Abstract
With the accelerated melting of the Arctic sea ice, the opening of the Northern Sea Route (NSR) of the Arctic is becoming increasingly accessible. The purpose of this paper was to examine the impact of uncertainty in sea ice thickness (SIT) data on the opening of the NSR and to quantify the extent of this impact, which is essential to the regularized operation of polar shipping. A quantitative assessment framework was proposed to examine the influence of SIT data uncertainty on navigational uncertainty through three aspects: the navigational spatiotemporal windows, the distribution of safe sailing speeds, and the uncertainty in optimal route planning by employing four distinct SIT datasets. Furthermore, the sensitivity of navigational spatiotemporal windows, the distribution of safe sailing speeds, and route planning to variations in SIT were also evaluated. Results show that experiment results based on CS2SMOS exhibit a more aggressive profile, while results based on CPOM are more conservative. The difference in SIT data has a significant impact on the proportion of operations subject to special consideration areas, such as safety speed, sailing time, and distance in NEP. A 0.1 m discrepancy in sea ice thickness data results in an approximate 0.067 change in the proportion of operations within special consideration areas. This discrepancy also leads to an approximate speed change of 0.89 knots, a navigation duration change of approximately 4 days, and a distance change of 152 km within specified limits.
1. Introduction
Global warming is leading to a continuous reduction in sea ice extent within the Arctic region. Arctic sea ice is a key indicator and “amplifier” of climate change, making the study of its melting patterns crucial for understanding climate change and its mechanisms of impact [1]. The rapid melting of Arctic sea ice directly influences the accessibility of the Arctic shipping route. Recent studies have shown that in the Kara Sea, the ice-free period ranges from 150 days at the Barents Sea boundary to 50 days in the vicinity of the Vilkitsky Strait [2]. In the Laptev Sea, the ice-free period ranges from 50 to 90 days; the shortest ice-free period, approximately 30 days, occurs on the northern route of the East Siberian Sea [2]. In the Chukchi Sea, the ice-free period increases to 200 days toward the Bering Strait, while ice is present only in the northern regions of the Barents Sea [2]. The extended ice-free period has made the investigation of the navigability of Arctic shipping routes a current research hotspot [3,4]. Contrary to traditional routes, the Arctic shipping route connecting Asia and Europe presents a shorter distance, richer oil and gas resources and lower risks of route privatization. Concurrently, the melting Arctic sea ice creates more favorable conditions for the strategic planning of the Arctic shipping route. This not only diminishes fuel consumption and navigation time for vessels but also lowers entry barriers for Arctic shipping, thereby extending the navigable range of the Arctic both temporally and spatially. The adaptability of the Northern Sea Route (NSR) in the Arctic is further enhanced. The primary Arctic shipping routes and total cargo volumes from 2011 to 2022 are illustrated in Figure 1. In 2022, a total of 2994 voyages were completed by 314 vessels. The total cargo volume along the NSR exhibited a consistent upward trend from 2011 to 2021, reaching 34,034 million tons in 2022, slightly below the 34,850 million tons recorded in 2021. Consequently, the Arctic shipping route holds substantial potential within the realms of shipping and the economy [5]. Nevertheless, in comparison to traditional routes, the formidable navigational challenges of the Arctic shipping route impose constraints on the safe navigation of vessels.
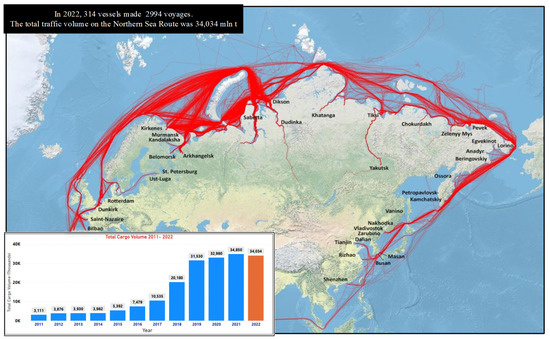
Figure 1.
The main ship routes in the Arctic waters in 2022 and total cargo volume 2011–2022 [6].
Accurately comprehending the patterns of sea ice variation is imperative for ensuring the safe navigation of vessels in the Arctic region and serves as a fundamental prerequisite for the normalized operation of the Arctic shipping route. Sea ice concentration and thickness stand out as critical indicators of sea ice conditions, playing pivotal roles in constraining the NSR and thereby influencing the design and selection of the Arctic shipping route. Satellite remote sensing and numerical simulation technologies have been widely utilized in the study of sea ice thickness (SIT). However, notable temporal and spatial disparities persist among various SIT data products, particularly when compared to the study of sea ice concentration [7].
Presently, SIT data are predominantly acquired through on-site observations, satellite observations, and numerical model simulations. While on-site observations boast minimal data errors, the observational samples are limited. SIT data obtained from satellite observations and numerical models exhibit diversity and varying quality. This has prompted extensive scholarly investigations into the uncertainty associated with these datasets [8,9,10]. In the realm of satellite observations, the altimetry satellites CryoSat-2 (CS2) incur errors arising from measurement inaccuracies in sea ice freeboard height and the conversion bias from sea ice freeboard to thickness [11]. Reducing the freeboard error to 0.01 m results in a thickness inversion error of approximately 32% for 1.0 m thick first-year ice and about 18% for 2.4 m thick multi-year ice [12]. Microwave satellite products, like the Soil Moisture and Ocean Salinity (SMOS) satellite, are constrained by the penetration depth of microwaves, leading to substantial uncertainty in SIT inversion [13]. While SMOS aligns well with airborne data in thin ice with a thickness of 20 cm, in thicker deformed ice, the average thickness error is about 30% [14]. Optical satellite products, such as the Polar Pathfinder (APP-x) based on the Advanced Very High-Resolution Radiometer (AVHRR) satellite radiometer, face inversion accuracy limitations due to observational errors in weather conditions and the precision of input auxiliary variables. The most significant error arises from the surface heat balance assumption of the energy budget model, increasing the uncertainty in ice thickness greater than 3 m by approximately 20% [15]. Numerical model products, like the Pan-Arctic Ice Ocean Modeling Assimilation System (PIOMAS), exhibit spatial errors in the data assimilation process [16]. However, they have been validated to align well with observational fields (average deviation of 0.1 m, correlation coefficient exceeding 0.8), faithfully reproducing corresponding changes in the observational field in terms of spatial distribution, seasonal periodicity, and trend variations [17].
While the aforementioned studies have provided valuable scientific support for navigation in the NSR, they have yet to address operationally significant questions regarding the potential impact of uncertainty in SIT data on navigation in the NSR and the magnitude of this impact.
Indeed, SIT plays a direct role in shaping the temporal and spatial windows for navigation, determining the speed of safe navigation, and influencing the optimal design of routes in the NSR [18]. Numerous scholars have endeavored to analyze navigable regions and times in the NSR by leveraging sea ice products and incorporating critical parameters for polar navigation. These parameters include the ice indices in the Arctic Ice Regime Shipping System (AIRSS) by Transport Canada [19] and the risk indices in the Polar Operational Limit Assessment Risk Indexing System (POLARIS) by the International Maritime Organization [20], among others. Ref. [21], utilizing PIOMAS SIT data and ice concentration data, scrutinized the feasibility of the NSR from 1979 to 2019. Their findings revealed high interannual and interdecadal variability in navigational windows, yet the number of navigable days was steadily growing. In the 2010s, Open Water (OW) vessels had navigable days reaching 89 ± 16 days, while for Polar Class 6 (PC6) vessels, it extended to 163 ± 19 days [21]. Ref. [22], employing CS2SMOS-corrected PIOMAS SIT data and the Risk Index Outcome (RIO) generated by the POLARIS system, delineated trajectories and regions in the NSR. Their study disclosed that in the 2010s, the navigational duration for PC6 vessels along the NSR extended to over 6 months (193 ± 13 days), while OW vessels could safely navigate for about 3 months (92 ± 15 days, with 113 days in 2019). Over the period from 1979 to 2018, the 90-day safe navigation area for OW vessels expanded by 35% [22]. Ref. [23], through the analysis of ICE-Sat and CS2 sea ice condition data from 1979 to 2012, observed an increase in the open period of the NSR from 84 days in 1980 to 146 days in 2012 [23]. These results underscore the substantial uncertainty in the navigational windows of the NSR based on different SIT data. V. Yu. Tretyakov [24] conducted a comprehensive analysis of the ice conditions along the Sabetta–Murmansk and Sabetta–Bering Strait routes over the period from 1997 to 2018 utilizing GIS data on sea ice thickness. The study examined the dynamics of ice conditions along the entire route, as well as in specific segments within various sea regions. The findings indicate that the navigational conditions have deteriorated in the Kara Sea and the Laptev Sea, while the ice conditions in the East Siberian Sea have remained relatively stable. In contrast, there has been a slight improvement in the navigational conditions within the Chukchi Sea. This research, focusing on the navigational conditions in different sea regions, is instrumental in developing more targeted navigation strategies for vessels. Moreover, the results of planning based on varying sea ice thickness data significantly impact the assessment of navigational conditions.
The speed of safe navigation serves as a crucial indicator, exerting a significant influence on the safety and efficiency of navigation in the NSR. Sea ice conditions stand out as a pivotal factor shaping vessel speed in the Arctic region. However, there is currently a lack of research addressing how different SIT data may impact the speed of safe navigation. Additionally, Ref. [25] were pioneers in considering the impact of sea ice data uncertainty on route planning. They approached the route optimization problem in ice-covered areas as a dynamic stochastic path planning problem, employing a heuristic route optimization model for its resolution. However, they did not quantitatively assess the extent to which different SIT data influence the outcomes of path planning [25]. Conversely, incorporating navigational spatiotemporal windows and safe sailing speeds, calculated from various SIT measurements, as utility functions and constraints in route optimization leads to increased uncertainty in planning.
Building on the delineated research gaps, this study aimed to investigate the impact of SIT data uncertainty on the opening of the NSR and the extent of such impact. To achieve this, the study examined the navigation conditions of IAS ice-class vessels along the NSR during the winter months, utilizing four different SIT datasets. The primary objective was to quantitatively assess the uncertainty in navigational spatiotemporal windows, the distribution of safe sailing speeds, and optimal route planning resulting from SIT data uncertainty. The investigation sought to explore the sensitivity of navigational spatiotemporal windows, the distribution of safe sailing speeds, and route planning to variations in SIT. Ultimately, this research aspires to offer decision support for the navigation and operation of the NSR. The ensuing sections are structured as follows: Section 2 introduces the data, Section 3 outlines the experimental design and methods employed, Section 4 presents the experimental findings, Section 5 discusses the impact of SIT uncertainty on various aspects of the opening of the NSR, and Section 6 provides a comprehensive summary of the entire paper.
2. Data
2.1. PIOMAS
The Pan-Arctic Ice-Ocean Modeling and Assimilation System (PIOMAS) stands as a coupled ocean and sea ice model that assimilates daily satellite products of sea ice concentration and sea surface temperature [26]. PIOMAS integrates the Parallel Ocean Program (POP) with a sea ice model encompassing 12 thickness and enthalpy distribution categories (TED). Rooted in Thorndike’s thickness distribution theory [27], the TED sea ice model has recently undergone enhancements based on enthalpy distribution theory [28]. Additionally, PIOMAS computes a snow depth distribution with 12 categories, drawing on the literature [29]. Uncertainties in SIT and snow depth in PIOMAS primarily arise from external driving forces on the model, such as wind, thermodynamics, and precipitation, as well as physical processes and parameterization schemes [30]. The PIOMAS dataset spans from 1978 to the present, offering estimates of critical sea ice and ocean variables, including Arctic SIT (http://psc.apl.uw.edu/data/, accessed on 15 March 2023).
2.2. APP-x
Derived from the Advanced Very High-Resolution Radiometer (AVHRR) satellite radiometer, the Polar Pathfinder (APP-x) dataset includes cloud cover, cloud optical depth, cloud particle phase and size, cloud top pressure and temperature, surface skin temperature, surface broadband reflectance, radiation fluxes, cloud radiative effects (“cloud forcing”), and SIT retrieved using a One-Dimensional Thermodynamic Ice Model (OTIM) [31]. APP-x provides twice-daily composite data for both the Arctic and Antarctic, featuring a spatial resolution of 25 km and spanning the time period from 1982 to the present (https://www.ncei.noaa.gov/thredds/catalog.html, accessed on 15 March 2023).
2.3. CS2SMOS
The CS2 product integrates Synthetic Aperture Radar (SAR) and interferometry techniques to measure SIT by detecting the ice freeboard. The accuracy of CS2 products is contingent on precise measurements of sea ice freeboard, and these products are specifically designed for measuring ice thicker than 0.5 m. On the other hand, SMOS data products utilize brightness temperature data measured in the L-band to retrieve SIT. However, owing to limitations in the penetration capabilities of the L-band, SMOS is more suitable for relatively thin ice, and its uncertainty increases for thicker sea ice. Therefore, a synergistic approach involving the combination of CS2 with SMOS may offer advantages.
The CS2SMOS SIT product, jointly developed by the Alfred Wegener Institute (AWI) and the University of Hamburg, combines thickness estimates from CS2 and SMOS. It furnishes weekly SIT data on the EASE2.0 grid (https://smos-diss.eo.esa.int, accessed on 15 March 2023) with a grid resolution of 25 km. The data coverage spanned from November 2010 and is regularly updated. For the experiments conducted in this paper, data from November 2010 to April 2021 were utilized.
2.4. CPOM
CPOM is an independent organization dedicated to providing polar observation and simulation data. By utilizing the Synthetic Aperture Radar/Interferometric Radar Altimeter (SIRAL) instrument on the CS2 satellite, CPOM acquires sea ice surface height data. By integrating these data with measurements from laser altimeters, estimates of SIT can be derived. CPOM is notable as the first publicly available satellite product generating SIT from CS2. It offers near real-time (NRT) thickness products with observation cycles of 28 days, 14 days, and 2 days, along with monthly average thickness data for the winter half-year, as utilized in this study (http://www.cpom.ucl.ac.uk/csopr/seaice.html, accessed on 15 March 2023). The data cover the period from November 2010 and are updated until October 2022, featuring a spatial resolution of 5 km.
Based on the above, a summary of the characteristics of the four sea ice thickness products is shown in Table 1.

Table 1.
Characteristics of different sea ice thickness products.
2.5. NSIDC
The sea ice concentration dataset utilized in this study was the Bootstrap Sea Ice Concentration (SIC) from Nimbus-7 SMMR and DMSP SSM/I-SSMIS, Version 3. The sea ice concentration data in this dataset were derived from measurements obtained by the Scanning Multichannel Microwave Radiometer (SMMR) on the Nimbus-7 satellite, as well as the Special Sensor Microwave/Imager (SSM/I) sensors on the Defense Meteorological Satellite Program (DMSP) satellites -F8, -F11, and -F13. Additionally, the dataset included measurements from the Special Sensor Microwave/Sounder (SSMIS) on DMSP-F17. This dataset was generated using the Advanced Microwave Scanning Radiometer—Earth Observing System (AMSR-E) Bootstrap Algorithm, which incorporates daily varying reference points. Daily data for the Arctic and Antarctic regions (prior to July 1987 every other day) and monthly data are available. The data are provided in a grid format with an SSM/I polar stereographic grid (25 × 25 km). The sea ice concentration monthly data for the Arctic polar projection from 2011 to 2021 used in this study are accessible at https://nsidc.org/data/nsidc-0079/versions/3 (accessed on 15 March 2023).
3. Experimental Design and Scheme
3.1. Experimental Design
This study centered on the IA Super (IAS) ice-class ship as the focal point of investigation. This study focused on IAS ice-class vessels. The study area spanned from 20° E eastward across the 180° meridian to 165° W, with a latitude range of 60° N to 85° N, encompassing the Barents Sea, Kara Sea, Laptev Sea, East Siberian Sea, and Chukchi Sea [33] The study’s research area spanned from latitude 60° N to 85° N and from longitude 20° W (crossing the Prime Meridian) to 165° W, covering sections of the Arctic Ocean and its adjoining marginal seas, including the Norwegian Sea, Barents Sea, Kara Sea, Laptev Sea, East Siberian Sea, and Chukchi Sea. The research employed daily SIT data covering the winter half-year (from October to April of the following year) from 2011 to 2021, sourced from four distinct datasets: PIOMAS, CPOM, APP-x, and CS2SMOS. The monthly SIT data underwent inverse distance weighted interpolation with a search radius of 25 km. The resulting interpolated values were then applied to a 25 × 25 km grid provided by NSIDC, yielding a final grid size of 448 × 304.
This paper explored the influence of various SIT products on the navigational feasibility of the NSR across three dimensions: navigational temporal windows, safe sailing speeds, and route planning. The research quantitatively evaluated the correlation between the uncertainty associated with SIT products and the uncertainty in the feasibility of navigation within the NSR. The experimental design process is visually depicted in Figure 2.
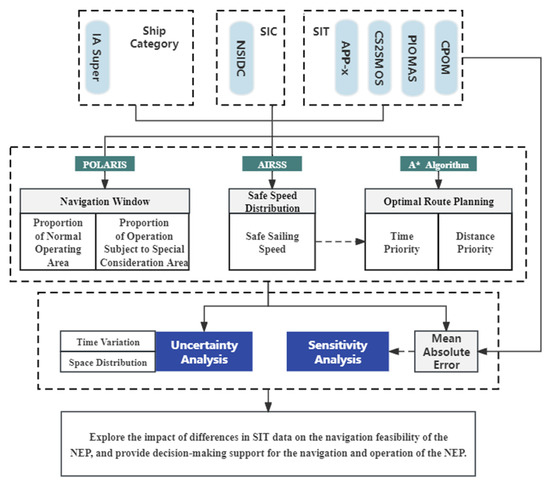
Figure 2.
Experimental design flow chart.
This study employed the RIO index of POLARIS to quantify navigation risk and investigated temporal changes in the area and the spatial distribution of the NSR navigation region using various sea ice datasets. By utilizing the AIRSS Ice Numeral (IN) and the speed-IN relationship proposed by John McCallum [34], the research analyzed the frequency and spatial distribution of safe sailing speeds in the Arctic NSR. The study applied the A* algorithm [35] to devise routes based on data regarding the distribution of safe sailing speeds obtained from different SIT and IN. Using the route from the port of Provideniya (64°23′ N, 173°18′ W), Russia, to the port of Murmansk (69°00′ N, 33°03′ E), Russia, as an illustrative case, this study examined the impact of diverse SIT on NSR route planning, considering factors such as the shortest time and distance. Furthermore, this study scrutinized the varied influence of SIT on NSR feasibility, exploring the sensitivity of NSR navigational spatiotemporal windows, the distribution of safe sailing speeds, and optimal route planning to changes in SIT.
3.2. Calculation Method for Polar Navigation Spatiotemporal Windows
The POLARIS system adopts terminology from the World Meteorological Organization (WMO) and adheres to ice class designations in alignment with those outlined in polar ship certificates [36]. Considering both the ice class of the vessel and the distinct growth stages of sea ice (ice types) present in navigational waters, the system allocates Risk Index Values (RIVs) to measure the risk associated with ship navigation [20]. The RIVs pertinent to the IAS ice-class ships utilized in this study are detailed in Table 2.
Table 2.
Risk index values [20,36].
The POLARIS system employs RIVs associated with various ice types, in conjunction with SIC data, to ascertain the RIO for ship navigation. This outcome functions as a quantification of navigation risk, facilitating an evaluation of operational constraints for vessels in ice-covered areas.
The determination of RIO involves summing the products of Risk Index Values (RIVs) corresponding to each ice type within each grid cell and its concentration (expressed in tenths) within that cell:
where represents the concentration (in tenths) of the ice type within the grid cell, and represents the corresponding Risk Index Value for each ice type.
Based on different RIO values, POLARIS proposes three levels of operations: normal operations, elevated operations, and operations subject to special consideration; in addition, there is another category of risk index that the POLARIS system is not recommended for navigation, as outlined in Table 3.
Table 3.
Risk index outcome criteria.
3.3. Calculation Method for Polar Safe Speed
Safe sailing speed is another crucial indicator for ship navigation. Building upon the spatiotemporal variations in the NSR navigational capability, this study performed a quantitative analysis of the safe sailing speed for the IAS ice-class ships in the NSR utilizing AIRSS and the speed-ice value relationship.
In 1998, Transport Canada implemented AIRSS navigation rules [38]. AIRSS classifies Arctic sea ice into nine distinct types, considering their development stages and density characteristics, such as new ice, gray ice, gray-white ice, etc. Each sea ice type corresponds to a designated ice multiplier (IM), as outlined in Table 4.
Table 4.
Explanation of ice multipliers in the Arctic region [19].
The AIRSS algorithm simultaneously considers sea ice conditions and the ice resistance level of ice-strengthened ships, developing an indicator called “IN” to measure the ice situation. The calculation formula is given as follows:
where (where “m” ranges from to ) denotes the sea ice concentration for different ice types. It is defined as the ice coverage expressed in tenths, ranging from 0 to 10, where 0 indicates open water, and 10 signifies complete ice coverage. in AIRSS denotes the “severity for each ice type for a particular vessel”, with a range from −4 to 2. Positive values indicate lower risk for the vessel, while negative values indicate more severe ice conditions for the ship.
The safe sailing speed of the icebreaker is determined using the formula provided by John McCallum [34], which relates IN to the vessel’s speed. The calculation method is outlined as follows:
This results in the distribution of safe sailing speeds for IAS ice-class ships in the NSR based on different SIT data.
3.4. Calculation Method for Polar Route Planning
In order for the NSR to operate regularly, it is necessary to assess its navigational potential. We conducted route design for the NSR from two perspectives—minimizing time and minimizing distance—in order to enhance its navigational potential. On the one hand, for shipping companies, a shorter sailing distance means less fuel consumption and lower operational costs. On the other hand, for long-distance transportation, especially for perishable goods, time cost is an important factor. Therefore, we selected these two indicators to qualitatively and quantitatively analyze the impact of sea ice thickness uncertainty on the uncertainty of route planning results. This study employed the A* algorithm, utilizing various SIT data, to conduct path planning in the NSR from both the perspectives of minimizing time and minimizing distance.
The A* algorithm is a heuristic widely used for solving optimal path problems in static road networks. It serves as an extension of Dijkstra’s algorithm [40] and the greedy algorithm [41]. While Dijkstra’s algorithm can find the globally optimal shortest path, it proves inefficient when traversing the entire network. On the other hand, the greedy algorithm can quickly search for paths but cannot guarantee global optimality. The A* algorithm addresses both search speed and global optimality considerations and can be represented by a special utility function f(n) as follows:
where represents the actual cost from the initial node to the current node, and represents the estimated cost from the current node to the target node. When , only is effective, and the A* algorithm degenerates into Dijkstra’s algorithm, ensuring that only the global optimum is found. When , the A* algorithm can guarantee both search speed and global optimality. As decreases, the search speed slows down. When , the number of search points decreases, speeding up the search, but it does not guarantee to obtain the optimal solution.
To initiate the route planning, the starting point was set at the port of Provideniya, and the destination point was set at the port of Murmansk. The starting point was added to the open list to commence the search process.
The steps of the A* algorithm search are as follows:
- Choose the node with the minimum cost from the open list, designating it as the current node;
- If the current node is the target node (port of Murmansk), the search successfully concludes;
- Move the current node from the open list to the closed list and proceed to expand its neighboring nodes;
- For each neighboring node, calculate the cost function and heuristic function to update the node’s comprehensive cost . This determines the priority of the node in the search.
Upon identifying the target node, the path from the starting point to the destination point can be reconstructed by backtracking through the parent nodes. This path comprises a sequence of nodes and their corresponding segments, ensuring the identification of the optimal route for diverse objectives.
In the two route planning scenarios presented in this paper, the cost for the shortest route planning was determined by the distance between grid points. In contrast, the cost for the fastest route planning was derived from time information obtained by dividing the distance between grid points by the safe sailing speed. The planning of air routes was of great significance for the safety and feasibility of navigation in polar regions.
3.5. Sensitivity Analysis
To investigate the sensitivity of navigable areas, distribution of safe sailing speeds, and route planning to sea ice thickness variations, the mean absolute errors (MAE) of four distinct sea ice thickness datasets were individually computed. Furthermore, the MAE of various parameters related to IAS ice-class ships operating within the NSR—such as the proportion of normal operational areas, the proportion of operation subject to special consideration areas, safe sailing speed, navigation duration, and route distance—derived from these four sea ice thickness datasets were determined. Scatter plots were then generated using these datasets to assess the sensitivity between sea ice thickness data and parameters, including the proportion of normal operational areas, the proportion of operation subject to special consideration areas, safe sailing speed, navigation duration, and route distance. The formulas for computing the mean absolute errors between two products are as follows:
where represents the year. and denote one of the four products: CS2SMOS, APP-x, PIOMAS, CPOM, with . indicates one of the subsequent parameters: monthly average SIT data, monthly average proportion of normal operational areas, monthly average proportion of operation subject to special consideration areas, monthly average safe sailing speed, monthly average navigation duration, or monthly average route distance.
4. Experimental Results
This section evaluates the navigational feasibility of the NSR using four different SIT datasets and examines the influence of SIT data uncertainty on spatiotemporal windows for navigation, the distribution of safe sailing speeds, and route planning in the Arctic NSR.
The spatial distribution of average sea ice thickness for different ice thickness datasets in October and April from 2011 to 2021 is shown in Figure 3 and Figure 4. The results indicate that in October, except for the central Arctic region, the four sea ice thickness products exhibit very small ice thickness distribution in the Barents Sea, Kara Sea, Laptev Sea, and East Siberian Sea. In April, there are significant spatial distribution differences in sea ice thickness among the four products in the central Arctic, Kara Sea, Laptev Sea, and East Siberian Sea, with the APP-x sea ice thickness being greater than that of the other three datasets.

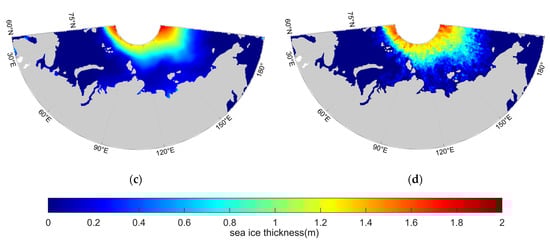
Figure 3.
Spatial distribution of average sea ice thickness from different products in October 2011–2021. (a) PIOMAS; (b) APP-x; (c) CS2SMOS; (d) CPOM.
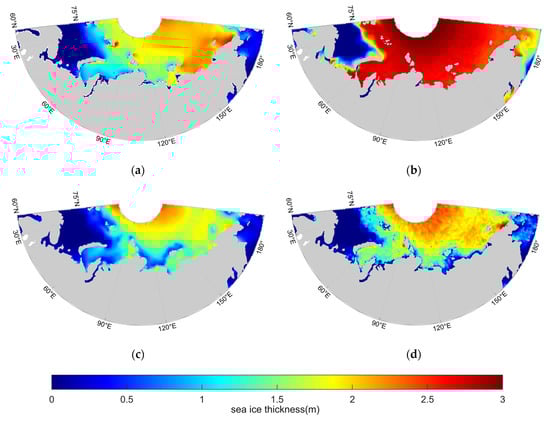
Figure 4.
Spatial distribution of average sea ice thickness from different products in April 2011–2021. (a) PIOMAS; (b) APP-x; (c) CS2SMOS; (d) CPOM.
4.1. Calculation of Spatiotemporal Navigation Windows Using Multi-Source SIT
In this section, POLARIS is utilized to determine the RIO values for each data grid unit within the NSR research area. The analysis specifically concentrates on the spatiotemporal distribution differences in the proportion of navigable areas within the NSR due to variations in SIT data.
4.1.1. Temporal Variation of NSR Navigable Areas
In this section, the analysis employing POLARIS focuses on the temporal variations in the proportion of the normal operational area (RIO ≥ 0) and operation subject to special consideration area (RIO ≥ −20) for IAS ice-class ships in the NSR during the winter half-year from 2011 to 2021. Refer to Figure 5 and Figure 6 for details.
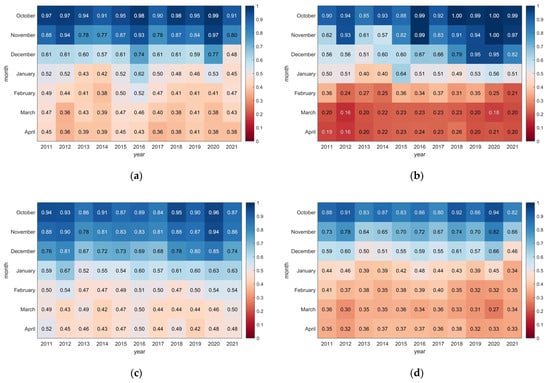
Figure 5.
Proportion of normal operational area for IAS ice-class ships in the NSR from 2011 to 2021 based on multi-source SIT data (October to April of the following year; data sources: (a) PIOMAS, (b) APP-x, (c) CS2SMOS, (d) CPOM).
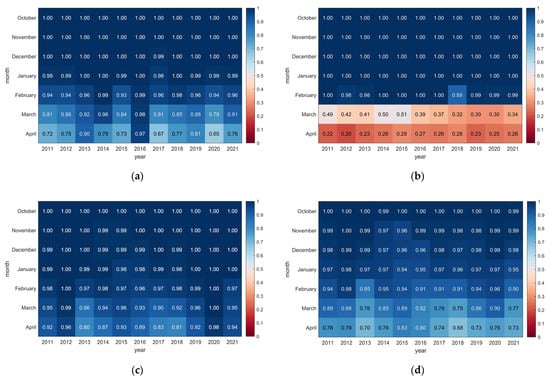
Figure 6.
Proportion of operation subject to special consideration area for IAS ice-class ships in the NSR from 2011 to 2021 based on multi-source SIT data (October to April of the following year; data sources: (a) PIOMAS, (b) APP-x, (c) CS2SMOS, (d) CPOM).
In Figure 5, each number within the colored blocks corresponds to the proportion of the normal operational area for IAS ice-class ships in the NSR, with each number signifying a specific period at a monthly resolution. The variations in the proportion of the operational area indicate the following:
Regarding interannual variations, the proportion of the normal operational area based on APP-x and CS2SMOS SIT data in the NSR exhibits a noticeable increasing trend during the winter half-year from 2011 to 2021. In contrast, the proportions based on PIOMAS and CPOM SIT data remained relatively stable during the same period.
Concerning monthly variations, the proportion of the normal operational area based on CS2SMOS, CPOM, and PIOMAS SIT data in the NSR gradually decreased from October to January of the following year and stabilized from February to April. Conversely, the proportion based on APP-x SIT data gradually decreased from October to February of the following year and stabilized from March to April.
Regarding interannual variations, the proportions of the operation subject to special consideration area based on PIOMAS, APP-x, and CS2SMOS SIT data in the NSR remained relatively stable during the winter half-year from 2011 to 2021. However, the proportion based on CPOM SIT data exhibited a decreasing trend during the same period.
Concerning monthly variations, the proportion of the operation subject to special consideration area based on CS2SMOS, CPOM, and PIOMAS SIT data in the NS remained relatively stable from October to January of the following year and gradually decreased from February to April. In contrast, the proportion based on APP-x SIT data remained relatively stable from October to February of the following year and gradually decreased from March to April.
Additionally, this study employed multi-year average SIT data from 2011 to 2021 (October to April of the following year) to assess the mean absolute errors (MAEs) of the four types of SIT data sources from the mean in both the proportion of normal operational area and operation subject to special consideration area. The comparisons are illustrated in Figure 7 and Figure 8.
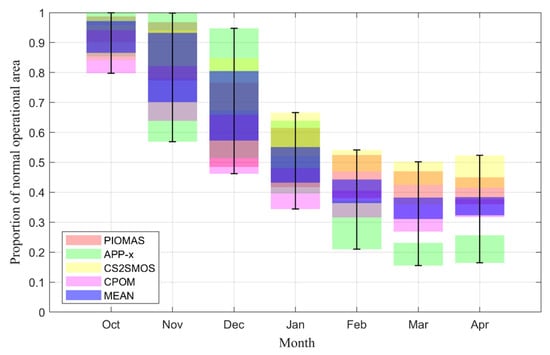
Figure 7.
Proportion of normal operational area for IAS ice-class ships in the NSR from 2011 to 2021 based on multi-source SIT data (October to April of the following year).
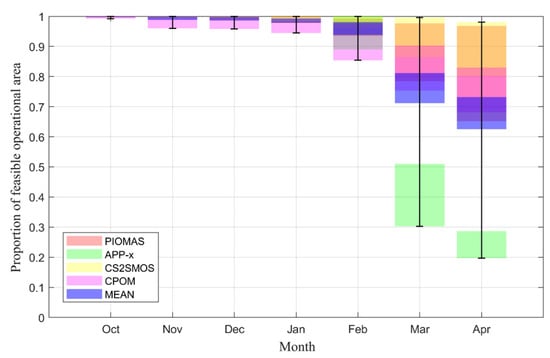
Figure 8.
Proportion of operation subject to special consideration area for IAS ice-class ships in the NSR from 2011 to 2021 based on multi-source SIT data (October to April of the following year).
Figure 7 illustrates the multi-year monthly average results proportion of normal operational area based on various SIT data from 2011 to 2021, illustrating variations in the proportion of normal operational area for IAS ice-class ships in the NSR across different months. The greatest fluctuation in mean values was observed in November to December, while the smallest fluctuation occurred from March to April.
A substantial disparity exists in the multi-year monthly average proportion of normal operational areas obtained from various SITs. From October to January of the following year, the fluctuation range in the proportion of normal operational area was approximately twice the mean, while from February to April, the fluctuation range reached 4–6 times the mean.
From 2011 to 2021, the mean variations in the proportion of normal operational areas from February to April were small for four SIT data products. However, there is a notable disparity in the proportion of normal operational areas among different products. This signifies considerable uncertainty in the proportion of normal operational areas during the months of February to April, marked by a gradual interannual change in normal operational areas.
Among the four types of SIT datasets, PIOMAS data were the closest to the mean. CS2SMOS consistently exhibited a positive deviation, with calculated results being larger. CPOM consistently displayed a negative deviation, with calculated results being smaller. APP-X exhibited the greatest deviation, showing a positive deviation in October, December, and January and a negative deviation from February to April.
Figure 8 illustrates that IAS ice-class ships, based on four different datasets, demonstrate varying proportions of operation subject to special consideration areas in the NSR. The multi-year monthly average of the proportion of operation subject to special consideration area for IAS ice-class ships in the NSR from 2011 to 2021 showed minimal variation from October to January of the following year and significant fluctuations from March to April.
There are significant disparities in the annual average monthly operation subject to special consideration area proportion based on SIT data. The fluctuation range of the operation subject to special consideration area proportion was approximately three times the mean value from October to February, increasing to seven times the mean value from March to April.
Among the sea ice datasets, PIOMAS data aligned closest with the mean value. CS2SOMS consistently exhibited a positive deviation in March and April, indicating an overestimation in the calculations. CPOM showed the largest deviation from October to the following February, displaying a negative deviation, while in March and April, it exhibited a substantial positive deviation, indicating a significant discrepancy in the calculations. APP-x showed the greatest negative deviation in March and April, suggesting an underestimation in the calculations.
Overall, depending on specific objectives, one might opt for different SIT datasets. For example, during the planning phase, CS2SMOS results may provide more flexibility for route design. However, during implementation, when prioritizing safe navigation, CPOM results may be more conservative.
4.1.2. Spatial Distribution of Navigable Areas in the NSR
In this section, the spatial distribution of normal operation and operation subject to special consideration areas in the NSR, based on four types of SIT data, is analyzed using a counting method. Additionally, the uncertainty of the spatial distribution of navigable areas in the NSR is further assessed using information entropy [42], as illustrated in Figure 9 and Figure 10.
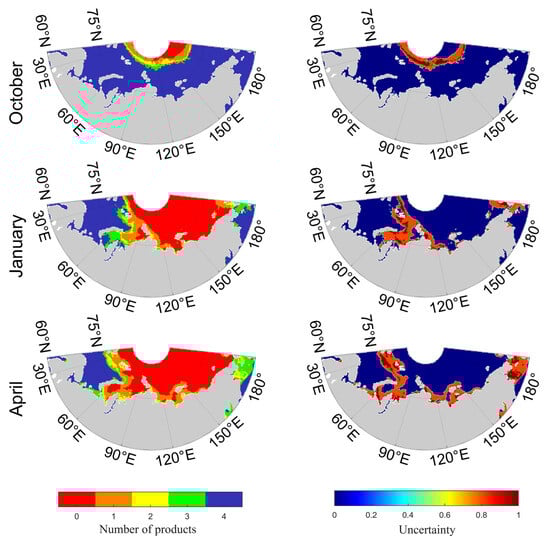
Figure 9.
Results of normal operational areas for IAS ice-class ships in the NSR based on multi-source SIT data from 2011 to 2021 (The left: The number of products with normal operation results; The right: Information entropy measures uncertainty [42]).

Figure 10.
Results of operation subject to special consideration areas for IAS ice-class ships in the NSR based on multi-source SIT data from 2011 to 2021 (The left: The number of products with operation subject to special consideration results; The right: information entropy measures uncertainty).
Figure 9 illustrates the proportion of normal operational areas for IAS ice-class ships in the NSR based on multi-source SIT data from 2011 to 2021, along with their uncertainties.
The navigability of the NSR was confirmed south of 80 degrees north during the fall of 2011–2021. However, the normal operational area significantly reduces in winter, comprising only the Norwegian Sea, the western part of the Barents Sea, and the Kara Sea. In spring, the normal operational area further diminishes, allowing IAS ice-class ships to operate only in the northern part of the Norwegian Sea and the western part of the Barents Sea.
During autumn (October), there is considerable uncertainty in the normal operational area north of 80° N. In winter (January), significant uncertainty exists in parts of the Svalbard Archipelago and the Kara Sea. In spring (April), areas with high uncertainty appear in the Svalbard Archipelago, south of the Kara Sea, and the Chukchi Sea. Additionally, uncertainties in the normal operational areas of the Laptev Sea, the East Siberian Sea, and the Chukchi Sea are high. The East Siberian Sea is influenced by high pressure, resulting in abnormal cyclonic wind patterns, increased overcast weather, slow ice melting, and a higher proportion of multi-year ice, leading to a short or even non-navigable period.
Figure 10 illustrates the proportion of operations subject to special consideration areas for IAS ice-class ships in the NSR, based on multi-source SIT data spanning 2011 to 2021. The depiction includes operations subject to special consideration areas and an analysis of uncertainties.
Regarding the determined proportion of operation subject to special consideration areas derived from four types of SIT datasets, it is observed that in autumn (October), all areas are navigable. In winter (January), with minimal uncertainties in the navigable areas north of the New Siberian Islands and above 80° N, all other regions remain navigable. In spring (April), the navigable area significantly diminishes, confining IAS ice-class ships to regions north of the Norwegian Sea and the western part of the Barents Sea.
Furthermore, in the spring, there will be significant uncertainty regarding the navigability of the entire NSR. Regions with the highest uncertainty encompass the Kara Sea west of the Severnaya Zemlya archipelago, sections of the East Siberian Sea to the Laptev Sea, and the western part of the Chukchi Sea. Caution is recommended for navigation in these areas during spring, particularly in regions south of the Svalbard archipelago, north of the Novaya Zemlya archipelago, and from the Kara Sea to the Laptev Sea region.
4.2. Safe Sailing Speeds Based on Multi-Source SIT Data in the NSR
The analysis of safe sailing speeds in the NSR was conducted using AIRSS “IN” and the speed-ice numeral relationship. Based on multi-source SIT data, this section examines the frequency and spatial distribution of safe speeds for IAS ice-class ships in the NSR from 2011 to 2021.
4.2.1. Frequency Distribution of Safe Sailing Speeds in the NSR
This section examines the frequency distribution of average safe speeds based on four types of SIT data during the winter half-year from 2011 to 2021 (October to April of the following year). The distribution is depicted in Figure 11, and the corresponding average safe speeds are detailed in Table 5.
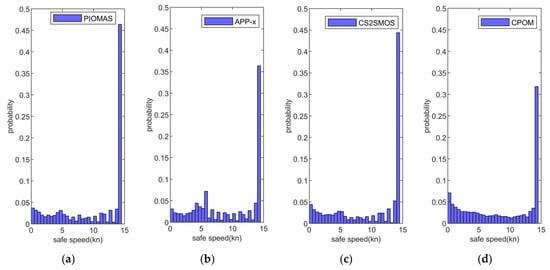
Figure 11.
Frequency histogram of speed distribution for IAS ice-class ships in the NSR based on multi-source SIT data from 2011 to 2021 (Data sources: (a) PIOMAS, (b) APP-X, (c) CS2SMOS, (d) CPOM).
Table 5.
Mean values of safe speed distribution for IAS ice-class ships in the NSR based on multi-source SIT data from 2011 to 2021.
Figure 11 illustrates that the frequency of the maximum safe speed range is high, as calculated from the four SIT data products. This suggests that most areas of the NSR are navigable at the maximum safe speed. Notably, PIOMAS exhibits the highest frequency for the maximum safe speed. In terms of other safe speeds, PIOMAS, APP-x, and CS2SMOS SIT data products display a consistent frequency distribution of safe speeds, contrasting with CPOM. For these three products, as the other safe speed values increase, their frequencies initially decrease, then increase, and finally decrease again.
Table 5 illustrates that the average safe sailing speed, based on PIOMAS and APP-x SIT data, consistently decreases from October to January of the following year and then increases from January to April. Conversely, the average safe sailing speed based on CS2SMOS and CPOM SIT data decreases continuously from October to February of the following year, followed by an increase from February to April. Furthermore, the average safe sailing speed based on PIOMAS and CS2SMOS is relatively high during the winter half-year, indicating favorable ice conditions in the NSR. Vessels can traverse the NSR more efficiently based on the outcomes from these two types of ice products, suggesting a more assertive navigation approach when utilizing PIOMAS and CS2SMOS results. In contrast, CPOM consistently exhibits a lower average safe sailing speed in each month of the winter half-year compared with the other three products, making it a reference for exercising caution in navigation.
4.2.2. Spatial Distribution of Safe Sailing Speeds in the NSR
This section compares the spatial distribution of average safe speed for vessels in the NSR based on four types of SIT data products during the winter half-year (October to April of the following year) in the years 2011–2021 (see Figure 12 and Figure A1, Figure A2, Figure A3, Figure A4, Figure A5 and Figure A6).

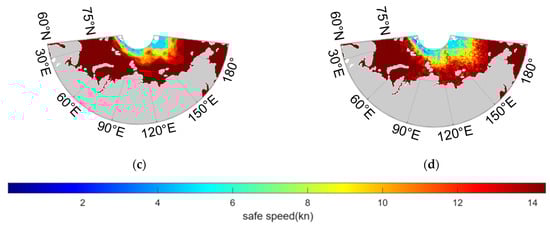
Figure 12.
Distribution of average safe sailing speeds for IAS ice-class vessels on the NSR in October from 2011 to 2021 based on multi-source SIT products. (a) PIOMAS; (b) APP-x; (c) CS2SMOS; (d) CPOM.
In October, the distribution of safe sailing speed among the four SIT data products was relatively consistent, with higher speeds observed in regions south of 80° N.
In November, a noteworthy change was observed in the distribution of safe sailing speeds based on the APP-x SIT data product. Specifically, there was a significant decrease in safe sailing speed in the Laptev Sea and the East Siberian Sea. The results from the PIOMAS and CS2SMOS SIT data products exhibit more consistent speed distribution, with significant speeds observed in all areas, except for a decrease in speed in the East Siberian Sea. The CPOM SIT data product shows a decrease in safe sailing speed, except in the marginal areas of the Laptev Sea and the East Siberian Sea.
In December, the spatial distribution of safe sailing speed, as based on the PIOMAS and APP-x SIT data products, reveals a coherent pattern. Both products demonstrate elevated safe sailing speeds in the northern regions of the Norwegian Sea, the Barents Sea, and the western section of the Kara Sea. Conversely, the Laptev Sea and the East Siberian Sea exhibit lower safe sailing speeds according to both products. Notably, in the Laptev Sea, APP-x computes higher safe sailing speeds than PIOMAS. The CS2SMOS SIT data product indicates relatively high safe sailing speeds in the marginal zones of the Laptev Sea. Conversely, the CPOM SIT data product suggests moderate safe sailing speeds in the Laptev Sea and the East Siberian Sea.
In January, a notable shift occurred in the distribution of safe sailing speeds based on the PIOMAS SIT data product. Portions of the Laptev Sea and the majority of the East Siberian Sea become impassable. Conversely, the safe sailing speed based on APP-x and CS2SMOS, excluding the Kara Sea, demonstrate a relatively uniform distribution in other regions. The safe sailing speed based on CPOM exhibit a distribution akin to APP-x but with higher values observed in the Laptev Sea and the East Siberian Sea.
In February, the navigable area, based on PIOMAS, experienced a further reduction. The distribution of safe sailing speed, as beads on APP-x, undergoes significant changes compared to January, with a substantial portion becoming unnavigable. Notably, there is a slight increase in safe sailing speed in the Kara Sea and the southern part of the Laptev Sea. CS2SMOS exhibits a less pronounced reduction in the navigable area, accompanied by a decrease in safe sailing speed in specific areas of the Kara Sea. Meanwhile, CPOM indicates a reduction in the navigable area, with no significant alteration in the magnitude of safe sailing speed.
In March, the navigable area, as based on PIOMAS, exhibits a less noticeable reduction, accompanied by a further increase in safe sailing speed in the southern part of the Kara Sea and the Laptev Sea. Conversely, the navigable area based on APP-x experiences a significant decrease, limiting navigation to only the northern part of the Norwegian Sea, the Barents Sea, and the Chukchi Sea. CS2SMOS indicates a marked reduction in the navigable area, with the northern part of the Laptev Sea and the northern part of the East Siberian Sea becoming unnavigable, while other regions remained relatively unchanged. CPOM shows a further reduction in the navigable area, coupled with increased safe sailing speed in the marginal areas of the East Siberian Sea.
In April, the distribution of safe sailing speed, as based on PIOMAS and CPOM, exhibited no significant changes. However, the navigable area based on APP-x experienced a further decrease. CS2SMOS indicates an increase in safe sailing speed in the marginal areas of the Laptev Sea and the East Siberian Sea.
In summary, the Barents Sea consistently demonstrates a significant distribution of safe sailing speed throughout the entire winter half-year period. Conversely, the East Siberian Sea, freezing early, exhibits a distribution of very low speeds. Until April, CS2SMOS calculates low-speed areas in the East Siberian Sea, suggesting a more aggressive navigation plan. PIOMAS and CPOM products indicate the earliest occurrence of large areas with unsafe navigation. However, PIOMAS shows an increase in safe sailing speed in March and April in some areas of the Kara Sea and Laptev Sea.
4.3. Route Planning Based on Multi-Source SIT Data in the NSR
In the planning phase, data from the four SIT datasets described in Section 3.2, along with the safe sailing speed information for IAS ice-class ships in the NSR, were utilized. Employing the A* algorithm, we calculated the time priority and distance priority route for navigation when viable routes ( > 0) were identified from the port of Provideniya, Russia, to the port of Murmansk.
4.3.1. Time Priority Shipping Route in the NSR
This section commenced with the time priority shipping route planning for IAS ice-class ships in the NSR, spanning from the port of Provideniya, Russia, to the port of Murmansk, utilizing SIT data from the multi-source for the winter half-year of 2011–2021 (see Figure A7). Furthermore, the multi-year average monthly shortest navigation time for IAS ice-class ships in the NSR during the winter half-year of 2011–2021 was determined (see Table 6).
Table 6.
Comparison of the average navigation duration for IAS ice-class ships in the NSR based on multi-source SIT data in different months (Time Priority; Diagonal lines indicate non-navigable routes).
The time priority route is determined by two factors: distance and speed. While the spatial range reflects the distance cost, speed is not visually apparent in the spatial representation. Figure A7 illustrates that routes lack a discernible pattern, and there is no evident trend of moving toward higher latitudes. However, in December, over the years, the time priority routes based on the four products exhibited a trend of reduced navigation duration. It is crucial to note that in 2020, carbon dioxide emissions significantly surpassed those of previous years, leading to a rise in Arctic temperatures and an accelerated sea ice melting rate. In November and December, the navigation duration based on the four products was considerably shorter than in other years (see Table A1, Table A2, Table A3 and Table A4).
Figure A7 and Table 6 illustrate that, from October to December, all four SIT products yield the time priority routes for navigation in the NSR. However, achieving this optimal route is not possible in April for any of the products. Between January and March, except for CS2SMOS, other products indicate non-navigable conditions. Specifically, the route planning results for PIOMAS and CPOM suggest non-navigability, while APP-x shows navigability only in January. In October, the route planning results for the four products closely align. In November, CS2SMOS presented the shortest duration for route planning, while APP-x’s planning duration exceeded 25 days, far exceeding the durations of the other three products. In December, the route planning durations for POIMAS, APP-x, and CPOM are similar, while CS2SMOS still exhibits the shortest route planning duration. In summary, based on CS2SMOS, the NSR has the longest navigation season and the shortest navigation duration.
Hence, there exist increased opportunities for optimizing the shortest navigation route planning based on CS2SMOS data in polar research. Furthermore, it leads to reduced navigation duration and increased sailing speed. However, these route planning outcomes exhibit a more assertive nature, necessitating supplementary data to bolster their reliability. Conversely, choosing PIOMAS and CPOM SIT data products as data sources for time-priority route planning ensures heightened reliability and can serve as a benchmark for prudent navigation.
4.3.2. Distance Priority Shipping Route in the NSR
In this segment, the distance priority routes for IAS ice-class ships navigating the NSR from port of Murmansk, Russia, to port of Provideniya, based on four SIT datasets for the winter half-year spanning from 2011 to 2021, are illustrated in Figure A8. Furthermore, Table 7 provides a summary of the average monthly navigation distances for IAS ice-class ships in the NSR during the winter half-year based on the four SIT datasets.
Table 7.
Comparison of the average navigation distances for IAS ice-class ships in the NSR based on multi-source SIT data in different months (Distance Priority; Diagonal lines indicate non-navigable routes).
The overlap rate of the distances priority routes monthly based on PIOMAS and APP-x during the winter half-year from 2011 to 2021 was remarkably high, providing limited reference value. In contrast, routes based on CS2SMOS and CPOM reveal distinct patterns, particularly after November of the winter half-year. Since 2011, these routes have displayed a tendency to move toward higher latitudes. Notably, the route planning results in 2012, influenced by the “Arctic Cyclone”, significantly deviated from the overall trend (see Table A5, Table A6, Table A7 and Table A8).
Figure A8 and Table 7 illustrate that all four SIT data products can achieve the distance priority route planning from October to December. Among them, PIOMAS, APP-x, and CS2SMOS exhibit relatively consistent results in distance priority. However, CPOM’s route planning deviates significantly from the other products, with its distance being greater than the results obtained from the other three products. From January to April, substantial differences in the distance priority route planning results among the four products emerge. PIOMAS and CPOM indicate non-navigable routes for all four months, APP-x allows navigation only in January, and CS2SMOS allows navigation in three months. In the context of the distance priority route planning, it is noteworthy that while CS2SMOS calculates the longest navigation season, unlike the time priority route planning, its navigation distance is not the minimum.
Therefore, for the distance priority route planning from October to December, one can choose among PIOMAS, APP-x, and CS2SMOS as the data source. However, from January to April, due to significant differences in product data, the choice of the most suitable data product as a source for the distance priority route planning depends on the specific circumstances.
5. Discussion
In addressing the limited research on the impact of uncertainty in SIT data on shipping in the NSR, this section explores the differences in four SIT datasets concerning the calculation of the spatiotemporal window of the NSR, the determination of safe sailing speeds, and the planning of the optimal route. The discussion emphasizes the sensitivity of each aspect to variations in SIT. As shown in Figure 13, this paper presents the frequency distribution graphs and the averages of four different product datasets. The figure reveals the distribution patterns and the magnitude of deviations among the four datasets.
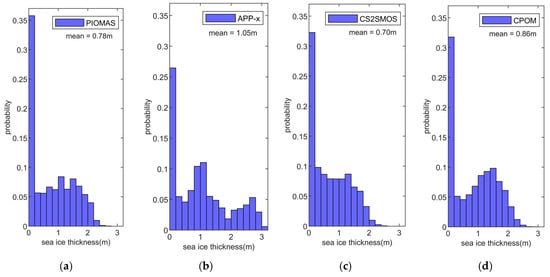
Figure 13.
Frequency distribution histograms of sea ice thickness from different products for the period 2011–2021 (a) PIOMAS; (b) APP-x; (c) CS2SMOS; (d) CPOM.
5.1. Impact of SIT Uncertainty on the Navigation Spatiotemporal Window of the NSR
This section delves into the impact of SIT uncertainty on the proportion of navigable areas in the NSR. It centers on two key aspects: the influence of discrepancies in SIT data on normal operational and operation subject to special consideration area for IAS ice-class ships in the NSR. The analysis seeks to evaluate the sensitivity of the spatiotemporal navigation window in the NSR to SIT data.
5.1.1. Sensitivity Analysis of SIT Data on the Proportion of Normal Operational Area in the NSR
This section engages in a comprehensive analysis of the sensitivity of SIT data uncertainty regarding the proportion of normal operational area in the NSR. The MAE is calculated for each of the four SIT data products, alongside the MAE for the proportion of normal operational areas for IAS ice-class ships in the NSR derived from these data sources. The sensitivity of SIT data to the proportion of operational areas in the NSR is systematically examined through scatter plots, as depicted in Figure 10.
Figure 14 illustrates a scattered distribution of MAEs in SIT data and the corresponding proportion of normal operational areas in the NSR. This dispersion presents a challenge in pinpointing a close linear correlation. Consequently, it can be inferred that variations in SIT in the NSR do not exert a significant impact on the proportion of normal operational areas.
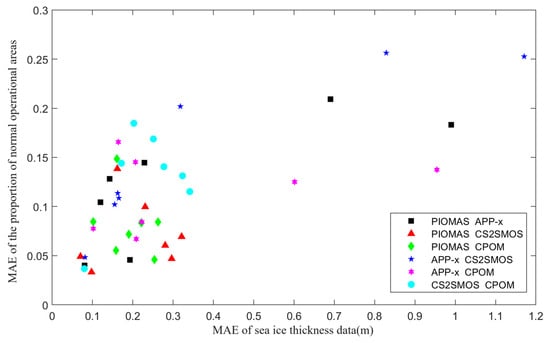
Figure 14.
Sensitivity analysis of multi-source SIT data and the proportion of normal operational areas in the NSR for IAS ice-class ships.
5.1.2. Sensitivity Analysis of SIT Data on the Proportion of Normal Operational Area in the NSR
In this section, we analyze the influence of SIT data uncertainty on the proportion of operation subject to special consideration areas in the NSR. The MAE for the four SIT datasets, as well as the MAE for the calculated proportion of operation subject to special consideration areas, are computed. Figure 15 illustrates a scatter plot depicting the sensitivity of SIT data to the proportion of operation subject to special consideration areas in the NSR.
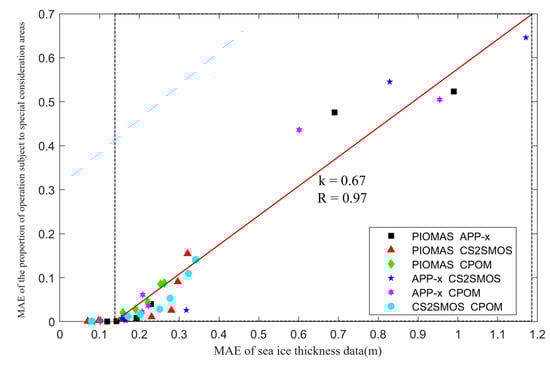
Figure 15.
Sensitivity analysis of multi-source SIT data and the proportion of operation subject to special consideration areas in the NSR for IAS ice-class ships (The range within the dashed box).
The variability in SIT significantly influences the proportion of operation subject to special consideration areas within a specific range. MAEs in SIT ranging from 0.15 to 1.20 m corresponded to changes in the proportion of operation subject to special consideration areas from 0 to 0.7. When the MAE of SIT ranged from 0.15 to 1.20 m, an approximately linear relationship was observed with a slope (k) of 0.67, which implies that for every 0.3 m of MAE in SIT data, there is an approximately 0.2 change in the proportion of operation subject to special consideration areas for IAS ice-class ships. Minor MAEs below 0.15 m in SIT data do not substantially impact the proportion of operation subject to special consideration areas. The correlation between MAE in SIT data and MAE in the proportion of operation subject to special consideration areas showed a strong association, reaching 0.97. This suggests a high sensitivity of the proportion of operation subject to special consideration areas for IAS ice-class ships in the NSR to variations in SIT data.
In summary, even minor discrepancies among SIT data products exert a noteworthy influence on the proportion of operation subject to special consideration areas, although their impact on the normal operational area is comparatively modest. The relationship between the MAE in SIT data and the MAE in the operation subject to special consideration area in the NSR follows a linear positive trend as the MAE increases, and the effect on the proportion of operation subject to special consideration areas is pronounced.
5.2. Impact of SIT Uncertainty on the Safe Sailing Speed in the NSR
In this section, we investigate the repercussions of uncertainties in SIT data on the safe sailing speed of vessels in the NSR. We calculated the MAE for four distinct SIT datasets, along with the MAE for the safe sailing speed of ice-class ships in the NSR derived from these datasets. The sensitivity of SIT data to the safe sailing speed of vessels in the NSR was examined through scatter plots, as depicted in Figure 16.
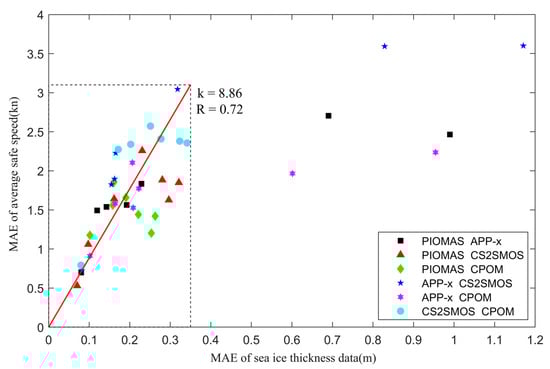
Figure 16.
Sensitivity analysis of multi-source SIT data and safe sailing speed for IAS ice-class ships in the NSR (The range within the dashed box).
Within a specific range, variations in SIT in the NSR notably influence the safe sailing speed. MAEs in SIT within the 0 to 0.35 m range lead to speed variations of 0 to 3.2 knots. When the MAE of SIT ranged from 0 to 0.35 m, an approximately linear relationship was observed with a slope (k) of 0.72. It implies that for every 0.1 m MAE in SIT data, there is an approximate change of 0.72 knots in the safe sailing speed of ice-class ships. Once the MAE in SIT surpasses 0.4 m, the impact on speed change becomes negligible. A robust correlation of 0.72 between MAE in SIT data and MAE in safe sailing speed underscores that MAEs in SIT data significantly alter the navigation speed of ice-class ships in the NSR, underscoring high sensitivity to variations in SIT.
5.3. Impact of SIT Uncertainty on Route Planning in the NSR
This section delves into the repercussions of SIT uncertainty on vessel route planning in the NSR. It scrutinizes the sensitivity of vessel route planning to SIT data, focusing on two primary planning objectives for ice-class ships: achieving time priority and distance priority.
5.3.1. Sensitivity Analysis of Multi-Source SIT Data and Navigation Duration
This section begins by assessing the influence of uncertainty in SIT data on the navigation duration of vessels in the NSR. It involves the calculation of MAE for four distinct SIT datasets, along with the MAE for monthly navigation time estimates for ice-class ships in the NSR derived from these datasets. Scatter plots are then employed to examine the sensitivity of SIT data to vessel navigation duration, as depicted in Figure 17.
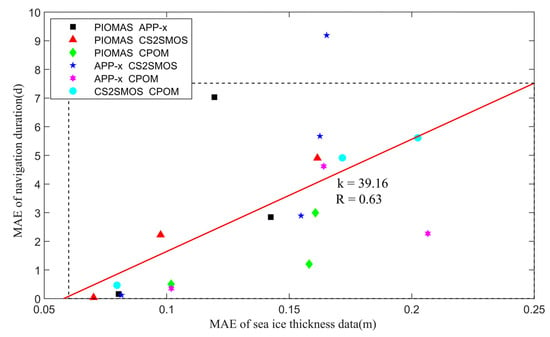
Figure 17.
Sensitivity analysis of multi-source SIT data products and navigation duration for IAS ice-class ships in the NSR (The range within the dashed box).
Within a specific range, variations in SIT in the NSR have a notable impact on navigation time. MAEs in SIT within the range of 0.06–0.25 m result in corresponding changes in navigation duration ranging from 0 to 7.2 days. When the MAE of SIT ranged from 0.06 to 0.25 m, an approximate linear relationship was observed, with a slope (k) of 39.16, which implies that for every 0.1 m MAE in SIT data, there is an approximate alteration of 4 days in the navigation duration of ice-class ships. The correlation between SIT data MAE and navigation duration MAE, while significant, was relatively moderate at 0.63. This signifies that MAEs in SIT data lead to considerable changes in the navigation duration of ice-class ships in the NSR, emphasizing a notable sensitivity to variations in SIT.
5.3.2. Sensitivity Analysis of Multi-Source SIT Data and Route Distance
This section investigates the influence of uncertainties in SIT data on the route distance in the NSR. The MAE for four types of SIT data is calculated, along with the MAE for the monthly route distance of ice-class ships in the NSR based on these datasets. Scatter plots are employed to scrutinize the sensitivity of SIT data to the route distance in the NSR, as depicted in Figure 18.
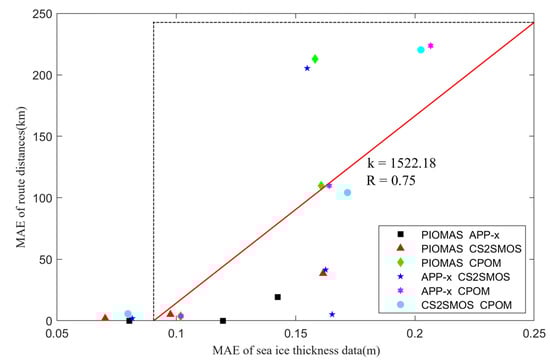
Figure 18.
Sensitivity analysis of multi-source SIT data products and route distance for IAS ice-class ships in the NSR (The range within the dashed box).
Within a certain range, alterations in SIT in the NSR notably influence route distance. MAEs in SIT within the range of 0.09 to 0.25 m yield variations in route distance from 0 to 250 km. When MAEs of SIT ranged from 0.09 to 0.25 m, an approximate linear relationship was observed, with a slope (k) of 1522.18, which implies that for every 0.1 m MAE in SIT data, there is an approximate alteration of 152 km in the route distance of ice-class ships, showing an approximately linear relationship (k = 1522.18). In simpler terms, for every 0.1 MAE in SIT data, there is an approximate change of 150 km in the route distance of Ice-Class ships. The impact on route distance is not substantial when SIT data MAE is shorter than 0.1 m. The correlation between SIT data MAE and route distance MAE was relatively robust at 0.75. This indicates that MAEs in SIT data significantly alter the route distance of ice-class ships in the NSR, underscoring a high sensitivity to variations in SIT.
In summary, minor MAEs among SIT data products notably affect the route distance of planned trajectories. Comparatively, the influence on navigation time is less significant. With an increase in the MAE in SIT data, a linear positive correlation emerges with MAEs in both route distance and navigation time in the NSR. However, the impact on route distance MAE is more pronounced, indicating a heightened sensitivity to variations in SIT.
6. Conclusions
This study provides a quantitative assessment of the influence of SIT data uncertainty on navigational uncertainty in the NSR. Employing four distinct SIT datasets, we evaluated uncertainty in navigational spatiotemporal windows, the distribution of safe sailing speed, and the uncertainty in optimal route planning resulting from SIT data uncertainty. Furthermore, we explored the sensitivity of navigational spatiotemporal windows, the distribution of safe sailing speed, and route planning to variations in SIT. The key findings of the study are summarized in Figure 19.
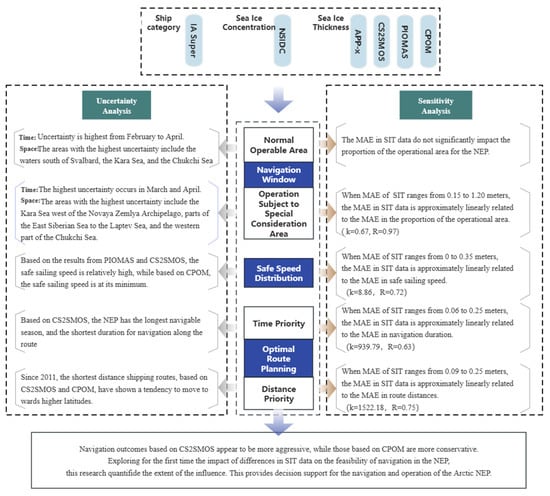
Figure 19.
Feasibility study results for the NSR based on multi-source SIT data for IAS ice-class ships.
The results indicate the following:
- (1)
- Navigational variations in the NSR over time: In relation to the navigational spatiotemporal windows in the NSR, the period from February to April witnesses the highest uncertainty in the determination of navigable areas when employing the four SIT products. Conversely, in October, this uncertainty reaches a minimum. Concerning the distribution of safe sailing speed in the NSR, PIOMAS and CS2SMOS consistently depict higher average safe speeds during winter, facilitating expedited vessel traversal through the NSR. In contrast, CPOM consistently reveals lower average safe speeds throughout each month of the winter half-year compared with the other three products. Regarding route planning, the peak uncertainty is observed in January, while navigability uncertainty is minimal from October to December. However, concerning the navigation duration and route distance, the least uncertainty is evident in October. Since 2011, the distance priority routes based on CS2SMOS and CPOM have manifested a notable trend, gradually shifting toward higher latitudes.
- (2)
- Spatial distribution of navigable areas in the NSR: Considerable navigational uncertainties are prevalent in specific regions, namely, the Kara Sea, the section extending from the East Siberian Sea to the Laptev Sea, and the western sector of the Chukchi Sea. These areas demand particular attention during the actual process of route planning.
- (3)
- Analysis of navigational aspects: spatiotemporal windows, safe sailing speed, and route planning: CS2SMOS consistently yields more assertive results, presenting increased opportunities for route design. In contrast, CPOM’s outcomes lean toward conservatism, providing a reference for prudential navigation concerning spatiotemporal windows, safe speed determination, and route planning.
Furthermore, this research presents the inaugural quantitative evaluation of the impact of SIT data variability on the navigational feasibility of the NSR.
Noteworthy is the pronounced sensitivity of the operations subject to special consideration areas in the NSR to disparities in SIT data (R = 0.97). Within the MAE of the SIT range of 0.15 to 1.20 m, a 0.3 m difference in SIT data results in an approximate 0.2 alteration in the proportion of operations subject to special consideration area. However, the influence of SIT data variations on the typical operational area percentage of the NSR is deemed insignificant. The frequency distribution of sea ice thickness data from different products during the winter half-years of 2011–2021 is shown in Figure 5. The deviations in the mean values of different sea ice thickness products range from 0.08 to 0.35 m. This uncertainty among the sea ice thickness products can significantly impact the navigable range of IAS ships in the areas of operations subject to special consideration on the NSR, increasing decision-making uncertainty. However, the effect on the normal navigational decision-making range for IAS ships on the NSR is minimal.
The NSR for IAS ice-class ships exhibits heightened sensitivity in safe sailing speed to alterations in SIT (R = 0.72). Specifically, when the MAE of SIT varies from 0 to 0.35 m, a 0.1 m difference in SIT data corresponds to a speed change of approximately 0.89 knots. This indicates that minor discrepancies between sea ice products can lead to significant changes in safe speed, thus increasing navigational risks primarily in the marginal ice zone and areas with first-year ice distribution. In regions with thick ice, even though there may be substantial differences in sea ice thickness products, the impact on maneuvering is minimal due to the inherently low safe sailing speeds.
The MAE in SIT data demonstrates a linear positive correlation with both navigation distance and MAE in navigation duration in the NSR. Nevertheless, its impact on route distance is more conspicuous (R = 0.75). In the MAE of the SIT range of 0.06 to 0.25 m, a 0.1 m difference in SIT data results in a distance alteration of 152 km, and a 0.1 m difference in SIT data corresponds to a navigation duration change of approximately 4 days. Minor discrepancies between sea ice products can lead to significant changes in both navigation distance and duration. On the one hand, these variations in distance and time contribute to uncertainty in economic cost estimation. On the other hand, for time-sensitive cargo, the unpredictability of arrival times is unacceptable. For instance, for the non-ice-class ship LR3, each additional day of navigation increases the operating and capital costs by USD 9175 and USD 14,178, respectively [3].
Overall, the uncertainty in sea ice thickness products significantly impacts operational range, maneuvering safety, and both economic and time costs of operations, thereby increasing the risks associated with routine liner shipping in the Arctic. This study demonstrates that reducing the uncertainty in sea ice thickness products and improving their accuracy is not only a scientific concern but also a practical necessity for Arctic shipping. Considering the three aspects of navigation, temporal and spatial window capture, safe sailing speed determination, and route planning, the CS2SMOS results are relatively aggressive and can provide more possibilities for route design, while the CPOM results are more conservative and can serve as a reference for cautious navigation. Depending on the type of shipping and specific shipping issues, careful selection of aggressive or conservative sea ice thickness data products as sources for navigation planning is essential for reducing safety risks and the complexity of navigation planning.
The highlights are the following:
- First, the impact of uncertainty in multi-source sea-ice thickness products on the feasibility of the Northern Sea Route is quantified considering navigation window, safe sailing speed, and route planning.
- Experiment results based on CS2SMOS exhibit a more aggressive profile, while results based on CPOM are more conservative.
A 0.1 m discrepancy in sea ice thickness data results in an approximate 0.067 change in the proportion of operations within special consideration areas. This discrepancy also leads to an approximate speed change of 0.89 knots, a navigation duration change of approximately 4 days and a distance change of 152 km within specified limits.
Author Contributions
Conceptualization, T.L. and Y.W.; methodology, T.L. and Y.W.; validation, Y.L. and Y.W.; formal analysis, Y.W. and B.W.; investigation, Q.L.; resources, Y.W.; data curation, T.L.; writing—original draft preparation, T.L.; writing—review and editing, Y.W.; visualization, T.L. and B.W.; supervision, Y.L.; project administration, X.C.; funding acquisition, Y.W. All authors have read and agreed to the published version of the manuscript.
Funding
This research was funded by Xi Chen, grant number “No. 62073332”, and the APC was funded by the National Natural Science Foundation of China.
Data Availability Statement
The data that support the findings of this study are available from the corresponding author, Y.L., upon reasonable request.
Conflicts of Interest
The authors declare no conflicts of interest.
Appendix A

Figure A1.
Distribution of average safe sailing speeds for IAS ice-class vessels on the NSR in November from 2011 to 2021 based on multi-source SIT products. (a) PIOMAS; (b) APP-x; (c) CS2SMOS; (d) CPOM. (white blank spaces indicate non-navigable areas).
Figure A1.
Distribution of average safe sailing speeds for IAS ice-class vessels on the NSR in November from 2011 to 2021 based on multi-source SIT products. (a) PIOMAS; (b) APP-x; (c) CS2SMOS; (d) CPOM. (white blank spaces indicate non-navigable areas).
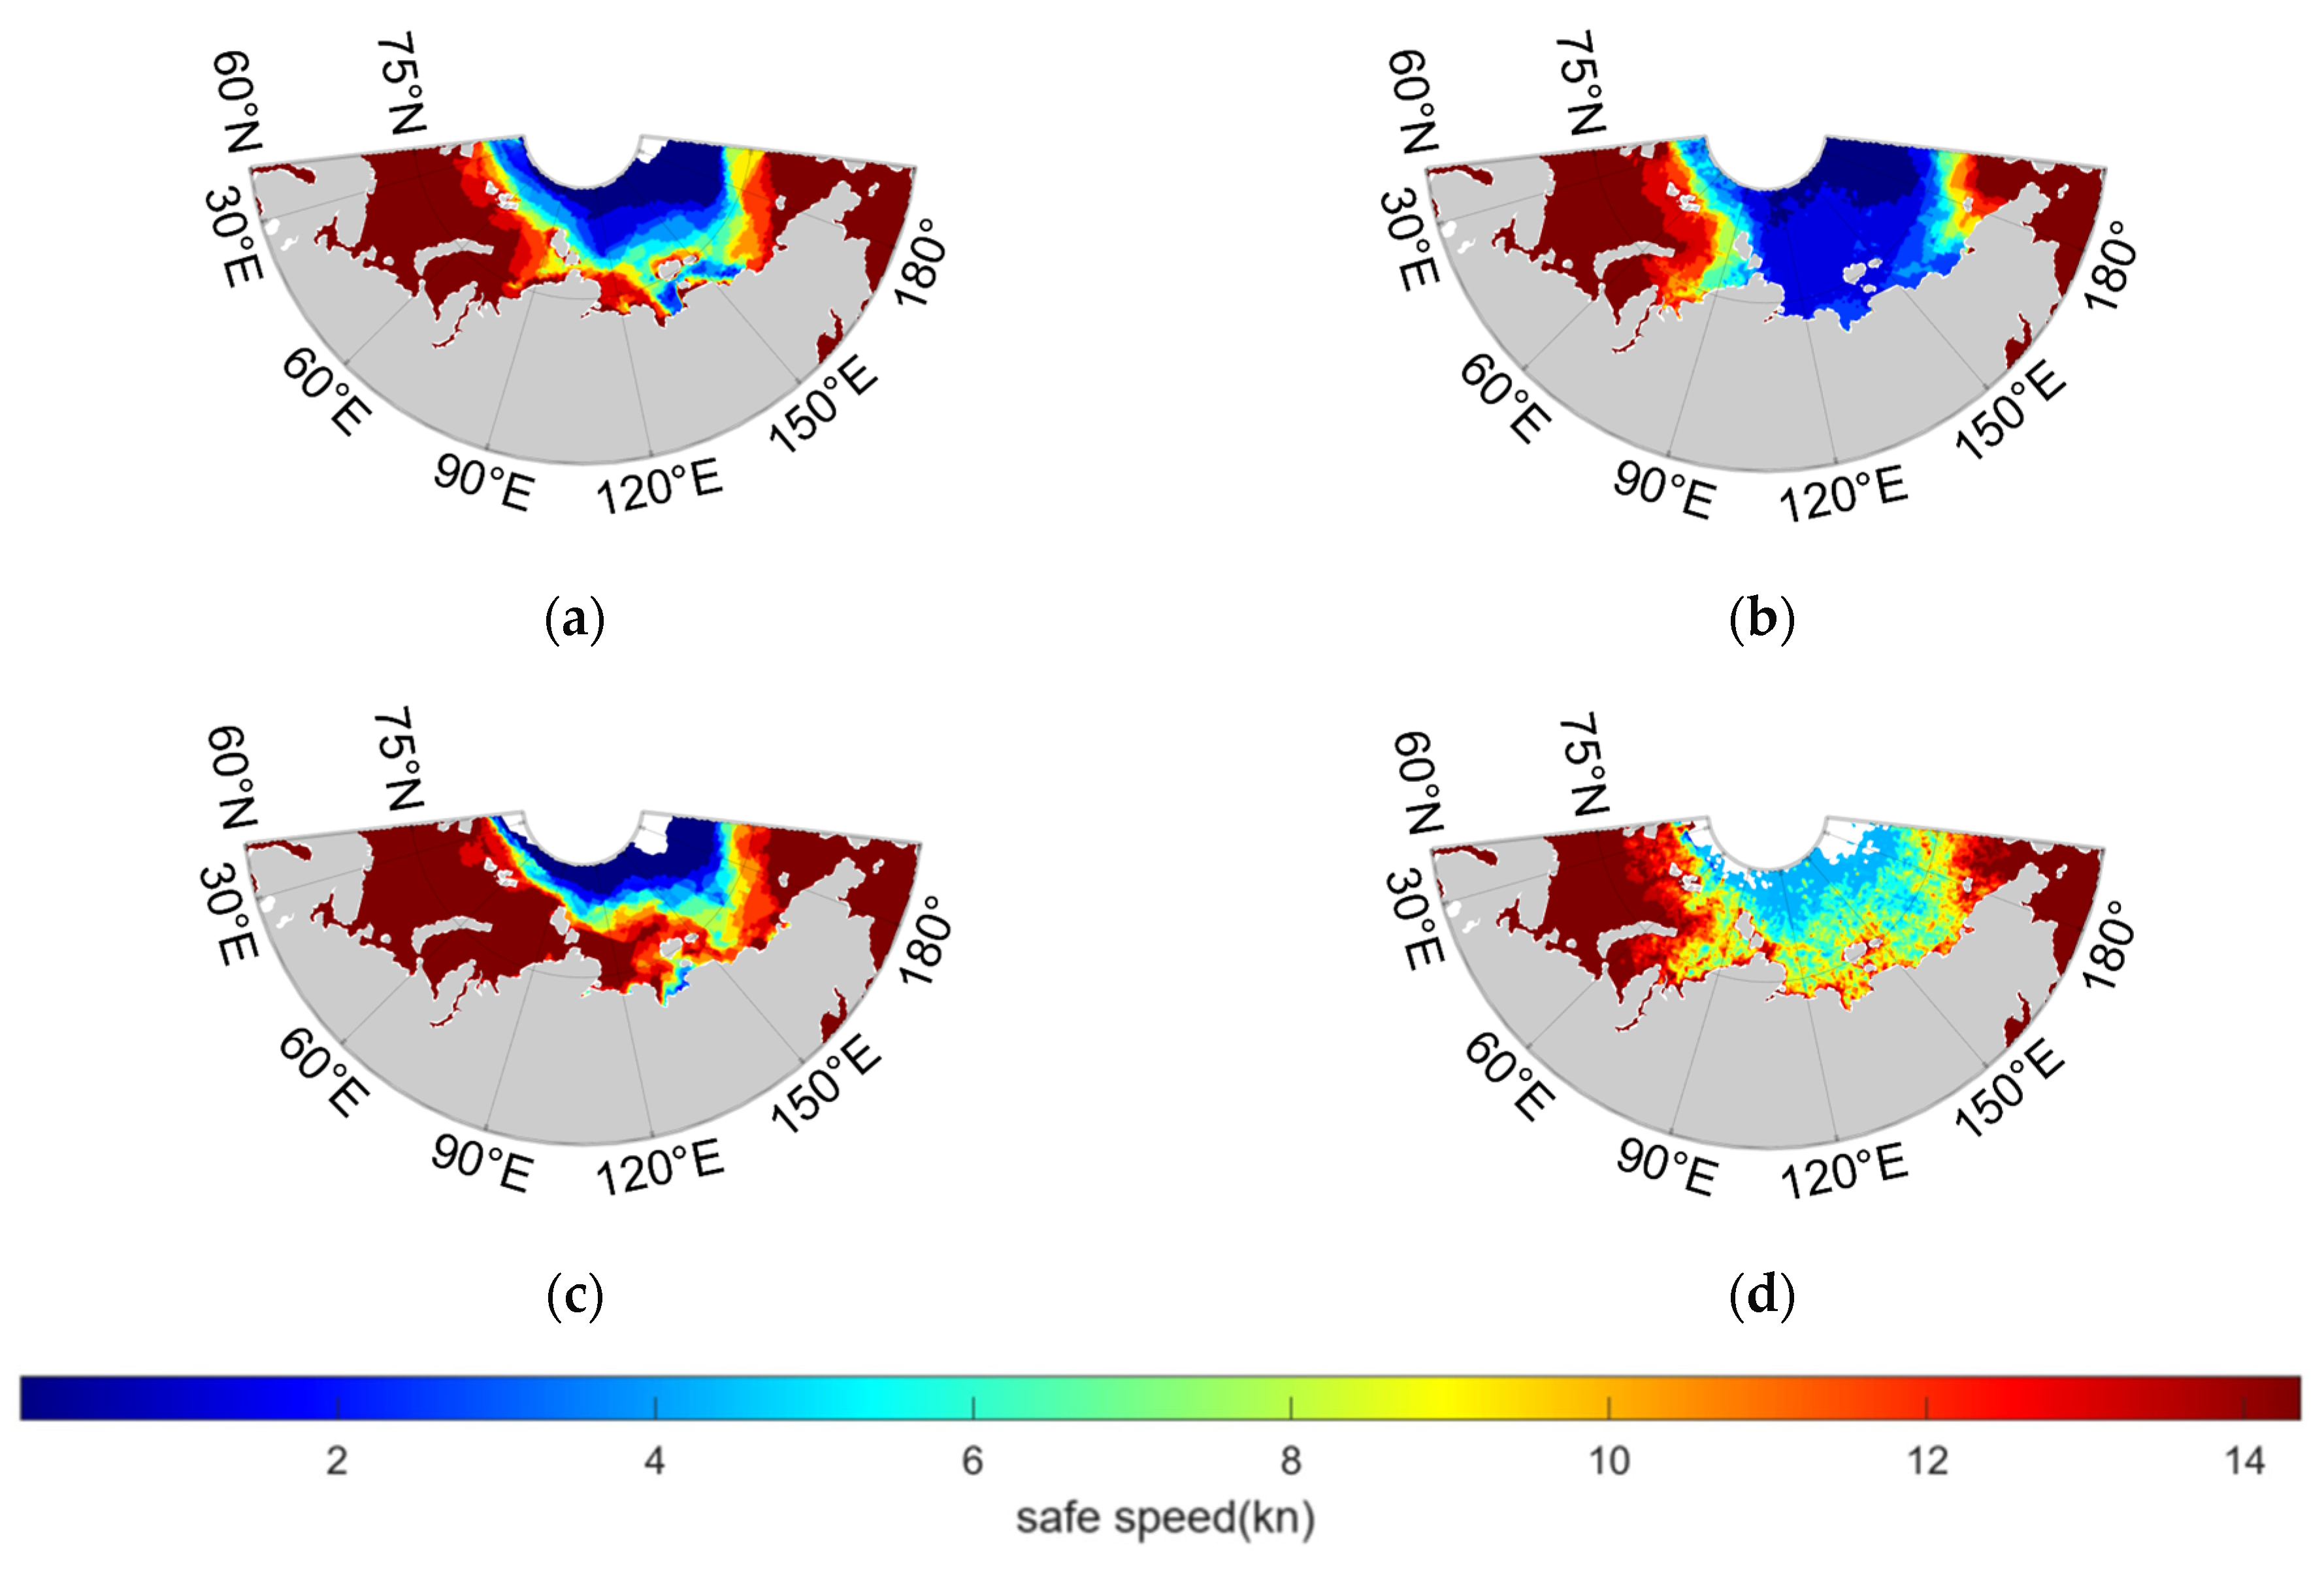

Figure A2.
Distribution of average safe sailing speeds for IAS ice-class vessels on the NSR in December from 2011 to 2021 based on multi-source SIT products. (a) PIOMAS; (b) APP-x; (c) CS2SMOS; (d) CPOM. (white blank spaces indicate non-navigable areas).
Figure A2.
Distribution of average safe sailing speeds for IAS ice-class vessels on the NSR in December from 2011 to 2021 based on multi-source SIT products. (a) PIOMAS; (b) APP-x; (c) CS2SMOS; (d) CPOM. (white blank spaces indicate non-navigable areas).
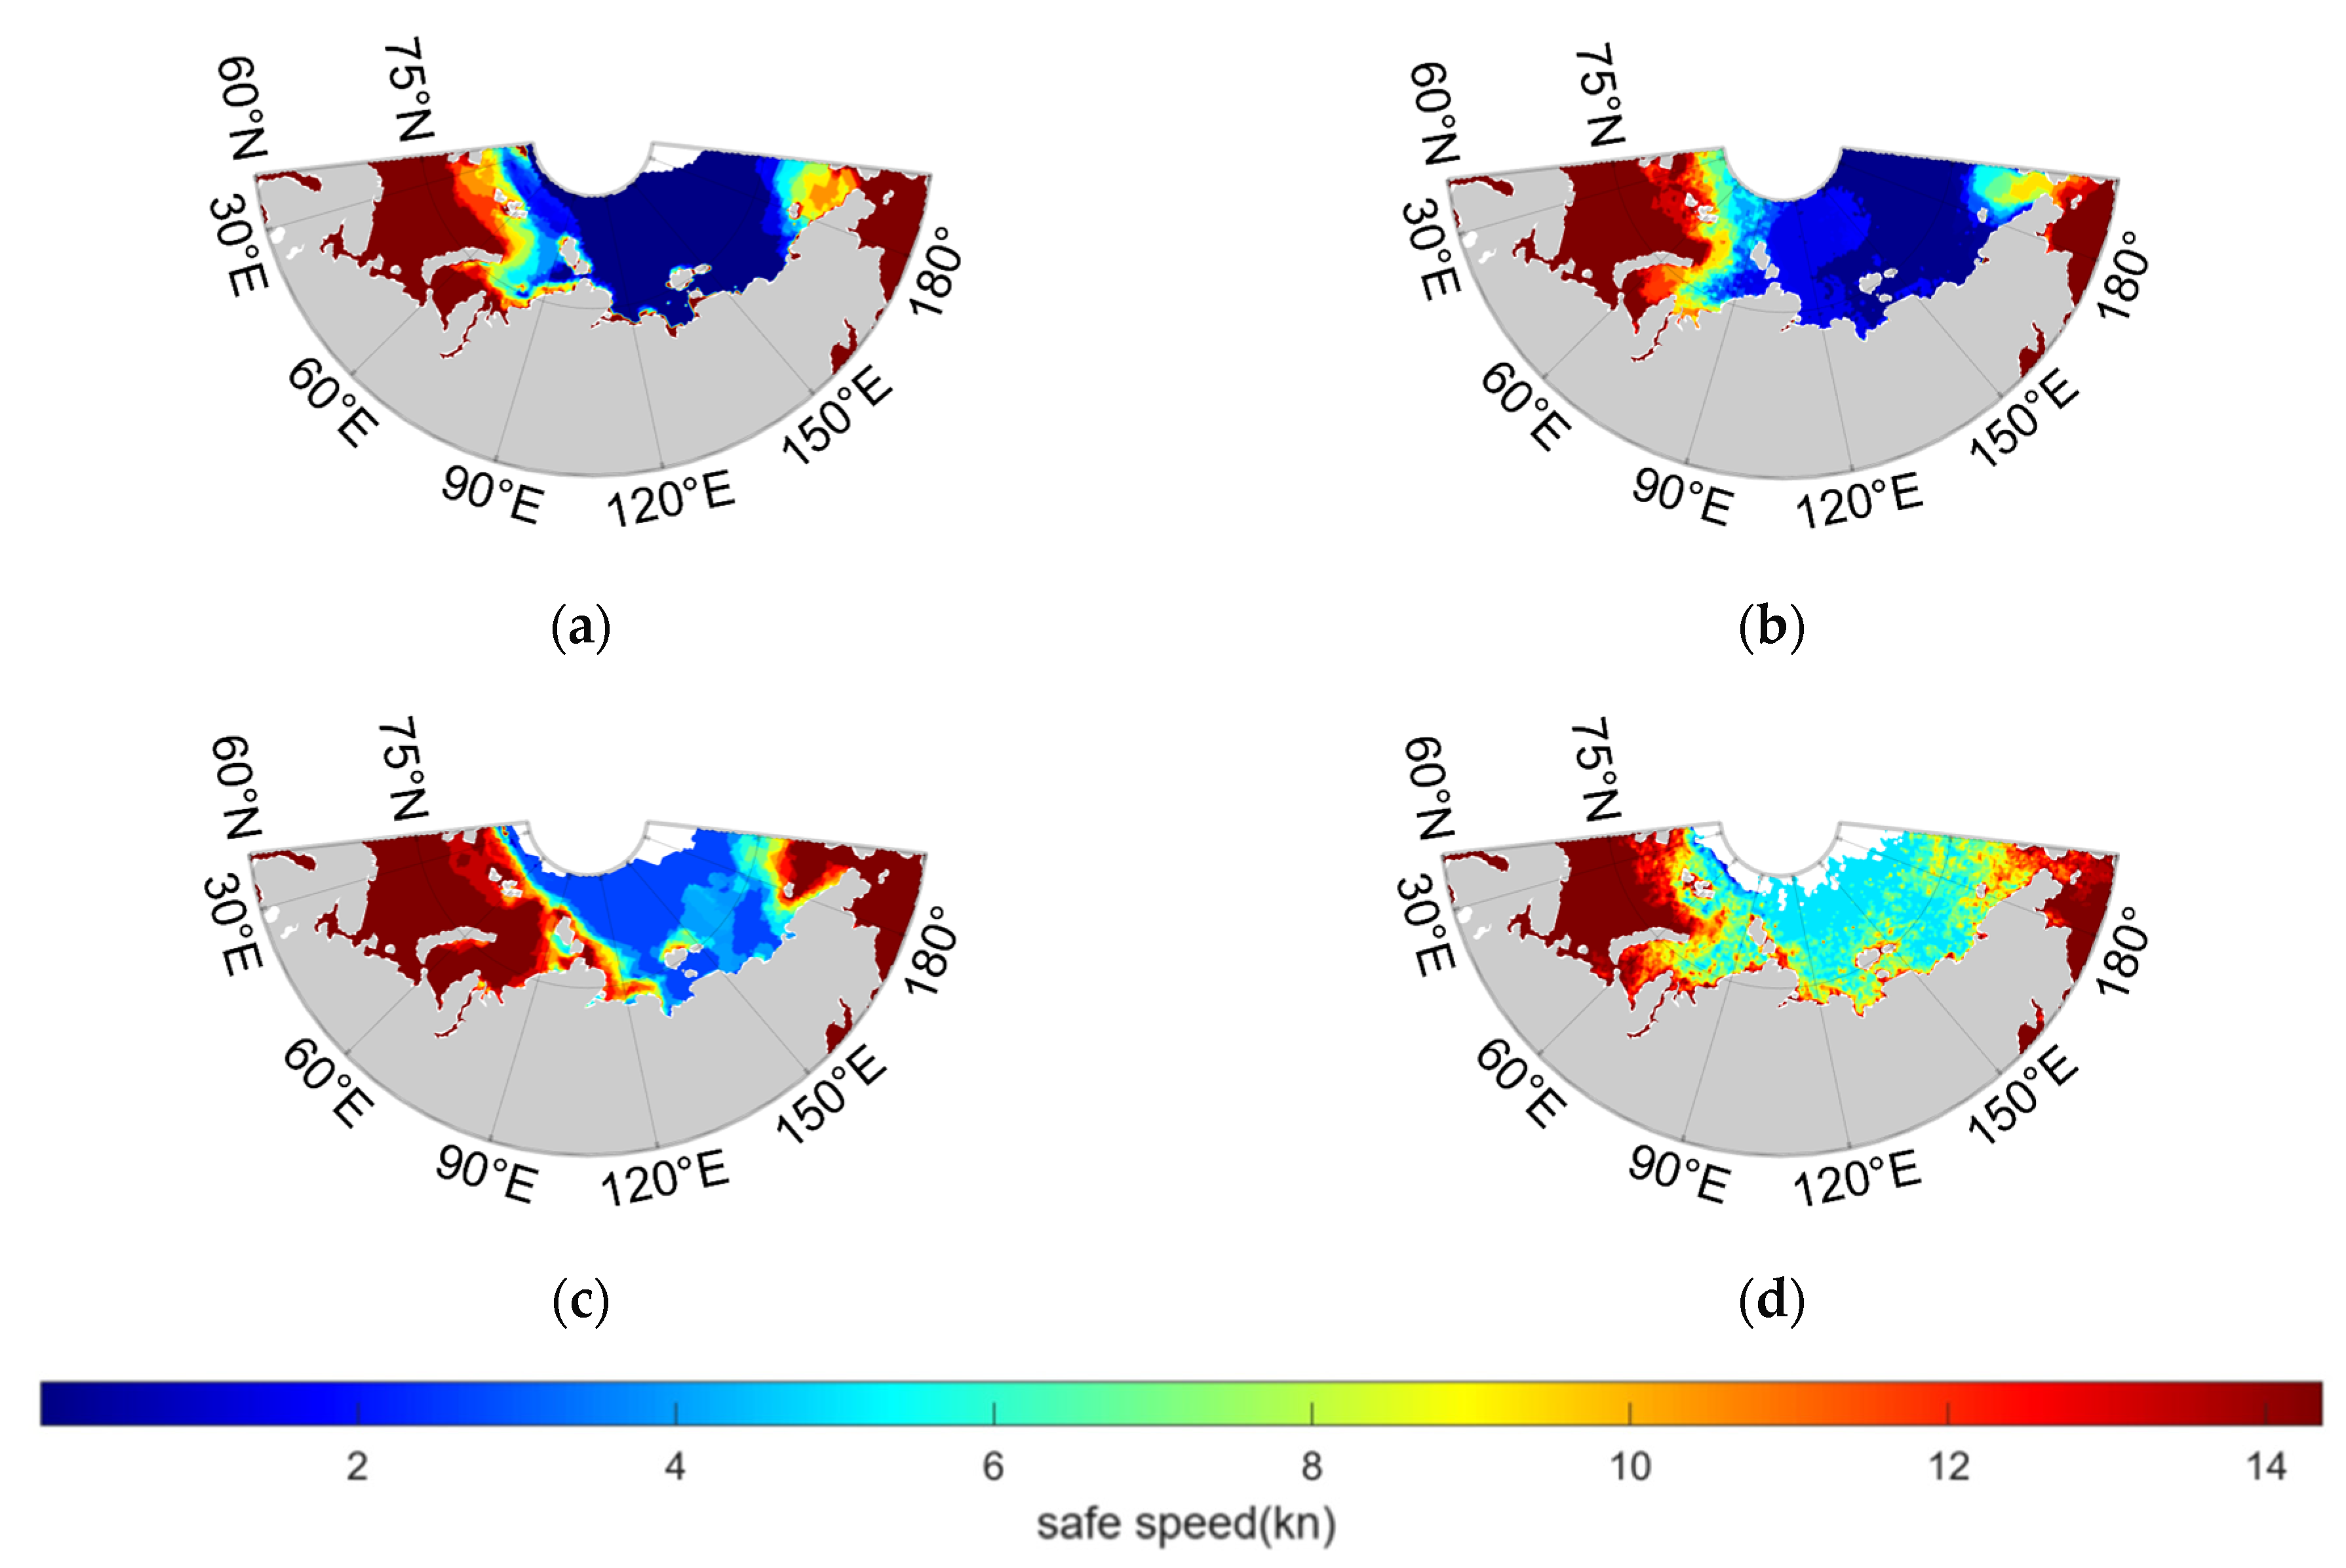
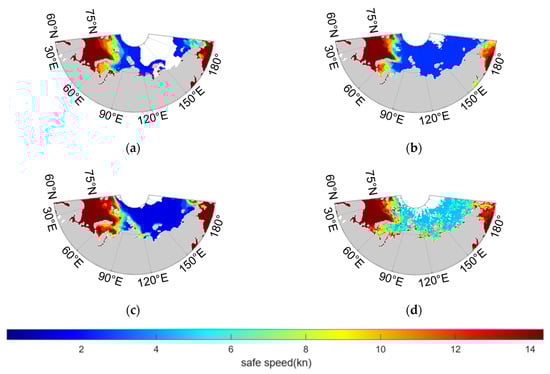
Figure A3.
Distribution of average safe sailing speeds for IAS ice-class vessels on the NSR in January from 2011 to 2021 based on multi-source SIT products. (a) PIOMAS; (b) APP-x; (c) CS2SMOS; (d) CPOM. (white blank spaces indicate non-navigable areas).
Figure A3.
Distribution of average safe sailing speeds for IAS ice-class vessels on the NSR in January from 2011 to 2021 based on multi-source SIT products. (a) PIOMAS; (b) APP-x; (c) CS2SMOS; (d) CPOM. (white blank spaces indicate non-navigable areas).
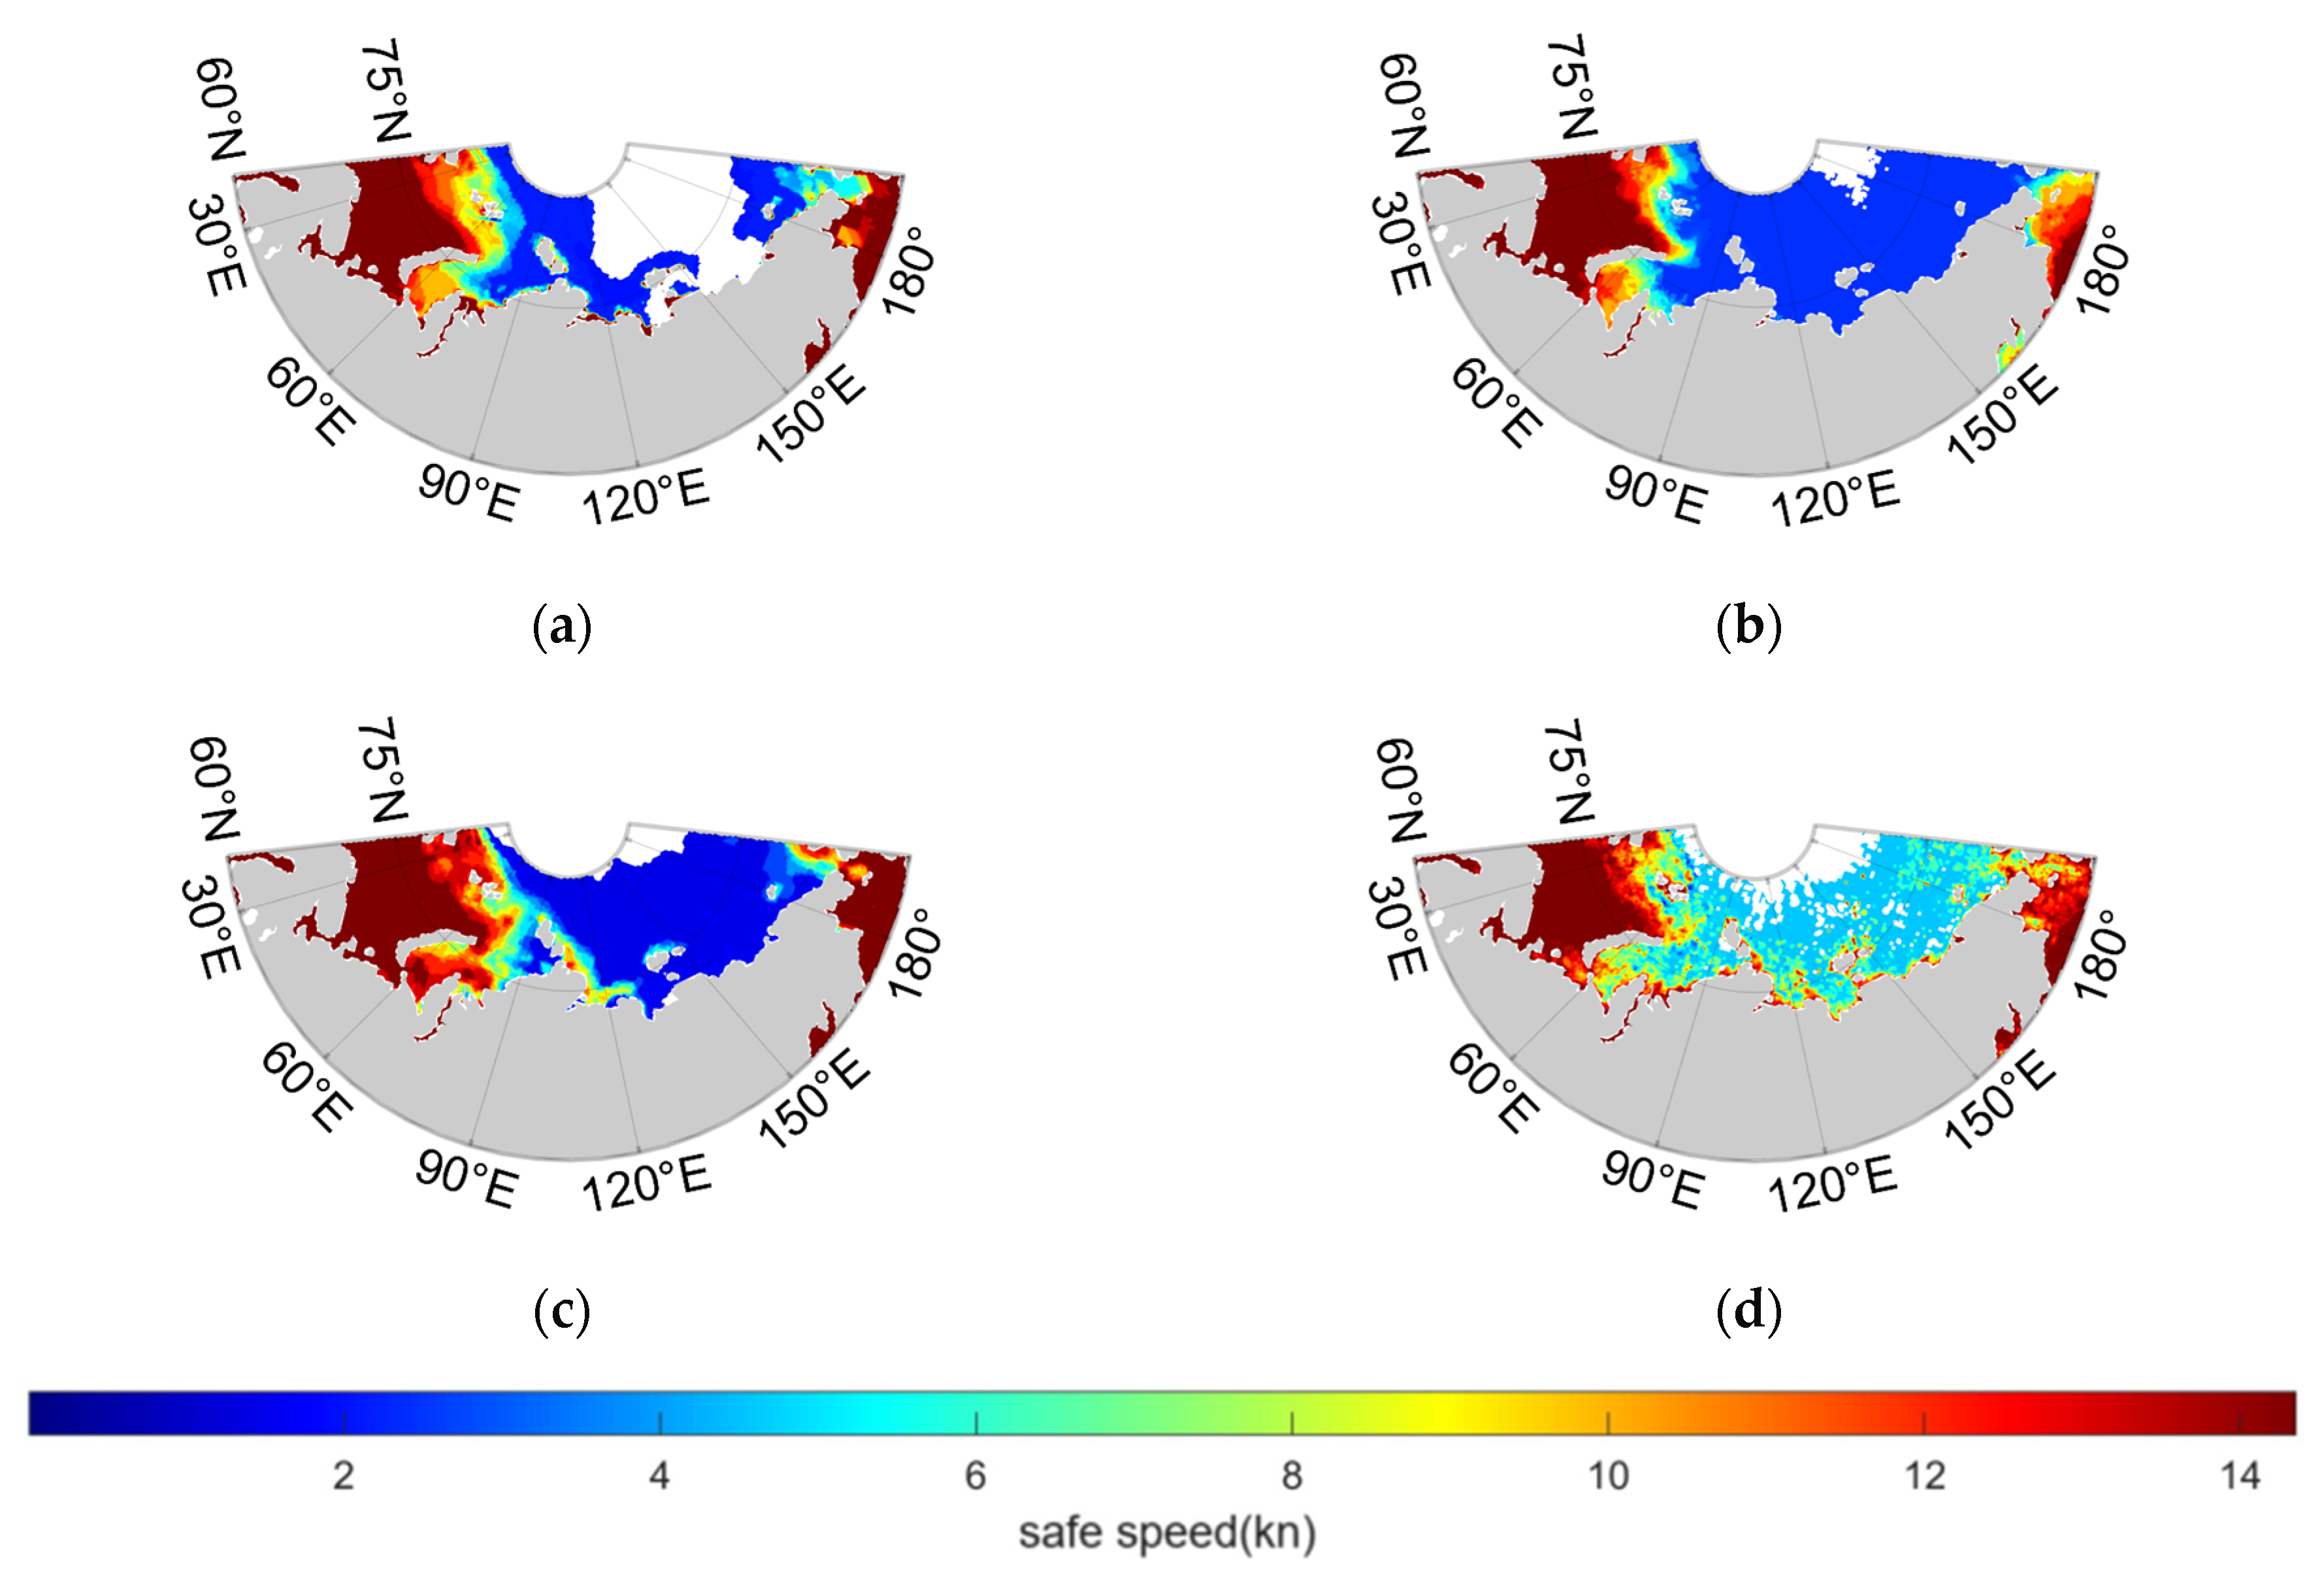
Figure A4.
Distribution of average safe sailing speeds for IAS ice-class vessels on the NSR in February from 2011 to 2021 based on multi-source SIT products. (a) PIOMAS; (b) APP-x; (c) CS2SMOS; (d) CPOM. (white blank spaces indicate non-navigable areas).
Figure A4.
Distribution of average safe sailing speeds for IAS ice-class vessels on the NSR in February from 2011 to 2021 based on multi-source SIT products. (a) PIOMAS; (b) APP-x; (c) CS2SMOS; (d) CPOM. (white blank spaces indicate non-navigable areas).

Figure A5.
Distribution of average safe sailing speeds for IAS ice-class vessels on the NSR in March from 2011 to 2021 based on multi-source SIT products. (a) PIOMAS; (b) APP-x; (c) CS2SMOS; (d) CPOM. (white blank spaces indicate non-navigable areas).
Figure A5.
Distribution of average safe sailing speeds for IAS ice-class vessels on the NSR in March from 2011 to 2021 based on multi-source SIT products. (a) PIOMAS; (b) APP-x; (c) CS2SMOS; (d) CPOM. (white blank spaces indicate non-navigable areas).


Figure A6.
Distribution of average safe sailing speeds for IAS ice-class vessels on the NSR in April from 2011 to 2021 based on multi-source SIT products. (a) PIOMAS; (b) APP-x; (c) CS2SMOS; (d) CPOM. (white blank spaces indicate non-navigable areas).
Figure A6.
Distribution of average safe sailing speeds for IAS ice-class vessels on the NSR in April from 2011 to 2021 based on multi-source SIT products. (a) PIOMAS; (b) APP-x; (c) CS2SMOS; (d) CPOM. (white blank spaces indicate non-navigable areas).
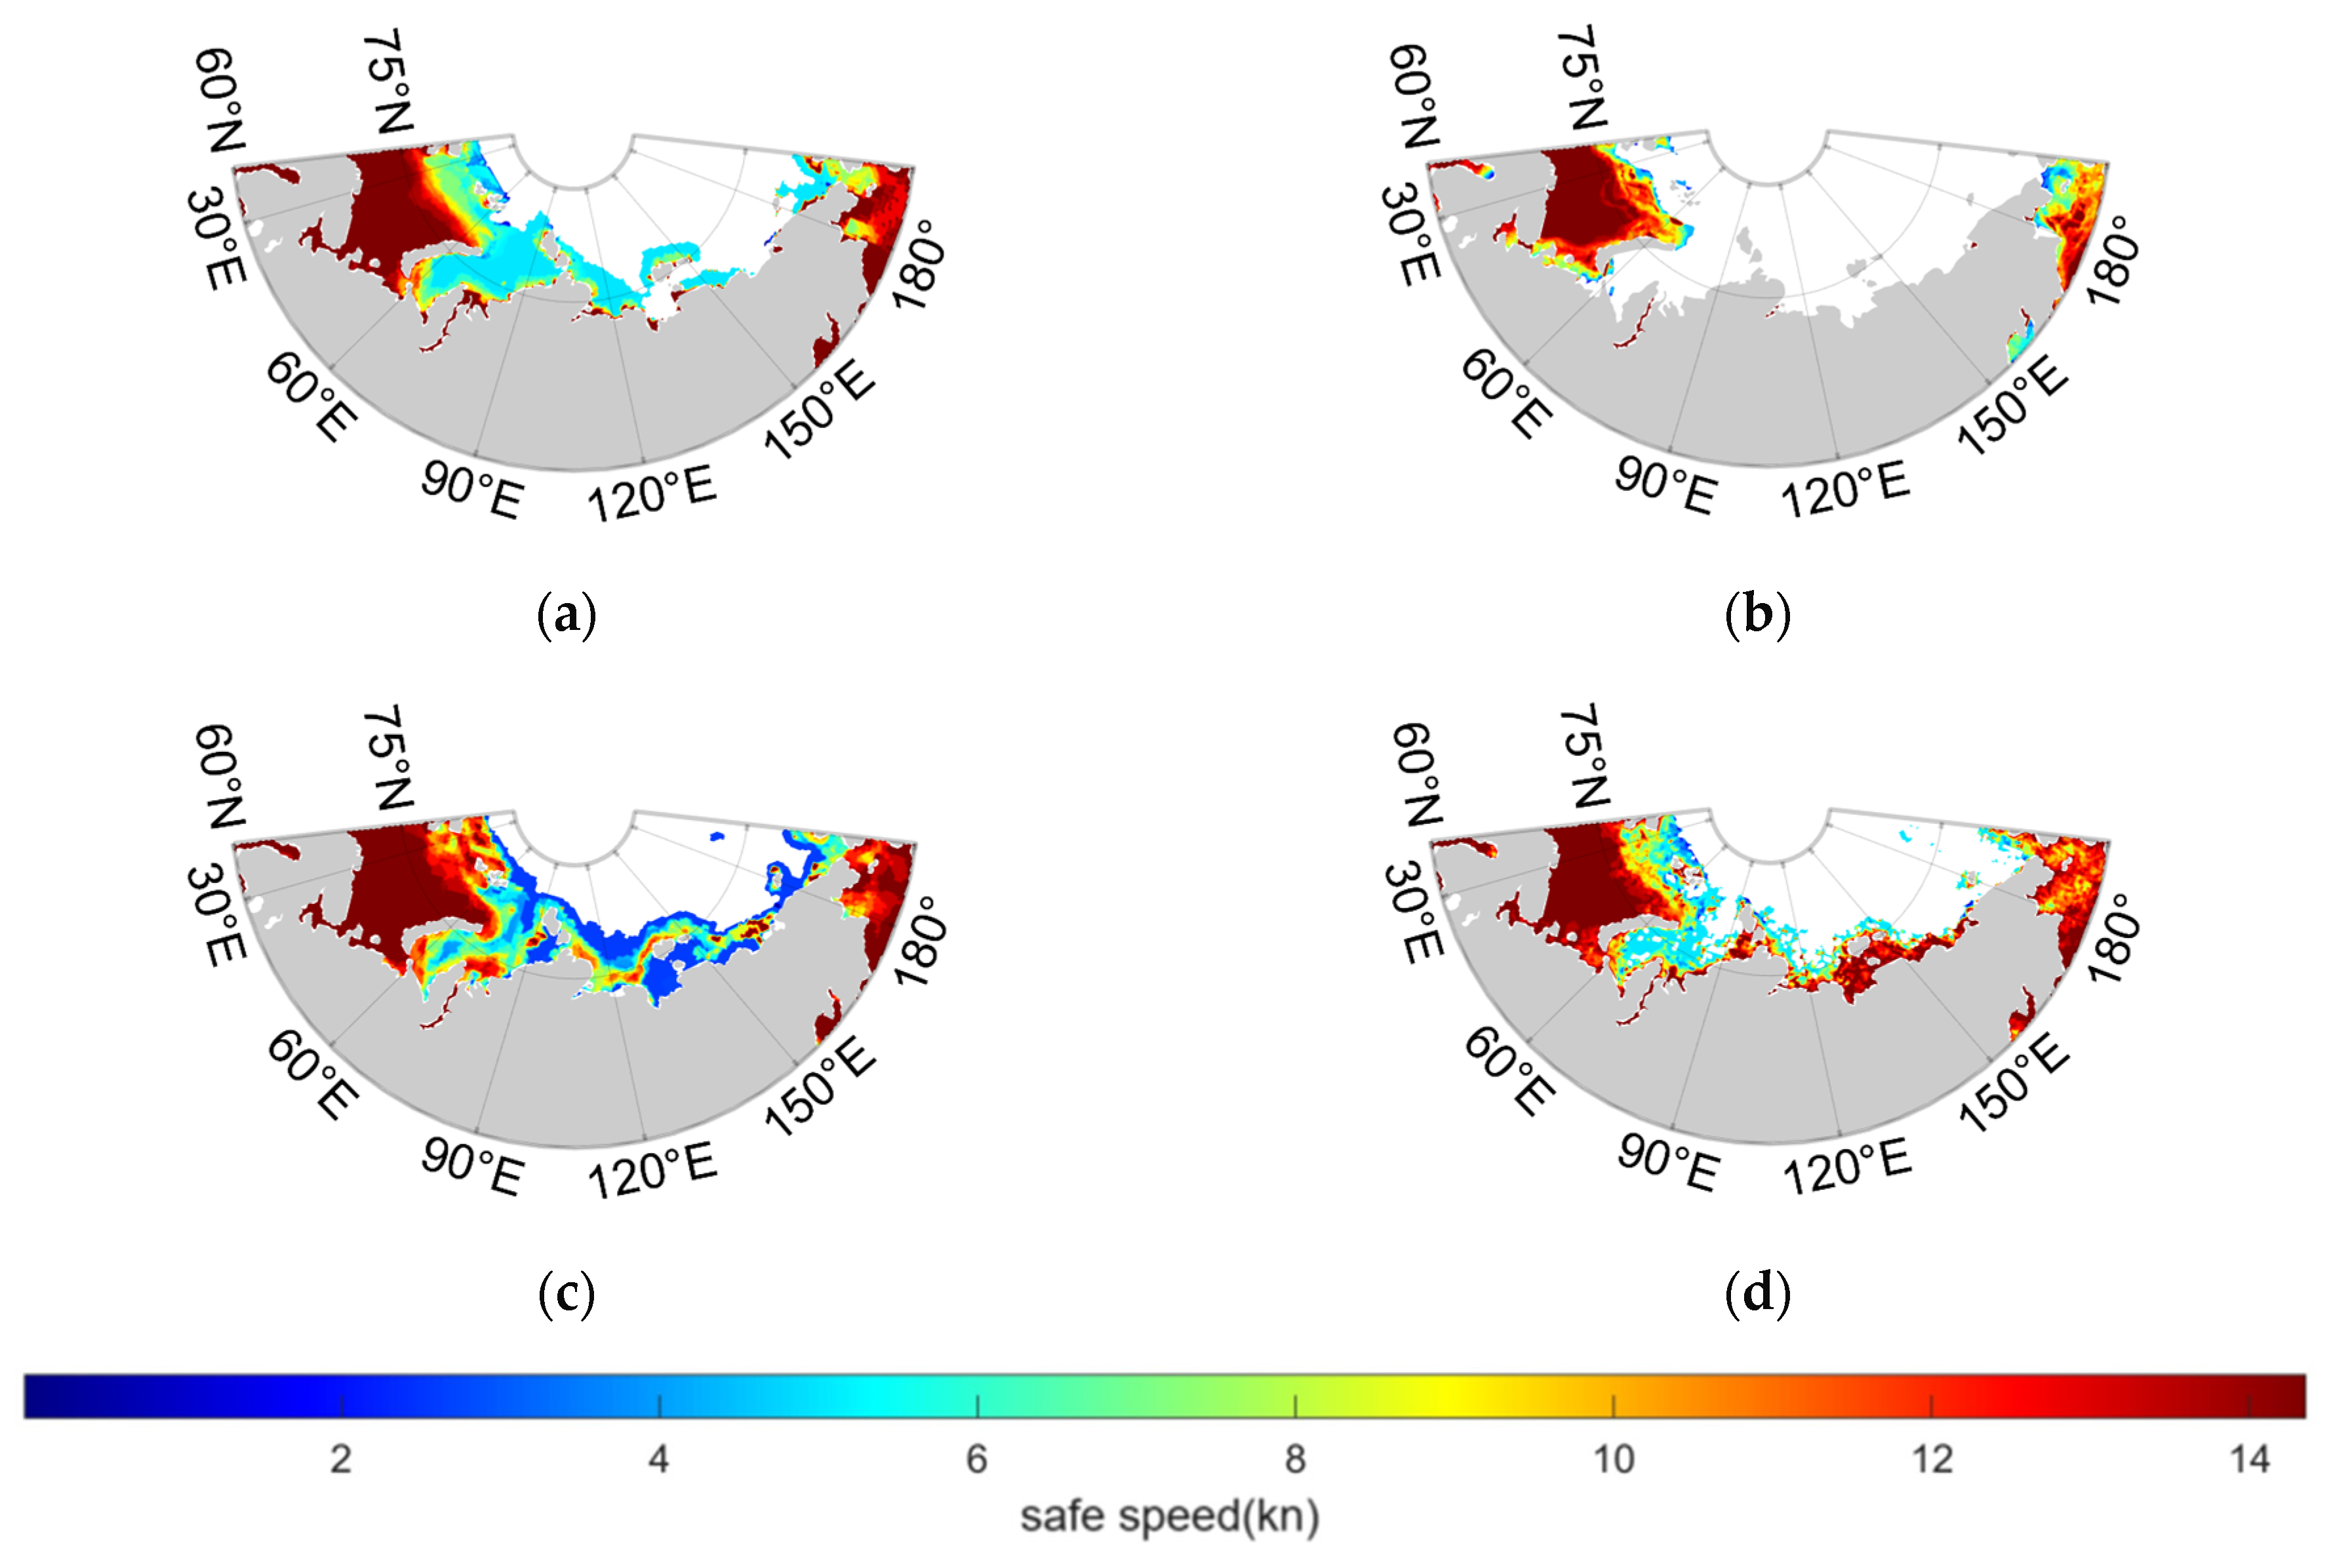
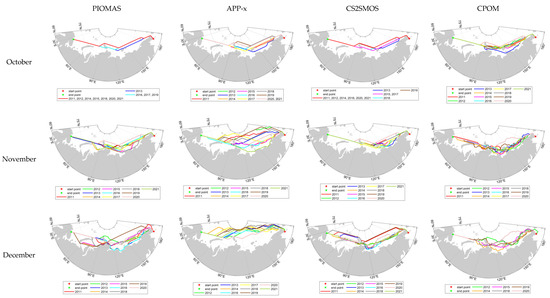
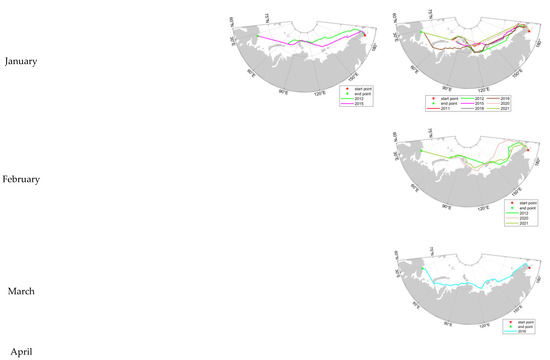
Figure A7.
Results of NSR route planning for IAS ice-class ships based on multi-source SIT products in different months (Time Priority) (Diagonal lines indicate non-navigable areas).
Figure A7.
Results of NSR route planning for IAS ice-class ships based on multi-source SIT products in different months (Time Priority) (Diagonal lines indicate non-navigable areas).
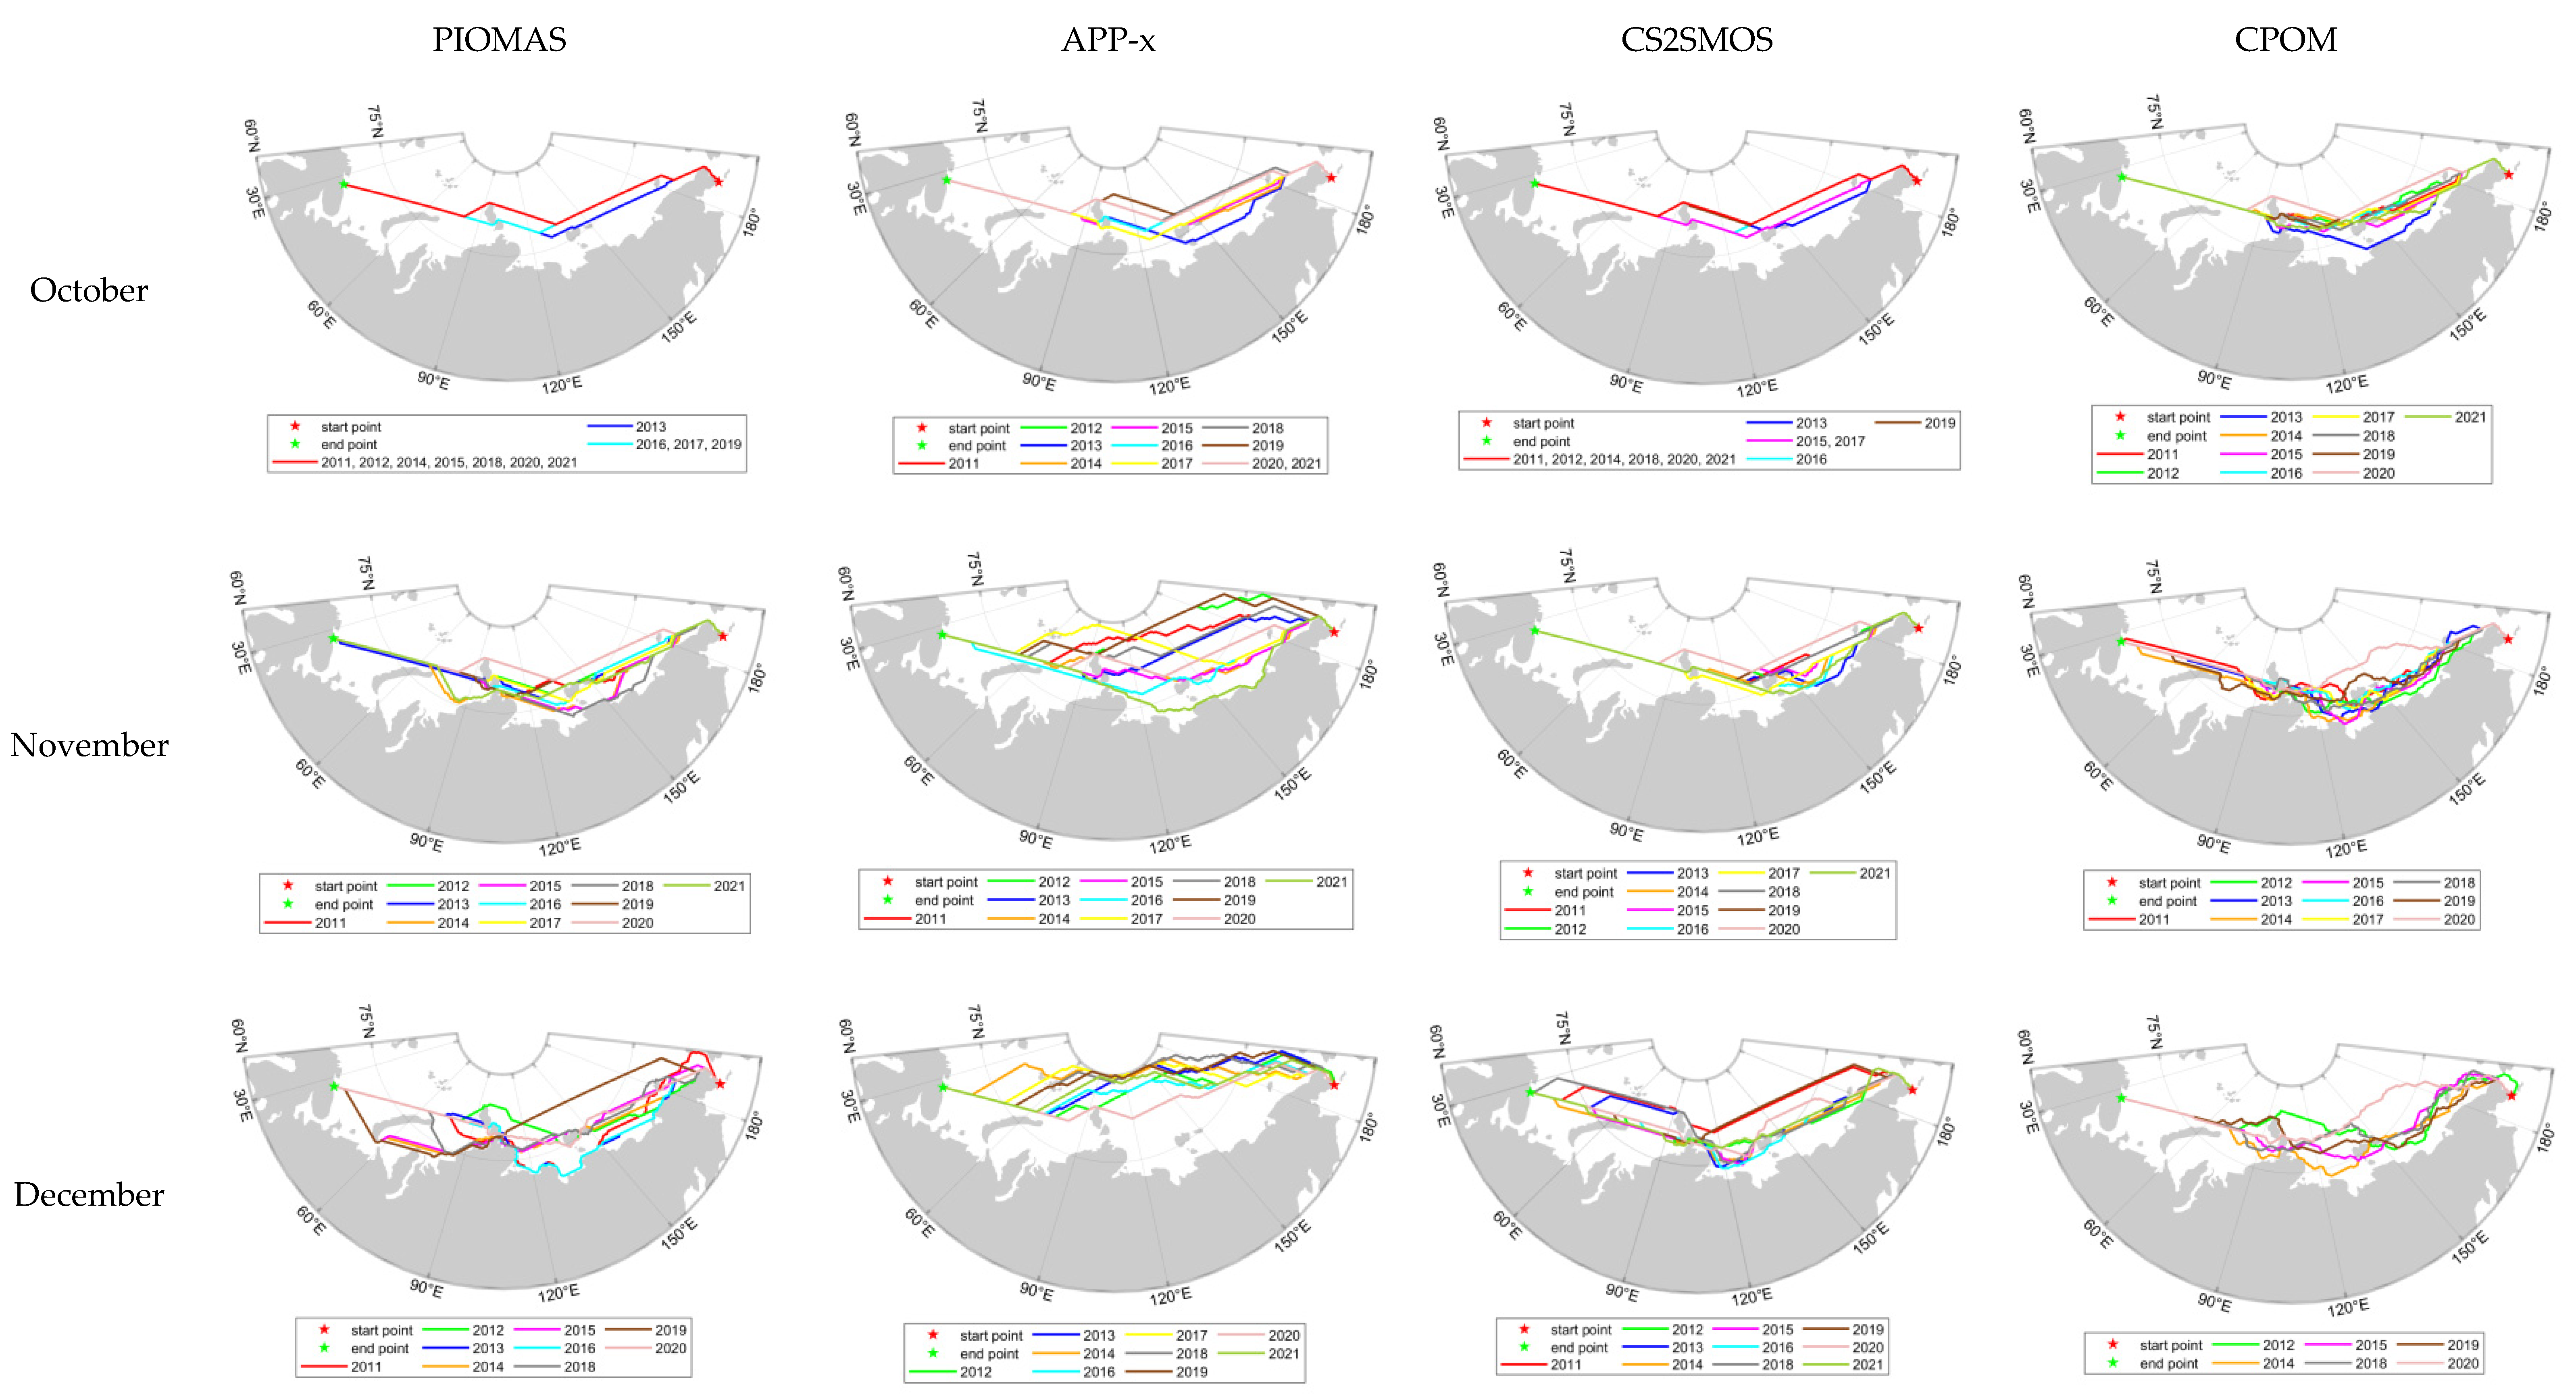
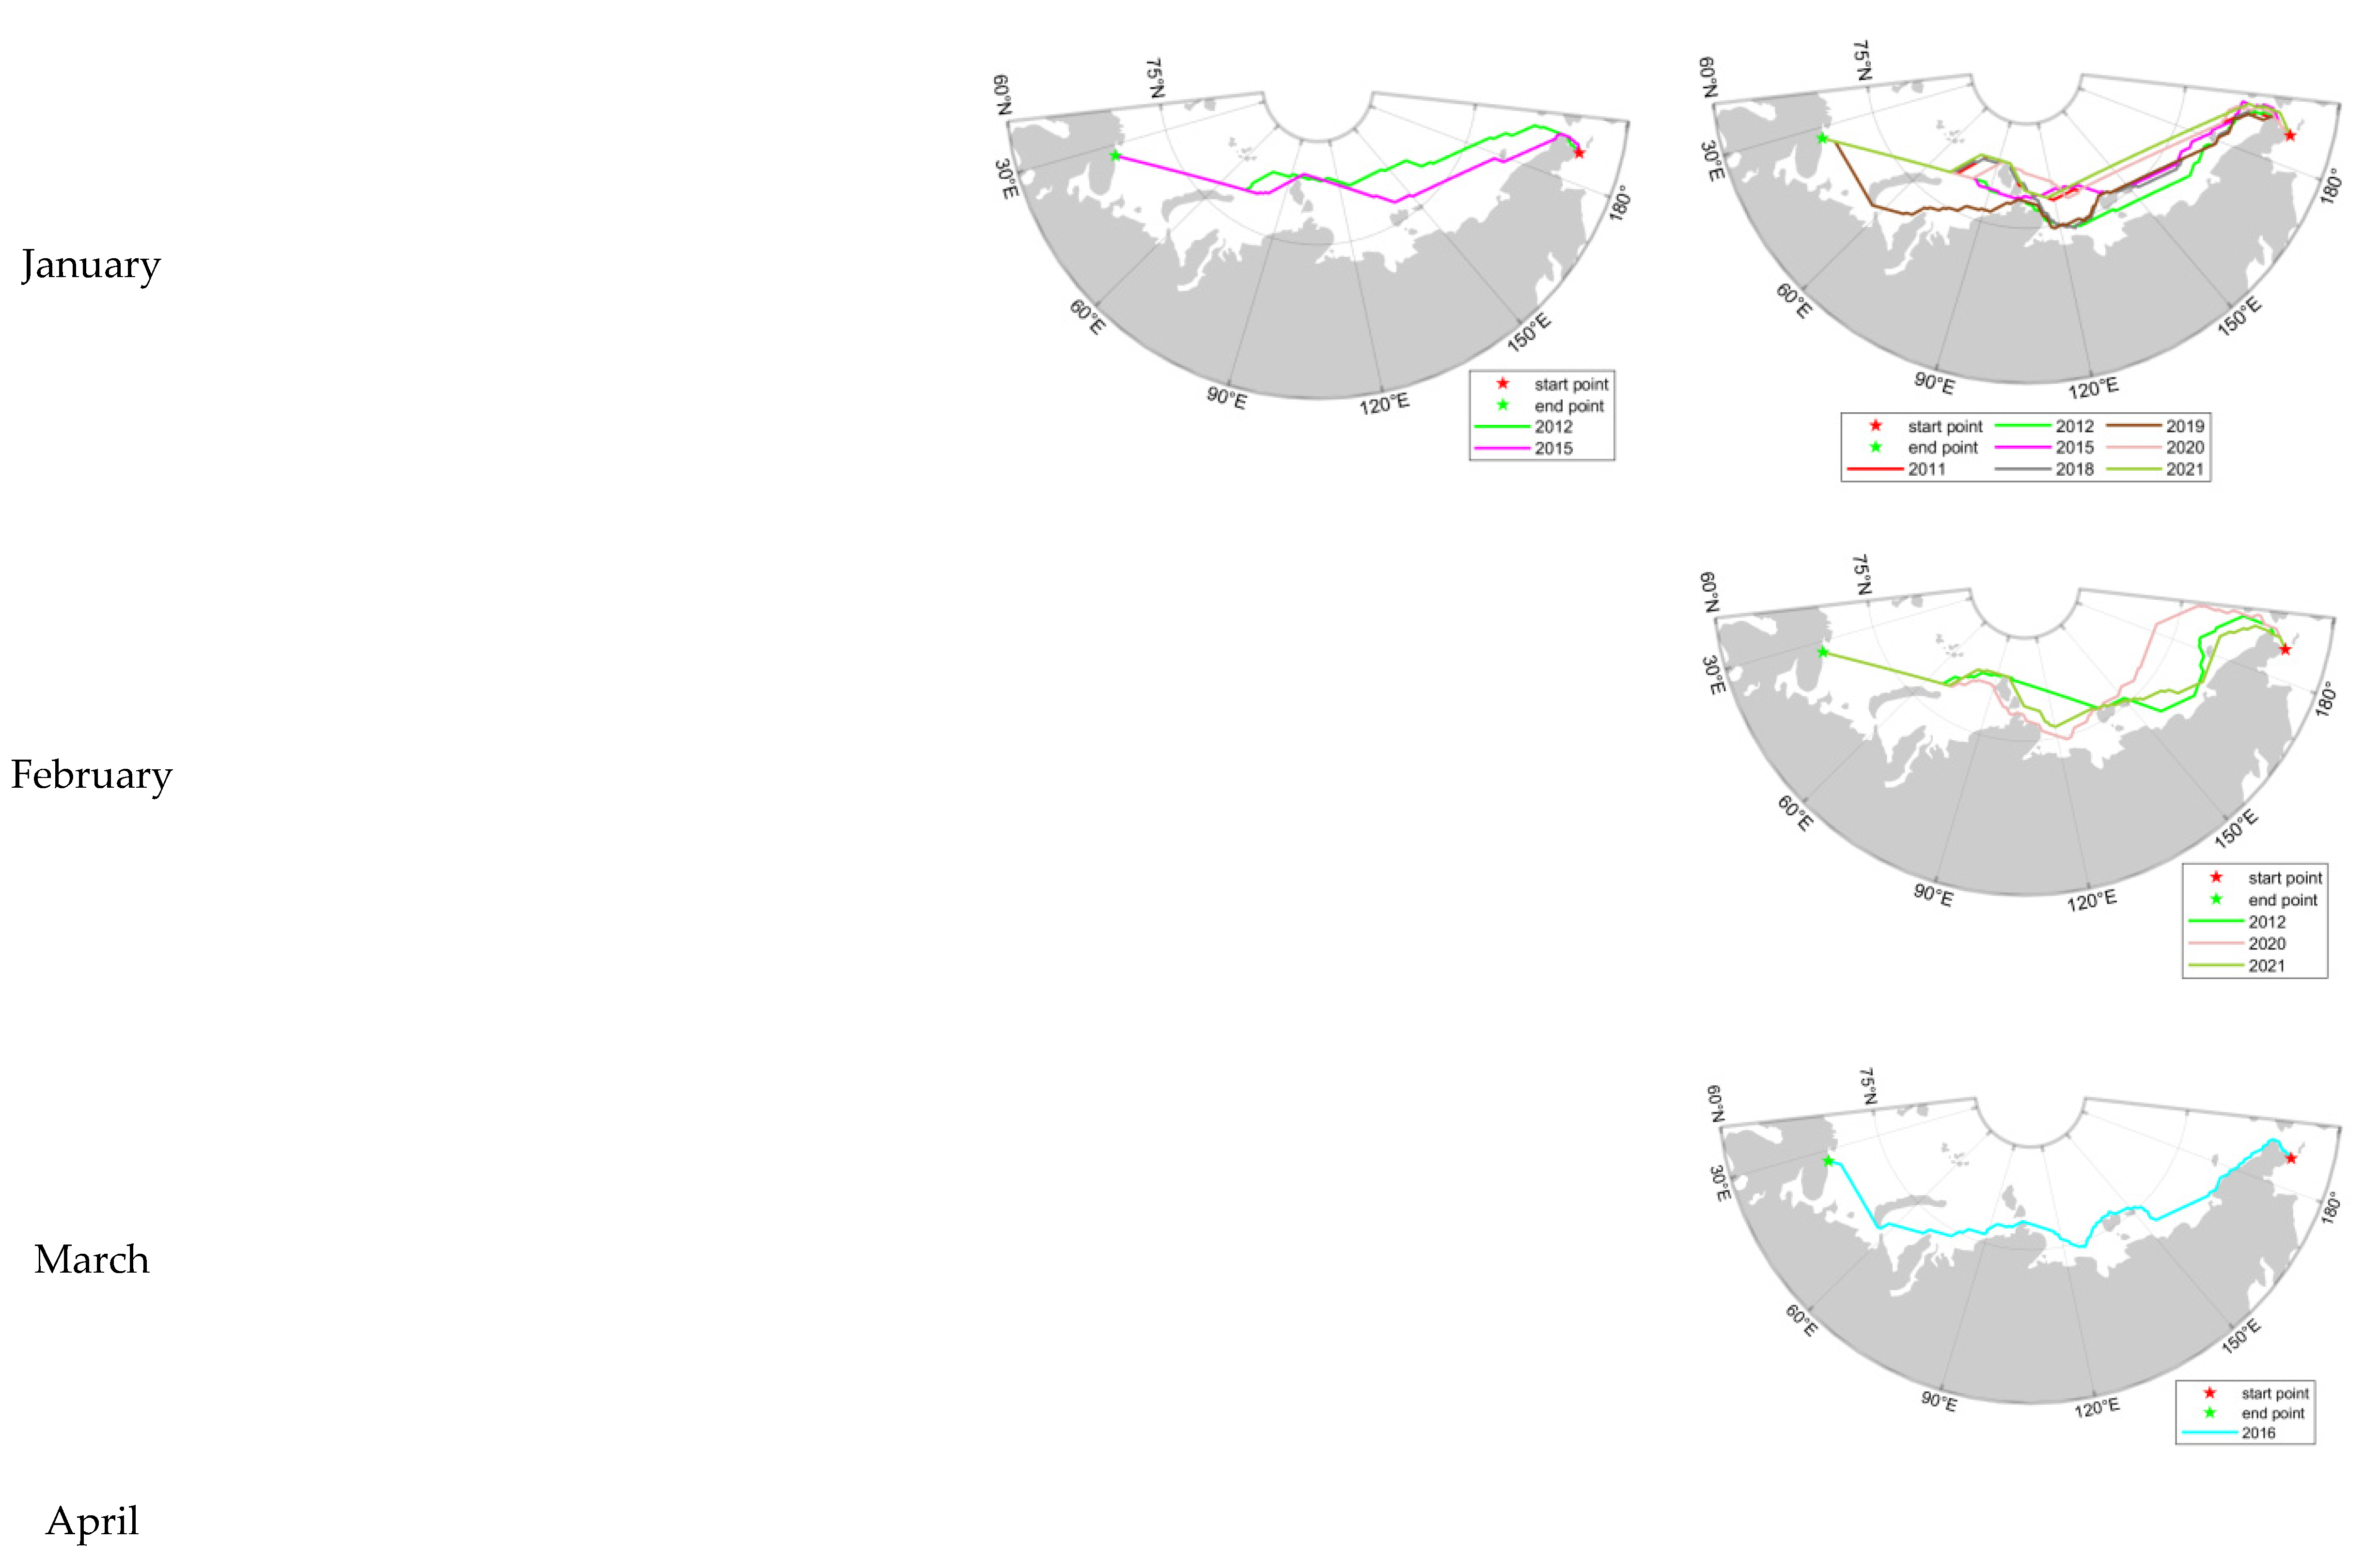
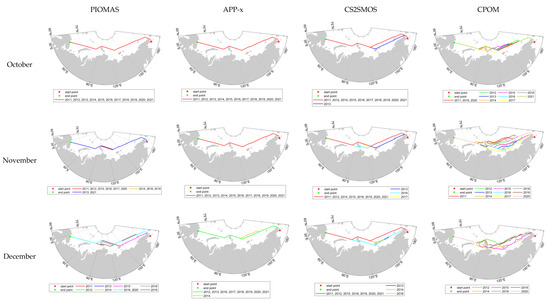
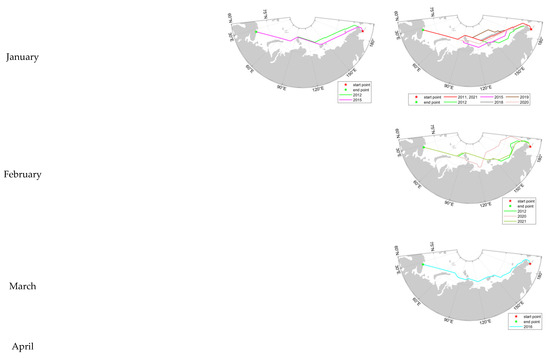
Figure A8.
Results of NSR route planning for IAS ice-class ships in the NSR based on multi-source SIT data in different months (Distance Priority) (Diagonal lines indicate non-navigable areas).
Figure A8.
Results of NSR route planning for IAS ice-class ships in the NSR based on multi-source SIT data in different months (Distance Priority) (Diagonal lines indicate non-navigable areas).
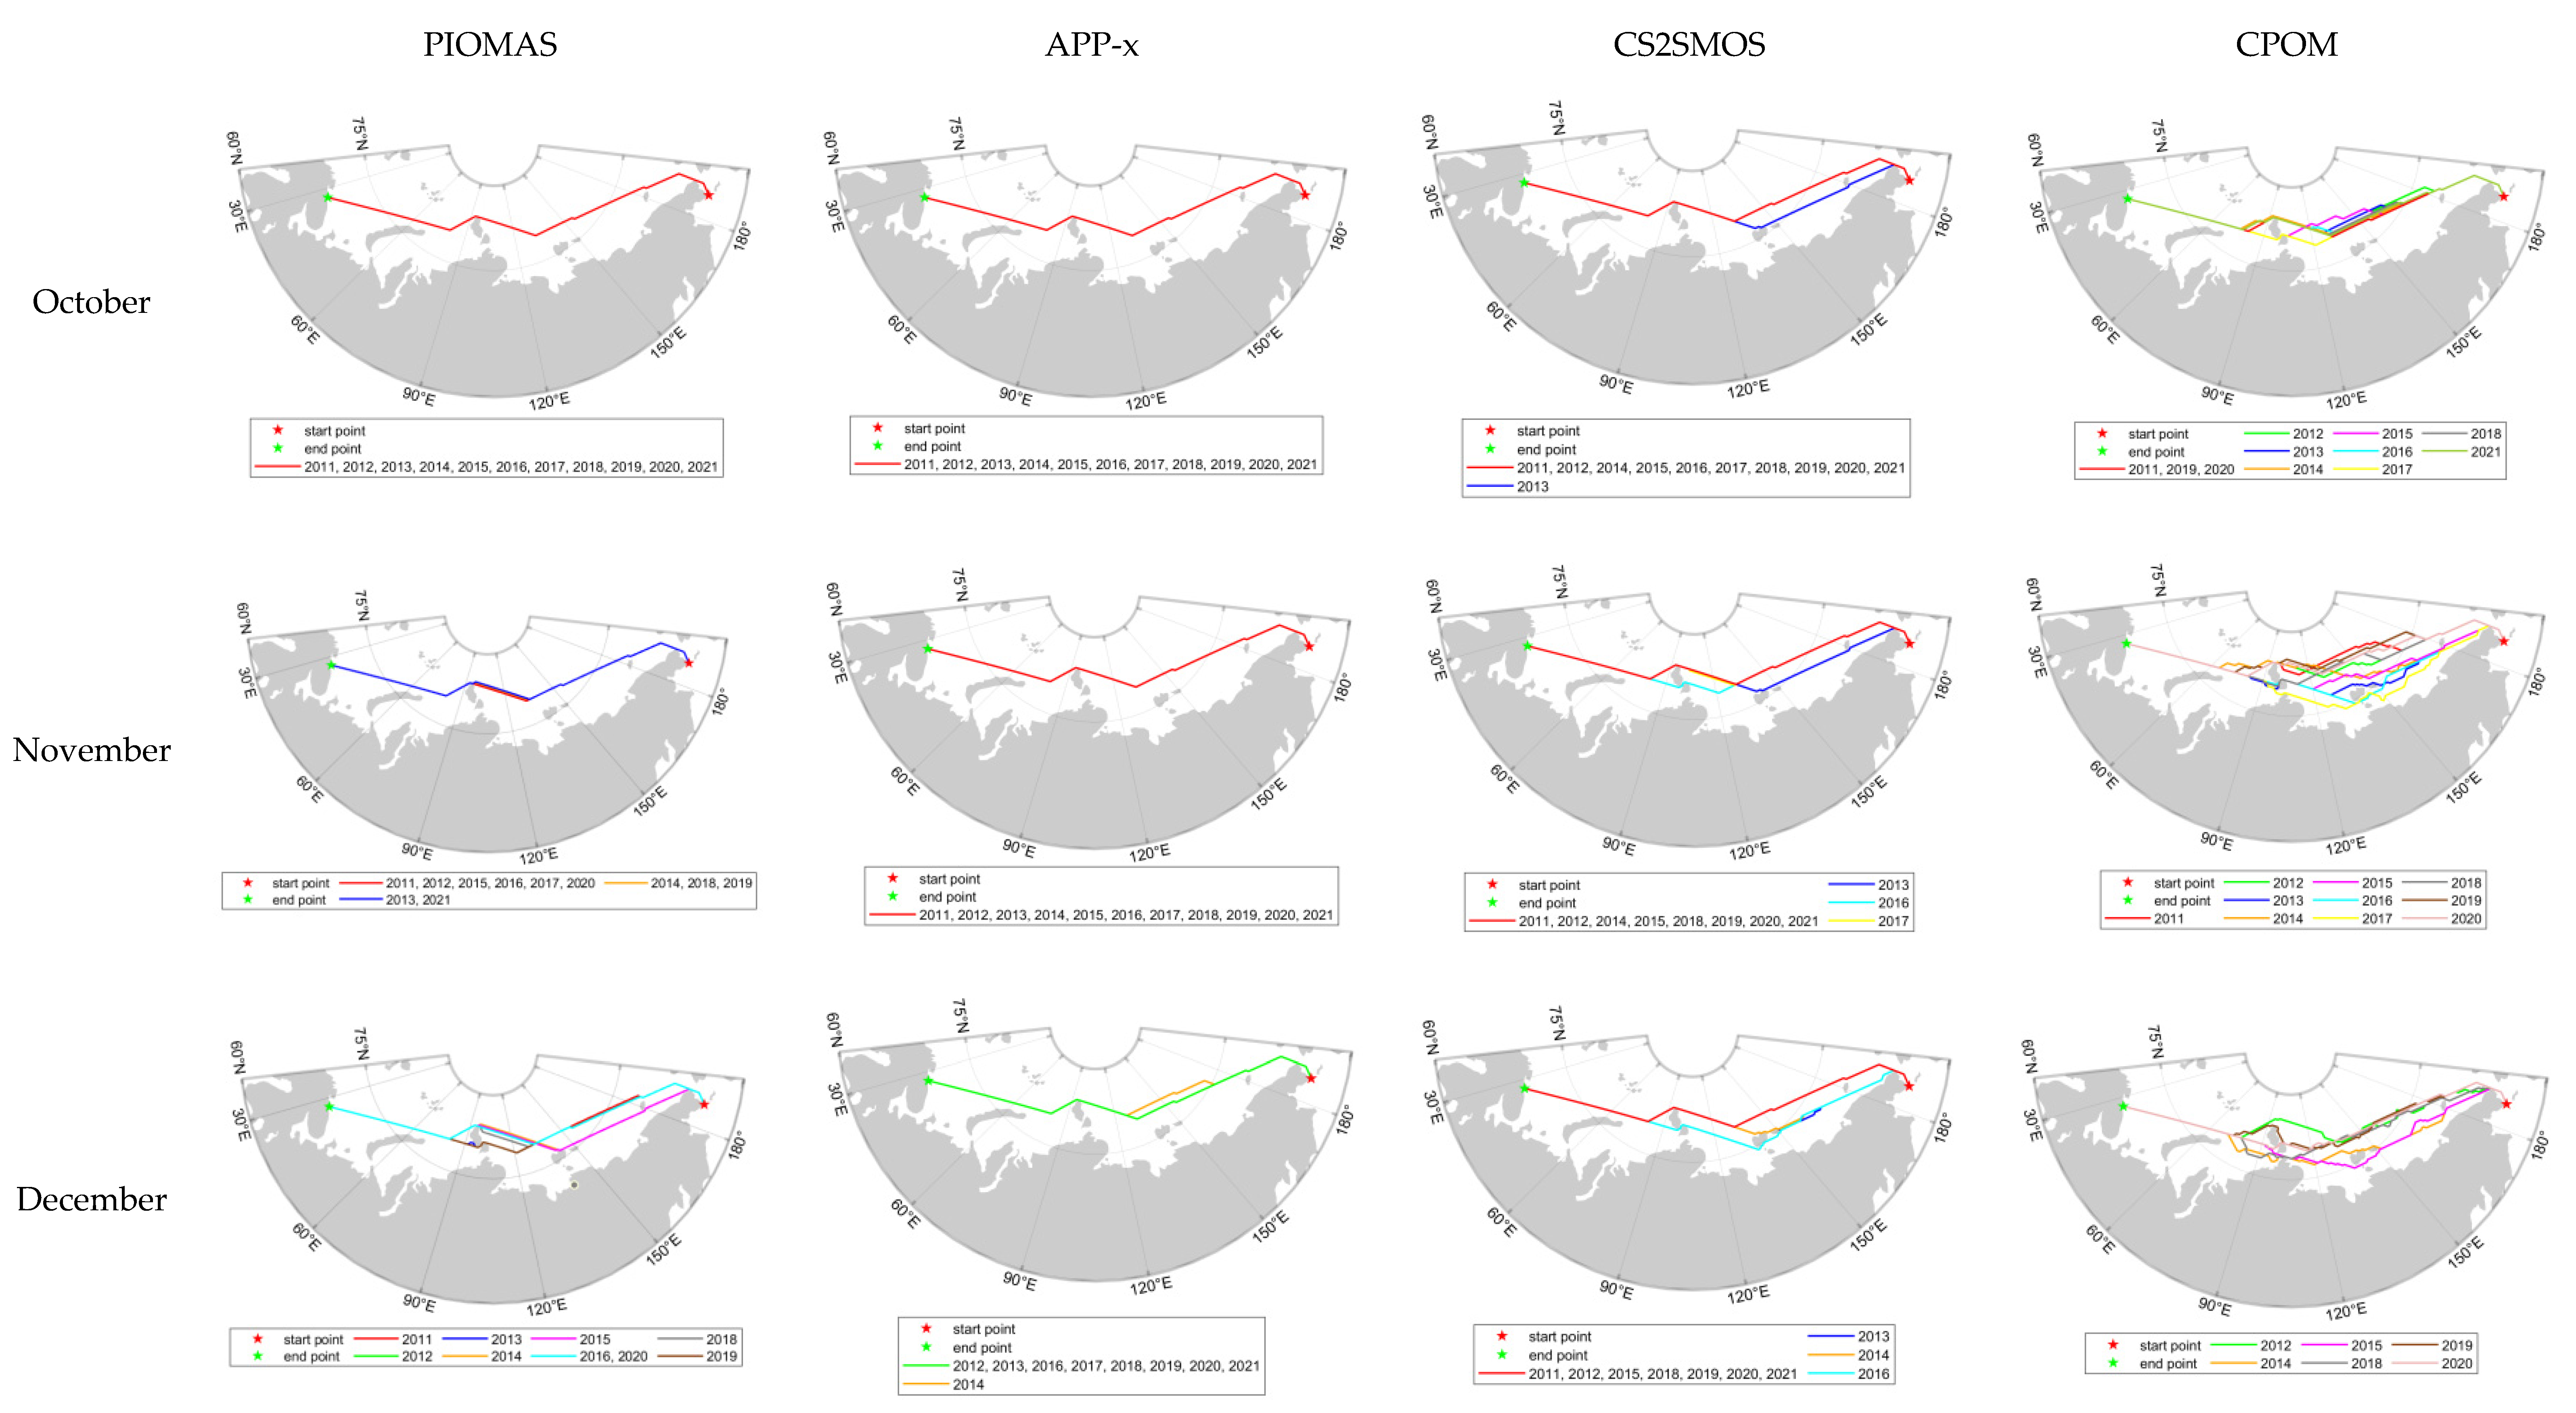

Table A1.
Results of NSR navigation duration for IAS ice-class ships based on PIOMAS SIT data in different months from 2011 to 2021 (Time priority; Diagonal lines indicate non-navigable areas).
Table A1.
Results of NSR navigation duration for IAS ice-class ships based on PIOMAS SIT data in different months from 2011 to 2021 (Time priority; Diagonal lines indicate non-navigable areas).
| Duration (d) | 2011 | 2012 | 2013 | 2014 | 2015 | 2016 | 2017 | 2018 | 2019 | 2020 | 2021 |
|---|---|---|---|---|---|---|---|---|---|---|---|
| October | 15.66 | 15.66 | 15.78 | 15.66 | 15.66 | 15.72 | 15.72 | 15.66 | 15.72 | 15.66 | 15.66 |
| November | 17.82 | 15.78 | 21.64 | 21.37 | 18.81 | 16.31 | 21.45 | 18.00 | 16.57 | 15.66 | 21.07 |
| December | 29.25 | 29.87 | 29.70 | 27.13 | 29.10 | 25.58 | 28.53 | 29.11 | 26.52 |
Table A2.
Results of NSR navigation duration for IAS ice-class ships based on APP-x SIT data in different months from 2011 to 2021 (Time priority; Diagonal lines indicate non-navigable areas).
Table A2.
Results of NSR navigation duration for IAS ice-class ships based on APP-x SIT data in different months from 2011 to 2021 (Time priority; Diagonal lines indicate non-navigable areas).
| Duration (d) | 2011 | 2012 | 2013 | 2014 | 2015 | 2016 | 2017 | 2018 | 2019 | 2020 | 2021 |
|---|---|---|---|---|---|---|---|---|---|---|---|
| October | 15.78 | 15.72 | 16.38 | 16.07 | 15.95 | 15.76 | 15.89 | 15.66 | 15.66 | 15.66 | 15.66 |
| November | 27.21 | 27.80 | 29.07 | 29.83 | 25.60 | 22.76 | 27.45 | 25.56 | 25.31 | 15.66 | 25.58 |
| December | 33.99 | 32.39 | 30.81 | 26.94 | 29.40 | 26.63 | 29.37 | 20.65 | 31.86 | ||
| January | 36.16 | 34.93 |
Table A3.
Results of NSR navigation duration for IAS ice-class ships based on CS2SMOS SIT data in different months from 2011 to 2021 (Time priority; Diagonal lines indicate non-navigable areas).
Table A3.
Results of NSR navigation duration for IAS ice-class ships based on CS2SMOS SIT data in different months from 2011 to 2021 (Time priority; Diagonal lines indicate non-navigable areas).
| Duration (d) | 2011 | 2012 | 2013 | 2014 | 2015 | 2016 | 2017 | 2018 | 2019 | 2020 | 2021 |
|---|---|---|---|---|---|---|---|---|---|---|---|
| October | 15.66 | 15.66 | 16.00 | 15.66 | 15.78 | 15.72 | 15.78 | 15.66 | 15.70 | 15.66 | 15.66 |
| November | 15.78 | 15.72 | 17.87 | 17.47 | 16.26 | 16.67 | 17.24 | 15.78 | 15.72 | 15.66 | 16.55 |
| December | 23.49 | 25.29 | 24.54 | 22.55 | 24.12 | 25.84 | 22.49 | 24.82 | 18.03 | 23.73 | |
| January | 31.83 | 32.24 | 33.05 | 32.96 | 27.48 | 31.88 | 30.48 | ||||
| February | 38.23 | 38.70 | 32.59 | ||||||||
| March | 31.70 |
Table A4.
Results of NSR navigation duration for IAS ice-class ships based on CPOM SIT data in different months from 2011 to 2021 (Time priority; Diagonal lines indicate non-navigable areas).
Table A4.
Results of NSR navigation duration for IAS ice-class ships based on CPOM SIT data in different months from 2011 to 2021 (Time priority; Diagonal lines indicate non-navigable areas).
| Duration (d) | 2011 | 2012 | 2013 | 2014 | 2015 | 2016 | 2017 | 2018 | 2019 | 2020 | 2021 |
|---|---|---|---|---|---|---|---|---|---|---|---|
| October | 16.0 | 16.0 | 17.14 | 16.25 | 16.39 | 15.87 | 16.41 | 15.84 | 15.81 | 15.66 | 16.68 |
| November | 21.50 | 17.64 | 23.94 | 22.23 | 22.27 | 20.53 | 23.64 | 20.74 | 23.54 | 17.29 | |
| December | 31.41 | 27.22 | 31.44 | 27.83 | 28.90 | 24.16 |
Table A5.
Results of NSR route distance for IAS ice-class ships based on PIOMAS SIT data in different months from 2011 to 2021 (Distance priority; Diagonal lines indicate non-navigable areas).
Table A5.
Results of NSR route distance for IAS ice-class ships based on PIOMAS SIT data in different months from 2011 to 2021 (Distance priority; Diagonal lines indicate non-navigable areas).
| Distance (km) | 2011 | 2012 | 2013 | 2014 | 2015 | 2016 | 2017 | 2018 | 2019 | 2020 | 2021 |
|---|---|---|---|---|---|---|---|---|---|---|---|
| October | 5449.14 | 5449.14 | 5449.14 | 5449.14 | 5449.14 | 5449.14 | 5449.14 | 5449.14 | 5449.14 | 5449.14 | 5449.14 |
| November | 5449.14 | 5449.14 | 5449.14 | 5449.14 | 5449.14 | 5449.14 | 5449.14 | 5449.14 | 5449.14 | 5449.14 | 5449.14 |
| December | 5449.14 | 5449.14 | 5499.14 | 5469.85 | 5469.85 | 5449.14 | 5493.07 | 5469.85 | 5449.14 |
Table A6.
Results of NSR route distance for IAS ice-class ships based on APP-x SIT data in different months from 2011 to 2021 (Distance priority; Diagonal lines indicate non-navigable areas).
Table A6.
Results of NSR route distance for IAS ice-class ships based on APP-x SIT data in different months from 2011 to 2021 (Distance priority; Diagonal lines indicate non-navigable areas).
| Distance (km) | 2011 | 2012 | 2013 | 2014 | 2015 | 2016 | 2017 | 2018 | 2019 | 2020 | 2021 |
|---|---|---|---|---|---|---|---|---|---|---|---|
| October | 5449.14 | 5449.14 | 5449.14 | 5449.14 | 5449.14 | 5449.14 | 5449.14 | 5449.14 | 5449.14 | 5449.14 | 5449.14 |
| November | 5449.14 | 5449.14 | 5449.14 | 5449.14 | 5449.14 | 5449.14 | 5449.14 | 5449.14 | 5449.14 | 5449.14 | 5449.14 |
| December | 5449.14 | 5449.14 | 5449.14 | 5449.14 | 5449.14 | 5449.14 | 5449.14 | 5449.14 | 5449.14 | ||
| January | 5449.14 | 5469.85 |
Table A7.
Results of NSR route distance for IAS ice-class ships based on CS2SMOS SIT data in different months from 2011 to 2021 (Distance priority; Diagonal lines indicate non-navigable areas).
Table A7.
Results of NSR route distance for IAS ice-class ships based on CS2SMOS SIT data in different months from 2011 to 2021 (Distance priority; Diagonal lines indicate non-navigable areas).
| Distance (km) | 2011 | 2012 | 2013 | 2014 | 2015 | 2016 | 2017 | 2018 | 2019 | 2020 | 2021 |
|---|---|---|---|---|---|---|---|---|---|---|---|
| October | 5449.14 | 5449.14 | 5469.85 | 5449.14 | 5449.14 | 5449.14 | 5449.14 | 5449.14 | 5449.14 | 5449.14 | 5449.14 |
| November | 5449.14 | 5449.14 | 5469.85 | 5449.14 | 5449.14 | 5469.85 | 5463.78 | 5449.14 | 5449.14 | 5449.14 | 5449.14 |
| December | 5449.14 | 5449.14 | 5531.98 | 5511.27 | 5449.14 | 5635.53 | 5449.14 | 5449.14 | 5449.14 | 5449.14 | |
| January | 5449.14 | 5656.24 | 5673.40 | 5449.14 | 5449.14 | 5469.85 | 5449.14 | ||||
| February | 6065.86 | 6175.48 | 5759.80 | ||||||||
| March | 5808.76 |
Table A8.
Results of NSR route distance for IAS ice-class ships based on CPOM SIT data in different months from 2011 to 2021 (Distance priority; Diagonal lines indicate non-navigable areas).
Table A8.
Results of NSR route distance for IAS ice-class ships based on CPOM SIT data in different months from 2011 to 2021 (Distance priority; Diagonal lines indicate non-navigable areas).
| Distance (km) | 2011 | 2012 | 2013 | 2014 | 2015 | 2016 | 2017 | 2018 | 2019 | 2020 | 2021 |
|---|---|---|---|---|---|---|---|---|---|---|---|
| October | 5449.14 | 5449.14 | 5449.14 | 5449.14 | 5469.85 | 5449.14 | 5469.85 | 5449.14 | 5449.14 | 5449.14 | 5449.14 |
| November | 5507.72 | 5449.14 | 5679.47 | 5511.27 | 552.91 | 5635.53 | 5876.96 | 5505.20 | 5449.14 | 5449.14 | |
| December | 5667.34 | 5784.49 | 5714.82 | 5693.07 | 5713.78 | 5505.20 |
References
- Ivanov, V. Arctic Sea Ice Loss Enhances the Oceanic Contribution to Climate Change. Atmosphere 2023, 14, 409. [Google Scholar] [CrossRef]
- Myslenkov, S.A. Analysis of the wind waves height and the duration of ice-free period along the Northern Sea Route from 1979 to 2021. Lomonosov Geogr. J. 2024, 2, 134–145. [Google Scholar] [CrossRef]
- Theocharis, D.; Rodrigues, V.S.; Pettit, S.; Haider, J. Feasibility of the Northern Sea Route: The role of distance, fuel prices, ice breaking fees and ship size for the product tanker market. J. Transp. Res. Part E Logist. Transp. Rev. 2019, 129, 111–135. [Google Scholar] [CrossRef]
- Wang, Y.; Liu, K.; Zhang, R.; Qian, L.; Shan, Y. Feasibility of the Northeast Passage: The role of vessel speed, route planning, and icebreaking assistance determined by sea-ice conditions for the container shipping market during 2020–2030. J. Transp. Res. Part E Logist. Transp. Rev. 2021, 49, 102235. [Google Scholar] [CrossRef]
- Wang, Y.; Zhang, R.; Liu, K.; Fu, D.; Zhu, Y. Framework for Economic Potential Analysis of Marine Transportation: A Case Study for Route Choice Between the Suez Canal Route and the Northern Sea Route. J. Transp. Res. Rec. J. Transp. Res. Board. 2023, 2677, 1–16. [Google Scholar] [CrossRef]
- CHNL NSR Shipping Activities in 2022. Available online: https://chnl.no/research/reports-reports/nsr-shipping-activities-in-2022/ (accessed on 2 June 2024).
- Sallila, H.; Farrell, S.L.; McCurry, J.; Rinne, E. Assessment of contemporary satellite sea ice thickness products for Arctic sea ice. J. Cryosphere 2019, 13, 1187–1213. [Google Scholar] [CrossRef]
- Kaleschke, L.; Tian-Kunze, X.; Maas, N.; Ricker, R.; Hendricks, S.; Drusch, M. Improved retrieval of sea ice thickness from SMOS and CryoSat-2. In Proceedings of the 2015 IEEE International Geoscience and Remote Sensing Symposium (IGARSS), Milan, Italy, 26–31 July 2015. [Google Scholar]
- Kwok, R.; Cunningham, G.F. Variability of Arctic sea ice thickness and volume from CryoSat-2. J. Philos. Trans. R. Soc. A Math. Phys. Eng. Sci. 2015, 373, 20140157. [Google Scholar] [CrossRef]
- Li, M.; Ke, C.; Xie, H.; Miao, X.; Shen, X.; Xia, W. Arctic sea ice thickness retrievals from CryoSat-2: Seasonal and interannual comparisons of three different products. J. Int. J. Remote Sens. 2020, 41, 152–170. [Google Scholar] [CrossRef]
- Laxon, S.W.; Giles, K.A.; Ridout, A.L.; Wingham, D.J.; Willatt, R.; Cullen, R.; Kwok, R.; Schweiger, A.; Zhang, J.; Haas, C.; et al. CryoSat-2 estimates of Arctic sea ice thickness and volume. J. Geophys. Res. Lett. 2013, 40, 732–737. [Google Scholar] [CrossRef]
- Alexandrov, V.; Sandven, S.; Johannessen, O.M.; Wåhlin, J. The relation between sea ice thickness and freeboard in the Arctic. J. Cryosphere 2010, 4, 373–380. [Google Scholar] [CrossRef]
- Ricker, R.; Ricker, R.; Hendricks, S.; Kaleschke, L.; Tian-Kunze, X.; King, J.; Haas, C.; Haas, C. A weekly Arctic sea-ice thickness data record from merged CryoSat-2 and SMOS satellite data. J. Cryosphere 2017, 11, 1607–1623. [Google Scholar] [CrossRef]
- Kaleschke, L.; Tian-Kunze, X.; Maaß, N.; Beitsch, A.; Wernecke, A.; Miernecki, M.; Müller, G.; Fock, B.H.; Gierisch, A.M.U.; Schlünzen, K.H.; et al. SMOS sea ice product: Operational application and validation in the Barents Sea marginal ice zone. J. Remote Sens. Environ. 2016, 180, 264–273. [Google Scholar] [CrossRef]
- Wang, X.; Key, J.; Kwok, R.; Zhang, J. Comparison of Arctic Sea Ice Thickness from Satellites, Aircraft, and PIOMAS Data. J. Remote Sens. 2016, 8, 713. [Google Scholar] [CrossRef]
- Gregory, W.; Lawrence, I.R.; Tsamados, M. A Bayesian approach towards daily pan-Arctic sea ice freeboard estimates from combined CryoSat-2 and Sentinel-3 satellite observations. J. Cryosphere 2021, 15, 2857. [Google Scholar] [CrossRef]
- Labe, Z.; Magnusdottir, G.; Stern, H. Variability of Arctic Sea Ice Thickness Using PIOMAS and the CESM Large Ensemble. J. Clim. 2018, 31, 3233–3247. [Google Scholar] [CrossRef]
- Liu, Q.; Wang, Y.; Zhang, R.; Yan, H.; Xu, J.; Guo, Y. Arctic weather routing: A review of ship performance models and ice routing algorithms. J. Front. Mar. Sci. 2023, 10. [Google Scholar] [CrossRef]
- Canada, T. Arctic Ice Regime Shipping System Pictorial Guide. Available online: https://tc.canada.ca/sites/default/files/migrated/tp14044e_airss_guide.pdf (accessed on 15 October 2023).
- IMO. Guidance on Methodologies for Assessing Operational Capabilities and Limitations in Ice-Appendix Methodology for Assessing Operational Capabilities and Limitations in Ice: Polar Operational Limit Assessment Risk Indexing System. Available online: https://edocs.imo.org/FinalDocuments/English/MSC.1-CIRC. (accessed on 10 October 2023).
- Min, C.; Zhou, X.; Luo, H.; Yang, Y.; Wang, Y.; Zhang, J.; Yang, Q. Toward Quantifying the Increasing Accessibility of the Arctic Northeast Passage in the Past Four Decades. J. Adv. Atmos. 2023, 40, 2378–2390. [Google Scholar] [CrossRef]
- Cao, Y.; Liang, S.; Sun, L.; Liu, J.; Cheng, X.; Wang, D.; Chen, Y.; Yu, M.; Feng, K. Trans-Arctic shipping routes expanding faster than the model projections. J. Glob. Environ. Change Part A Hum. Policy Dimens. 2022, 73, 102488. [Google Scholar] [CrossRef]
- Lei, R.; Xie, H.; Wang, J.; Lepparanta, M.; Jonsdottir, I.; Zhang, Z. Changes in sea ice conditions along the Arctic Northeast Passage from 1979 to 2012. J. Cold Reg. Sci. Technol. 2015, 119, 132–144. [Google Scholar] [CrossRef]
- Tretyakov, V.Y.; Frolov, S.V.; Sarafanov, M.I. The variability of ice conditions along the Northern sea route for the period 1997–2018. Arct. Antarct. Res. 2019, 65, 328–340. [Google Scholar] [CrossRef]
- Choi, M.; Chung, H.; Yamaguchi, H.; Nagakawa, K. Arctic sea route path planning based on an uncertain ice prediction model. J. Cold Reg. Sci. Technol. 2015, 109, 61–69. [Google Scholar] [CrossRef]
- Zhang, J.; Rothrock, D.A. Modeling global sea ice with a thickness and enthalpy distribution model in generalized curvilinear coordinates. J. Mon. Weather. Rev. 2003, 131, 845–861. [Google Scholar] [CrossRef]
- Thorndike, A.S.; Rothrock, D.A.; Maykut, G.A.; Colony, R. The Thickness Distribution of Sea Ice. J. Geophys. Res. Part C Ocean. 1975, 80, 4501–4513. [Google Scholar] [CrossRef]
- Zhang, J.; Rothrock, D.A. A Thickness and Enthalpy Distribution Sea-Ice Model. J. Phys. Oceanogr. 2001, 31, 2986. [Google Scholar] [CrossRef]
- Flato, G.; Hibler, W.D.J.J.o.G.R. Ridging and strength in modeling the thickness distribution of Arctic sea ice. J. Geophys. Res. Ocean. 1995, 100, 18611–18626. [Google Scholar] [CrossRef]
- Schweiger, A.; Lindsay, R.; Zhang, J.; Steele, M.; Stern, H.; Kwok, R. Uncertainty in modeled Arctic sea ice volume. J. Geophys. Res. 2011, 116, C00D06. [Google Scholar] [CrossRef]
- Smith, A.; Jahn, A.; Wang, M. Seasonal transition dates can reveal biases in Arctic sea ice simulations. Cryosphere 2020, 14, 2977. [Google Scholar] [CrossRef]
- Mu, L.; Losch, M.; Yang, Q.; Ricker, R.; Losa, S.; Nerger, L. Arctic-Wide Sea Ice Thickness Estimates From Combining Satellite Remote Sensing Data and a Dynamic Ice-Ocean Model with Data Assimilation During the CryoSat-2 Period. Geophys. Res. Ocean 2018, 123, 7763–7780. [Google Scholar] [CrossRef]
- Gurlev, I.V.; Makosko, A.A.; Malygin, I.G. Analysis of the state and development of the transport system of the Northern Sea Route. J. Arct. Ecol. Econ. 2022, 12, 258–270. [Google Scholar] [CrossRef]
- McCallum, J. Safe Speed in Ice: An Analysis of Transit Speed and Ice Decision Numerals. Report Prepared for Transport Canada. 1996. Available online: www.geoinfosolutions.com/projects/Safeice.pdf (accessed on 25 October 2023).
- Hart, P.E.; Nilsson, N.J.; Raphael, B. A Formal Basis for the Heuristic Determination of Minimum Cost Paths. IEEE Trans. Syst. Sci. Cybern. 1968, 4, 100–107. [Google Scholar] [CrossRef]
- WMO. Sea-Ice Nomenclature. Available online: https://library.wmo.int/idurl/4/41953 (accessed on 10 October 2023).
- Springer, J.A., III; Caughlan, S.A.; Kristensen, D.H.; Cronin, D.D.; Menon, B.C. SS: Arctic: Application of the Newly Adopted IACS Polar Class Rules to Offshore Support Vessels of Small Tonnage. In Proceedings of the Offshore Technology Conference, Houston, TX, USA, 4–7 May 2009. [Google Scholar]
- Canada, T. Arctic Ice Regime Shipping System (AIRSS): User Assistance Package for the Implementation of Canada’s Arctic Ice Regime Shipping System (AIRSS). Available online: https://tc.canada.ca/sites/default/files/migrated/tp12819e.pdf (accessed on 25 October 2023).
- Daley, C. Ice Class Rules-Description and Comparison. Available online: https://www.engr.mun.ca/~cdaley/8074/Ice%20Class%20Rules_CD.pdf (accessed on 25 October 2023).
- Nam, J.; Park, I.; Lee, H.; Kwon, M.; Choi, K.; Seo, Y. Simulation of optimal arctic routes using a numerical sea ice model based on an ice-coupled ocean circulation method. J. Nav. Arch. Ocean Eng. 2014, 5, 210–226. [Google Scholar] [CrossRef]
- Zhang, Z.; Schwartz, S.L.; Wagner, L.; Miller, W.C. A Greedy Algorithm for Aligning DNA Sequences. J. Comput. Biol. 2000, 7, 203–214. [Google Scholar] [CrossRef] [PubMed]
- Shannon, C.E. A mathematical theory of communication. J. Bell Syst. Tech. J. 1948, 27, 379–423. [Google Scholar] [CrossRef]

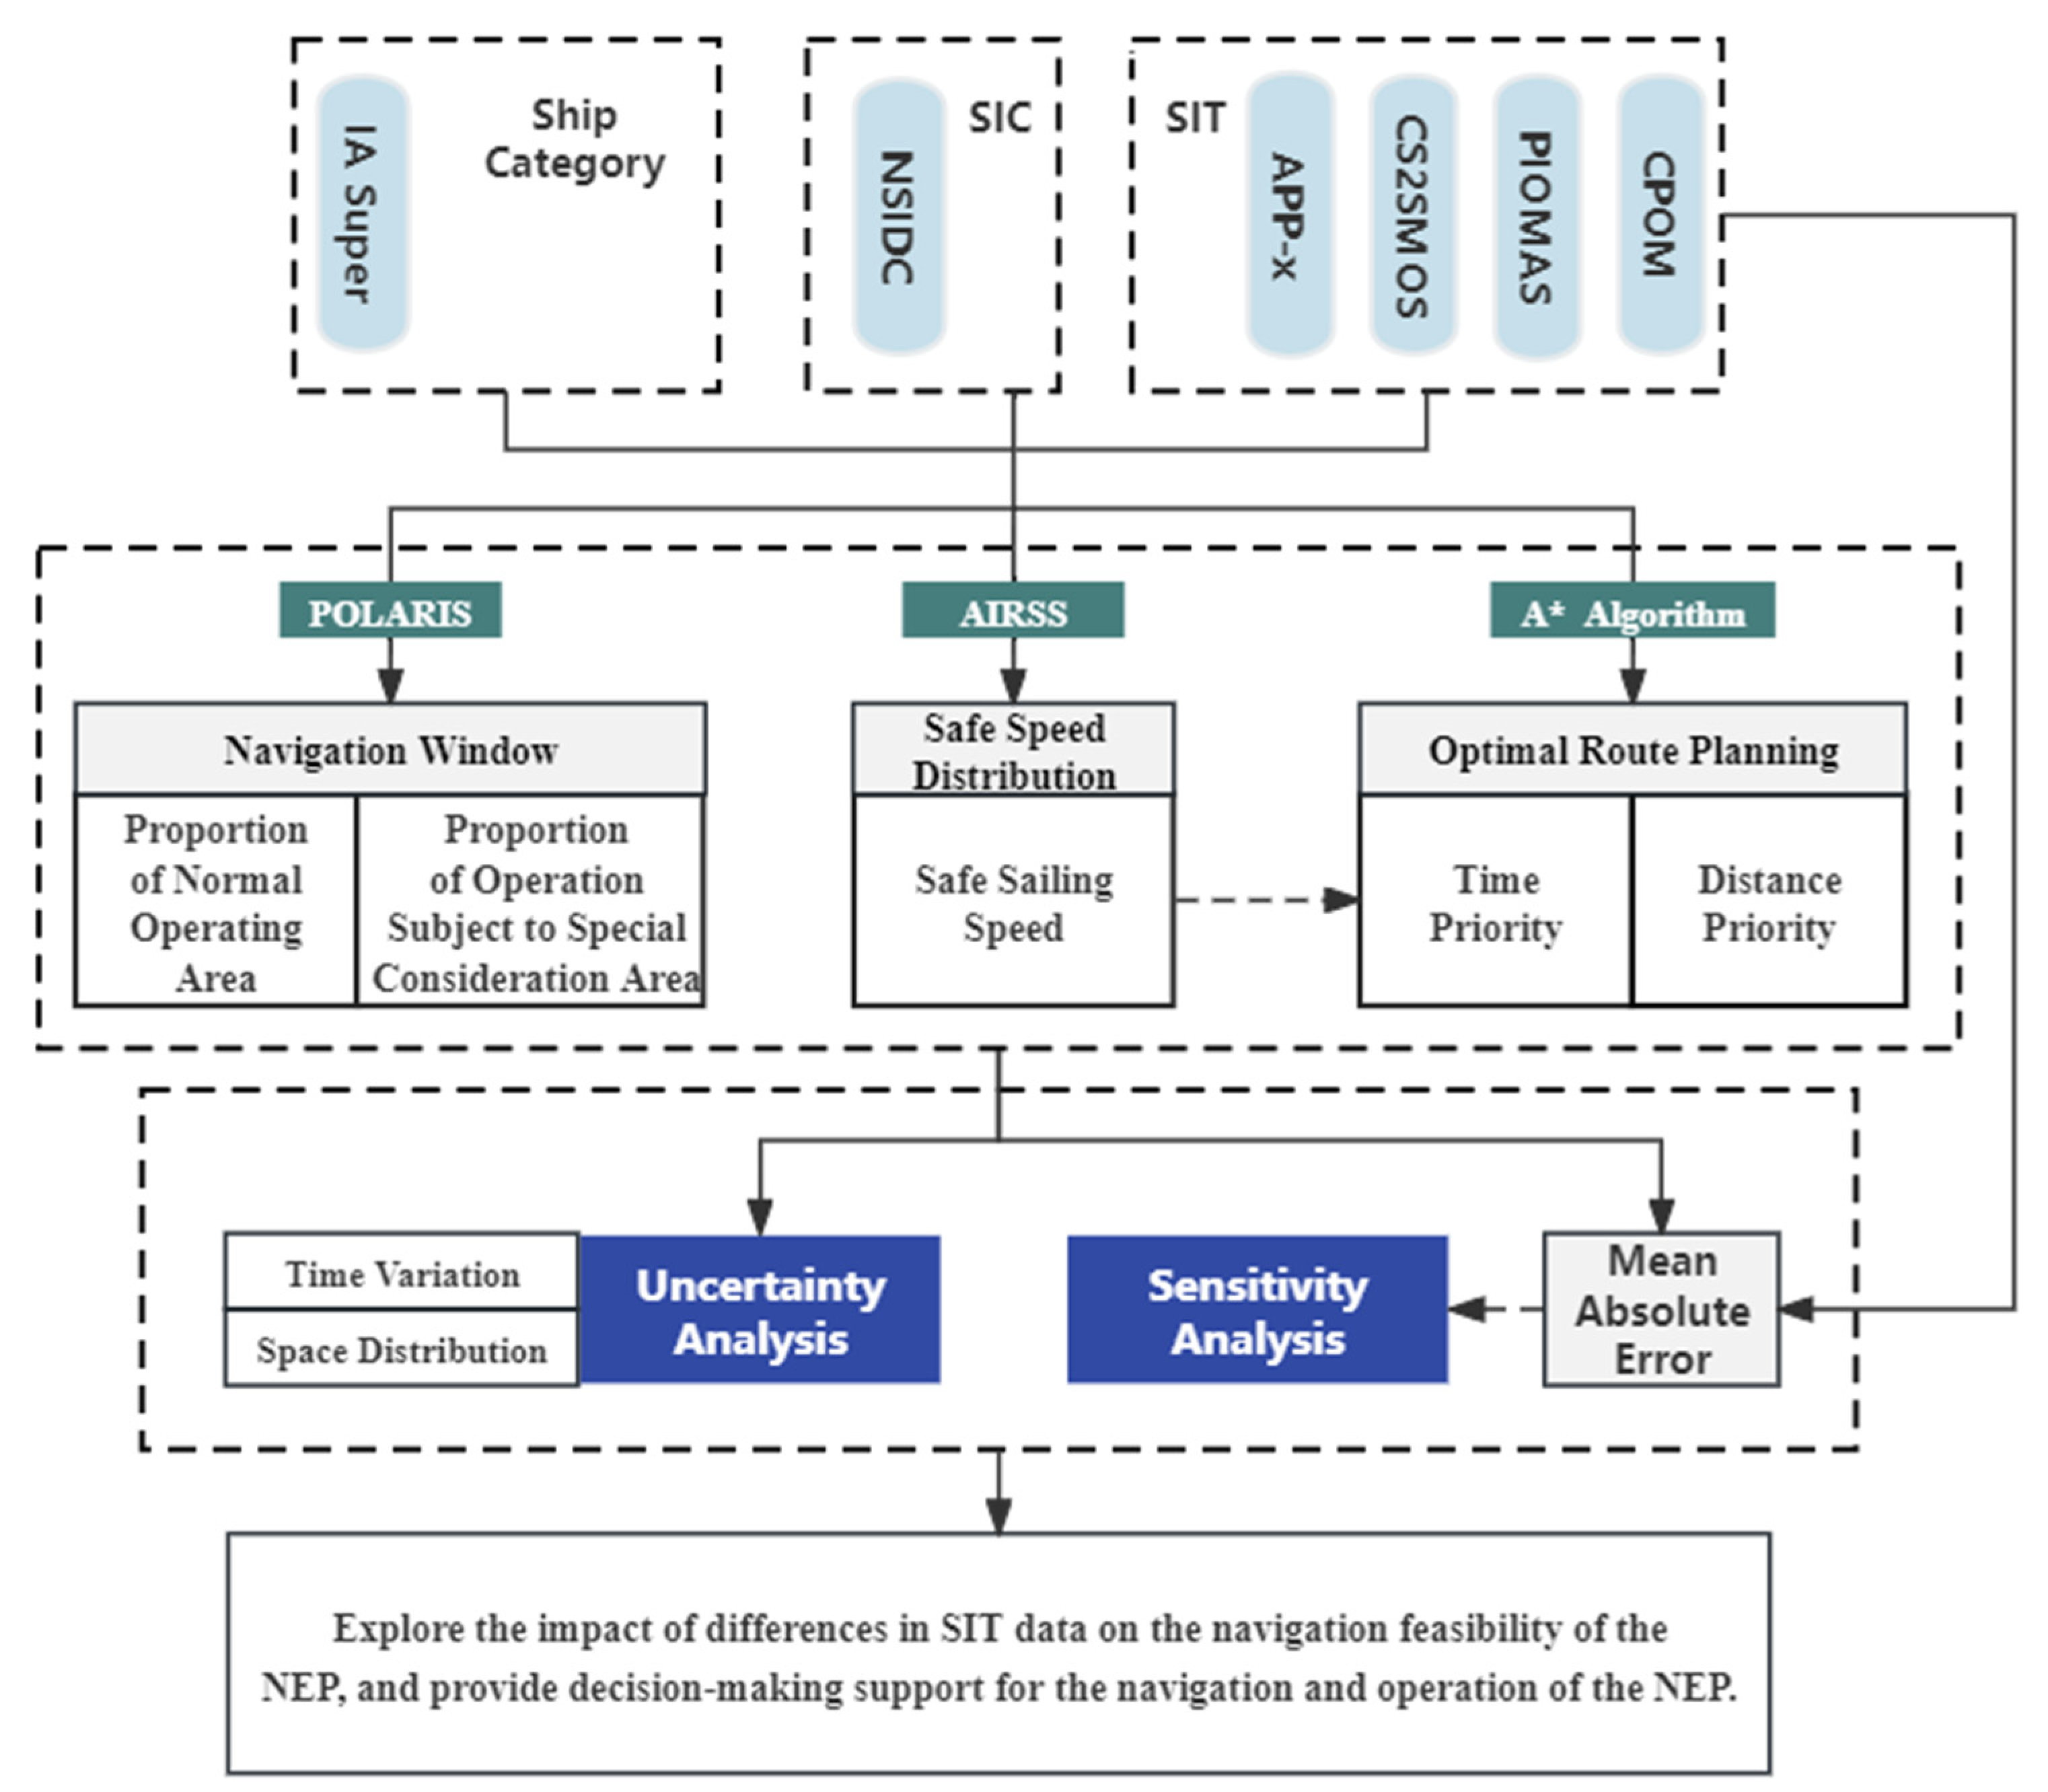
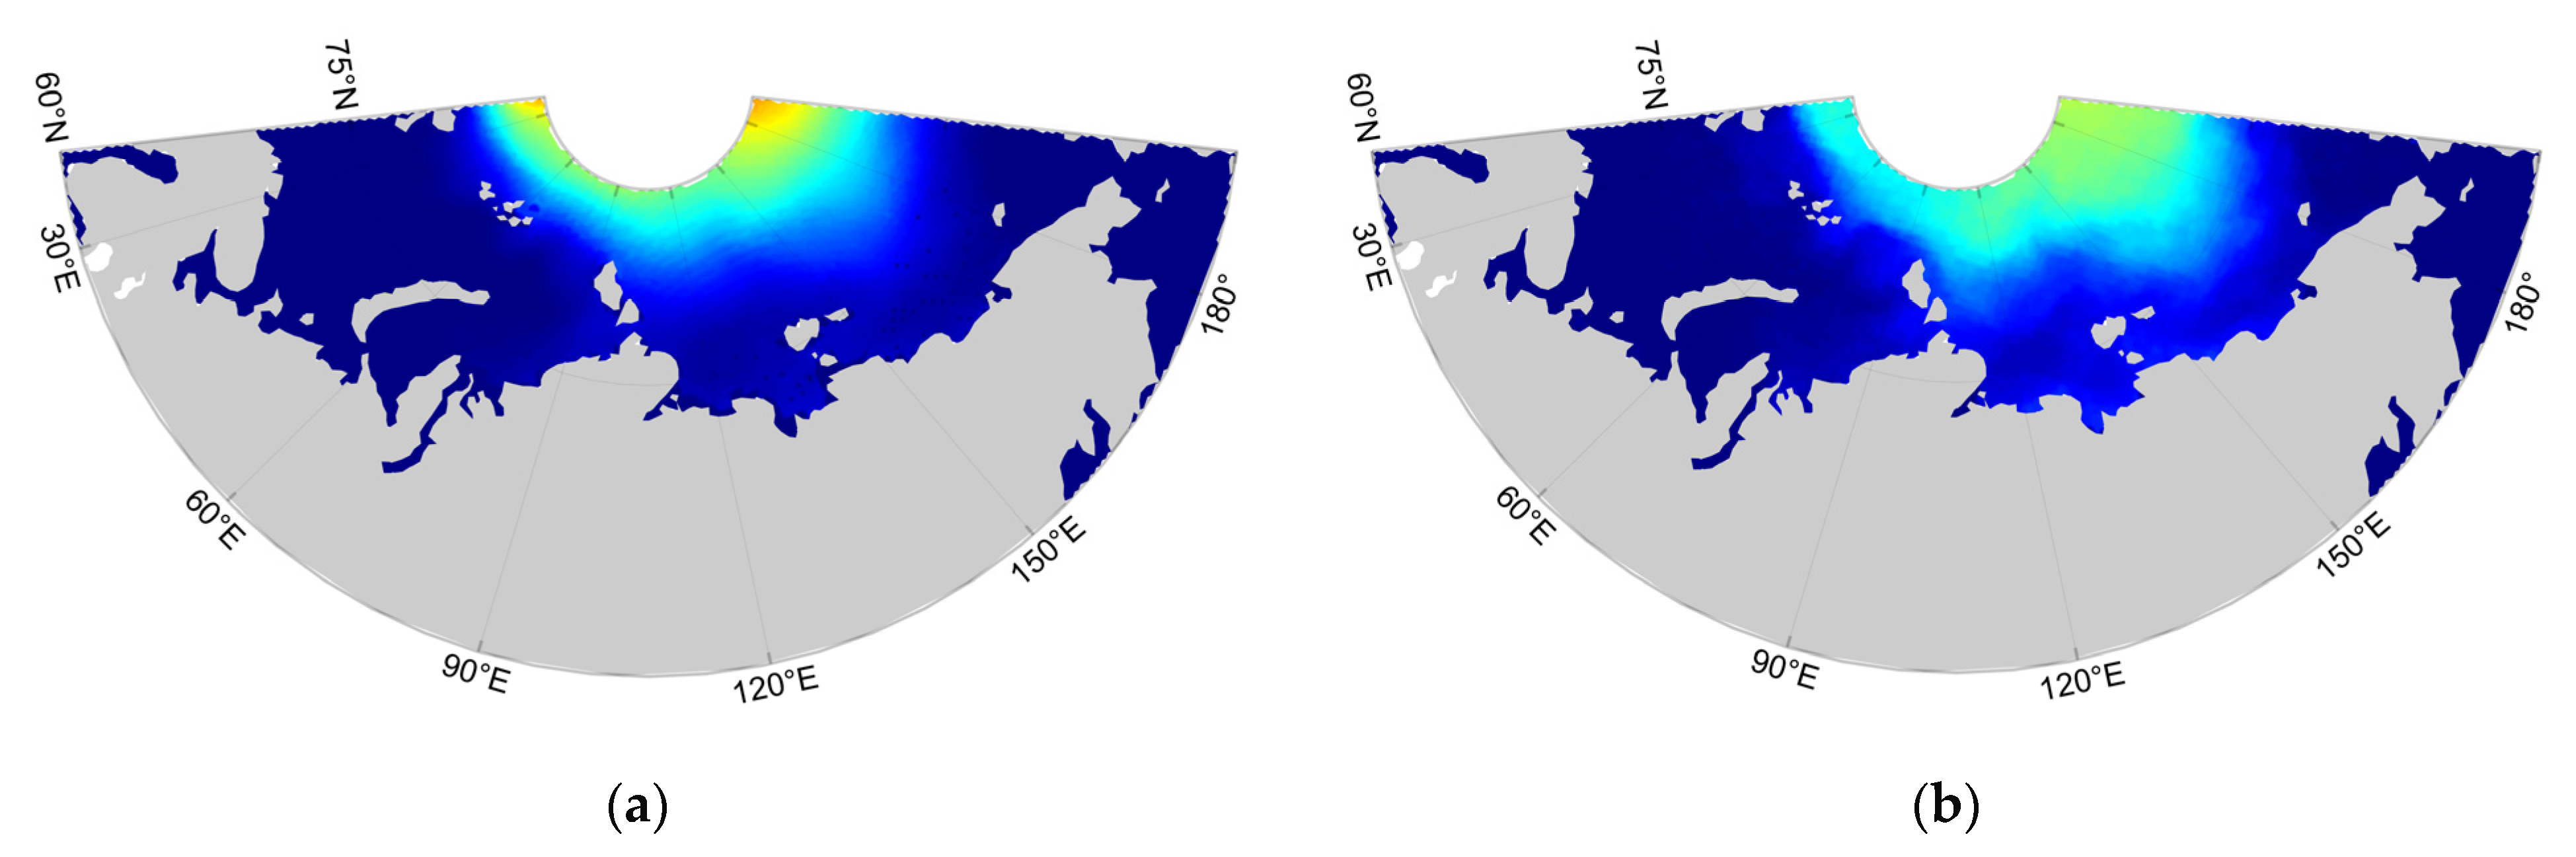
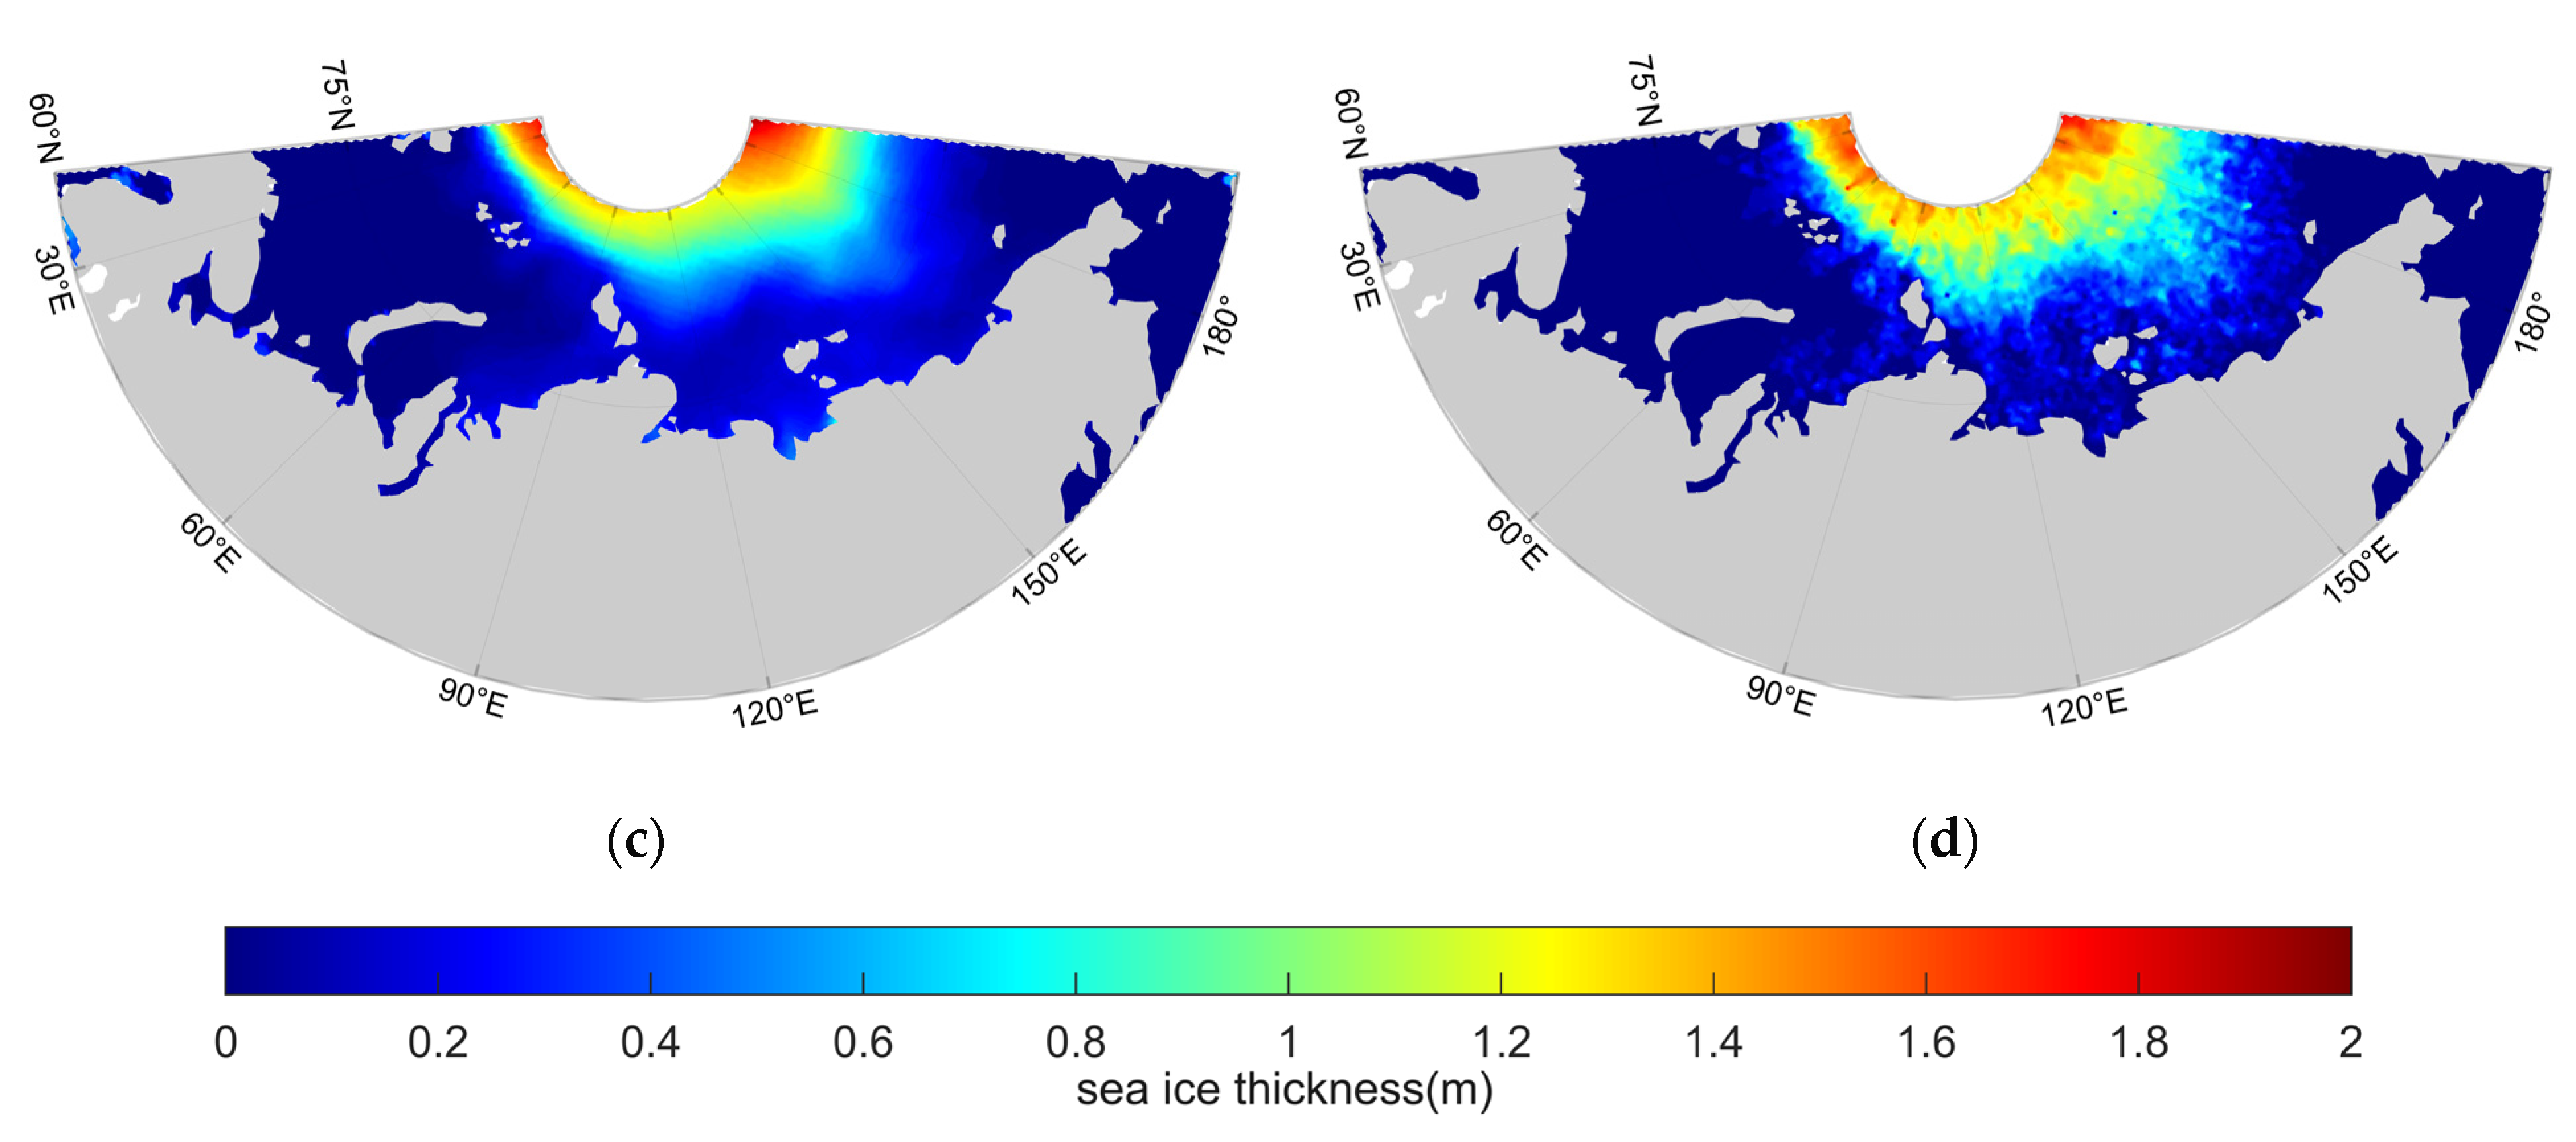
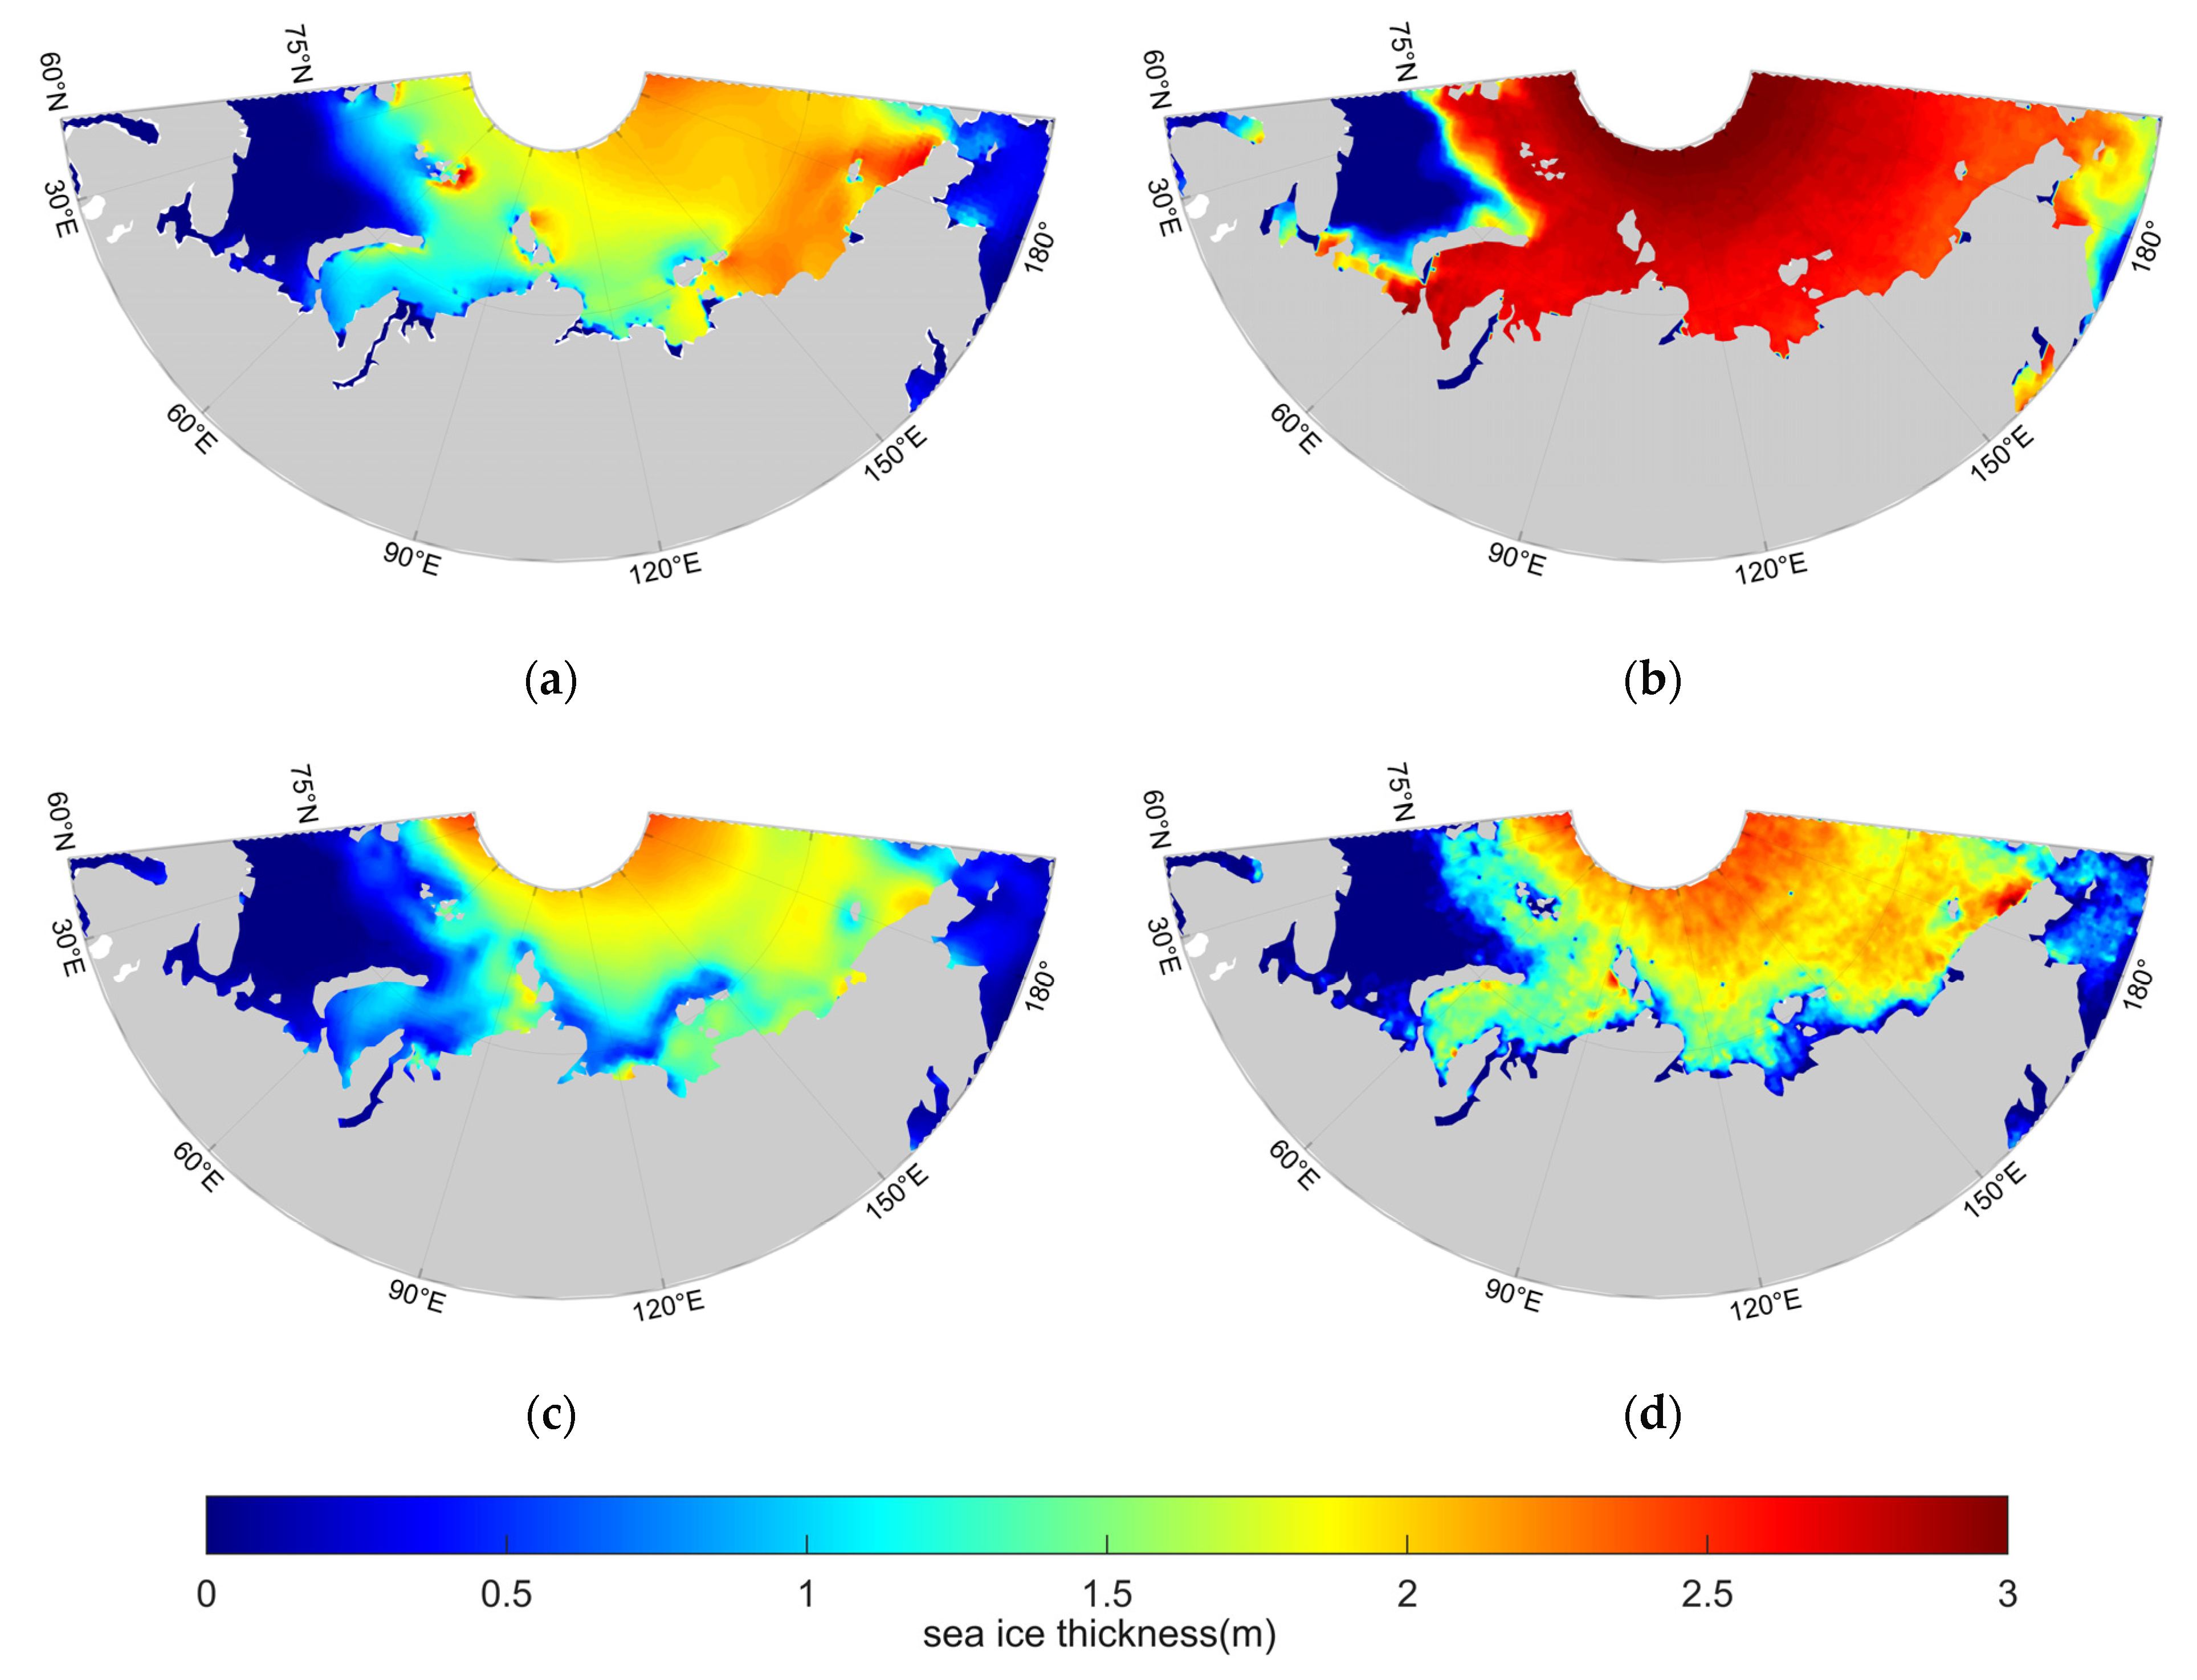

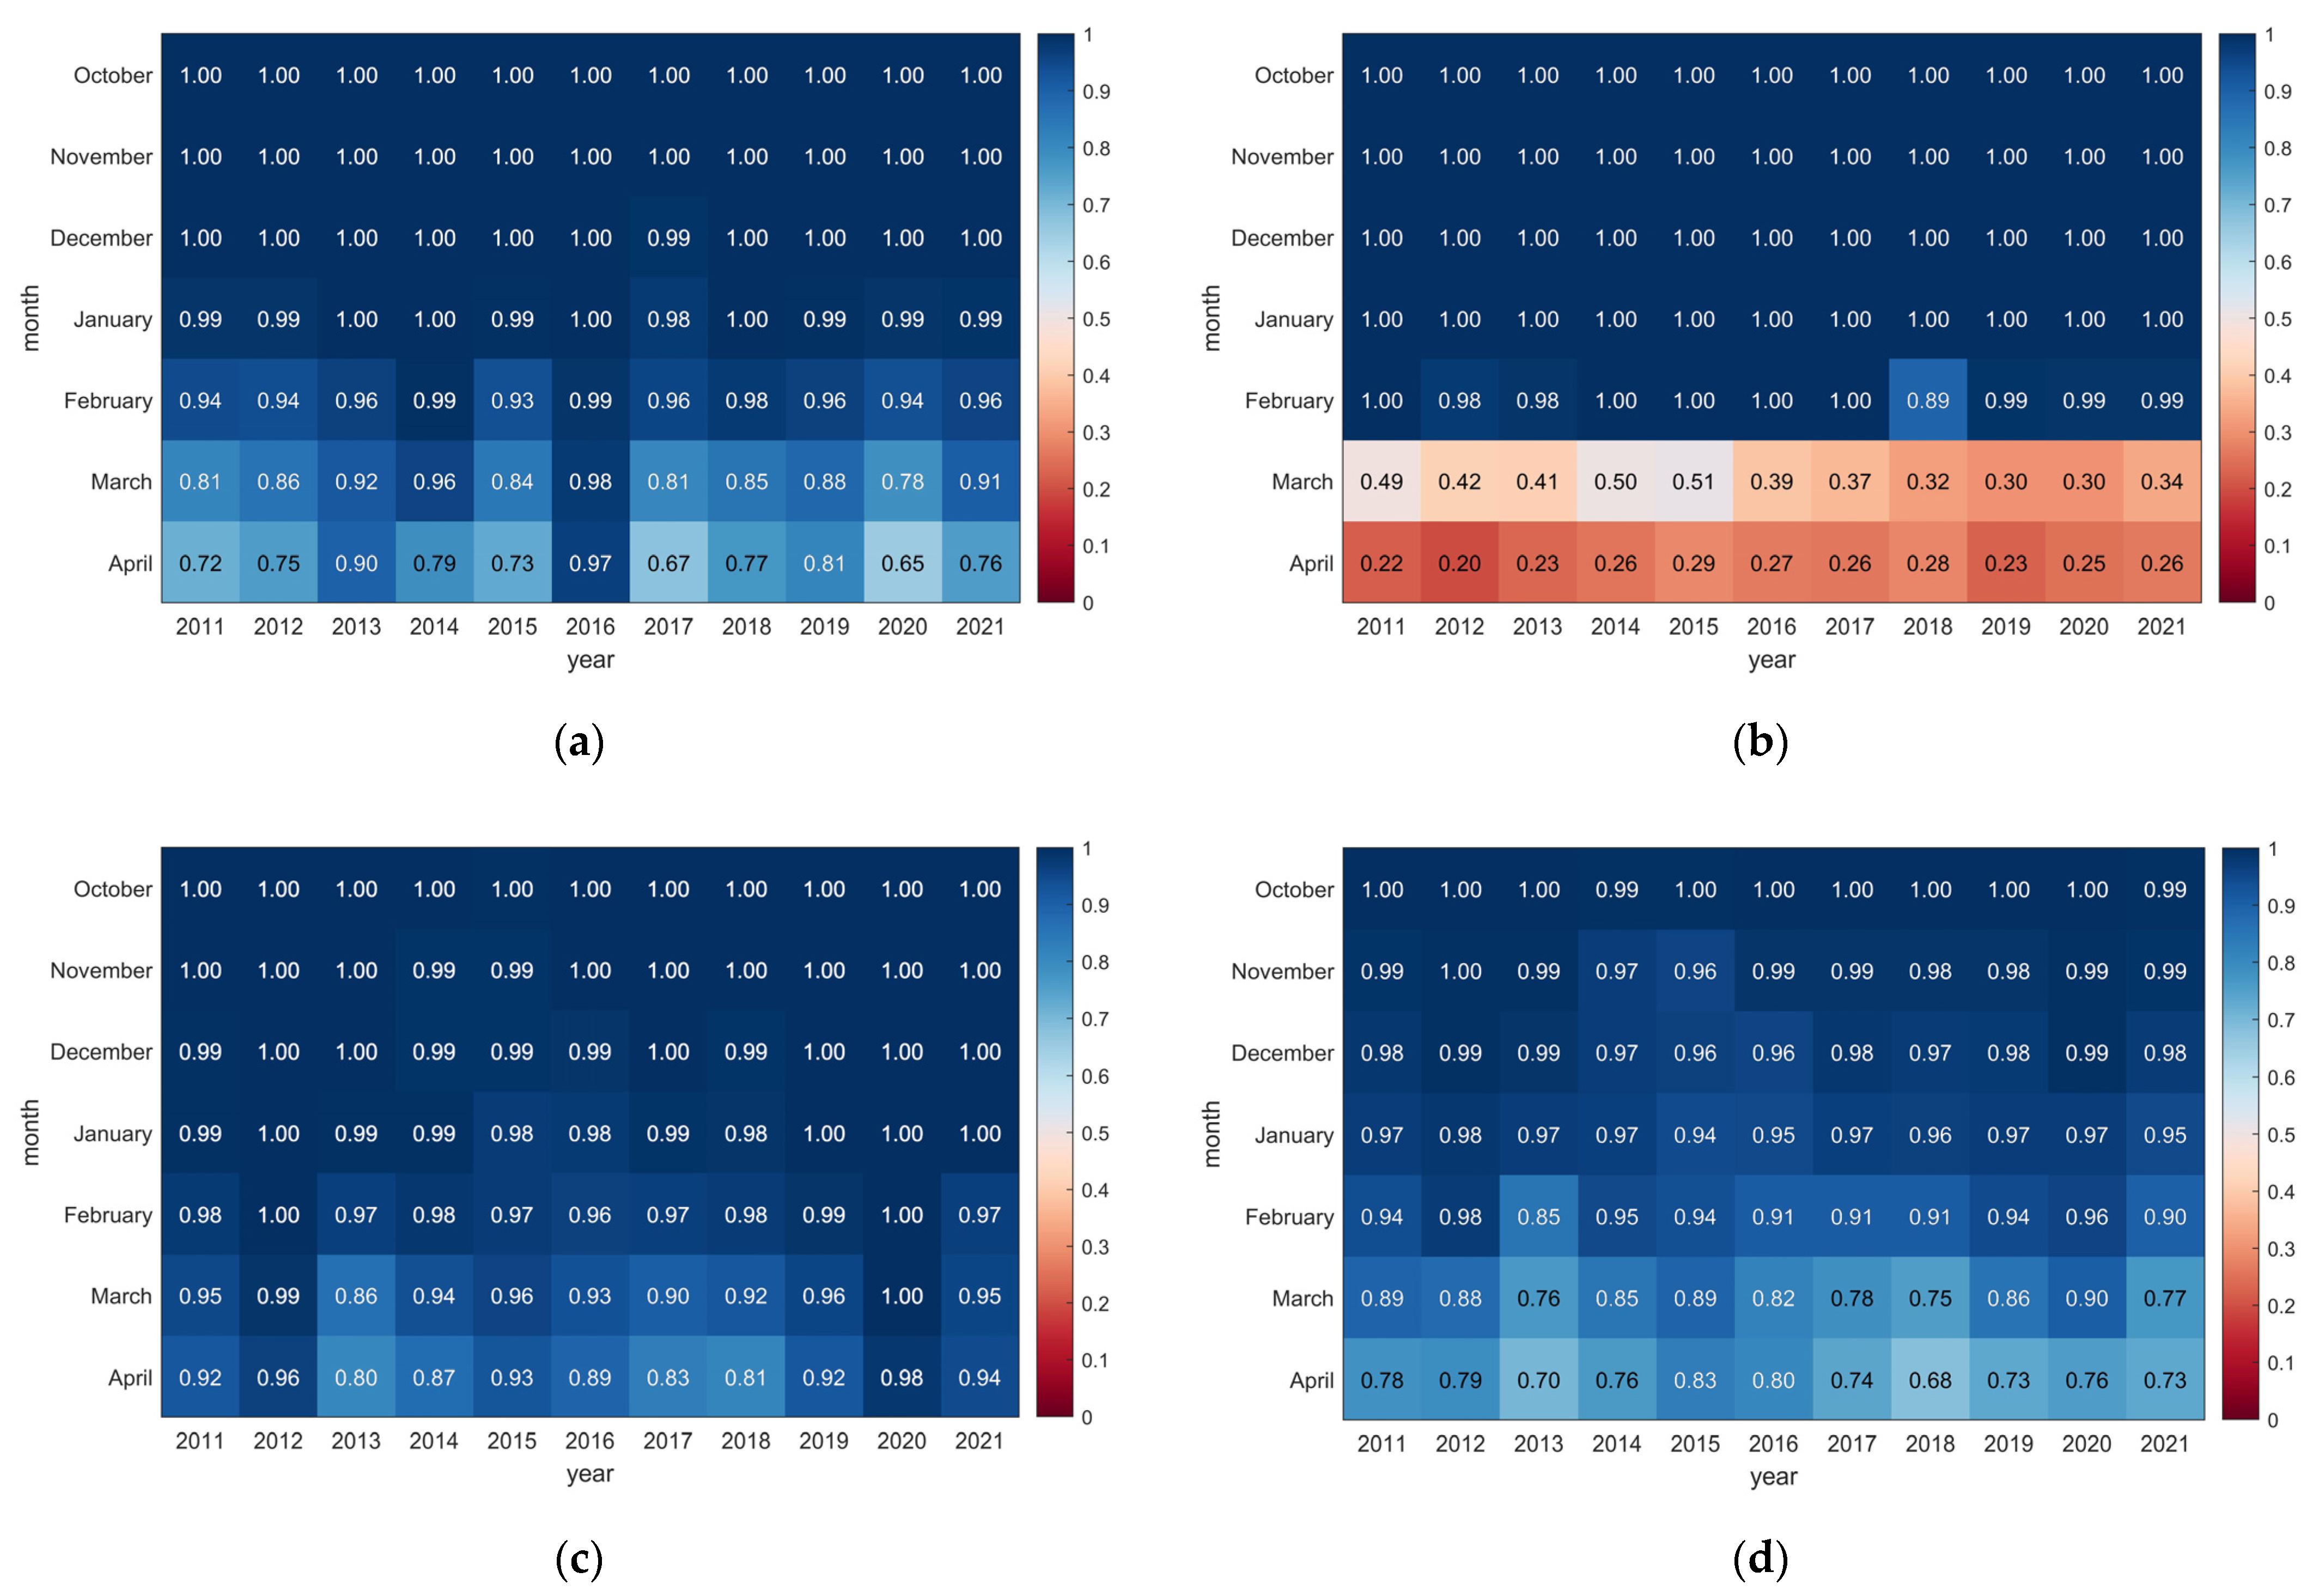
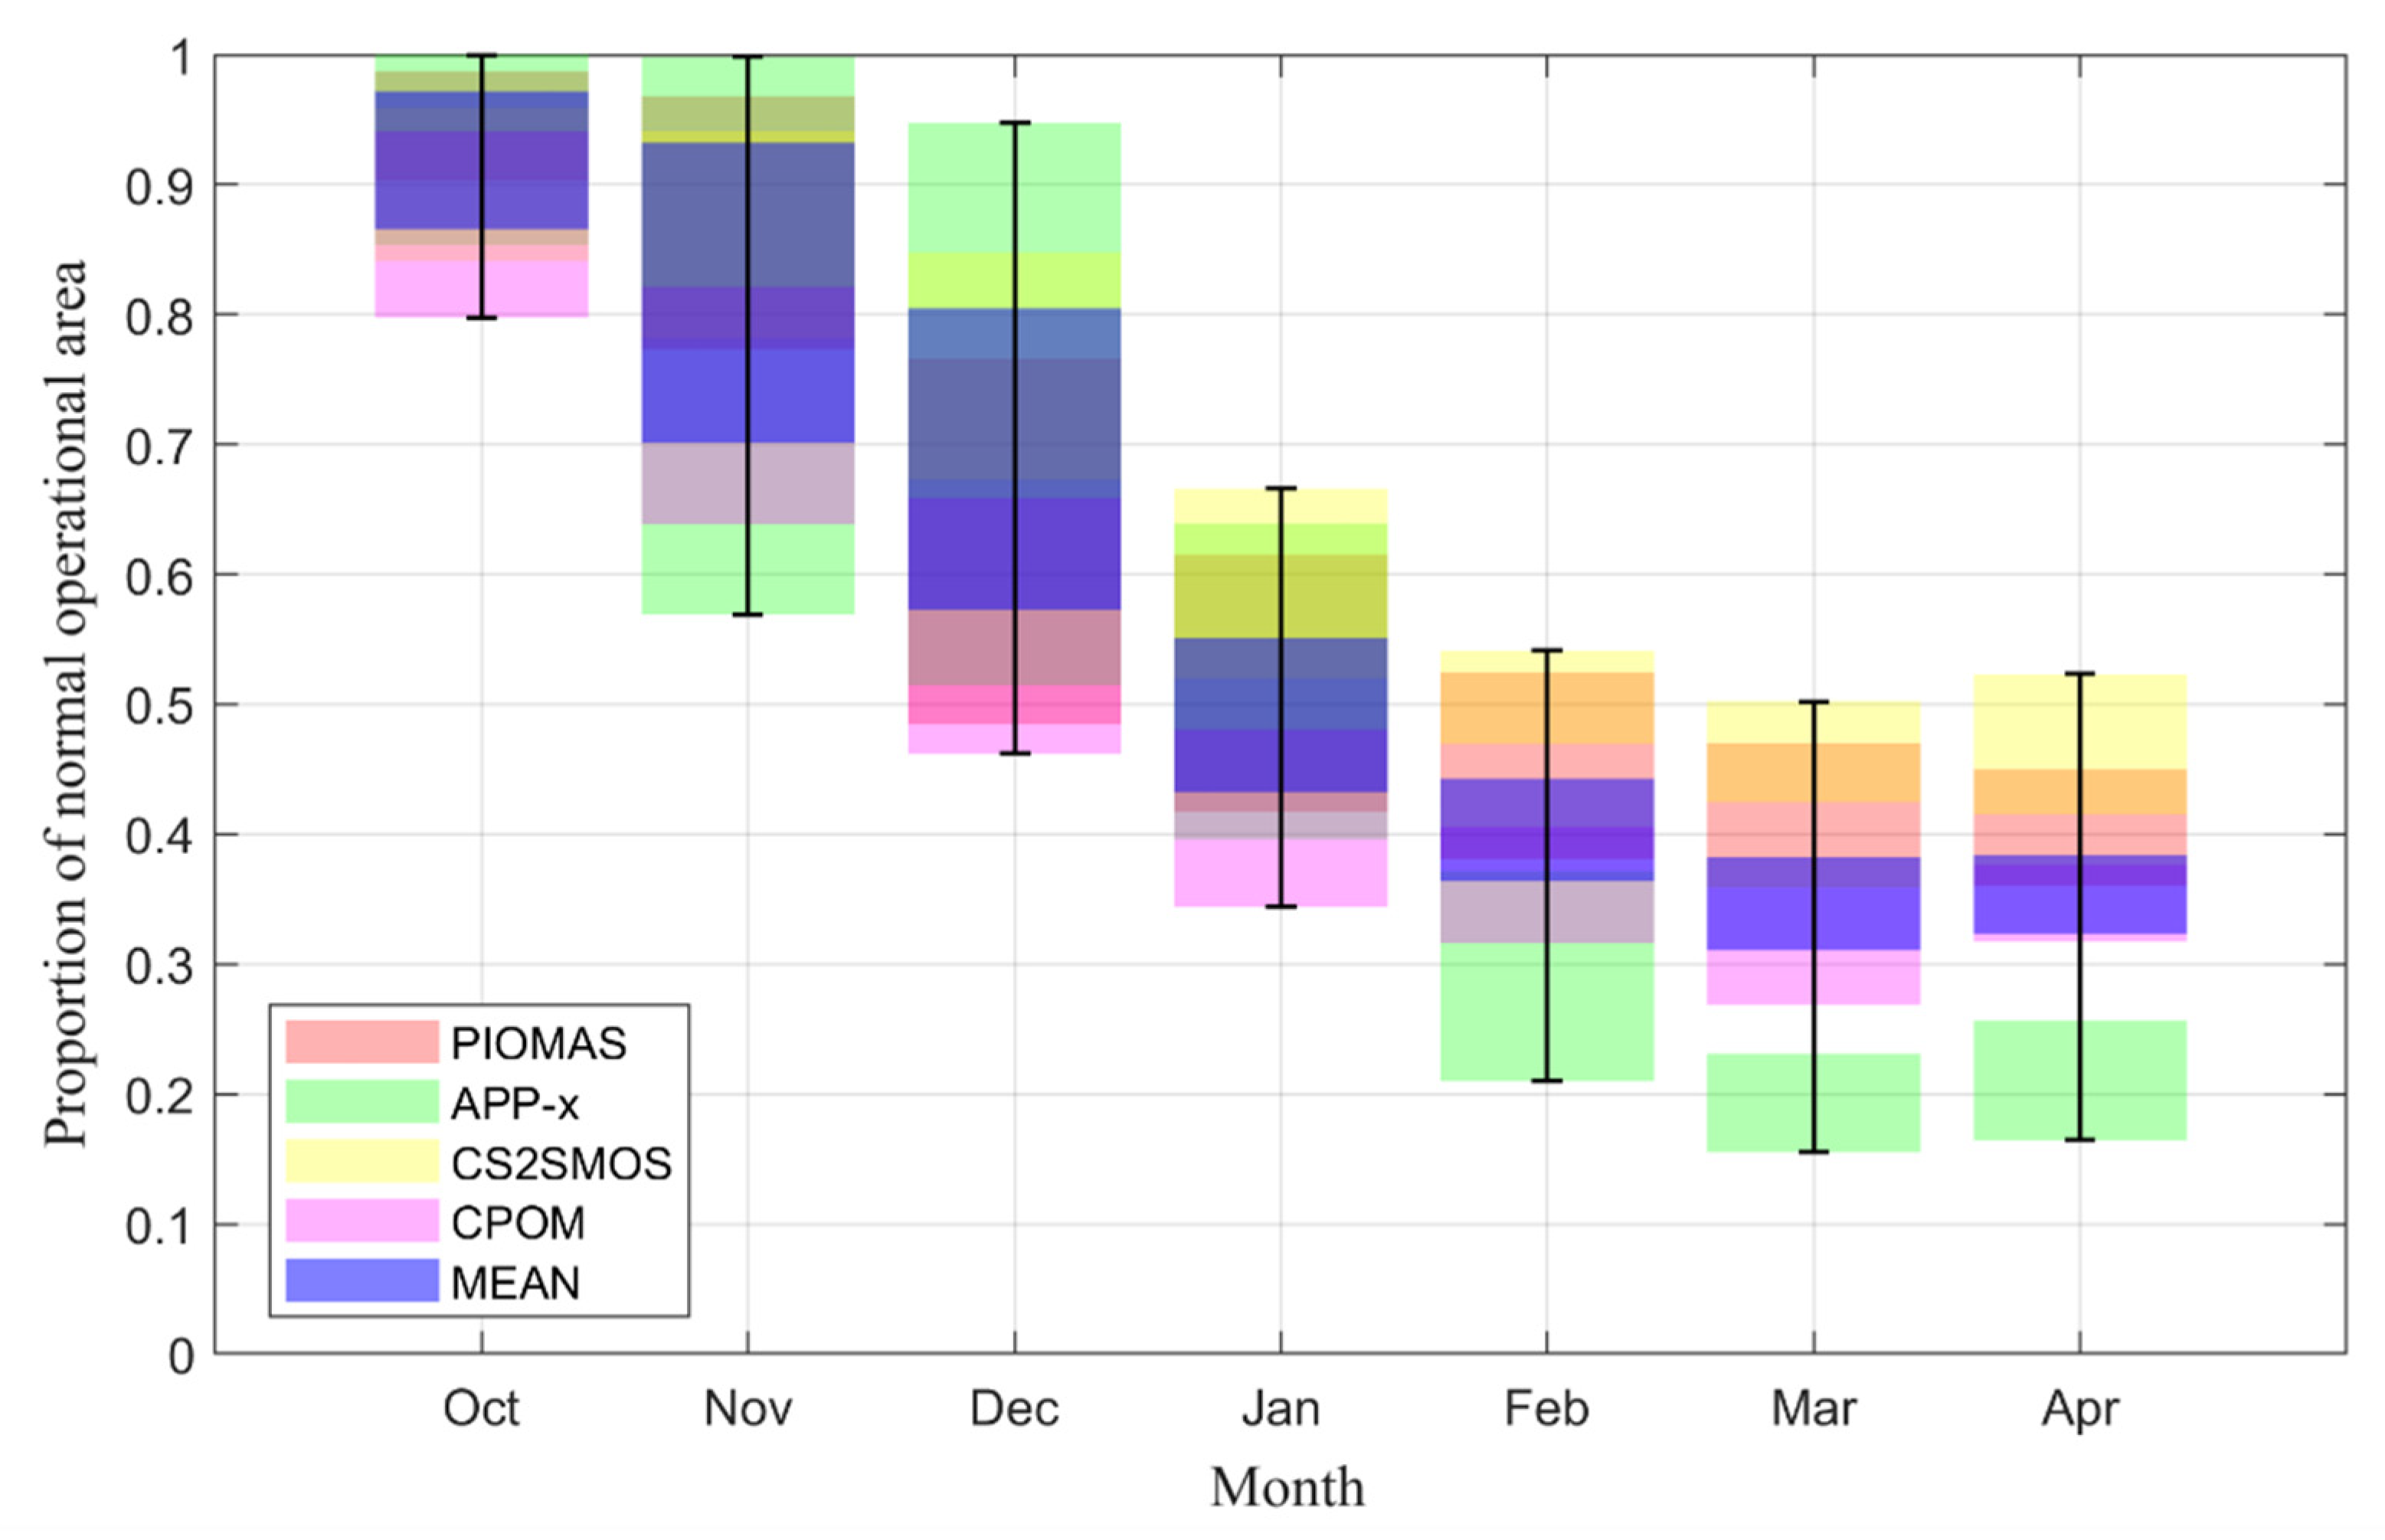


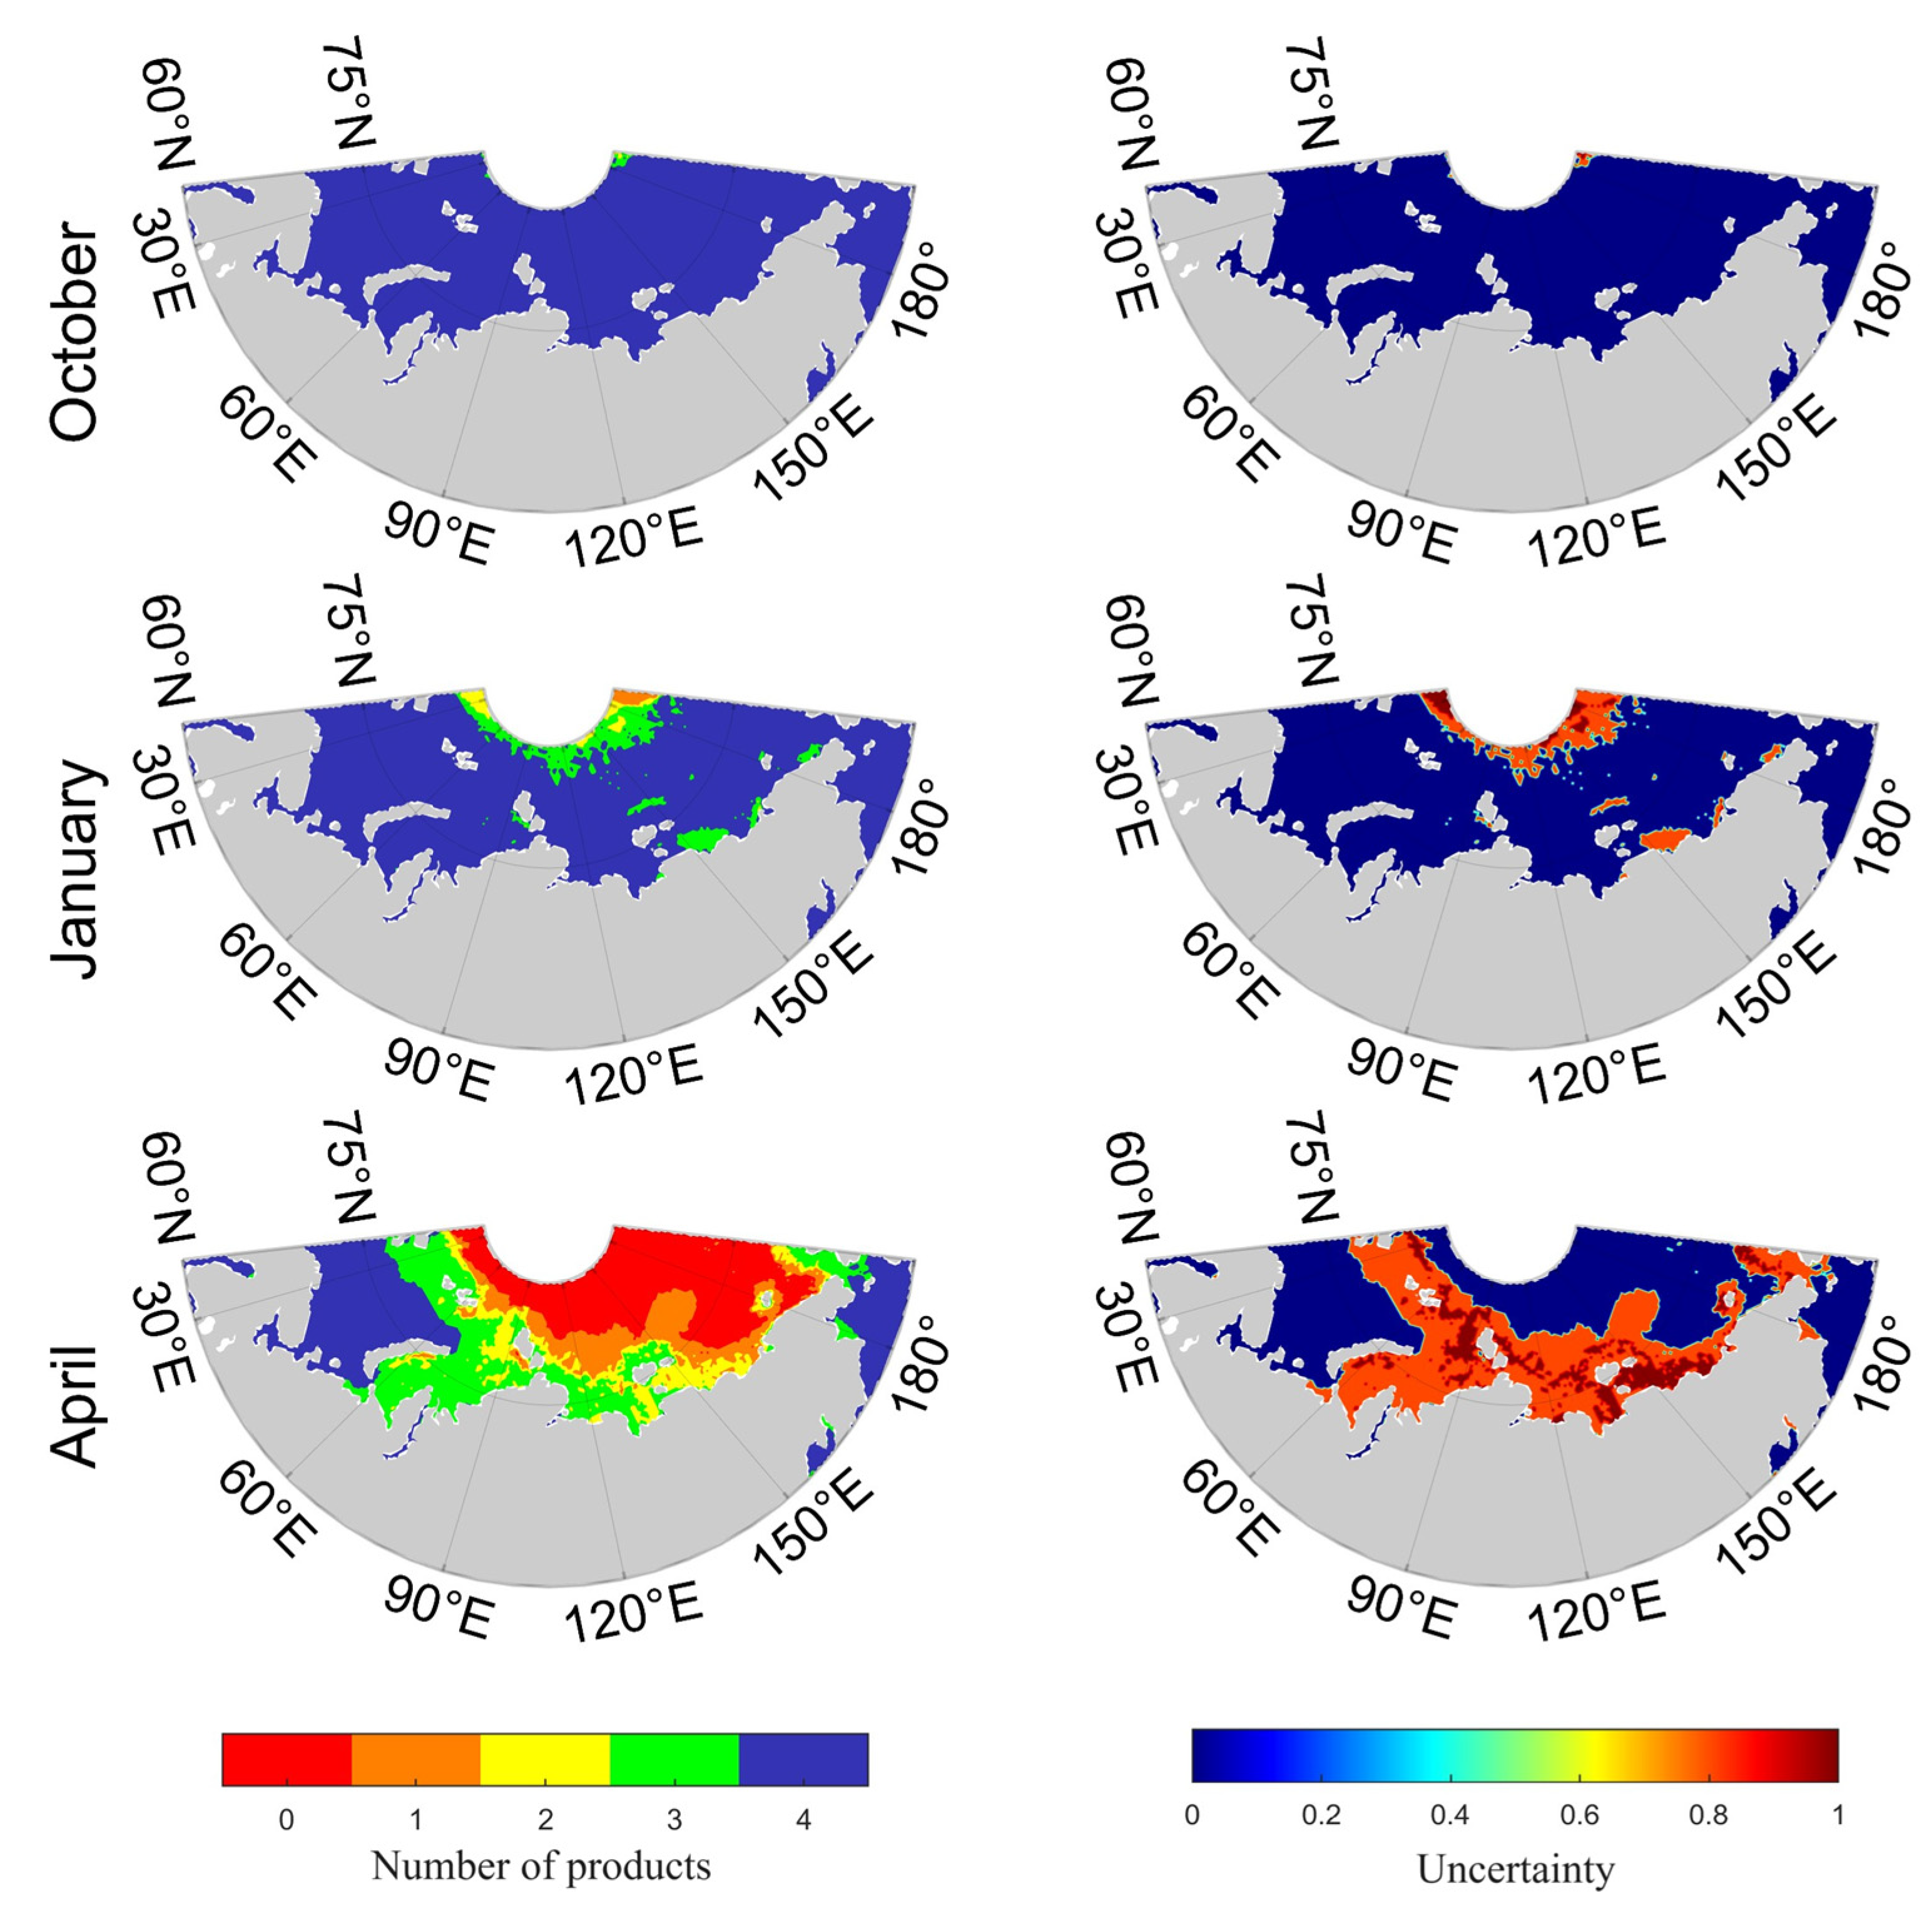
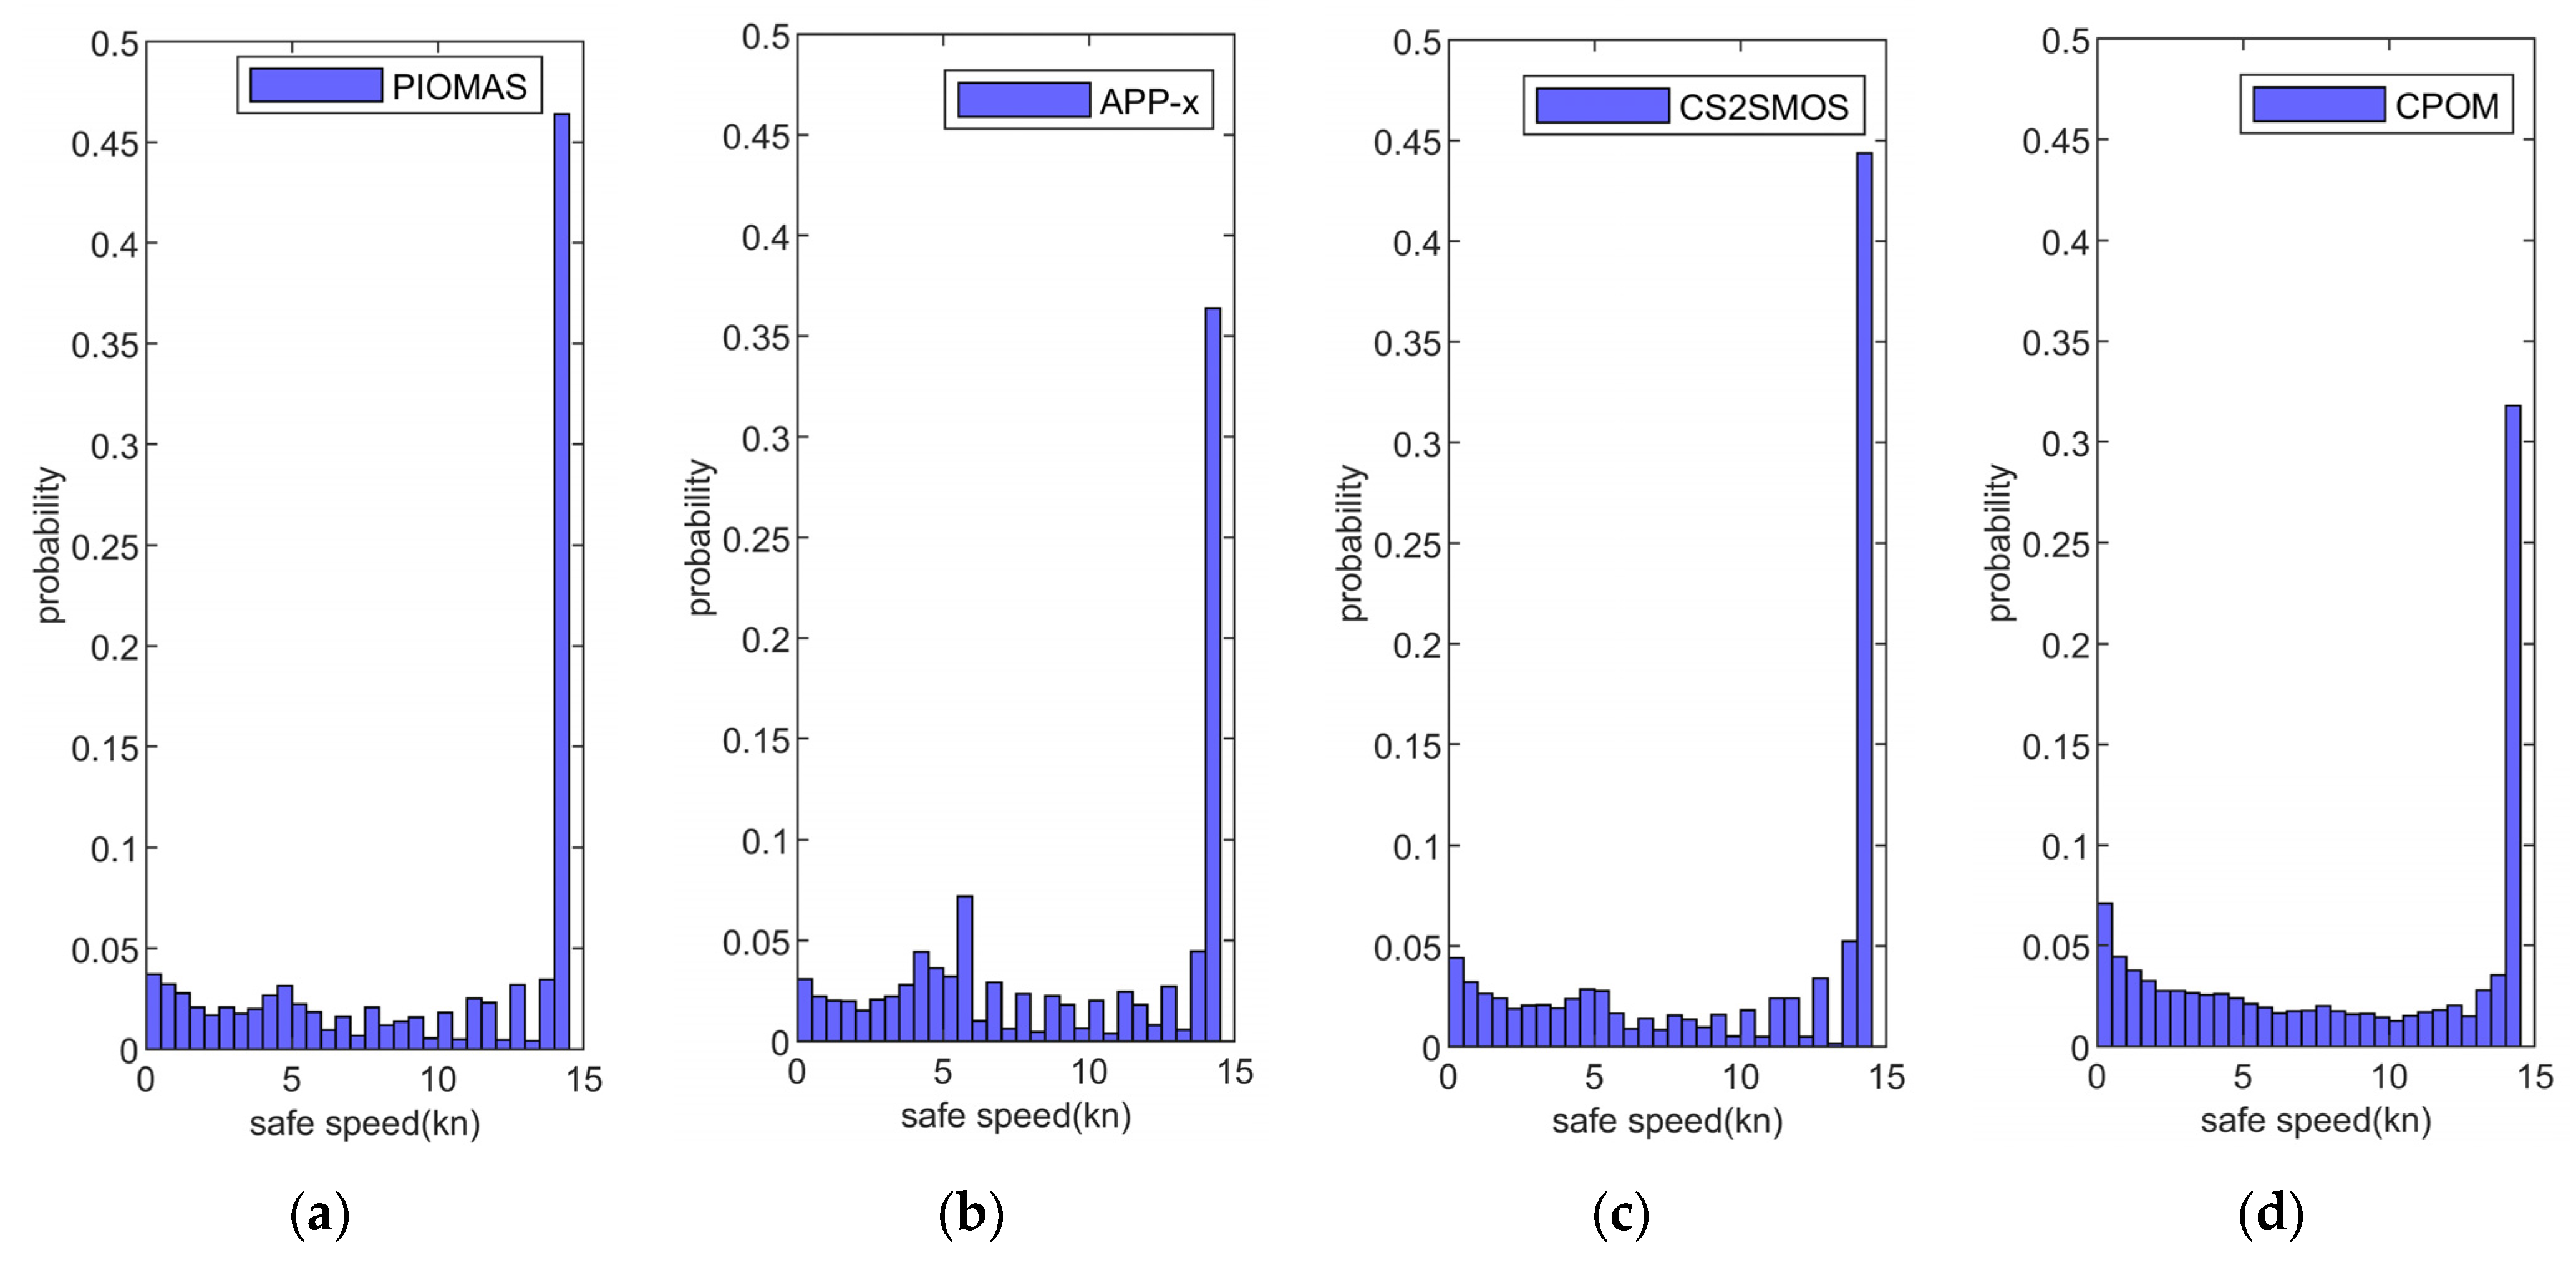
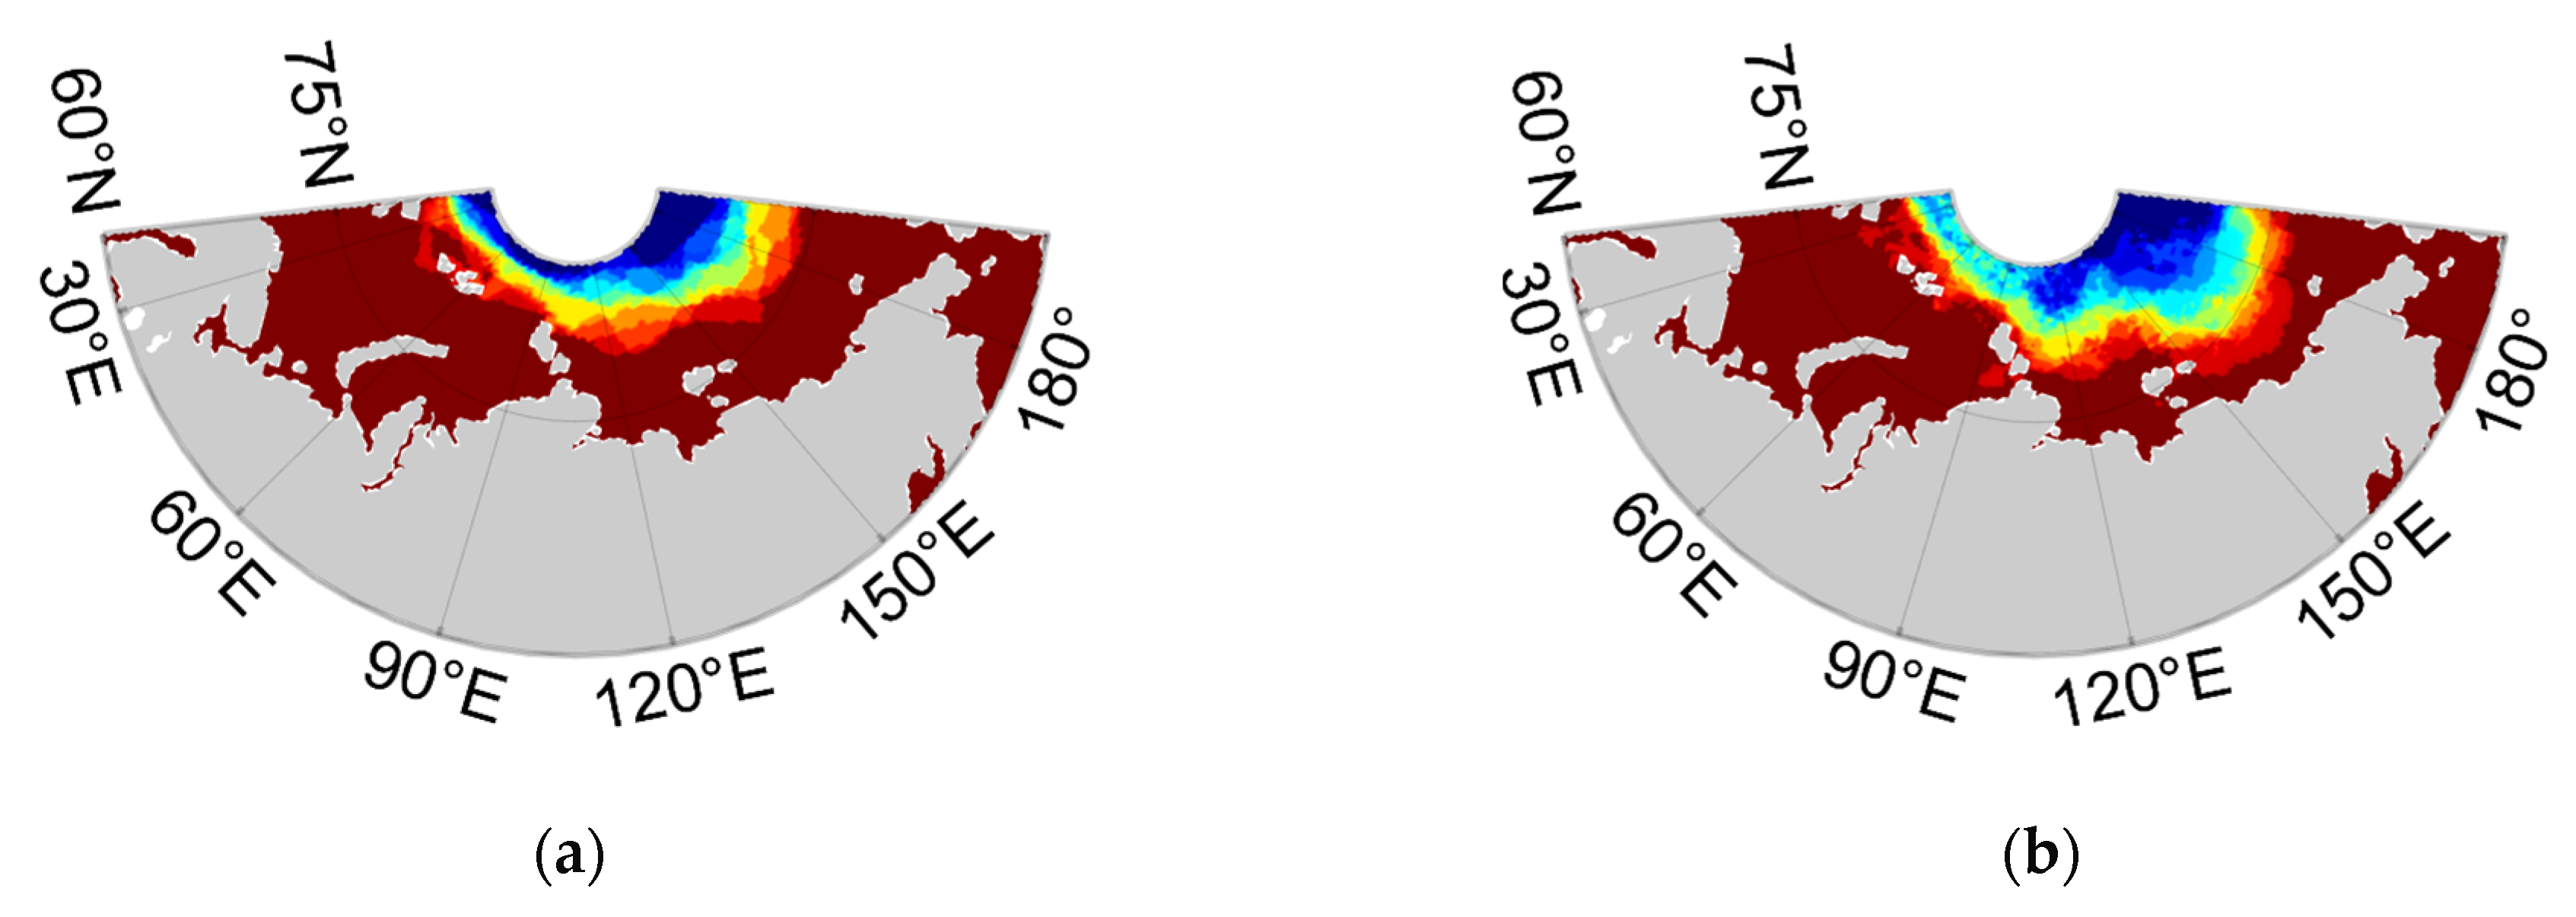

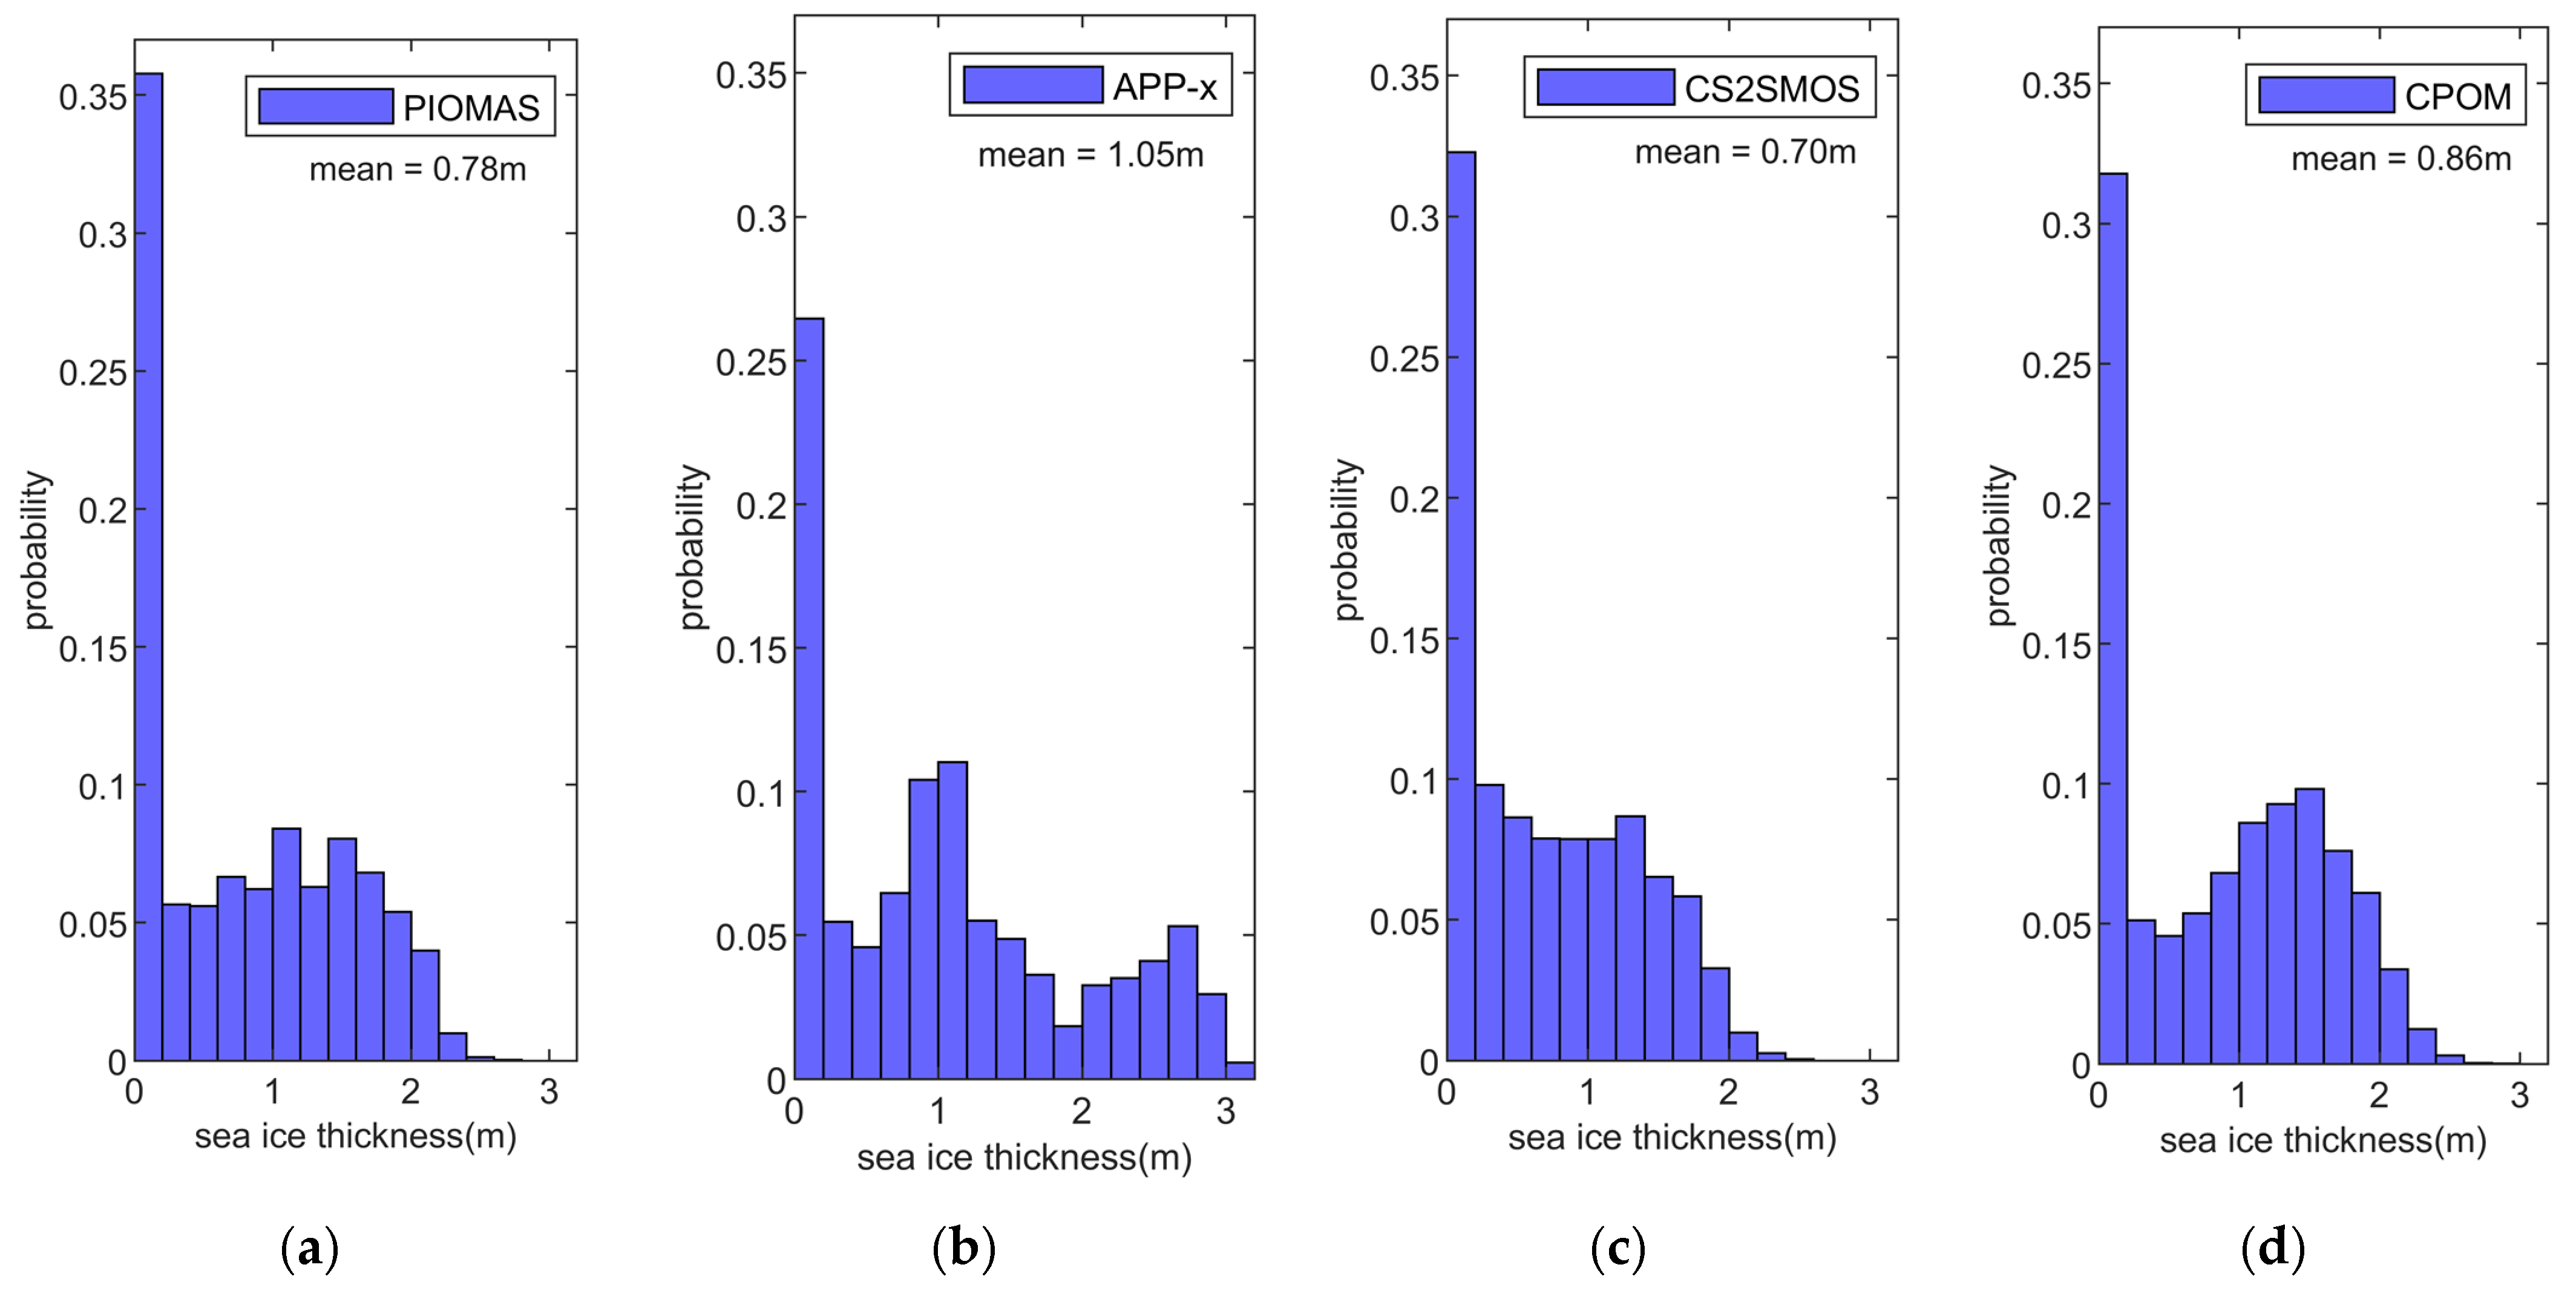
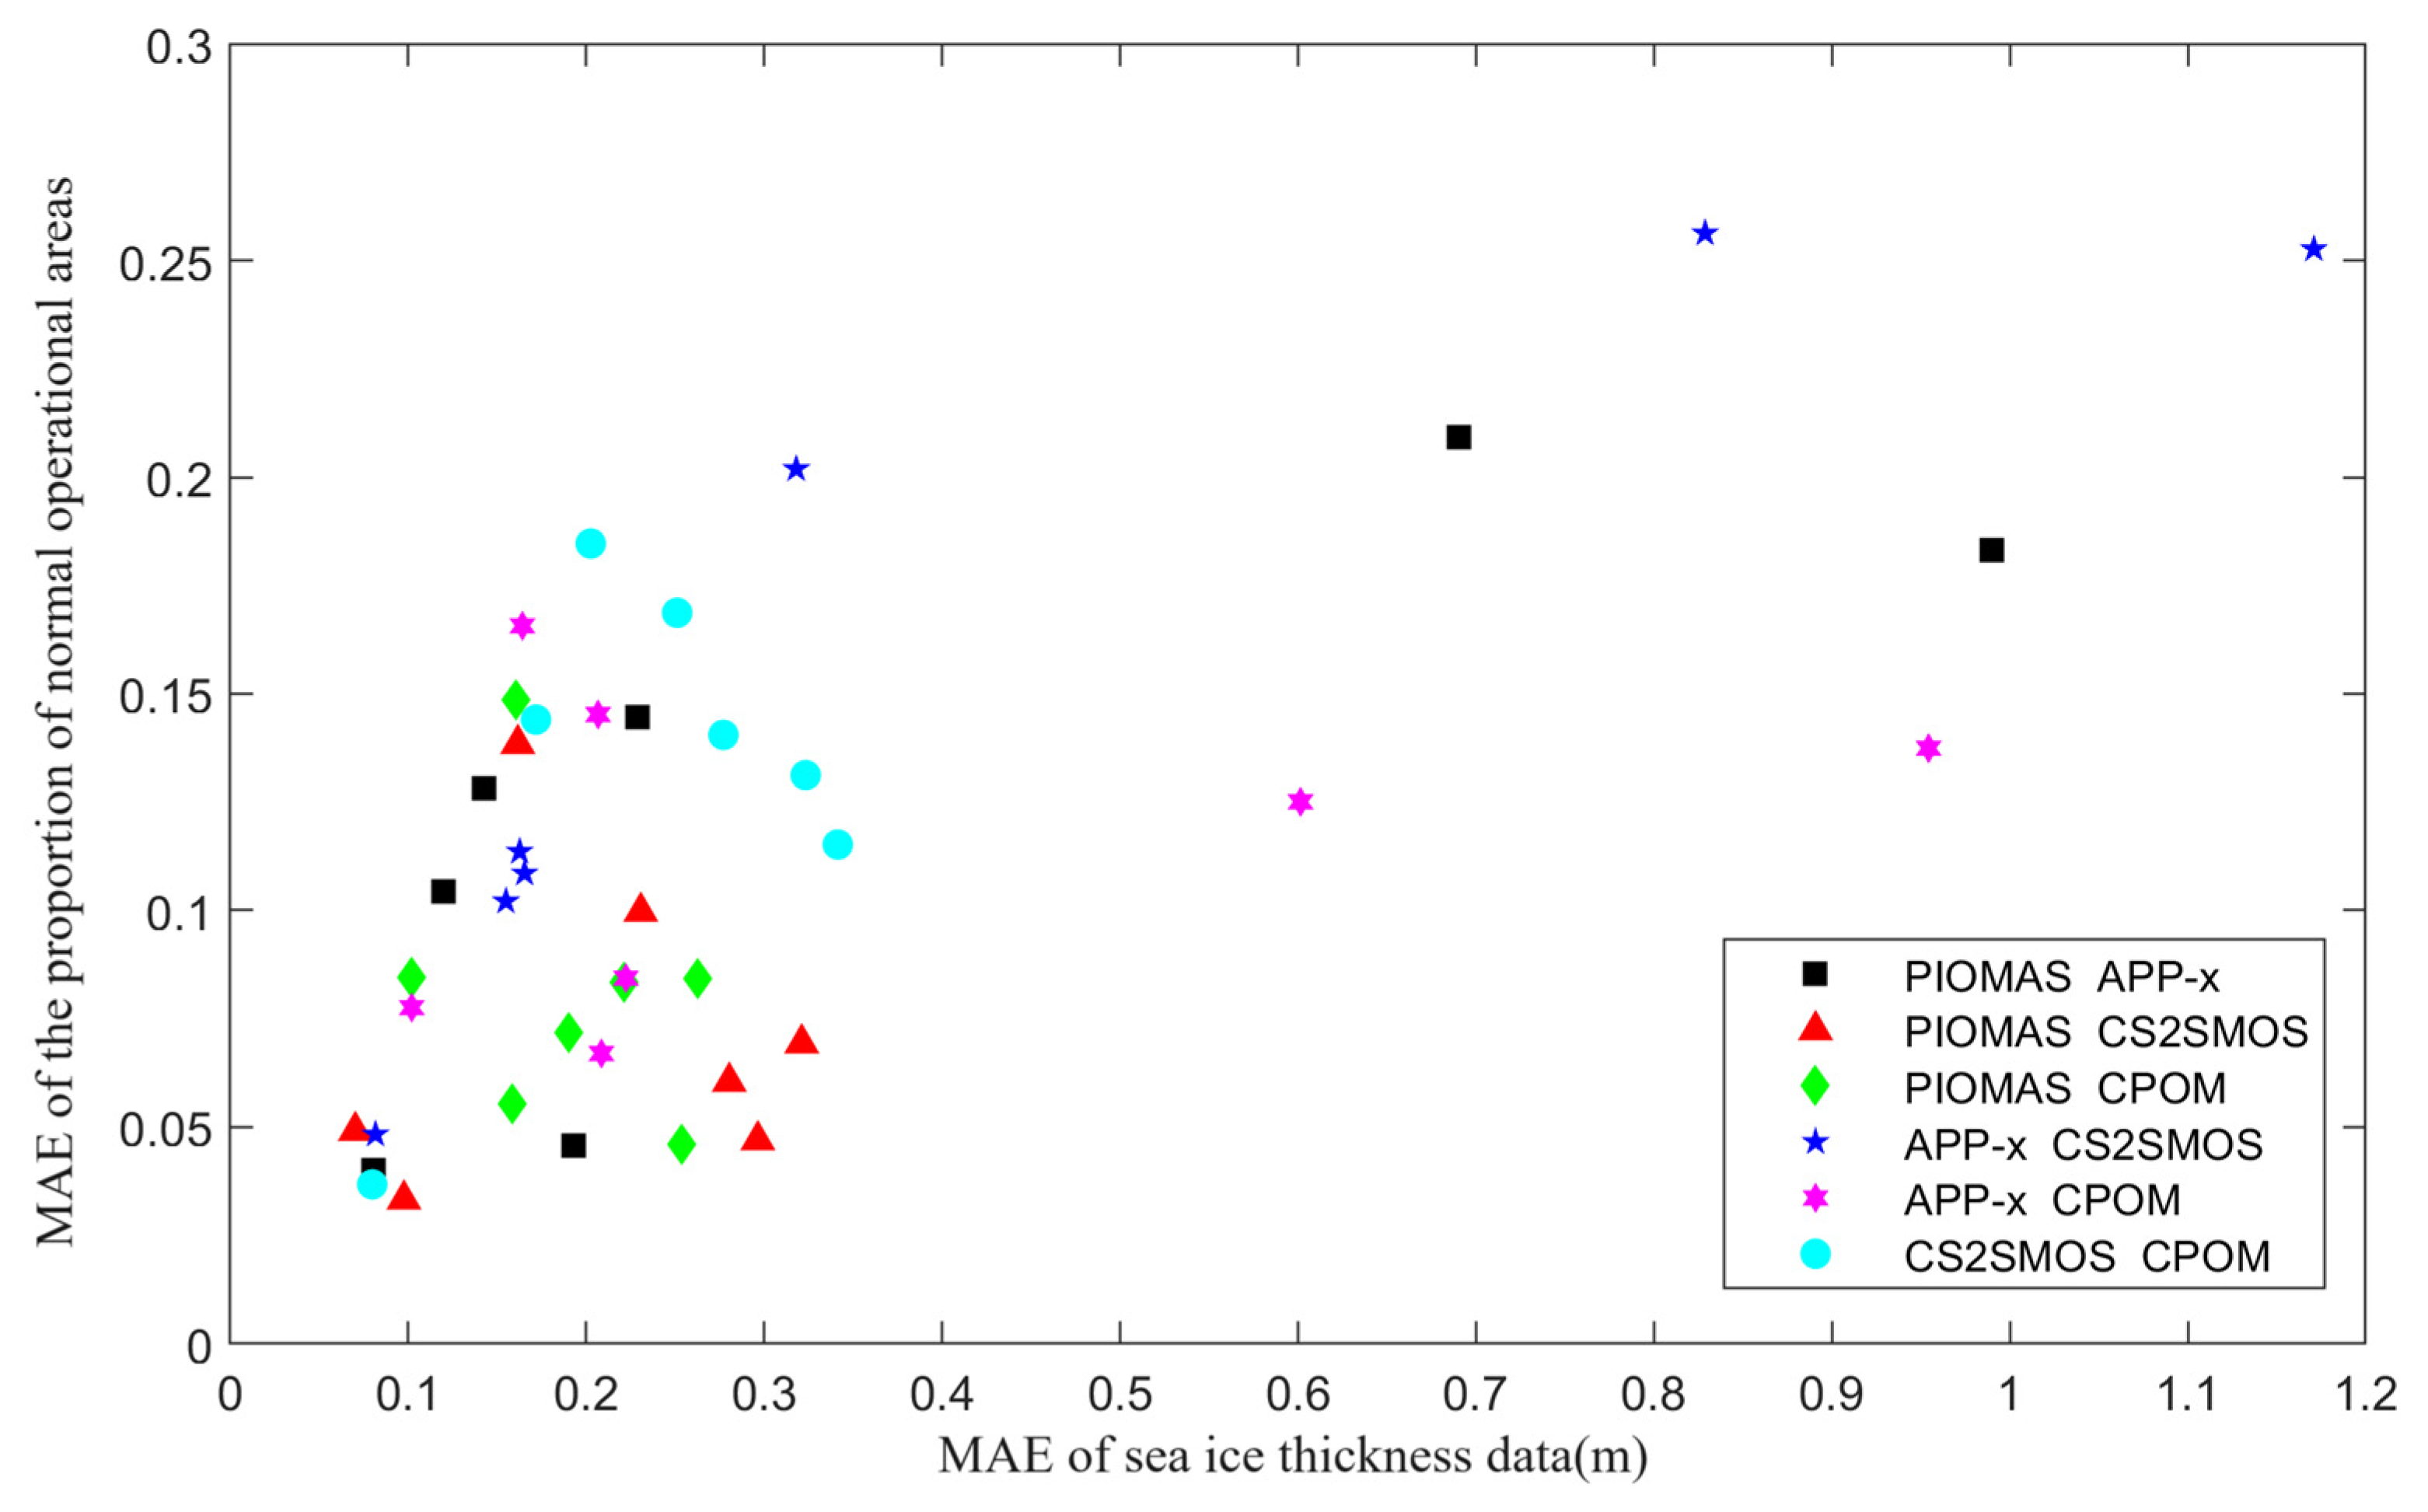
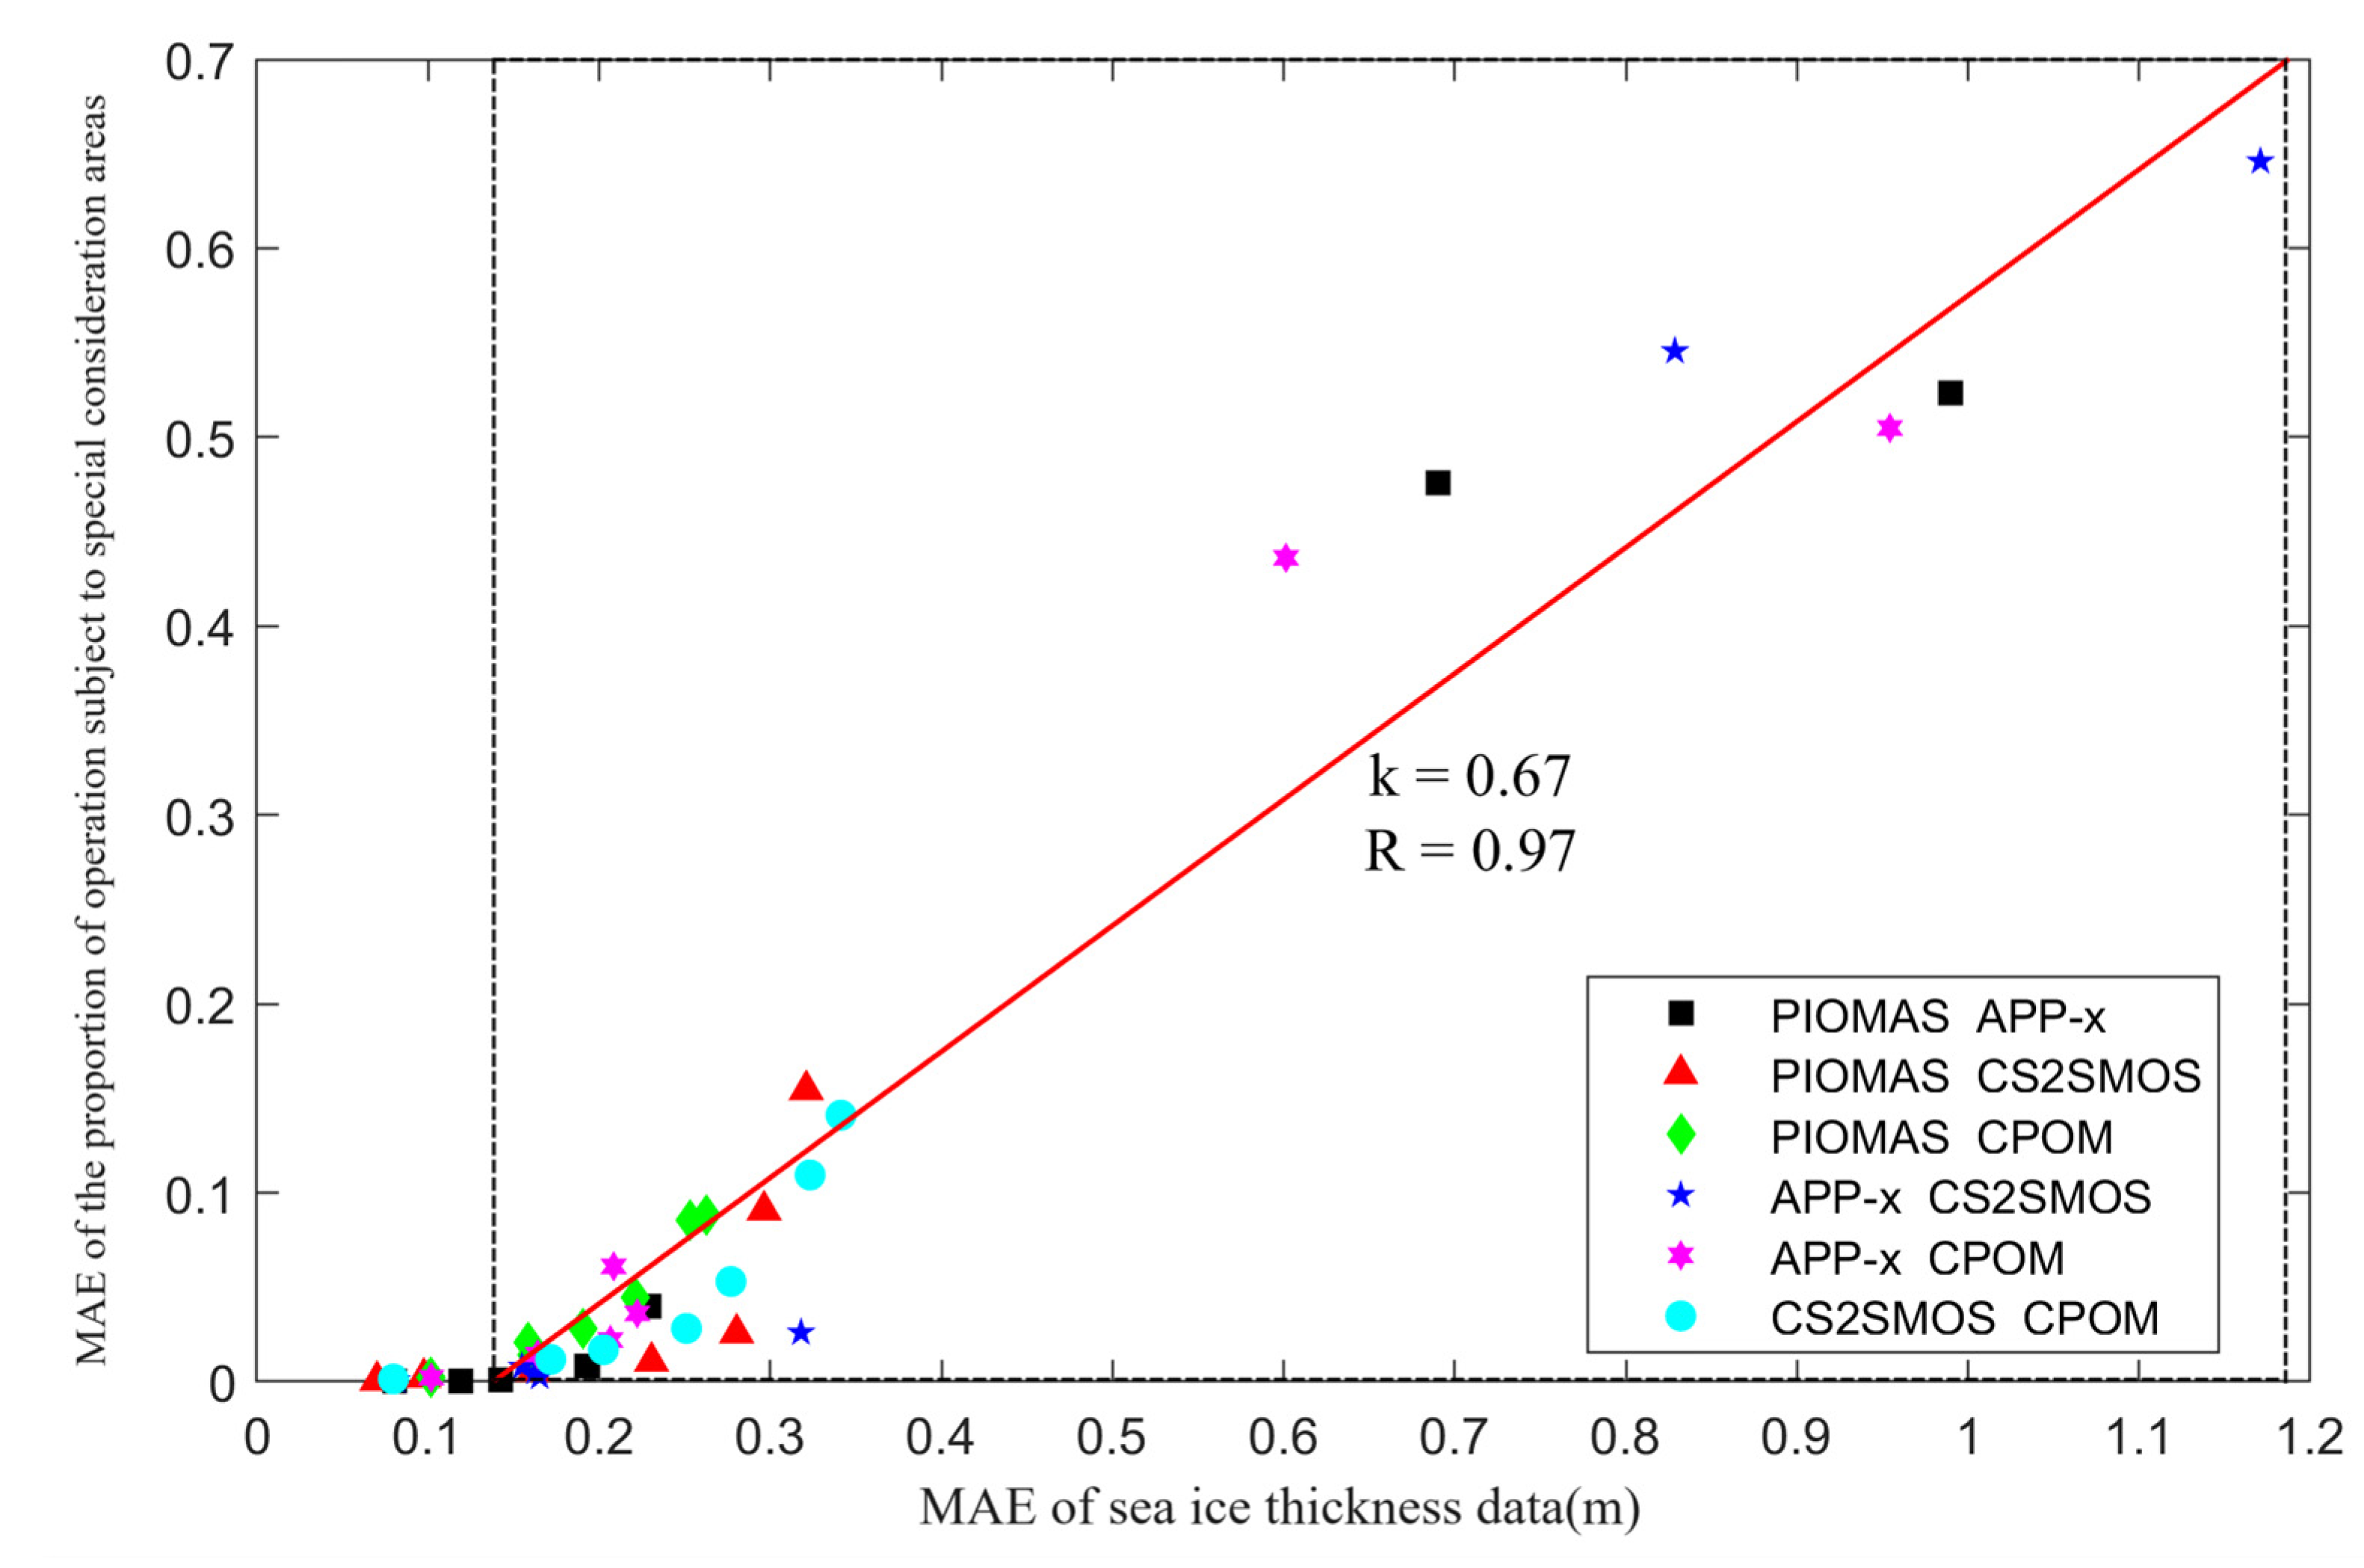
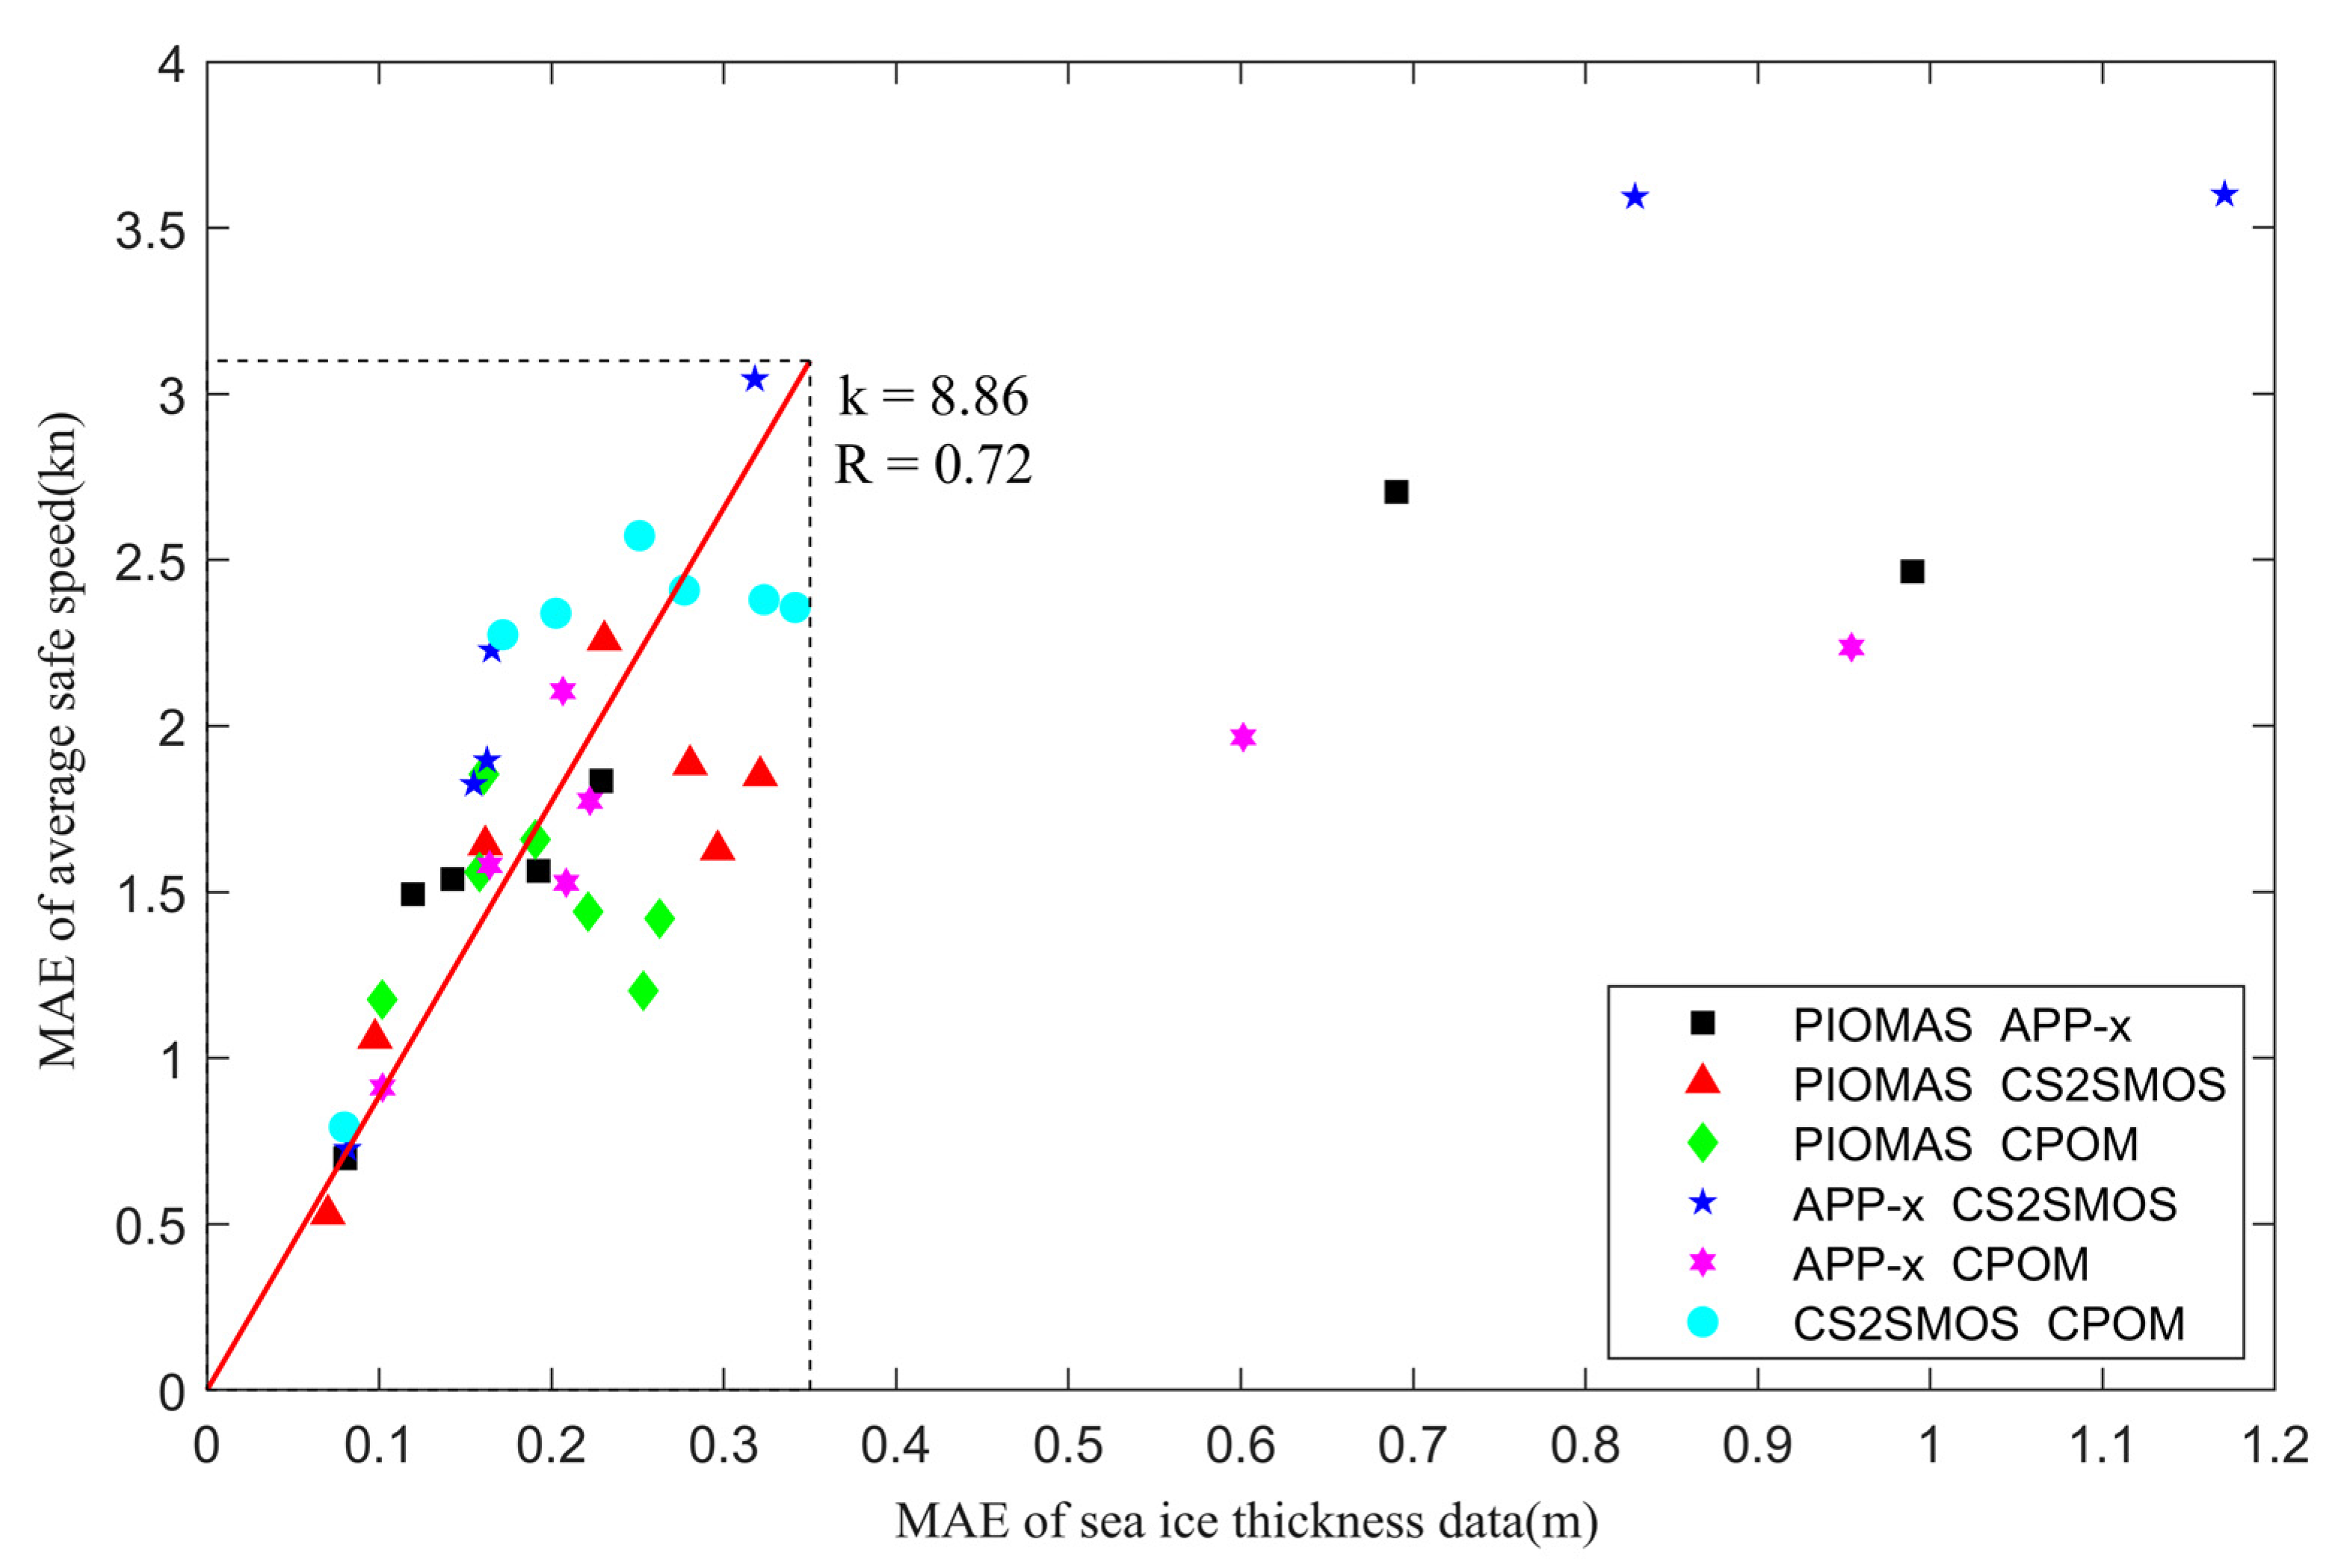
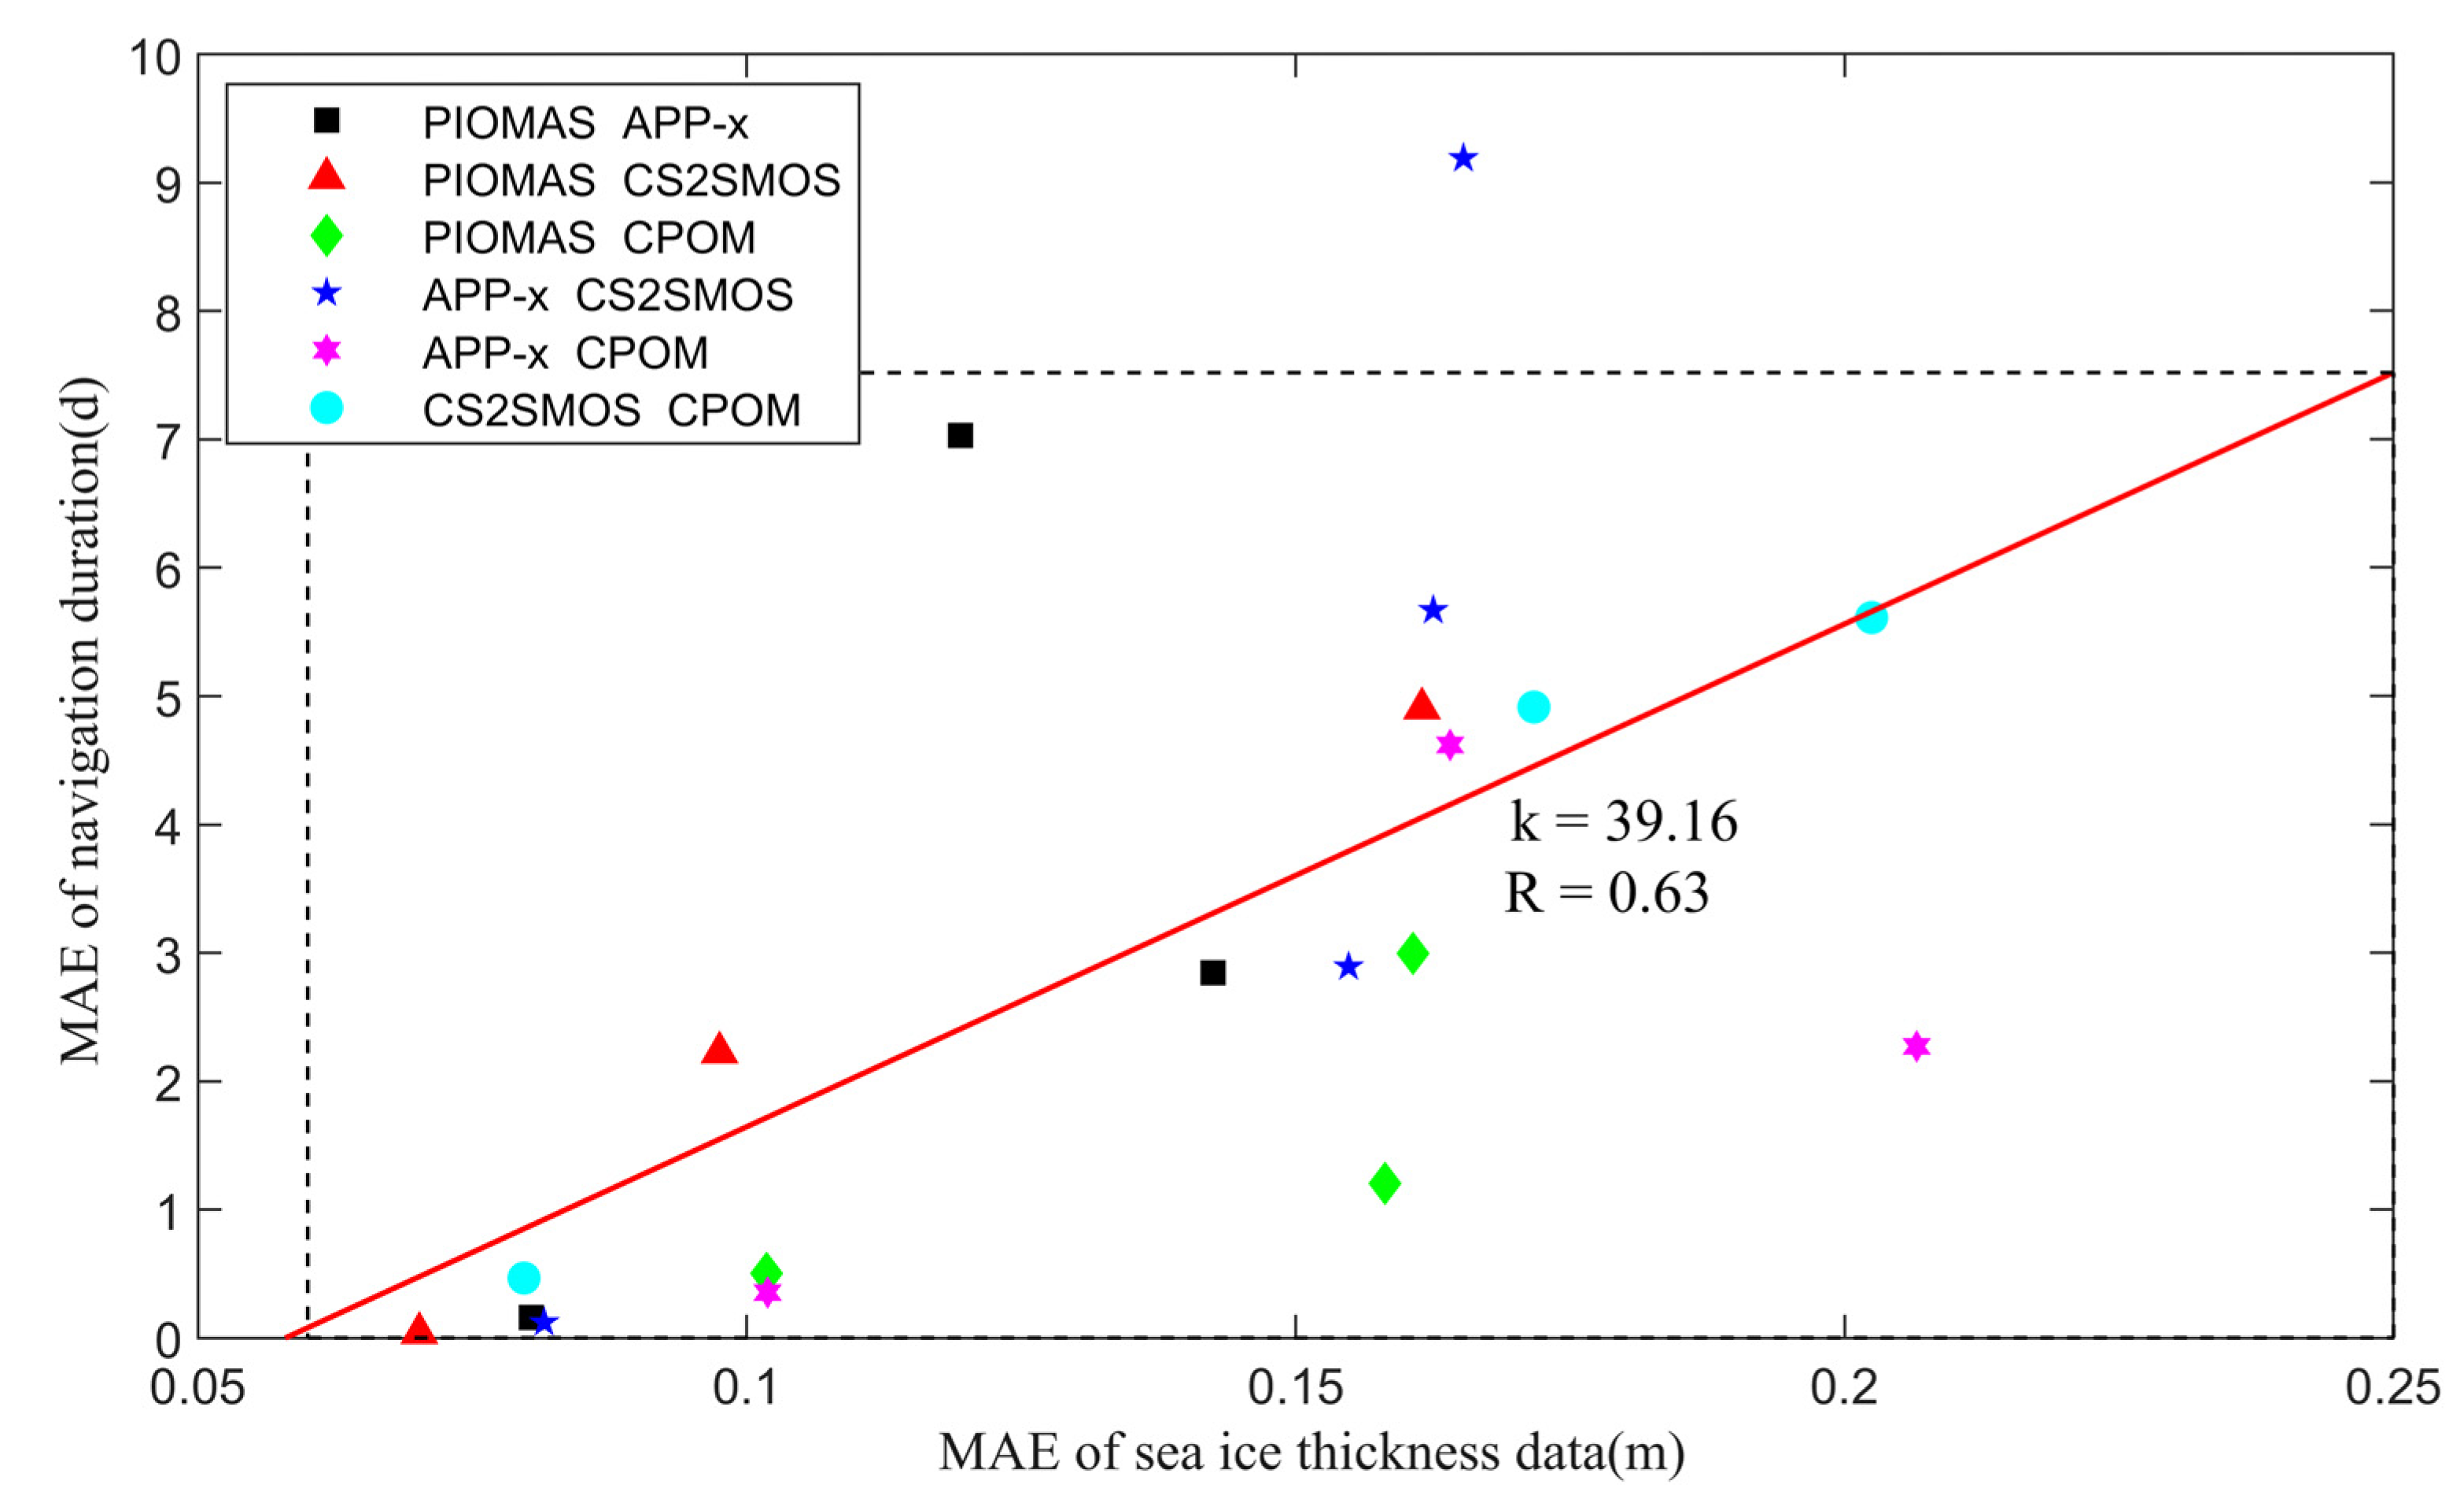
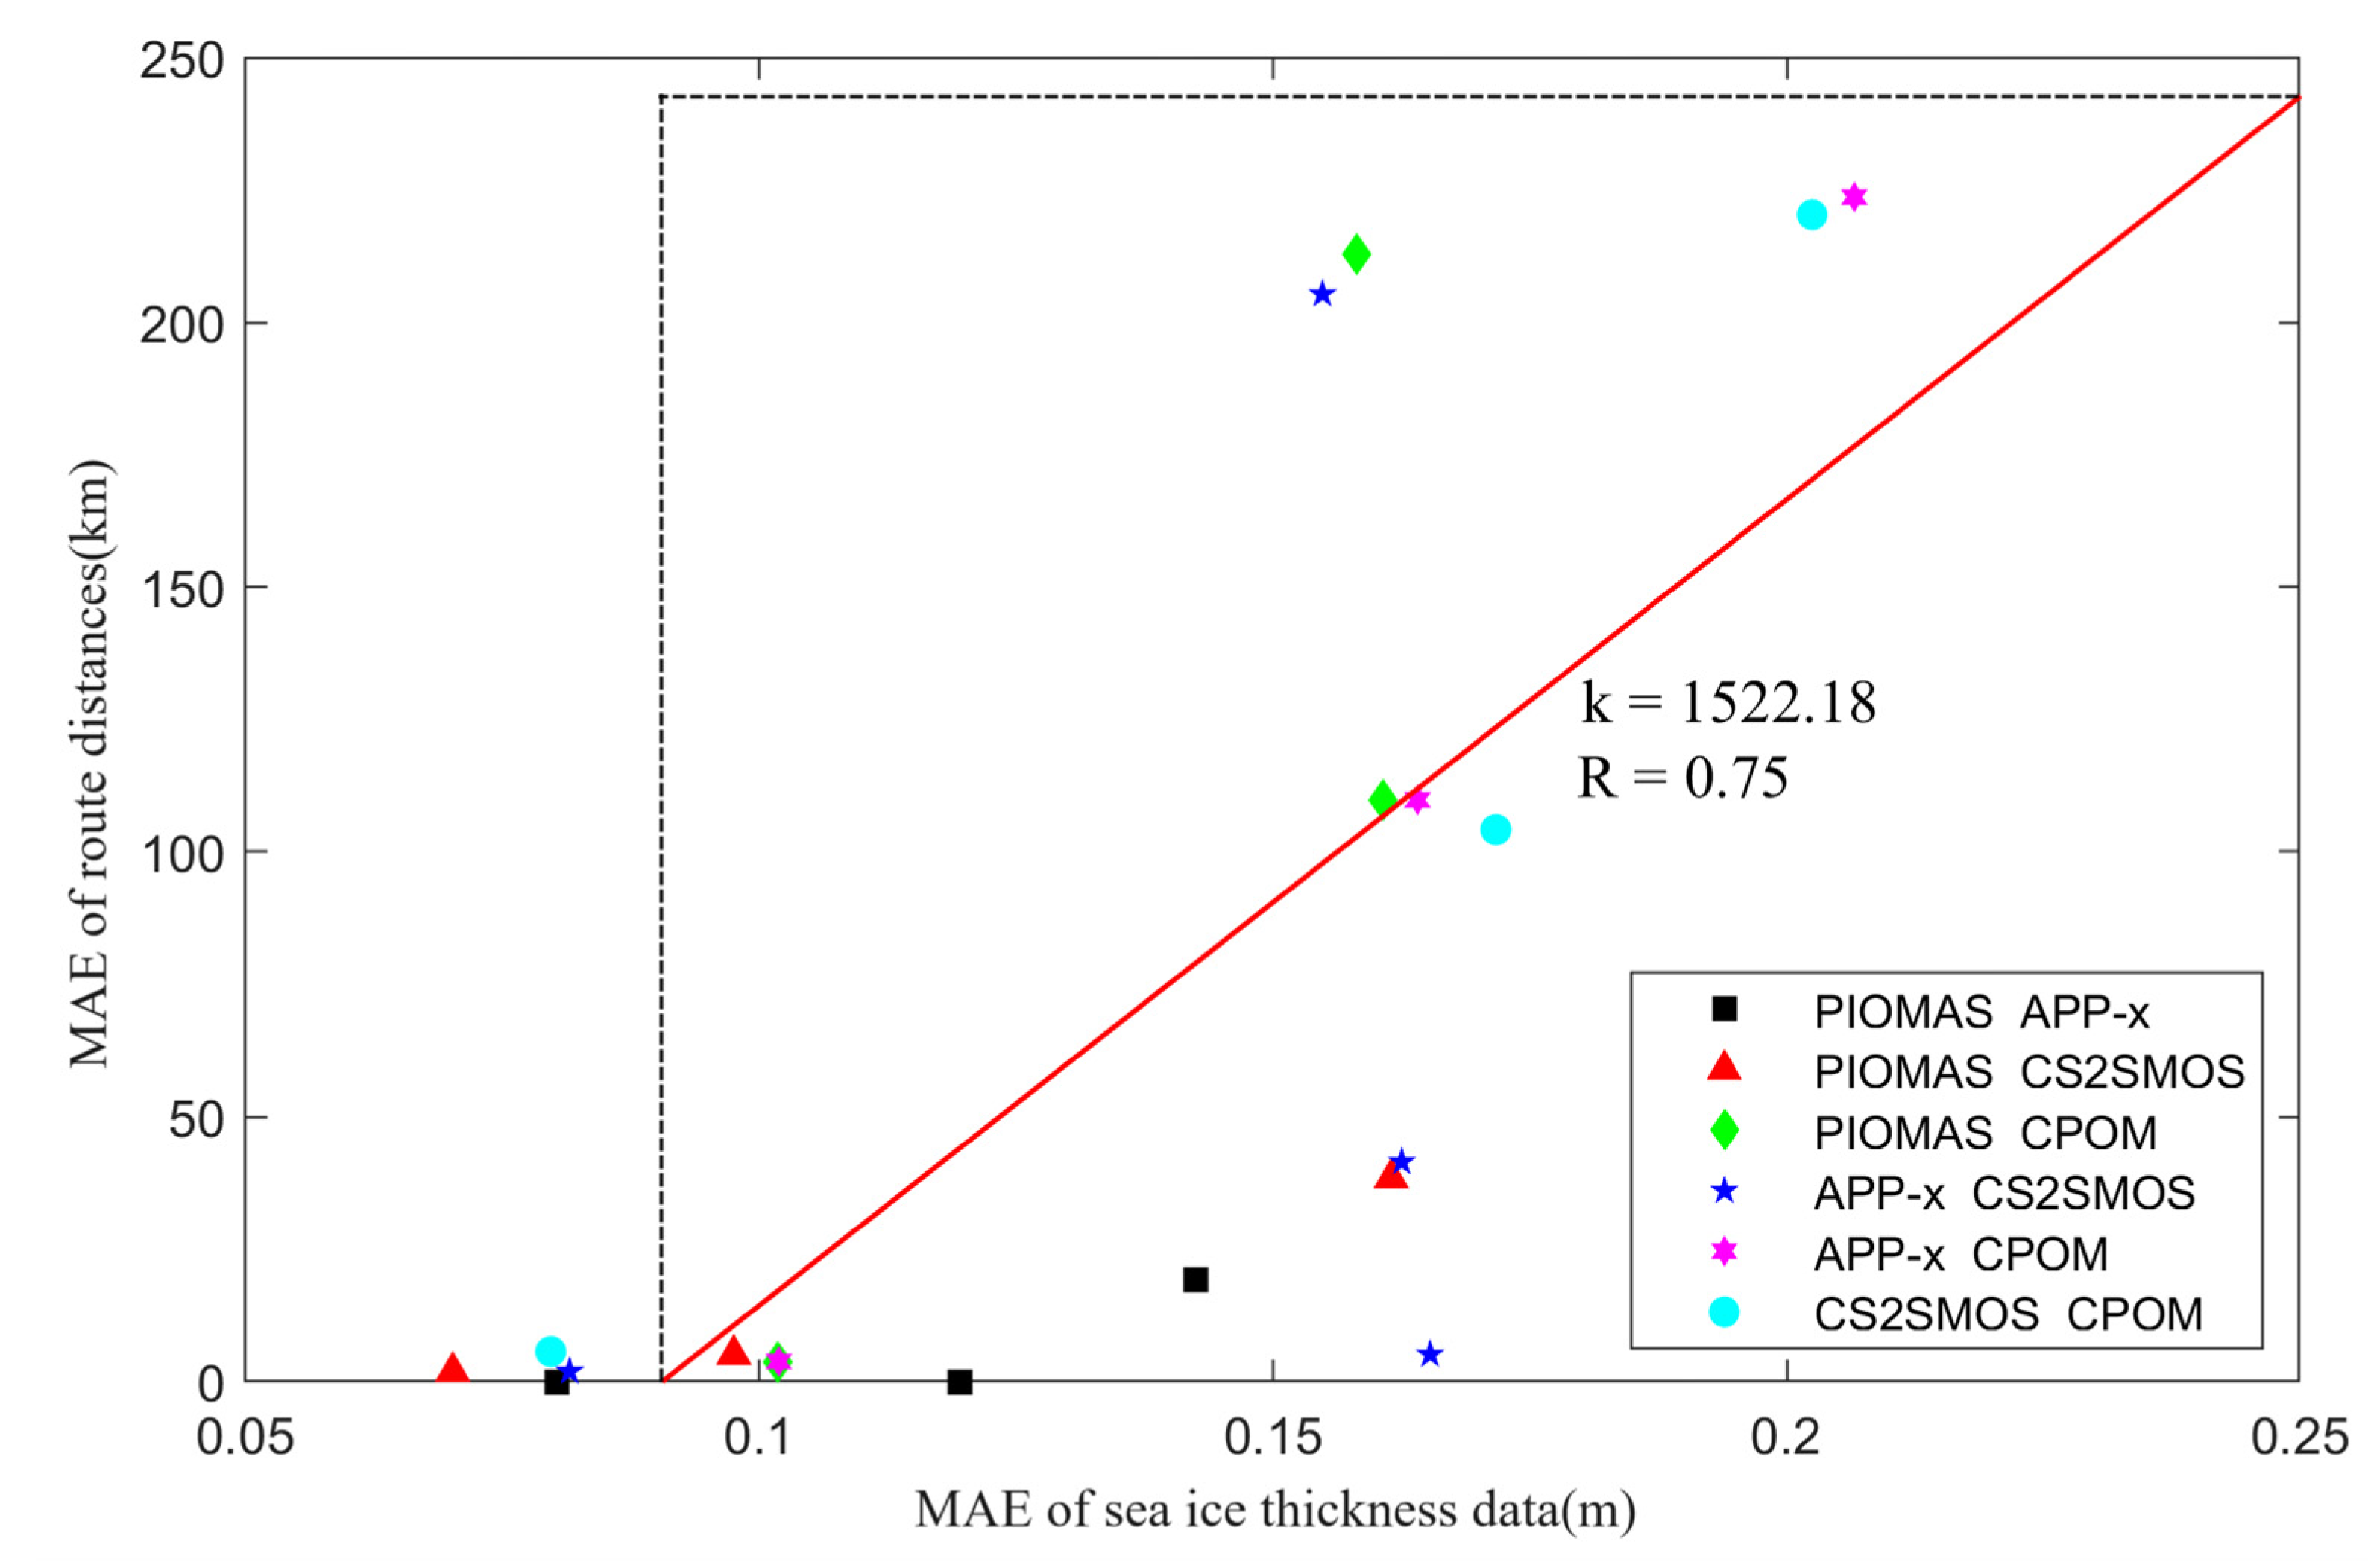
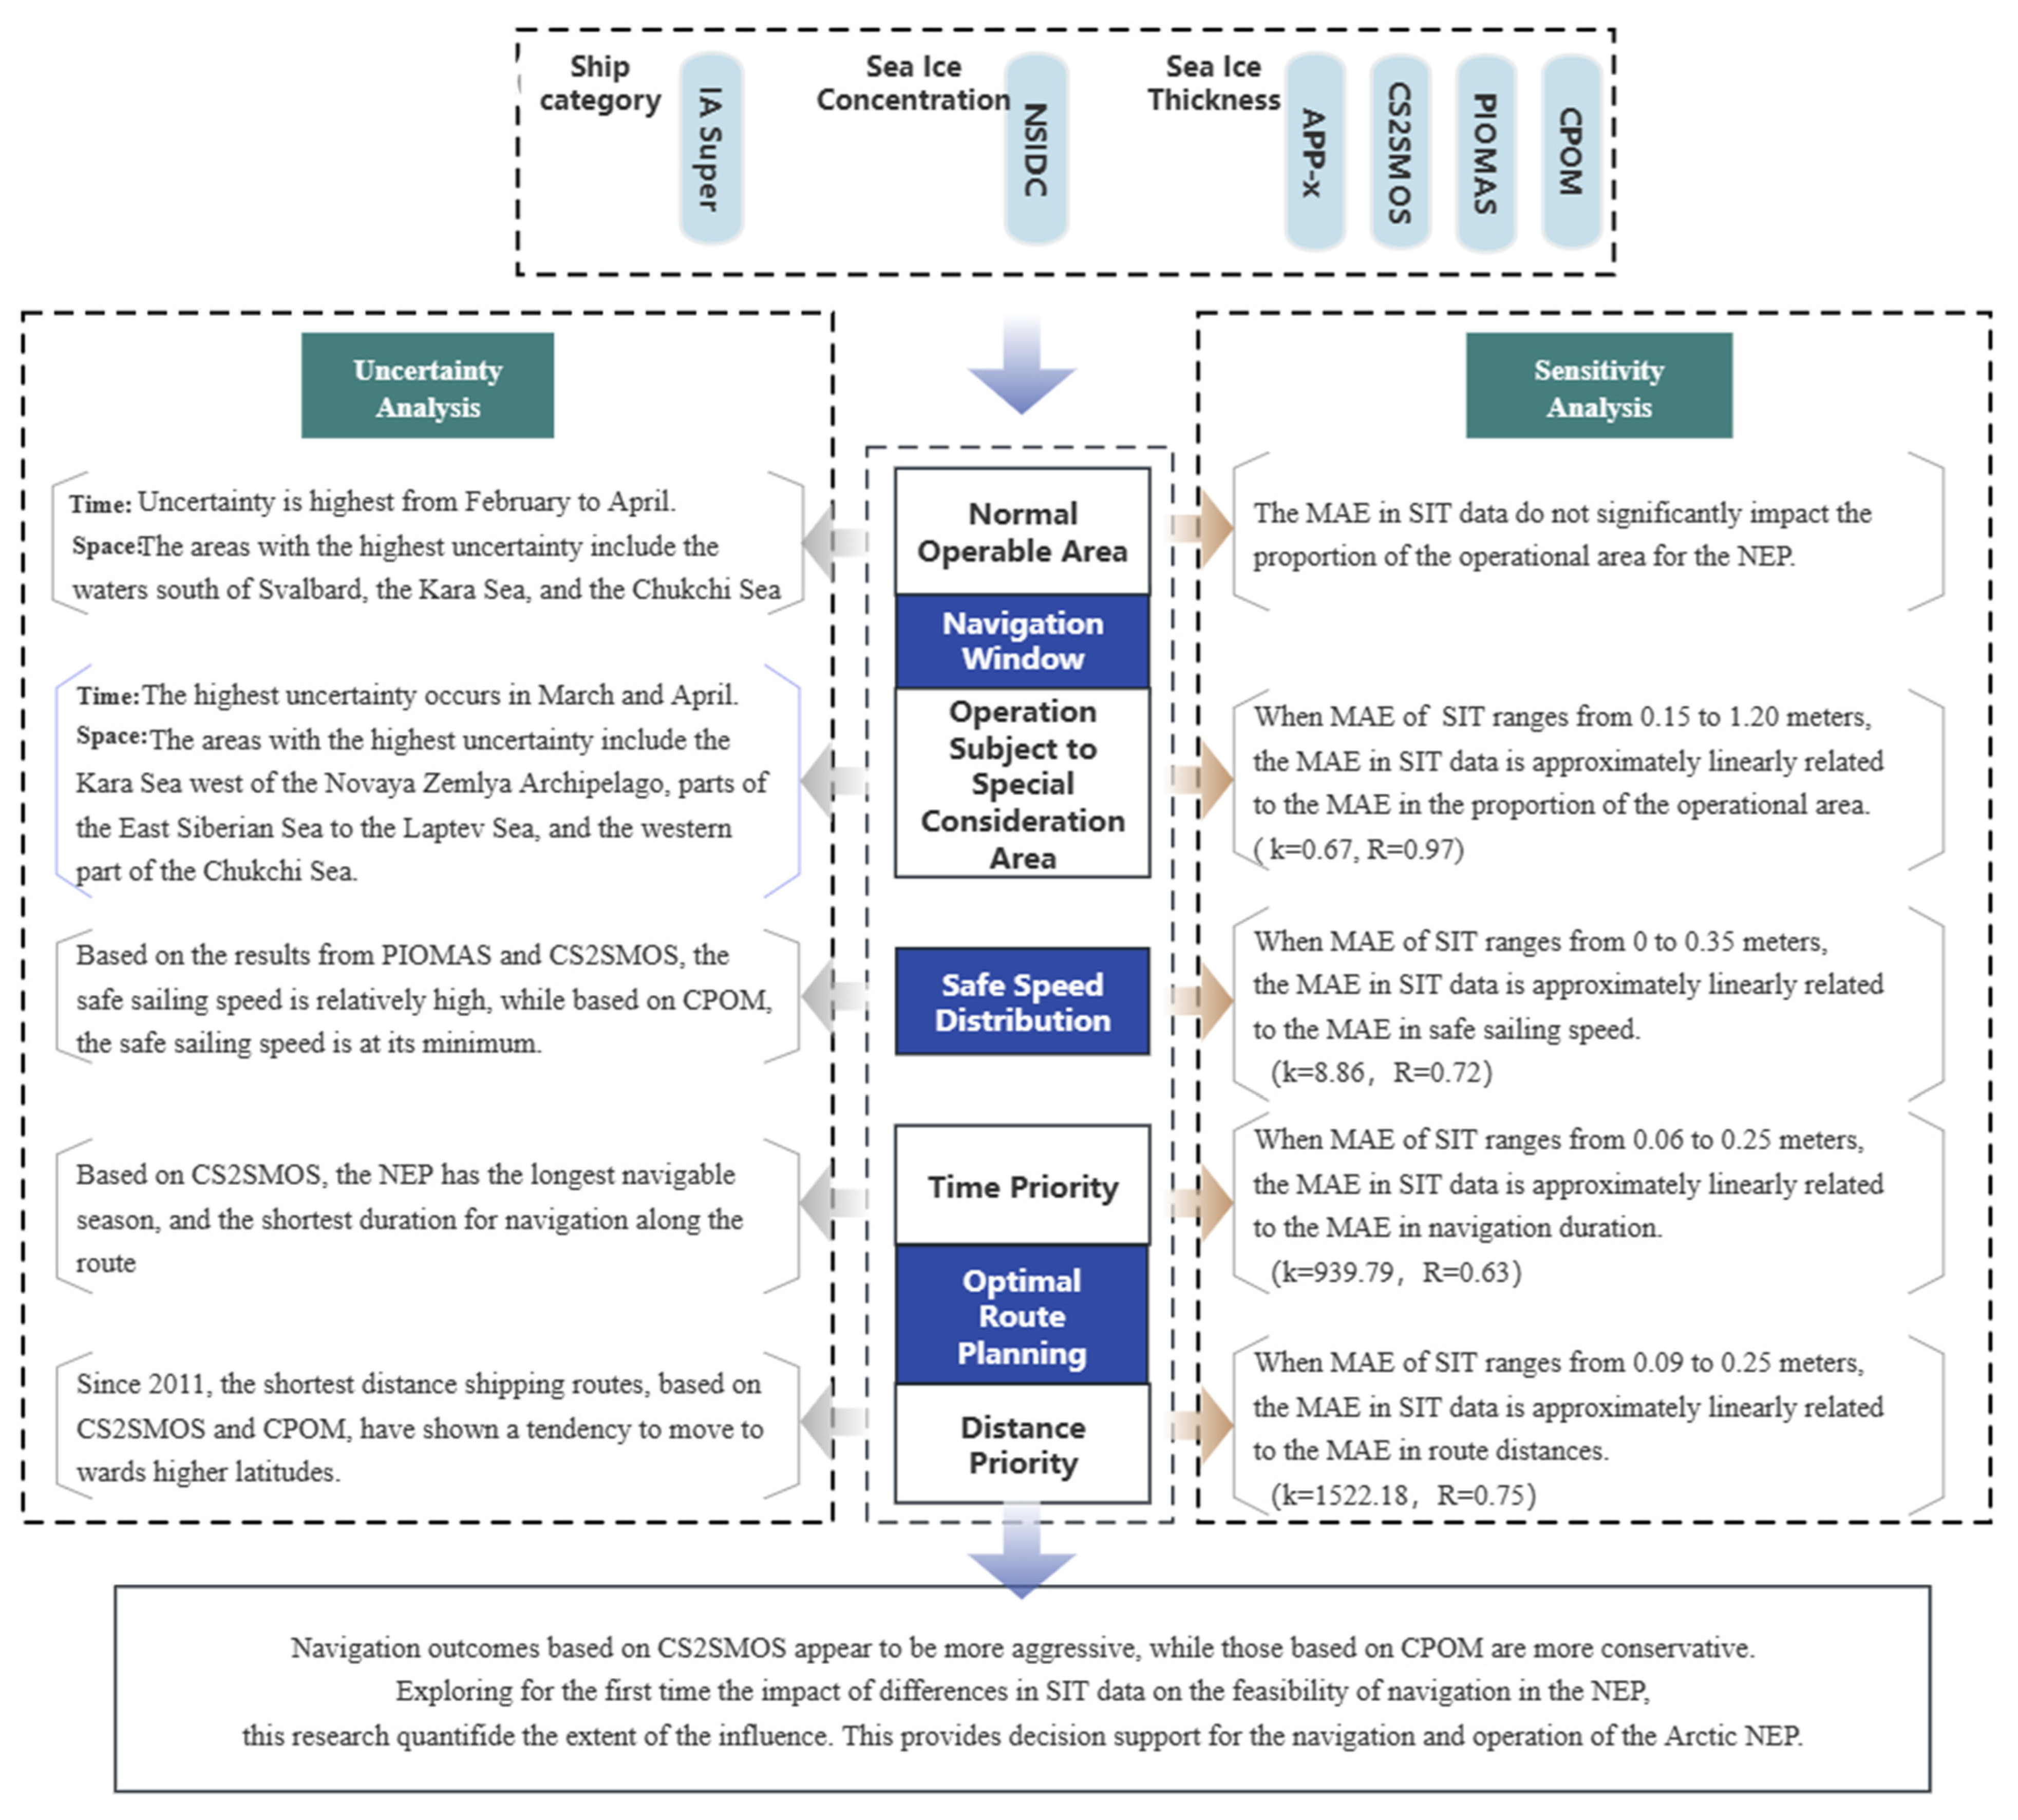
Disclaimer/Publisher’s Note: The statements, opinions and data contained in all publications are solely those of the individual author(s) and contributor(s) and not of MDPI and/or the editor(s). MDPI and/or the editor(s) disclaim responsibility for any injury to people or property resulting from any ideas, methods, instructions or products referred to in the content. |
© 2024 by the authors. Licensee MDPI, Basel, Switzerland. This article is an open access article distributed under the terms and conditions of the Creative Commons Attribution (CC BY) license (https://creativecommons.org/licenses/by/4.0/).