Article

Development of Single-Nucleotide Polymorphism Markers and Population Genetic Analysis of the Hadal Amphipod Alicella gigantea across the Mariana and New Britain Trenches

by
Lei Chen
1,2,
Shouwen Jiang
3,4,
Binbin Pan
2 and
Qianghua Xu
1,2,3,*
1
Key Laboratory of Sustainable Exploitation of Oceanic Fisheries Resources, Ministry of Education, College of Marine Living Resource Sciences and Management, Shanghai Ocean University, Shanghai 201306, China
2
Shanghai Engineering Research Center of Hadal Science and Technology, Shanghai Ocean University, Shanghai 201306, China
3
International Research Center for Marine Biosciences (Ministry of Science and Technology), Shanghai Ocean University, Shanghai 201306, China
4
Key Laboratory of Exploration and Utilization of Aquatic Genetic Resources, Ministry of Education, Shanghai Ocean University, Shanghai 201306, China
*
Author to whom correspondence should be addressed.
J. Mar. Sci. Eng. 2024, 12(7), 1117; https://doi.org/10.3390/jmse12071117
Submission received: 10 June 2024 / Revised: 29 June 2024 / Accepted: 1 July 2024 / Published: 3 July 2024

Abstract

:
Alicella gigantea, the largest amphipod scavengers found to date, play key roles in the food web of the hadal ecosystem. However, the genetic structure of A. gigantea populations among different trenches has not been reported yet. In this study, SNP (single-nucleotide polymorphism) markers were developed for three A. gigantea geographic populations collected from the southern Mariana Trench (SMT), the central New Britain Trench (CNBT), and the eastern New Britain Trench (ENBT), based on the SLAF-seq (specific locus amplified fragment sequencing) technology. A total of 570,168 filtered SNPs were screened out for subsequent population genetic analysis. Results showed that the inbreeding levels across the three geographic populations were relatively low, and the genomic inbreeding coefficients of the three populations were similar in magnitude. Based on the results of phylogenetic analysis, population structure analysis, and principal component analysis, it is believed that the three A. gigantea geographic populations belong to the same population, and the kinship relationship between the ENBT and CNBT populations is close. Moreover, the differential candidate adaptive sites on the SNPs suggest that there may be variations in metabolic rates among the three geographic populations, possibly linked to differences in food availability and sources in different trenches, ultimately resulting in different survival strategies in A. gigantea populations within distinct trenches. Compared with the Mariana Trench, the New Britain Trench has a richer organic matter input, and it is speculated that the A. gigantea Mariana Trench population may adopt a lower metabolic rate to cope with the harsher environment of nutrient deficiency.

1. Introduction

The hadal zone refers to the area in the ocean that is more than 6000 m in depth, formed by the subduction of the oceanic plate towards the continental plate [1]. The deepest part of the hadal zone can reach 11,000 m, accounting for 45% of the entire ocean depth range [2]. The hadal zone is mainly a trench zone, and its characteristics of high hydrostatic pressure, low temperature, darkness, and low organic matter have created a unique ecosystem on Earth, with high hydrostatic pressure being its main feature [3,4,5,6]. The hadal region was once considered an “ecological desert”, but with the improvement of deep-sea technology, especially deep-sea diving technology, hadal science is receiving more and more attention from countries around the world, becoming a hotspot in international deep-sea research [7].
Amphipods, as one of the protagonists in the hadal zone, have a long evolutionary history and a wide variety of species. They are widely distributed in the range of 0 to 11,000 m. They are capable of locating and feeding on the remains of organisms. The productivity of the upper water column significantly affects the food sources of hadal amphipods [8,9,10]. Different trenches or different parts of a trench exhibit significant differences in the requirements of hadal amphipods for carrion, surface debris, and microbial organic carbon [11]. Amphipods are relatively easy to collect in the hadal zone, making them a common research subject for studying the adaptive mechanisms of organisms in extreme hadal environments [12].
Alicella gigantea, a member of the Amphipoda order and Alicellidae family, is a scavenger and the largest known species of amphipod. It is a participant in the food web of deep-sea ecosystems and is distributed over a wide range of bathymetric and geographic areas [13,14,15]. A. gigantea mainly inhabits the deep-sea plains in the North Atlantic and the vicinity of the Hawaiian Islands in the North Pacific. Adult A. gigantea can reach a body length of 240 to 340 mm [12,16,17]. There is a viewpoint that suggests that under a low temperature and high hydrostatic pressure, cell size and lifespan tend to increase, which may be one of the reasons for the gigantism of A. gigantea [18]. Recently, through transcriptome comparison and evolutionary analysis regarding the hadal “supergiant” A. gigantea and the hadal small-sized amphipods, researchers identified positively selected genes (PSGs) solely in the “supergiant” A. gigantea. These PSGs were found to be involved in inositol phosphate metabolism, insulin signaling, and glycogenesis signaling, which might be the possible gigantism mechanisms of the hadal “supergiant” A. gigantea [18]. Hadal amphipods have remarkably large genomes, ranging from 4.04 Gb in Paralicella caperesca to 34.02 Gb in A. gigantea. The huge genome of A. gigantea makes it cumbersome and challenging to investigate its adaptation to the hadal zone and the mechanisms behind its gigantism [19].
Given that A. gigantea is the largest known amphipod found to date, it has attracted a great deal of scientific research interest. Li et al. compared A. gigantea with shallow-water amphipod species at the transcriptome level to explore its hadal adaptation strategies [20,21]. They also found that the concentration of trimethylamine oxide (TMAO), an important osmoregulatory substance, in the eggs of hadal amphipods is significantly higher than in shallow-water species. This may enhance the adaptability of hadal amphipod eggs to the hadal environment [20,21]. Classification surveys of the gut microbiota of A. gigantea, Hirondellea gigas, and Scopelocheirus schellenbergi, three hadal amphipod species, detected a large number of probiotic bacteria, indicating that these probiotic bacteria may contribute to the growth and development of the hosts, promoting the adaptation of amphipods to extreme environments [4,22]. Studies also attempted to explore the unique aspects of growth and development in the hadal environment based on the mitochondrial genomes of A. gigantea and the accumulation of trace elements in their bodies [13,23]. Furthermore, based on mitochondrial DNA linkage data sets (COI and 16S rRNA genes) from three amphipod species (A. gigantea, H. gigas, and S. schellenbergi) collected from three isolated trenches, genetic diversity and intraspecific population differentiation among these three amphipod species were described. The results suggested that the formation of amphipod population structures may be the result of multiple factors including high hydrostatic pressure, food distribution, trench topography, and potential ecological interactions [24]. However, the genetic structure of A. gigantea populations among different trenches has not been reported yet.
To better study the evolutionary relationships and population genetic structure among A. gigantea populations in different trenches, it is necessary to develop genome-wide markers in addition to using single-gene mitochondrial markers. Therefore, our study first developed SNP (single-nucleotide polymorphism) markers from the genome of A. gigantea based on the SLAF-seq (specific locus amplified fragment sequencing) technology. SLAF-seq is a simplified genome sequencing technology based on enzyme cutting sites, which has the advantages of high throughput, long effective reads, high accuracy, good repeatability, and no need for a reference genome [25]. SLAF-seq technology can develop a large number of genome-wide SNP markers, which can be used to estimate genomic inbreeding and relatedness. Meanwhile, these genome-wide SNPs can also be used for analyzing population genetic relationships such as phylogenetic trees and genetic structures. SLAF tags have shown excellent performance in molecular breeding and germplasm resource protection, and have been widely used for the fine mapping of quantitative trait loci (QTLs) on linkage maps. For example, by using SLAF-seq, researchers constructed a high-density genetic map for the Pacific white shrimp (Litopenaeus vannamei), including 17,338 polymorphic markers. They identified a QTL related to ammonia tolerance and, combined with transcriptome analysis, discovered candidate genes associated with ammonia tolerance [26]. In chrysanthemum, a high-density genetic linkage map was constructed using SLAF-seq to locate QTLs that control flower traits, laying the foundation for molecular marker-assisted breeding and candidate gene digging for flower types [27]. Researchers used SLAF-seq to develop 15,396 genome-wide SNP markers to investigate the genetic relationships of Sichuan taimen (Hucho bleekeri) populations in the same river basin, providing insights for conservation and breeding strategies [28]. The three populations (A, B, and C) of 43 H. bleekeri samples were collected from the upper reaches of the Taibai River, which was isolated by a hydropower station. In the study, the low levels of genomic inbreeding and relatedness, estimated through genome-wide SNPs, indicated that a relatively large number of sexually mature individuals were involved in reproduction. Genetic structure analysis showed that there is a negative correlation between genomic differentiation and geographic distance among the three populations, and the fish at site A can be considered genetically independent of the other two sites [28].
Here, we used genome-wide single-nucleotide polymorphism (SNP) markers generated by the SLAF-seq (specific locus amplified fragment sequencing) technology to assess the population genetic patterns among three A. gigantea geographic populations collected from the southern Mariana Trench (SMT), the central New Britain Trench (CNBT) and the eastern New Britain Trench (ENBT). The Mariana Trench is considered the deepest trench in the world, with its deepest point (Challenger Deep) reaching approximately 11,034 m, and the hydrostatic pressure at its bottom reaching 110 MPa [29,30]. The main morphological features at the bottom of the Mariana Trench are primarily influenced by plate tectonics. The bottom of the trench is covered with deep-sea and semi-deep-sea sediments predominantly composed of diatomaceous mud [31]. New Britain Island is located in the southwestern Pacific Ocean, and there is an underwater depression on the south side of the island, which is the location of the New Britain Trench. The New Britain Trench roughly extends in an east–west direction, with a length of about 750 km and an average width of 40 km. Studies have shown that in the New Britain Shelf–Trench continuum, sediments at a depth between 1553 and 8901 m receive a significant input of soil organic matter, including a mixture of algae and terrestrial C3 vascular plants [32]. The aim of this project is to unfold the population genetic structure of hadal “supergiant” A. gigantea from two hadal trenches (Mariana Trench and New Britain Trench), to reveal genetic differences among different geographical populations at the whole genome level, to explore survival strategies and evolutionary differences among different populations, and to determine the influence of environmental factors on population-level variation.

2. Materials and Methods

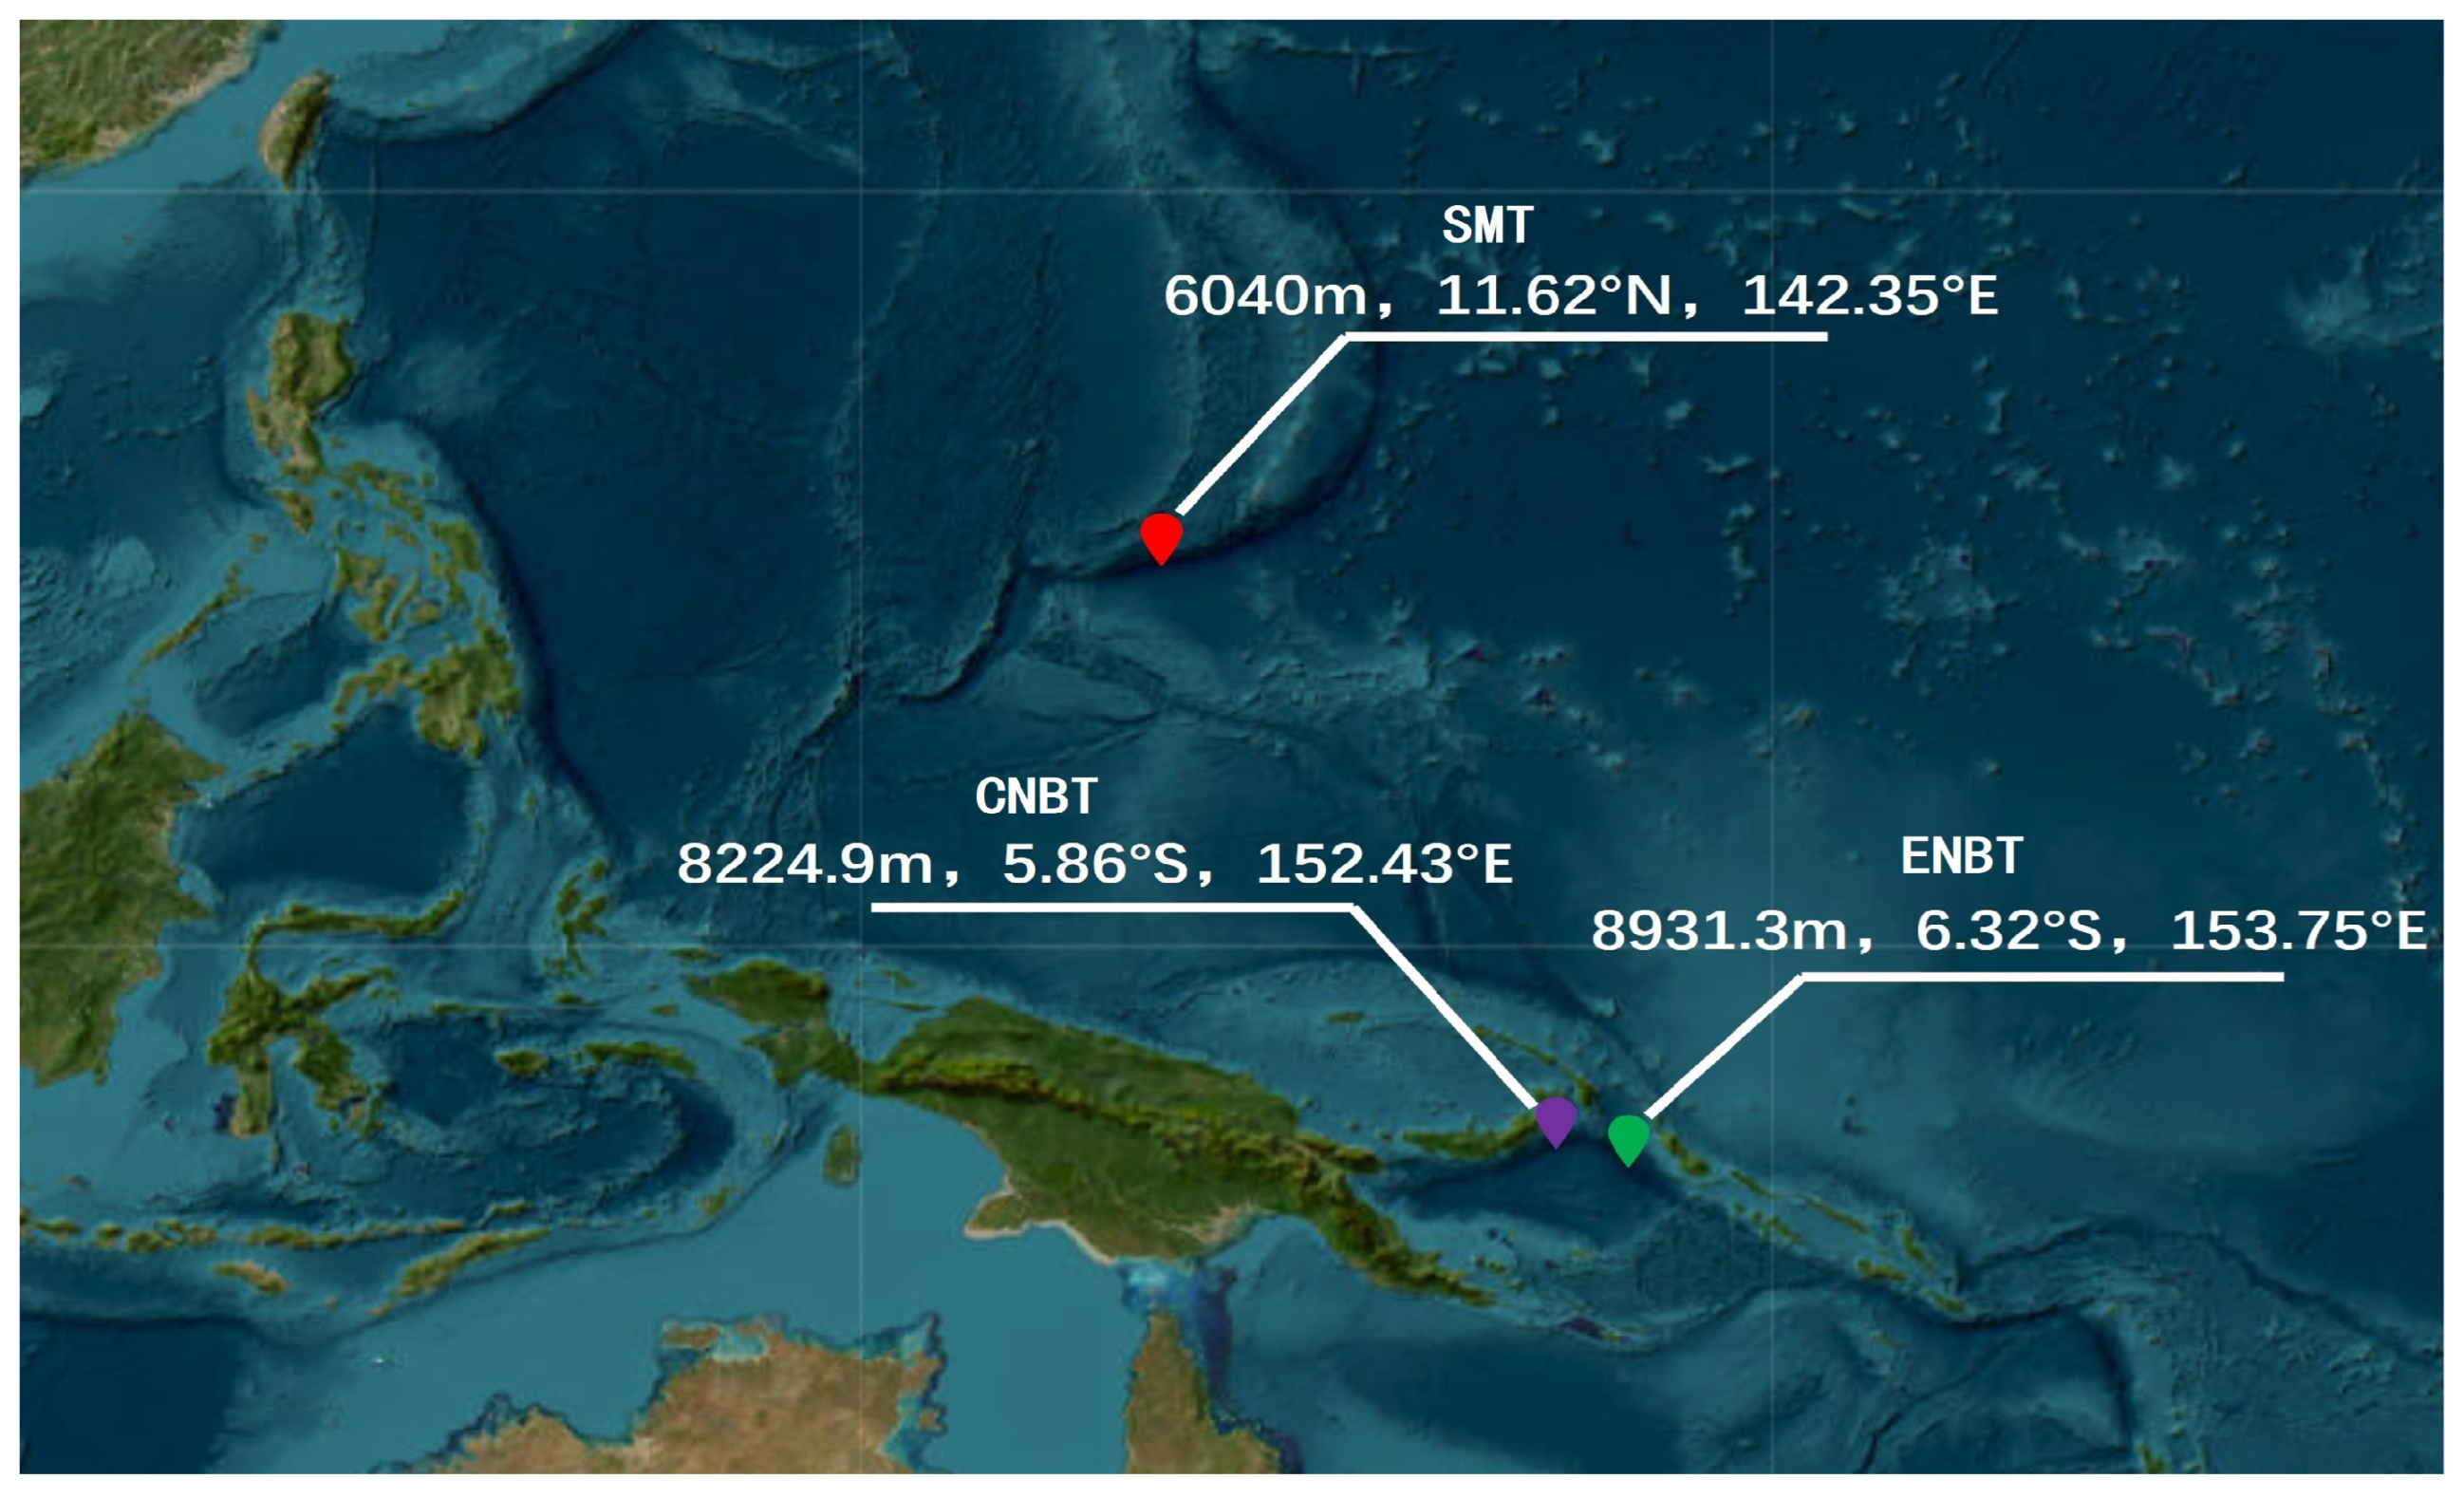
2.1. Sample Collection

Thirty A. gigantea samples used in this study were collected during the sampling campaigns of the “Zhang Jian” and “Shen Kuo” research vessels in 2017 and 2018. Table 1 show relevant information about these sampling campaigns. Automatic deep-sea landers were used to collect samples from the eastern (ENBT, 6.32° S, 153.75° E, 8931.3 m) and central (CNBT, 5.86° S, 152.43° E, 8224.9 m) New Britain Trench and the southern Mariana Trench (SMT, 11.62° N,142.35° E, 6040 m) (Table 1 and Figure 1). The landers were equipped with two cylindrical traps baited with a moderate amount of mackerel. The landers were deployed from the research vessels and remained on the seabed for up to 10 h. After the landers were retrieved, the amphipods were immediately frozen at −80 °C until analysis.

2.2. SLAF Sequencing and Genotyping

Genomic DNA was extracted from the tail muscle tissue of 30 A. gigantea individuals using the TIANamp Marine Animals DNA Kit (Tiangen, Beijing, China). Using the Illumina HiSeq 2500 platform, specific locus amplified fragment sequencing (SLAF-seq) was performed for simplified sequencing [25,33]. Two restriction endonucleases, RsaI and HaeIII, were used to generate SLAF tags with fragment lengths ranging between 450–480 bp [34]. To ensure high-quality analysis, a read length of 126 bp × 2 was used for subsequent analysis.
The maximum depth sequence of each SLAF tag was selected as the reference sequence, and BWA-0.7.15 software was used to align sequencing reads to the reference sequence [35]. Then, GATK-4.1.3.0 and SAMtools-1.10 software were used to develop SNP markers [36,37], and the intersection of results was taken as a reliable dataset for subsequent analysis [38,39]. If there were sequence differences in the same SLAF tag among 30 different A. gigantea samples, this SLAF tag could be defined as polymorphic [40].
After filtering by QUAl value > 30 (minQ = 30), completeness (max-missing) = 1 with no missing data allowed, minor allele frequency (maf) ≥ 0.05, and Hardy–Weinberg Equilibrium (hwe) ≥ 0.01, a total of 570,168 SNP markers with high consistency were selected for subsequent analysis by using VCFtools-0.1.16 [38].

2.3. Genetic Population Analysis Regarding the Three A. gigantea Geographic Populations

The genomic inbreeding coefficients (F) of individuals from three populations were calculated using PLINK-1.9 software [41]. In this study, the genomic inbreeding coefficient (F) was calculated based on SNP homology [28].
Based on the developed set of 570,168 SNP markers, the P-distance matrix was calculated using VCF2Dis [42,43]. Then, a phylogenetic tree of 30 A. gigantea samples was constructed using VCF2Dis-1.45 and PHYLIPNEW-3.69.660 (https://github.com/hewm2008/VCF2Dis/blob/main/Install.NJ.cn.md, accessed on 20 June 2024) based on neighbor-joining method with 1000 bootstrap replicates [44], which was displayed using iTOL (https://itol.embl.de/, accessed on 20 June 2024).
The genetic structure of three A. gigantea geographic populations was analyzed using Admixture-1.3.0 software [45]. Clustering was performed based on the assumption of 1–5 subpopulations (K) among the 30 A. gigantea individuals, and the cross-validation error rate (CV) was calculated for K = 1–5. A line graph was plotted using the CV values, and the recommended optimal number of subpopulations corresponded to the value of K with the lowest CV.
Principal component analysis (PCA) was performed using PLINK-1.9 software to analyze the kinship relationships among 30 A. gigantea individuals [41]. The ggplot2 and patchwork packages in R-4.2.2 were used for data visualization.

2.4. Environmental Adaptation Locus Screening and Functional Annotations

The vcf file format of SNP loci was converted to the input format of Bayenv2 software using PGDSpider2 [46]. Bayenv2 software was used for screening environmental adaptation loci [47,48,49,50]. Bayenv2 uses an MCMC algorithm and can quickly screen adaptive evolution loci by combining the grouping of three A. gigantea populations and the geographic environmental information (sampling depth in this study) of three sampling sites.
Then, the eggNOG-mapper v2.1.7 tool was used to perform the functional annotation of SLAF tags containing environmental adaptation loci [51]. The annotation results from the KEGG, GO, and KOG databases were compiled and analyzed.

3. Results

3.1. SLAF Sequencing and Genotyping

SLAF sequencing was performed on 30 samples of A. gigantea from three geographic populations collected from the southern Mariana Trench (SMT), as well as the central New Britain Trench (CBNT) and eastern New Britain Trench (ENBT), resulting in 320.03 Mb of read data, boasting a Q30 percentage of 93.97% and an average GC percentage of 39.67% among the sampled reads (Table S1). A total of 4,634,945 SLAF tags were obtained, with an average sequencing depth of 56.94X (Table S2). Among these tags, 1,560,252 were found to be polymorphic with SNP loci, resulting in a total of 11,343,886 SNPs (Table S3). Then, 570,168 SNP markers were filtered out with high consistency for subsequent population genetic analysis.

3.2. Genomic Inbreeding Level Estimation and Phylogenetic Analysis Regarding the Three Geographic Populations

The average genomic inbreeding coefficient ( F ) indicates that the level of inbreeding in the entire isolated population is at a low level ( F = −1.42 × 10⁻¹ ± 0.071). The average inbreeding coefficients of the three A. gigantea populations in our study are negative values close to zero. The genomic inbreeding coefficients of the three populations are similar, with the XZ population having the highest genomic inbreeding coefficient, with an average inbreeding coefficient of F = −1.13 × 10⁻¹ ± 0.091 (Table 2 and Figure 2a). Meanwhile, the absolute value of F of the EBNT population is significantly higher than that of the SMT and CNBT populations, while there is no significant difference between the CNBT and SMT populations.
A neighbor-joining phylogenetic tree of 30 A. gigantea samples was constructed with 1000 bootstrap replications (Figure 2b). Among the 30 individuals, 10 individuals from the SMT population clustered together in one branch. In the phylogenetic tree, ENBT-1 and ENBT-10 from the ENBT population were mixed with the CNBT population, indicating a close genetic distance between the geographically close CBNT and ENBT populations, suggesting potential individual migration and gene flow between the two geographic populations. The branch lengths on the phylogenetic tree showed that the ENBT population is genetically closer to the CNBT population and farther from the SMT population (Figure 2b).

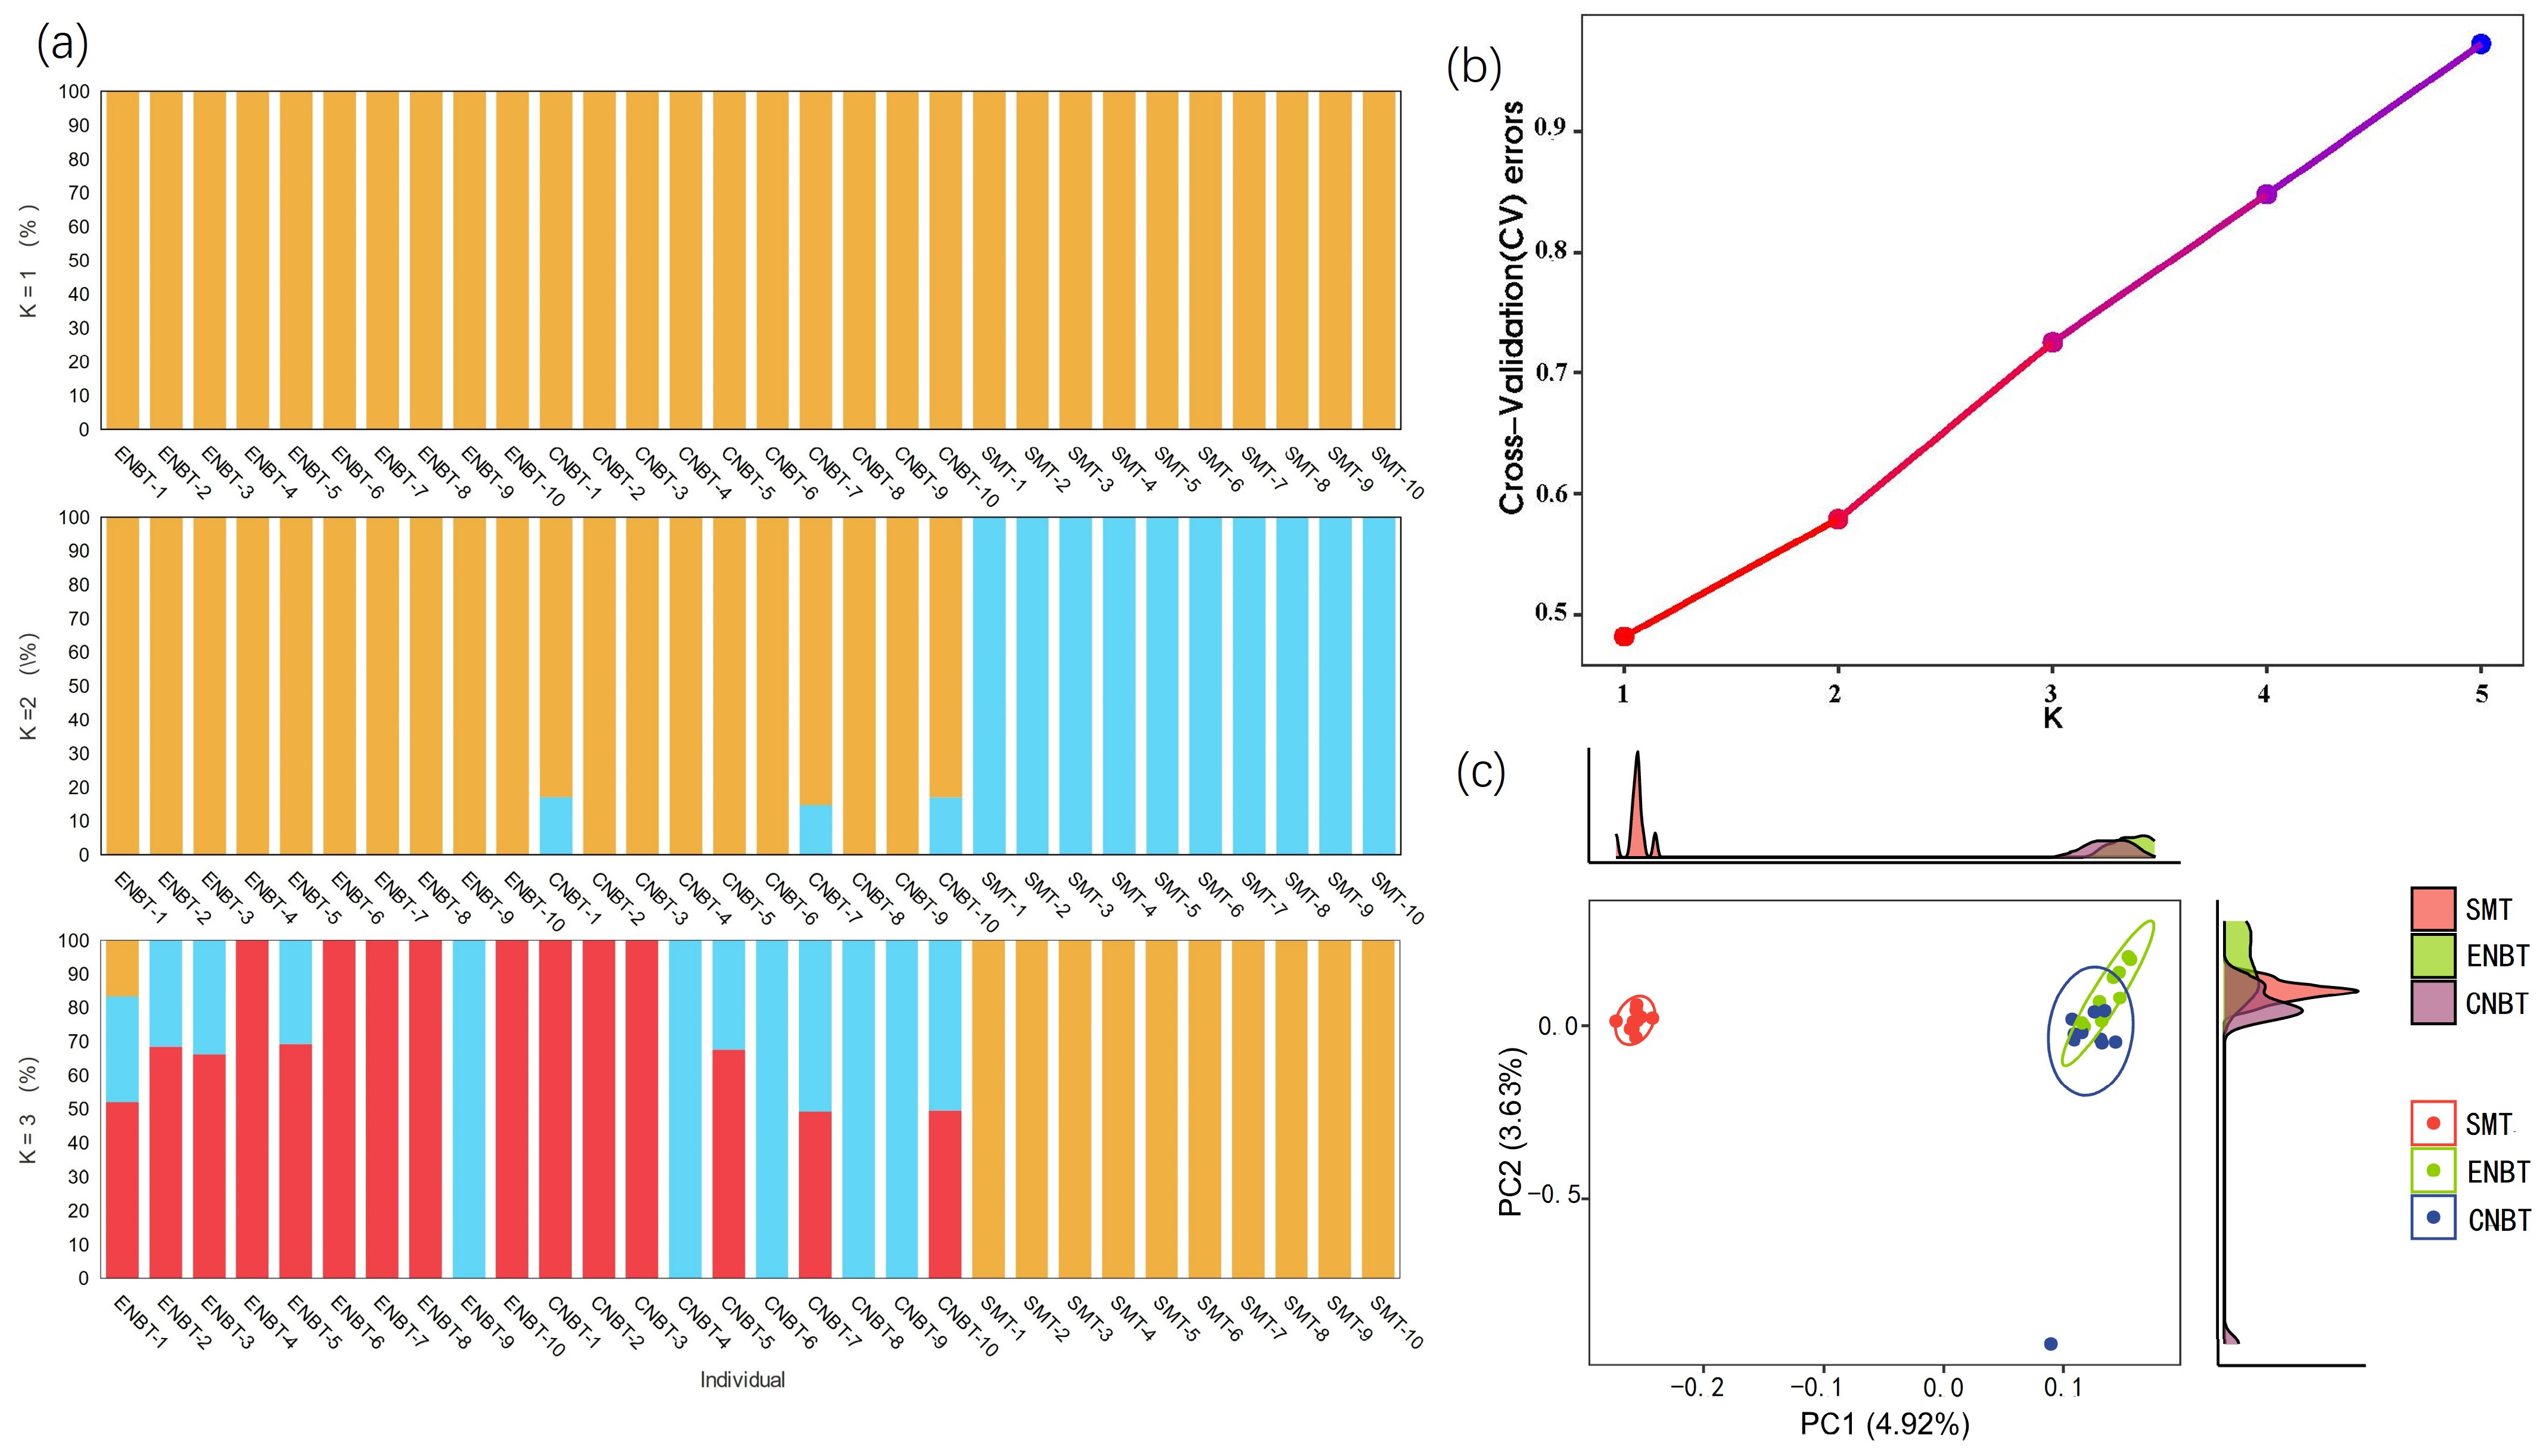
3.3. Population Structure Analysis and Principal Component Analysis Regarding the A. gigantea Geographic Populations

The CV-K line chart shows that the lowest CV value is obtained when K = 1 (Figure 3a,b), indicating relatively small genetic differences between the 30 A. gigantea individuals. This suggests that there is no significant population genetic differentiation among the three A. gigantea geographic populations (ENBT, CNBT, and SMT), and one is the optimal number of clusters. Therefore, the three populations can be considered as belonging to the same subpopulation.
Principal component analysis (PCA) was performed using the PLINK-1.9 software to calculate the values of the first three principal components (PC1, PC2, and PC3), as well as the variance contribution rates of PC1, PC2, and PC3. The computed variance contribution rates for PC1, PC2, and PC3 were 4.92%, 3.63%, and 3.5%, respectively.
A two-dimensional plot was generated using PC1 and PC2 (Figure 3c), which showed that the 10 individuals from the SMT population clustered together, while the ENBT and CNBT populations were more mixed. It was strange to see that one individual, CNBT-8, was identified as an outlier in the CNBT population and was distant from all three populations (Figure 3c).

3.4. Screening of the Environmental Adaptation Loci from the A. gigantea Geographic Populations

A scatter plot was generated using the SNP position information (as there was no reference genome available, the order of SNPs was not considered in the analysis) and the Bayes factor (log base 10) for each SNP locus obtained from the results of the Bayenv2 analysis (Figure 4). The larger log10(BF) values indicate the more reliable loci.
Bayenv2 software was used to detect the correlation between SNP loci and environmental factor (sampling depth information), where log10(BF):0.5–1 = substantial evidence; 1–2 = strong evidence; and >2 = decisive. A blue dashed line represents log10(BF) = 0.5 and a red dashed line represents log10(BF) = 1. The x-axis represents the position of the SNP, and the y-axis represents the log10(BF) value.
Out of 570,168 SNP loci, there were 33 SNPs with log10(BF) > 2, 157 SNPs with log10(BF) between 1 and 2, and 448 SNPs with log10(BF) between 0.5 and 1. In total, there were 638 SNP loci with log10(BF) > 0.5, corresponding to 627 SLAF tags for downstream functional annotation analysis.

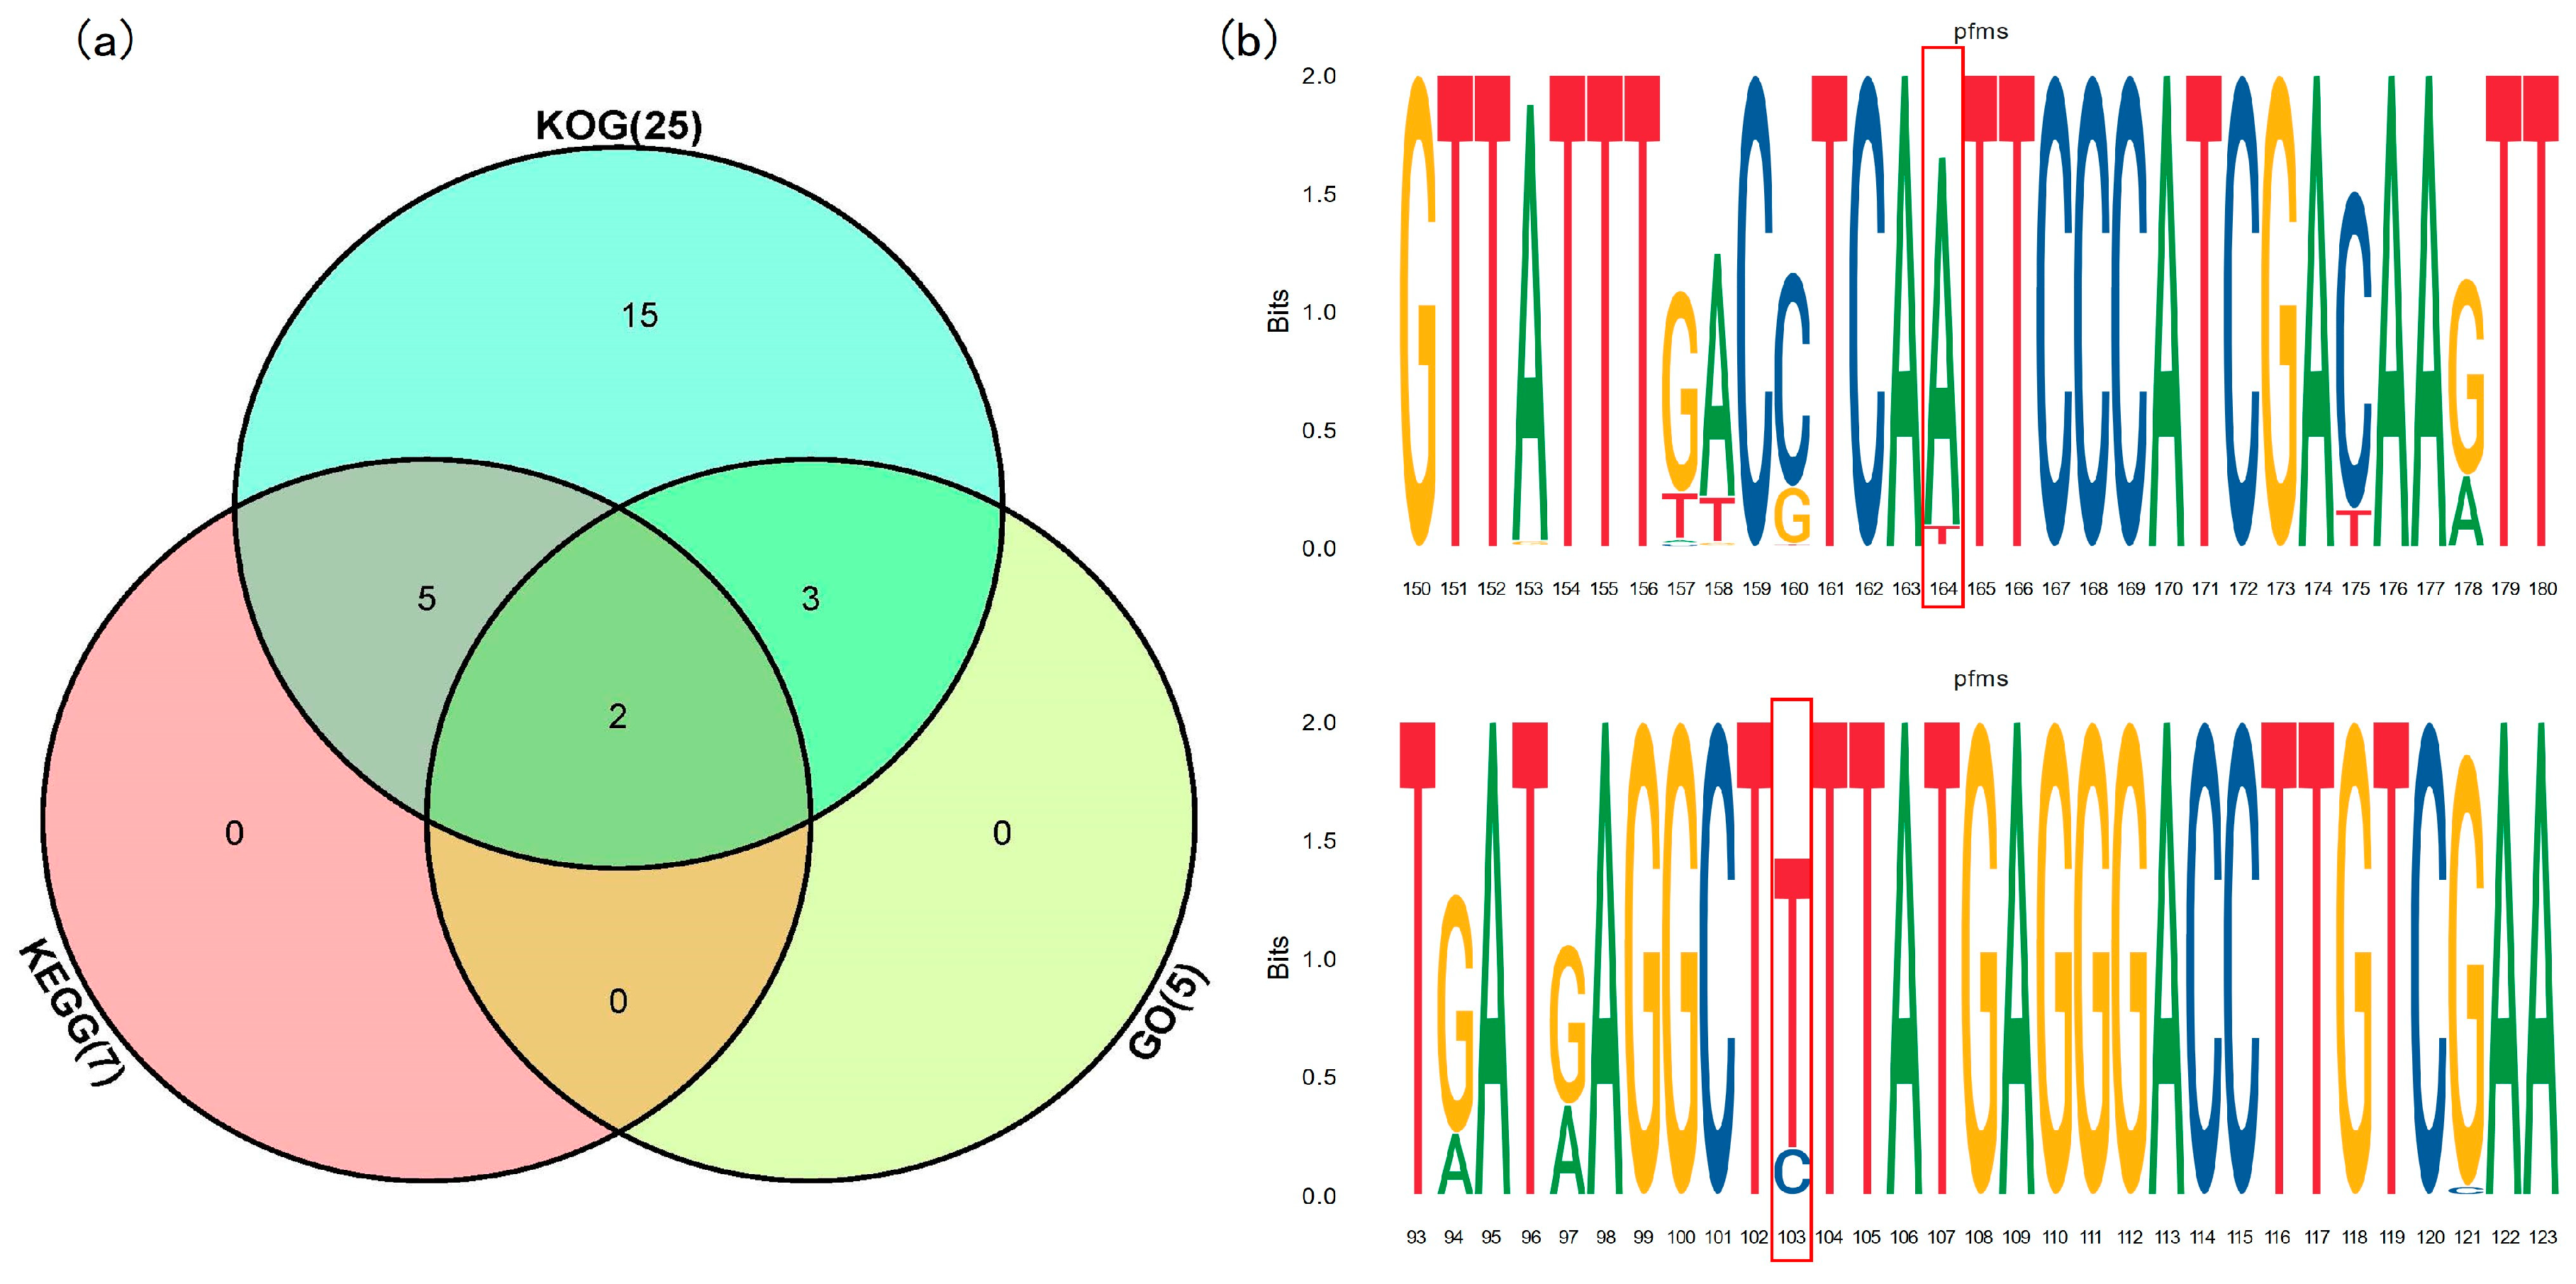
3.5. Functional Annotation of the Environmental Adaptation Loci

Among the 627 SLAF tags, 25 tags were annotated to subcategories of six KOG protein databases (Figure 5a). The subcategory with the greatest number of genes was “General function prediction only”, which contained 20 SLAF tags, accounting for 80% of the total. The other subcategories including “Transcription”, “Replication, recombination and repair”, “Chromatin structure and dynamics”, “Signal transduction mechanisms”, and “Carbohydrate transport and metabolism” matched only one gene each.
Among the 627 SLAF tags aligned to the KEGG database, a total of seven tags were annotated to 15 metabolic pathways (Table 3). Among them, “Cytosolic DNA-sensing pathway”, “RNA polymerase”, and “Metabolic pathways” had annotations for three SLAF tags each. In terms of KEGG’s A-level classification, five SLAF tags were annotated to “Organismal Systems” and six were annotated to “Metabolism” (Figure 5b).
GO functional annotation is divided into three main categories: biological process (BP), molecular function (MF), and cellular component (CC) (Figure 5c). BP is further divided into 21 subcategories, MF is divided into 6 subcategories, and CC is divided into 9 subcategories. The most commonly annotated genes were in the “cellular process” subcategory of BP and the “organelle”, “cell”, and “cell part” subcategories of CC.
Then, the 627 SLAF tags were annotated by aligning them to KOG, KEGG, and GO databases. A total of 7 tags were annotated in the KEGG database, 25 tags were annotated in the KOG database, and 5 tags were annotated in the GO database. Two tags were commonly annotated in all three databases (Figure 6a,b and Table 4). Two tags are numbered as Marker63205 and Marker137036 in the sequencing data. The selected SNP for sequence Marker63205 is located at the 164th base, while the selected SNP for sequence Marker137036 is located at the 103rd base.
Marker63205 encodes SLC3A2 (solute carrier family 3 member 2), which belongs to the SLC3 family of type II transmembrane glycoproteins [52,53]. Marker137036 encodes SphK (sphingosine kinase), which is an important rate-limiting enzyme and intracellular signaling enzyme [54]. Marker63205 and Marker137036 might indicate the most differentiations between the A. gigantea geographic populations.

4. Discussion

The distribution and evolutionary mechanisms of multicellular organisms in the hadal environment have long been a focus of scientific inquiry. It is commonly believed that the hadal zone consists of a series of isolated island-like habitats, although the concept has been challenged by the pan-ocean distribution of some fauna. However, the validity of pan-ocean distribution at the population genomic level remains to be tested. Recently, researchers collected samples of the amphipod Bathycallisoma schellenbergi from 12 hadal features across the Pacific, Atlantic, Indian, and Southern oceans and conducted the genetic population analysis study regarding those samples. The results showed that despite the wide distribution of B. schellenbergi worldwide, population connectivity is highly restricted by habitat topography, with limited gene flow occurring only between geographically connected areas [55]. The relatively shallow seafloor divides the hadal zone into relatively isolated regions, and even populations of the same species in different hadal zones follow different evolutionary trajectories. Earlier studies regarding the amphipod Hirondellea gigas collected in batches from the Philippine Trench, Mariana Trench, and Palau Trench showed low levels of gene flow between geographically isolated trench populations, leading to morphological differences [56]. This also supports the concept of relative isolation within hadal zones.
In previous studies, by using mitochondrial DNA COI and 16S rRNA gene markers, the genetic differentiation analysis of two A. gigantea populations in the central and eastern parts of the New Britain Trench showed that 99.97% of the variation could be attributed to differences within populations. These two populations exhibited low FST values (0.00032, p > 0.05) and high levels of gene flow (Nm, 784.58). Additionally, the gut microbiota between these two A. gigantea populations were highly similar [22,24].
Many researchers have used SLAF-seq technology to develop a large number of genome-wide SNP markers for population genetic analysis. For example, some researchers have used SLAF-seq to develop SNP markers for Hucho bleekeri. They used these SNPs to determine the genetic relationships of the three populations isolated by the hydropower station in the upper reaches of the Taibai River [28]. Some researchers have also used SLAF-seq to conduct whole-genome screening to investigate genetic diversity in Shandong indigenous pig breeds and Western pig breeds. The study showed that Duroc pigs had clear genetic relationships with Dapulian pigs (DPL) and Laiwu pigs (LW). Through selective sweep analysis, a total of 162 differentially selected regions (DSRs) with 841 genes and 157 DSRs with 707 genes were identified in DPL and LW, respectively. The subsequent gene annotation of the selected regions identified a series of genes regulating immunity and fat deposition [57]. In this study, phylogenetic analysis, population structure analysis, and PCA all indicated that the ENBT and CNBT populations exhibited significant genetic distance from the SMT population (Figure 2 and Figure 3). The CNBT and ENBT populations were sampled from the central and eastern parts of the New Britain Trench, with similar sampling depths, while the SMT population was sampled from the Mariana Trench. The ENBT and CNBT populations showed closer genetic distances in the kinship analysis, indicating a close genetic relationship due to their geographical proximity. In contrast, the SMT population exhibited a greater genetic distance. Geographic distance and genetic distance displayed a positive correlation. The ENBT and CNBT populations showed a high degree of admixture in the kinship analysis (Figure 2), which is consistent with previous studies [22,24].
From this study, the ENBT and CNBT populations still maintained a certain genetic distance in the phylogenetic tree (Figure 2), which is inconsistent with the depth-differentiation hypothesis [58]. The depth-differentiation hypothesis suggests that as depth increases and topography decreases, environmental heterogeneity and gene flow barriers are weakened, and some studies have supported this hypothesis [59,60,61]. However, as more species from isolated hadal environments, such as mid-ocean ridges and fracture zones, are deeply studied, the depth-differentiation hypothesis is coming under scrutiny and is being increasingly challenged [62]. For example, researchers collected samples of the amphipod Hirondellea gigas from depths exceeding 8000 m in the Mariana Trench and used RAD sequencing to identify loci containing SNPs, with the discriminant analysis of principal components (DAPC) revealing a significant correlation between outlier SNP-containing loci and latitude and depth [63], which challenges the depth-differentiation hypothesis. In addition, in a global-scale study exploring the genetic diversity of Eurythenes gryllus using nuclear (28S rDNA) and mitochondrial (COI, 16S rDNA) sequence data, researchers found that abyssal lineages exhibited higher diversity, contradicting the depth-differentiation hypothesis [64].
Theoretically, the values of the inbreeding coefficient (F) based on genomic heterozygosity should range from 0 to 1 as positive numbers. However, software calculations often yield negative values due to random sampling errors caused by the presence of multiple heterozygotes in the samples [41]. Considering that a significant number of negative values were obtained for the calculation of the inbreeding coefficient (F) of 30 individuals, it can be speculated that the populations of A. gigantea at the three sampling sites are relatively large, with a higher number of mature individuals available for reproduction and mating, resulting in a lower true level of inbreeding and an increased presence of negative values due to random sampling errors. Although this study obtained a substantial amount of reliable SNPs through SLAF-seq, obtaining 320.03 Mb of read data, the genome size of A. gigantea is 34.02 Gb [19]. Therefore, the coverage of SLAF tags across the entire genome is relatively low, and the uniform distribution and representativeness of SNP loci in the genome of A. gigantea, without a reference genome, remain uncertain.
In this study, besides exploring the genetic structure of amphipod populations in the Mariana Trench and the New Britain Trench, we also tried to investigate the differentiation relationship and functional differences among populations from the two trenches. Through the functional annotation of the environmentally adaptive loci, we detected two genes, SLC3A2 and SphK (Marker63205 and Marker137036), commonly annotated by the KEGG, KOG, and GO databases, and observed significantly differentiations between the Mariana Trench and the New Britain Trench hadal populations (Figure 6a,b and Table 4).
SLC3A2 (solute carrier family 3 member 2, Marker63205), which belongs to the SLC3 family of type II transmembrane glycoproteins [52,53], serves as a heavy chain component of heteromeric amino acid transporters (HATs). In cells, HATs are highly expressed and mediate almost all essential amino acid transport across the membrane to maintain stable intracellular amino acid levels, playing an important role in maintaining the normal biological functions of cells [65]. SphK (sphingosine kinase, Marker137036), which is an important rate-limiting enzyme and intracellular signaling enzyme, is used to maintain a balance of sphingosine-1-phosphate (S1P), ceramide (Cer), and sphingosine (Sph), and participates in regulating various physiological functions such as cell proliferation and apoptosis, vascular contraction and remodeling, inflammation, and metabolism [54]. It was obviously shown that these two genes are closely associated with amino acid transport, cell proliferation, and metabolism, indicating potential differences in metabolic rates among the three populations. It has been reported that amphipods in the New Britain Trench rely more on high-quality organic matter, such as carrion, while amphipods in the Mariana Trench utilize detritus and bacterial organic matter as supplementary food. The New Britain Trench has higher net primary productivity (NPP) and is more influenced by terrestrial inputs compared to the Mariana Trench [11,32]. The different environmentally adaptive loci revealed by this study might be possibly due to the variations in food abundance and sources in different trenches, which might ultimately lead to differences in the survival strategies of A. gigantea.

Supplementary Materials

The following supporting information can be downloaded at: https://www.mdpi.com/article/10.3390/jmse12071117/s1, Table S1: Sequencing data statistics of A. gigantea; Table S2: SLAF number statistics of A. gigantea; Table S3: SNP information statistics of A. gigantea; Table S4: 25 SLAF tags annotated to three databases.

Author Contributions

Data curation, L.C.; Formal analysis, L.C.; Funding acquisition, Q.X.; Methodology, B.P.; Project administration, Q.X.; Resources, S.J. and B.P.; Supervision, Q.X.; Validation, S.J.; Writing—original draft, L.C.; Writing—review and editing, Q.X. All authors have read and agreed to the published version of the manuscript.

Funding

This work was supported in part by the Funding Project of the National Key Research and Development Program of China (2018YFC0310600, 2022YFD2400800, and 2018YFD0900600) and the National Natural Science Foundation of China (31772826).

Institutional Review Board Statement

Not applicable.

Informed Consent Statement

Not applicable.

Data Availability Statement

All sequencing data associated with this project were deposited in the National Center for Biotechnology Information (NCBI) Sequence Read Archive database (BioProject Accession Number: PRJNA1052361).

Acknowledgments

We would like to thank Weicheng Cui’s and Jiasong Fang’s research group members and other people for sample collection.

Conflicts of Interest

The authors declare no conflicts of interest.

References

  1. Ding, H.; Sun, C. Towards the understanding from sea surface to hadal zone—A multidisciplinary study of the Yap Trench. J. Oceanol. Limnol. 2020, 38, 591–592. [Google Scholar] [CrossRef]
  2. Cressey, D. The Hadal Zone: Life in the Deepest Oceans. Nature 2015, 523, SB1. [Google Scholar]
  3. Weston, J.N.J.; Espinosa-Leal, L.; Wainwright, J.A.; Stewart, E.C.D.; Gonzalez, C.E.; Linley, T.D.; Reid, W.D.K.; Hidalgo, P.; Oliva, M.E.; Ulloa, O.; et al. Eurythenes atacamensis sp. nov. (Crustacea: Amphipoda) exhibits ontogenetic vertical stratification across abyssal and hadal depths in the Atacama Trench, eastern South Pacific Ocean. Mar. Biodivers. 2021, 51, 51. [Google Scholar] [CrossRef]
  4. Chan, J.; Geng, D.; Pan, B.; Zhang, Q.; Xu, Q. Metagenomic Insights Into the Structure and Function of Intestinal Microbiota of the Hadal Amphipods. Front. Microbiol. 2021, 12, 668989. [Google Scholar] [CrossRef]
  5. Zhang, W.P.; Tian, R.M.; Sun, J.; Bougouffa, S.; Ding, W.; Cai, L.; Lan, Y.; Tong, H.Y.; Li, Y.X.; Jamieson, A.J.; et al. Genome Reduction in Psychromonas Species within the Gut of an Amphipod from the Ocean’s Deepest Point. Msystems 2018, 3, e00009-18. [Google Scholar] [CrossRef]
  6. Macdonald, A.G. Hydrostatic pressure as an environmental factor in life processes. Comp. Biochem. Phys. A 1997, 116, 291–297. [Google Scholar] [CrossRef]
  7. Huang, Y.; Sun, C.; Yang, G.; Yue, X.; Jiang, F.; Cao, W.; Yin, X.; Guo, C.; Niu, J.; Ding, H. Geochemical characteristics of hadal sediment in the northern Yap Trench. J. Oceanol. Limnol. 2019, 38, 650–664. [Google Scholar] [CrossRef]
  8. Eustace, R.M.; Ritchie, H.; Kilgallen, N.M.; Piertney, S.B.; Jamieson, A.J. Morphological and ontogenetic stratification of abyssal and hadal Eurythenes gryllus sensu lato (Amphipoda: Lysianassoidea) from the Peru-Chile Trench. Deep Sea Res. Part I 2016, 109, 91–98. [Google Scholar] [CrossRef]
  9. Lacey, N.C.; Rowden, A.A.; Clark, M.R.; Kilgallen, N.M.; Linley, T.; Mayor, D.J.; Jamieson, A.J. Community structure and diversity of scavenging amphipods from bathyal to hadal depths in three South Pacific Trenches. Deep Sea Res. Part I 2016, 111, 121–137. [Google Scholar] [CrossRef]
  10. Copilas-Ciocianu, D.; Borko, S.; Fiser, C. The late blooming amphipods: Global change promoted post-Jurassic ecological radiation despite Palaeozoic origin. Mol. Phylogenet. Evol. 2020, 143, 106664. [Google Scholar] [CrossRef]
  11. Shi, L.L.; Xiao, W.J.; Liu, Z.G.; Pan, B.B.; Xu, Y.P. Diet change of hadal amphipods revealed by fatty acid profile: A close relationship with surface ocean. Mar. Environ. Res. 2018, 142, 250–256. [Google Scholar] [CrossRef] [PubMed]
  12. Li, W.; Wang, F.; Jiang, S.; Pan, B.; Chan, J.; Xu, Q. The Adaptive Evolution and Gigantism Mechanisms of the Hadal “Supergiant” Amphipod Alicella gigantea. Front. Mar. Sci. 2021, 8, 743663. [Google Scholar] [CrossRef]
  13. Li, J.Y.; Song, Z.L.; Yan, G.Y.; He, L.S. The complete mitochondrial genome of the largest amphipod, Alicella gigantea: Insight into its phylogenetic relationships and deep sea adaptive characters. Int. J. Biol. Macromol. 2019, 141, 570–577. [Google Scholar] [CrossRef] [PubMed]
  14. Martin, J.W.; Davis, G.E. An Updated Classification of the Recent Crustacea; Natural History Museum of Los Angeles County: Los Angeles, CA, USA, 2001; 124p. [Google Scholar]
  15. Barnard, J.L.; Barnard, C.M. Freshwater Amphipoda of the World; Hayfield Associates: Mt. Vernon, VA, USA, 1983. [Google Scholar]
  16. Jamieson, A.J.; Lacey, N.C.; Lorz, A.N.; Rowden, A.A.; Piertney, S.B. The supergiant amphipod Alicella gigantea (Crustacea: Alicellidae) from hadal depths in the Kermadec Trench, SW Pacific Ocean. Deep Sea Res. Part II 2013, 92, 107–113. [Google Scholar] [CrossRef]
  17. Gallo, N.D.; Cameron, J.; Hardy, K.; Fryer, P.; Bartlett, D.H.; Levin, L.A. Submersible- and lander-observed community patterns in the Mariana and New Britain trenches: Influence of productivity and depth on epibenthic and scavenging communities. Deep Sea Res. Part I 2015, 99, 119–133. [Google Scholar] [CrossRef]
  18. Timofeev, S.F. Bergmann’s principle and deep-water gigantism in marine crustaceans. Biol. Bull. Russ. Acad. Sci. 2001, 28, 646–650. [Google Scholar] [CrossRef]
  19. Ritchie, H.; Jamieson, A.J.; Piertney, S.B. Genome size variation in deep-sea amphipods. R. Soc. Open Sci. 2017, 4, 170862. [Google Scholar] [CrossRef]
  20. Liu, Q.; Jiang, S.; Li, W.; Pan, B.; Xu, Q. Trimethylamine N-Oxide (TMAO) and Trimethylamine (TMA) Determinations of Two Hadal Amphipods. J. Mar. Sci. Eng. 2022, 10, 454. [Google Scholar] [CrossRef]
  21. Li, W.; Wang, F.; Jiang, S.; Pan, B.; Liu, Q.; Xu, Q. Morphological and molecular evolution of hadal amphipod’s eggs provides insights into embryogenesis under high hydrostatic pressure. Front. Cell Dev. Biol. 2022, 10, 987409. [Google Scholar] [CrossRef]
  22. Chan, J.L.; Geng, D.Q.; Pan, B.B.; Zhang, Q.M.; Xu, Q.H. Gut Microbial Divergence Between Three Hadal Amphipod Species from the Isolated Hadal Trenches. Microb. Ecol. 2022, 84, 627–637. [Google Scholar] [CrossRef]
  23. Zhu, L.; Geng, D.; Pan, B.; Li, W.; Jiang, S.; Xu, Q. Trace Elemental Analysis of the Exoskeleton, Leg Muscle, and Gut of Three Hadal Amphipods. Biol. Trace Elem. Res. 2022, 200, 1395–1407. [Google Scholar] [CrossRef] [PubMed]
  24. Chan, J.; Pan, B.; Geng, D.; Zhang, Q.; Zhang, S.; Guo, J.; Xu, Q. Genetic Diversity and Population Structure Analysis of Three Deep-Sea Amphipod Species from Geographically Isolated Hadal Trenches in the Pacific Ocean. Biochem. Genet. 2020, 58, 157–170. [Google Scholar] [CrossRef] [PubMed]
  25. Sun, X.; Liu, D.; Zhang, X.; Li, W.; Liu, H.; Hong, W.; Jiang, C.; Guan, N.; Ma, C.; Zeng, H.; et al. SLAF-seq: An efficient method of large-scale de novo SNP discovery and genotyping using high-throughput sequencing. PLoS ONE 2013, 8, e58700. [Google Scholar] [CrossRef] [PubMed]
  26. Zeng, D.; Yang, C.; Li, Q.; Zhu, W.; Chen, X.; Peng, M.; Chen, X.; Lin, Y.; Wang, H.; Liu, H.; et al. Identification of a quantitative trait loci (QTL) associated with ammonia tolerance in the Pacific white shrimp (Litopenaeus vannamei). BMC Genom. 2020, 21, 857. [Google Scholar] [CrossRef] [PubMed]
  27. Song, X.; Xu, Y.; Gao, K.; Fan, G.; Zhang, F.; Deng, C.; Dai, S.; Huang, H.; Xin, H.; Li, Y. High-density genetic map construction and identification of loci controlling flower-type traits in Chrysanthemum (Chrysanthemum × morifolium Ramat.). Hortic. Res. 2020, 7, 108. [Google Scholar] [CrossRef] [PubMed]
  28. Zhang, Y.; Luan, P.; Ren, G.; Hu, G.; Yin, J. Estimating the inbreeding level and genetic relatedness in an isolated population of critically endangered Sichuan taimen (Hucho bleekeri) using genome-wide SNP markers. Ecol. Evol. 2020, 10, 1390–1400. [Google Scholar] [CrossRef]
  29. Fujioka, K.; Okino, K.; Kanamatsu, T.; Ohara, Y. Morphology and origin of the Challenger Deep in the Southern Mariana Trench. Geophys. Res. Lett. 2002, 29, 10-1–10-4. [Google Scholar] [CrossRef]
  30. Yancey, P.H. Cellular responses in marine animals to hydrostatic pressure. J. Exp. Zool. A Ecol. Integr. Physiol. 2020, 333, 398–420. [Google Scholar] [CrossRef] [PubMed]
  31. Shan, S.; Qi, Y.Z.; Tian, J.W.; Wang, X.C.; Luo, C.L.; Zhou, C.; Zhang, X.H.; Xin, Y.; Wang, Y.H. Carbon cycling in the deep Mariana Trench in the western north Pacific Ocean: Insights from radiocarbon proxy data. Deep Sea Res. Part I 2020, 164, 103370. [Google Scholar] [CrossRef]
  32. Luo, M.; Gieskes, J.; Chen, L.Y.; Scholten, J.; Pan, B.B.; Lin, G.; Chen, D.F. Sources, Degradation, and Transport of Organic Matter in the New Britain Shelf-Trench Continuum, Papua New Guinea. J. Geophys. Res. Biogeosci. 2019, 124, 1680–1695. [Google Scholar] [CrossRef]
  33. Kozich, J.J.; Westcott, S.L.; Baxter, N.T.; Highlander, S.K.; Schloss, P.D. Development of a Dual-Index Sequencing Strategy and Curation Pipeline for Analyzing Amplicon Sequence Data on the MiSeq Illumina Sequencing Platform. Appl. Environ. Microb. 2013, 79, 5112–5120. [Google Scholar] [CrossRef] [PubMed]
  34. Zhu, Z.; Sun, B.; Lei, J. Specific-Locus Amplified Fragment Sequencing (SLAF-Seq) as High-Throughput SNP Genotyping Methods. Methods Mol. Biol. 2021, 2264, 75–87. [Google Scholar] [CrossRef] [PubMed]
  35. Li, H.; Durbin, R. Fast and accurate short read alignment with Burrows-Wheeler transform. Bioinformatics 2009, 25, 1754–1760. [Google Scholar] [CrossRef] [PubMed]
  36. McKenna, A.; Hanna, M.; Banks, E.; Sivachenko, A.; Cibulskis, K.; Kernytsky, A.; Garimella, K.; Altshuler, D.; Gabriel, S.; Daly, M.; et al. The Genome Analysis Toolkit: A MapReduce framework for analyzing next-generation DNA sequencing data. Genome Res. 2010, 20, 1297–1303. [Google Scholar] [CrossRef] [PubMed]
  37. Li, H.; Handsaker, B.; Wysoker, A.; Fennell, T.; Ruan, J.; Homer, N.; Marth, G.; Abecasis, G.; Durbin, R.; 1000 Genome Project Data Processing Subgroup. The Sequence Alignment/Map format and SAMtools. Bioinformatics 2009, 25, 2078–2079. [Google Scholar] [CrossRef] [PubMed]
  38. Danecek, P.; Auton, A.; Abecasis, G.; Albers, C.A.; Banks, E.; DePristo, M.A.; Handsaker, R.E.; Lunter, G.; Marth, G.T.; Sherry, S.T.; et al. The variant call format and VCFtools. Bioinformatics 2011, 27, 2156–2158. [Google Scholar] [CrossRef]
  39. Liang, Y.-K.; Liu, W.-C.; Chen, J.-H.; Chen, X.-R.; Tang, Q.; Sun, Z.-M.; Luan, M.-B. Relationships among Chinese Boehmeria species and the evolution of various clade. Ind. Crops Prod. 2020, 148, 112092. [Google Scholar] [CrossRef]
  40. Khan, S.A.; Chen, H.; Deng, Y.; Chen, Y.; Zhang, C.; Cai, T.; Ali, N.; Mamadou, G.; Xie, D.; Guo, B.; et al. High-density SNP map facilitates fine mapping of QTLs and candidate genes discovery for Aspergillus flavus resistance in peanut (Arachis hypogaea). Theor. Appl. Genet. 2020, 133, 2239–2257. [Google Scholar] [CrossRef] [PubMed]
  41. Purcell, S.; Neale, B.; Todd-Brown, K.; Thomas, L.; Ferreira, M.A.R.; Bender, D.; Maller, J.; Sklar, P.; de Bakker, P.I.W.; Daly, M.J.; et al. PLINK: A tool set for whole-genome association and population-based linkage analyses. Am. J. Hum. Genet. 2007, 81, 559–575. [Google Scholar] [CrossRef]
  42. Du, M.; Xiong, M.; Chang, Y.; Liu, Z.; Wang, R.; Lin, X.; Zhou, Z.; Lu, M.; Liu, C.; Liu, E. Mining Candidate Genes and Favorable Haplotypes for Flag Leaf Shape in Rice (Oryza sativa L.) Based on a Genome-Wide Association Study. Agronomy 2022, 12, 1814. [Google Scholar] [CrossRef]
  43. Sun, X.; Jiao, C.; Schwaninger, H.; Chao, C.T.; Ma, Y.; Duan, N.; Khan, A.; Ban, S.; Xu, K.; Cheng, L.; et al. Phased diploid genome assemblies and pan-genomes provide insights into the genetic history of apple domestication. Nat. Genet. 2020, 52, 1423–1432. [Google Scholar] [CrossRef]
  44. Retief, J.D. Phylogenetic analysis using PHYLIP. Methods Mol. Biol. 2000, 132, 243–258. [Google Scholar] [PubMed]
  45. Alexander, D.H.; Novembre, J.; Lange, K. Fast model-based estimation of ancestry in unrelated individuals. Genome Res. 2009, 19, 1655–1664. [Google Scholar] [CrossRef]
  46. Lischer, H.E.L.; Excoffier, L. PGDSpider: An automated data conversion tool for connecting population genetics and genomics programs. Bioinformatics 2012, 28, 298–299. [Google Scholar] [CrossRef]
  47. Coop, G.; Witonsky, D.; Di Rienzo, A.; Pritchard, J.K. Using Environmental Correlations to Identify Loci Underlying Local Adaptation. Genetics 2010, 185, 1411–1423. [Google Scholar] [CrossRef]
  48. Gunther, T.; Coop, G. Robust Identification of Local Adaptation from Allele Frequencies. Genetics 2013, 195, 205–220. [Google Scholar] [CrossRef]
  49. Li, Y.L.; Xue, D.X.; Zhang, B.D.; Liu, J.X. Population Genomic Signatures of Genetic Structure and Environmental Selection in the Catadromous Roughskin Sculpin Trachidermus fasciatus. Genome Biol. Evol. 2019, 11, 1751–1764. [Google Scholar] [CrossRef]
  50. Welcker, C.; Spencer, N.A.; Turc, O.; Granato, I.; Chapuis, R.; Madur, D.; Beauchene, K.; Gouesnard, B.; Draye, X.; Palaffre, C.; et al. Physiological adaptive traits are a potential allele reservoir for maize genetic progress under challenging conditions. Nat. Commun. 2022, 13, 3225. [Google Scholar] [CrossRef] [PubMed]
  51. Huerta-Cepas, J.; Forslund, K.; Coelho, L.P.; Szklarczyk, D.; Jensen, L.J.; von Mering, C.; Bork, P. Fast Genome-Wide Functional Annotation through Orthology Assignment by eggNOG-Mapper. Mol. Biol. Evol. 2017, 34, 2115–2122. [Google Scholar] [CrossRef] [PubMed]
  52. Cooke, A.; Schwarzl, T.; Huppertz, I.; Kramer, G.; Mantas, P.; Alleaume, A.M.; Huber, W.; Krijgsveld, J.; Hentze, M.W. The RNA-Binding Protein YBX3 Controls Amino Acid Levels by Regulating SLC mRNA Abundance. Cell Rep. 2019, 27, 3097–3106. [Google Scholar] [CrossRef]
  53. Cano-Crespo, S.; Chillaron, J.; Junza, A.; Fernandez-Miranda, G.; Garcia, J.; Polte, C.; de la Ballina, L.R.; Ignatova, Z.; Yanes, O.; Zorzano, A.; et al. CD98hc (SLC3A2) sustains amino acid and nucleotide availability for cell cycle progression. Sci. Rep. 2019, 9, 14065. [Google Scholar] [CrossRef]
  54. Haddadi, N.; Lin, Y.G.; Simpson, A.M.; Nassif, N.T.; McGowan, E.M. “Dicing and Splicing” Sphingosine Kinase and Relevance to Cancer. Int. J. Mol. Sci. 2017, 18, 1891. [Google Scholar] [CrossRef] [PubMed]
  55. Weston, J.N.; Jensen, E.L.; Hasoon, M.S.; Kitson, J.J.; Stewart, H.A.; Jamieson, A.J. Barriers to gene flow in the deepest ocean ecosystems: Evidence from global population genomics of a cosmopolitan amphipod. Sci. Adv. 2022, 8, eabo6672. [Google Scholar] [CrossRef] [PubMed]
  56. France, S.C. Geographic variation among three isolated populations of the hadal amphipod Hirondellea gigas (Crustacea: Amphipoda: Lysianassoidea). Mar. Ecol.-Prog. Ser. 1993, 92, 277. [Google Scholar] [CrossRef]
  57. Qin, M.; Li, C.; Li, Z.; Chen, W.; Zeng, Y. Genetic Diversities and Differentially Selected Regions Between Shandong Indigenous Pig Breeds and Western Pig Breeds. Front. Genet. 2019, 10, 1351. [Google Scholar] [CrossRef] [PubMed]
  58. Rex, M.A.; Etter, R.J. Deep-Sea Biodiversity: Pattern and Scale; Harvard University Press: Cambridge, MA, USA, 2010. [Google Scholar]
  59. Cowart, D.A.; Halanych, K.M.; Schaeffer, S.W.; Fisher, C.R. Depth-dependent gene flow in Gulf of Mexico cold seep Lamellibrachia tubeworms (Annelida, Siboglinidae). Hydrobiologia 2014, 736, 139–154. [Google Scholar] [CrossRef]
  60. Quattrini, A.M.; Baums, I.B.; Shank, T.M.; Morrison, C.L.; Cordes, E.E. Testing the depth-differentiation hypothesis in a deepwater octocoral. Proc. R. Soc. B Biol. Sci. 2015, 282, 20150008. [Google Scholar] [CrossRef] [PubMed]
  61. Ritchie, H.; Cousins, N.; Cregeen, S.; Piertney, S. Population genetic structure of the abyssal grenadier (Coryphaenoides armatus) around the mid-Atlantic ridge. Deep. Sea Res. Part. II Top. Stud. Oceanogr. 2013, 98, 431–437. [Google Scholar] [CrossRef]
  62. Baco, A.R.; Etter, R.J.; Ribeiro, P.A.; Von der Heyden, S.; Beerli, P.; Kinlan, B.P. A synthesis of genetic connectivity in deep-sea fauna and implications for marine reserve design. Mol. Ecol. 2016, 25, 3276–3298. [Google Scholar] [CrossRef]
  63. Piertney, S.B.; Wenzel, M.; Jamieson, A.J. Large effective population size masks population genetic structure in Hirondellea amphipods within the deepest marine ecosystem, the Mariana Trench. Mol. Ecol. 2023, 32, 2206–2218. [Google Scholar] [CrossRef]
  64. Havermans, C.; Sonet, G.; d’Udekem d’Acoz, C.; Nagy, Z.T.; Martin, P.; Brix, S.; Riehl, T.; Agrawal, S.; Held, C. Genetic and morphological divergences in the cosmopolitan deep-sea amphipod Eurythenes gryllus reveal a diverse abyss and a bipolar species. PLoS ONE 2013, 8, e74218. [Google Scholar] [CrossRef] [PubMed]
  65. Palacin, M.; Errasti-Murugarren, E.; Rosell, A. Heteromeric amino acid transporters. In search of the molecular bases of transport cycle mechanisms. Biochem. Soc. Trans. 2016, 44, 745–752. [Google Scholar] [CrossRef] [PubMed]
Figure 1. Sampling locations of the three A. gigantea geographic populations.
Jmse 12 01117 g001
Figure 2. Genomic inbreeding coefficients and phylogenetic analysis regarding the 30 individuals of A. gigantea. (a) Genomic inbreeding coefficients of the 30 sequenced individuals and average genomic inbreeding coefficients of three populations. (b) Neighbor-joining phylogenetic tree for 30 sequenced individuals based on 570,168 SNPs.
Jmse 12 01117 g002
Figure 3. Population structure analysis and principal component analysis. (a) Plots of the individual ancestry inference for K = 1 (upper), K = 2 (middle), and K = 3 (lower). (b) Cross-validation error of A. gigantea K = 1–5. (c) Principal component analysis of A. gigantea.
Jmse 12 01117 g003
Figure 4. Bayesian factor numerical diagram of SNP sites. A blue dashed line represents log10(BF) = 0.5 and a red dashed line represents log10(BF) = 1.
Jmse 12 01117 g004
Figure 5. Functional annotation of environmental adaptation loci. (a) KOG function classification of selected genes. (b) KEGG function classification of environmental adaptation loci. (c) GO function annotation of environmental adaptation loci.
Jmse 12 01117 g005
Figure 6. Two SLAF tags annotated by all three databases. (a) Venn diagram of three-database-annotated tags. (b) Sequence logo diagram of these two genes. The red box in the figure indicates the environmental adaptation site. One gene’s sequence number is Marker63205, and the selected site is at the 164th base (upper), and the other gene’s sequence number is Marker137036, and the selected site is at the 103rd base (down).
Jmse 12 01117 g006
Table 1. Sampling information of the three geographic populations of A. gigantea.
Geographic PopulationSample NumberGeographic CoordinatesDepth (m)
ENBT 110S6.32°, E153.75°8931.3
CNBT 210S5.86°, E152.43°8224.9
SMT 310N11.62°, E142.35°6040
1 ENBT is the abbreviation for the geographic population in the eastern New Britain Trench. 2 CNBT is the abbreviation for the geographic population in the central New Britain Trench. 3 SMT is the abbreviation for the geographic population in the southern Mariana Trench.
Table 2. Average genomic inbreeding coefficients for three geographic populations of A. gigantea.
PopulationSample SizeGenomic Inbreeding Coefficient (Mean ± SD) 1MinMax
SMT10−0.123 a ± 0.041−0.1803−0.0525
ENBT10−0.189 b ± 0.051−0.2881−0.1024
CNBT10−0.113 a ± 0.091−0.19840.1304
Total30−0.142 ± 0.071−0.28810.1304
1 Genomic inbreeding coefficients were analyzed using 570,168 SNP set by PLINK. Within a row with no common lowercase superscript (a,b), there were significant differences in multiple comparisons (p < 0.05).
Table 3. KEGG pathways of the environmental adaptation loci.
KEGG_B_ClassPathwayOut (7)All (44,233)
Immune systemCytosolic DNA-sensing pathway33381
TranscriptionRNA polymerase33683
Cell growth and deathFerroptosis1877
Digestive systemProtein digestion and absorption11016
Signal transductionmTOR signaling pathway11035
Signal transductionVEGF signaling pathway11273
Signal transductionSphingolipid signaling pathway11316
Lipid metabolismSphingolipid metabolism11317
Immune systemFc gamma R-mediated phagocytosis11332
Signal transductionApelin signaling pathway11408
Signal transductionPhospholipase D signaling pathway11597
Signal transductionCalcium signaling pathway11784
Amino acid metabolismLysine degradation27024
Infectious diseasesTuberculosis12593
Global and overview mapsMetabolic pathways317,672
Table 4. The intersection of three-database-annotated genes.
IDSymbolPathway/Module
Marker63205SLC3A2, MDU1, CD98mTOR signaling pathway
Ferroptosis
Protein digestion and absorption
Marker137036SphKSphingosine degradation
Disclaimer/Publisher’s Note: The statements, opinions and data contained in all publications are solely those of the individual author(s) and contributor(s) and not of MDPI and/or the editor(s). MDPI and/or the editor(s) disclaim responsibility for any injury to people or property resulting from any ideas, methods, instructions or products referred to in the content.

