Abstract
The air–sea exchange of carbon dioxide (CO2) on a global scale is a key factor in understanding climate change and predicting its effects. The magnitude of sea spray’s contribution to this flux is currently highly uncertain. Constraining CO2’s diffusion in sea spray droplets is important for reducing error margins in global estimates of oceanic CO2 uptake and release. The timescale for CO2 gas diffusion within sea spray is known to be shorter than the timescales for the droplets’ physical changes to take place while aloft. However, the rate of aqueous carbonate reactions relative to these timescales has not been assessed. This study investigates the timescales of droplet physical changes to those of chemical transformations across the H2CO3/HCO3−/CO32− sequence. We found that physical timescales are rate limiting and that evaporation drives carbonate species into gaseous CO2, promoting the production and evasion of CO2 from sea spray droplets. This has important implications for carbon cycling and feedback in the surface ocean.
1. Introduction
Carbon dioxide (CO2), an important greenhouse gas, is exchanged between the ocean and atmosphere across the globe. Understanding the distribution of this flux is critical to our understanding and prediction of the global climate. Gas exchange in the open ocean is enhanced when windspeeds exceed 12 m/s [1]. At this speed, winds substantially disturb the sea surface, causing waves to form and break. Breaking waves encapsulate air into the sea as bubbles and generate sea spray [2], but the wind also directly tears off water from the wave crests into larger spray spume droplets [3]. While aloft, droplets first thermally equilibrate with the surrounding air, then begin to evaporate, shrinking in size and increasing in salinity. At wind speeds over 12 m/s, some drops remain aloft long enough to not only achieve thermal equilibrium, but to reach significant evaporation and considerable evasion of gases. At higher wind speeds, these processes intensify. As more sea spray is generated and remains aloft for longer time periods, there is increasing opportunity for gas exchange between the spray droplets and the surrounding air. Sea spray droplets are known to mediate the transfer of heat, momentum, and nonreactive gases across the air–sea interface [4,5,6,7,8]. The contribution of sea spray to the exchange of abiotically reactive gases such as CO2 is likely also substantial but understudied.
To examine this reactive gas, it is first necessary to consider the carbonate reactions and compare them to the timescales of the physical processes a sea spray droplet undergoes. It is hypothesized that the evaporation of a sea spray droplet will shift the balance of the carbonate equilibrium to favor CO2, which will then evade the increasingly hostile environment. In this paper, the reaction rates and equilibrium constants across the carbonate system are examined relative to a spray droplet’s rates of temperature change, evaporation, and time aloft to discern which of these processes limits the net flux of CO2. The effects of changing temperature and salinity on the ionization of water, Kw, have been well defined and are not further examined [9,10].
2. Carbonate System Reactions
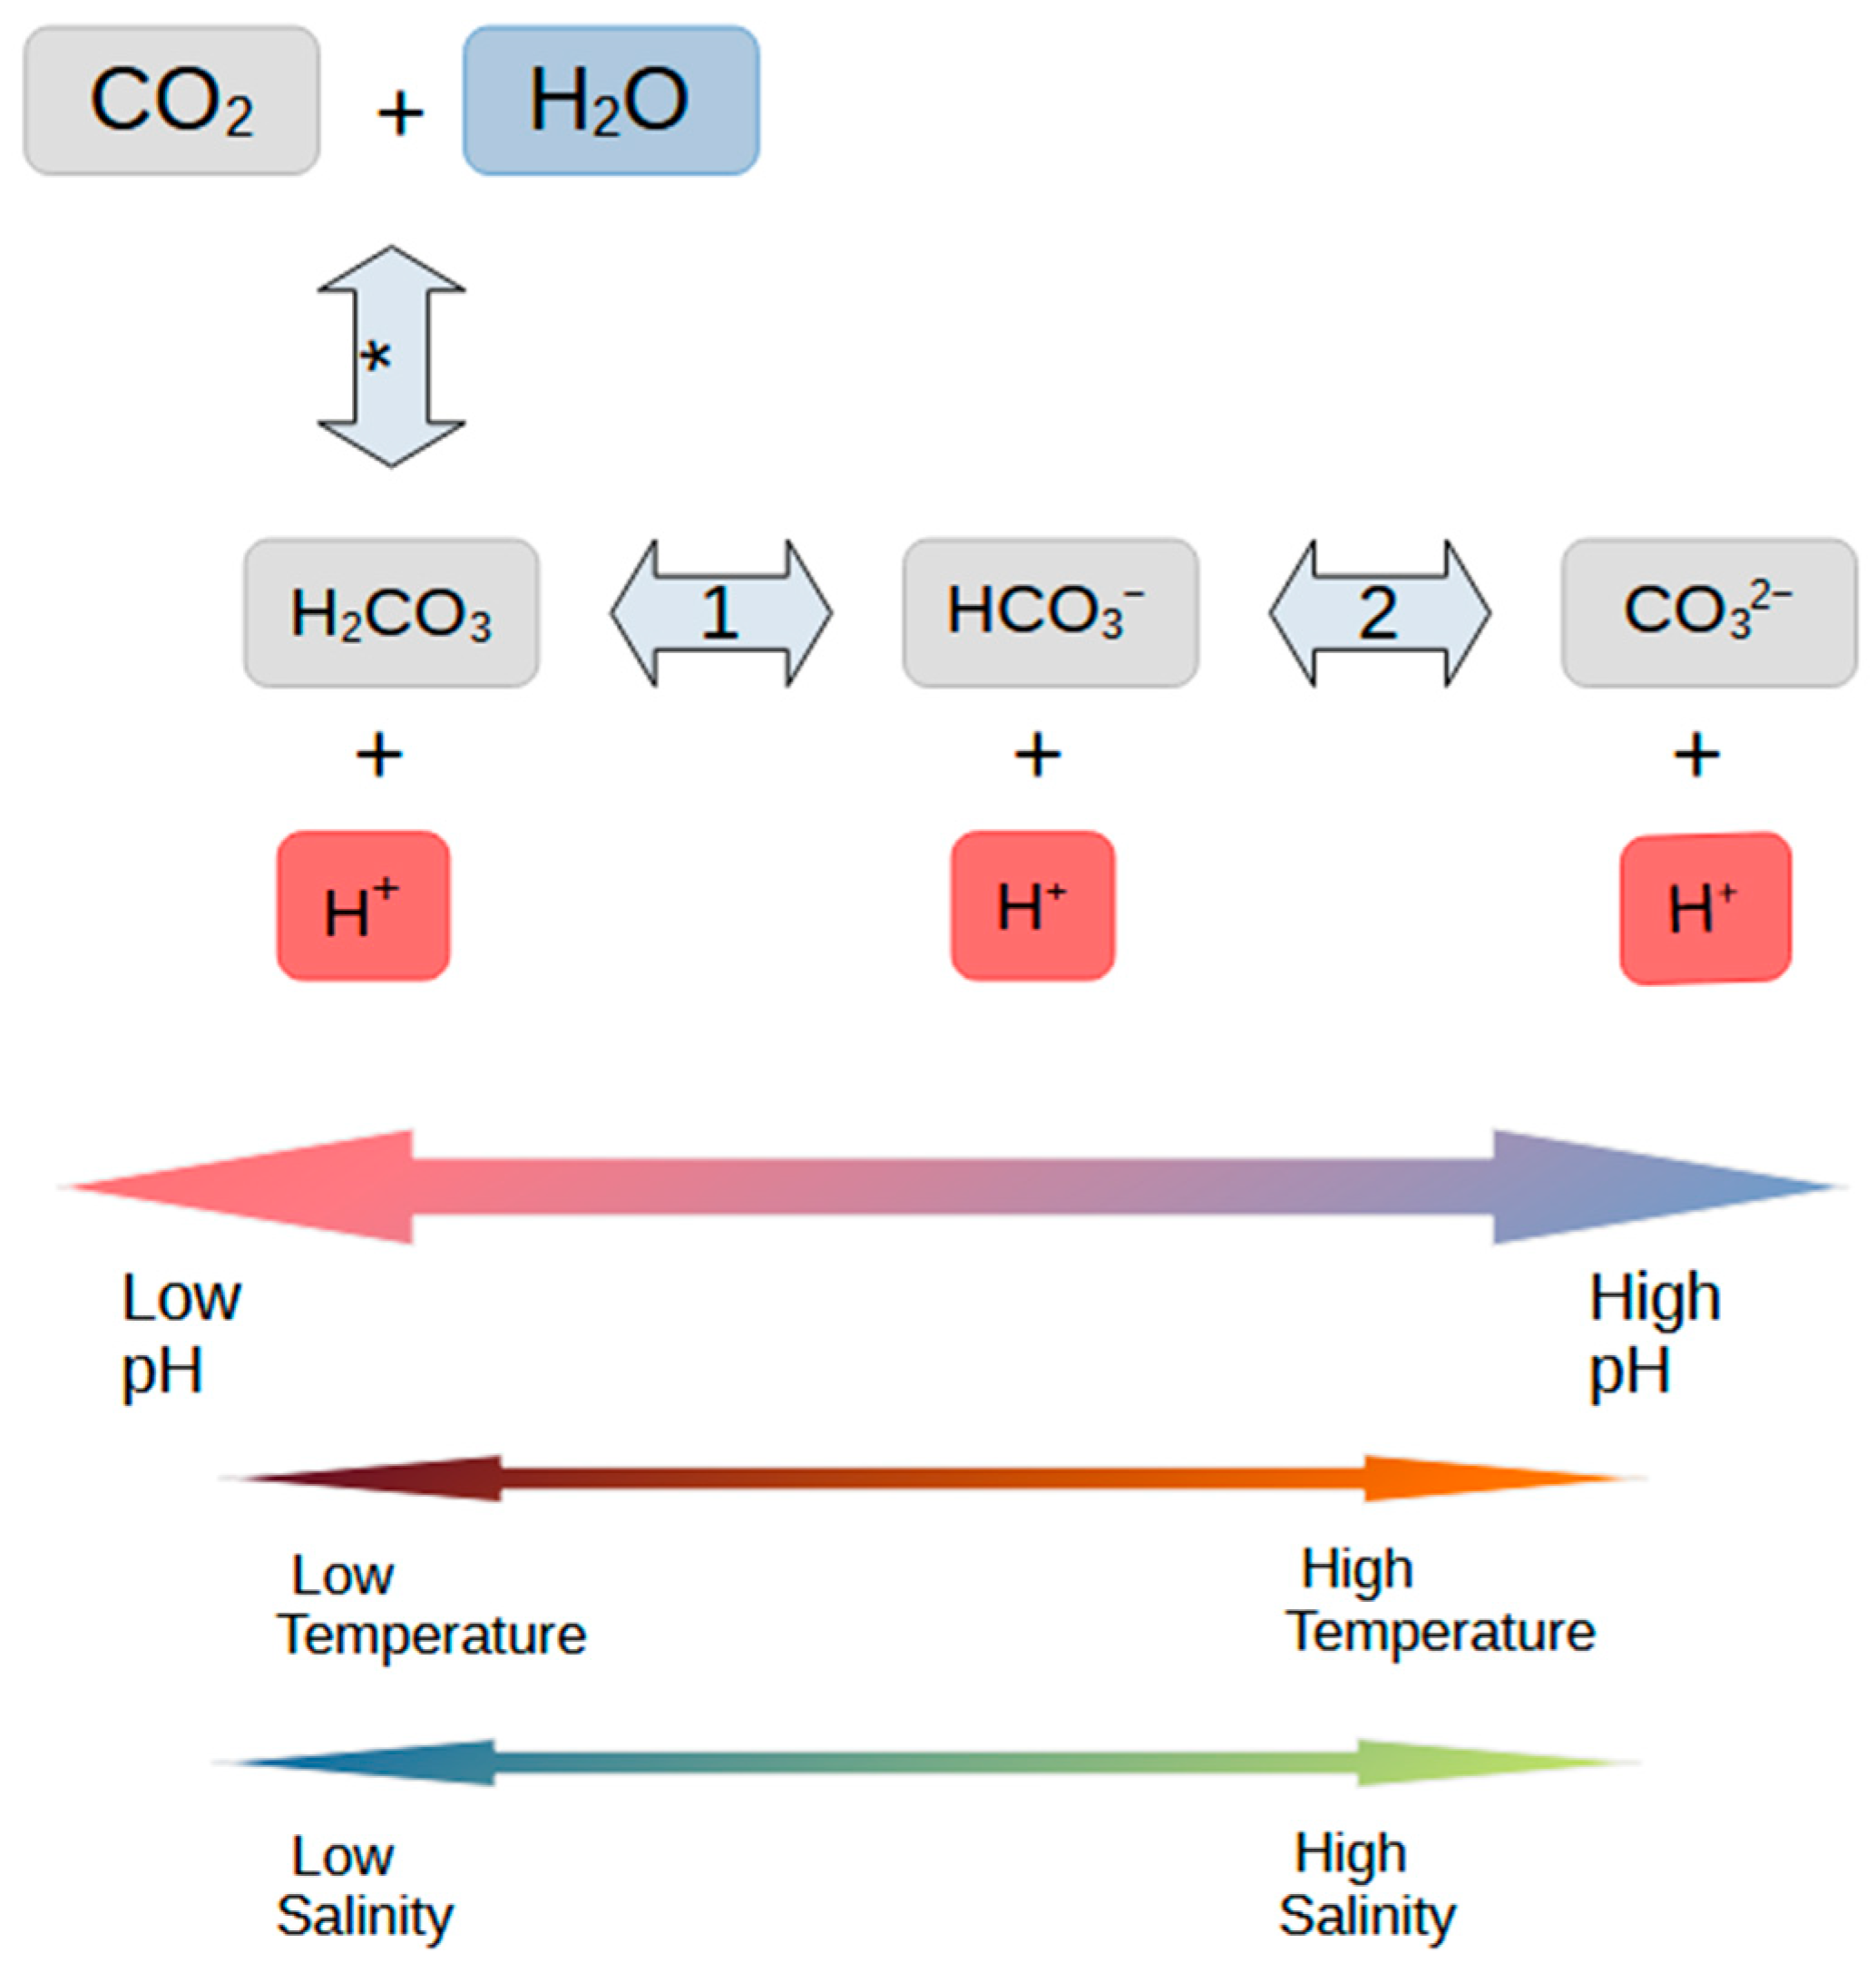
CO2 gas reacts in water to form carbonic acid, which further dissociates into bicarbonate and, subsequently, carbonate ions. K*, k*, and k*− are the equilibrium constant, forward reaction rate, and reverse reaction rate for the reaction of CO2 and water to carbonic acid (H2CO3), marked * in Figure 1 (see Equation (1)), and the constants for the reactions marked 1 and 2 are denoted accordingly, as shown in Equations (2) and (3).

Figure 1.
The scheme for aqueous reactions of carbon dioxide and carbonate species in water. Note the impacts of changes in pH are significantly greater than those of temperature and salinity. The asterisk in the first arrow indicates the conversion of gaseous CO2 to carbonic acid, while the 1 and 2 on the second and third arrows indicate the first and second deprotonation reactions of carbonic acid, respectively.
Figure 1 illustrates the reactions and the notations for reaction rates and equilibrium constants used herein. The effects of temperature, and salinity on the species balance are also shown. As the droplet evaporates, the temperature of the droplet may either rise or fall depending on the ambient air temperature, but the droplet’s salinity will always increase.
The equilibrium constants for the dissociation of carbonic acid into bicarbonate, K1, are up to seven orders of magnitude greater than that of CO2 hydration, K*, as the dissociation reaction is purely ionic [11]. Since the conversion of carbonic acid to bicarbonate is so rapid, the two species are considered to be in stable equilibrium and the two reactions are not separated. K1 and its associated reaction rates are combined with the hydration pathway, K*, and are henceforth referred to as K1* [11], and K2 remains as described.
3. Sea Spray Droplet Evolution
Andreas et al. (2017) [6] examined the timescales of gas diffusion within sea spray for common gases in the atmosphere: helium, neon, argon, oxygen, nitrogen, and carbon dioxide. Following the assumptions in their approach, the gas concentration in sea spray droplets can be assumed to be in instantaneous equilibrium with that of the atmosphere. After a spray drop is formed, its time aloft can be estimated as a function of the droplet settling velocity and droplet size. These characteristics are functions of wave height, whitecap coverage, and other wave characteristics. Historically, models for sea spray generation and time aloft depended on wind speed, which has since been shown to be an oversimplification of more complex processes [6,12,13].
While aloft, a droplet passes through two physical equilibrations with the atmosphere: a thermal equilibration, and a radial equilibration, where it begins to evaporate. In this second phase, the salinity increases as the radius decreases. Using the Andreas microphysical model [6], thermal and radial equilibria can be considered separately. The evolution of a droplet is modeled using three gas diffusion timescales and three physical timescales. The gas diffusion timescales describe the diffusion across the waterside boundary layer, the diffusion across the airside boundary layer into the bulk atmosphere, and the diffusion of the gas within the droplet. These are reversible equilibria that can describe both the invasion and evasion of gas. The physical timescales describe the droplet’s time aloft, the timescale for the droplet to achieve thermal equilibrium, and the timescale to reach radial equilibrium through evaporation. Both sets of timescales depend on the initial radius of the droplet, r0 [6]. These physical timescales provide a framework for incorporating carbonate reaction kinetics.
The conversion of CO2 gas to bicarbonate (hydration) and the conversion of bicarbonate to CO2 gas (dehydration) control the amount of carbon that the droplet can release or store. These reactions are therefore critical to the net carbon flux as they control the rate at which CO2 is either converted into ionic bicarbonate dissolved in water, preventing it from diffusing out of the droplet as CO2, or generated from dissolved bicarbonate and thus available for diffusion out of the droplet. If these reaction rates are much faster than the physical and diffusive timescales, the reactions can be considered instantaneous, and the physical and diffusive timescales will be rate limiting for CO2 gas exchange. If the reaction rates are slower, they will limit the rate of CO2 gas exchange across the air–droplet interface. Therefore, these rates will determine whether or not sea spray can act as a vector for transferring CO2 between the ocean and the atmosphere.
4. Timescales for Droplet and Carbonate System Evolution in Standard Seawater Conditions
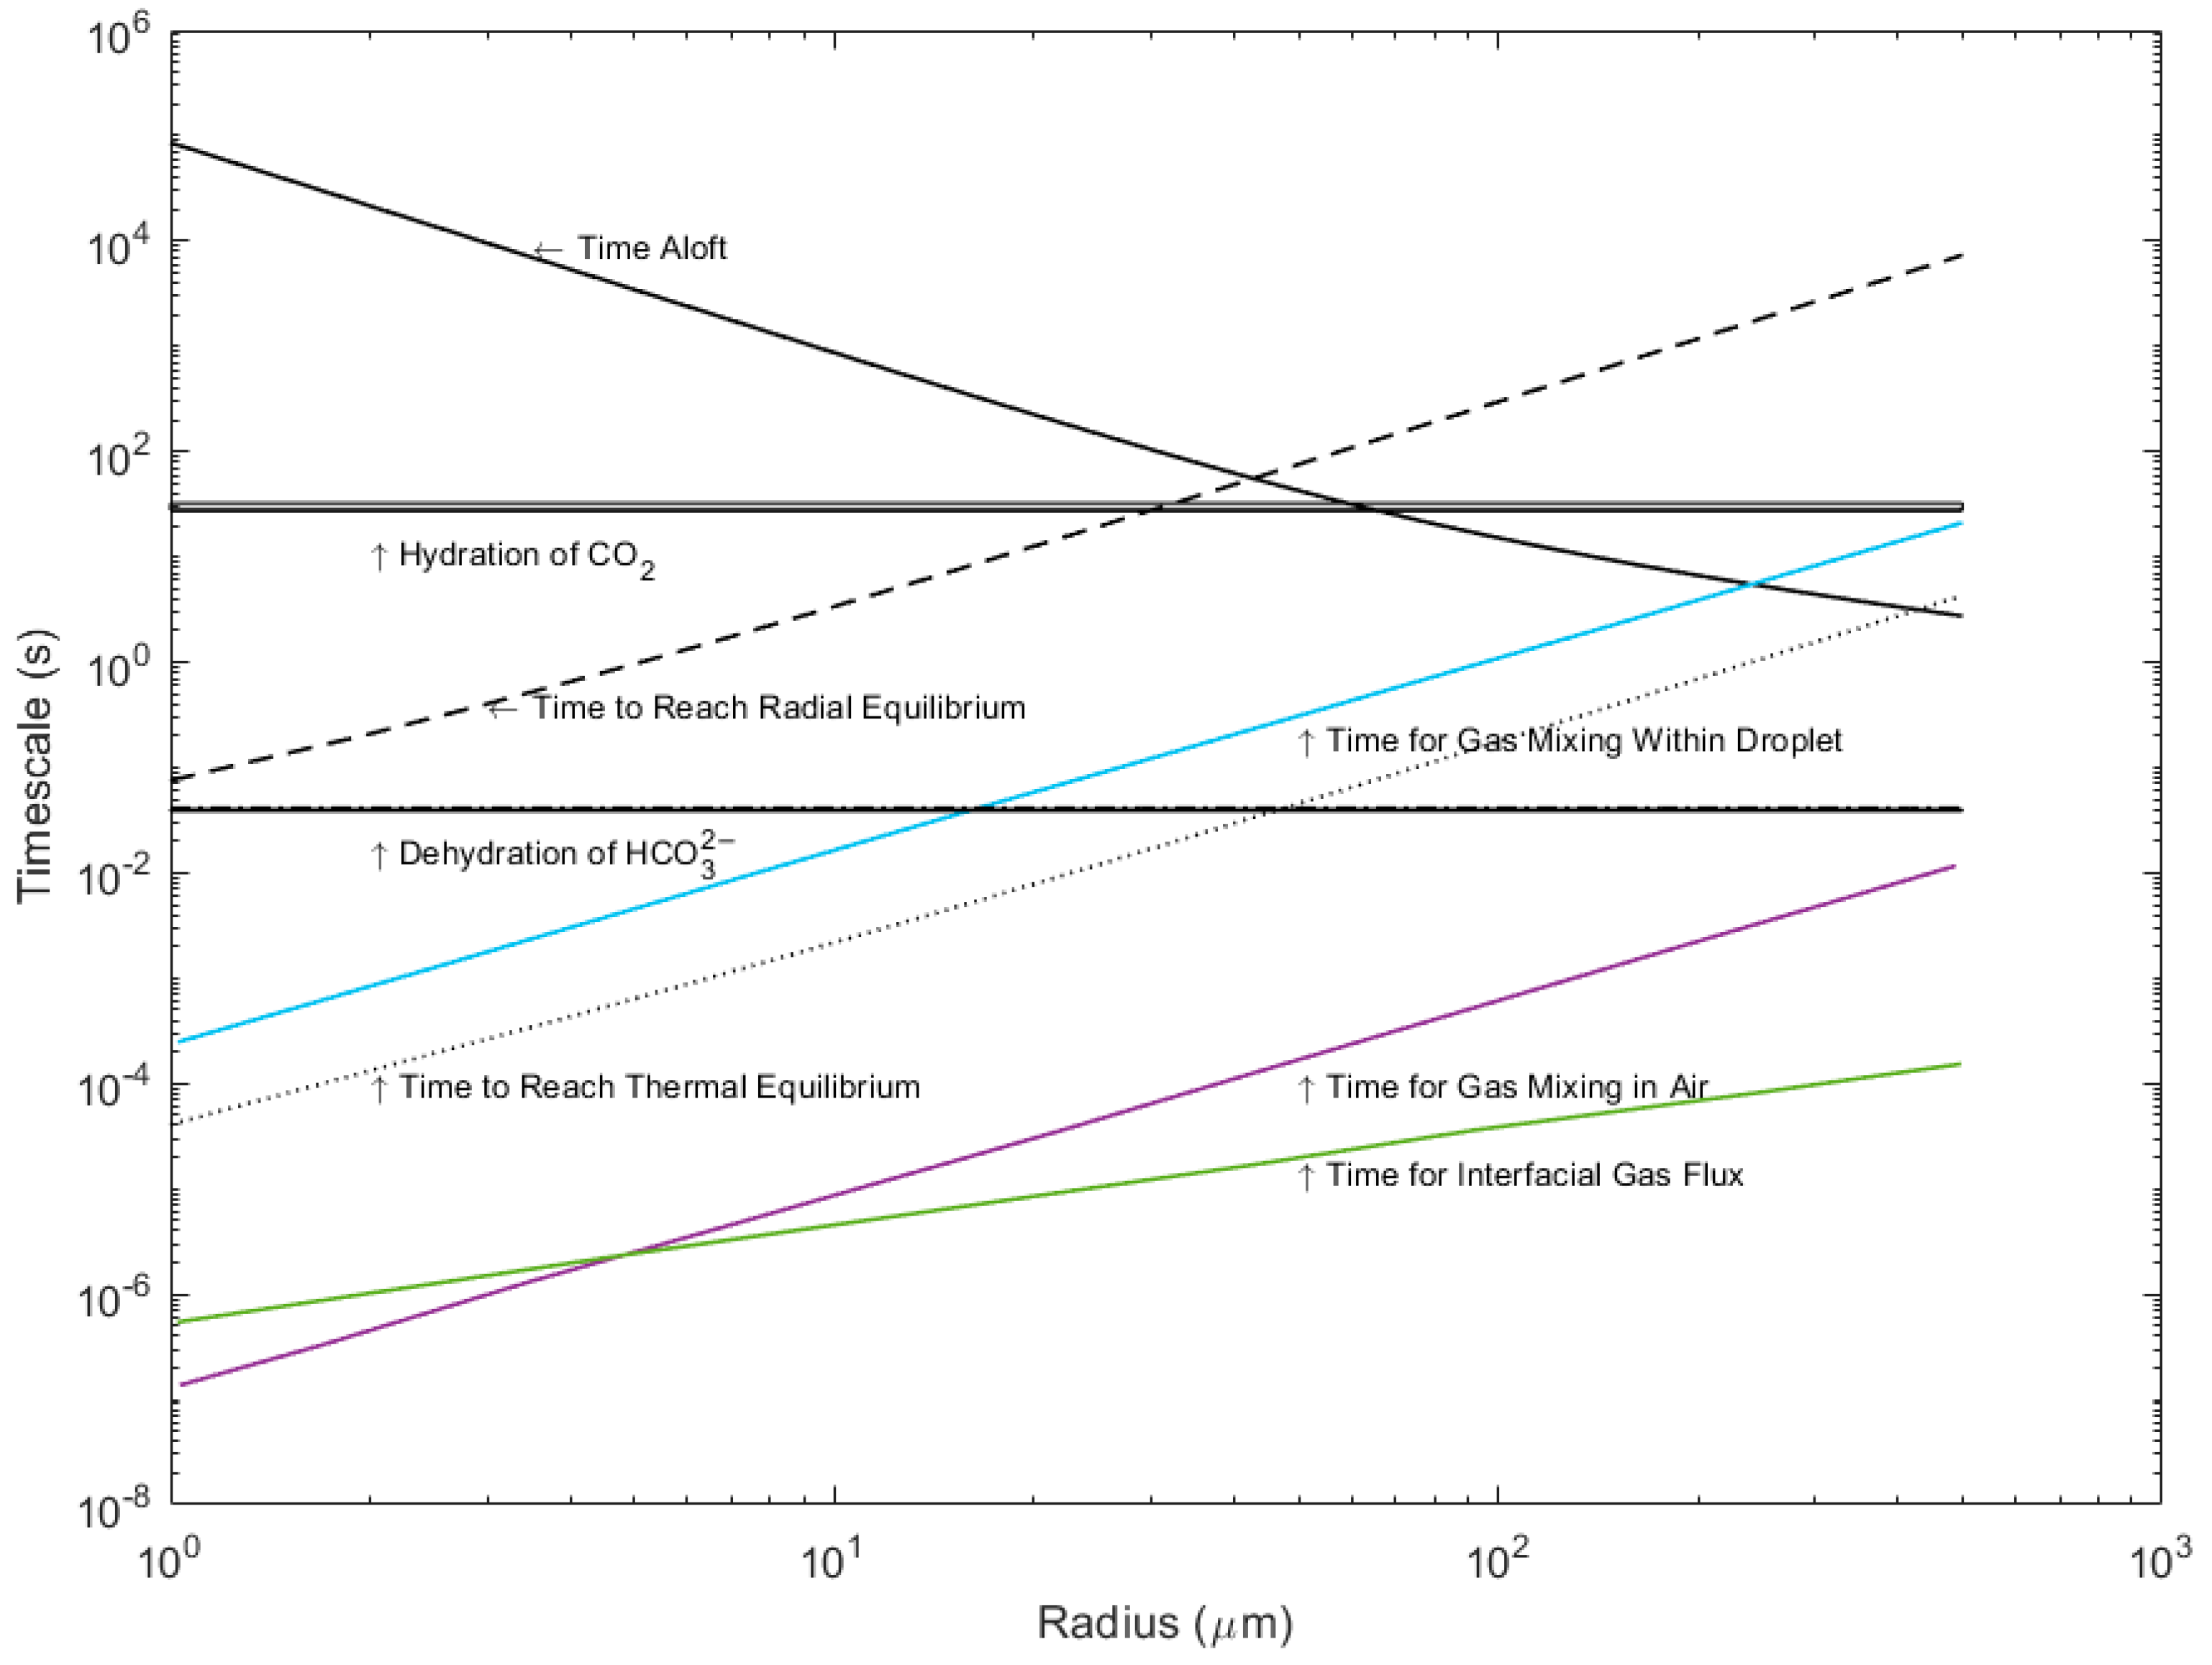
In the first stage of droplet evolution, before thermal equilibration or evaporation have begun, the droplet conditions match those of the bulk seawater. As a first step, we compare the timescales of carbonate reactions in standard seawater at 25 °C and a salinity of 33.77, as determined by Johnson (1982) [11], to the physical and gas exchange timescales modeled by Andreas (2017) [6]. These timescales are shown in Figure 2. The timescales of the reactions are calculated as the inverse of the reaction rates (k−1) [14]. Note that the reaction rates are independent of droplet radius.
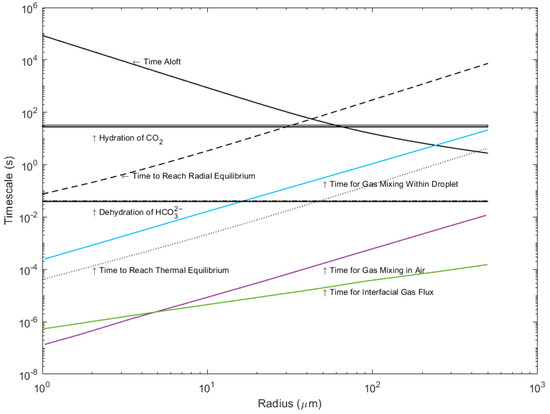
Figure 2.
Timescales for hydration and dehydration at a salinity of 33.77 and 25 °C compared to the timescales of droplet evolution and gas exchange for droplets up to 500 μm in radius. (Data from [11]).
The reaction timescale for dehydration of bicarbonate into CO2 gas is much faster than the timescales of physical change, particularly time aloft and evaporation, while the hydration of bicarbonate into CO2 gas is not. The dehydration reaction is much faster than the total time aloft for droplets and the time to reach thermal equilibrium; therefore, we can assume that dehydration across all sea spray droplet sizes is not rate limiting to gas transfer, but rather the physical timescales of evaporation and time aloft are the limiting factors. The degree with which the reverse hydration reaction may occur is much more dependent on droplet radius. Hydration is faster than the typical times aloft for droplets that are smaller than 45 μm in initial radius. For larger droplets, the reaction is slower than the time aloft and therefore rate limiting (as larger droplets re-enter the ocean too rapidly for this reaction to take place appreciably while the droplet is aloft). The rate-limiting step for hydration therefore depends on the droplet size, while the rate-limiting steps for dehydration are always the physical processes, particularly time aloft. Droplets less than 60 μm in radius reach thermal equilibrium at rates faster than the dehydration reaction; therefore, only evaporation is rate-limiting. For droplets of an initial radius greater than 60 μm, both thermal equilibrium and radial equilibrium are rate limiting.
Previous work by Andreas et al. (2017) [6] has shown that the timescales of gas diffusion in and out of the droplet across the air and waterside boundaries is much faster than the timescales of thermal equilibrium. Subsequently, the availability of CO2 gas in the droplet does not limit hydration or dehydration within the droplet. The efflux of CO2 gas from a sea spray droplet is not limited by the reaction rates but by the slower physical processes. However, reaction rates do limit the influx of CO2 gas into a sea spray droplet. Since the conversion of CO2 gas into bicarbonate does not occur rapidly enough to provide a sink for carbon species within the droplet while it is aloft, the amount of carbon a droplet can take up is limited by Henry’s law. Thermal equilibrium, however, may allow for both evasion (if the droplet temperature is warmer than the air) and invasion (if the droplet temperature is cooler than the air). Invasion will be slower than the physical equilibria on larger droplets and therefore temporally decoupled, whereas evasion will appear instantaneous.
The dehydration-driven shift of bicarbonate to CO2 favors evasion. The more bicarbonate that is converted to CO2, the more carbon has the potential to evade the droplet. Generally, during the evaporative phase, it is reasonable to assume that dehydration followed by evasion will be the dominant process. In a droplet small enough to completely evaporate while aloft, this could result in an order-of-magnitude increase in released CO2 relative to an equivalent volume of bulk seawater. Analysis of these timescales indicates that evasion of CO2 is favored in droplet conditions, and invasion of CO2 is not favored. Within the overall context of global air–sea flux, sea spray is more likely to be a vector for moving CO2 out of the ocean and back into the atmosphere than vice versa.
5. Carbonate Reaction Rate Responses to Changes in Temperature and Salinity
The next consideration is regarding the rates of carbonate species interconversions within the aqueous droplet matrix. Since the hydration reaction timescale is within the timescale of evaporation, it will be affected by changes in salinity. Similarly, since the dehydration timescale is within the timescale of thermal equilibration, it will be primarily affected by the changing temperature in the droplet. It is therefore necessary to investigate the effects of changing salinity and temperature on these reaction rates.
5.1. Thermal Equilibration
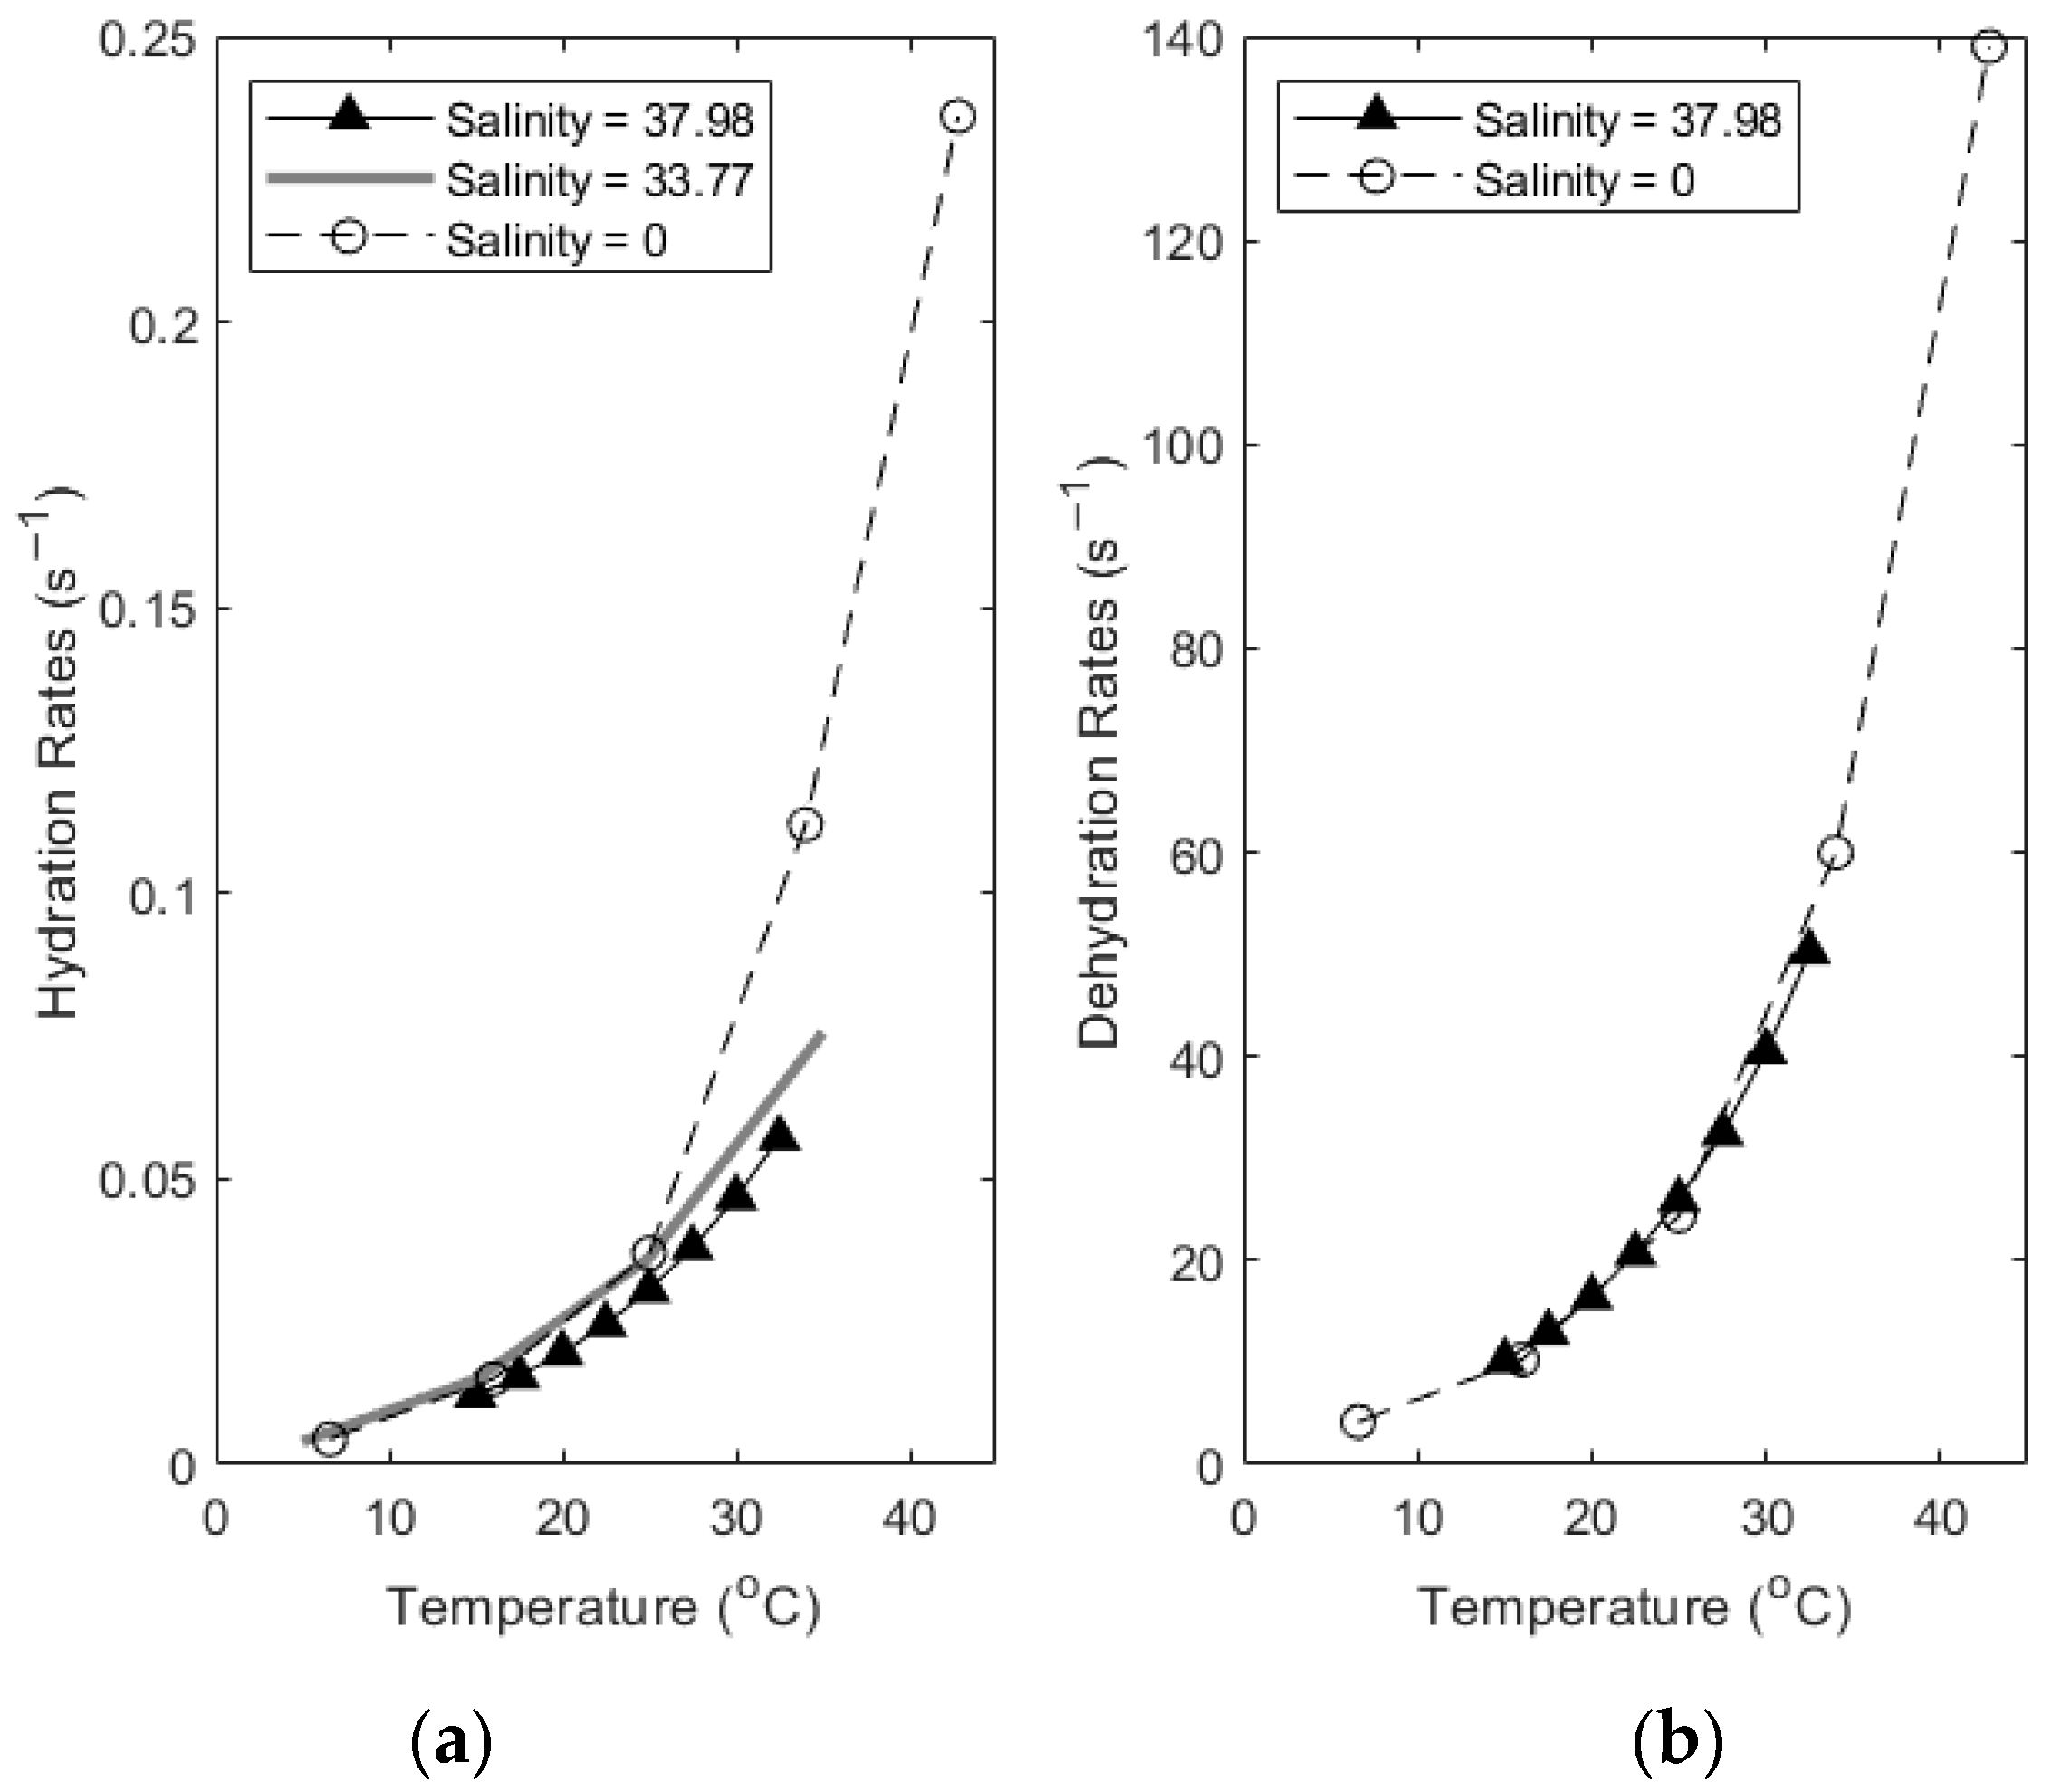
During thermal equilibration, changes to the carbonate reaction rate constants can be estimated as a direct result of the changing temperature. To investigate the effects of this equilibration on carbonate reaction rates in seawater, we have synthesized and compared published data. Soli and Byrne (2002) [15] investigated the effect of changing temperature on the carbonate system reaction rates and equilibrium constants. Their work was at a salinity of 37.98 psu, close to the average salinity of seawater. Wang et al. (2010) [16] also investigated the effect of temperature on carbonate system rate constants over a range of 6.6 to 42.8 °C, at S = 0 psu, where S is the salinity. The rates of k1* and k−1* were found to increase with increasing temperature. These values provide a reference point to begin parsing the effect of thermal changes on carbonate reaction rates when compared to values determined in seawater. Johnson (1982) [11] measured the rate constants for the hydration and dehydration of carbon dioxide in seawater from 5° to 35 °C at a salinity of 33.77 psu.
Figure 3 shows the effect of changing temperature on the reaction rates of hydration and dehydration, comparing reaction rates determined at various salinities. Note the different scale on each axis. Salinities are in psu. Despite the wide range in salinity, the rate constants’ change with temperature is similar until about 25 °C, when the freshwater constants increase sharply while the constants measured at a higher salinity continue increasing at a slower rate. An additional factor is that as temperature increases, so does the dissociation of H+ from weak acids. These are neutralized by bicarbonate preferentially as the most abundant anion species present. The protonated bicarbonate, now carbonic acid, can undergo dehydration to water and dissolved CO2 gas. In tandem with this effect, as temperature increases, the solubility of gas in water also decreases, pushing the gas to evade from the water. This dual effect likely contributes to an elevated dehydration rate and evasion of CO2, consistent with the evasion expected from examining the timescales in Figure 2 [17].
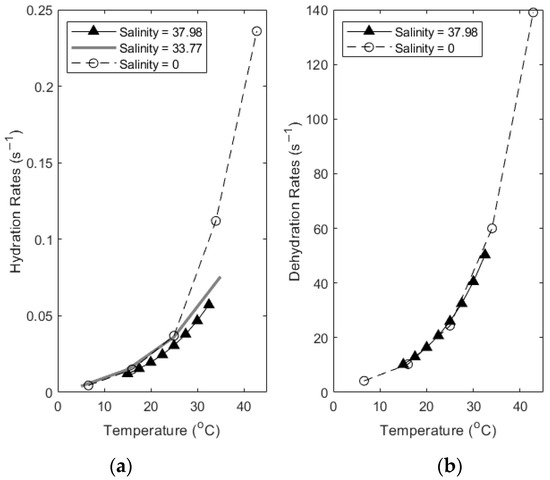
Figure 3.
Comparing thermal changes in k1* (a) and k−1* (b) values empirically determined at different salinities (Data from [11,15,16]).
5.2. Radial Equilibration
The salinity within an evaporating sea spray droplet can reach up to 130 psu; therefore, this upper limit is appropriate when investigating the effect of salinity on carbonate reaction rates in the aqueous droplet [6]. Evaporation beyond this point approaches droplet-to-aerosol transitions and is beyond the scope of this assessment. Unfortunately, most carbonate system equilibrium and rate constants are determined in bulk seawater or similar conditions. The salinity ranges of these data sets do not extend into the hypersaline conditions predicted in an evaporating sea spray drop. This has also been recognized for other high salinity environments, such as Arctic brine. Pitzer parameterizations for carbonate system rate constants in hypersaline conditions are particularly useful for these conditions and should be a priority for future research [18]. Here we have dealt with this uncertainty by assessing the reaction rates with no adjustment for additional non-ideal changes in rate constants due to hypersalinity. We compare experimentally determined rate constants at different salinities under the assumption of ideal conditions and extrapolate from the salinity range in which the values were measured.
Table 1 shows the response of the hydration and dehydration rate constants to increasing salinity at 25 °C. As salinity increases, the forward rate constant decreases (invasion) and the reverse rate constant increases (evasion). This translates to a trend of the forward reaction slowing and the reverse reaction becoming more rapid as salinity increases.

Table 1.
CO2 Hydration and Dehydration Rate Constants at 25 °C and Increasing Salinity from the Literature (Data from [11,15,16]).
It is important to note that conclusions drawn from comparing the experimental results shown in Table 1 are based on an examination of the behavior of the rate constants, assuming that the only reacting species are water and carbonate. Competing ionic reactions with salts are not considered. These may become significant at higher salinities. The actual reaction conditions in a sea spray droplet are expected to vary based on the mass and charge balances of the seawater. For example, the pH in submicron sea spray droplets decreases as evaporation progresses and can reach as low as 2 [19]. The timescale for this pH decrease from that of the sea surface microlayer (~8.0–7.8) is within the timescale of time aloft, though the final acidity of the droplet is dependent on several parameters (initial radius, temperatures of air and water, relative humidity, and wind velocity). As the H+ concentration increases, the carbonate equilibria are pushed away from ionic, basic species (HCO3− and CO32−) towards CO2 and outgassing. At pH ≤ 4, nearly all the inorganic carbon species are converted to CO2 gas [10] for evasion. This effect would be stronger than the small changes to the equilibria caused by temperature and salinity. Therefore, we expect the evasion to be significantly higher than that predicted by physical changes alone and that these ideal conditions render a conservative estimate of the evasion potential. This would magnify the expected effect of sea spray as a vector, pumping CO2 out of the ocean and generating CO2 from sequestered inorganic carbon through evaporation, returning it into the atmosphere.
6. Carbonate System Equilibrium Constant Responses to Changes in Temperature and Salinity
6.1. Thermal Equilibration
In the thermal equilibration stage, the changing droplet temperature may affect the balance of carbonate species present in the sea spray droplet. To quantify this effect, we examine the dependence on temperature of the carbonate system equilibrium constants, as published in the literature and used in the CO2SYS system [20]. Millero et al. (2006) [21] used experimental data in real seawater to derive equations for the response of K1* and K2 to changes in T and S. Their range was S = 0 to 50 psu and T = 0 to 50 °C. In their work, they compared empirical values, error margins, and equations adjusting K1* and K2 for changing temperature and salinity from five previous studies [22,23,24,25,26].
The values of both K1* and K2 increase slightly with increasing temperature. This trend indicates a slight shift that favors both the hydration of CO2 gas and the deprotonation to bicarbonate and the further deprotonation from bicarbonate to carbonate. However, the change over a typical temperature gradient is relatively small. For example, a temperature gradient from 1 to 5 °C at a salinity of 35 psu shifts the equilibrium constants by 15% [21]. In a sea spray droplet that cools while it is aloft, the reverse reactions converting carbonate and bicarbonate ions to CO2 gas capable of evasion would therefore continue to be favored. In this early stage aloft, it is the air–sea temperature differential that drives CO2 invasion or evasion from the droplet.
6.2. Radial Equilibration
As salinity increases in an evaporating droplet, the balance of carbonate species present in the sea spray droplet also changes. Millero et al. (2006) [21] found that as salinity increases, the equilibrium constants for both hydration of CO2 gas and the deprotonation of bicarbonate to carbonate slightly increase. Empirical measurements of carbonate system equilibrium constants in salinities up to 100 psu have been published for studies of sea ice brine, which better reflect the hypersaline conditions of an evaporating sea spray droplet [27]. These brine constants confirm the trend of increasing equilibrium constants with increasing salinity seen in the lower-salinity studies of Millero et al. (2006) [21].
The increasing values of K1* and K2 with increasing salinity indicate that as the salinity increases, the hydration of CO2 gas into carbonic acid and its deprotonation into bicarbonate and carbonate becomes increasingly favored. However, in this stage, evasion of CO2 from the droplet dominates any potential invasion, resulting in the droplet transferring CO2 from the ocean to the atmosphere. For example, an increase in salinity from 20 to 43 psu at 20 °C increases the pK1* value from 5.959 to 5.857, representing a 1.7% change. Under the same conditions, the pK2 value changes from 9.21 to 8.958, representing a 2.7% change [21]. This is due to increasing ionic interactions with the carbonate and bicarbonate ions as the salinity increases. These interactions would slightly increase the energy barrier for the bicarbonate and carbonate ions to react to their less ionic stages, though the very small equilibrium constants still overwhelmingly favor the reverse reactions overall (dehydration) [21,27]. This rationale excludes the non-ideal effects of competing reactions.
7. Conclusions
Since there are no literature values for carbonate system rate constants in hypersaline conditions, data were extrapolated without accounting for competing ionic reactions. These competing interactions are expected to increase with salinity and may become significant at hypersaline conditions. This study also did not consider other competing effects or physical interference that may arise from sources such as the sea surface microlayer, organic reactions, or biological reactions.
Under these assumptions, the dehydration of bicarbonate to CO2 controls gas evasion, and as the rate of this reaction is significantly faster than droplets’ time aloft, the reaction itself does not limit the evasion of carbon from the droplet as CO2 gas. On the other hand, hydration is limited by an initial droplet size and is decoupled with physical equilibria in droplets with an initial radius over 45 µm.
Changing conditions in a sea spray droplet as it cools in the atmosphere and begins evaporating further slow the rate of hydration and increase the rate of dehydration. These effects combine to prevent sea spray droplets from taking up any significant additional carbon while aloft but rather contribute to the evasion of the carbon (both CO2 gas and carbonate species) they initially contained. It is expected that sea spray droplets are therefore a net source of CO2 from the ocean to the atmosphere to a degree that greatly surpasses the initial CO2 content itself. Evaporating sea spray droplets are CO2 generators, shifting dissolved carbonate and bicarbonate species from an ionic dissolved state to a gas capable of evasion.
Author Contributions
Writing—original draft preparation, L.H.; writing—review and editing, all authors; funding acquisition, P.V. and L.R. All authors have read and agreed to the published version of the manuscript.
Funding
This research was funded by the United States of America’s National Science Foundation, Award #2218781.
Data Availability Statement
No new data were created or analyzed in this study. Data sharing is not applicable to this article.
Conflicts of Interest
The authors declare no conflicts of interest. The funders had no role in the design of the study; in the collection, analyses, or interpretation of data; in the writing of the manuscript; or in the decision to publish the results.
References
- Wanninkhof, R. Relationship between wind speed and gas exchange over the ocean revisited. Limnol. Oceanogr. Methods 2014, 12, 351–362. [Google Scholar] [CrossRef]
- Erinin, M.A.; Wang, S.D.; Liu, R.; Towle, D.; Liu, X.; Duncan, J.H. Spray Generation by a Plunging Breaker. Geophys. Res. Lett. 2019, 46, 8244–8251. [Google Scholar] [CrossRef]
- Veron, F. Ocean Spray. Annu. Rev. Fluid Mech. 2015, 47, 507–538. [Google Scholar] [CrossRef]
- Andreas, E.L. Sea spray and the turbulent air-sea heat fluxes. J. Geophys. Res. Ocean. 1992, 97, 11429–11441. [Google Scholar] [CrossRef]
- Andreas, E.L.; Vlahos, P.; Monahan, E.C. The potential role of sea spray droplets in facilitating air-sea gas transfer. IOP Conf. Ser. Earth Environ. Sci. 2016, 35, 012003. [Google Scholar] [CrossRef]
- Andreas, E.L.; Vlahos, P.; Monahan, E.C. Spray-Mediated Air-Sea Gas Exchange: The Governing Time Scales. J. Mar. Sci. Eng. 2017, 5, 60. [Google Scholar] [CrossRef]
- Fairall, C.; Kepert, J.; Holland, G. The effect of sea spray on surface energy transports over the ocean. Glob. Atmos. Ocean. Syst. 1995, 2, 121–142. [Google Scholar]
- Staniec, A.; Vlahos, P.; Monahan, E.C. The role of sea spray in atmosphere–ocean gas exchange. Nat. Geosci. 2021, 14, 593–598. [Google Scholar] [CrossRef]
- Harned, H.S.; Scholes, S.R., Jr. The Ionization Constant of HCO3- from 0 to 50°. J. Am. Chem. Soc. 1941, 63, 1706–1709. [Google Scholar] [CrossRef]
- Stumm, W.; Morgan, J.J. Aquatic Chemistry: Chemical Equilibria and Rates in Natural Waters, 3rd ed.; John Wiley & Sons, Inc.: Hoboken, NJ, USA, 1996. [Google Scholar]
- Johnson, K.S. Carbon dioxide hydration and dehydration kinetics in seawater. Limnol. Oceanogr. 1982, 27, 849–855. [Google Scholar] [CrossRef]
- Andreas, E.L. Time constants for the evolution of sea spray droplets. Tellus B 1990, 42, 481–497. [Google Scholar] [CrossRef]
- Monahan, E.C.; Staniec, A.; Vlahos, P. Spume Drops: Their Potential Role in Air-Sea Gas Exchange. J. Geophys. Res. Ocean. 2017, 122, 9500–9517. [Google Scholar] [CrossRef]
- Wartha, E.-M.; Bösenhofer, M.; Harasek, M. Characteristic Chemical Time Scales for Reactive Flow Modeling. Combust. Sci. Technol. 2021, 193, 2807–2832. [Google Scholar] [CrossRef]
- Soli, A.L.; Byrne, R.H. CO2 system hydration and dehydration kinetics and the equilibrium CO2/H2CO3 ratio in aqueous NaCl solution. Mar. Chem. 2002, 78, 65–73. [Google Scholar] [CrossRef]
- Wang, X.; Conway, W.; Burns, R.; McCann, N.; Maeder, M. Comprehensive Study of the Hydration and Dehydration Reactions of Carbon Dioxide in Aqueous Solution. J. Phys. Chem. A 2010, 114, 1734–1740. [Google Scholar] [CrossRef]
- Jiang, L.-Q.; Carter, B.R.; Feely, R.A.; Lauvset, S.K.; Olsen, A. Surface ocean pH and buffer capacity: Past, present and future. Sci. Rep. 2019, 9, 18624. [Google Scholar] [CrossRef] [PubMed]
- Brown, K.A.; Miller, L.A.; Davelaar, M.; Francois, R.; Tortell, P.D. Over-determination of the carbonate system in natural sea-ice brine and assessment of carbonic acid dissociation constants under low temperature, high salinity conditions. Mar. Chem. 2014, 165, 36–45. [Google Scholar] [CrossRef]
- Angle, K.J.; Crocker, D.R.; Simpson, R.M.; Mayer, K.J.; Garofalo, L.A.; Moore, A.N.; Mora Garcia, S.L.; Or, V.W.; Srinivasan, S.; Farhan, M.; et al. Acidity across the interface from the ocean surface to sea spray aerosol. Proc. Natl. Acad. Sci. USA 2021, 118, e2018397118. [Google Scholar] [CrossRef] [PubMed]
- Orr, J.C.; Epitalon, J.-M.; Dickson, A.G.; Gattuso, J.-P. Routine uncertainty propagation for the marine carbon dioxide system. Mar. Chem. 2018, 207, 84–107. [Google Scholar] [CrossRef]
- Millero, F.J.; Graham, T.B.; Huang, F.; Bustos-Serrano, H.; Pierrot, D. Dissociation constants of carbonic acid in seawater as a function of salinity and temperature. Mar. Chem. 2006, 100, 80–94. [Google Scholar] [CrossRef]
- Hansson, I. The determination of dissociation constants of carbonic acid in synthetic sea water in the salinity range of 20–40‰ and temperature range of 5–30 °C. Acta Chem. Scandanavia 1973, 27, 931–944. [Google Scholar] [CrossRef]
- Mehrbach, C.; Culberson, C.H.; Hawley, J.E.; Pytkowicx, R.M. Measurement of the Apparent Dissociation Constants of Carbonic Acid in Seawater at Atmospheric Pressure1. Limnol. Oceanogr. 1973, 18, 897–907. [Google Scholar] [CrossRef]
- Goyet, C.; Poisson, A. New determination of carbonic acid dissociation constants in seawater as a function of temperature and salinity. Deep. Sea Res. Part A Oceanogr. Res. Pap. 1989, 36, 1635–1654. [Google Scholar] [CrossRef]
- Roy, R.N.; Roy, L.N.; Vogel, K.M.; Porter-Moore, C.; Pearson, T.; Good, E.; Millero, F.J.; Campbell, D.M. The dissociation constants of carbonic acid in seawater at salinities 5 to 45 and temperatures 0 to 45 °C. Mar. Chem. 1993, 44, 249–267. [Google Scholar] [CrossRef]
- Prieto, F.J.M.; Millero, F.J. The values of pK1 + pK2 for the dissociation of carbonic acid in seawater. Geochim. Cosmochim. Acta 2002, 66, 2529–2540. [Google Scholar] [CrossRef]
- Papadimitriou, S.; Loucaides, S.; Rérolle, V.M.C.; Kennedy, P.; Achterberg, E.P.; Dickson, A.G.; Mowlem, M.; Kennedy, H. The stoichiometric dissociation constants of carbonic acid in seawater brines from 298 to 267 K. Geochim. Cosmochim. Acta 2018, 220, 55–70. [Google Scholar] [CrossRef]
Disclaimer/Publisher’s Note: The statements, opinions and data contained in all publications are solely those of the individual author(s) and contributor(s) and not of MDPI and/or the editor(s). MDPI and/or the editor(s) disclaim responsibility for any injury to people or property resulting from any ideas, methods, instructions or products referred to in the content. |
© 2024 by the authors. Licensee MDPI, Basel, Switzerland. This article is an open access article distributed under the terms and conditions of the Creative Commons Attribution (CC BY) license (https://creativecommons.org/licenses/by/4.0/).