Article

Risk Performance Analysis on Navigation of MASS via a Hybrid Framework of STPA and HMM: Evidence from the Human–Machine Co-Driving Mode

1
School of Nautical Technology, Jiangsu Shipping College, Nantong 226010, China
2
Merchant Marine College, Shanghai Maritime University, Shanghai 201306, China
*
Authors to whom correspondence should be addressed.
J. Mar. Sci. Eng. 2024, 12(7), 1129; https://doi.org/10.3390/jmse12071129
Submission received: 2 June 2024 / Revised: 28 June 2024 / Accepted: 2 July 2024 / Published: 5 July 2024
(This article belongs to the Section Ocean Engineering)

Abstract

:
The remote control ship is considered to be the most likely implementation of maritime autonomous surface ships (MASS) in the near-term future. With collaborative control from onboard controllers and operators ashore, ships may operate in three navigation control modes (NCMs), manual, autonomous, and remote control, based on different levels of control authority. The scientific selection of the appropriate NCM for MASS under multiple driving modes is crucial for ensuring ship navigation safety and holds significant importance for operators and regulatory authorities overseeing maritime traffic within specific areas. To aid in selecting the proper NCM, this study introduces a risk-based comparison method for determining optimal control modes in specific scenarios. Firstly, safety control paths and processes for MASS under different NCMs are constructed and analyzed using system-theoretic process analysis (STPA). By analyzing unsafe system control actions, key Risk Influencing Factors (RIFs) and their interrelationships are identified. Secondly, a Hidden Markov Model (HMM) process risk assessment model is developed to infer risk performance (hidden state) through measuring RIF states. Cloud modeling with expert judgments is utilized to parameterize the HMM while addressing inherent uncertainty. Lastly, the applicability of the proposed framework was verified through simulation case studies. Typical navigation scenarios of conventional ships in coastal waters were chosen, and real-time data collected by relevant sensors during navigation were used as simulation inputs. Results suggest that in the same scenario, process risks differ among the analyzed NCMs. Traffic complexity, traffic density, and current become the primary factors influencing navigation risks, and it is necessary to select the appropriate NCM based on their real-time changes.

1. Introduction

There is a growing global research interest in the field of maritime autonomous surface ships (MASS) [1,2,3,4,5,6,7,8,9,10]. Concerning the safety of MASS, there is a broad consensus in the industry that “at least not lower than the safety level of traditional manned ships”. Currently, significant advancements have been made in key technologies such as ship design, intelligent collision avoidance, navigation and control to ensure the inherent safety of autonomous ships. Furthermore, during the 101st Maritime Safety Committee meeting [11], Interim Guidelines for MASS Trial Voyages were adopted, marking a milestone in permitting MASS trials. These guidelines are crucial in assisting relevant authorities and stakeholders to ensure the safety of MASS trials. Accordingly, the practical operation of a large-scale MASS is anticipated. However, alongside technological development benefits, it is essential to consider their impact on MASS navigation safety [12].
In order to delineate the developmental trajectory of MASS, the IMO’s Maritime Safety Committee [13] categorizes it into four levels and acknowledges that MASS may operate at one or more autonomy levels during a single voyage. Different degrees of autonomy imply that the ship can utilize various navigation control modes (NCMs), which encompass three modes based on differences in control rights: manual, autonomous, and remote control. In the initial phases of autonomous navigation technology development and application, considering technological maturity and safety, manual control modes may still be regarded as a contingency option configured across different autonomy levels of MASS to facilitate onboard operator management and control when necessary. Consequently, it is anticipated that multiple NCMs will become a new trend for MASS within a single voyage. Confronted with a dynamic and uncertain external environment, scientifically selecting appropriate NCMs becomes pivotal in ensuring the safety of MASS navigation, which is related to the process of commercial development of MASS. However, there are currently limited articles on this issue, especially the establishment of criteria for selecting the appropriate NCMs based on the perspective of risk control, which remain open questions.
Navigational risks, such as collision, grounding, stranding, and sinking, are expected to remain the primary risk categories in future maritime transportation systems where MASS are projected to operate [14]. The causes of these navigational risks typically encompass human unsafe behaviors, object states that compromise safety, and hazardous environmental conditions. These factors continue to be relevant for autonomous ships, particularly those under remote control. In comparison with conventional cargo vessels, the interaction and control processes of system components have become more intricate. According to [6,15], object detection and interactions with manned vessels represent the most significant hazard category for MASS navigation safety. Additionally, threats concerning network and communication security have presented novel challenges to MASS. AIS, GMDSS, and ship–shore communication systems are all regarded as high-risk system modules. In contrast to traditional manned ships, MASS needs to pay twice as much attention to the vulnerability of information and communication systems. In addition to preventing hacker attacks, interference or fraudulent signals from AIS or GNSS systems can also cause network security issues, thereby influencing the navigation safety of ships [10].
In terms of identifying the navigation Risk Influencing Factors (RIFs) of MASS, most of the literature [16,17,18,19] has relied on expert judgment. However, a few studies have utilized conventional ship accident statistics as data sources and conducted differential analyses to identify factors or potential risk events affecting the navigation safety of MASS [10,12,20,21,22]. Based on expert knowledge analysis, the literature [1] concludes that the reliability of ship hardware and software equipment constitutes the main factor for the safe operation of autonomous ships. Through comprehensive literature analysis and expert research, Fan et al. [23] identified 55 RIFs, including 12 newly discovered technical factors such as insufficient redundancy and communication loss. Interestingly, autonomous ships are not exempt from human factor influences; these do not originate from the crew but rather from operators in a Shore-based Control Center (SCC) [6,24]. Consequently, the consideration of human factors by SCC operators has been extensively discussed. According to [25], SCC operator roles resemble those of regular ship crew members with responsibilities encompassing “monitoring the ship and intervening when necessary”. However, it is argued that overall responsibility for SCC operators will be even more critical [26]. The identified RIFs have established the groundwork for the subsequent risk analysis endeavors.
In the quantitative analysis of MASS navigation safety risk, there has been a growing focus on measuring uncertainty in unexpected events by scholars [27]. Conventional risk analysis methodologies such as Formal Safety Assessment (FSA), Failure Mode and Effects Analysis (FMEA) [20], and Hazard and Operability Analysis (HZAOP) [6,21] have been utilized for risk assessment in the context of MASS. However, these methods face challenges in accurately describing the nonlinear correlations and interactions among system components within the complex intelligent ship system. Given these limitations, particularly with respect to couplings between systems and emerging issues related to complex systems and system safety, the STPA method has been proposed [28]. The feasibility of using the STPA method for analyzing MASS risks has been verified [29,30], as it can reveal correlations between systems or elements through constructing a hierarchical control structure. This approach effectively represents process risks through information interaction [31]. For the first time, the STPA method was systematically used to analyze the safety control structure of remote-controlled and fully autonomous merchant ships; its results offer significant guidance for identifying and controlling MASS risks throughout their life cycle. Nevertheless, while excelling in qualitative analysis, the strength of the STPA method lies in its qualitative assessment but presents limitations in quantitative evaluation. Therefore, exploring how to integrate it with traditional quantitative risk analysis methods to provide new insights into quantifying MASS navigation risks represents an important area for further research.
As an extension of the FSA method, significant progress has been made in the risk assessment of ship navigation under random processes. A process can be understood as the manner in which events unfold and develop amidst spatiotemporal changes, representing a set of interconnected activities that yield anticipated outcomes through initial input. Building upon the assumption of a Markov process, studies [32,33] have treated changes in ship navigation risks over time as a stochastic process with Markov characteristics. The evolution of risk processes was analyzed using Monte Carlo methods based on cloud models and Markov chains, leading to the quantification of operational risks within complex systems. Furthermore, research on risk theories has entered into the Safety II era [34]. For intricate human–machine systems, it is crucial and challenging to measure nonlinear correlations between RIFs (Risk Influencing Factors), quantify random variables and phenomena resulting from correlation effects, and elucidate evolutionary characteristics of system process risks over time series data. The Hidden Markov model (HMM) excels at inferring unobservable parameters while considering probabilistic properties of observed vector sequences; it is particularly well suited for applications involving distinct stage-based processes occurring sequentially based on their unique characteristics. HMM has demonstrated its value across various scientific disciplines through modeling, simulation, and practical applications [35,36,37,38,39], including traffic congestion situation assessment [40], vehicle trajectory prediction [41,42], among other areas [43,44].
The development of MASS is gradual. It is anticipated that the ship–shore collaboration mode will be the most stable and achievable. When confronted with changes in the complex external environment, determining the ships’ driving mode from the risk control perspective requires careful thought. Therefore, the main contribution of this article is to propose a comprehensive risk-based comparison method, providing a theoretical basis for the selection of the optimal driving mode.
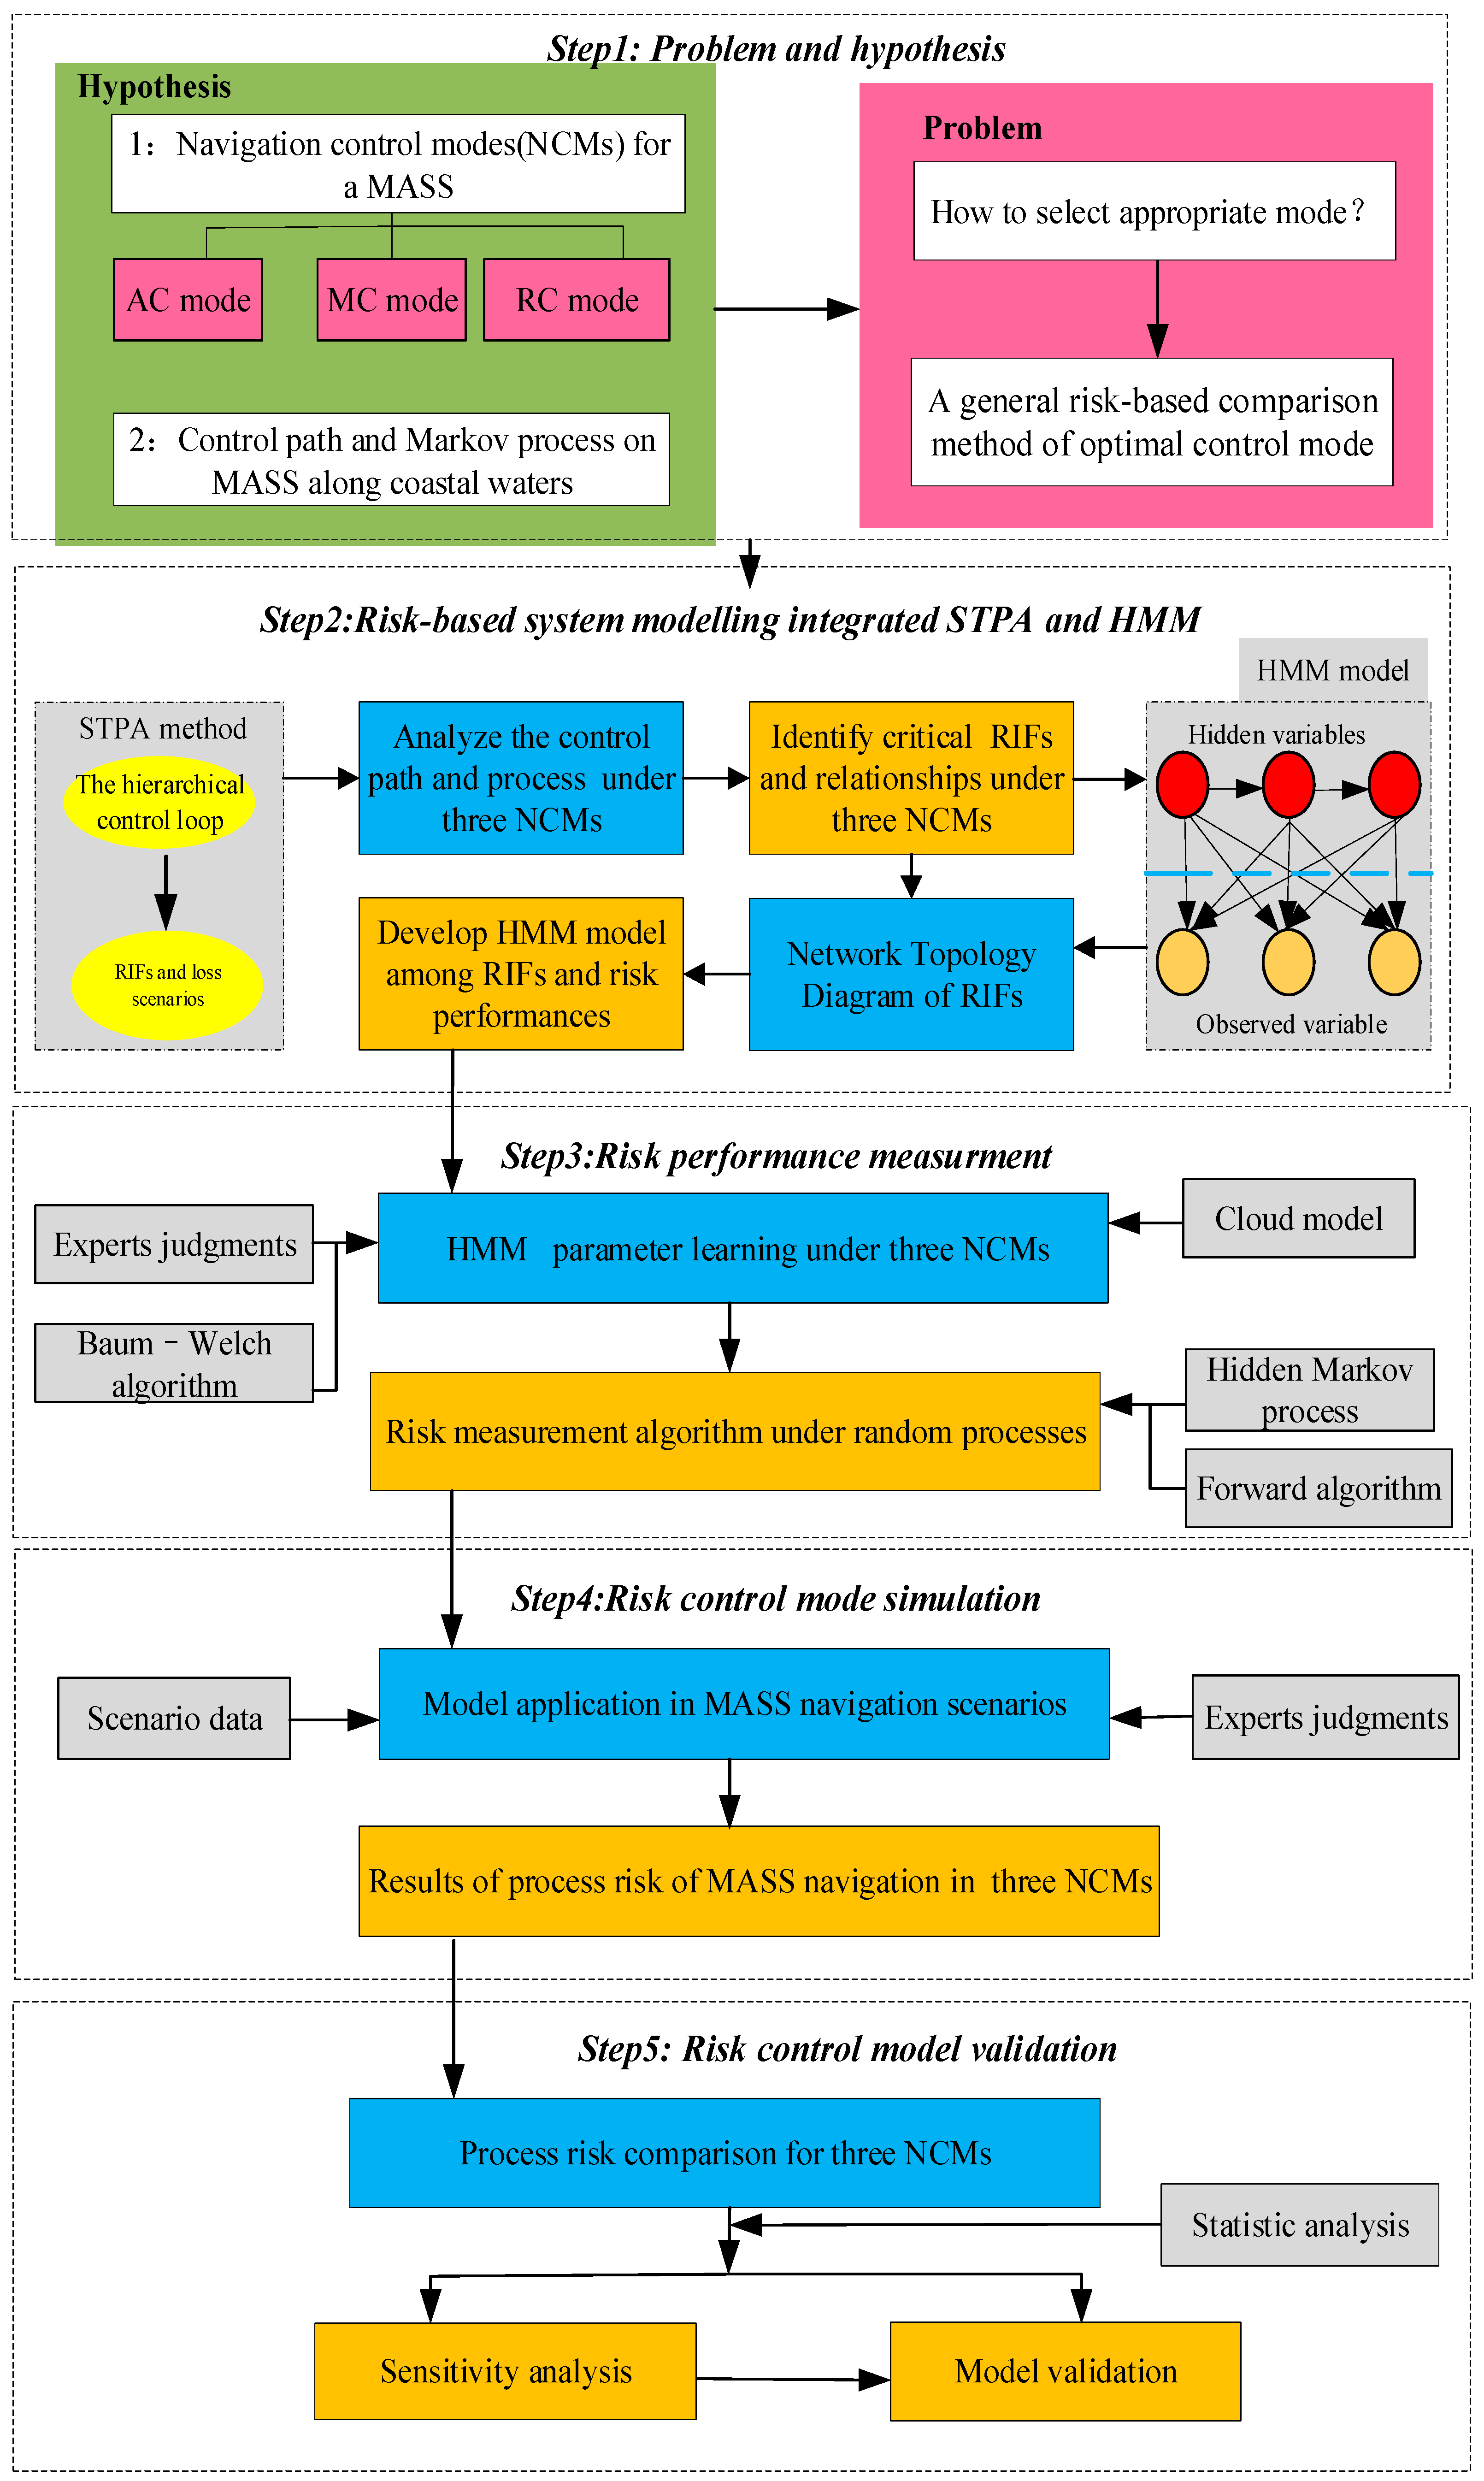
  • The model will be utilized to conduct a risk-based comparison of MASS navigation in specific scenarios. By comparing the dynamic evolution process of ship navigation risks under different NCMs, it can offer valuable insights for operators and regulatory authorities involved in monitoring and managing maritime traffic to select suitable NCMs.
  • To accomplish this objective, this article extensively leverages the robust modeling capabilities of STPA and HMM. From the perspective of system safety control paths and processes, the STPA method is employed to analyze the composition and interrelation of risk factors under three NCMs while identifying the most representative observation factors as input variables for the HMM.
  • By organically integrating STPA and HMM, it unveils the changing patterns in hidden states of process risk associated with MASS under three NCMs, thereby laying a theoretical foundation for a more scientific and comprehensive understanding of MASS navigation risks.
The structure of this paper is as follows: Section 2 introduces the proposed framework, which includes risk-based system modeling, a risk measurement algorithm, and simulation steps. In Section 3, we present the application of STPA-HMMs in scenarios involving coastal open waters, along with the results of risk evolution for the MASS navigation process under three NCMs and verification of model sensitivity. The findings are discussed in Section 4, followed by a summary of study conclusions in Section 5.

2. Methodology

2.1. Framework and Approach

2.1.1. Conceptual Framework of Approach

The research framework of approach in Figure 1 shows the five main research stages.
Stage 1: Problem and hypothesis. Drawing from relevant literature, this study proposes two hypotheses: (1) assuming that MASS has three navigation control modes (AC, MC, and RC); (2) it exhibits distinct control paths under different NCMs, and the risk performances demonstrate Markov properties within time series data. Building upon these foundations, this paper focuses on the selection of appropriate NCMs; hence, it is imperative to introduce a comprehensive risk-based comparison method for optimal control modes.
Stage 2: Risk-based system modelling integrated STPA and HMM. A comprehensive model for the dynamic quantification of risk in MASS navigation is formulated through the integration of STPA and HMM methodologies. The STPA method dissects the system’s control processes and identifies navigation Risk Influencing Factors (RIFs) under different NCMs. Meanwhile, the HMM is employed to deduce the latent state of system risk by dynamically evaluating observable RIF states.
Stage 3: Risk performance measurement. In order to parameterize the HMM, a cloud model incorporating expert judgments is utilized to expand training samples, followed by the application of the Baum–Welch algorithm to obtain the HMM parameters. Subsequently, the forward and backward algorithms are employed to quantify risk performance under three NCMs.
Stage 4: Risk control mode simulation. The developed STPA-HMM is then implemented for simulating process risks in MASS navigation scenarios under three NCMs, enabling the acquisition of risk performance results.
Stage 5: Risk control model validation. By comparing the risk performance of MASS navigation across three NCMs, insights into risk evolution characteristics amidst spatiotemporal changes can be derived. The model is subsequently validated through sensitivity analysis, literature comparison, and expert validation to identify critical RIFs. Finally, relevant suggestions are provided based on parameter learning from multiple simulation data.

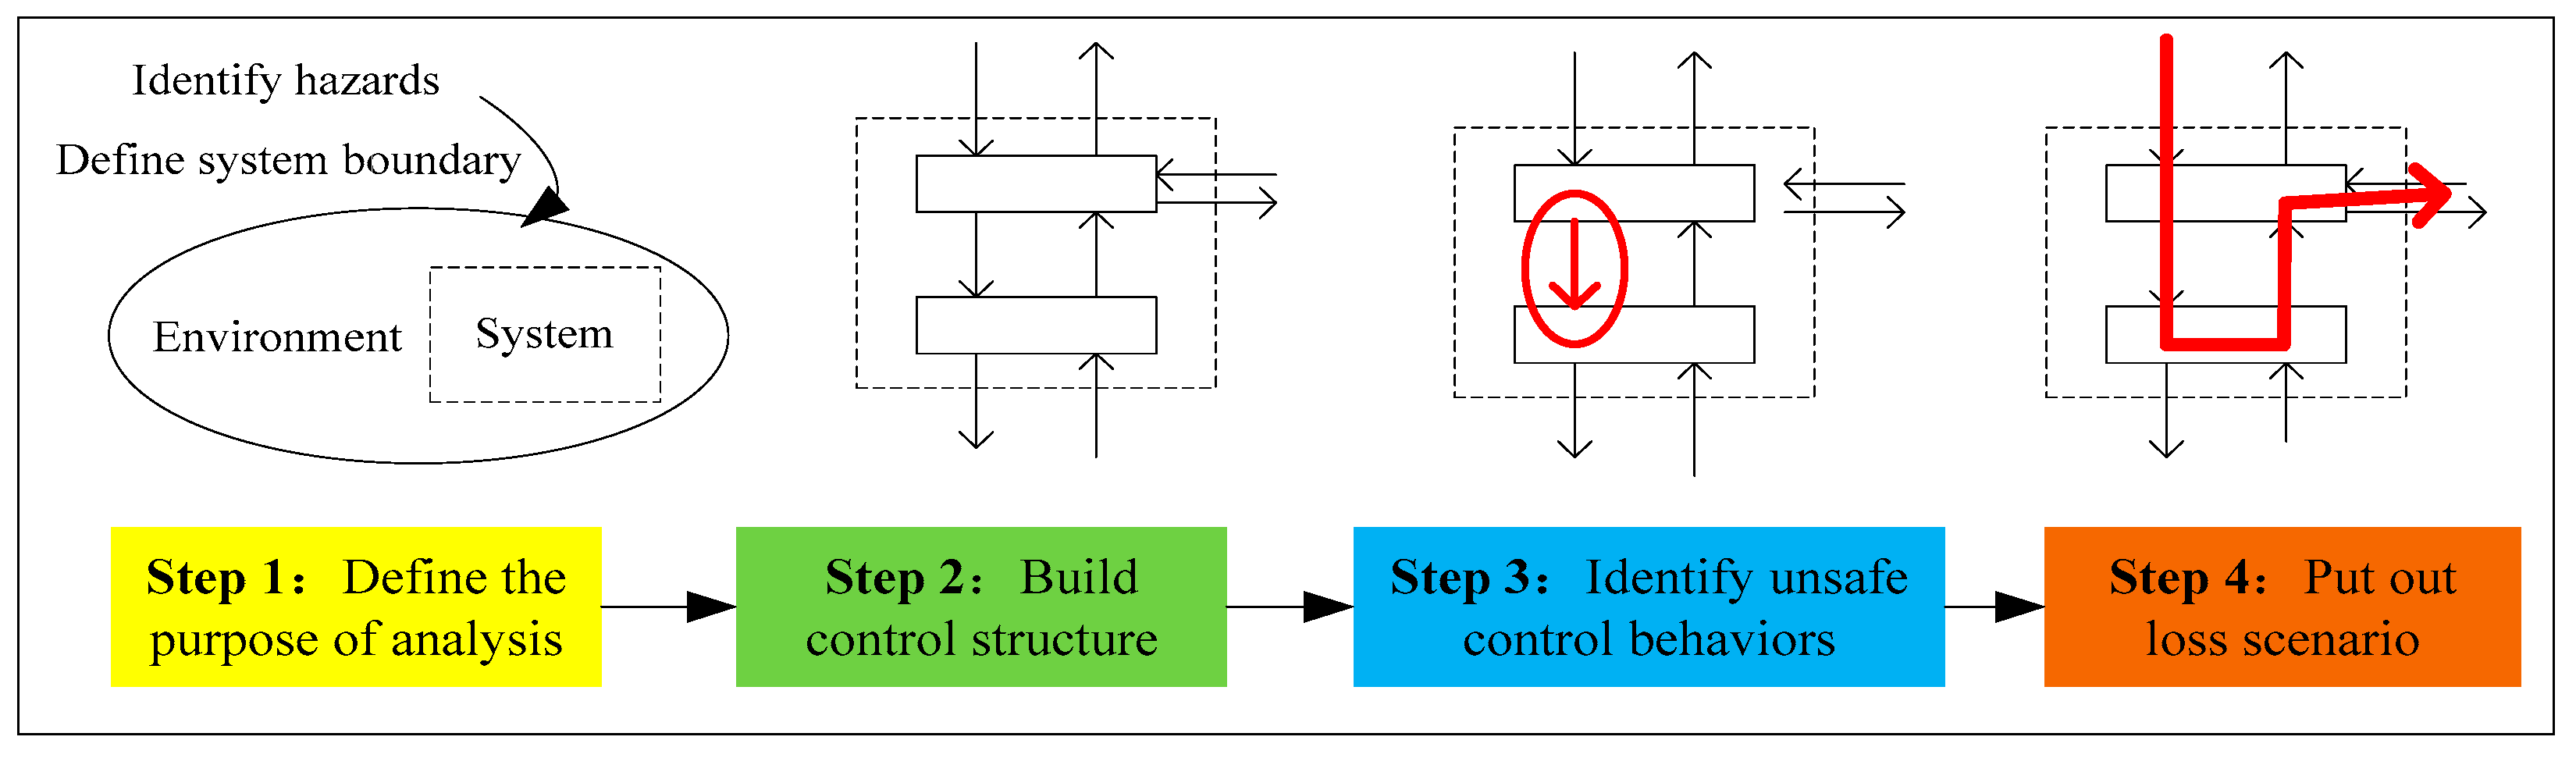
2.1.2. The STPA Method

The STPA method is a systematic safety assessment technique rooted in system-theoretic accident modeling and processes (STAMP). It approaches system safety as a control problem rather than one of component failure [45]. This top-down analysis method constructs a system model using functional control diagrams, diverging from the physical component diagrams utilized in traditional hazard analysis methods. Notably, STPA comprises four consecutive steps that can be iteratively implemented at any level of abstraction.
In comparison to traditional hazard analysis techniques, STPA offers greater precision in identifying safety requirements by pinpointing constraints from each causal factor and hazard scenario, particularly those associated with software, system design, and human behavior [28]. STPA delineates four unsafe control actions (depicted as the Stage 3 red arrow in Figure 2), which encompass:
(a)
Failure to provide necessary safety control actions (or providing correct control instructions that are not implemented);
(b)
Provision of incorrect or unsafe control behavior;
(c)
Delay in executing the correct control behavior;
(d)
Execution of the correct control behavior at an inappropriate time, resulting in premature or delayed action.
By identifying unsafe control behaviors and analyzing specific scenarios while considering the transmission process of system security constraints, it becomes feasible to map the control loop to specific physical components. Furthermore, refining constraint relationships between components enables identification of specific influencing factors leading to unsafe control behaviors.

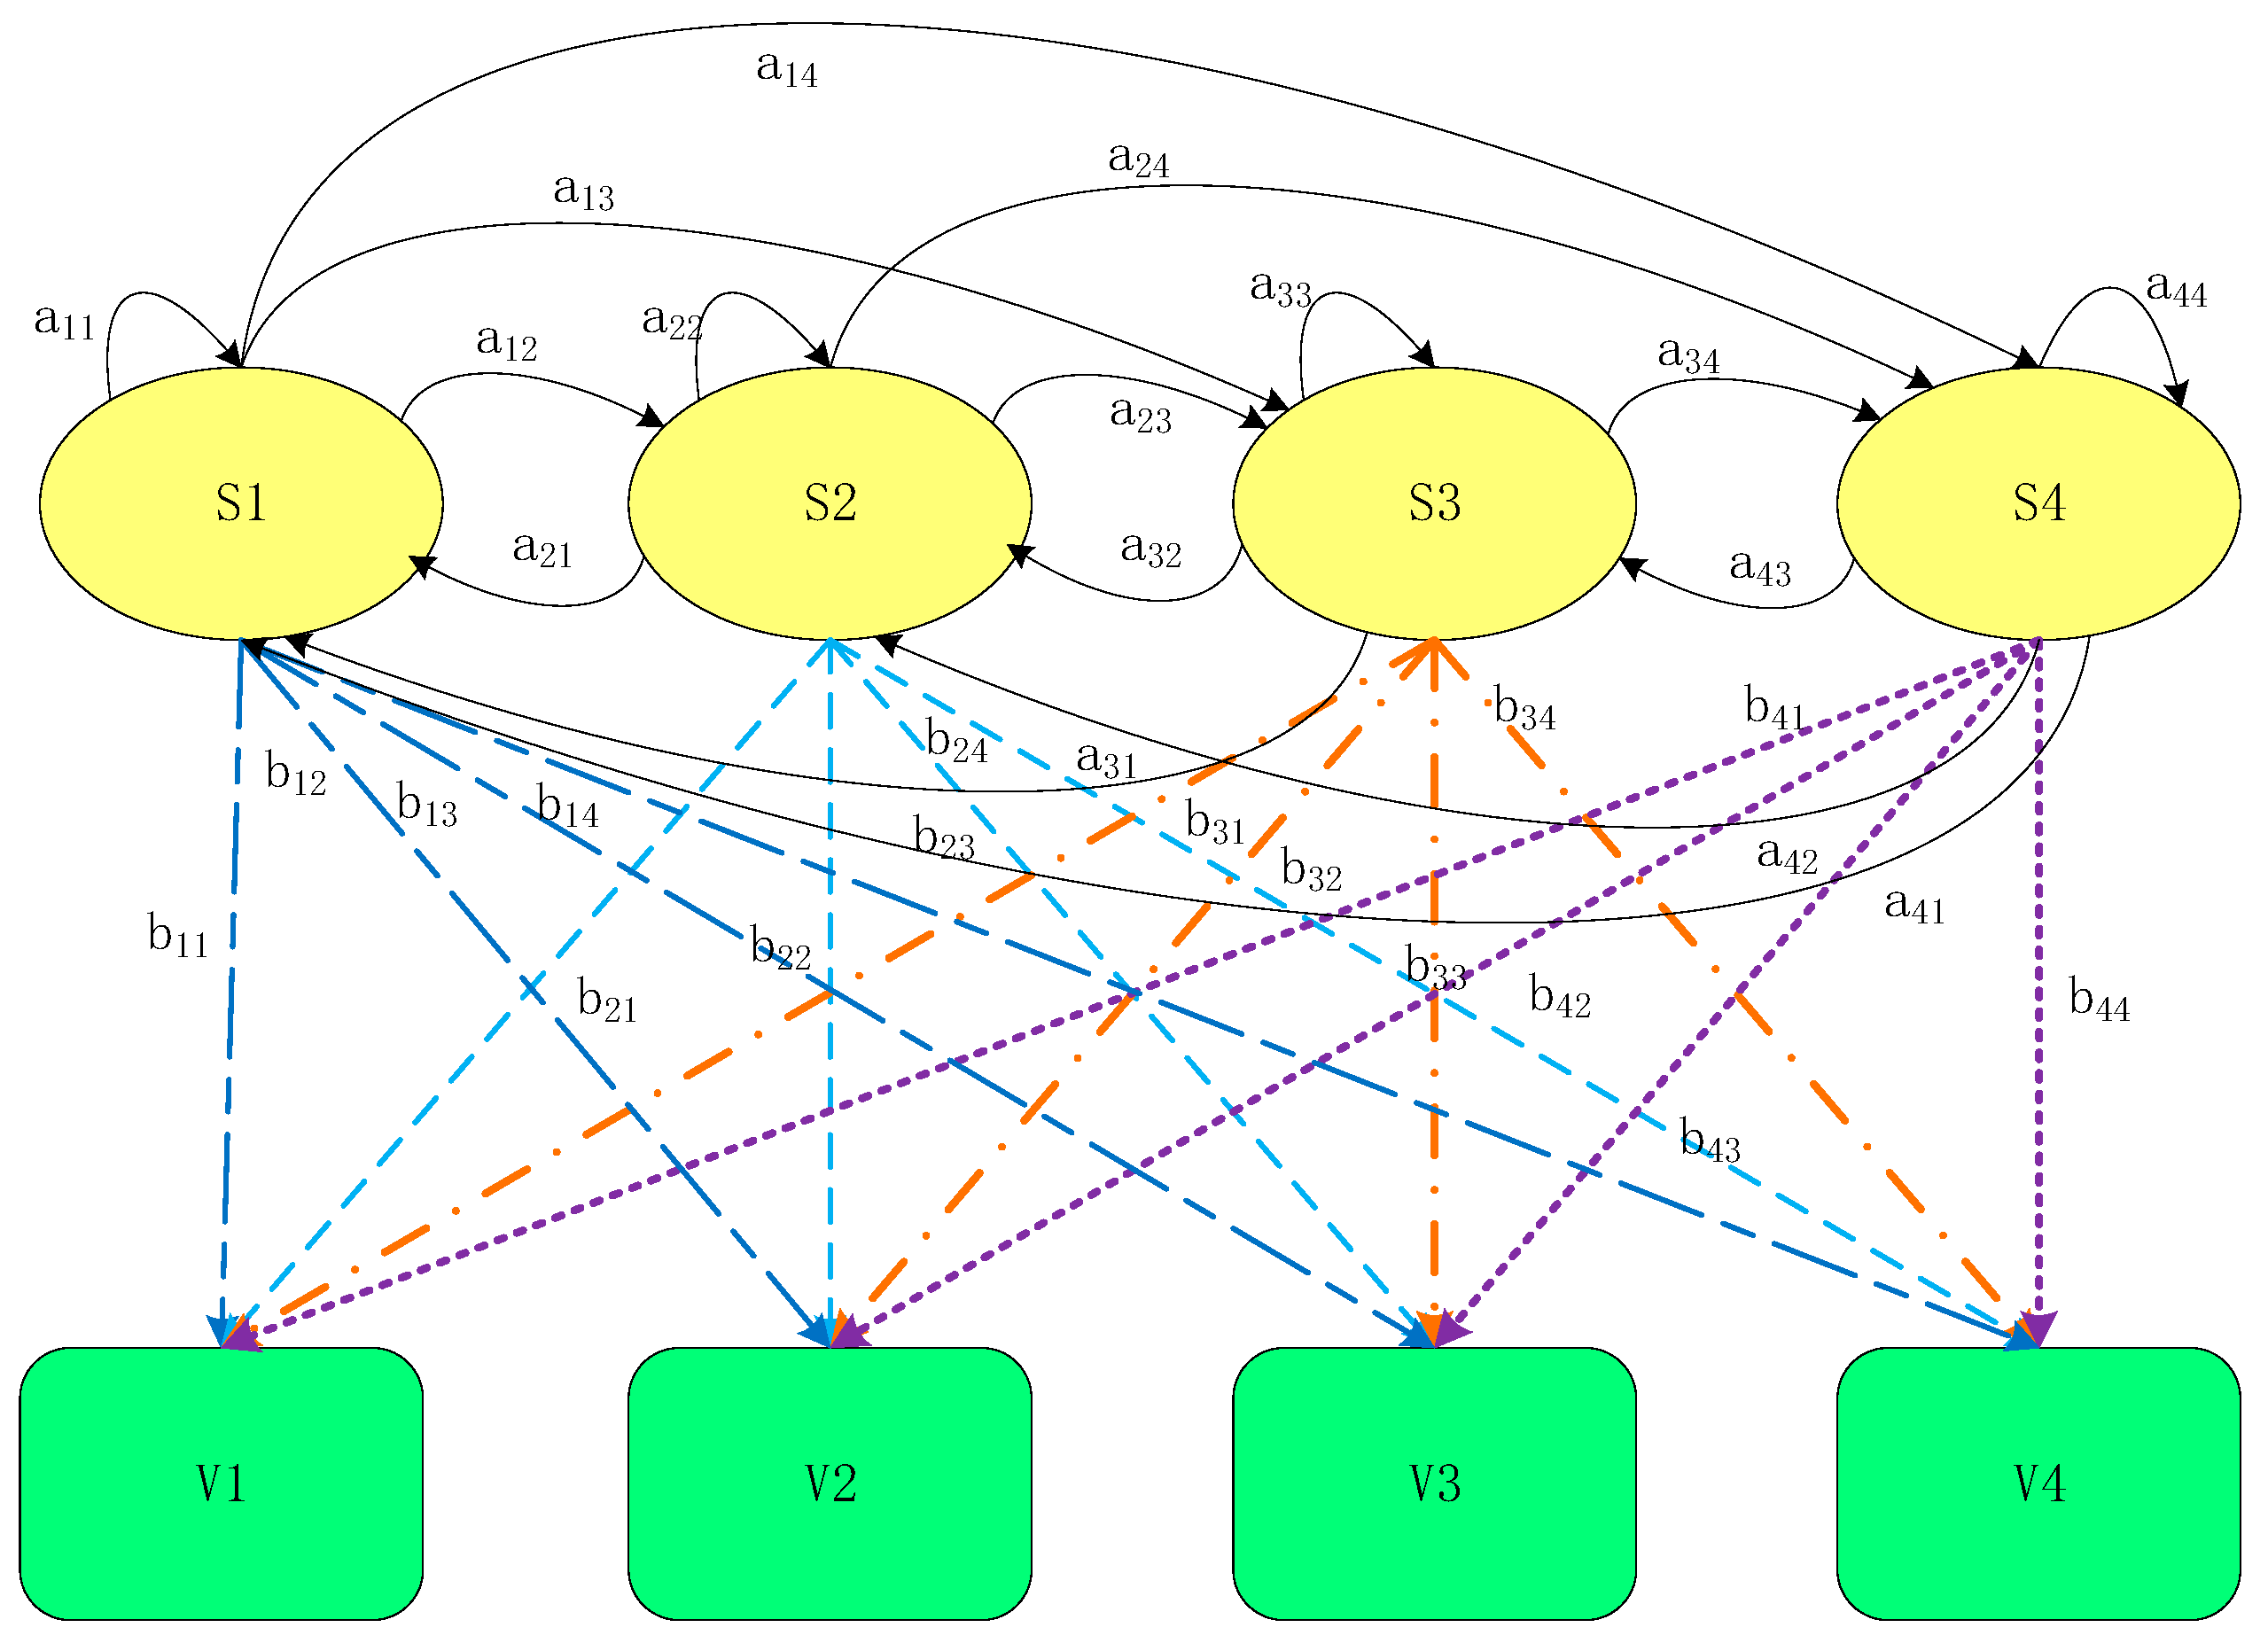
2.1.3. Hidden Markov Models

HMM is a statistical model for time series data based on the Markov Process. It is a doubly stochastic process, comprising a Markov process consisting of unknown or hidden parameters, and the generation of observable random sequences from these hidden states. This model enables the identification of hidden parameters using observed parameters [43]. The system under consideration in an HMM is assumed to be a Markov process with unknown parameters, presenting the significant challenge of determining latent and unobservable variables from those that are observable.
Definition 1.
For a first-order discrete HMM, which is a randomly generated model of time series, 5 elements λ = ( N , M , π , A , B ) can be used to define the model.
(1)
N: set of N states in a model,  S = s 1 , s 2 , , s N  represent a collection of finite states, which are not visible and cannot be measured directly.
(2)
M: number of observations that can be obtained, V = {v1, v2, …, vM} represent a collection of all possible observation.
(3)
π : initial probability distribution over states vector,  π = [ π i ]  where:
π i = P ( y 1 = s i ) , 1 i N ,   a n d   i = 1 N π i = 1 ,   0 π i 1
(4)
A: the probability distribution of the state transition, which is given by:
A = a i j , a i j = P ( y t + 1 = s j y t = s i ) , i , j = 1 , 2 , , N , i = 1 N a i j = 1
(5)
B: observation likelihood matrix, which is given by:
B = b i k , b i k = P ( x t = v k y t = s i ) , i = 1 , 2 , , N , k = 1 , 2 , , M
There are three basic problems associated with using HMMs [35,38].
(1)
Given a model λ = ( π , A , B ) and an observation sequence, X = x 1 , x 2 , , x T , x i Ω , to compute the probability of this model to produce an observation sequence P ( X λ ) .
(2)
Given an observation sequence X = x 1 , x 2 , , x T , x i Ω and a model λ = ( π , A , B ) , to find the optimal state sequence Q = q 1 , q 2 , , q T , q i S .
(3)
Given a set of observation sequences X = O k k = 1 K , the model parameters that realize this training set at the highest rate is for the calculation of λ , P ( X λ ) .
The objective of utilizing HMM is to deduce the state of navigation risk by assessing Risk Influencing Factors (RIFs) in MASS. This necessitates addressing both the first and third issues outlined above, accomplished through the application of the forward–backward algorithm and the Baum–Welch algorithm.

2.2. Process Risk Control Modes of MASS Navigation Safety (Stage 1)

Referring to previous research literature [46,47] on the definition of ship navigation modes, this study redefines three NCMs based on the distinct “actual controllers” of MASS, specifically: autonomous control (AC) mode, manual control (MC) mode, and remote control (RC) mode. It is posited that different control paths and processes exist under these NCMs, with risk performance exhibiting Markov properties over time series data, as demonstrated in references [33,48].
As indicated in the literature [33], MASS comprises sensors, a controller, an executor, and a controlled object. Taking the AC mode as an example, the control process unfolds as follows: Shipborne sensing devices (comprising various sensor types) initially perceive external interference information (e.g., natural and traffic environments) along with ship status details (e.g., draft, ship attitude, and performance), transmitting these data to the shipborne autonomous control system. Subsequently, the decision-making system evaluates the current state of the vessel using a process model to generate control algorithms and instruction sets. Finally, these instructions are implemented by the controller.
In essence, across different NCMs we can measure variables such as state, disturbance, and control within MASS systems to compute output states (hidden states). Evidently, the HMM is well suited for addressing such challenges and has been applied across diverse scientific disciplines [35,36,37,38].

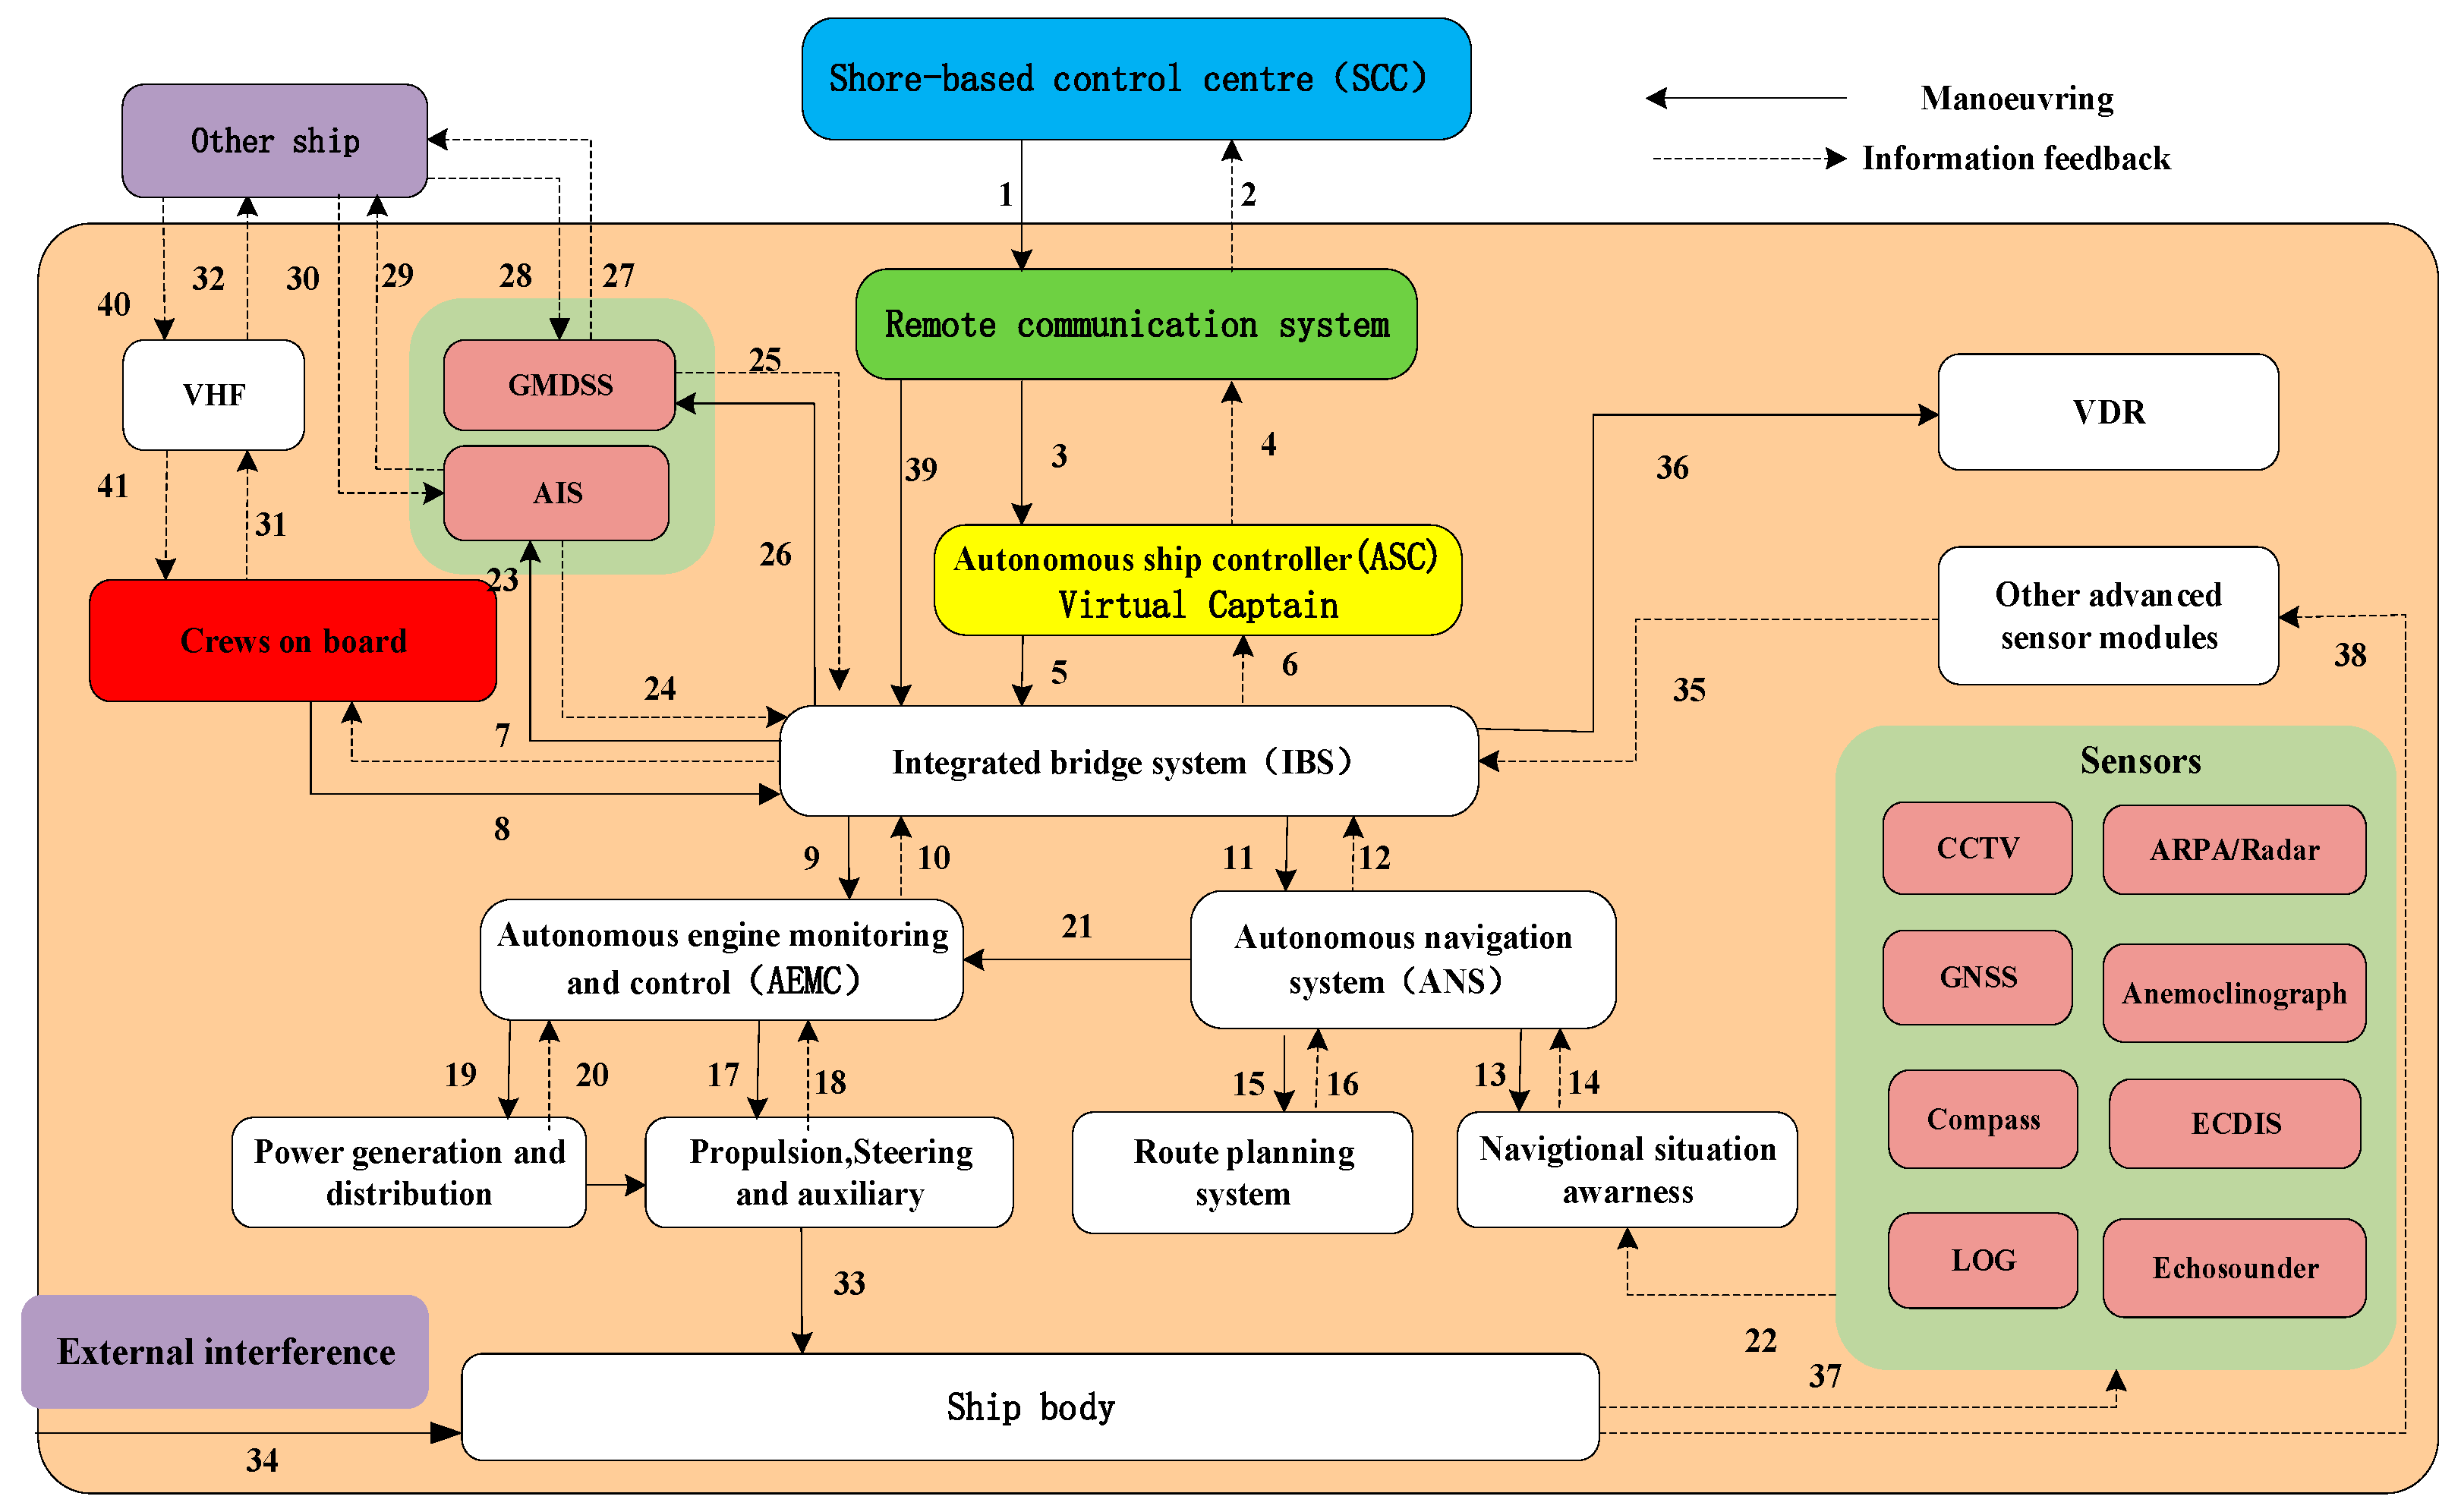
2.3. Risk-Based System Modelling with STPA and HMM (Stage 2)

A general model of dynamic risk quantification of MASS navigation is established by combining STPA and HMM method. The STPA method deconstructs the system control process and identifies the navigation RIFs. HMM method is used to infer the hidden state of system risk through the dynamic evaluation of the observable state of RIFs.
(1) 
RIFs identification in three NCMs
Utilizing the STPA method to model ship navigation systems aids in analyzing system risk control processes and uncovering correlations among RIFs. Accordingly, as depicted in Figure 3, this study constructs a hierarchical control structure model for MASS based on information gathered from [49,50], and other pertinent articles [2,51]. This model is jointly controlled by the shipboard autonomous controller (SAC) and SCC subsystems via communication links. Additionally, this study acknowledges that few crew members are typically present onboard and remain inactive under normal circumstances; they only operate the ship during specific situations such as berthing, approaching port, or managing emergency scenarios.
Based on the constructed autonomous ship hierarchical control structure, 23 feedback and 18 control actions were obtained. The model consists of three parallel control loops, and the path for system safety control under three NCMs is described in Table 1. In any control mode, the interaction process of system components can be divided into three stages, such as information perception, decision making, and control action.
The STPA method was used to analyze the control path and process of MASS under three NCMs, and the mechanism of the safety control process of the system can be revealed in more detail and depth through layer-by-layer identification. Based on the specific tasks during the voyage, comprehensively analyze from three dimensions, i.e., components failure, external interference, and unsafe interactions, the identification of key RIFs X = x 1 , x 2 , , x M for the system to be completed.
(2) 
Develop HMM among the RIFs
Next, we could infer the process risk performance of MASS navigation in different modes by measuring RIFs. Here, the RIFs were considered as observable variables, and the risk performance of MASS navigation was considered as hidden states. Therefore, an HMM for evaluating the risk performance of MASS navigation can be constructed, as shown in Figure 4.
The upper layer of the model displayed four types of risk performances, S = S 1 , S 2 , S 3 , S 4 represented a set of risk states, which were not visible and cannot be measured directly, and Y = y 1 , y 2 , , y T was a state sequence with a length of T. The lower layer of the model was an observable set of RIFs. Considering that directly applying all influencing factors to the model can lead to excessively verbose observation samples, here, V = V 1 , V 2 , V 3 , V 4 was defined as the state space of observation variables to simplify calculation, and X = x 1 , x 2 , , x M was an observation sequence at any time, M represented the number of RIFs.
The arrows among various states in the model (Figure 4) showed the correlation between them. The matrix A was used to describe the process of ship risk state transition. At a certain time, the probability distribution of the state transition of MASS navigation risk could be recorded as:
A = a 11 a 12 a 13 a 14 a 21 a 22 a 23 a 24 a 31 a 32 a 33 a 34 a 41 a 42 a 43 a 44
where a i j is the transfer frequency of risk performance ( y i y j ), and j = 1 4 a i j = 1 .
The observation probability matrix B represented the correlation between risk states and the status of observable influencing factors. At a certain time, the observation probability matrix could be expressed as:
B = b 11 b 12 b 13 b 14 b 21 b 22 b 23 b 24 b 31 b 32 b 33 b 34 b 41 b 42 b 43 b 44
where b i k 0 ,   1 i 4 ,   1 k 4 ,   i = 1 N b i k = 1 .

2.4. The Risk Performance Measurement Algorithm (Stage 3)

The goal of using HMM is to infer the state of navigation risk by measuring RIFs of MASS. To achieve this, we need to solve both the first and third problems associated with using HMMs, with the forward–backward algorithm and the Baum–Welch algorithm.
The forward–backward algorithm [43] is used to calculate P ( X λ ) , and the observation sequence is divided into two parts, which are 1 , , t and t + 1 , , T . The forward variable, α t ( i ) , refers to obtaining the partial observation sequence X 1 , X 2 , , X t , up until time the probability of the state s i at time t, while the backward variable, β t ( i ) , refers to being in s i at time t, and yields the probability of observing the partial sequence X t + 1 , X 2 , , X T .
The steps for the forward algorithm are given below (see Equations (6)–(9))
(1)
Define the forward variable α t ( i ) :
α t ( i ) = P ( x 1 , x 2 , , x t , y t = s i λ ) ; 1 i N , 1 t T
(2)
Initialization:
α 1 ( i ) = P ( x 1 , y 1 = s i λ ) = π i b i ( x 1 )
(3)
Recursion:
α t + 1 ( j ) = ( i = 1 N α t ( i ) a i j ) b j ( x t + 1 )
(4)
Termination:
P ( X = x λ ) = i = 1 N α T ( i )
By the same way, define the backward variable βt(i). The backward algorithm is provided below (see Equation (10))
P ( X = x λ ) = i = 1 N β 1 ( i ) π i b i ( x 1 )
The Baum–Welch algorithm [43] is an iterative procedure that can determine the parameters sub-optimally, similar to the expectation maximization (EM) method. It operates as follows:
Step 1: Assign initial values to parameters based on prior knowledge, λ 0 = ( π , A , B ) .
Step 2: Compute a new λ based on λ 0 and the observation sequence X , and define variables γ t ( i ) and ξ t ( i , j ) at time t, where γ t ( i ) is the probability of being in a state s i , and ξ t ( i , j ) is the probability of appearing from state s i to state s j .
γ t ( i ) = P ( y t = s i X , λ ) = P ( X , y t = s i λ ) i = 1 N P ( X , y t = s i λ ) = α t ( i ) β t ( i ) i = 1 N α t ( i ) β t ( i )
ξ t ( i , j ) = P ( y t = s i , y t + 1 = s j X , λ ) = P ( y t = s i , y t + 1 = s j , X λ ) i = 1 N P ( X λ ) = α t ( i ) a i j b j y t + 1 β t ( i ) i = 1 N j = 1 N α t ( i ) a i j b j y t + 1 β t ( i )
where α t ( i ) is the forward variable, and β t ( i ) is the backward variable.
The HMM parameters λ = ( π ^ , A ^ , B ^ ) can be derived from the above formula:
π i ^ = P ( X , s i λ ) P ( X λ ) = γ 1 ( i ) a i j ^ = t = 1 T 1 P ( X , y t = s i , y t + 1 = s j λ ) t = 1 T 1 P ( X , y t = s i λ ) = t = 1 T 1 ξ t ( i , j ) t = 1 T 1 γ t ( i ) b i j ^ = t = 1 T 1 P ( X , y t = s i λ ) b ( s i v k ) t = 1 T 1 P ( X , y t = s i λ ) = t = 1 T 1 γ t ( i , j ) b ( s i v k ) t = 1 T 1 γ t ( i )
Step 3: If log P ( X λ ^ ) log P ( X λ ) τ , stop, else set λ 0 = λ and go to Step 2 ( τ is the minimum tolerance between two subsequent models).
Definition 2.
According to the forward algorithm (Equations (14) and (15)), the probability of risk performance  S i  of ship navigation at time t can be obtained:
P t ( i ) = α t ( i ) i = 1 N α t ( i ) ;   1 i N ,   1 t T
The risk quantification value of the MASS under different control modes is expressed as:
R t = i = 1 N P t ( i ) E x ( i )
where R t is the corresponding risk performance probability of the ship at a certain time under one of three NCMs, and E x i represents the mathematical expectations for different levels of risk performance. This article divides the risk performance into four levels as R1, R2, R3, and R4. To ensure the level of risk performance corresponding to the dataset, the golden section method [52] has been used as a mathematical basis to obtain cloud parameters for four different risk levels:
R 1 = N ( 1.54 , 0.44 , 0.08 ) ,   g r a d e d   a s   A R 2 = N ( 2.50 , 0.27 , 0.05 ) ,   g r a d e d   a s   B R 3 = N ( 3.46 , 0.17 , 0.03 ) ,   g r a d e d   a s   C R 4 = N ( 5.00 , 0.10 , 0.02 ) ,   g r a d e d   a s   D

2.5. Risk Control Mode Simulation and Analysis (Stage 4 and Stage 5)

MASS is in the incipient stage of development, bereft of actual ship operation data, not to mention accident data. From the viewpoint of the operating environment and navigation scenarios of ships, there is virtually no distinction between MASS and traditional ships. The cardinal dissimilarity lies in that MASS is more intelligent and leans more heavily on information and control technology in the process of risk perception, cognition, and control. Thus, it is practicable to design simulation schemes based on traditional ship-related operating data and in conjunction with expert experience methods, which is currently the predominant means for conducting research.
In the current study, the risk performance of MASS navigation is dynamically simulated. Utilizing the developed STPA-HMM, Risk Influencing Factors (RIFs) are treated as observable variables, while the risk performance of MASS navigation is regarded as hidden states. The Monte Carlo method is employed to obtain simulation results for risk performance by inputting multiple observation variables. The specific implementation steps are outlined below.
Step 1: Identification of RIFs in three NCMs
Within the context of the hierarchical control structure framework depicted in Figure 3, a more detailed and comprehensive understanding of the safety control process mechanism within the system can be achieved through systematic layer-by-layer identification. By comprehensively analyzing specific tasks during voyages from three dimensions, the identification of key RIFs X = x 1 , x 2 , , x M for the system can be completed.
Step 2: HMM parameter learning
After building the HMM for risk assessment of MASS navigation, it was necessary to determine the model parameters λ = ( π , A , B ) . To parameterize the HMM, the cloud model with experts’ judgments is used to expand training samples, and further used the Baum–Welch algorithm to determine the parameters of the model.
Step 3: Quantification processing of RIFs
Based on real-time information during ship navigation in real scenarios, the status information of RIFs from SAC and SCC subsystems are selected. According to the risk classification criteria, the collected subjective and objective data can be uniformly quantified, the corresponding cloud parameter characteristic values, ( E x i , E n i , H e i ) , i = 1 , 2 , , n are calculated.
Step 4: Risk performance simulation
Following the risk measurement model for MASS navigation provided by Equations (14) and (15), the risk performance sets of ship navigation under different modes are obtained through multiple simulations using the HMM. By comparing the evolution characteristics of risks under different modes across multiple simulations, further validation and sensitivity analysis of the model can be conducted.

3. Results

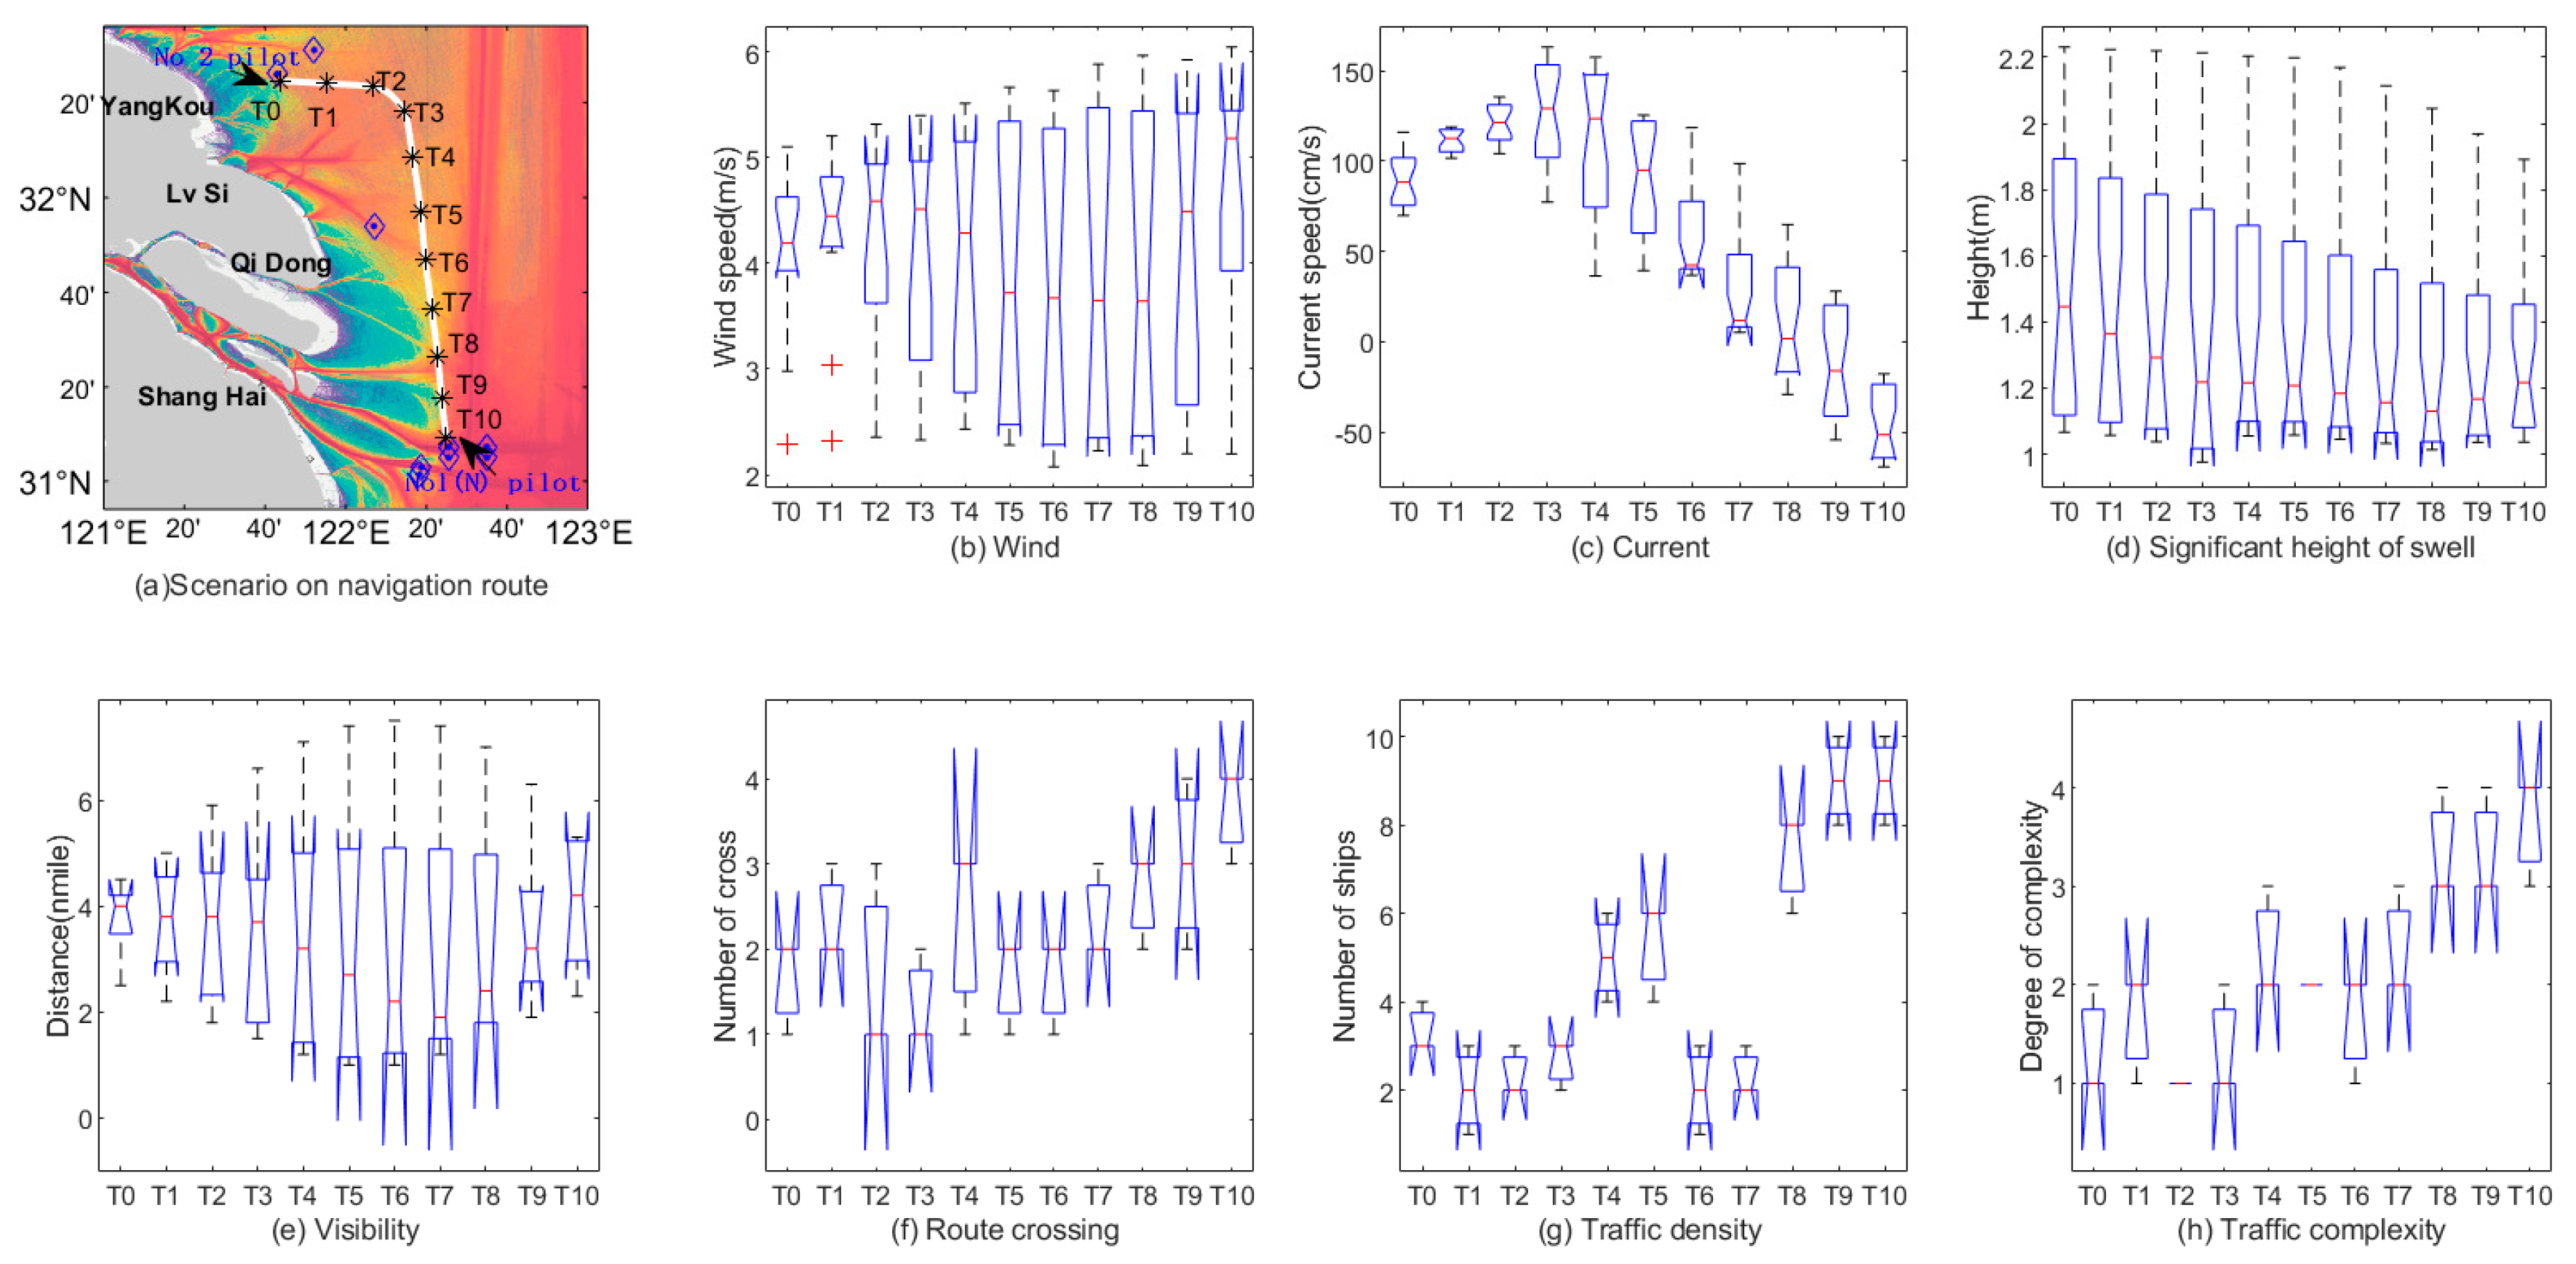
3.1. Scenario and Data

3.1.1. Scenario for the Ship–Shore Synergy Mode of MASS

In order to assess the process risks of MASS navigation under three NCMs with the previously established model, this article selects a set scene for simulation. To date, the real ship data are lacking because the operation of MASS has not been implemented. Accordingly, this study takes the navigation process of an ordinary bulk cargo ship (“B ship”) as the research object, and assumes that the ship is a MASS (L3 level), which can be remotely controlled by the shore-based center, using three NCMs. The simulation is divided into two navigation scenarios, one is open water (T0–T3), and the other is a relatively complex navigation environment (T4–T10), the average speed of the ship was 10 kn, and the total voyage is 110 n miles. Section 3.2 and Section 3.3 will compare the navigation process risks of MASS using three NCMs in above scenarios. The relevant ship navigation scenario parameters are listed in Table 2.

3.1.2. RIFs Identification in Three NCMs

In the previous section, the STAMP model of MASS was constructed (Figure 3), which revealed the hierarchical control structure and control process of the system under different NCMs. During navigation, MASS need to complete a series of tasks to ensure ship safety, including “Identify danger of collision”, “Take collision avoidance actions”, “Adjust the speed and course”, and “Keep a safe distance”. Any unsafe control action may lead to the occurrence of risks. Here, taking “Adjust speed and course” as examples, and assuming the ship encounters a fixed object with collision risk, there were four types of unsafe control actions (UCAs), namely:
  • UCA-1: Not provide control actions to adjust speed and course.
  • UCA-2: Provide incorrect or unsafe control actions to adjust speed and course.
  • UCA-3: Provide control actions to adjust speed and course at incorrect time.
  • UCA-4: Provide control actions to adjust speed and course with incorrect duration.
After identifying the system-level hazards of UCAs, by analyzing the loss scenarios of the system, the control loop was mapped to specific physical components, and the constraint relationships between components were refined to derive more specific RIFs. By further refining and categorizing the risk factors, key RIFs can be identified. The causes of UCAs can be summarized into three categories: component failures (CF), unsafe interaction among components (UI), and external environmental disturbances (ED). The process of identifying RIFs under three NCMs was illustrated, as shown in Table 3.
Within the framework of the hierarchical control structure of the system, the mechanism of the system security control process can be disclosed in an even more meticulous and profound manner through layer wise identification. Grounded on the analysis outcomes of other tasks during the MASS navigation process, such as route planning, situational awareness, and alarm handling, 16 key RIFs can be attained by summarizing and integrating relevant literature accomplishments. For example, the direct cause of UCA-1 in the AC mode (Table 3), “vessel sensors (Radar, ECDIS or GNSS) failure”, can be summarized as the operational conditions of perception equipment (X14), and “propulsion or steering failure”, can be summarized as the operational conditions of control equipment (X15). These factors can be directly observed or measured, and the safety status of the system can be inferred by gauging the status of the influencing factors. Furthermore, on the basis of expert prior knowledge, the evaluation criteria for RIF can be obtained as presented in Table 4 [53,54,55]. The risk performance is divided into four levels, designated as R1~R4, and the risk performance value is defined within the range of [0,5]. The greater the risk behavior value, the higher the risk.

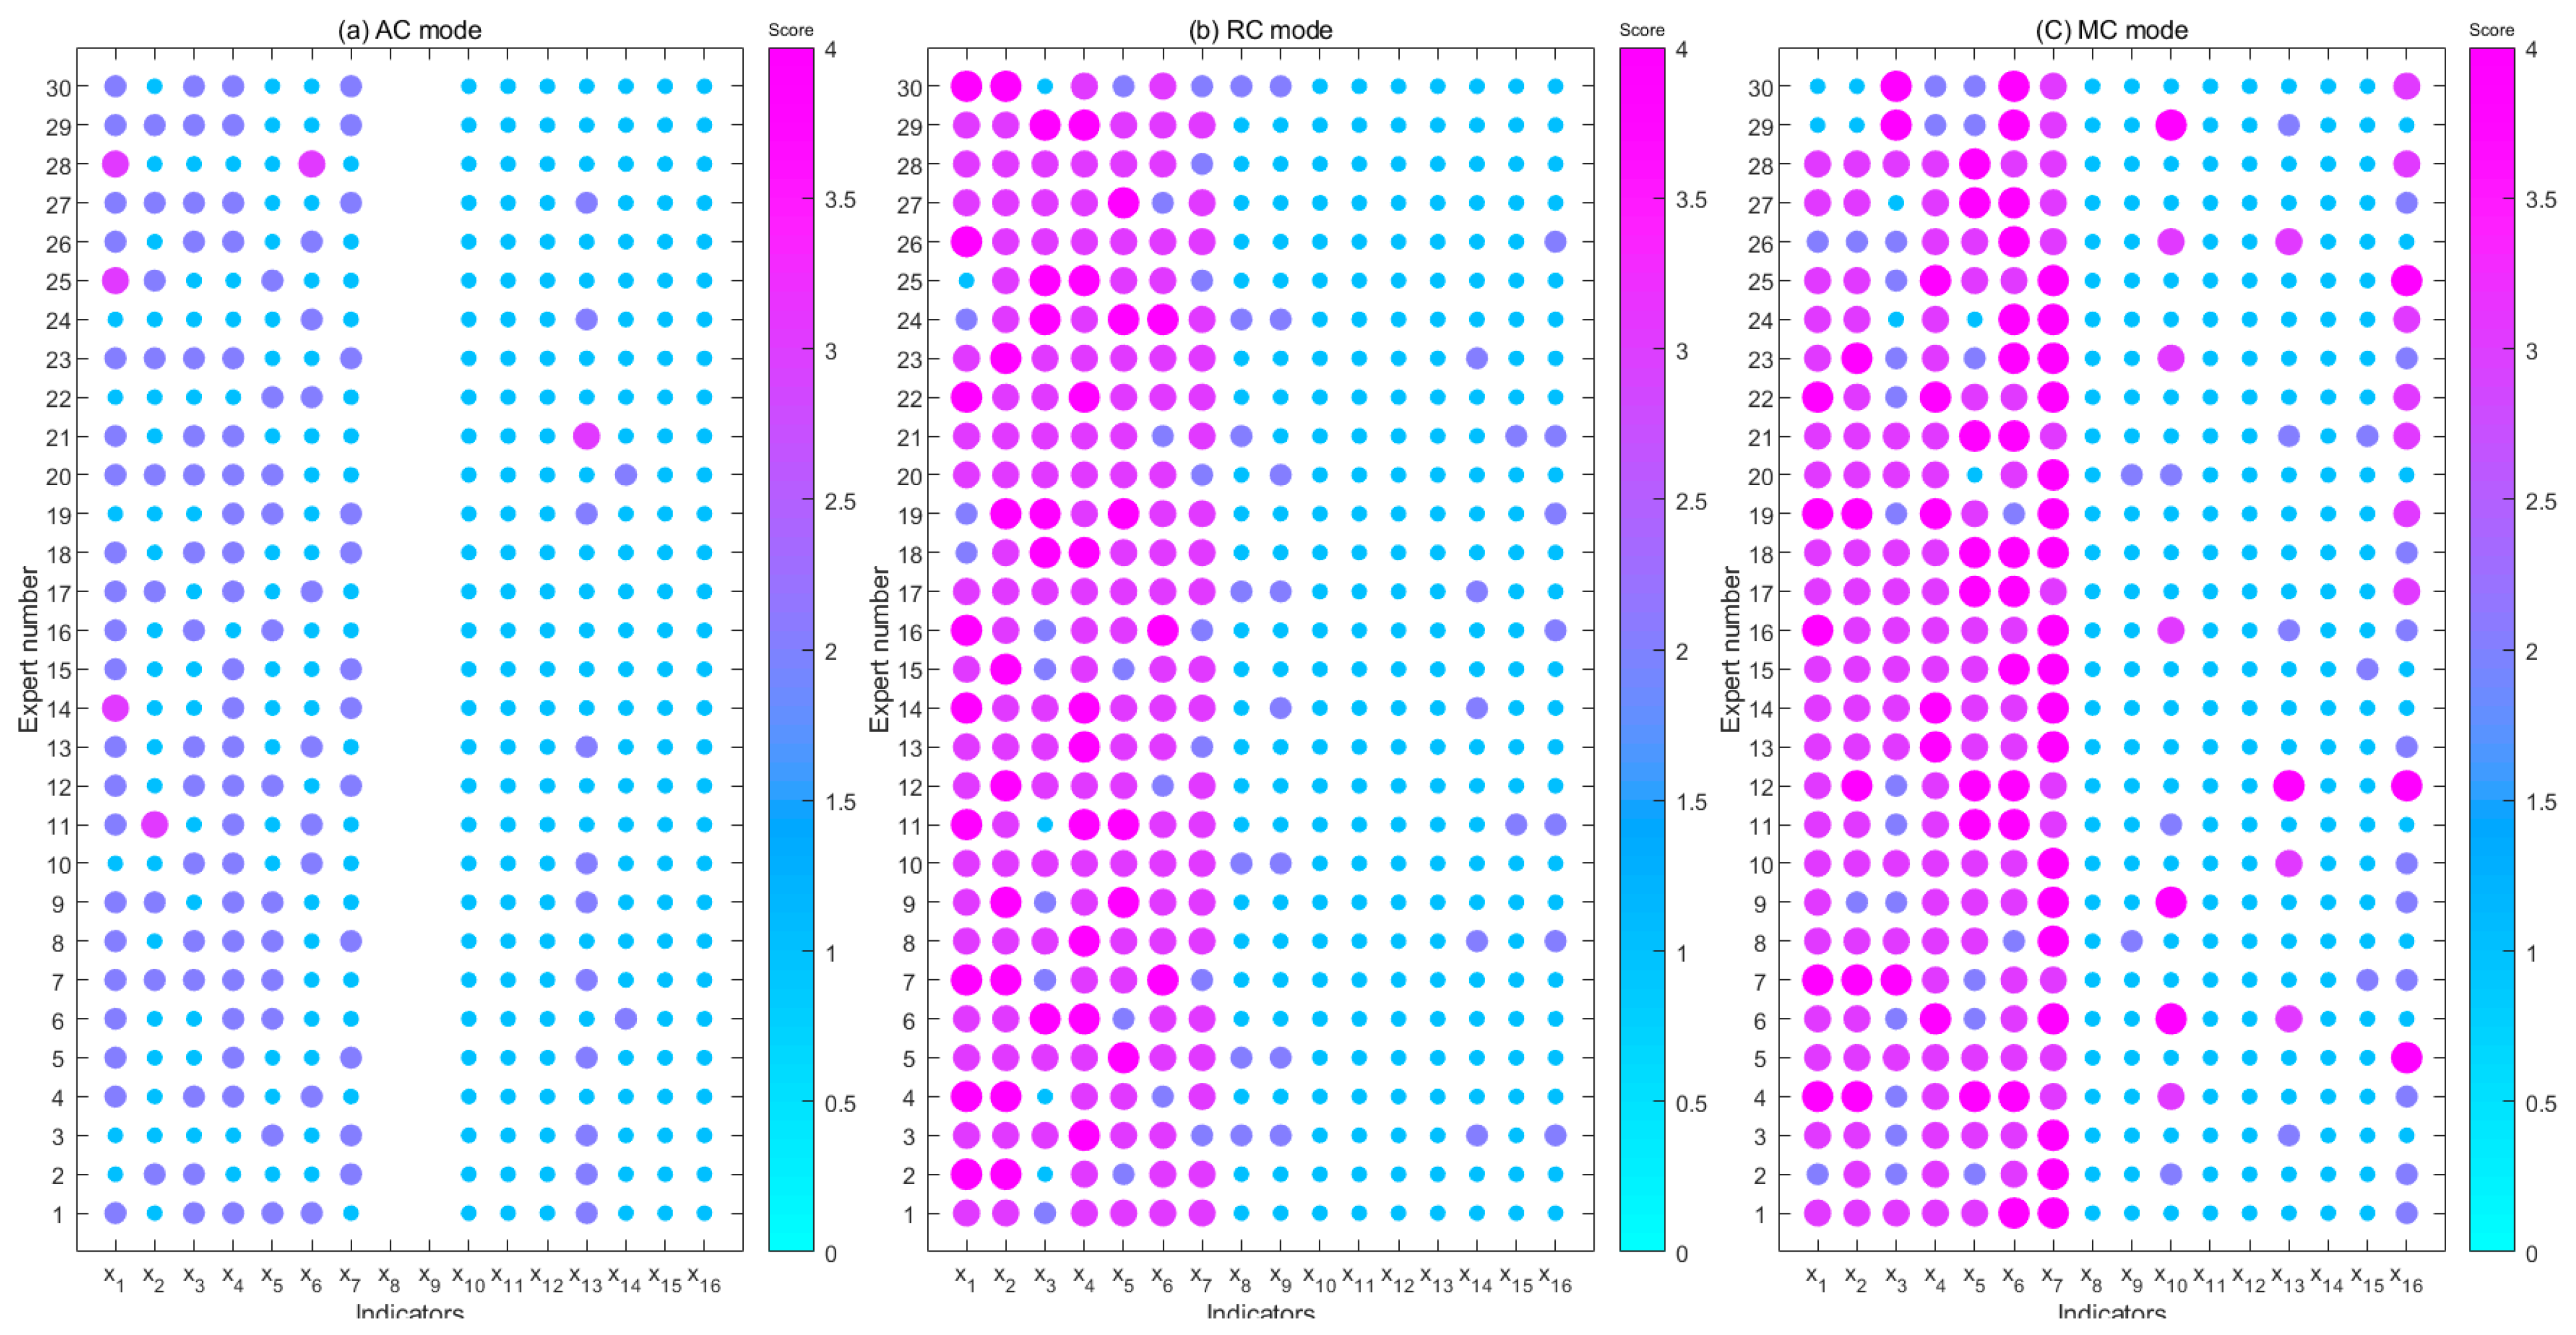
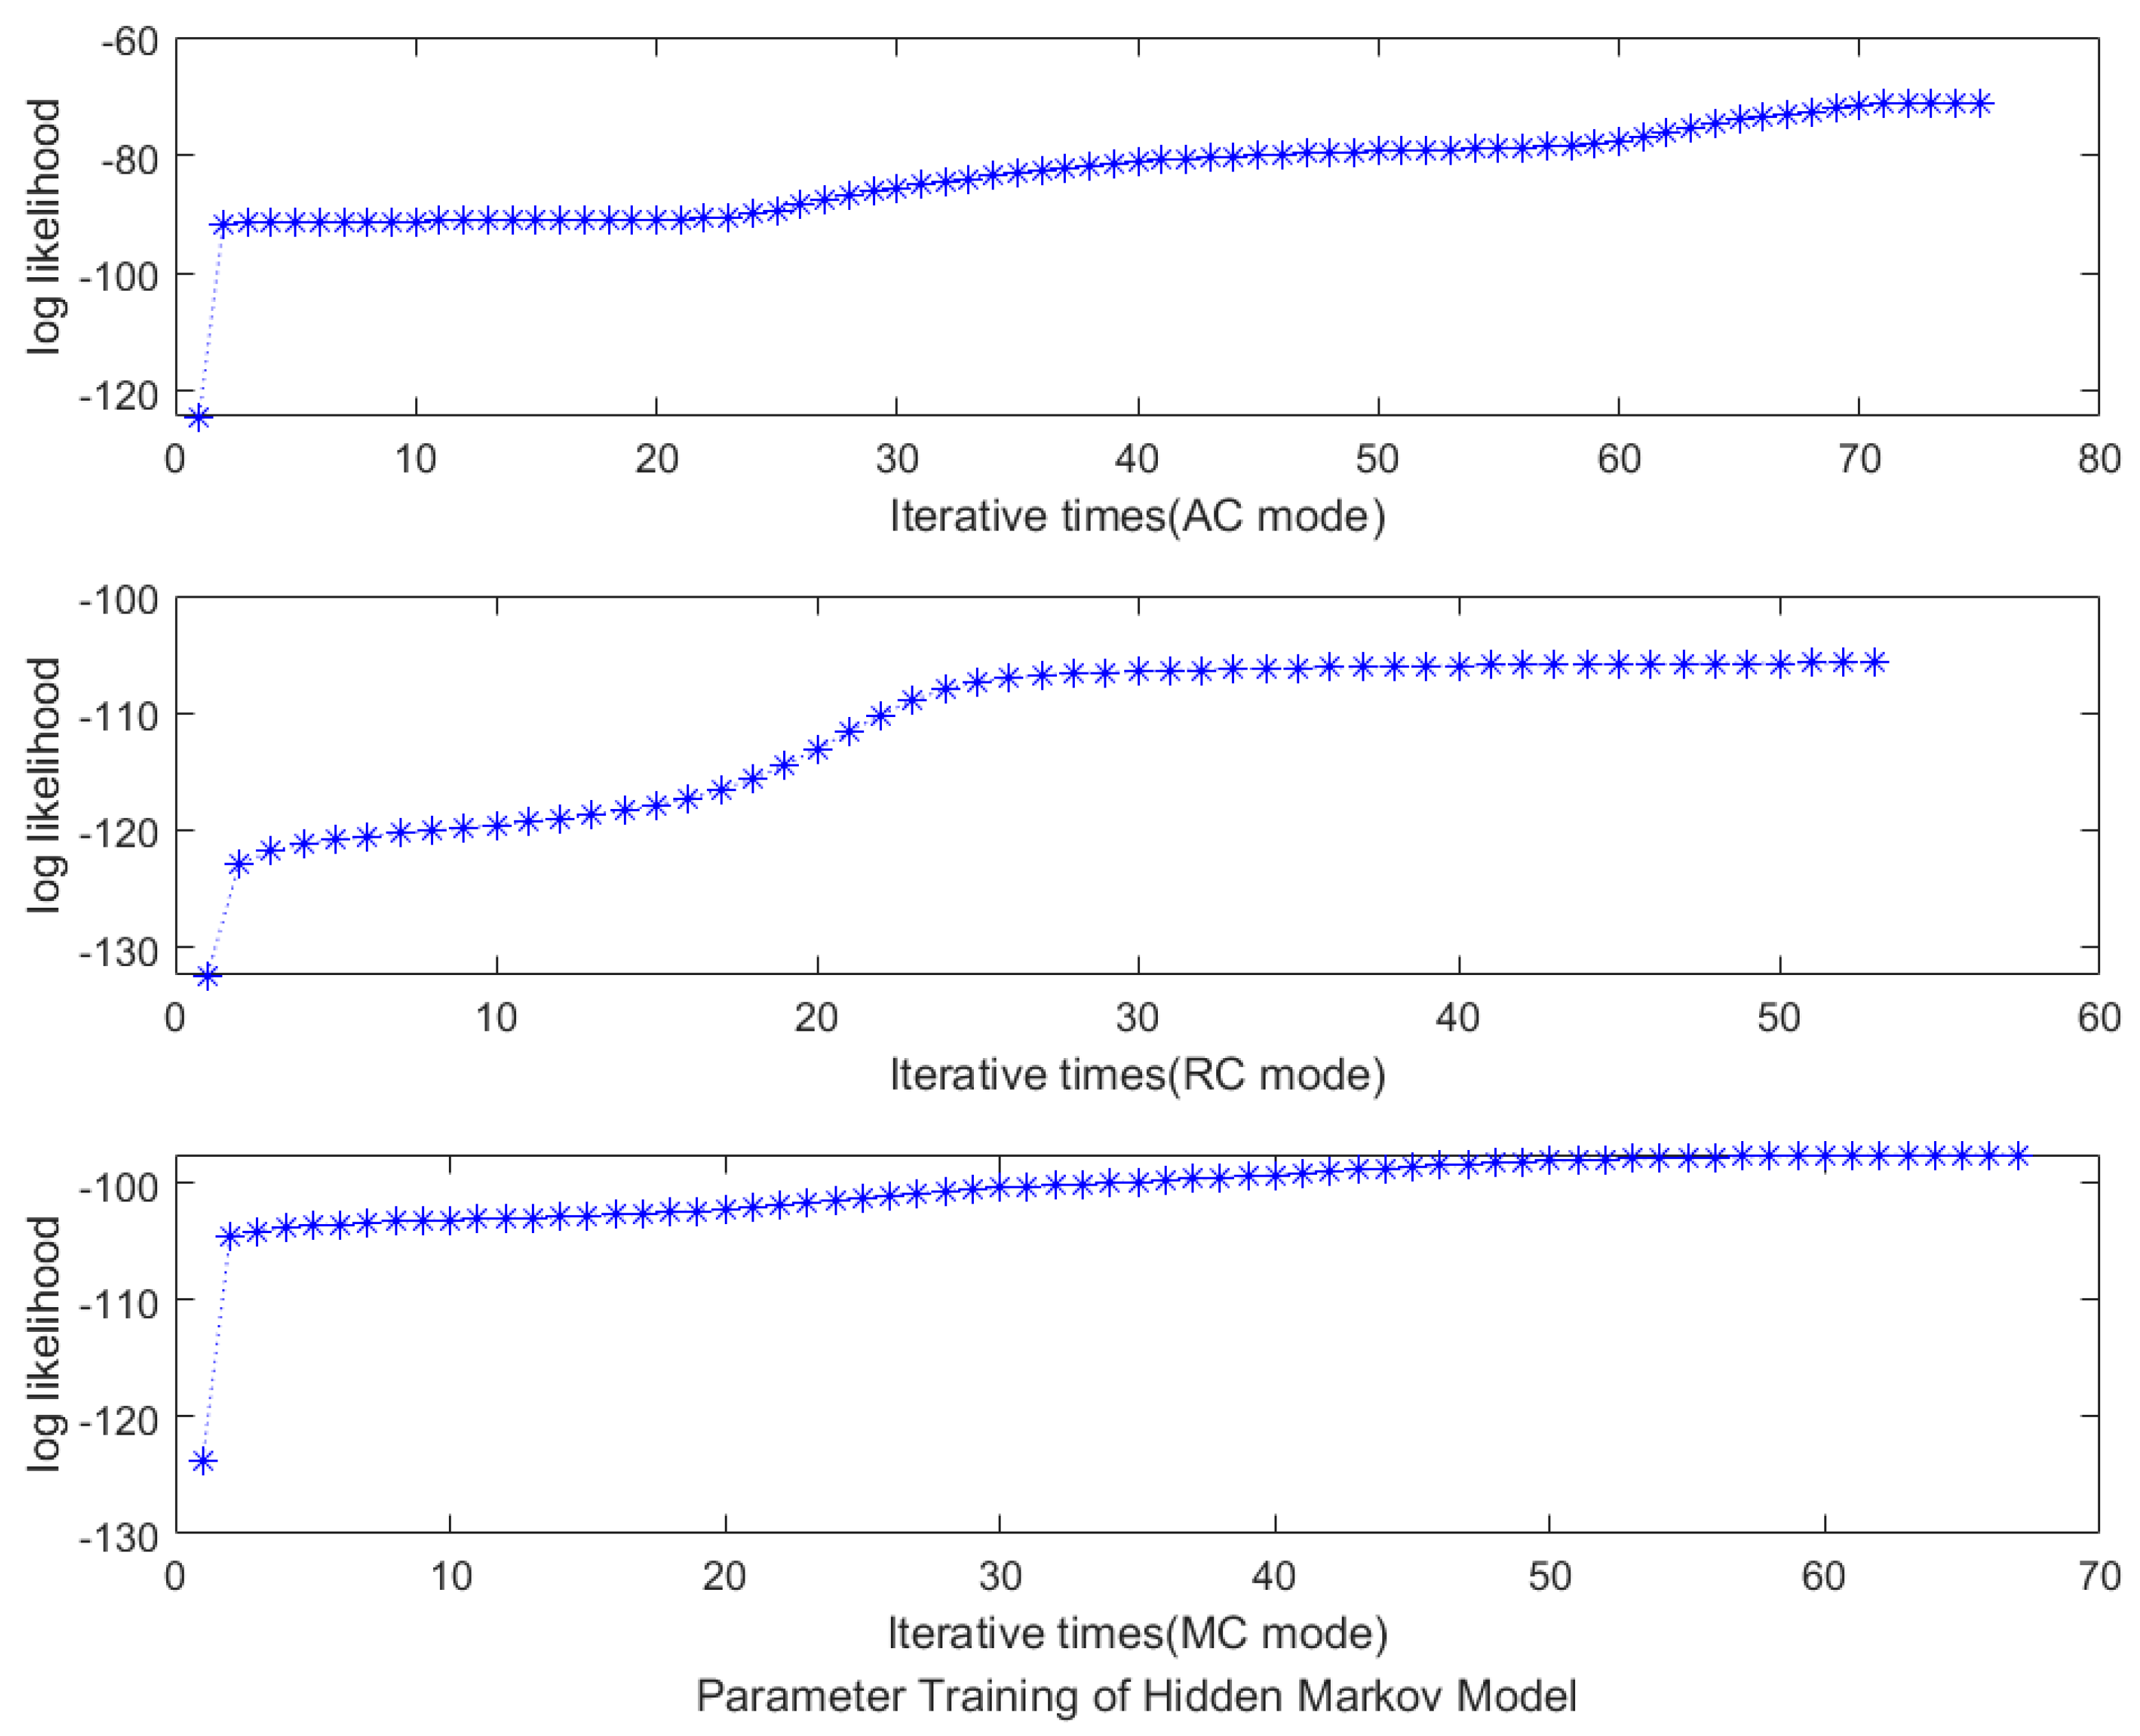
3.1.3. HMM Parameter Learning

After building the HMM for risk assessment of MASS navigation, it was necessary to determine the model parameters λ . So far, no historical records of actual marine accident of MASS were reported. Therefore, it was particularly important to rely on the prior knowledges of relevant experts. Here, we used the data from expert questionnaires as the dataset for parameter training, and further used the Baum–Welch algorithm to determine the parameters of the model.
The questionnaire survey was carried out in 2022. The authors conducted interviews with 30 experts and scholars in related fields. The background of the 30 participants is listed in Table 5. All experts except Groups II are familiar with MASS.
The content of the survey is to determine the maximum tolerance values for the risk status of the 16 RIFs under three modes, which were identified in the previous section. Experts scored basing on their prior knowledge, and the risk tolerance values were recorded as A, B, C and D from low to high. Taking X7 (traffic situation complexity) as an example, in the AC mode, the maximum risk tolerance value of X7 was B, and in the MC mode, it was C, which indicates that the AC mode was suitable for scenarios where the risk performance of X7 was not greater than B, and the MC mode was suitable for scenarios where the risk performance was not greater than C. Of course, some experts’ estimates may be conservative, which was more beneficial to the navigation safety of MASS. The survey results are shown in Figure 5.
Utilizing the expert consultation data presented in Figure 5 as the initial samples for model parameter training, to further expand the training set and mitigate the bias arising from the subjective nature of experts, initially, the evaluation values of various influencing factors under different modes are computed to acquire cloud feature values. Subsequently, a considerable number of cloud droplets are generated through a cloud generator, and 100 values are randomly sampled near the mean of each indicator (within the range of Ex ± En) as the dataset for HMM parameter training. The Baum–Welch algorithm is employed for parameter learning. Through multiple iterations until the convergence condition is attained, as depicted in Figure 6, the parameters of the HMM in three NCMs can be obtained, respectively (Equations (17) and (18)):
π 1 = 0.00 , 0.99 , 0.01 , 0.00 , π 2 = 0.07 , 0.00 , 0.93 , 0.00 , π 3 = 0.001 , 0.002 , 0.997 , 0.000
A 1 = 0.999 0.000 0.001 0.000 0.248 0.750 0.001 0.001 0.000 0.011 0.309 0.680 0.000 0.495 0.274 0.231 A 2 = 0.946 0.000 0.054 0.000 0.446 0.554 0.000 0.000 0.000 0.000 0.579 0.421 0.000 0.444 0.000 0.556 A 3 = 0.989 0.011 0.000 0.000 0.421 0.579 0.000 0.000 0.000 0.433 0.567 0.000 0.000 0.000 0.413 0.587 B 1 = 0.866 0.092 0.042 0.000 0.462 0.537 0.001 0.000 0.193 0.743 0.064 0.000 0.747 0.253 0.000 0.000 B 2 = 0.934 0.066 0.000 0.000 0.008 0.000 0.393 0.599 0.000 0.143 0.655 0.202 0.054 0.249 0.649 0.048 B 3 = 0.846 0.153 0.001 0.000 0.000 0.276 0.724 0.000 0.045 0.017 0.603 0.335 0.026 0.089 0.613 0.272

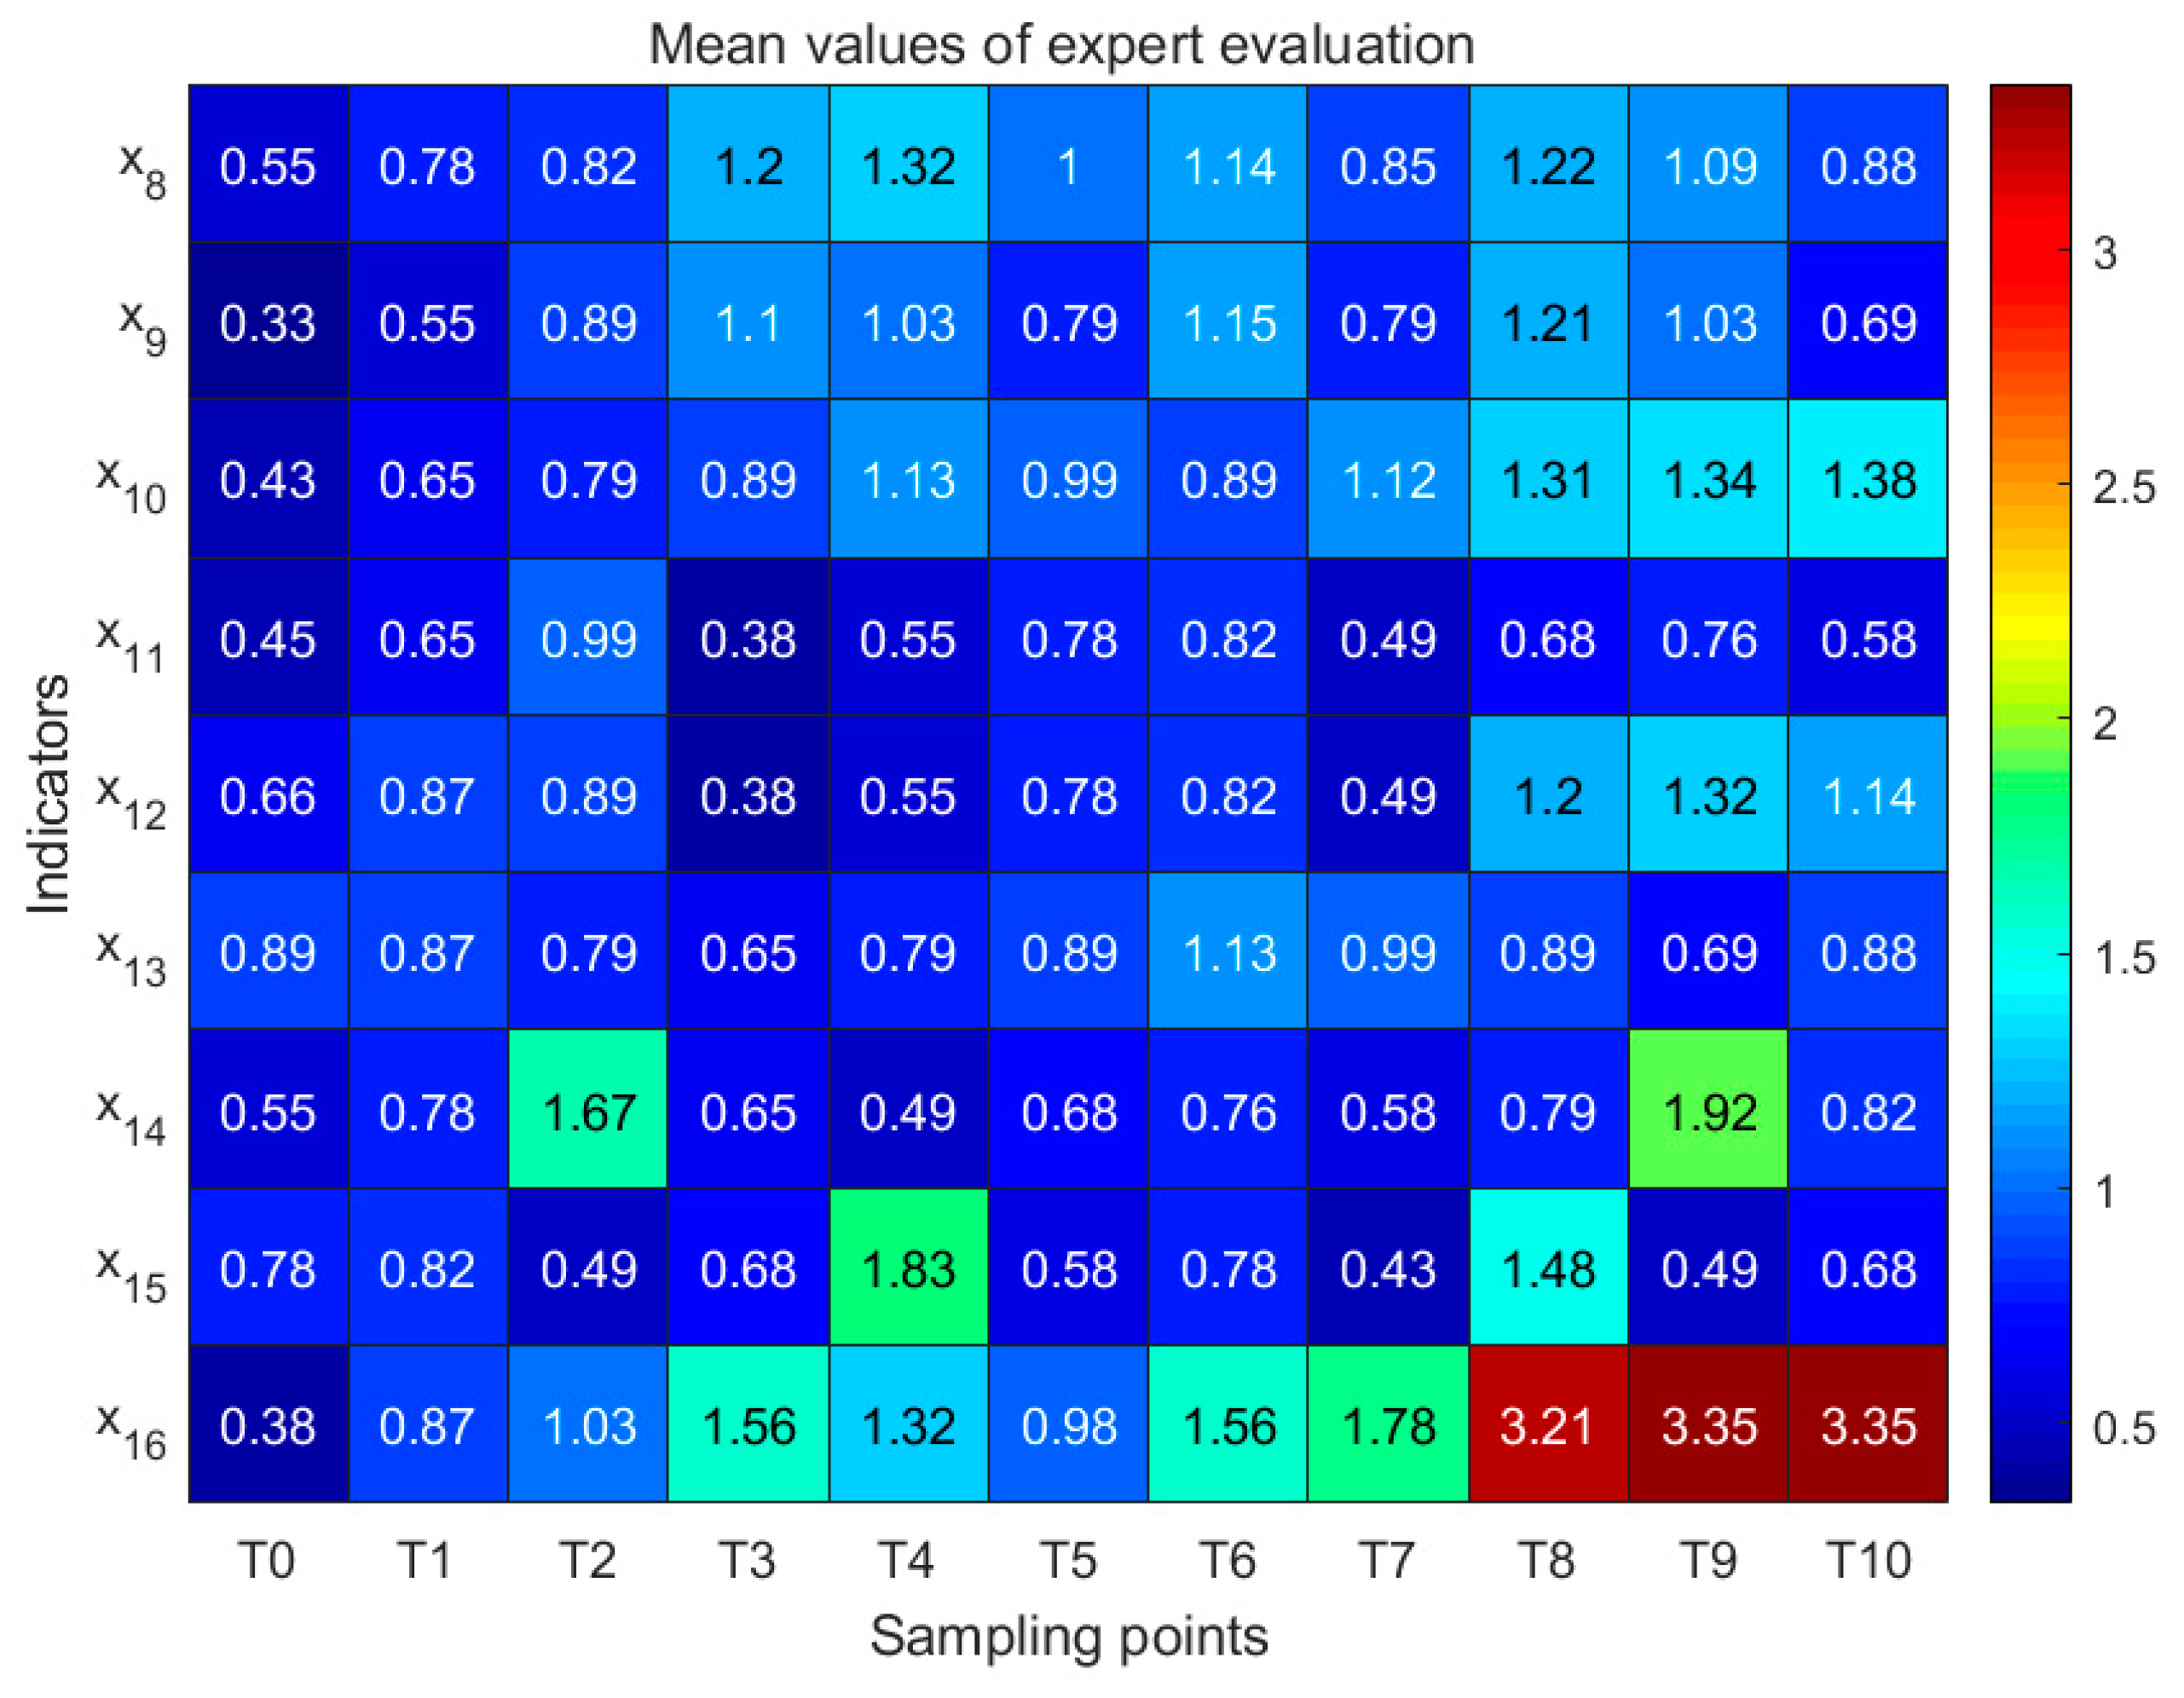
3.1.4. Quantification Processing of RIFs

  • Acquisition and quantification of objective data
The external environment data are quantitative indicators, including natural factors (i.e., X1, X2, X3, and X4), channel indicators (i.e., X5), and traffic indicators (i.e., X6 and X7). These indicator data can be directly obtained through ship perception devices such as CCTV, anemoscope, radar and AIS, as shown in Figure 7b–h.
  • Acquisition and quantification of subjective data
Subjective data indicators include component failures (i.e., X8, X9, X10, X14, X15 and X16), Unsafe interaction among components (i.e., X11, X12, and X13), which were obtained through expert evaluation. To improve the reliability of the results, Cloud models are used to fuse expert scoring values by Equation (16). The 21 experts (Group I and Group II in Table 4) were investigated, who all have rich navigation experiences. Accordingly, the risk state value was evaluated according to the collected information to derive the random state data of the MASS system (Figure 8).

3.2. Risk Performance Comparison in Open Sea Area

To simulate the evolution process of ship navigation risk performance across three NCM types (i.e., the AC mode, the MC mode, and RC the mode), the initial state values of relevant evaluation indicators (see Figure 7 and Figure 8) were utilized as input data during open water sailing (T0–T2). This included external environmental indicators and subjective data indicators from the SCC and SAC subsystems. The Monte Carlo method was employed to derive the distribution of risk performance under the three different modes after 200 simulations, as depicted in Figure 9. This approach enables the identification of differences in risk performance transfer among the three modes.
The results showed that the process risks of MASS were at a lower level (R1) for the three NCMs in open waters, but the risk fluctuation in the MC mode was greater. The RC mode had the lowest risk level, and it was easier to combine human navigation experience with the rapid computing ability of the machine to ensure the safety of ship navigation.

3.3. Risk Performance Comparison in Complex Water Area

In order to compare the risk evolution of MASS navigation for three NCMs (i.e., the AC mode, the MC mode and the RC mode) in a relatively complex external environment, this study simulated the process risks of “Vessel B” navigation during the T0–T10 period. The state values of relevant evaluation indicators (Figure 7 and Figure 8 T0–T10) were used as input data. After 100 simulations, the dynamic evolution of the process risk of MASS navigation could be obtained under three NCMs, as shown in Figure 10.
The results showed that the process risks of MASS navigation all exhibited significant differences and volatility, under the interference of external environmental changes. In the AC mode (marked with green lines), the process risks fluctuated relatively small, with risk performance values ranging from 1.5 to 2.2, and most of them are at R1 level. However, it was not possible to calculate the risk performance in some segments (i.e., T2–T4 and T8–T10), due to external environmental changes exceeding the threshold value of the preset scenario. In the RC mode (marked with blue lines), the fluctuation of process risks was the largest, with risk performance values ranging from 1.0 to 3.1, and the level of some segments also reached R3 level, but the risk performance values are significantly lower than the other two NCMs in the T0–T8 segment. In the MC mode (marked with red lines), the process risks fluctuated relatively significant, and the risk fluctuation range is between the other two modes. The mean values of risk performance were 1.5 (T0–T3 segment) and 2.5 (T4–T10 segment).

3.4. Sensitivity Analysis and Model Verification

Sensitivity analysis can elucidate how changes in specific variables impact the target object, thereby determining the significance of system variables. To verify the model’s sensitivity, we compared external environmental data collected by sensors and the evolution of process risk in MASS navigation over a time series (T0–T10). This allowed us to establish the corresponding relationship between observed environmental RIF states and hidden process risk, as illustrated in Figure 11.
To further validate the model’s adaptability, a cloud model data generator was utilized to transform RIF status into cloud parameters. These parameters encompass descriptions of ship system components based on expert judgment and environmental sensor data. Cloud droplets generated by the cloud generator were randomly selected as input data. Following multiple simulations, statistical analysis was conducted to produce Figure 12. The box plot within this figure comprises five numerical points: the smallest observation (lower edge), 25th percentile (Q1), median, 75th percentile (Q3), and largest observation (upper edge). Other points represent simulation samples.
The behavior of process risk in the MC mode and the RC mode, as well as X 1 , X 2 , X 3 , X 4 , X 5 , X 6 , X 7 were selected as the research objects. On the whole, the data in Figure 7 indicated that the change in process risk was evidently affected by the external environment, and its evolution trend was consistent with the change in the external environmental risk. Specifically, the most prominent factors were X2 (Current), X5 (Route crossing), X6 (Traffic density), X7 (Traffic complexity), the degree of influence of various factors on the risks during navigation was X7 > X6 > X2 > X5. The analysis showed that X7 (Traffic complexity) and X6 (Traffic density) are the most direct factors affecting the navigation risk of MASS during the T3–T10 period. In contrast to the literature [20,33], the simulation results demonstrate remarkable consistency in the evolutionary characteristics of navigation risks and possess the following advantages. The HMM not only takes into account the correlation between risk behaviors in the time series, but also pays attention to the correlation between risk factors and system risk behaviors. The sensitivity of the model exceeds that of the literature [33]; Moreover, the quantification of ship dynamic risk was accomplished through time series MC simulation, while reference [20] merely quantified ship static risk. The simulation outcomes will undergo further verification and analysis by relevant experts (Table 4. Group II Pilot and Caption). It can be deduced that a typical characteristic exists in the high-risk sections of the route. Specifically, these sections are all situated in waters where the routes intersect, with frequent vessel entry and exit from the port, and complex vessel traffic situations involving fishing vessels, work vessels, and cargo ships. These are the key areas of concern regarding ship traffic accidents in this region. Crew members of conventional ships tend to encounter significant pressure while navigating in the aforesaid environment. The simulation results are in line with the crew’s perception of navigation risks, further validating the applicability of the model.
In addition, X2 (Current) was also need to particular attention. For one thing, current can cause ships to drift or deflect, thereby affecting the navigation posture or trajectory of ships. For another thing, there was also a significant correlation between current and ship traffic density. Generally, ships would use tidal changes to enter or leave the port. That is, during rising tide, ships would queue up to enter the port, while during falling tide, ships would queue up to leave the port. During this process, relatively dense traffic flows may occur in the waters near the entrance channel.

4. Discussions

4.1. Risk Performance from the Ship–Shore Synergy Mode of MASS

Compared with Figure 10, the overall trend in the risk evolution of the system is similar to the trend reported in the earlier text. This result also demonstrates the effectiveness of the risk control model. Based on the above simulation results, several conclusions and suggestions were found as follows:
(1)
In waters with lower external environmental risks, the process risk of MASS navigation for three NCMs are at a lower level (as shown in Figure 9 and Figure 10 T0–T2), and R (AC) > R (MC) > R (RC). Speaking to the risk fluctuation amplitude, the AC mode was the most stable, while the MC mode was the most volatile. Therefore, in open waters with good external environments, the AC mode or the RC mode is the most appropriate choice, and can minimize the impact of human factors and control the risk at an acceptable level. Of course, the following conditions are required to support the two modes. The ship’s sensing system (i.e., radar, AIS, CCTV) and decision-making system (virtual captain) are in good working condition, relevant sensors have sufficient redundancy design, and the control algorithm has good reliability and robustness. At the same time, ship–shore communication has enough bandwidth to transmit data in real time.
(2)
In waters with relatively complex external navigation environments, there were significant differences in process risks under the three NCMs. In the AC mode, due to environmental risks exceeding the preset threshold at some segments (T2T4 and T8T10), the process risk of MASS navigation reached the maximum. Therefore, it is a highly challenging task to scientifically and comprehensively understand the formation mechanism of autonomous ship risks, and on this basis, reasonably define the preset scenarios for autonomous ship operation.
(3)
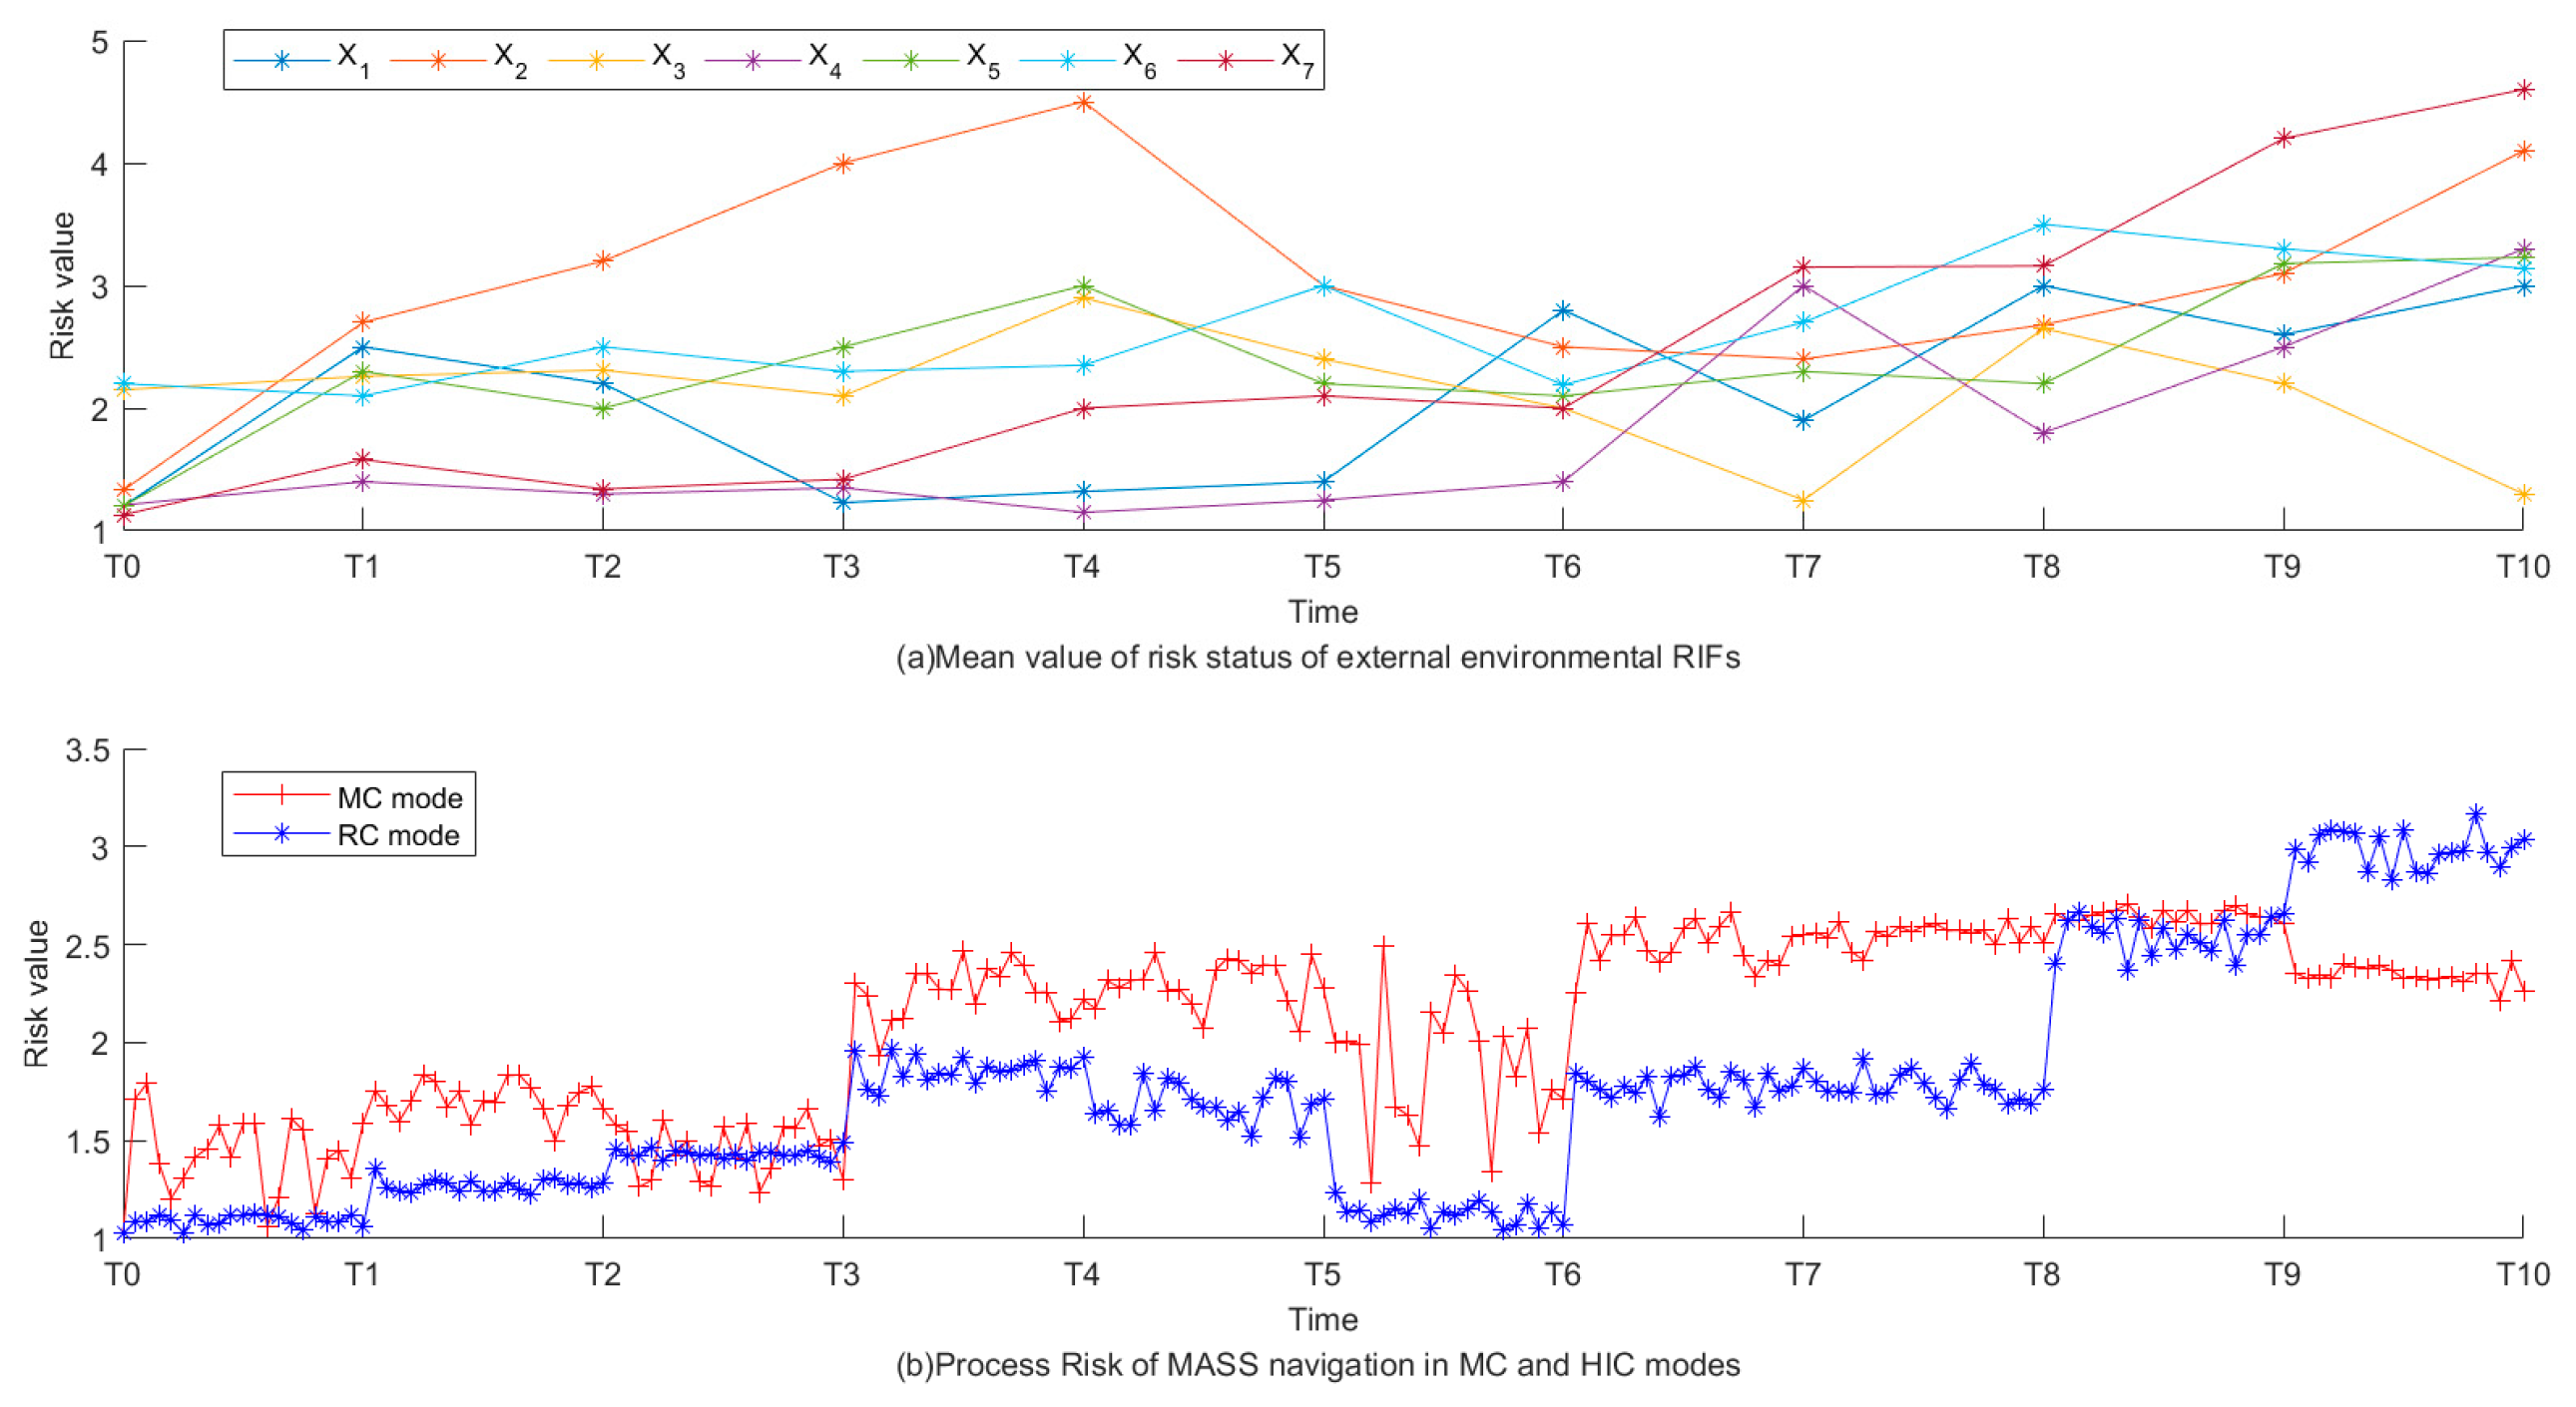
It can well adapt to the changes in environmental risks both in the MC mode and the RC mode. The RC mode had a smaller magnitude and fluctuation of navigation risk performances at segments T0–T8, but at segment T9–T10, there was a sharp increase and reached the R3 level. In comparison, the risk of ship navigation always fluctuates at the R2 level in the MC mode, and the risk performance values are greater. However, at segment T9–T10, it can effectively suppress the increasing trend of risk and kept at the R2 level. Based on comprehensive analysis, it can be concluded that in waters with complex environments, the RC mode is more suitable, which can keep the risk of ship navigation at a lower level. However, in emergency situations, direct control by crews on board is still the most effective method, and the MC mode is the most suitable for more complex or unexpected segments.
(4)
Based on the evolution trend of process risk, we believe that the AC mode and the RC mode should be the appropriate choice to ensure the safe navigation of MASS in coastal waters. Of course, how to choose between the two modes also depends on the risk tolerance of ship operators and the foresight of designers for preset scenarios. Even if this selection is feasible based on risk assessment, the timing of mode switching still depends on the definition of acceptable criteria, However, universally accepted criteria to measure the navigational risk for MASS are still open question. In addition, how to choose the appropriate NCM for MASS may be a multi-attribute problem, as this selection can not only consider the results of navigation risk comparison, but also other aspects, e.g., the availability of ship RCC communication and the physical and mental state of operators. Moreover, in some cases, the proposed NCM should comply with mandatory rules of the coastal or port country, if any [14].
(5)
In terms of the adaptability of the three NCMs to external environmental risks, the AC mode has the strictest standards, followed by the RC and MC standards, which may provide insights into the formulation of future risk acceptance standards for MASS. In specific navigation tasks, the feasibility of switching the three NCMs needs to be further discussed. The MC or RC mode switching to the AC mode means that manual control is transformed into machine control. This situation is usually applicable to waters with R1 risk level, and the switching can be implemented only after the operator’s confirmation. Before this, operational risk needs to be evaluated. Switching from the AC mode to the RC or MC mode will be the main way for MASS to cope with external risks or emergencies in the future, which needs to be analyzed according to the actual situation, for example, when the ship loses GNSS signal and the remote communication is interrupted, it needs to be switched to the MC mode. The crew can solve this problem well according to their sailing experience, at least to keep the ship away from danger. Of course, when the ship deviates from the course or approaches the crowded area of ships, the RC mode is still the first option on the premise that the remote communication and sensing system are in good condition. After all, the MC mode is only an option for emergency treatment. Finally, a very important task is how to solve the problem of early warning of navigational risks of MASS. The challenge here is to ensure sufficient time margin, because both the operator onshore and the crew onboard need some time to adapt to mode switching or role switching.

4.2. Permit of Framework via STPA-HMM

4.2.1. Risk Performance Model Considering System Control

The control process of the MASS system is guided by the inherent logic governing information perception, security decision making, and control implementation. The establishment of control loops not only elucidates the hierarchical control relationship between each component but also delineates the pathway for safety information exchange with a Markov property. Risk performance is commonly regarded as a latent state that cannot be directly measured, and there exists a mapping relationship between risk performance and RIFs. The values of risk performance can be deduced from observed values of RIFs. Here, an HMM process risk assessment model for MASS navigation is developed to represent this dual random process. This model integrates cloud modeling, the Baum–Welch algorithm, and the forward algorithm to quantify relevant uncertain information. Focusing on specific navigation scenarios, the process risks of MASS are quantified in three NCMs, providing decision-making guidance for controlling MASS navigation risks. Furthermore, through further comparison between observable RIF states and hidden risk performance states, the sensitivity of the model is verified; it is concluded that X7 (Traffic complexity), X6 (Traffic density), and X2 (Current) have the most significant impact on MASS navigation’s process risk.

4.2.2. Process Risk Assessment via STPA-HMM

The primary contribution of this study lies in the proposal of an STPA-HMM for analyzing risks in complex systems. This model addresses the issue of inadequate quantitative analysis within STPA. Furthermore, by examining the composition and interrelation of risk factors under three NCMs from the perspective of system safety control paths and processes, it identifies the most representative observation factors to serve as input variables for the HMM. Through the integrated application of STPA and HMM, it unveils the dynamic patterns within hidden states of process risk for MASS under three NCMs, thereby providing a theoretical foundation for a more scientific and comprehensive understanding of MASS navigation risks.

4.3. Limitations of Framework via STPA-HMM

MASS constitutes an elaborate human–machine intelligent system, and the evolution of navigation constitutes a complex and dynamic progress. Given that MASS is still in its initial stage of development, the hierarchical control structure formulated in this study merely depicts a simplistic initial framework, which will be consecutively enhanced in future research undertakings. This subsequently brings about two notable limitations in this study. Firstly, the risk factors are analyzed based on the developed hierarchical control structure, and a simplified hierarchical control structure is unfavorable for obtaining a comprehensive understanding of risk factors, potentially influencing the evaluation outcomes. Secondly, accurately obtaining transfer variables based on the security information exchange process currently poses a significant challenge. In this study, the parameter training set is derived from expert prior knowledge to acquire transfer variables in the HMM. Due to the differences among expert knowledge levels and limitations in comprehension, model parameters are inevitably prone to certain subjectivity. Nevertheless, this does not undermine the overall concept of the risk assessment framework proposed in this article, which supplements the ongoing research work concentrating on MASS navigation risk and safety. With the extensive operation of MASS in the future, integrating expert knowledge with objective data in subsequent research can effectively address this issue by continuously amending the evaluation indicators and model parameters.

5. Conclusions

In this study, a novel process analysis method based on system theory is applied to model the risk of MASS navigation safety. The process risk was assessed in specific scenarios under three NCMs (AC, MC, and RC modes) by constructing a parallel control model that includes crews on board, the SAC and SCC subsystems. This approach facilitated an examination of the composition of MASS, interactions among components, and differences in control processes under different NCMs. Through in-depth analysis of unsafe behaviors under various scenarios, key RIFs and their coupling relationships were determined. The developed risk modeling method demonstrates its capability to overcome the limitations of linear analysis in traditional accident cause theory.
Furthermore, this study aimed to address the shortcomings of previous STPA methods through quantitative analysis. Combined uncertainty methods were utilized to quantify HMM parameters in the MASS navigation process under three NCMs; this integration fully incorporates observational evidence and expert knowledge to address uncertainty inference issues.
The resulting STPA-HMM reveals changing rules within hidden states of process risk for MASS across three NCMs through interaction with observed variables such as RIFs within the system. These findings provide a theoretical basis for assisting in selecting appropriate NCMs and are also applicable for analyzing process risks in other operational processes (e.g., port approaching and departing). Additionally, these integrated methods can be extended for assessing process risks in other complex intelligent systems such as road transportation or air transportation.
Moving forward, our focus will shift towards early warning systems for MASS navigation risks to provide guidance on switching among different NCMs while allowing sufficient time for operators onshore or crew onboard to adapt during role transitions.

Author Contributions

W.L., conceptualization, methodology, software, writing—original draft, validation, data curation, and writing—review and editing. W.C., conceptualization, validation, and supervision. Y.G., data curation, writing—original draft, formal analysis, and validation. S.H., conceptualization, software, validation, writing—review and editing, and supervision. Y.X., data curation and formal analysis. J.W., data curation and formal analysis. All authors have read and agreed to the published version of the manuscript.

Funding

This project is supported by The Science and Technology Planning Project of Nantong City (JC22022062). This work is also supported by the National Natural Science Foundation of China, No. 52272353. The authors thank experts solicited for their valuable suggestions for this study. We also thank the institutions that provided data for this study.

Institutional Review Board Statement

Not applicable.

Informed Consent Statement

Not applicable.

Data Availability Statement

All the data used in this study have been presented in this paper.

Conflicts of Interest

The authors declare no conflicts of interest.

Abbreviations

The following abbreviations are used in this manuscript:
ACAutonomous Control
AISAutomatic Identification System
CCTVClosed Circuit Television
ECDISElectronic Chart Display and Information System
FMEAFailure Modes and Effects Analysis
FSAFormal Safety Assessment
GMDSSGlobal Maritime Distress and Safety System
GNSSGlobal Navigation Satellite System
HMMHidden Markov Model
HZAOPHazard and Operability Analysis
IMOInternational Maritime Organization
MASSMaritime Autonomous Surface Ship
MCManual Control
NCMsNavigation Control Modes
RIFsRisk Influencing Factors
RCRemote Control
SACShipboard Autonomous Controller
SCCShore-based Control Center
STAMPSystem-Theoretic Accident Modeling and Processes
STPASystem-Theoretic Process Analysis
UCAsUnsafe Control Actions

References

  1. Rødseth, Ø.J.; Burmeister, H.-C. Risk Assessment for an Unmanned Merchant Ship. TransNav Int. J. Mar. Navig. Saf. Sea Transp. 2015, 9, 357–364. [Google Scholar] [CrossRef]
  2. Wróbel, K.; Montewka, J.; Kujala, P. Towards the development of a system-theoretic model for safety assessment of autonomous merchant vessels. Reliab. Eng. Syst. Saf. 2018, 178, 209–224. [Google Scholar] [CrossRef]
  3. Munim, Z.H. Autonomous ships: A review, innovative applications and future maritime business models. Supply Chain Forum Int. J. 2019, 20, 266–279. [Google Scholar] [CrossRef]
  4. Goerlandt, F. Maritime Autonomous Surface Ships from a risk governance perspective: Interpretation and implications. Saf. Sci. 2020, 128, 104758. [Google Scholar] [CrossRef]
  5. Shaobo, W.; Yingjun, Z.; Lianbo, L. A collision avoidance decision-making system for autonomous ship based on modified velocity obstacle method. Ocean Eng. 2020, 215, 107910. [Google Scholar] [CrossRef]
  6. Chang, C.-H.; Kontovas, C.; Yu, Q.; Yang, Z. Risk assessment of the operations of maritime autonomous surface ships. Reliab. Eng. Syst. Saf. 2021, 207, 107324. [Google Scholar] [CrossRef]
  7. Guo, C.; Utne, I.B. Development of risk indicators for losing navigational control of autonomous ships. Ocean Eng. 2022, 266, 113204. [Google Scholar] [CrossRef]
  8. Lee, E.; Khan, J.; Son, W.-J.; Kim, K. An Efficient Feature Augmentation and LSTM-Based Method to Predict Maritime Traffic Conditions. Appl. Sci. 2023, 13, 2556. [Google Scholar] [CrossRef]
  9. Lee, E.; Khan, J.; Zaman, U.; Ku, J.; Kim, S.; Kim, K. Synthetic Maritime Traffic Generation System for Performance Verification of Maritime Autonomous Surface Ships. Appl. Sci. 2024, 14, 1176. [Google Scholar] [CrossRef]
  10. Wróbel, K.; Montewka, J.; Kujala, P. System-theoretic approach to safety of remotely-controlled merchant vessel. Ocean Eng. 2018, 152, 334–345. [Google Scholar] [CrossRef]
  11. IMO. Interim Guidelines for Maritime Autonomous Surface Ship Trials Approved. Maritime Safety Committee. Available online: https://www.imo.org/en/MediaCentre/MeetingSummaries/Pages/MSC-101st-session.aspx (accessed on 5 June 2023).
  12. Hoem, Å.S.; Fjortoft, K.; Rødseth, Ø.J. Addressing the Accidental Risks of Maritime Transportation: Could Autonomous Shipping Technology Improve the Statistics? TransNav Int. J. Mar. Navig. Saf. Sea Transp. 2019, 13, 487–494. [Google Scholar] [CrossRef]
  13. IMO. IMO Takes First Steps to Address Autonomous Ships. Available online: https://www.imo.org/en/MediaCentre/PressBriefings/Pages/08-MSC-99-MASS-scoping.aspx (accessed on 25 May 2018).
  14. Fan, C.; Montewka, J.; Zhang, D. A risk comparison framework for autonomous ships navigation. Reliab. Eng. Syst. Saf. 2022, 226, 108709. [Google Scholar] [CrossRef]
  15. Bolbot, V.; Theotokatos, G.; Wennersberg, L.A. A method to identify and rank objects and hazardous interactions affecting autonomous ships navigation. J. Navig. 2022, 75, 572–593. [Google Scholar] [CrossRef]
  16. Chen, P.; Huang, Y.; Mou, J.; van Gelder, P.H.A.J.M. Probabilistic risk analysis for ship-ship collision: State-of-the-art. Saf. Sci. 2019, 117, 108–122. [Google Scholar] [CrossRef]
  17. Thieme, C.A.; Utne, I.B. Safety performance monitoring of autonomous marine systems. Reliab. Eng. Syst. Saf. 2017, 159, 264–275. [Google Scholar] [CrossRef]
  18. Man, Y.; Lundh, M.; Porathe, T.; MacKinnon, S. From Desk to Field—Human Factor Issues in Remote Monitoring and Controlling of Autonomous Unmanned Vessels. Procedia Manuf. 2015, 3, 2674–2681. [Google Scholar] [CrossRef]
  19. Zhang, M.; Zhang, D.; Yao, H.; Zhang, K. A probabilistic model of human error assessment for autonomous cargo ships focusing on human–autonomy collaboration. Saf. Sci. 2020, 130, 104838. [Google Scholar] [CrossRef]
  20. Fan, C.; Montewka, J.; Zhang, D. Towards a Framework of Operational-Risk Assessment for a Maritime Autonomous Surface Ship. Energies 2021, 14, 3879. [Google Scholar] [CrossRef]
  21. Chou, C.-C.; Wang, C.-N.; Hsu, H.-P. A novel quantitative and qualitative model for forecasting the navigational risks of Maritime Autonomous Surface Ships. Ocean Eng. 2022, 248, 110852. [Google Scholar] [CrossRef]
  22. Wróbel, K.; Montewka, J.; Kujala, P. Towards the assessment of potential impact of unmanned vessels on maritime transportation safety. Reliab. Eng. Syst. Saf. 2017, 165, 155–169. [Google Scholar] [CrossRef]
  23. Fan, C.; Wróbel, K.; Montewka, J.; Gil, M.; Wan, C.; Zhang, D. A framework to identify factors influencing navigational risk for Maritime Autonomous Surface Ships. Ocean Eng. 2020, 202, 107188. [Google Scholar] [CrossRef]
  24. Ahvenjärvi, S. The Human Element and Autonomous Ships. TransNav Int. J. Mar. Navig. Saf. Sea Transp. 2016, 10, 517–521. [Google Scholar] [CrossRef]
  25. Saha, R. Mapping competence requirements for future shore control center operators. Marit. Policy Manag. 2021, 50, 415–427. [Google Scholar] [CrossRef]
  26. Yoshida, M.; Shimizu, E.; Sugomori, M.; Umeda, A. Identification of the Relationship between Maritime Autonomous Surface Ships and the Operator’s Mental Workload. Appl. Sci. 2021, 11, 2331. [Google Scholar] [CrossRef]
  27. Wang, K.; Xiong, L.; Xue, R. Real-time data stream learning for emergency decision-making under uncertainty. Phys. A Stat. Mech. Its Appl. 2024, 633, 129429. [Google Scholar] [CrossRef]
  28. Leveson, N. A new accident model for engineering safer systems. Saf. Sci. 2004, 42, 237–270. [Google Scholar] [CrossRef]
  29. Zhou, X.-Y.; Liu, Z.-J.; Wang, F.-W.; Wu, Z.-L.; Cui, R.-D. Towards applicability evaluation of hazard analysis methods for autonomous ships. Ocean Eng. 2020, 214, 107773. [Google Scholar] [CrossRef]
  30. Thieme, C.A.; Utne, I.B.; Haugen, S. Assessing ship risk model applicability to Marine Autonomous Surface Ships. Ocean Eng. 2018, 165, 140–154. [Google Scholar] [CrossRef]
  31. Banda, O.A.V.; Kannos, S.; Goerlandt, F.; van Gelder, P.H.A.J.M.; Bergström, M.; Kujala, P. A systemic hazard analysis and management process for the concept design phase of an autonomous vessel. Reliab. Eng. Syst. Saf. 2019, 191, 106584. [Google Scholar] [CrossRef]
  32. Wu, J.; Hu, S.; Jin, Y.; Fei, J.; Fu, S. Performance Simulation of the Transportation Process Risk of Bauxite Carriers Based on the Markov Chain and Cloud Model. J. Mar. Sci. Eng. 2019, 7, 108. [Google Scholar] [CrossRef]
  33. Li, W.; Chen, W.; Hu, S.; Xi, Y.; Guo, Y. Risk evolution model of marine traffic via STPA method and MC simulation: A case of MASS along coastal setting. Ocean Eng. 2023, 281, 114673. [Google Scholar] [CrossRef]
  34. Saldanha, M.C.W.; de Carvalho, R.J.M.; Arcuri, R.; Amorim, A.G.; Vidal, M.C.R.; Carvalho, P.V.R.D. Understanding and improving safety in artisanal fishing: A safety-II approach in raft fishing. Saf. Sci. 2020, 122, 104522. [Google Scholar] [CrossRef]
  35. de Carvalho, D.F.; Kaymak, U.; Van Gorp, P.; van Riel, N. A Markov model for inferring event types on diabetes patients data. Healthc. Anal. 2022, 2, 100024. [Google Scholar] [CrossRef]
  36. Hassan, M.R.; Ramamohanarao, K.; Kamruzzaman, J.; Rahman, M.; Hossain, M.M. A HMM-based adaptive fuzzy inference system for stock market forecasting. Neurocomputing 2013, 104, 10–25. [Google Scholar] [CrossRef]
  37. Wang, X.; Liu, J.; Moore, S.J.; Nugent, C.D.; Xu, Y. A behavioural hierarchical analysis framework in a smart home: Integrating HMM and probabilistic model checking. Inf. Fusion 2023, 95, 275–292. [Google Scholar] [CrossRef]
  38. Salawudeen, A.T.; Mu’azu, M.B.; Adedokun, E.A.; Baba, B.A. Optimal determination of hidden Markov model parameters for fuzzy time series forecasting. Sci. Afr. 2022, 16, e01174. [Google Scholar] [CrossRef]
  39. Zheng, J.; Yu, D.; Zhu, B.; Tong, C. Learning hidden Markov models with unknown number of states. Phys. A Stat. Mech. Its Appl. 2022, 594, 127047. [Google Scholar] [CrossRef]
  40. Zheng, X.; Zhang, D.; Gao, H.; Zhao, Z.; Huang, H.; Wang, J. A Novel Framework for Road Traffic Risk Assessment with HMM-Based Prediction Model. Sensors 2018, 18, 4313. [Google Scholar] [CrossRef] [PubMed]
  41. Xiong, X.; Chen, L.; Liang, J. A New Framework of Vehicle Collision Prediction by Combining SVM and HMM. IEEE Trans. Intell. Transp. Syst. 2018, 19, 699–710. [Google Scholar] [CrossRef]
  42. Zhu, K.; Zhao, X.; Zhang, L.; Yu, H. Research on aging-related degradation of control rod drive system based on dynamic object-oriented Bayesian network and hidden Markov model. Nucl. Eng. Technol. 2022, 54, 4111–4124. [Google Scholar] [CrossRef]
  43. Karaca, Y.; Baleanu, D.; Karabudak, R. Hidden Markov Model and multifractal method-based predictive quantization complexity models vis-á-vis the differential prognosis and differentiation of Multiple Sclerosis’ subgroups. Knowl. Based Syst. 2022, 246, 108694. [Google Scholar] [CrossRef]
  44. Nesdoly, A.; Bone, C.; Fraser, M.; Serra-Sogas, N.; Canessa, R. Evaluating models for classifying movement of whale-watching vessels. Ecol. Inform. 2023, 73, 101903. [Google Scholar] [CrossRef]
  45. Leveson, N. A systems approach to risk management through leading safety indicators. Reliab. Eng. Syst. Saf. 2015, 136, 17–34. [Google Scholar] [CrossRef]
  46. Burmeister, H.-C.; Bruhn, W.; Rødseth, Ø.J.; Porathe, T. Autonomous Unmanned Merchant Vessel and its Contribution towards the e-Navigation Implementation: The MUNIN Perspective. Int. J. e-Navig. Marit. Econ. 2014, 1, 1–13. [Google Scholar] [CrossRef]
  47. Wrobel, K.; Krata, P.; Montewka, J.; Hinz, T. Towards the Development of a Risk Model for Unmanned Vessels Design and Operations. TransNav Int. J. Mar. Navig. Saf. Sea Transp. 2016, 10, 267–274. [Google Scholar] [CrossRef]
  48. Hu, S.; Li, W.; Xi, Y.; Li, W.; Hou, Z.; Wu, J.; Han, B. Evolution pathway of process risk of marine traffic with the STAMP model and a genetic algorithm: A simulation of LNG-fueled vessel in-and-out harbor. Ocean Eng. 2022, 253, 111133. [Google Scholar] [CrossRef]
  49. MUNIN. Final Report Summary—MUNIN (Maritime Unmanned Navigation through Intelligence in Networks). European Commission. 2016. Available online: https://cordis.europa.eu/project/id/314286/reporting (accessed on 4 April 2016).
  50. AAWA. Remote and autonomous surface ships the next steps. In Report of the Andvanced Autonomous Waterbone Applications (AAWA) Initiative Project. 2016. Available online: https://www.rolls-royce.com/~/media/Files/R/Rolls-Royce/documents/customers/marine-/ship-intel/aawa-whitepaper-210616.pdf (accessed on 24 October 2016).
  51. Zhou, X.-Y.; Liu, Z.-J.; Wang, F.-W.; Wu, Z.-L. A system-theoretic approach to safety and security co-analysis of autonomous ships. Ocean Eng. 2021, 222, 108569. [Google Scholar] [CrossRef]
  52. Yan, F.; Zhang, Q.; Ye, S.; Ren, B. A novel hybrid approach for landslide susceptibility mapping integrating analytical hierarchy process and normalized frequency ratio methods with the cloud model. Geomorphology 2019, 327, 170–187. [Google Scholar] [CrossRef]
  53. Chaal, M.; Banda, O.A.V.; Glomsrud, J.A.; Basnet, S.; Hirdaris, S.; Kujala, P. A framework to model the STPA hierarchical control structure of an autonomous ship. Saf. Sci. 2020, 132, 104939. [Google Scholar] [CrossRef]
  54. Ramos, M.A.; Thieme, C.A.; Utne, I.B.; Mosleh, A. Human-system concurrent task analysis for maritime autonomous surface ship operation and safety. Reliab. Eng. Syst. Saf. 2020, 195, 106697. [Google Scholar] [CrossRef]
  55. Aylward, K.; Weber, R.; Lundh, M.; MacKinnon, S.N.; Dahlman, J. Navigators’ views of a collision avoidance decision support system for maritime navigation. J. Navig. 2022, 75, 1035–1048. [Google Scholar] [CrossRef]
Figure 1. The flowchart of the proposed risk comparison framework.
Jmse 12 01129 g001
Figure 2. A typical STPA analysis procedure.
Jmse 12 01129 g002
Figure 3. STAMP model of MASS control path and process.
Jmse 12 01129 g003
Figure 4. HMM for evaluating the risk performance of MASS navigation.
Jmse 12 01129 g004
Figure 5. The survey results of the maximum tolerance values for the risk status of RIFs under three NCMs.
Jmse 12 01129 g005
Figure 6. Parameters training of Hidden Markov Model.
Jmse 12 01129 g006
Figure 7. Application scenario and distribution of the external environment on MASS navigation route.
Jmse 12 01129 g007
Figure 8. Random state data of SCC and SAC subsystems.
Jmse 12 01129 g008
Figure 9. The transfer process of risk performance in three NCMs.
Jmse 12 01129 g009
Figure 10. Process risk of MASS navigation in three NCMs.
Jmse 12 01129 g010
Figure 11. Sensitivity of risk outcome during voyage.
Jmse 12 01129 g011
Figure 12. Box plot in simulation integrating into cloud model.
Jmse 12 01129 g012
Table 1. The description of control loop under three NCMs.
NCMs.Control Process
MCPerception (34/40/41→37/38/28/30/31/32→22/24/25/35/→14/16/18/20/10/12)→Decision making (7→Crew→8) →Action (9/11/→13/15/17/19/31→33)
RCPerception (34/40/412→37/38/28/30→22/24/25/35/→14/16/18/20/10/12)→Decision making (6→ASC→4→2→SCC→1→3→5 or 6→ASC→4→2→SCC→1→39)→Action (9/11/→13/15/17/19-33)
ACPerception (34/40/41→37/38/28/30→22/24/25/35/→14/16/18/20/10/12)→Decision making (6→ASC→5)→Action (9/11/→13/15/17/19→33)
Table 2. Ship navigation scenario parameters.
ParameterDescriptionParameterDescription
Length117 mShip age5 years
Width17 mInitial positionNo. 2 pilot boarding point in Yangkou Port
Depth9.9 mFinal positionNo. 1 (S) pilot boarding point in Shanghai Port
Draft4.2 mDistance110 n mile
Ship TypeContainerVoyage time11 h
Table 3. Description of causes of UCAs identified.
TypeDirect Causes in ACDirect Causes in MCDirect Causes in RC
UCA-1CFVessel sensors (Radar, ECDIS or GNSS) failure; control command loss due to defects of control algorithms; propulsion or steering failure Vessel sensors (Radar, ECDIS or GNSS) failure; negligence, fault and lack of skill of crews; propulsion or steering failureVessel sensors (Radar, ECDIS or GNSS) failure; negligence, fault and lack of skill of operators; remote control equipment failure in SCC
UIUnable to receive feedback information; control command not executed; software engineer lacking knowledge of the latest rules or potential traffic scenariosUnable to receive feedback information; no response from propulsion or steering system; Unable to receive feedback information; poor cooperation between the ship and the RCC; communication failure or break off; control command not executed
EDClutter interference by rain or snow; complex traffic situationClutter interference by rain or snow; complex traffic situationClutter interference by rain or snow; complex traffic situation
UCA-2CFECDIS data error or GNSS data loss; control command error due to defects of control algorithmsECDIS data error or GNSS data loss; human negligence or decision-making errorECDIS data error or GNSS data loss; human negligence or decision-making error; control action error due to defects of control algorithms
UISoftware engineer lacking knowledge of the latest rules or potential traffic scenarios;
received incorrect perception information; error executing the control command
Violation or incorrect operation
received incorrect perception information; unknown error from propulsion or steering system
Negligent or incorrect operation; The complacency brought about by intelligence; received incorrect perception information and error alert; poor cooperation between the ship and the RCC
EDChange in current or winds; complex traffic situationPoor visibility; heavy waves or wind; complex traffic situationPoor visibility; heavy waves or wind; complex traffic situation
UCA-3CFControl algorithm defects, decision-making process delayCrew decision-making process delays due to lack of experiencesOperator decision-making process delays due to lack of experiences; control algorithm execution delay
UICommunication network delay;
system response delay;
information transmission delay
Communication network delay;
control response delay;
information transmission delay
Communication network delay;
remote control response delay;
information transmission delay
EDChange in natural (currents, wind or wave) and traffic conditionsChange in natural (currents, wind or wave) and traffic conditionsChange in natural (currents, wind or wave) and traffic conditions
UCA-4CFThe propulsion or steering system failure onboard; insufficient command execution due to control algorithm defectsThe propulsion or steering system failure onboard; insufficient decision making due to operator cognitive limitationsFailure of remote control equipment or vessel control equipment; insufficient decision making due to operator cognitive limitations
UICommunication interrupt;
inadequate execution of control commands; received incorrect or insufficient sensor information
Communication interrupt;
inadequate execution of control commands; received incorrect or insufficient feedback; low coordination with other ships, the port or maritime authority
Communication interrupt;
inadequate execution of remote-control commands; received incorrect or insufficient feedback; low coordination with other ships, the port or maritime authority
EDChange in natural (currents, wind or wave) and traffic conditionsChange in natural (currents, wind or wave) and traffic conditionsChange in natural (currents, wind or wave) and traffic conditions
Table 4. Risk-rating indicators and grading norms.
No.IndicatorRisk Performance
R1R2R3R4
X1Wind (m/s)[0,4)[4,9)[9,15)[15,∞)
X2Current (m/s)[0,0.5)[0.5,1)[1,2)[2,∞)
X3Visibility (nmile)[8,∞)[4,8)[2,4)[0,2)
X4Wave (m)[0,0.3)[0.3,0.5)[0.5,1.5)[1.5,∞)
X5Route crossings (number)[1,2)[2,3)[3,4)[4,∞)
X6Traffic density (N/h)[0,5)[5,10)[10,15)[15,∞)
X7Traffic complexity (score)[0,36)[36,72)[72,108)[108,∞)
X8Personnel competencyStrongStrongerWeakerWeak
X9Physical and mental state of personnelGoodBetterWorsePoor
X10Working conditions of remote control equipmentNormalIndividual failurePartial failureAll failure
X11Violation or abnormal operationRarelyOccasionallyFrequentlyConstantly
X12Human–computer interaction interfaceNormalIndividual failurePartial failureAll failure
X13Communication networkGoodBetterWorsePoor
X14Working conditions of sensorsNormalIndividual failurePartial failureAll failure
X15Working conditions of controllersNormalIndividual failurePartial failureAll failure
X16Working conditions of autonomous decision-making systemNormalIndividual failurePartial failureAll failure
Table 5. The background of questionnaire participants.
Participant GroupNumberPercentage (%)Other Information
Group IScholar/captain516.67There are 3 professors and 2 associate professors
Scholar/officer516.67They are all associate professors and have rich navigation experience
Group IICaptain310They are all working in merchant vessels
Pilot620
Officer26.66
Group IIIEngineer of CCS310They are all senior engineers with no prior navigation experience
Group IVScholar/information engineer310They all have no navigation experiences
Scholar/officer/information engineer310They have acquired rich navigation expertise through their previous roles as vessel officers
Total 30100
Disclaimer/Publisher’s Note: The statements, opinions and data contained in all publications are solely those of the individual author(s) and contributor(s) and not of MDPI and/or the editor(s). MDPI and/or the editor(s) disclaim responsibility for any injury to people or property resulting from any ideas, methods, instructions or products referred to in the content.

