Article

Numerical Study of Hydrodynamic Characteristics of a Three-Dimensional Oscillating Water Column Wave-Power Device

by
Jun-Lin Zhu
,
Peng Tang
*,
Hong-Sheng Zhang
* and
Peng-Bo Zheng
College of Ocean Science and Engineering, Shanghai Maritime University, Shanghai 201306, China
*
Authors to whom correspondence should be addressed.
J. Mar. Sci. Eng. 2024, 12(7), 1161; https://doi.org/10.3390/jmse12071161
Submission received: 11 June 2024 / Revised: 6 July 2024 / Accepted: 8 July 2024 / Published: 10 July 2024
(This article belongs to the Topic Wind, Wave and Tidal Energy Technologies in China)

Abstract

:
The impact of wave-induced forces on the integrity of stationary oscillating water column (OWC) devices is essential for ensuring their structural safety. In our study, we built a three-dimensional numerical model of an OWC device using the computational fluid dynamics (CFDs) software OpenFOAM-v1912. Subsequently, the hydrodynamic performance of the numerical model is comprehensively validated. Finally, the hydrodynamic performance data are analyzed in detail to obtain meaningful conclusions. Results indicate that the horizontal wave force applied to the OWC device is approximately 6.6 to 7.9 times greater than the vertical wave force, whereas the lateral wave force is relatively small. Both the horizontal and vertical wave forces decrease as the relative water depth increases under a constant wave period and height. In addition, the highest dynamic water pressure is observed at the interface between the water surface and device, both within and outside the front wall of the gas chamber. The dynamic water pressure at different locations on the front chamber increases and subsequently decreases as the wave frequency increases.

1. Introduction

Oceans have a variety of renewable energy sources, including ocean wind, wave, tidal, temperature, and salt. They are also the Earth’s greatest receivers of solar energy. Wave energy is particularly important for mitigating the energy crisis and environmental pollution, thus rendering its development and utilization essential. To extract and convert wave energy, various wave-energy-conversion technologies have been developed. Owing to its straightforward design, minimal undersea moving parts, and inexpensive upkeep, the OWC device is a viable choice [1]. Over the past few decades, a great deal of research has been conducted on the hydrodynamic performance of OWC devices. For example, Bayoumi et al. [2] developed a numerical wave-energy prediction tool that was experimentally validated for an offshore spar buoy OWC and discovered that the predictions aligned with the experimental results outside the resonance frequency. Evans [3] assumed that the water surface width within an OWC chamber was significantly smaller than the wavelength; thus, they disregarded the wave-surface variation within the chamber and reduced the wave-surface motion to a rigid piston motion to increase energy-conversion efficiency. Martins-rivas et al. [4] investigated the effects of the shoreline angle of incident and reflective waves on power-generation efficiency under a constant sea depth and a bluff coast. Nader et al. [5] used the finite-element approach to model single and multiple OWC devices and found that the closeness of the devices considerably influenced the power-generation efficiency. A basic three-dimensional (3D) OWC model based on potential flow theory was created by Dimakopoulos et al. [6] to study the impact of air compressibility on energy-conversion efficiency while taking air compressibility into account. Through physical model tests and theoretical research, Xu et al. [7] evaluated the wave-energy extraction of a 3D OWC device using a secondary power output model. They found that shorter waves were severely impacted by spatial non-uniformity and viscous losses. Hu et al. [8] established a two-dimensional (2D) model of an offshore OWC with a rectangular chamber and used theoretical and numerical methods to examine the effects of immersion depth and chamber width on energy-conversion efficiency; their results indicated that the frequency of the peak efficiency decreased with increasing immersion depth.
However, studies regarding forces exerted on OWC wave-energy devices and few related studies exist. Physical model studies were conducted by Ashlin et al. [9] on a fixed 2D OWC to examine wave forces in both horizontal and vertical orientations. They found that, on the OWC structure, the peak horizontal wave forces were 2.5–3 times greater than the peak vertical wave forces. Jakobsen et al. [10] investigated wave stress on a hemispherical point absorber using both physical model testing and simulations. Numerical simulations were used by Elhanafi [11] to study the wave force on a stationary, two-dimensional rectangular OWC. He discovered that, regardless of changes in the incident wave’s wavelength and height, the horizontal wave force is always greater than the vertical wave force. The effect of viscosity on wave force was investigated by adding an artificial viscous term to a 2D OWC through numerical simulation, which showed that the effect of viscosity on the total horizontal wave force at the front wall increased with the front wall draft [12]. Ning et al. [13] investigated the wave force on a 2D OWC via physical model tests and numerical simulations, where they demonstrated that the total wave force decreased with increasing wavelength and increased with increasing incident wave height. Additionally, they discovered that the wave force was affected significantly by the opening rate, with higher opening rates resulting in smaller wave forces in the low-frequency region, whereas the opposite trend was observed in the high-frequency region.
The 3D circular OWC device research has mostly concentrated on energy-conversion efficiency, with little attention given to force laws. Deng et al. [14] and Zhou et al. [15] investigated the energy-conversion efficiency of a 3D circular OWC using the eigenfunction expansion method. Huang et al. [16], as well as Xv and Huang [17], investigated the flow-field characteristics near an OWC device. He et al. [18,19] experimentally verified the energy-conversion efficiency of a 3D circular OWC using a physical model. Zhou et al. [20] investigated the energy-conversion efficiency and hydrodynamic performance of a 3D circular OWC device via numerical simulations. Zhou et al. [21] investigated the energy-conversion efficiency and force characteristics of a 3D circular OWC device both experimentally and numerically. Several researchers [22,23,24] integrated a circular OWC and investigated its power-generation efficiency.
Studies pertaining to 3D circular OWC devices focus primarily on energy-conversion efficiency [14,15,18,19,21,22,23,24,25] and flow-field characteristics [16,17], whereas force laws are focused less. Most previous studies regarding the force laws of OWC devices are restricted to 2D models, such as fixed 2D OWC devices [9,11,12,13]. These models cannot account for the complexity of 3D space; hence, their force characteristics cannot be utilized to analyze the forces of 3D OWC devices. In addition, experimentally verifying the overall forces of 3D OWC devices is difficult, thus rendering numerical simulations an ideal method for evaluating them.
In recent years, many OWC wave-energy-conversion devices [26] and marine structures [27] have been unable to operate normally due to various degrees of damage. Therefore, it has become especially critical to fully consider the wave loads on the devices to ensure their safe design and long-term stable operation [28]. Therefore, scholars began to consider the wave force characteristics of 3D OWCs. Li et al. [29] established a semi-analytical two-chamber OWC by using potential flow theory and the matched eigenfunction method and investigated the relationship between the angle of the incident wave and the wave load on the cavity but did not study the relationship between the forces on the whole device and the wave parameters. Although Ning et al. [30] investigated the force characteristics of 2D and 3D OWCs through experiments and numerical simulations, their findings are not generalizable to the type of waves studied, isolated waves. Huang et al. [31] investigated the forces exerted on 3D circular OWC devices under wave loading via numerical simulations. The results showed that wave loading is insensitive to changes in wavelength and period but increases with wave height. Although Huang et al. [31] extensively investigated the force law of a 3D circular OWC device, they did not provide a quantitative law for the variation in force with wave height of the OWC device. Moreover, they did not investigate the effects of water depth on the force of the OWC device or the variation in the dynamic water pressure of the device.
Therefore, the objective of this study is to perform a more detailed examination and analysis of 3D OWC force laws. In Section 2, the numerical modeling of a 3D circular OWC device is presented. In Section 3, the accuracy of the model is verified. In Section 4, the effects of wave period, wave height, and water depth on the forces in the OWC are analyzed, and conclusions about the effects of wave height on the forces in the OWC are provided; subsequently, the dynamic water pressure in the internal and external front walls of the OWC is analyzed. In Section 5, the conclusions are summarized, and future endeavors are presented.

2. Materials and Methods

In this study, a 3D wave flume was developed using the finite-volume approach for wave interactions with a 3D circular OWC-type device supported by a bottom-sitting C-shaped structure. The Cartesian coordinate system was established at the intersection of the static water surface (water depth d = 0.30 m) and the midline of the flume side, i.e., the center point of the flume left-end rectangle, with the positive z-axis oriented vertically upward and the positive x-axis oriented horizontally to the right. A 3D diagram of the numerical wave tank is shown in Figure 1. The device was placed at the center of the sink’s calculation area. The outer diameter of the device D = 0.125 m, the diameter of the upper orifice DO = 0.014 m, the size of the lower opening Ds = 0.244 m, and the column height Dh = 0.4 m (see Figure 2).
OpenFOAM was chosen for numerical modeling due to its open source nature and flexibility, with the numerical model incorporating free-slip wall boundaries at the front and back of the flume, the bottom, and the OWC units while applying no-slip conditions to the walls, and patch boundaries at the top, left, and right of the flume. The velocity inlet and pressure outlet were placed on the left and right sides of the flume, respectively, and the top of the flume was imposed with both the velocity-outlet and pressure-outlet boundary conditions (pressureInletOutletVelocity). Meanwhile, the waves2Foam relaxation zone technology was used to generate and eliminate waves [32]. The role of the relaxation zone is to distribute weights between the calculated and theoretical values, as well as to create and eliminate waves through the transition between analytical and CFD solutions; therefore, an appropriate length of the relaxation zone for wave creation and elimination is required.
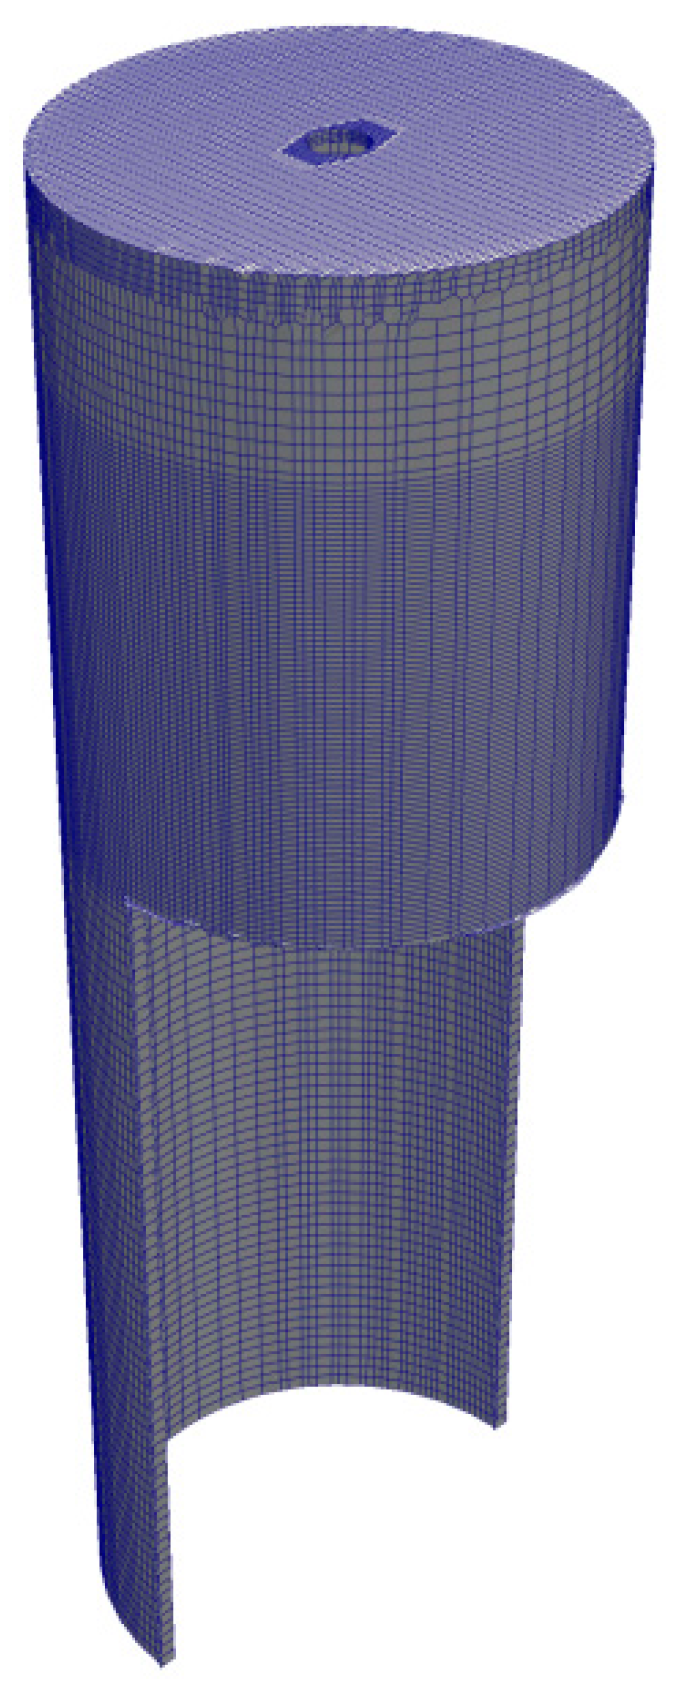
All the above numerical parameters and boundary conditions were carefully designed according to the actual experimental conditions [7]. In order to ensure the accuracy of wave creation and dissipation, the length of the flume was set to 15 m, the width and height were set to 0.6 m, and the lengths of the left and right waveform relaxation zones were set to twice the wavelength λ . The spatial step Δ x in the x direction was set to Δ x / λ 1 / 67 . In the z direction, z = 0 was set as the reference point. The area above and below the reference point at twice the length of the wave height 2H was encrypted, where the spatial step Δ z in the encrypted area was set to Δ z / H = 0.5 and the spatial step in the non-encrypted area was set to Δ z / H = 1.3 . To ensure the accuracy of the device calculations, the grid on the surface of the OWC device was encrypted, as shown in Figure 3. The time step Δt was calculated using the time step Δt, which was automatically adjusted to improve model stability using adjustRunTime in the Controldict file.

3. Theory and Validation

3.1. Governing Equations

Under low water velocity, water is typically assumed to be an incompressible fluid, i.e., its density ρ = 1000 kg/m3 is constant, and the fluid satisfies the continuity and momentum equations.
U t + ( U ) U = p ρ g z ,
In Equation (1), U is the fluid velocity, t is the time, p is the pressure, g is the acceleration owing to gravity, and z is the water surface height. The free surface of a liquid under a two-phase flow model can be modeled using the VOF method [33] as follows:
C t + ( U C ) = 0 ,
In Equation (2), C is the volume fraction of the fluid. The wave force exerted on the device can be solved by integrating the pressure over the device surface as follows:
F = τ p n d τ ,
In Equation (3), F is the force applied to the structure, p is the pressure on the surface of the structure, n is the normal vector on the surface of the device, and τ is the surface area of the structure. Because the gas pressure is extremely low relative to the wave load, the wave force is expressed as F minus the hydrostatic load.

3.2. Model Validation

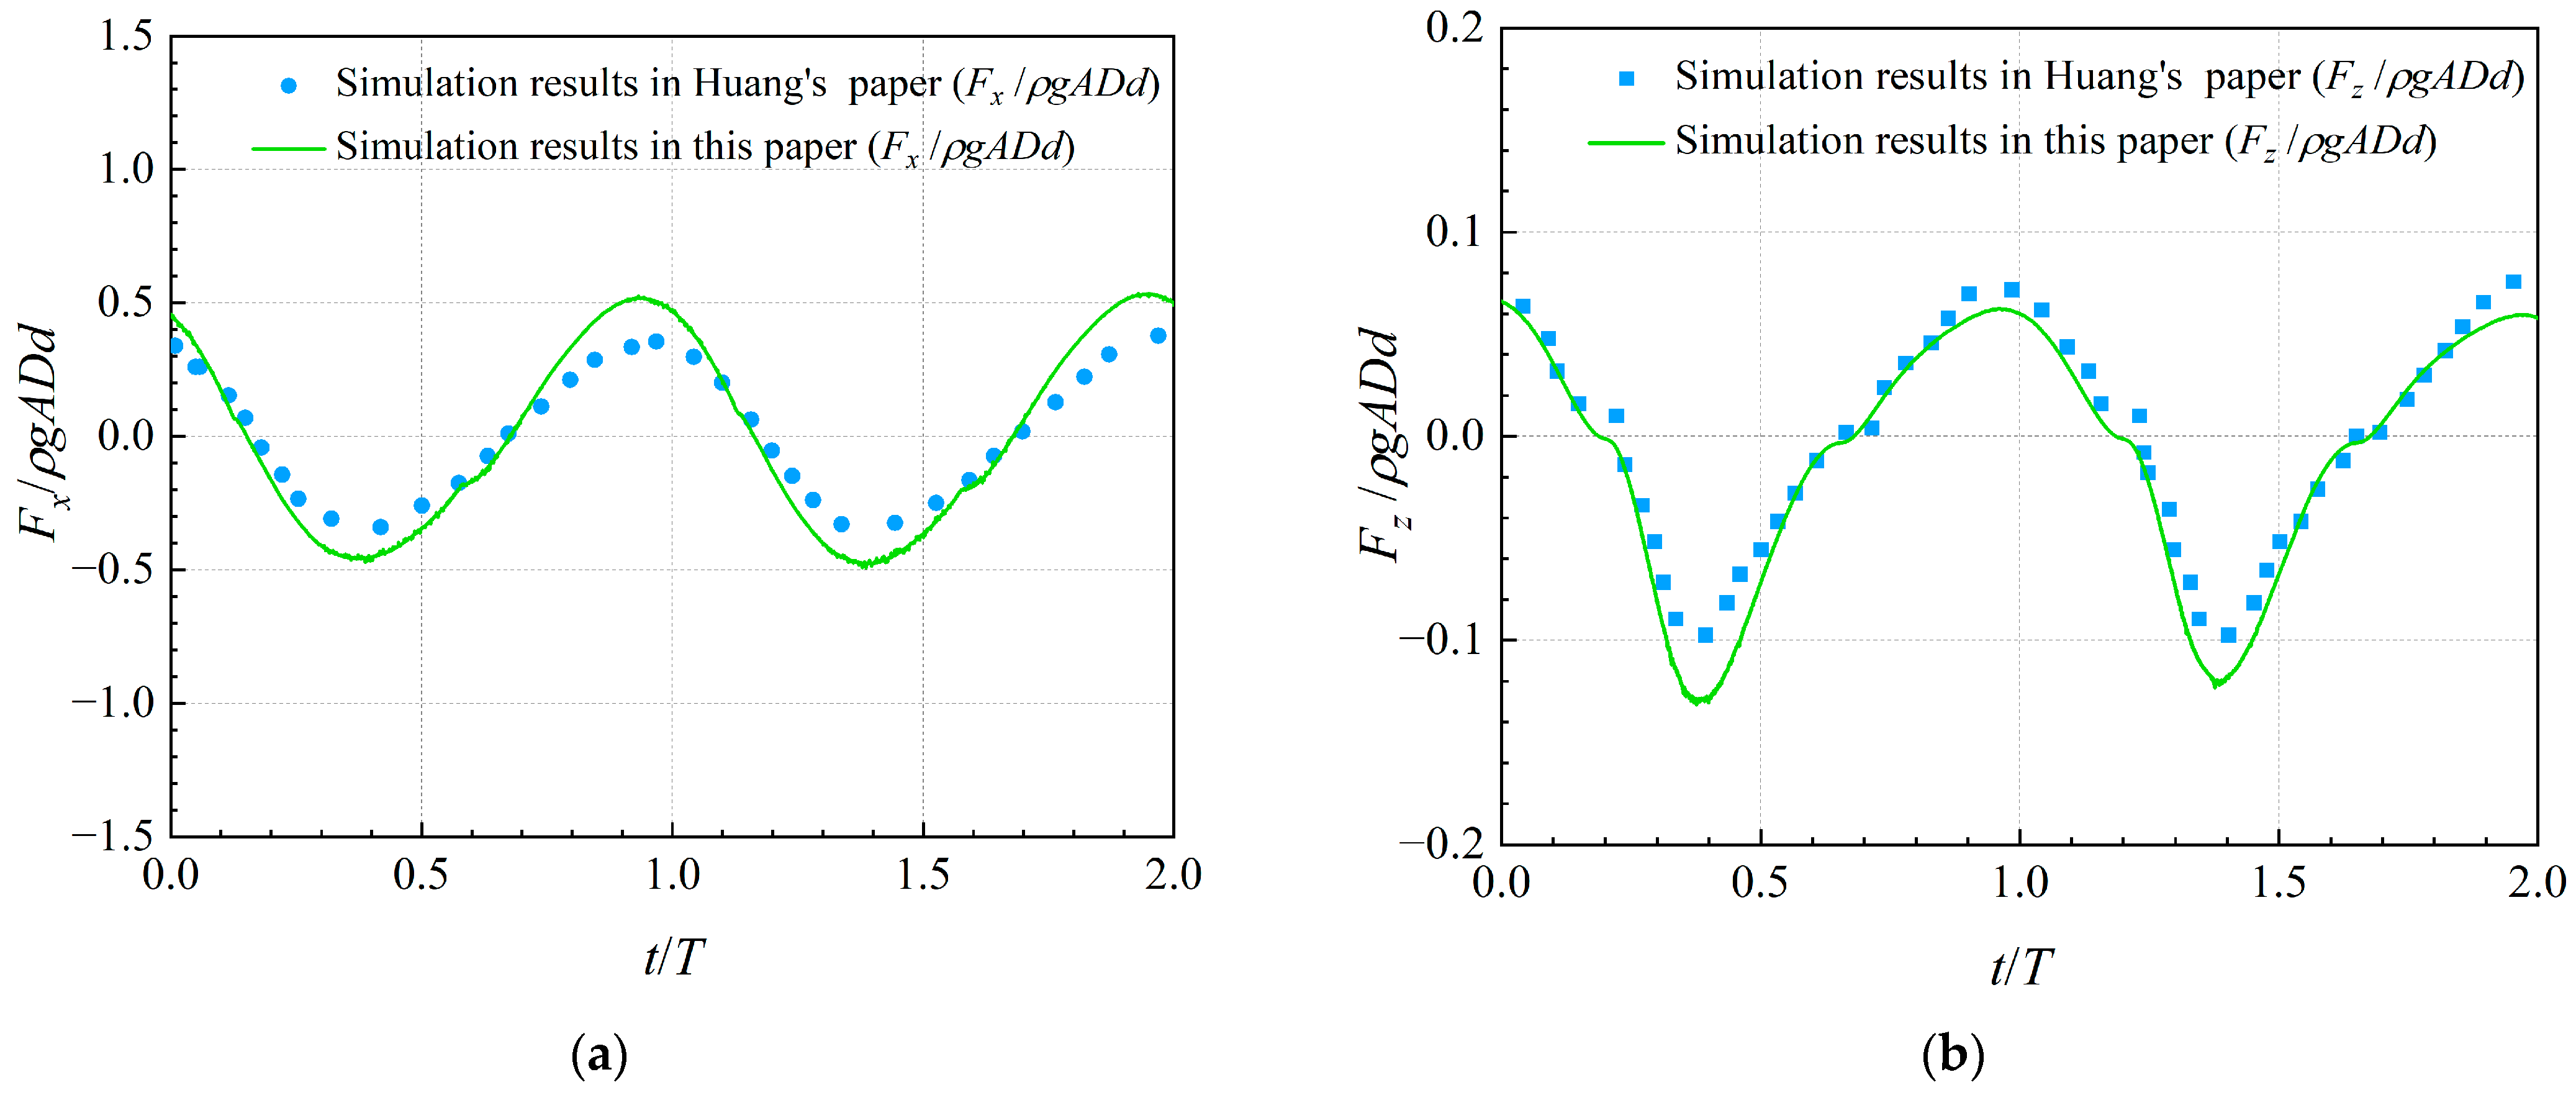
The numerical results of this study based on an incident wave period T of 1.40 s, a water depth d of 0.30 m, and H = 0.04 m for the horizontal wave force Fx and vertical wave force Fz are presented in Figure 4a for a comparison with the numerical results of Huang et al. [31]. Figure 4a,b shows that the numerical results agreed well with each other, thus indicating that the OWC wave-energy device established in this study can accurately simulate the wave load on the device.
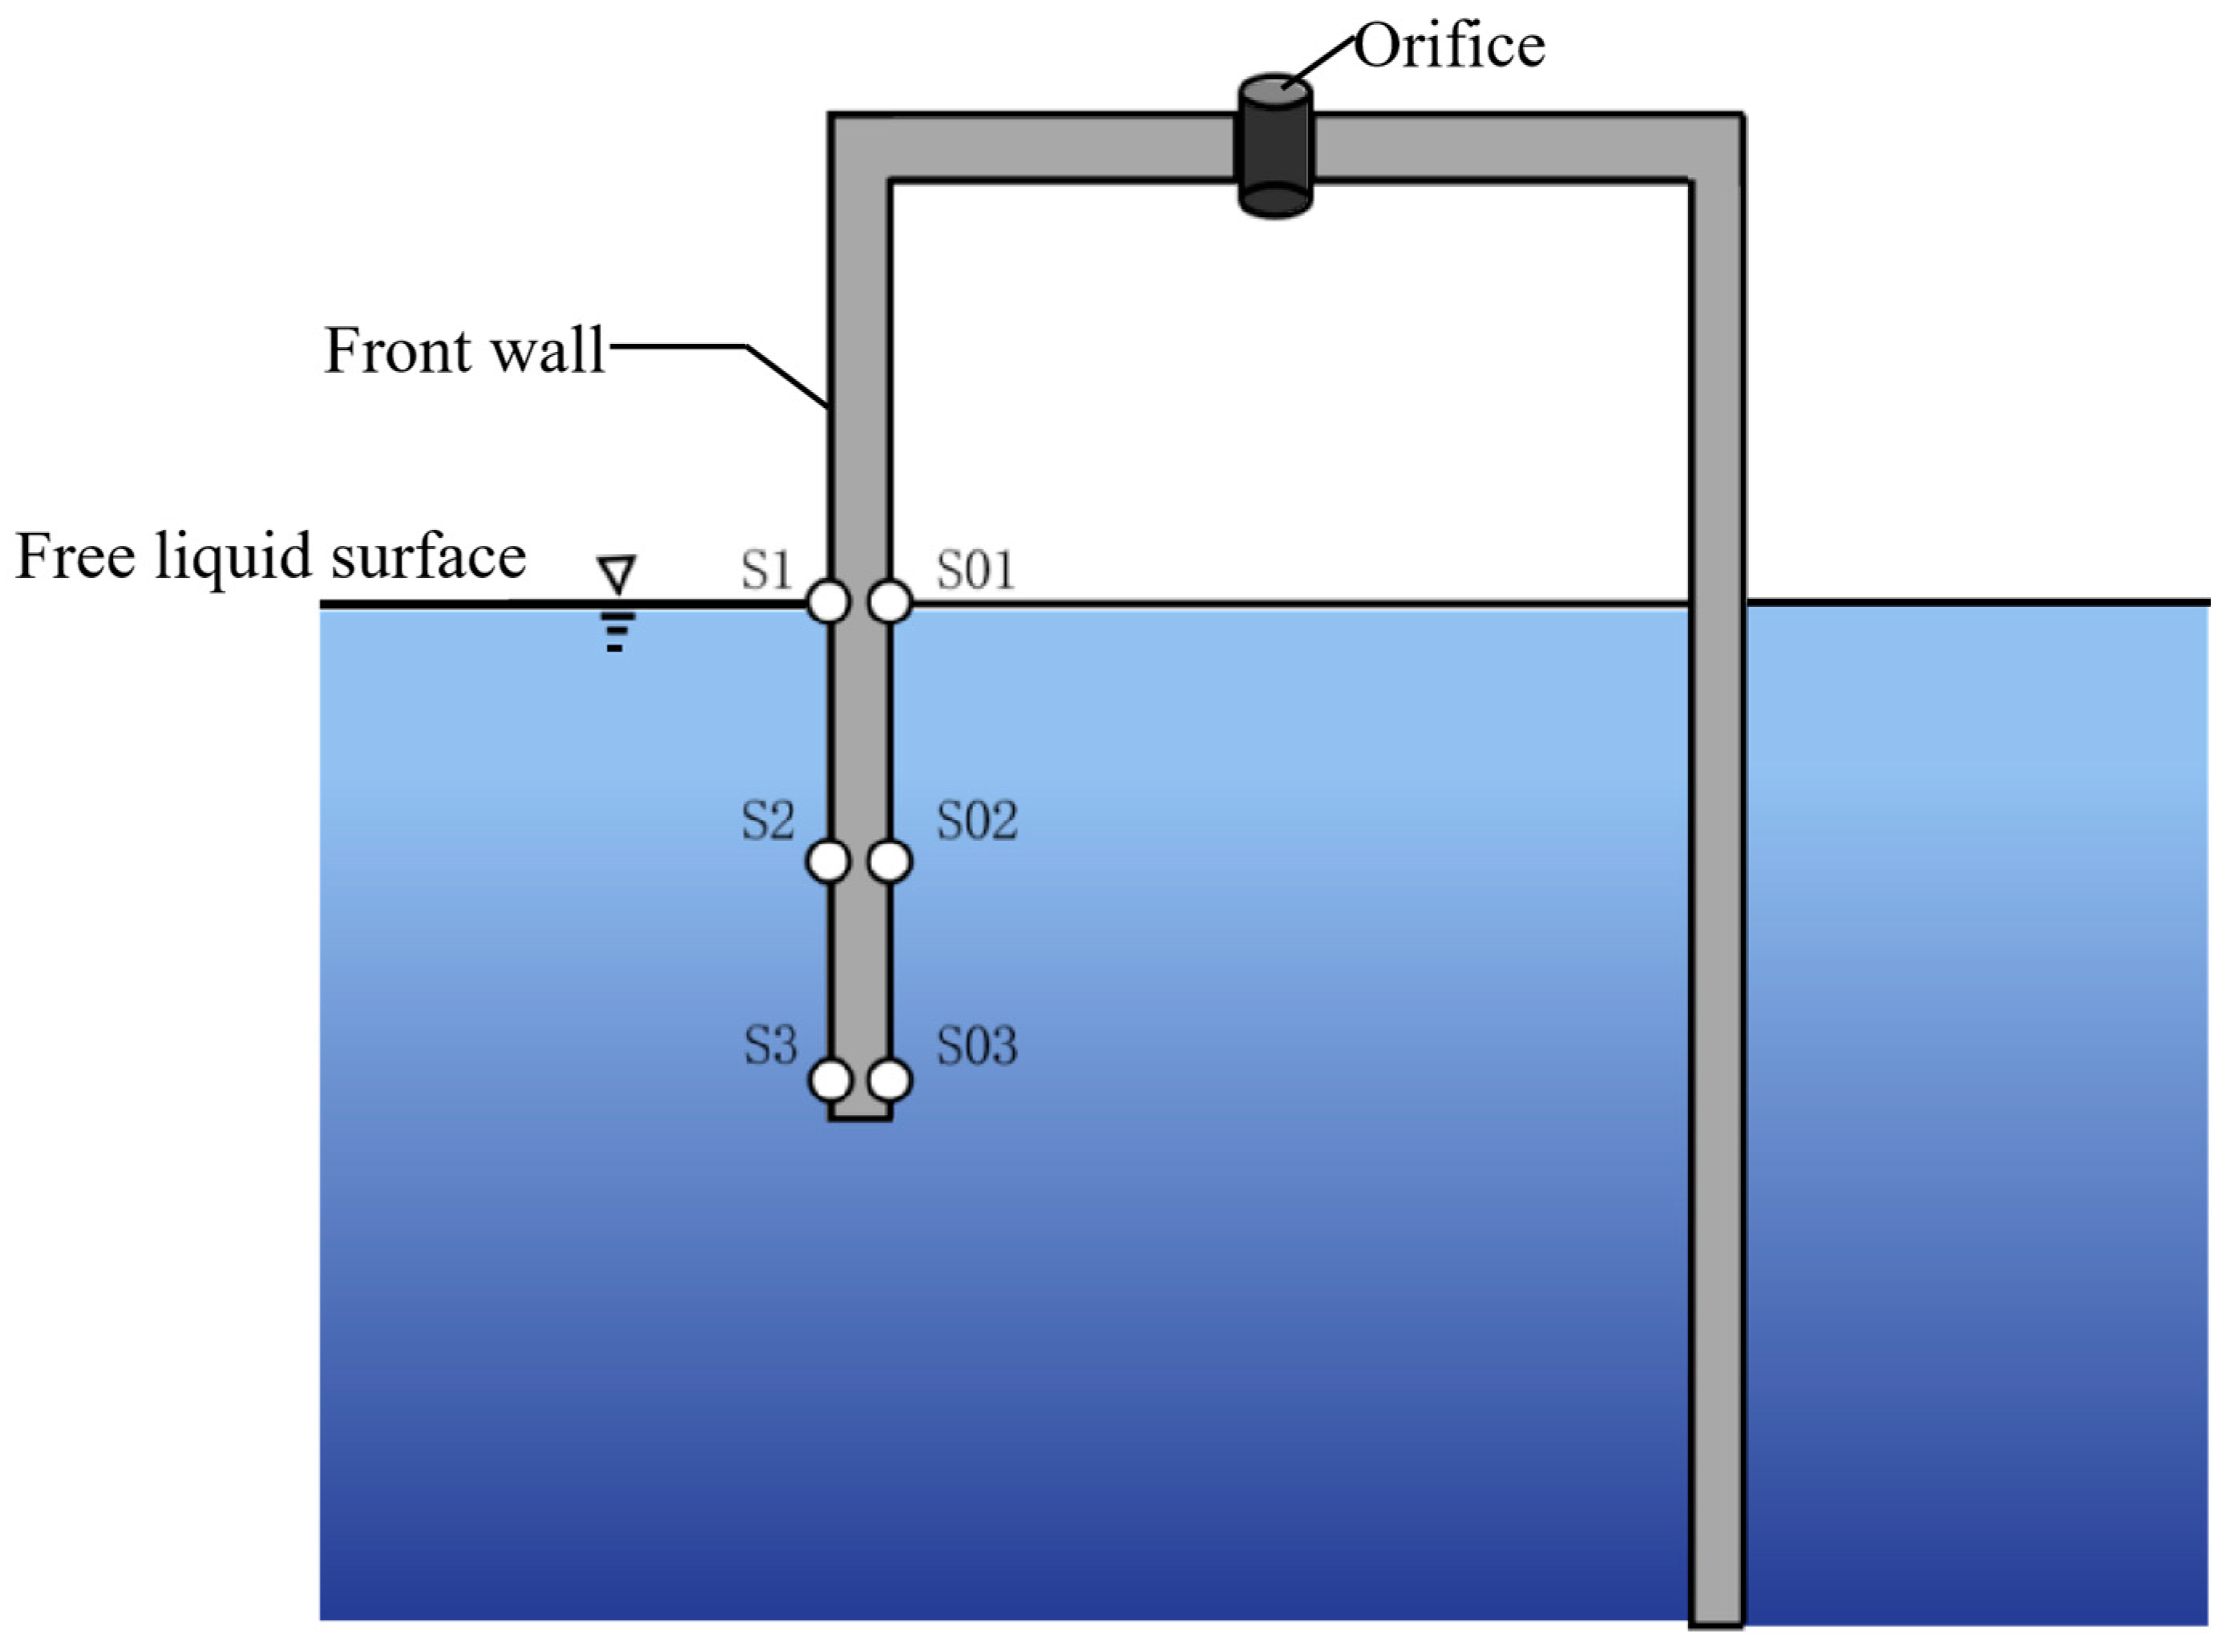
As shown in Figure 5, six monitoring points, i.e., (S1 and S01), (S2 and S02), and (S3 and S03), were arranged at the hydrostatic water surface inside and outside the front wall of the device, at the midpoint of the inundation depth, and at 0.01 m from the bottom, respectively, to monitor the pressure. The dynamic water pressure is written as the sum of the first- and second-order dynamic water pressures, i.e., p w = p 1 + p 2 , as a theoretical value to verify the numerical results of the dynamic water pressure at three points (i.e., S1, S2, and S3) on the front wall of the gas chamber of the installation.
p 1 = ρ g H 2 cosh k ( z + d ) cosh k d cos ( k x ω t ) ,
p 2 = 3 π H 2 4 L ρ g sinh 2 k d [ cosh 2 k ( z + d ) sinh 2 k d 1 3 ] cos 2 ( k x ω t ) π H 2 4 λ ρ g sinh 2 k d cosh 2 k ( z + d ) ,
In Equations (4) and (5), k denotes the wave number and ω denotes the circular frequency; the monitoring points on the front wall of the air chamber are shown in Figure 5.
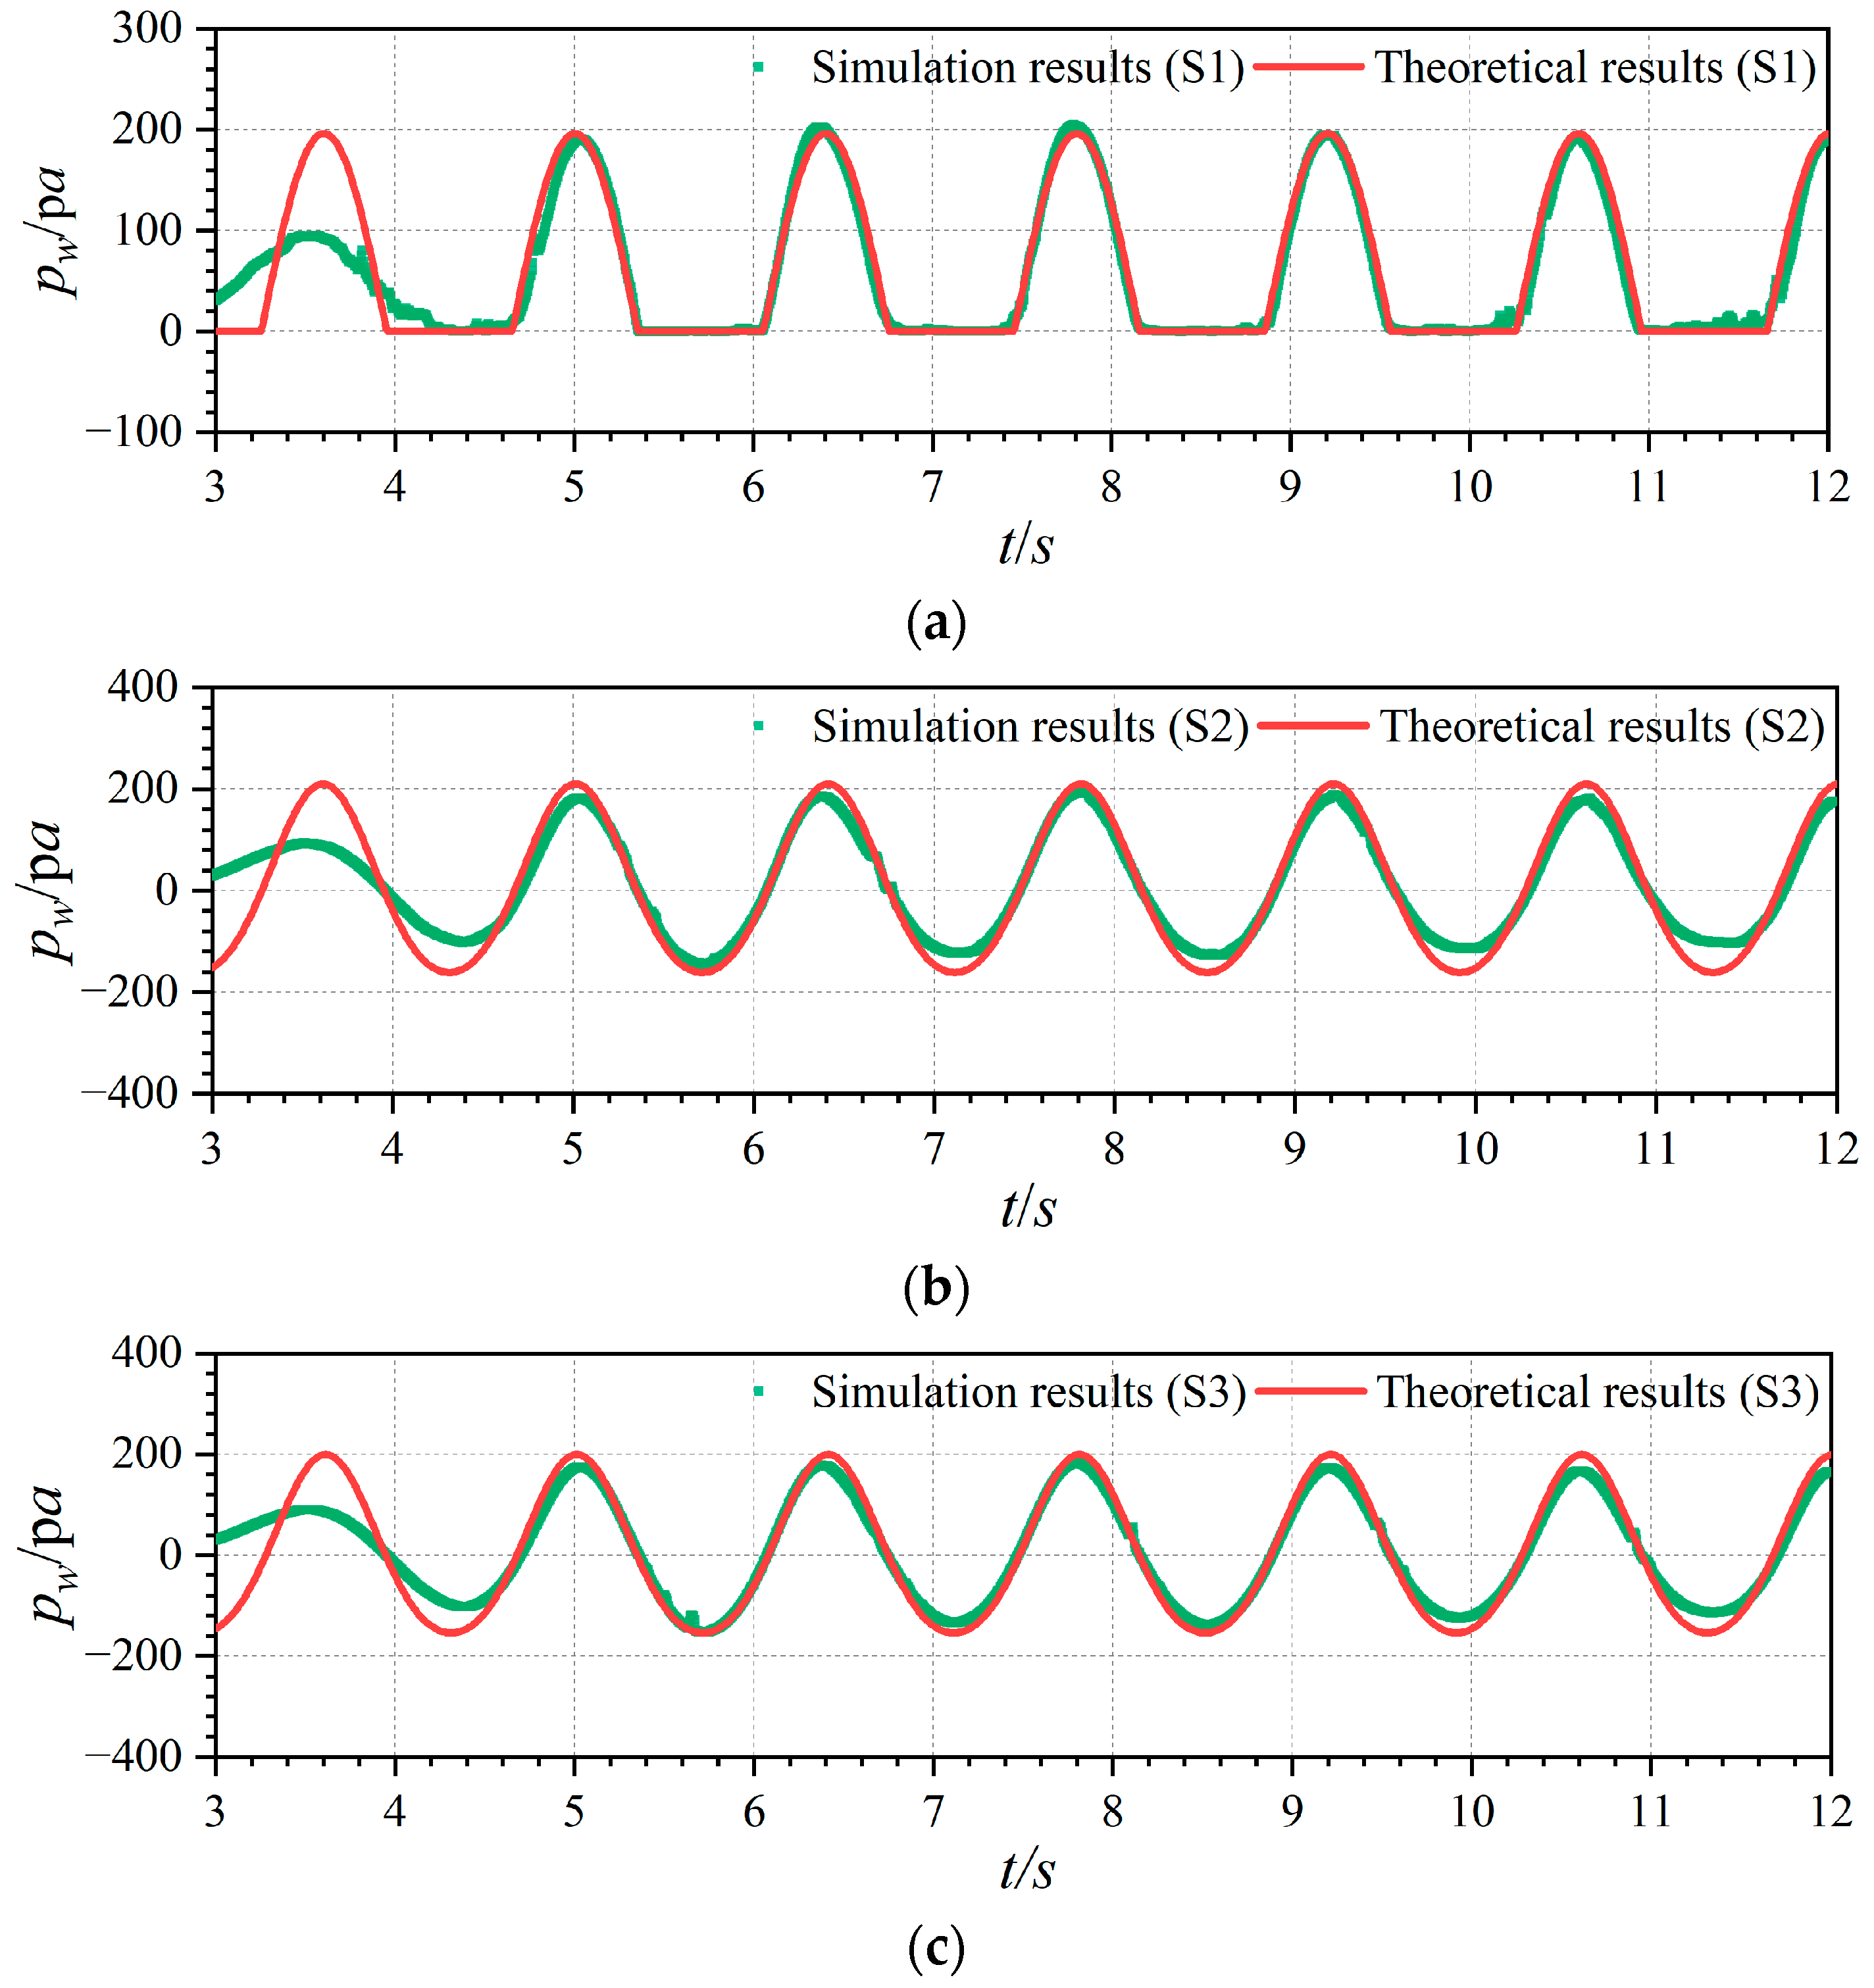
Figure 6 shows a comparison between the numerical modeling results and the theoretical results of the dynamic water pressure at three monitoring points on the outside of the front wall at T = 1.40 s, d = 0.30 m, and H = 0.04 m. As shown in Figure 6, the numerical modeling results of the dynamic water pressure at the three monitoring points agreed well with the theoretical results, thereby indicating that the OWC wave-energy device established in this study can accurately simulate the dynamic water pressure on the front wall of the installation.
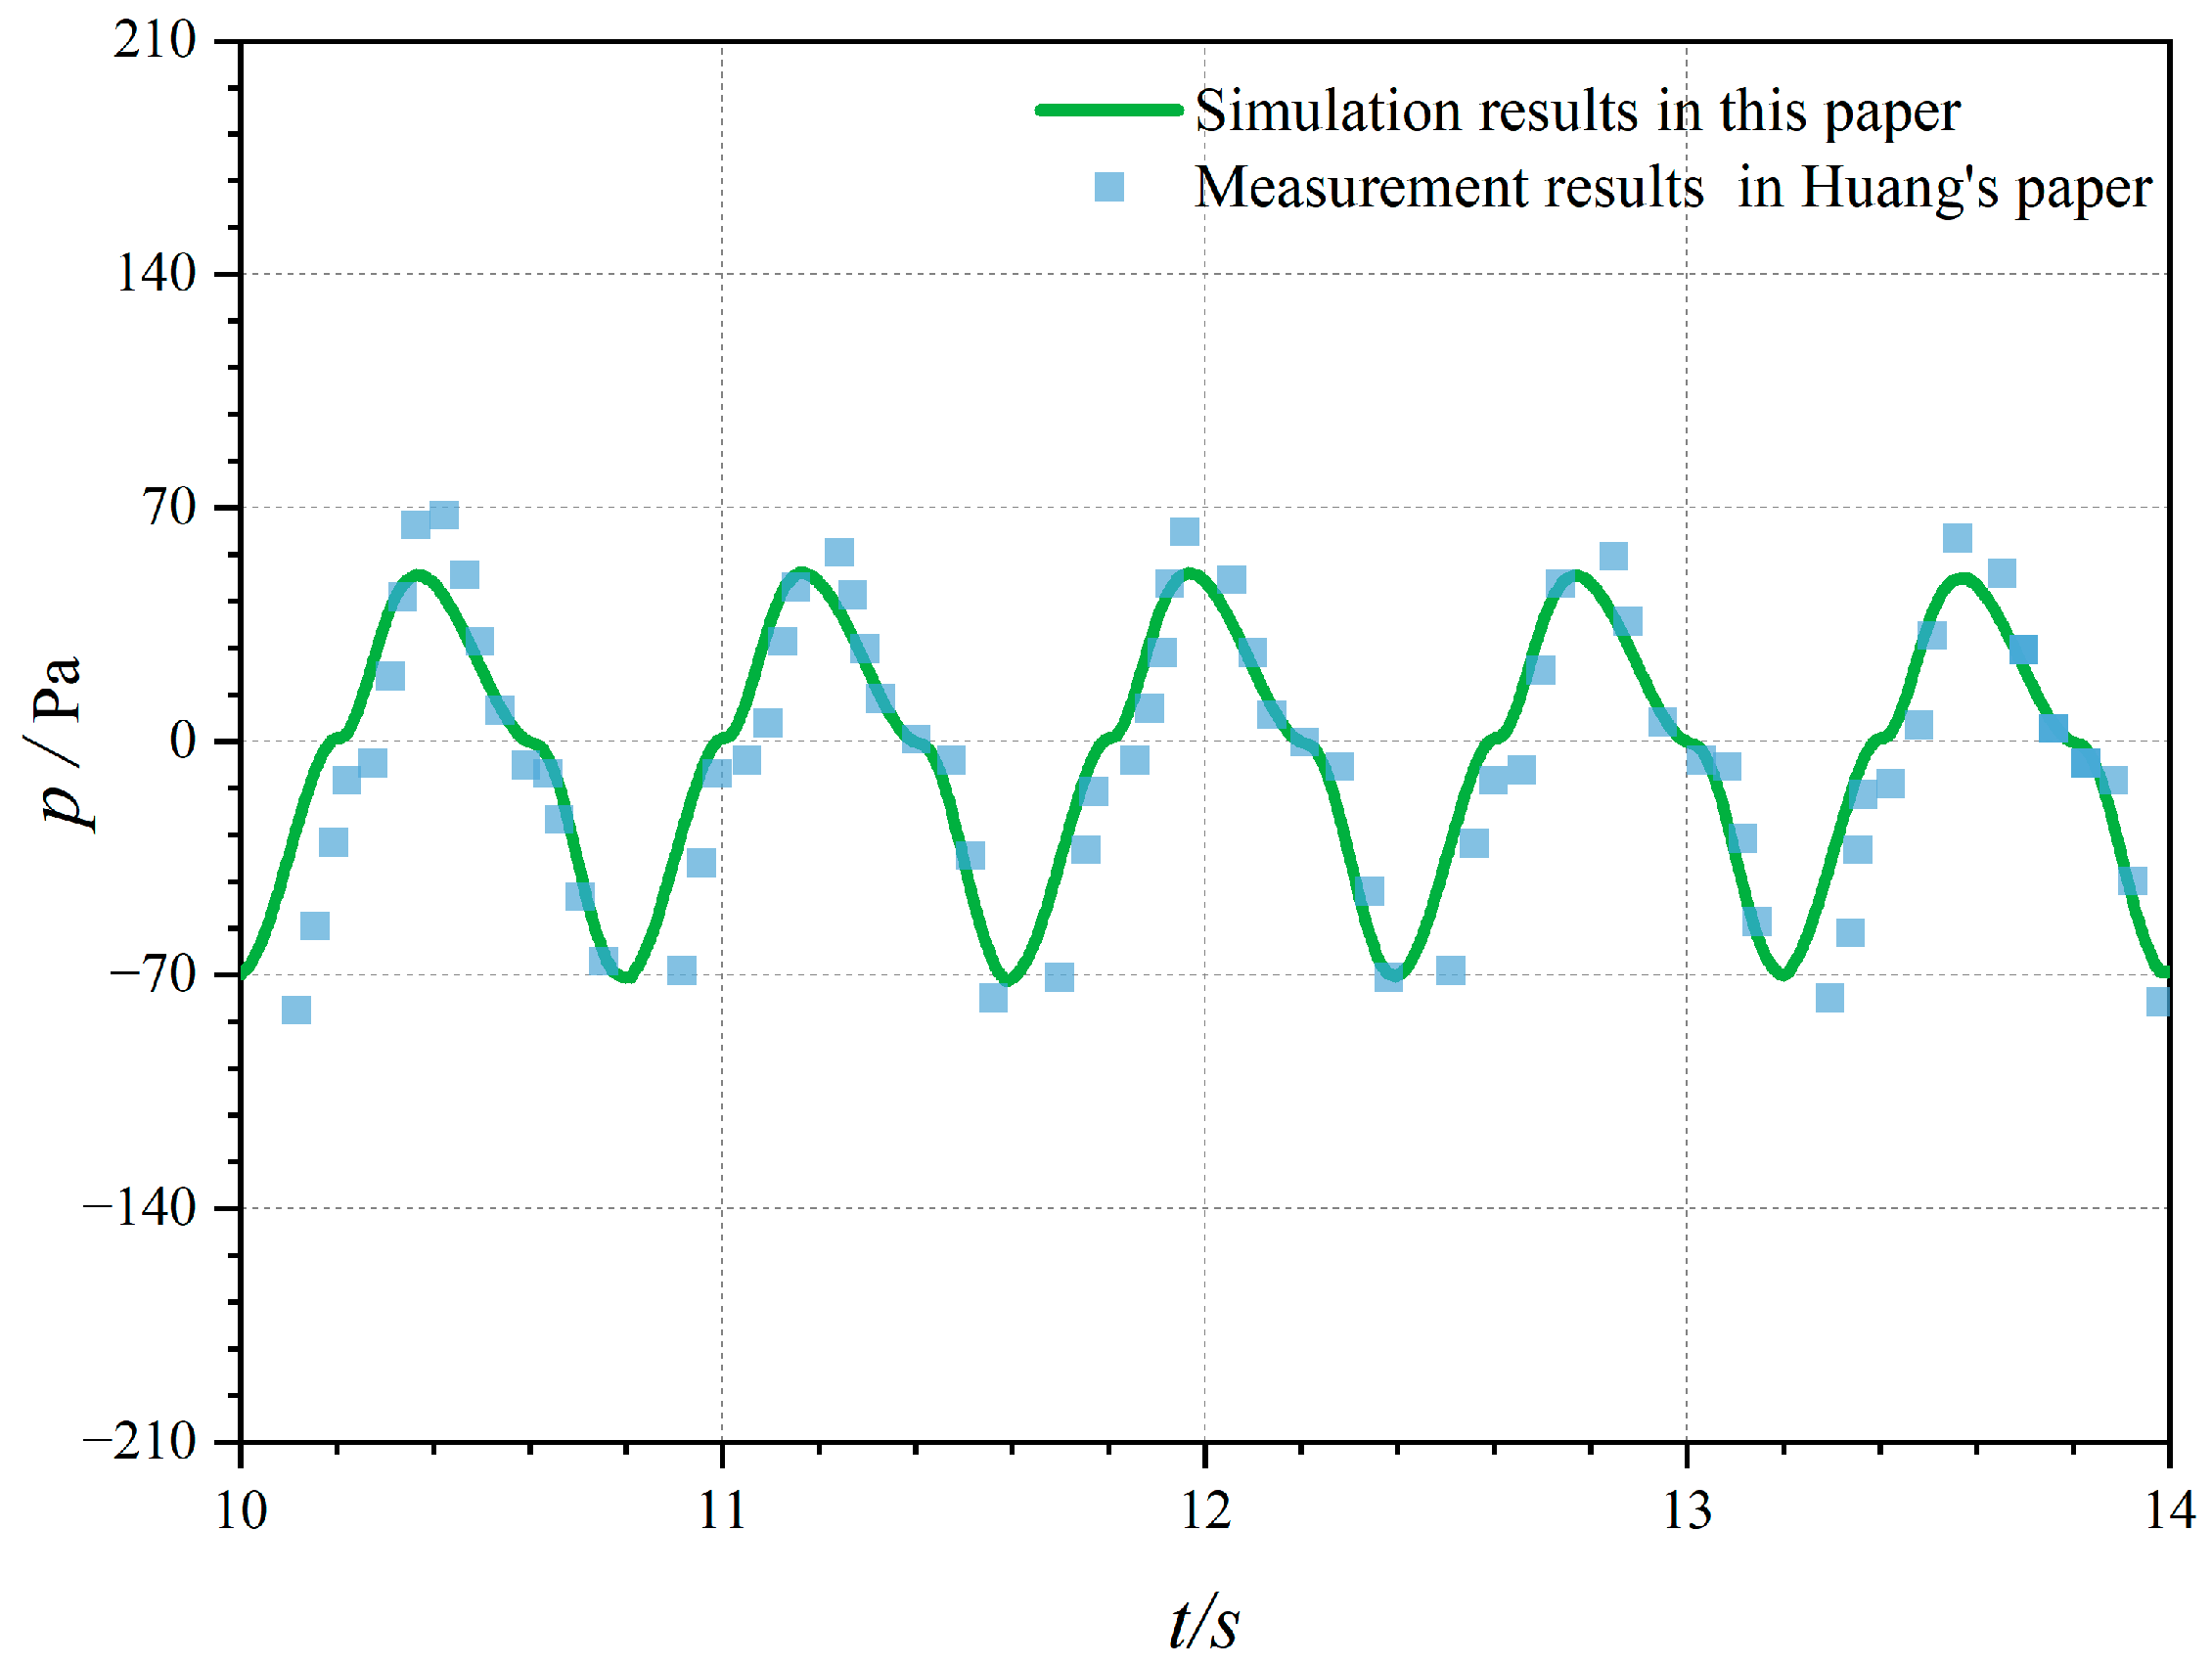
A comparison between the measured air pressure inside the chamber and the numerical model is provided in Figure 7, which shows the measured results [31] are consistent with the results of the numerical model, thus indicating that the numerical model established in this study can accurately simulate the relative pressure of air inside the air chamber.

4. Results

4.1. Effect of Wave Period on Forces in an OWC Device

At a water depth of 0.30 m, the wave height was set to 0.04 m, whereas the wave period was varied within the range of 0.80–1.40 s. This allowed for the determination of the relationship between the wave force and the wave period. To examine the wave force action law, the wave forces in the three directions were rendered dimensionless.
f x i = F x i ρ g A D d ,
Here, xi (i = 1, 2, and 3) denotes the x-, y-, and z-directions, respectively; f x i shows the dimensionless wave force in the three directions; and A is the wave amplitude.
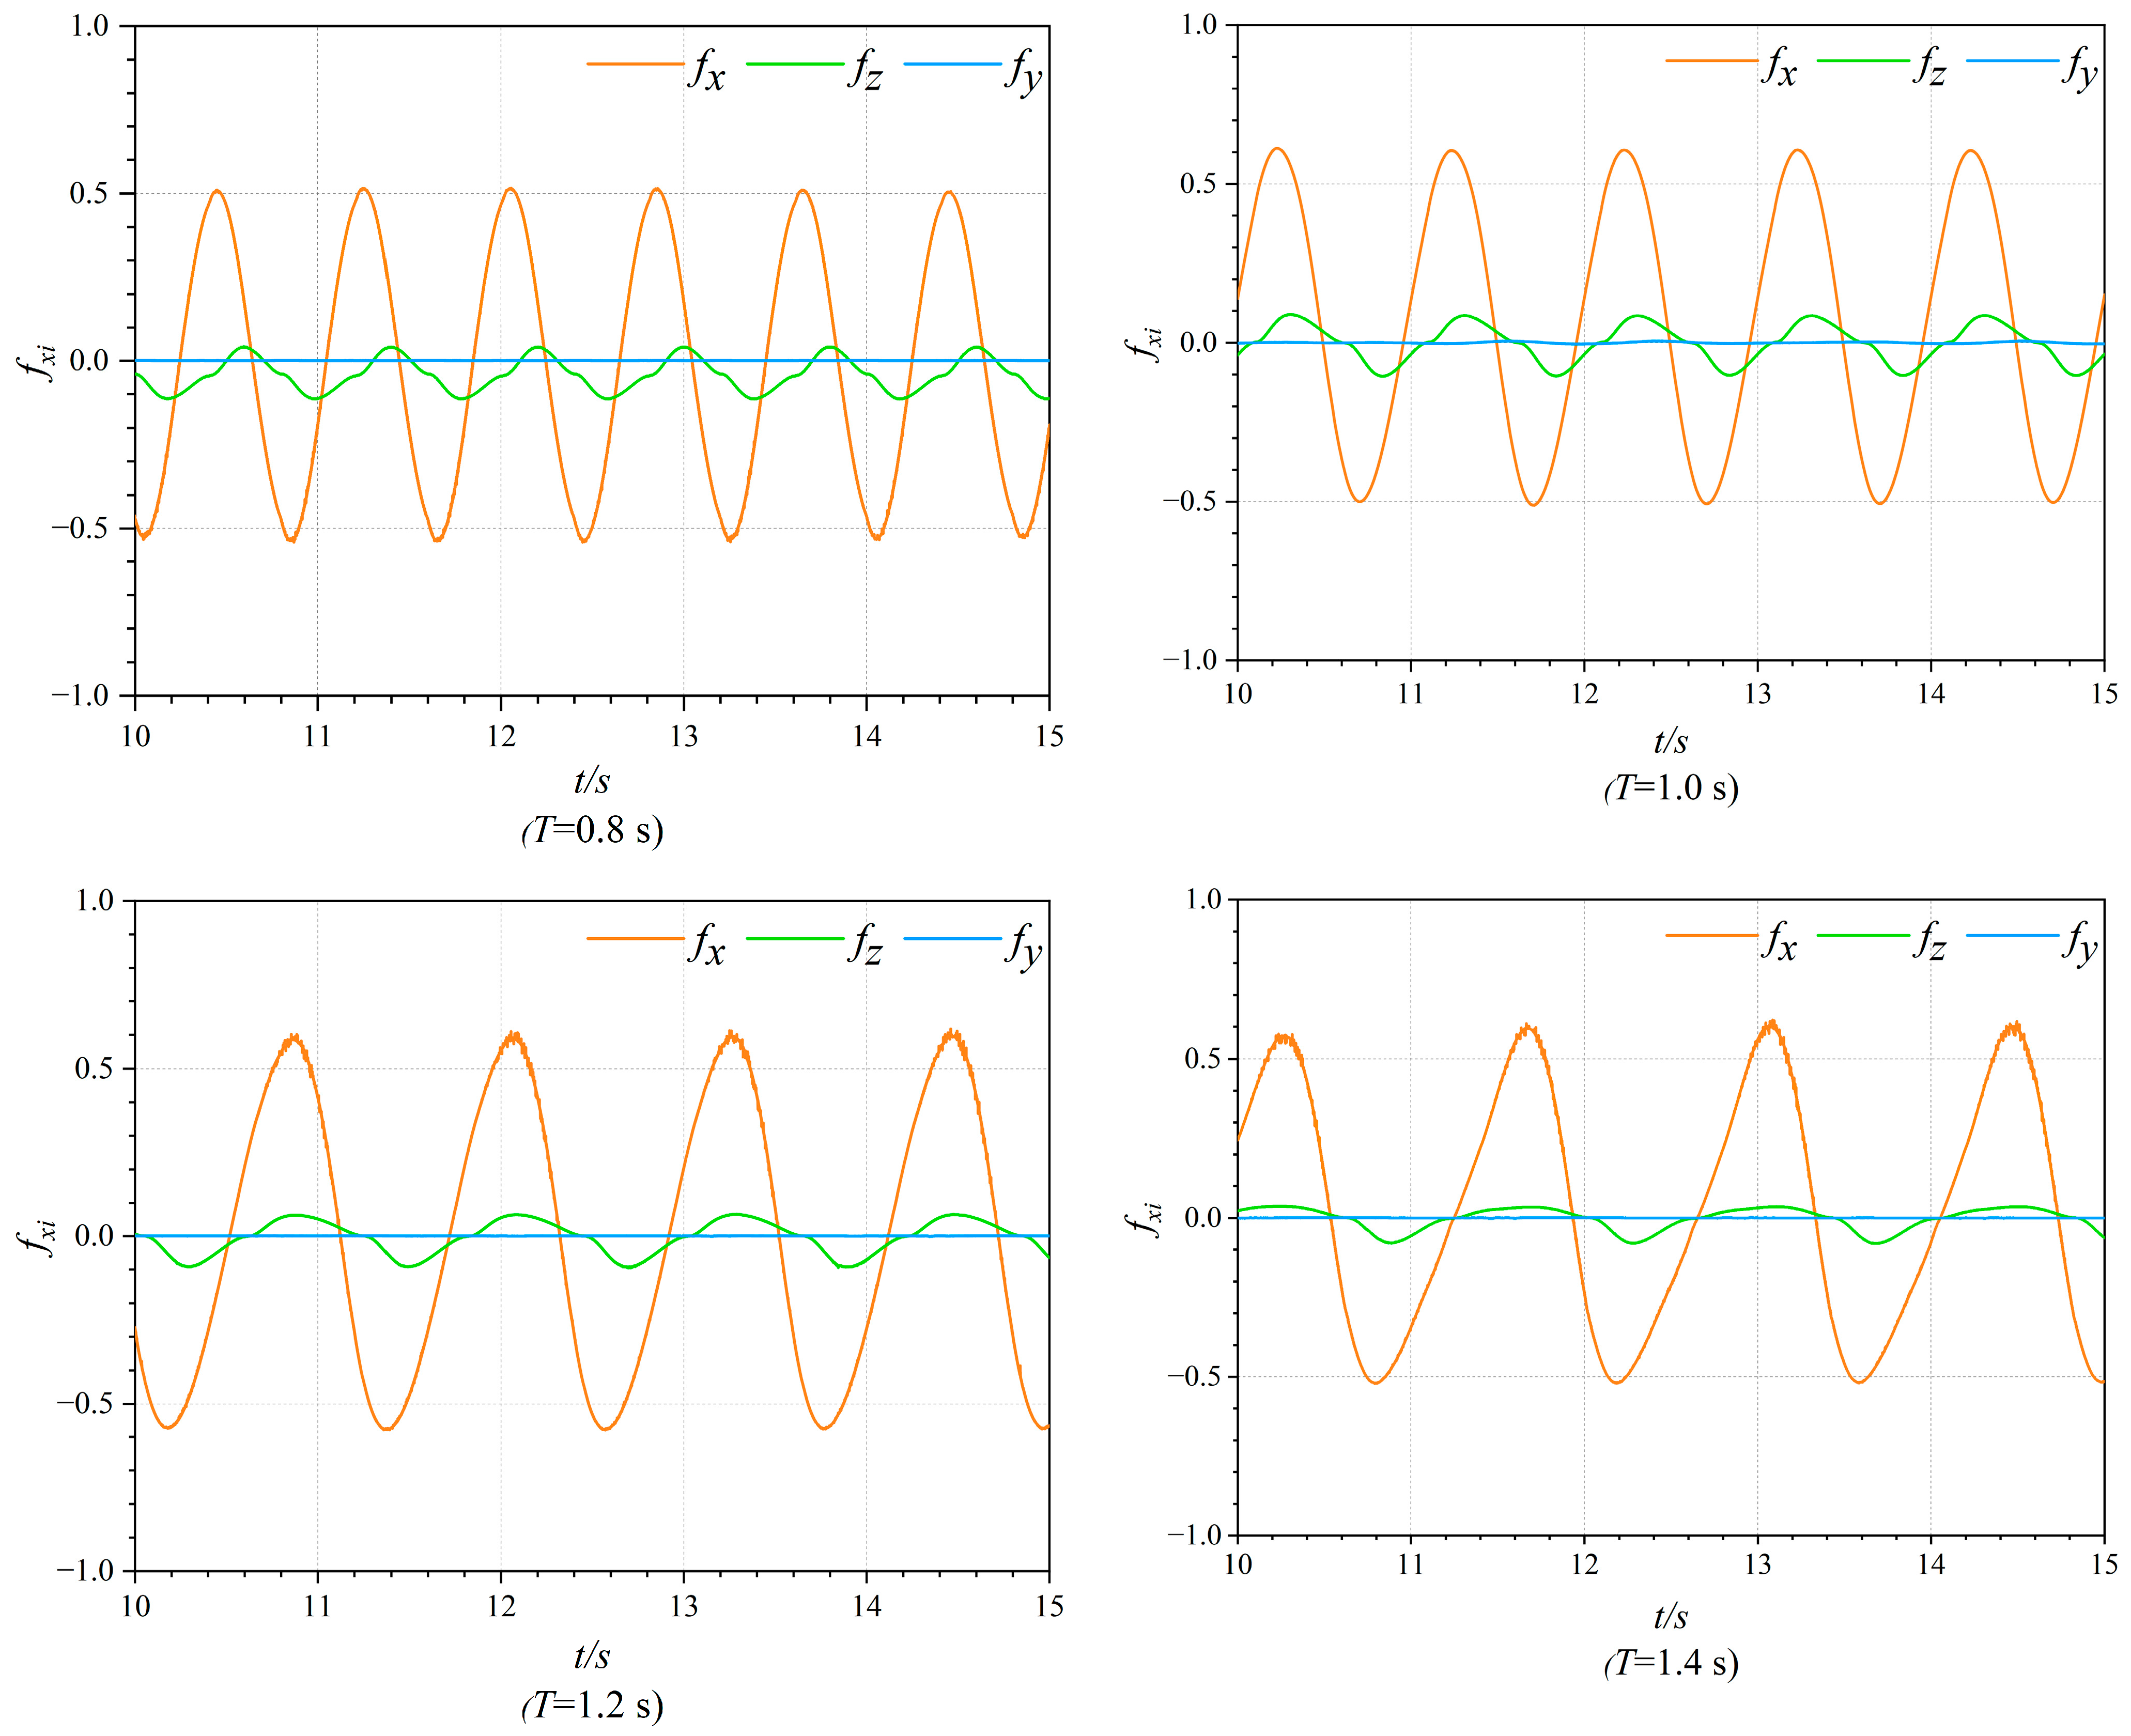
Figure 8 shows the variation in the wave force on the OWC device in three directions (horizontal, vertical, and transverse) with time for different incident wave periods. The dimensionless wave force varied periodically in all three directions, with the same period as the incident wave. The horizontal dimensionless wave force fx reflected a regular sine curve, whereas the vertical dimensionless wave force fz presented clear peaks and troughs but did not present the typical sine curve. The magnitude of fx was approximately 6.6 to 7.9 times that of fz, and the horizontal dimensionless wave force fy was approximately zero.
According to Huang et al. [31], the magnitude of fy is directly related to the vorticity generated by the OWC pile, whereas vortex shedding on the device pile is related to the Keulegan–Carpenter number. Based on the model parameters of the installation, the vortex was not dislodged from the outer surface of the pile and main support structure, whereas vortex dislodgement occurred at the lower end of the pile skirt of the installation. Furthermore, because the waves were incident in the forward direction, the device was also placed on the centerline of the flume and symmetrical about the y = 0 cross-section, which explains the low fy relative to fx and fz. Because fy was extreme and thus minimally affected the device, it shall not be discussed herein.
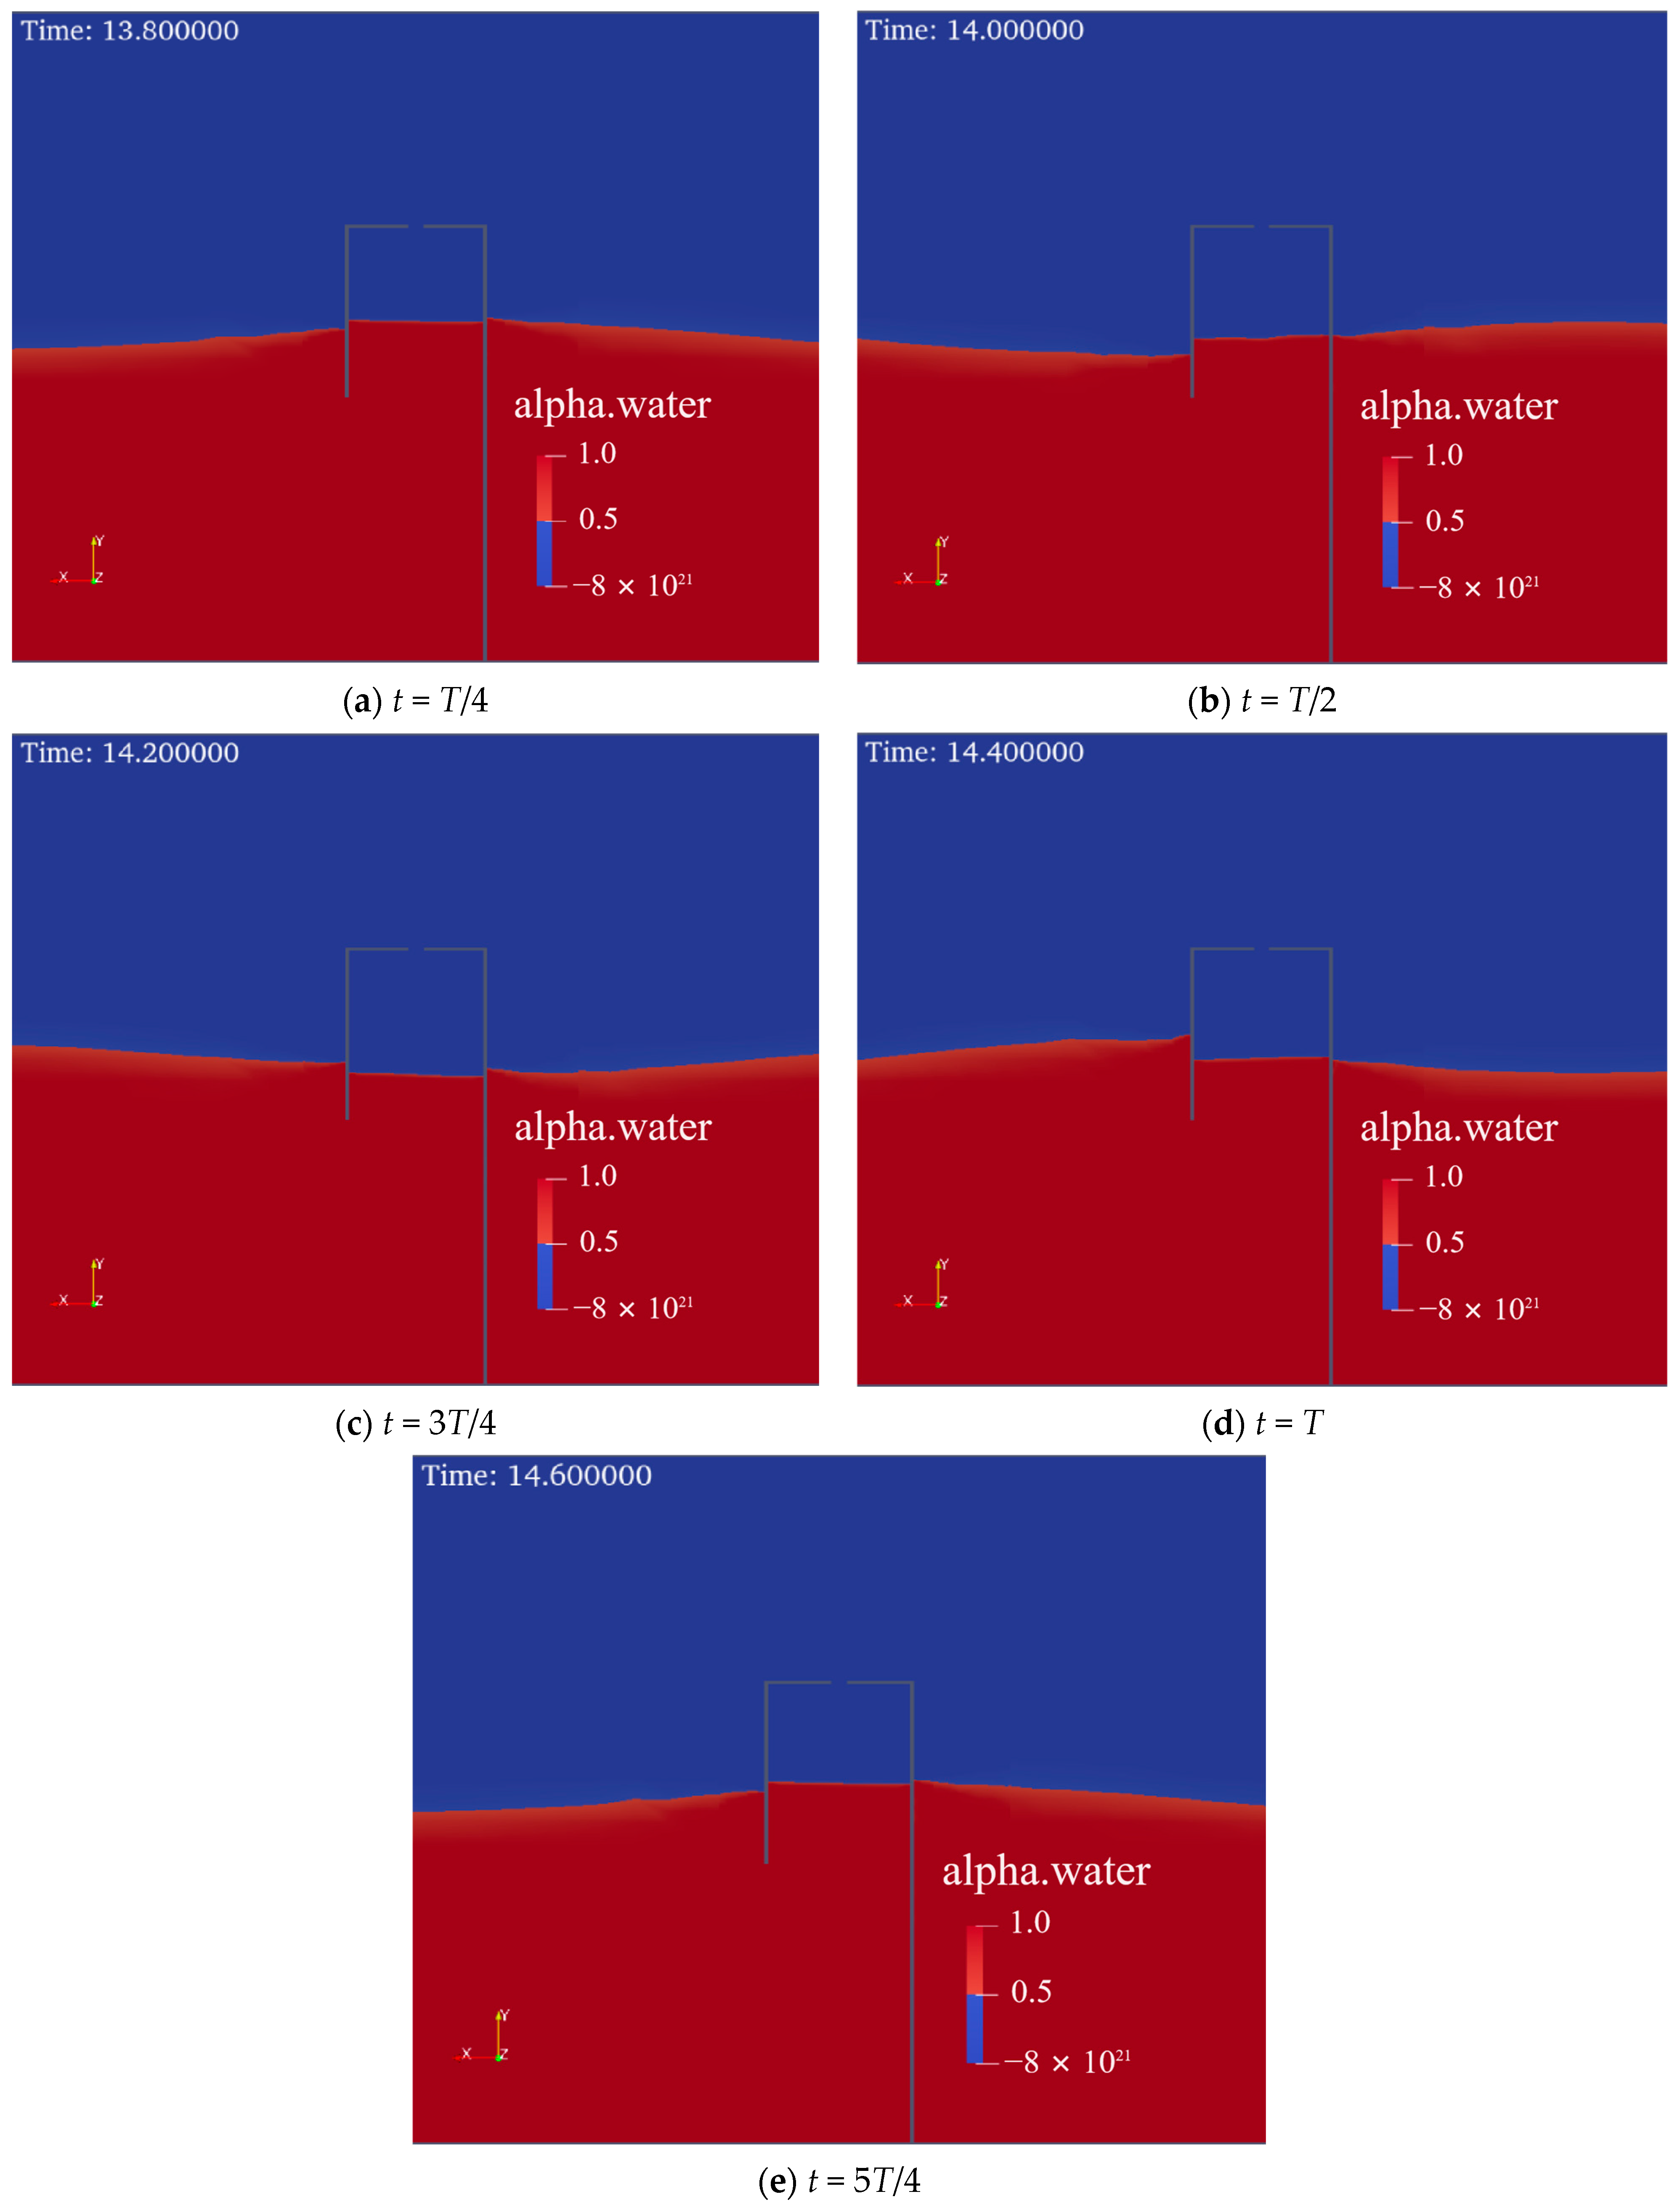
For a more intuitive observation of the water level corresponding to the force case of the device at different moments, the variation in the liquid level near the OWC device on the y = 0 cross-section during one cycle (T = 0.80 s) is presented in Figure 9. As shown, the liquid levels on the outside of the OWC device and inside the chamber varied periodically within one cycle, which corresponded to the force case shown in Figure 8; fx reached its maximum value when the water level on the outside of the front wall of the device reached its maximum, whereas the amplitude of fz lagged slightly.
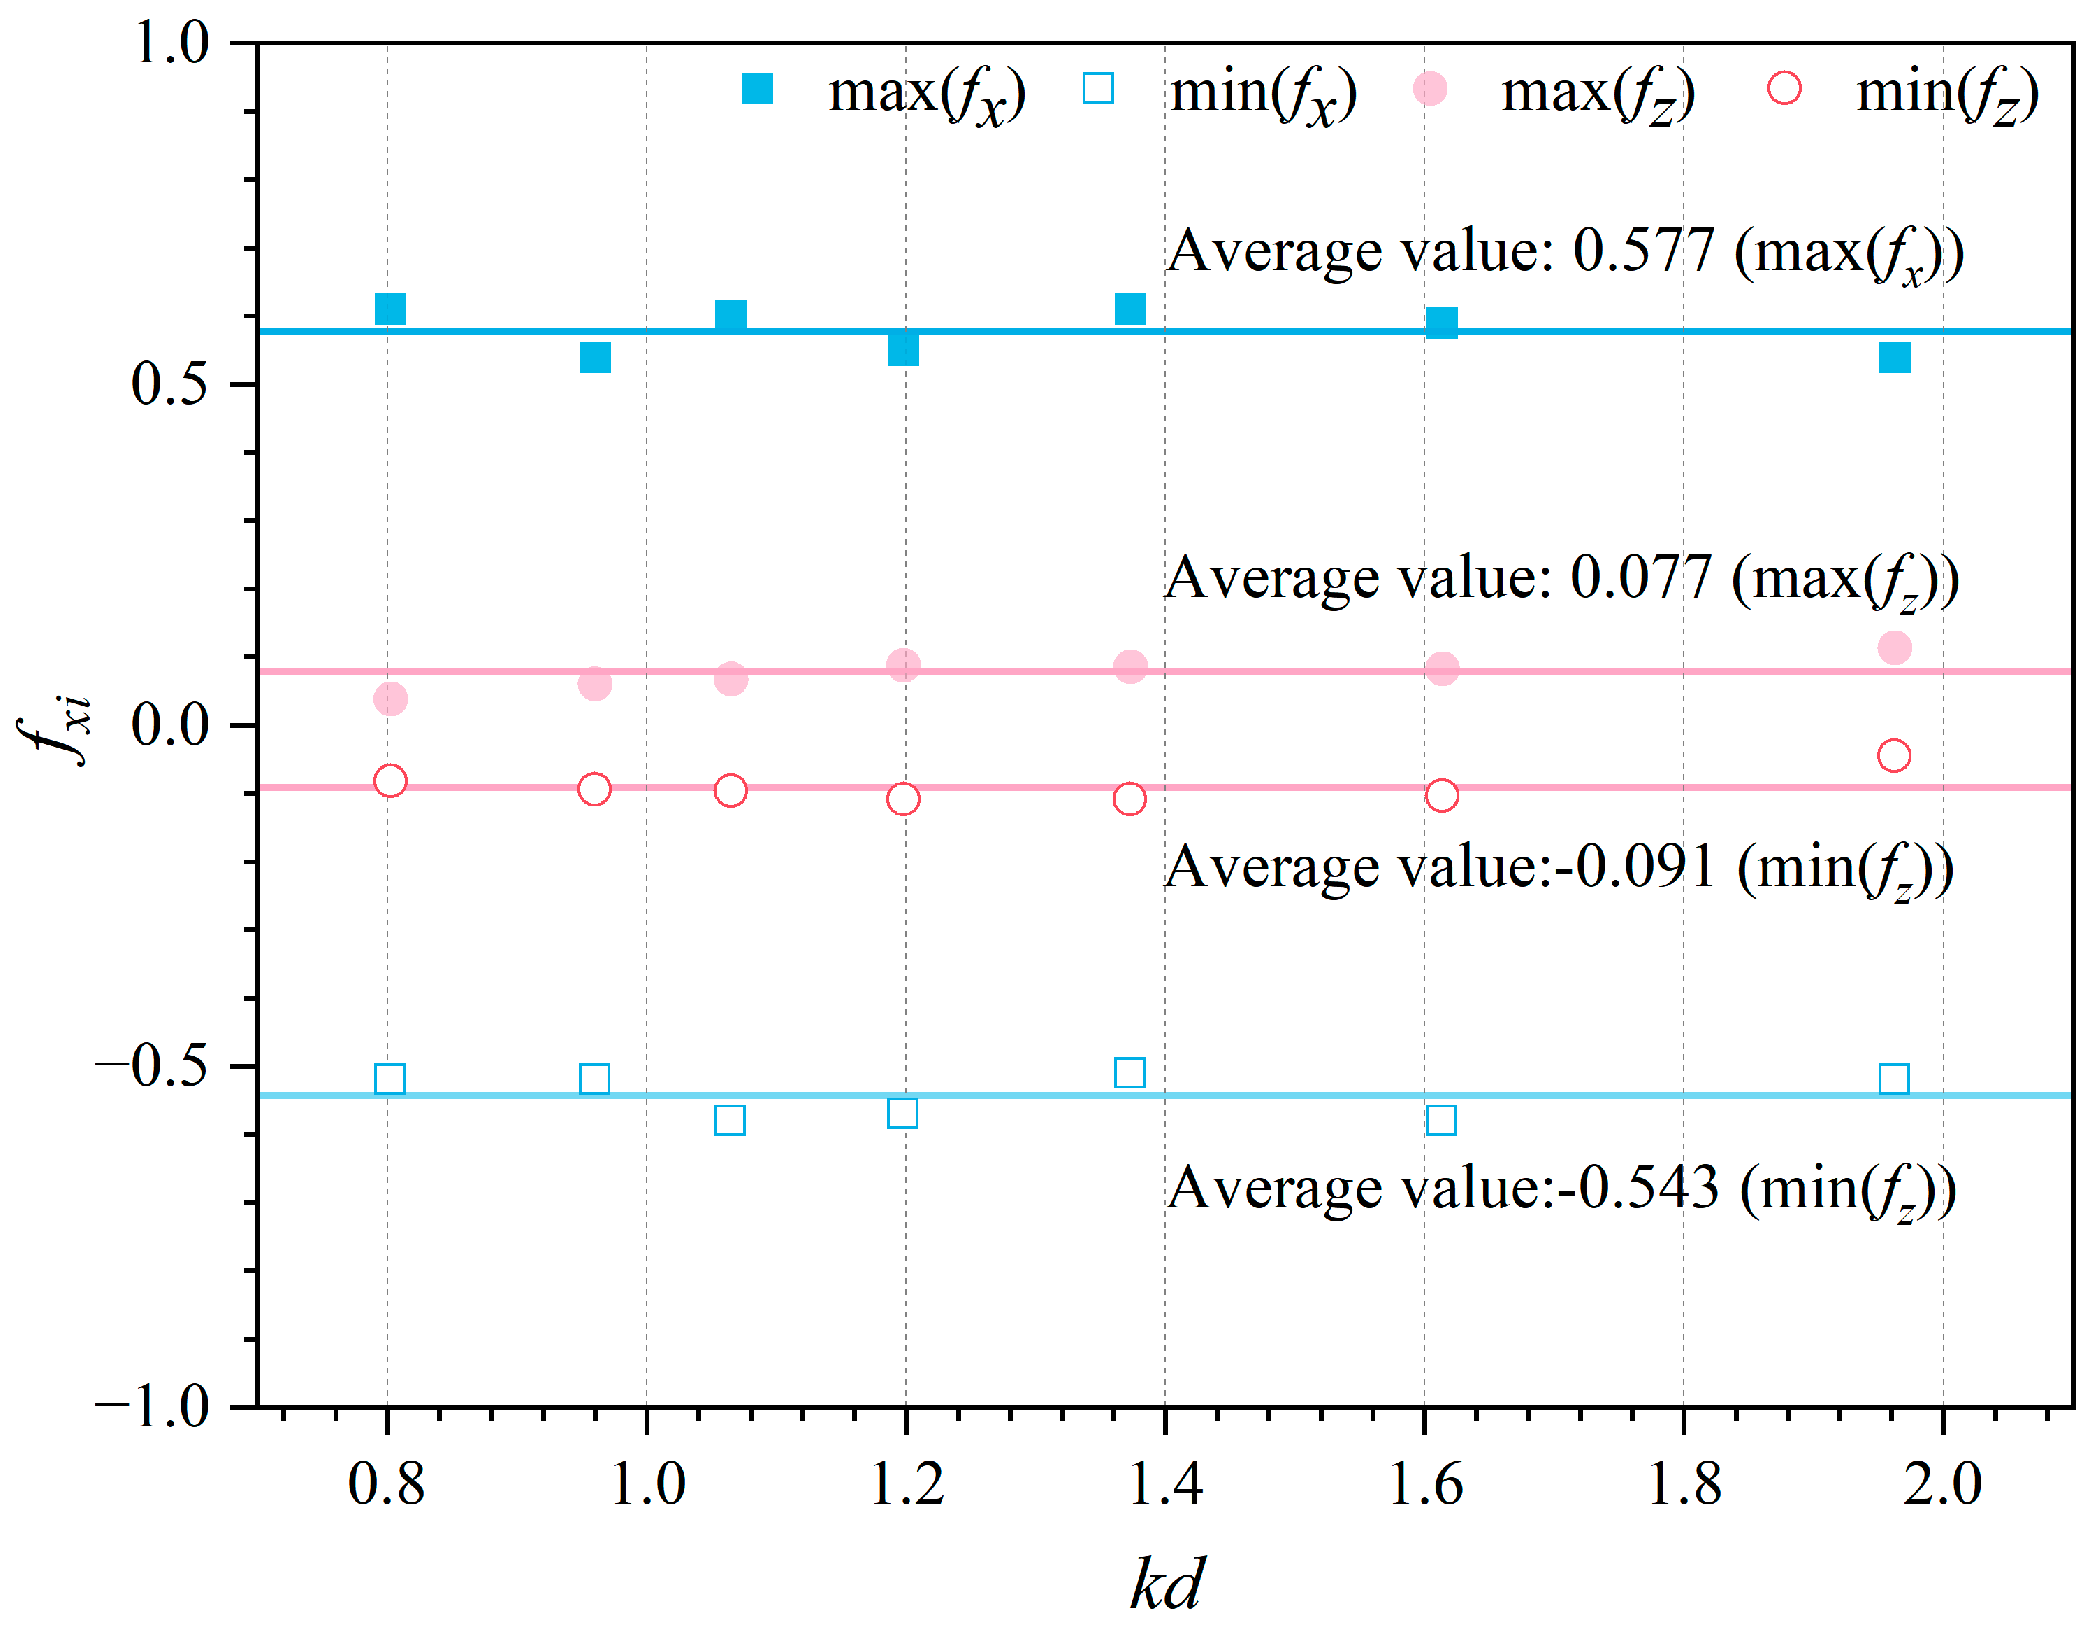
Figure 10 shows the maximum dimensionless wave force max (fxi), the minimum dimensionless wave force min (fx), and the corresponding mean value for wave frequencies kd of 0.80 to 1.96 (T = 0.80 to 1.40 s) after the wave propagation stabilized. As shown in Figure 10, the effect of period on the horizontal and vertical dimensionless wave forces to which the device was subjected was insignificant. At kd = 0.80–1.96, both the maximum and minimum wave forces did not vary significantly; thus, the mean values of the dimensionless wave forces at different periods can be a good estimate of the device wave force under a constant wave height and water depth.

4.2. Effect of Water Depth on Forces in an OWC Device

At a wave period of 1.40 s and a fixed wave height of 0.04 m, the water depth varied within the range of 0.26–0.32 m. This allowed for the determination of the relationship between the wave force and water depth.
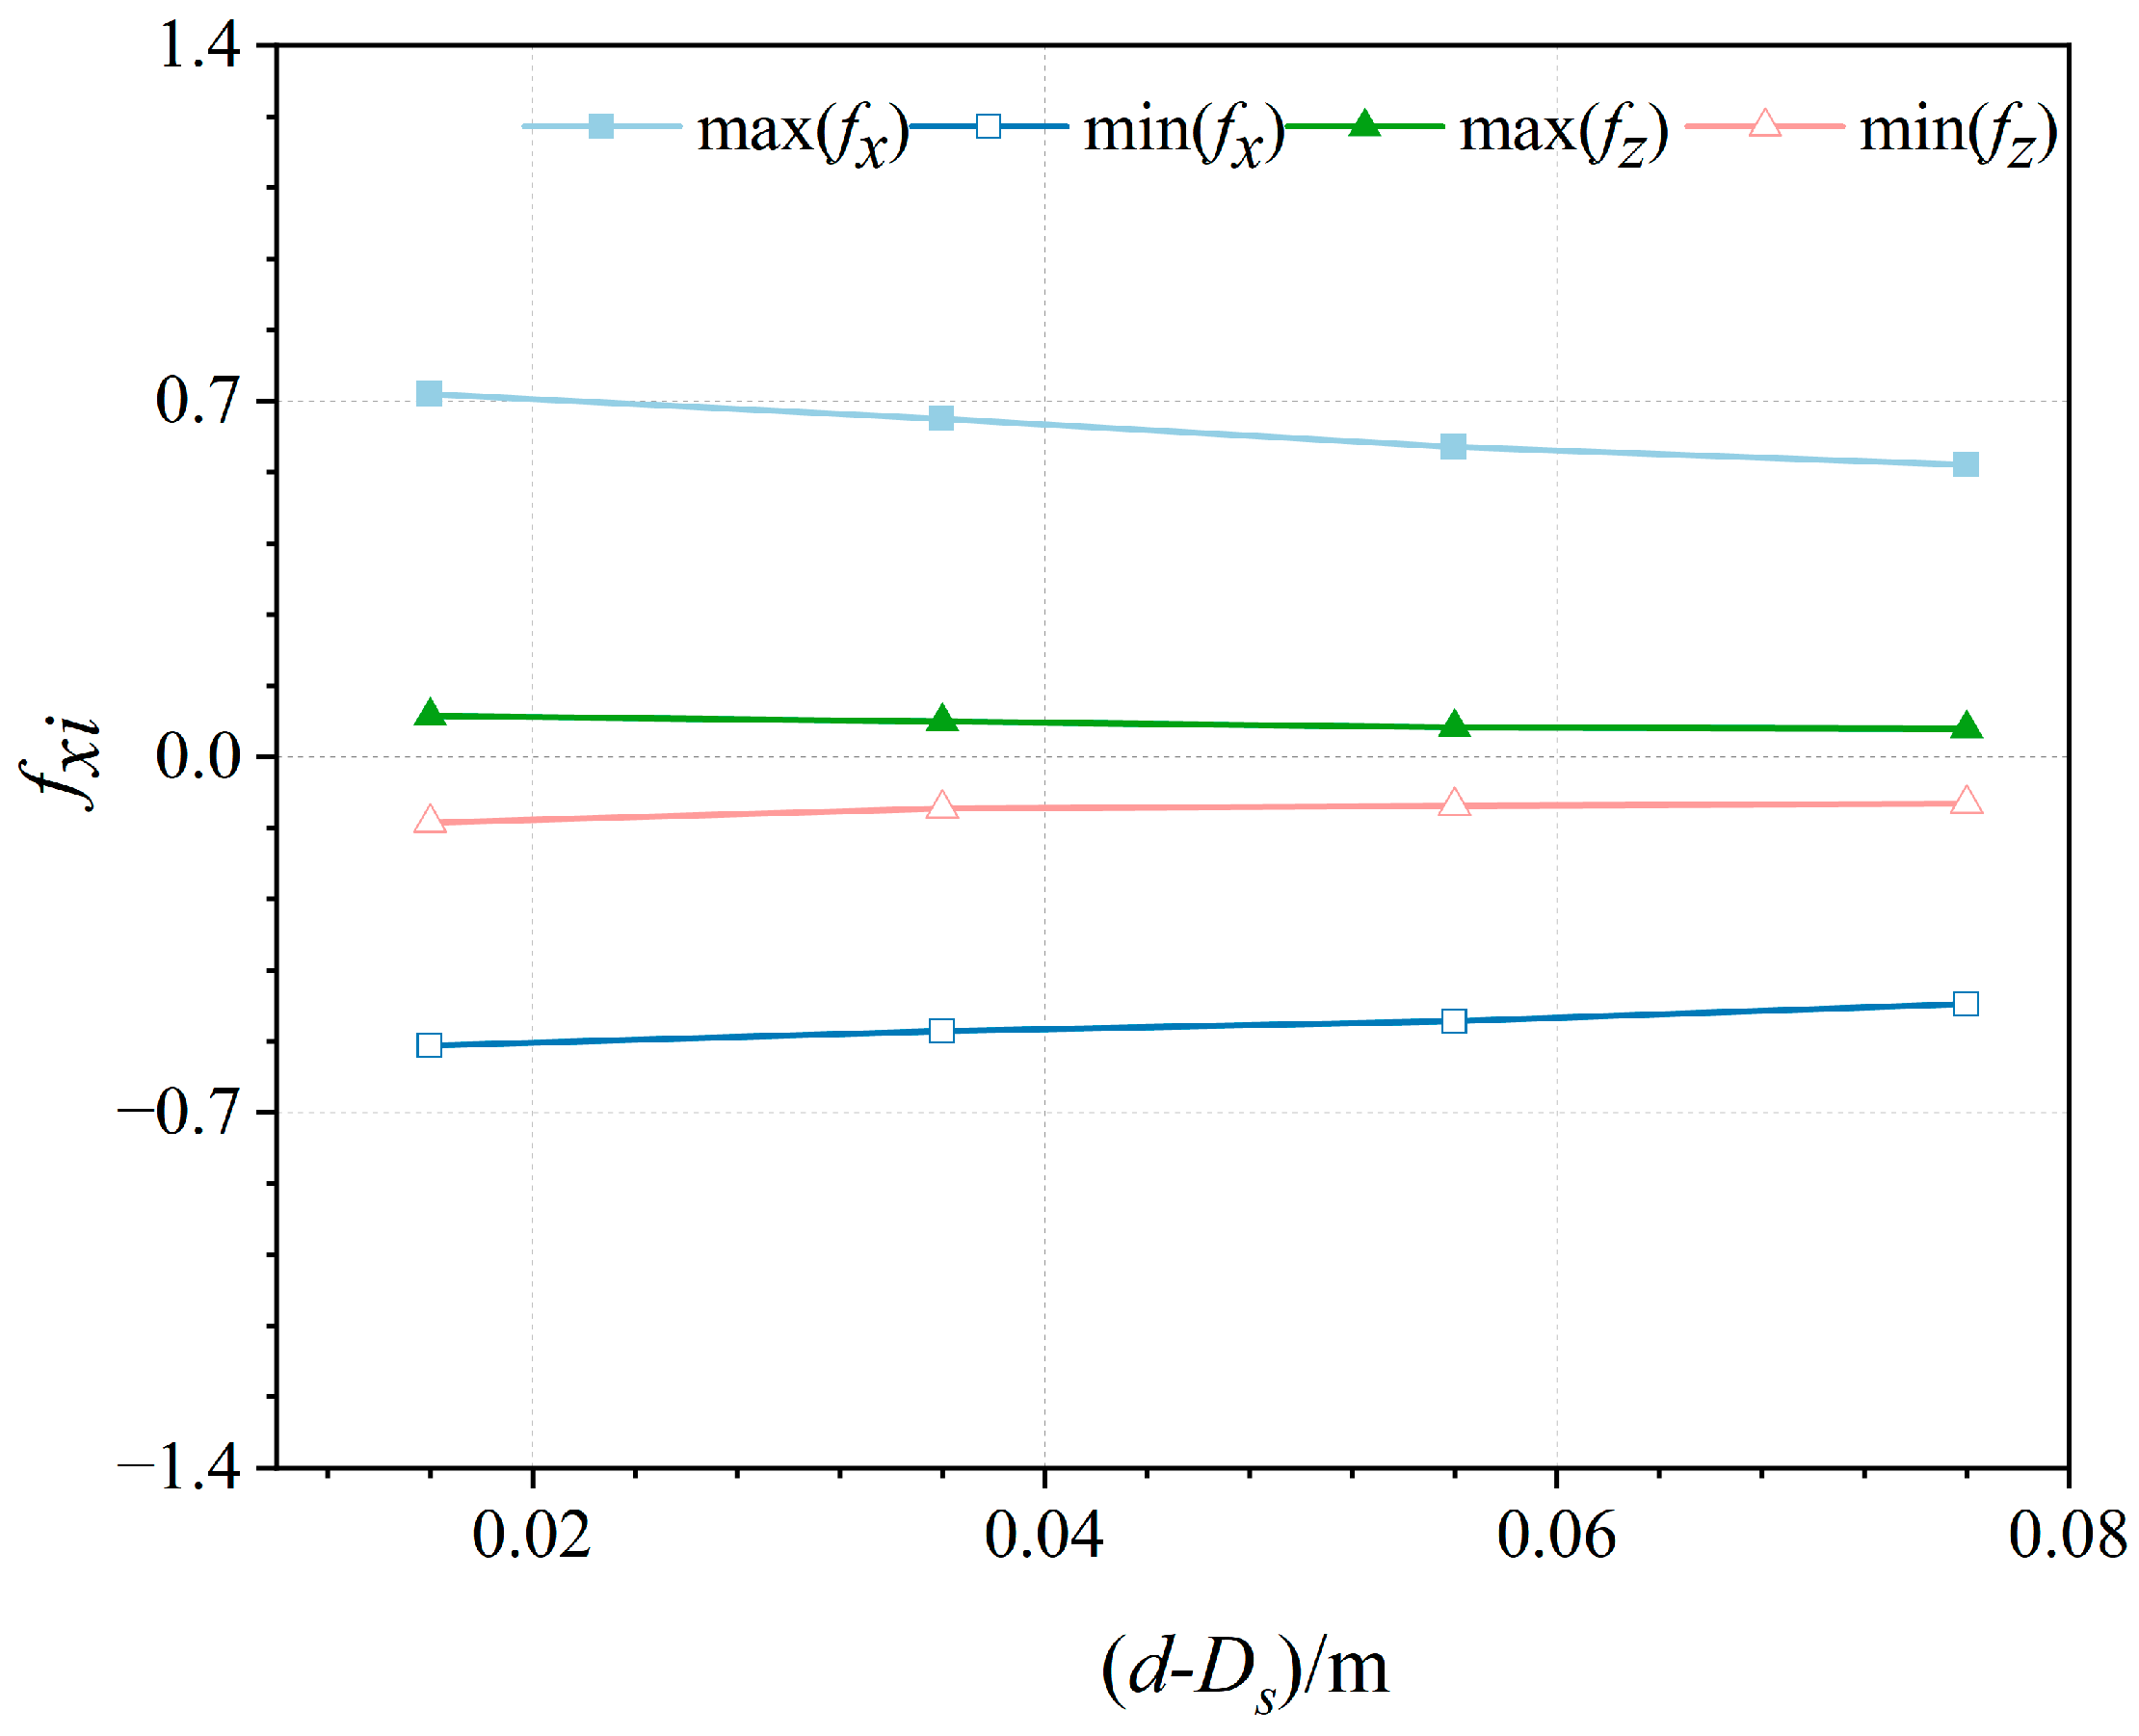
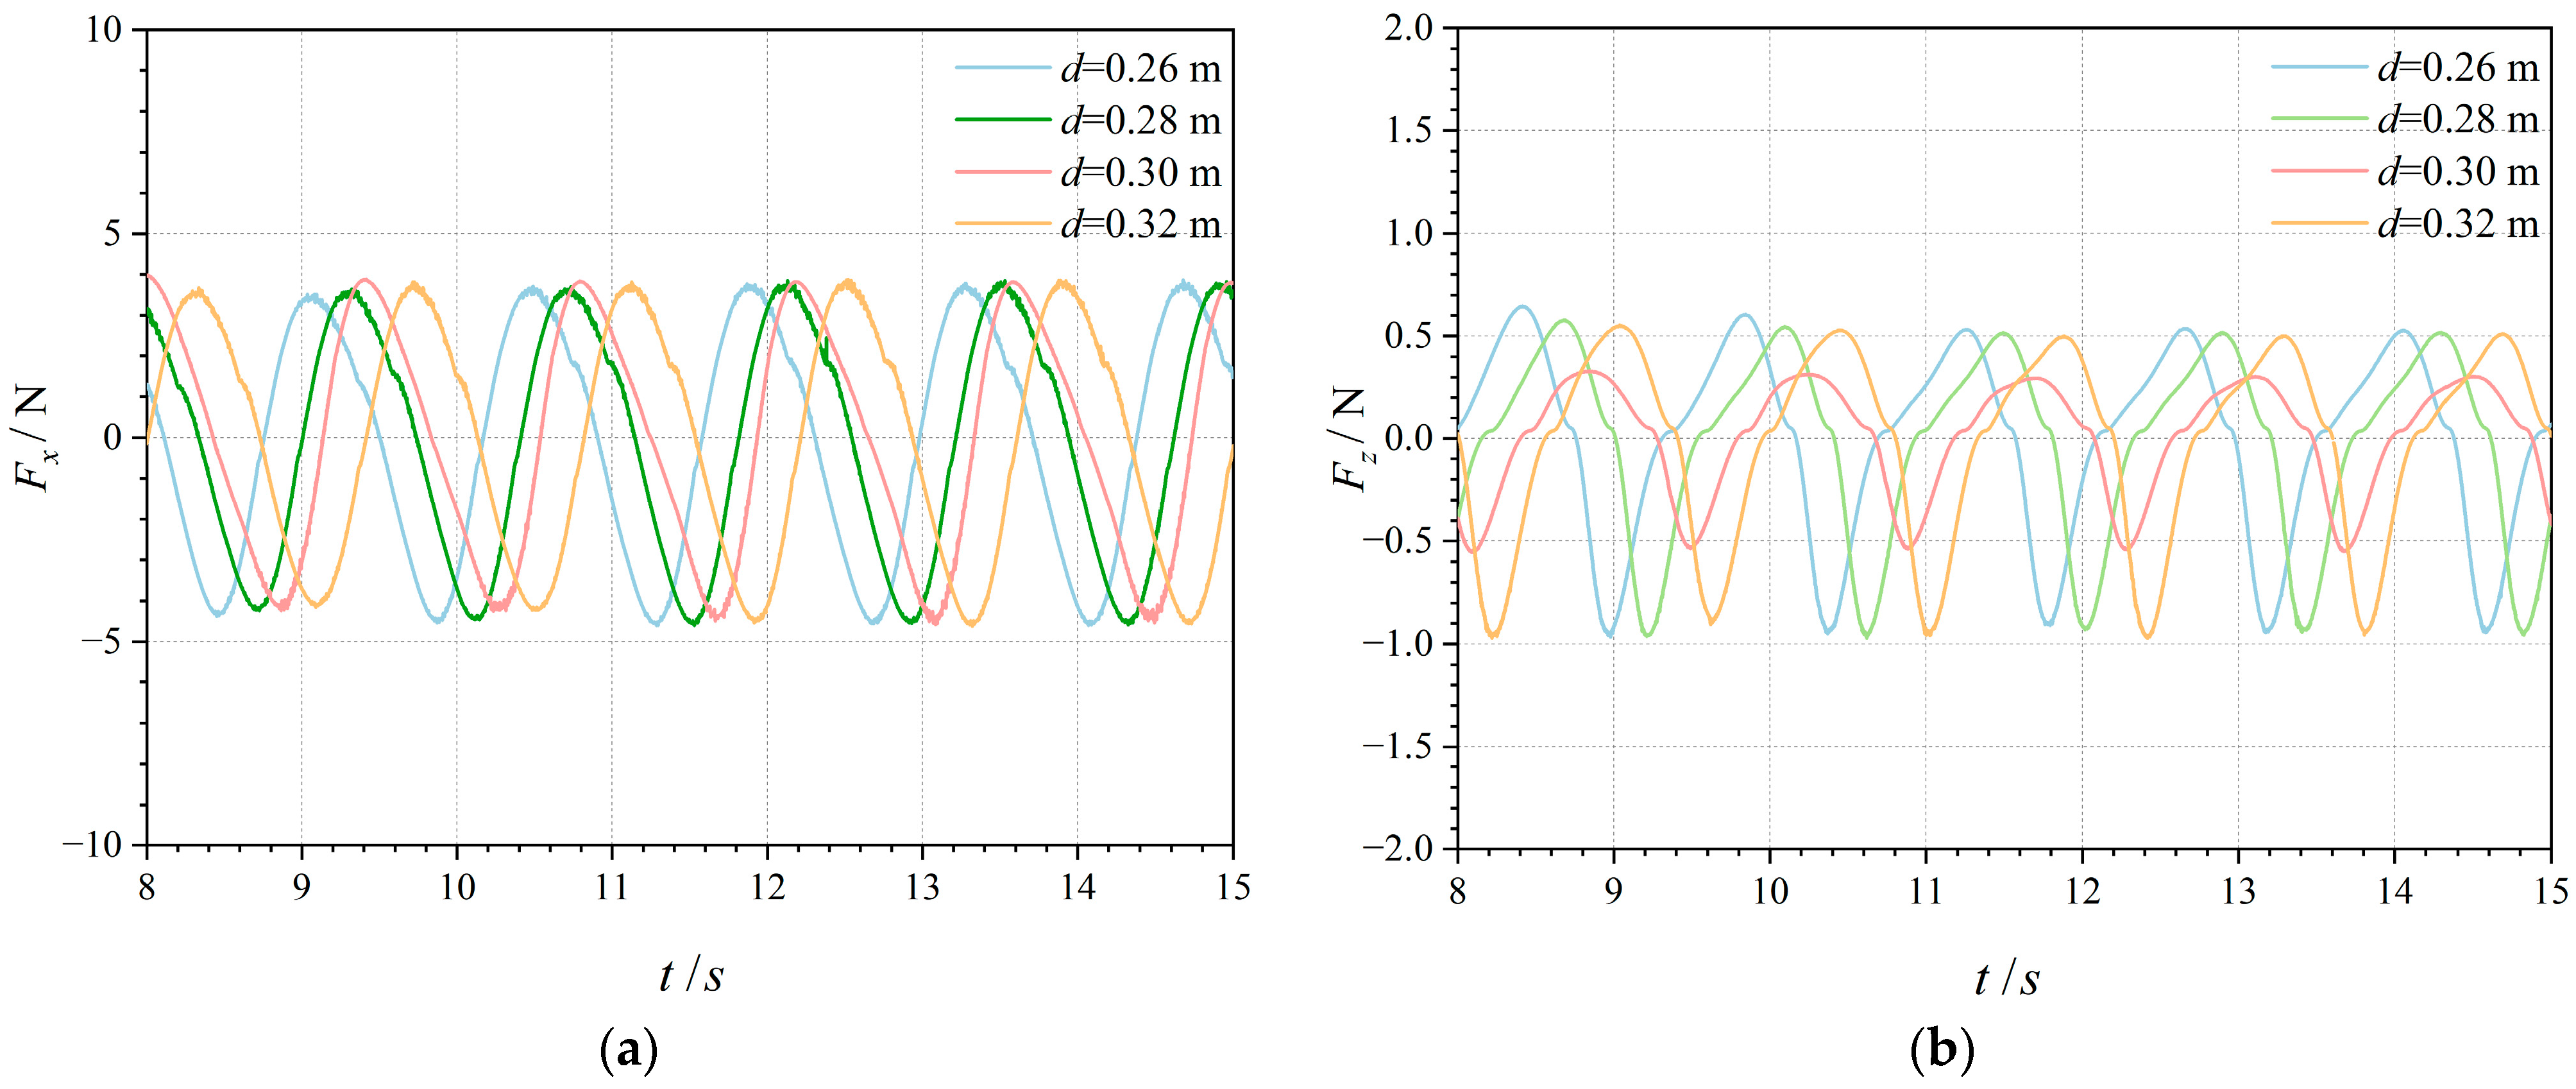
The maximum and minimum dimensionless wave loads after wave stabilization under different operating conditions are shown in Figure 11 as a function of the relative water depth dDs. As shown in Figure 11, the dimensionless wave force Fxi (i = 1 and 3) decreased as the relative water depth increased. However, the magnitudes of the horizontal and vertical wave forces exerted on the entire device were almost constant, as shown in Figure 12a,b. The submerged section of the OWC device comprised a hollowed-out half-cylinder section and a hollowed-out cylinder section. Because the OWC device requires the water surface to be above the skirt for power generation, the area of the circular cylindrical section submerged in the water increased with the water depth. The velocity of the water quality points decreased with increasing distance from the water surface, and the movement of the water quality points contributed primarily to the wave pressure. For a specified period and wave height, the velocity of the water-quality points at the free water surface was the highest, and it increased with the water depth at the horizontal surface. By focusing only on the wave force due to the water-point velocity on the outer surface, the size of the wave loads should increase with the water depth. Therefore, the wave force on the OWC device should not only be related to the water-point velocity outside the device but also to the force on the submerged section of the structure.

4.3. Effect of Wave Height on Forces in an OWC Device

The variation in pressure with the wave height was obtained by fixing the wave period to 1.40 s and varying the wave height from 0.01 to 0.05 m at a water depth of 0.30 m.
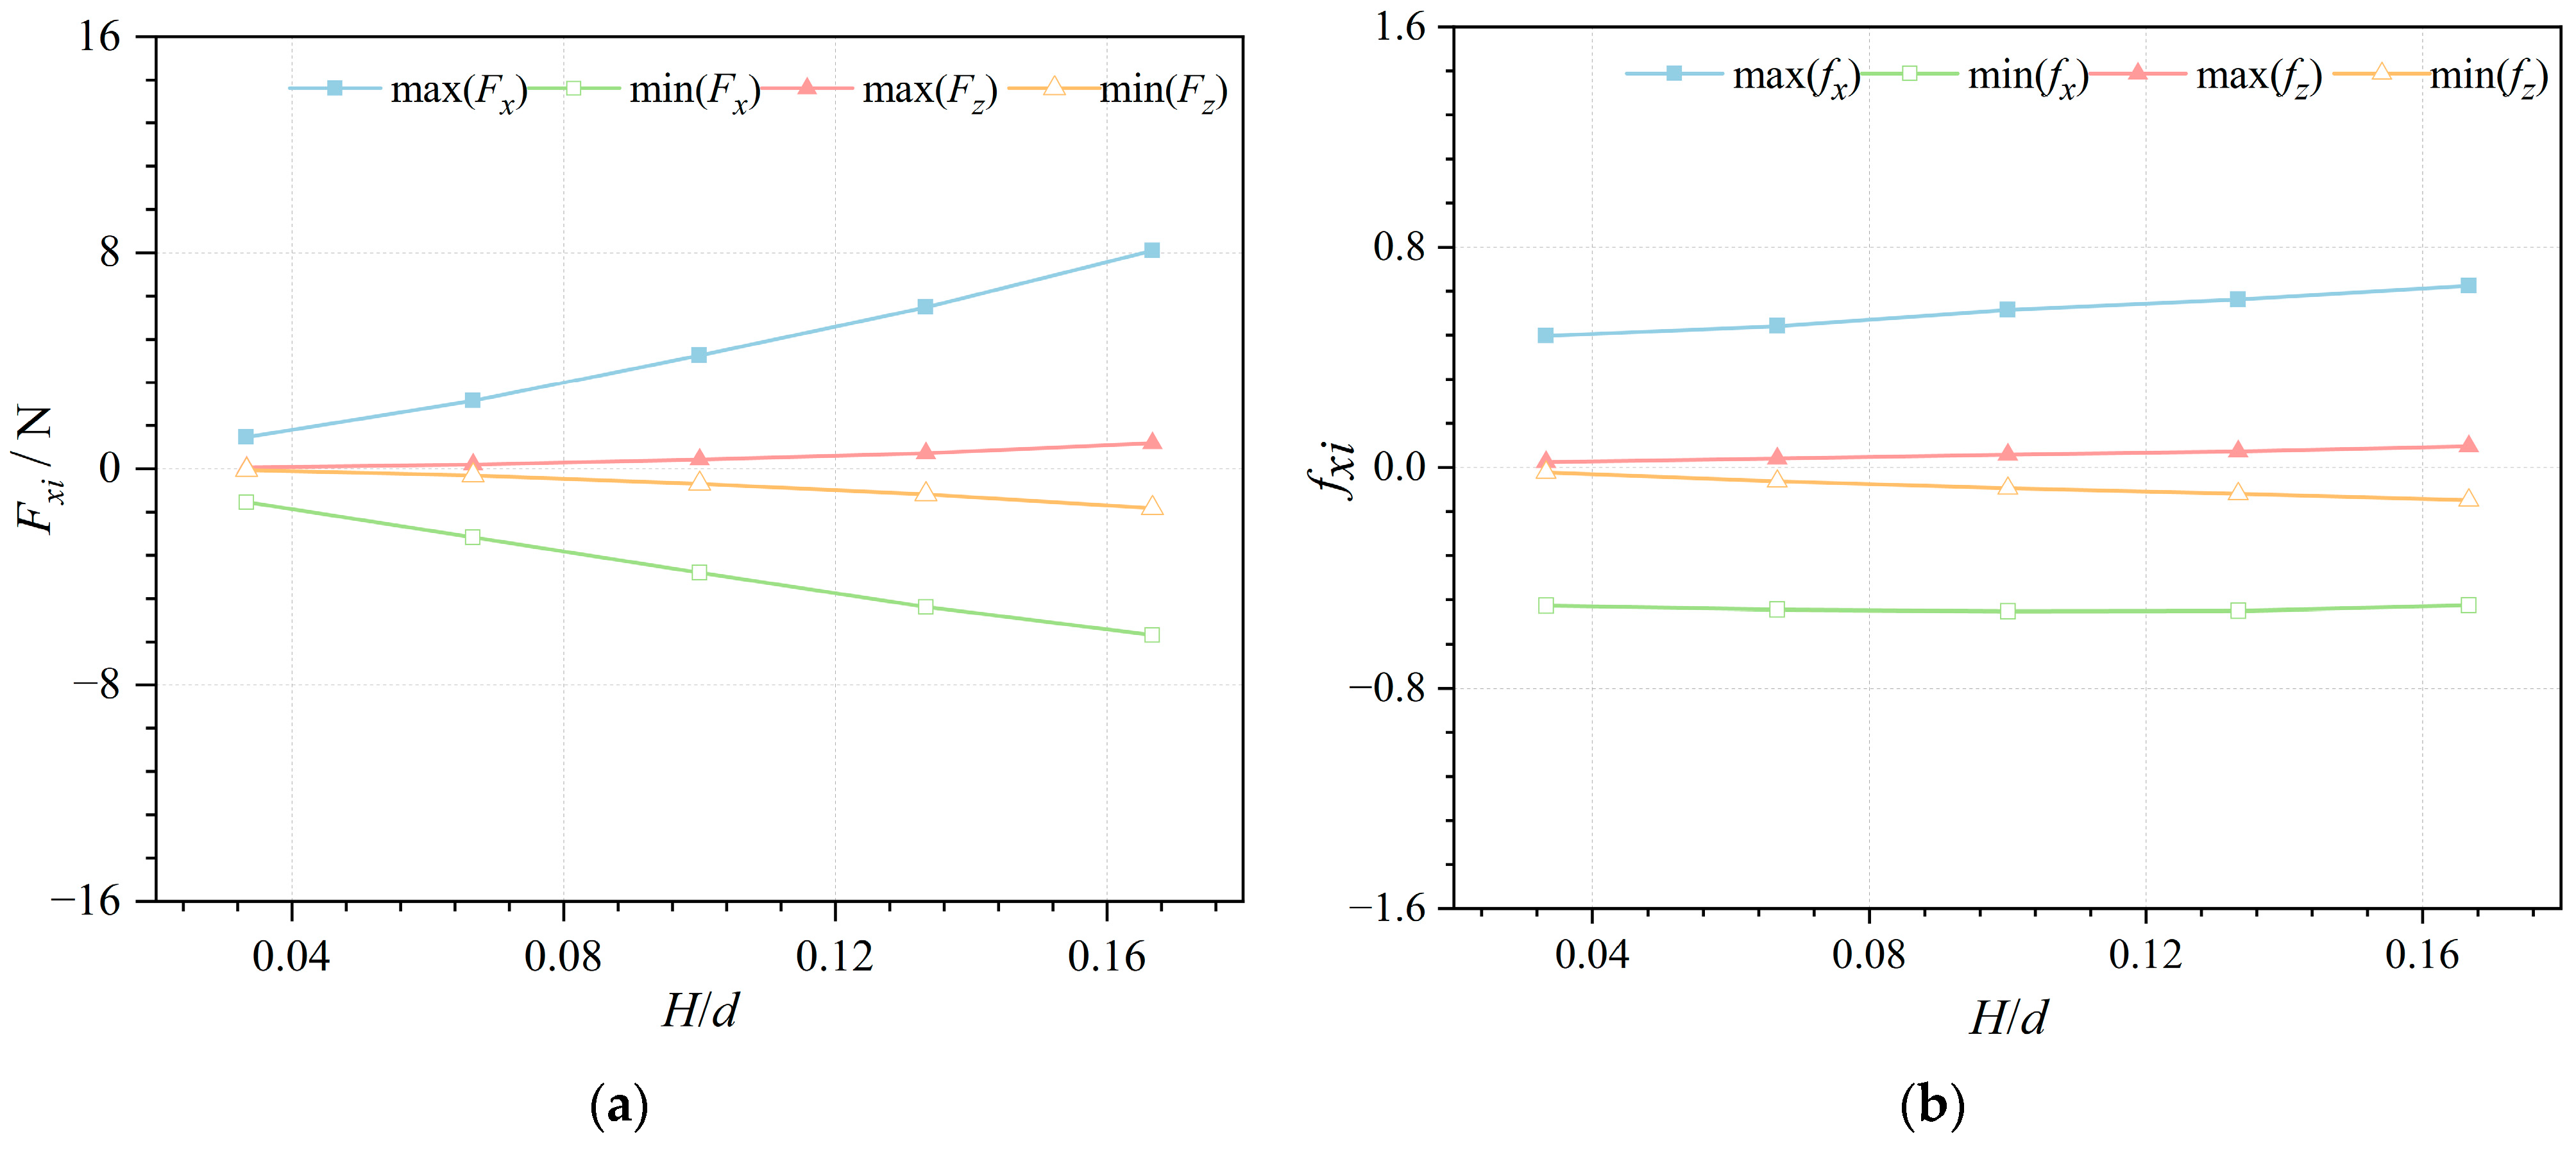
Figure 13 illustrates the changes in the maximum and lowest wave forces with the relative wave height H/d following wave-propagation stabilization under various wave height circumstances. As shown in Figure 13a, the dimensionless wave force grows with the relative wave height, with the minimum dimensionless horizontal wave force min (fx) decreasing slightly at relative water depths H/d of 0.1 to 0.167; however, both the maximum and minimum dimensional wave forces on the device increased significantly with the relative wave height, as shown in Figure 13b.
To further investigate the relationship between the wave height and wave force, the average of the sum of the absolute values of the horizontal dimensionless wave force fx and the vertical dimensionless wave force fz crest and trough were set as the average horizontal wave force and average vertical wave force, respectively.
[ f x ] = m i n ( f x ) + m a x ( f x ) 2 ,
In Equation (7), [fx] is the average horizontal wave force.
[ f z ] = m i n ( f z ) + m a x ( f z ) 2 ,
In Equation (8), [fz] is the average vertical wave force.
The variations of [fx]/[fx]H=0.01 m and [fz]/[fz]H=0.01 m with the wave height are shown in Figure 14. [fx]H=0.01 m and [fz]H=0.01 m represent the average of the sum of the absolute values of the crests and troughs for incident wave heights of H = 0.01 m for the horizontal and vertical dimensionless wave forces, respectively. As illustrated in Figure 14, the mean horizontal wave force [fx] increased linearly with the wave height, whereas the mean vertical wave force [fz] increased with the square of the wave height.
To further examine the relationship between the wave force as well as wave height, the average value of the sum of the absolute values of the horizontal wave force Fx and the vertical wave force Fz peaks and troughs was set as the average horizontal wave force and the average vertical wave force [ F z ] . Based on the force law of the device shown in Figure 14 and the conclusion that the water depth is not correlated significantly with the force of the device obtained in Section 3.2, we assumed that the magnitudes of [ F x ] and [ F z ] can be determined as follows, respectively:
[ F x ] = α ρ g D H ,
[ F z ] = β ρ g D H 2 ,
Here, α and β are used to estimate the [ F x ] and [ F z ] empirical formula coefficients, respectively. Based on the data presented in Figure 13 and Figure 14, one obtains α = 0.212 ± 0.018 and β = 0.788 ± 0.038 .

4.4. Dynamic Water Pressure at the Front Wall of the OWC Device

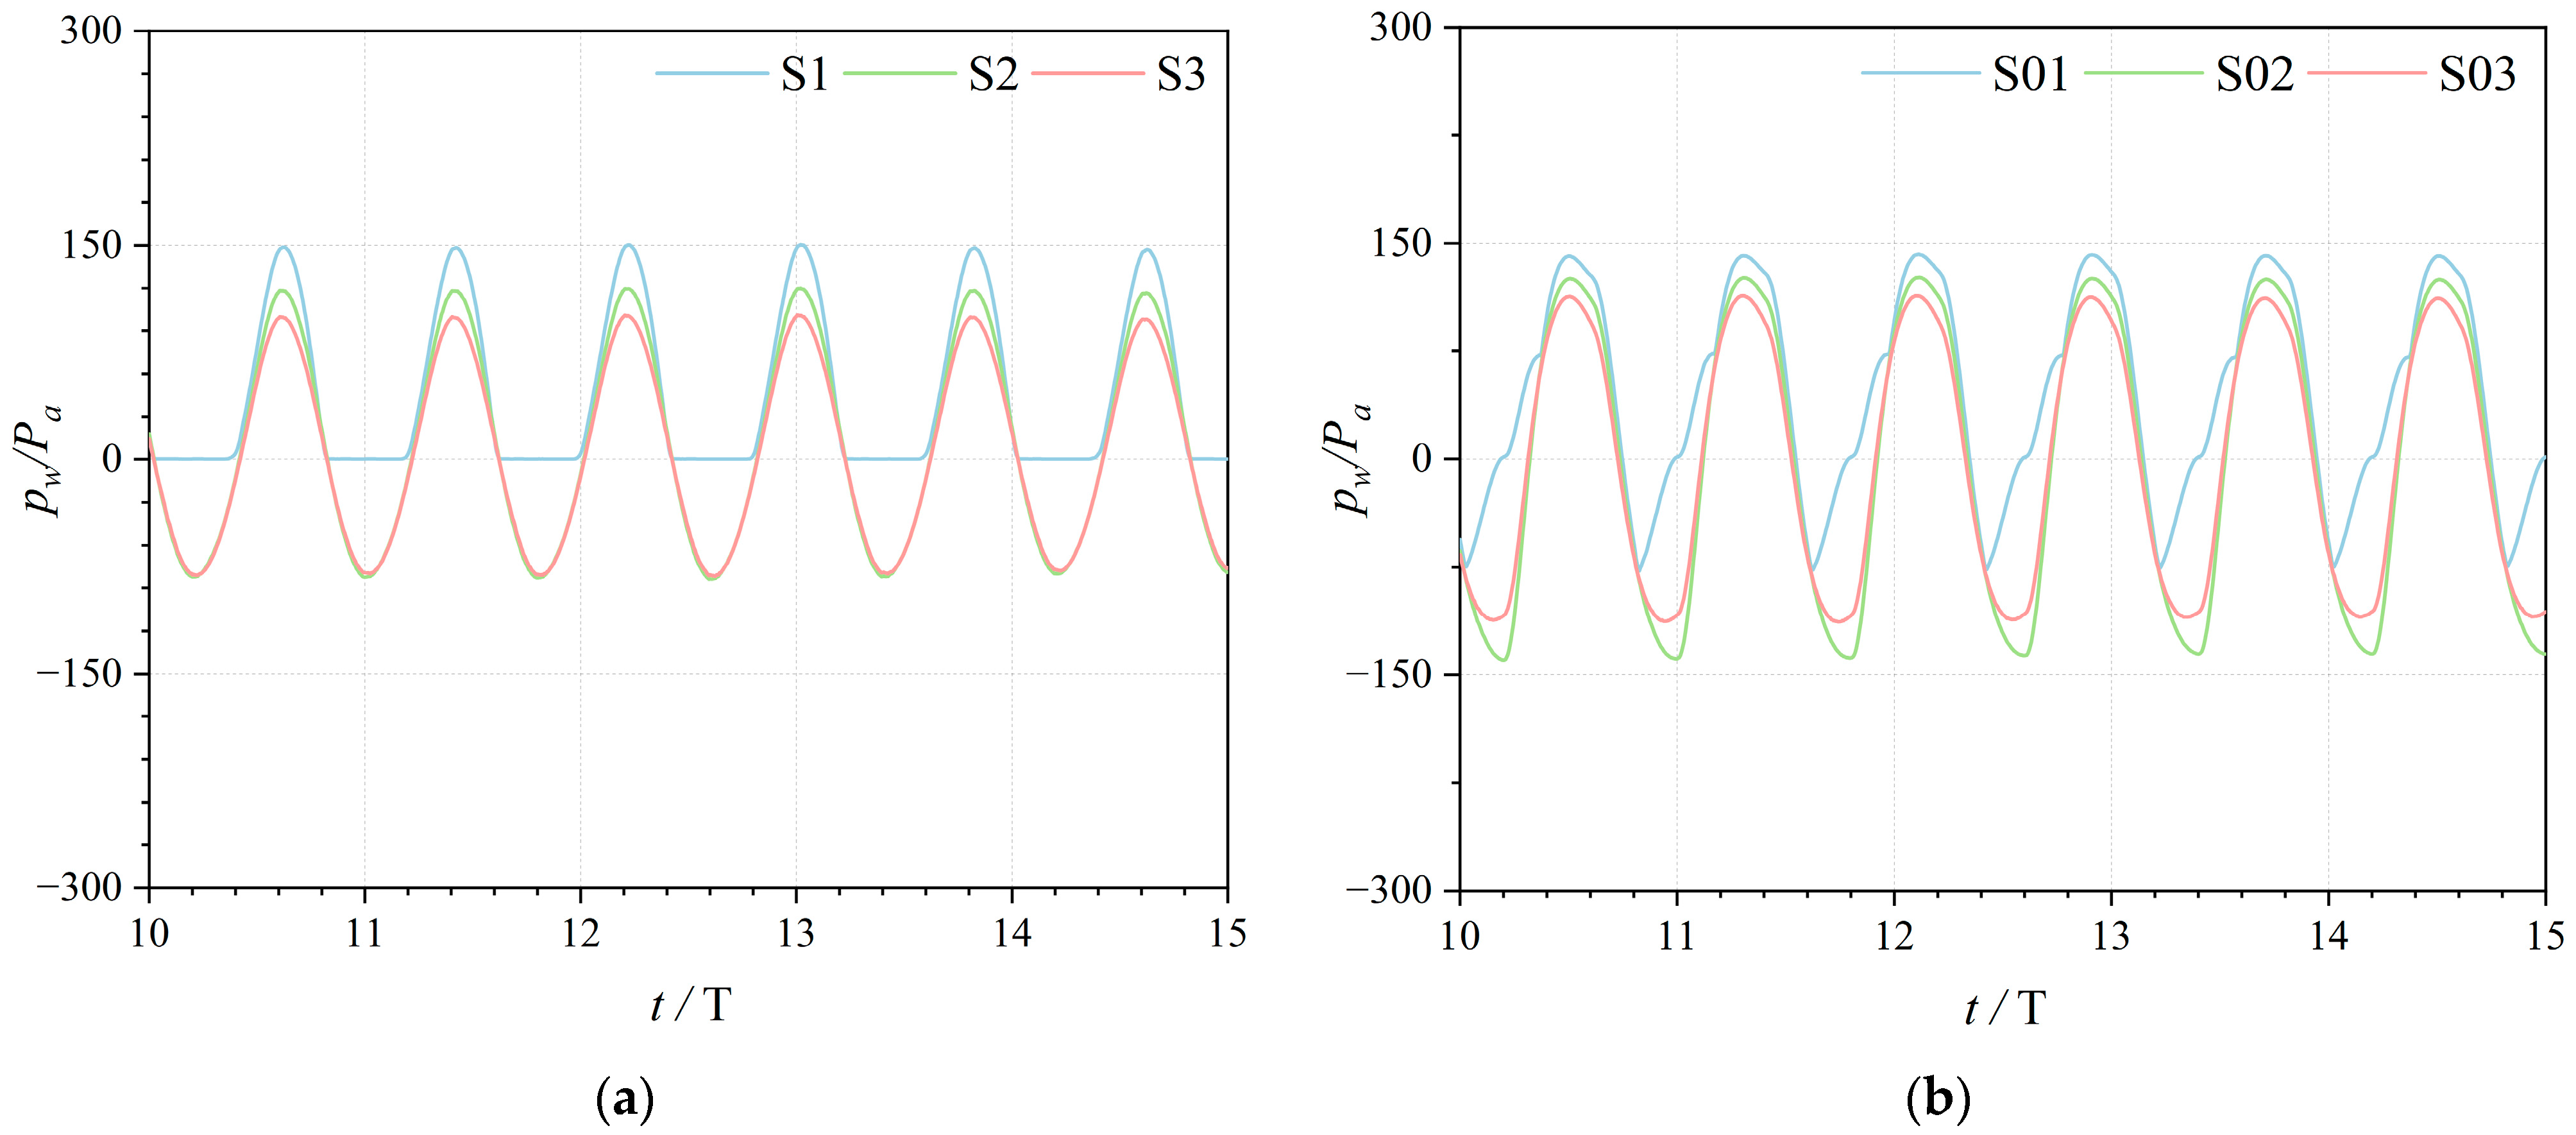
The dynamic water pressure monitoring points on the front wall of the gas chamber are shown in Figure 5. Figure 15 shows the results of the comparison of dynamic water pressure pw histories at each measurement point inside and outside the front wall of the gas chamber. As shown in Figure 15a,b, the changes in the dynamic water pressure were cyclical, and the dynamic water pressure on the outside of the front wall of the gas chamber reflected a sinusoidal curve, whereas that on the inside changed relatively irregularly compared with the dynamic water pressure on the outside; this indicates that multiple wave reflections occurred inside the gas chamber of the device and were subject to the action of the air pressure inside the gas chamber. The maximum dynamic water pressure on both sides of the front wall of the gas chamber occurred at the point where it intersected the hydrostatic surface, i.e., the maximum pressures on the outside and inside occurred at points S1 and S01, respectively.
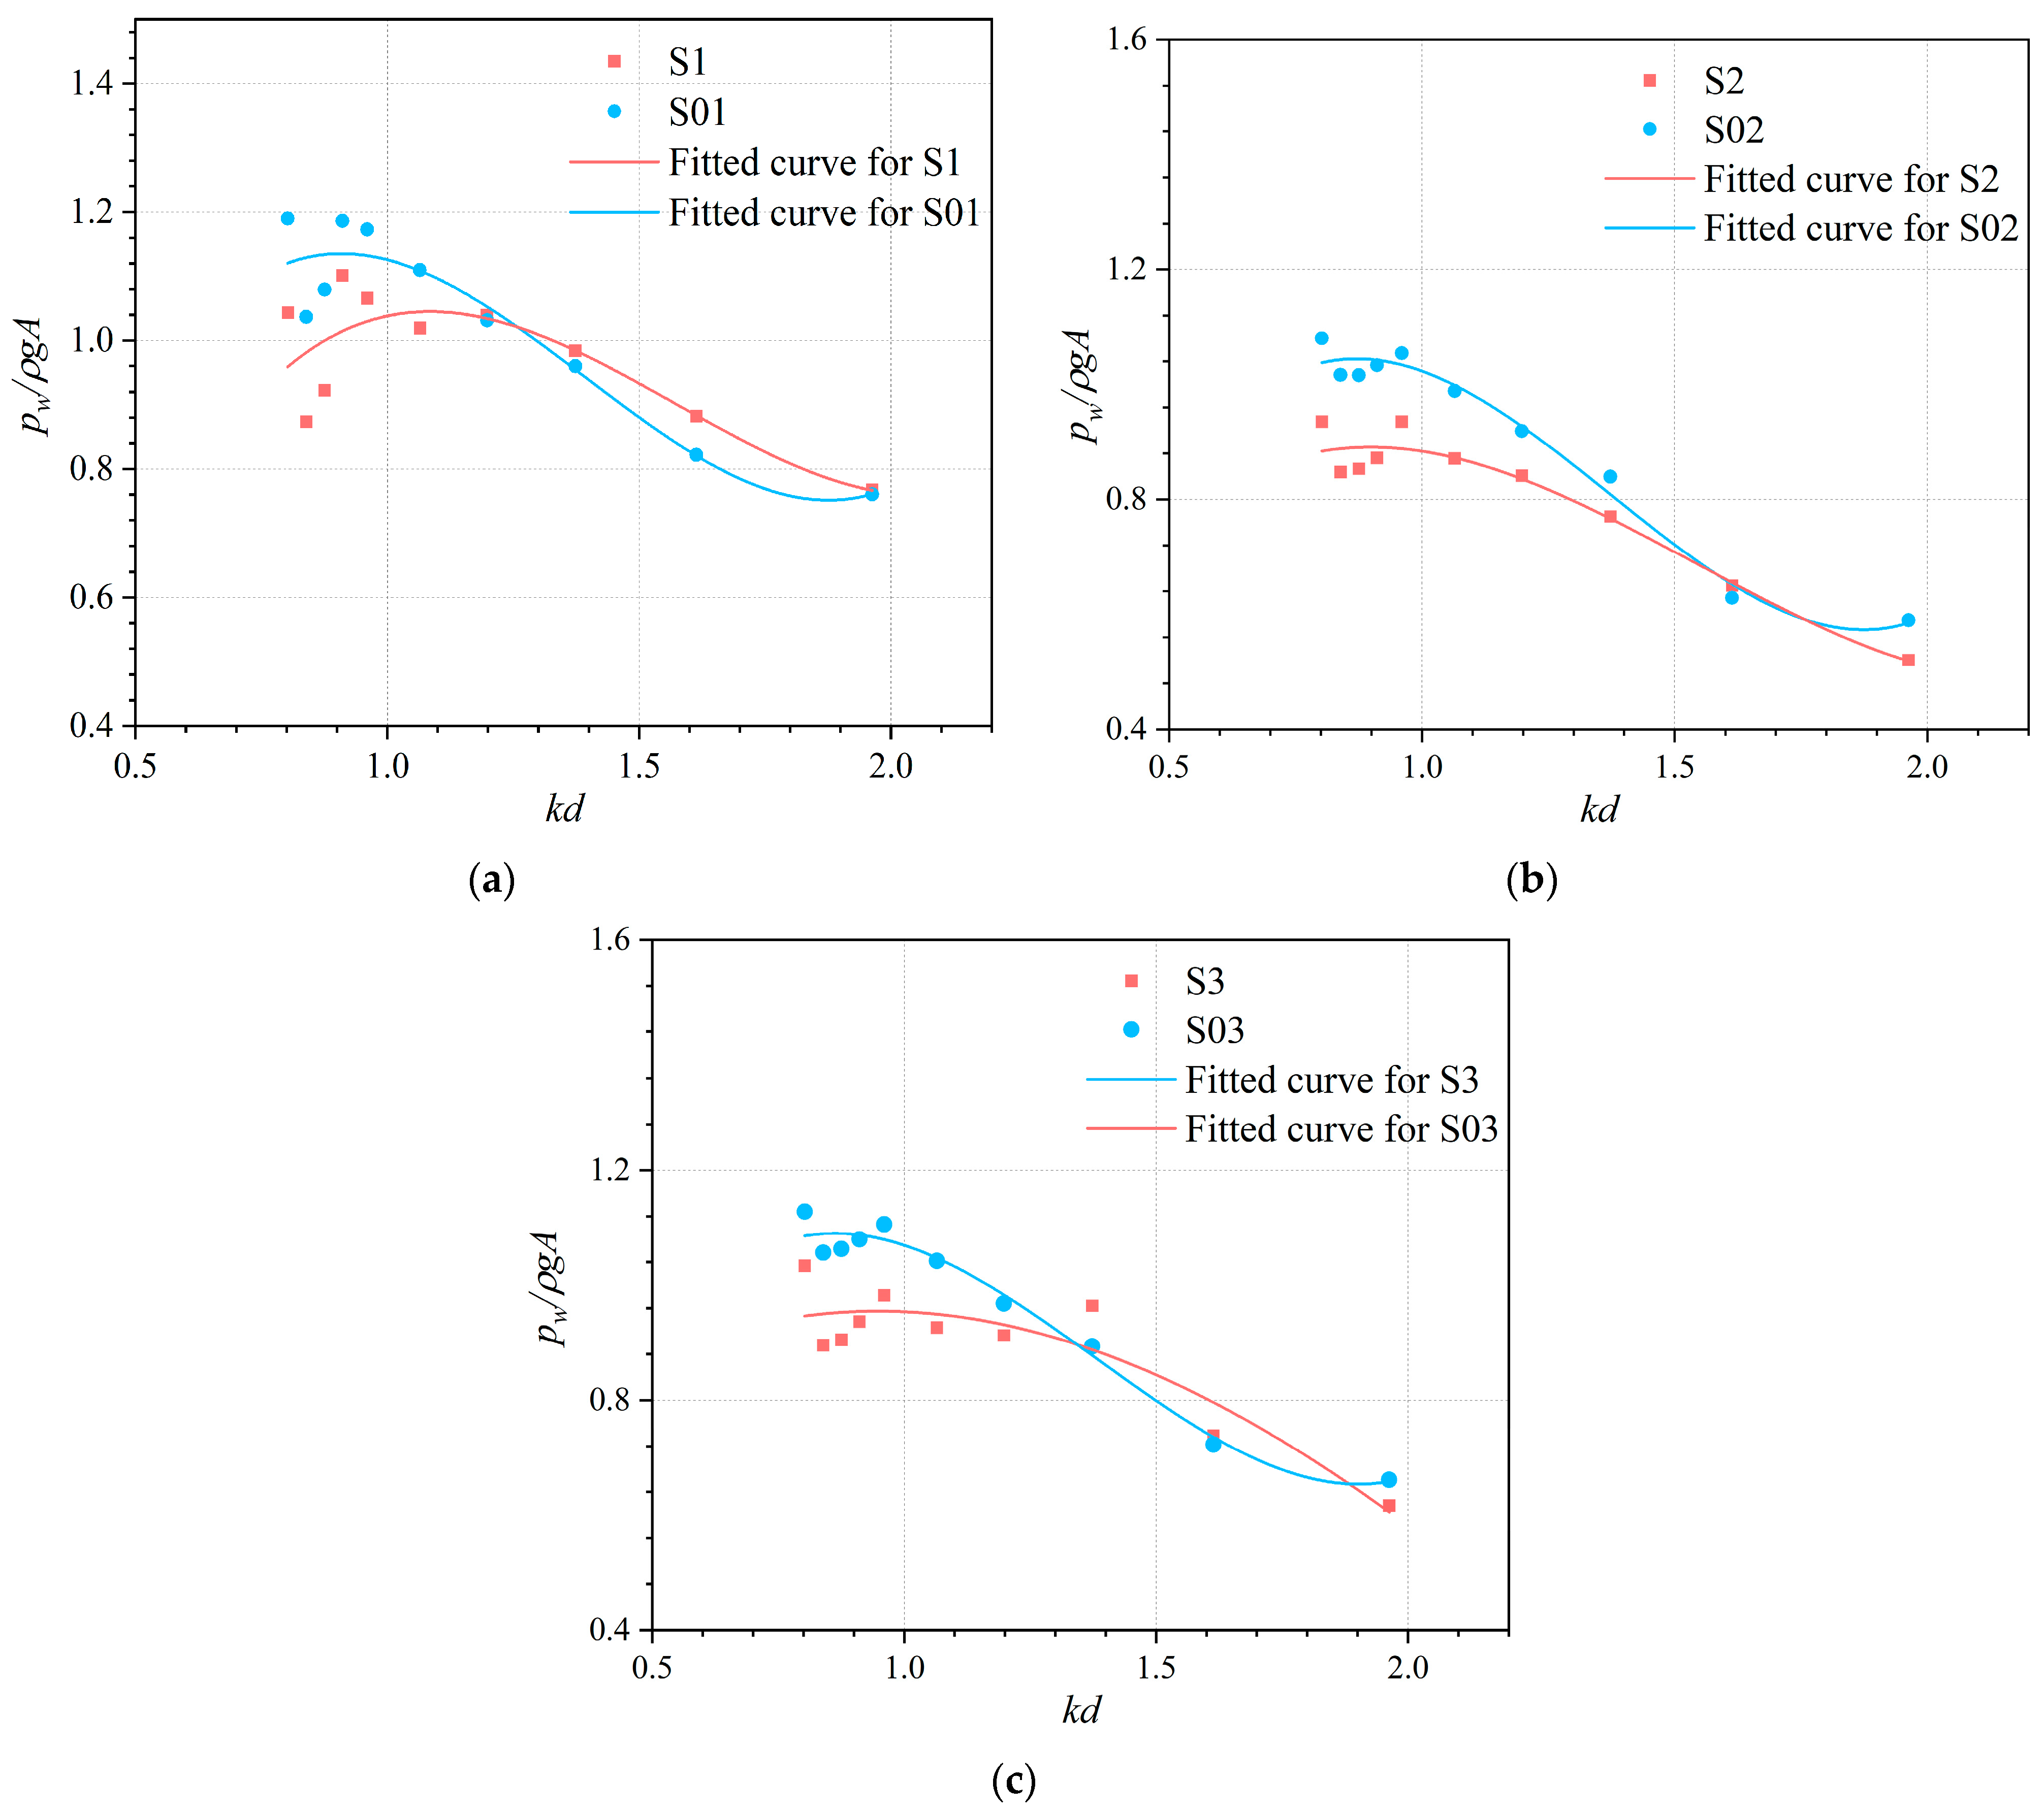
The mean value of the sum of the peaks and troughs of the dynamic water pressure at each pressure-monitoring point on the front wall is shown in Figure 16 as a function of kd. As shown in Figure 16, the dynamic water pressure at each point on the inside of the front wall of the air chamber pw increased at kd = 0.80–1.0 and decreased at kd = 1.0–2.0. Notably, at kd less than 1.3 (low-frequency region), the dynamic water pressure amplitude on the inside of the front wall was greater than the outside pressure amplitude, whereas at kd greater than 1.3 (high-frequency region), the outside amplitude is likely to exceed the inside amplitude. Due to the limitations of the VOF method, the existing models fail to adequately simulate the behavior of the impinging rigid wall after wave entrainment into the air. The two-phase compression SPH method proposed by Rafiee et al. [34], with its advantages in dealing with complex hydrodynamics problems, may provide an important reference value for the improvement and refinement of our future work.

5. Conclusions

This study used OpenFOAM to simulate wave loads on an OWC device under forward-wave incidence conditions, as well as dynamic water pressures on the inside and outside of the device’s front wall. The following conclusions were drawn from this study:
(1)
The horizontal wave force was significantly greater than the lateral and vertical wave forces, which may be related to the forward incidence of the wave.
(2)
The horizontal and vertical wave forces on the device did not change significantly with the relative water depth. This suggests that the force on the submerged section of the device affected the force of the device.
(3)
The horizontal wave force changed linearly as the wave height increased, whereas the vertical wave force increased with the square of the wave height. Consequently, when designing installations in the face of large wave heights in the marine environment, special attention must be paid to the influence of the vertical wave force in order to ensure the stability and safety of the structure.
(4)
The maximum value of the dynamic water pressure on both sides of the front wall of the device occurred at the junction of the water surface and the device. The dynamic water pressure at each point of the front wall inside the gas chamber appeared to increase and then decrease with increasing wave frequency, which was very similar to the energy-conversion efficiency of the device. Therefore, the design of the device should consider more about the strength of the device along with its maximum energy-conversion efficiency. At the same time, more attention needs to be paid to the strength of the water surface junction.
The numerical simulation results of this study provide reference values for the design and optimization of OWC devices. Even though the force characteristics of OWC devices are complex, existing studies, including Li et al.’s [29] on the effect of incident wave angle, Ning et al.’s [30] on the force law of isolated waves, and Khakimzyanov et al.’s [35,36] on the interaction of surface waves with movable structures, provide a foundation for future work. These studies provide valuable references and point out areas for further exploration. For future endeavors, the following can be considered:
(1)
Extend the studies on the effects of different incidence angles to fully understand the force characteristics of OWC devices.
(2)
Utilize the existing studies as a theoretical foundation to gain a deeper understanding of the dynamic response of OWC devices under different sea states.
(3)
Based on the existing studies, explore the force law of a 3D floating OWC device under variable sea states and then improve its stability and energy-conversion efficiency.

Author Contributions

Conceptualization, J.-L.Z., P.T., H.-S.Z. and P.-B.Z.; methodology, J.-L.Z.; software, J.-L.Z.; validation, J.-L.Z., P.T. and H.-S.Z.; formal analysis, J.-L.Z.; investigation, J.-L.Z.; resources, J.-L.Z.; data curation, J.-L.Z.; writing—original draft preparation, J.-L.Z.; writing—review and editing, H.-S.Z. and P.-B.Z.; visualization, J.-L.Z.; supervision, P.T. and H.-S.Z.; project administration, P.T.; funding acquisition, P.T. and H.-S.Z. All authors have read and agreed to the published version of the manuscript.

Funding

This research was funded by the National Natural Science Foundation of China, (Grant Nos. 51679132, and U22A20216), the Science and Technology Commission of Shanghai Municipality (Grant No. 21ZR1427000).

Data Availability Statement

Data are contained within the article.

Conflicts of Interest

The authors declare no conflicts of interest.

References

  1. Ashlin, S.J.; Sundar, V.; Sannasiraj, S.A. Effects of bottom profile of an oscillating water column device on its hydrodynamic characteristics. Renew. Energy 2016, 96, 341–353. [Google Scholar] [CrossRef]
  2. Bayoumi, S.; Incecik, A.; El-Gamal, H. Dynamic modelling of Spar-Buoy oscillating water column wave energy converter. Ships Offshore Struct. 2015, 10, 601–608. [Google Scholar] [CrossRef]
  3. Evans, D.V. The Oscillating Water Column Wave-energy Device. IMA J. Appl. Math. 1978, 22, 423–433. [Google Scholar] [CrossRef]
  4. Martins-rivas, H.; Mei, C.C. Wave power extraction from an oscillating water column along a straight coast. Ocean Eng. 2009, 36, 426–433. [Google Scholar] [CrossRef]
  5. Nader, J.-R.; Zhu, S.-P.; Cooper, P.; Stappenbelt, B. A finite-element study of the efficiency of arrays of oscillating water column wave energy converters. Ocean Eng. 2012, 43, 72–81. [Google Scholar] [CrossRef]
  6. Dimakopoulos, A.S.; Cooker, M.J.; Bruce, T. The influence of scale on the air flow and pressure in the modelling of Oscillating Water Column Wave Energy Converters. Int. J. Mar. Energy 2017, 19, 272–291. [Google Scholar] [CrossRef]
  7. Xu, C.; Huang, Z.; Deng, Z. Experimental and theoretical study of a cylindrical oscillating water column device with a quadratic power take-off model. Appl. Ocean Res. 2016, 57, 19–29. [Google Scholar] [CrossRef]
  8. Hu, H.; Deng, Z.; Yao, Y.; Zhao, X. Theoretical and numerical studies of off-shore oscillating water column wave energy device. J. Zhejiang Univ.-Sci. A (Appl. Phys. Eng.) 2019, 53, 325–335. [Google Scholar] [CrossRef]
  9. Ashlin, S.J.; Sannasiraj, S.A.; Sundar, V. Wave Forces on an Oscillating Water Column Device. Procedia Eng. 2015, 116, 1019–1026. [Google Scholar] [CrossRef]
  10. Jakobsen, M.M.; Beatty, S.; Iglesias, G.; Kramer, M.M. Characterization of loads on a hemispherical point absorber wave energy converter. Int. J. Mar. Energy 2016, 13, 1–15. [Google Scholar] [CrossRef]
  11. Elhanafi, A. Prediction of regular wave loads on a fixed offshore oscillating water column-wave energy converter using CFD. J. Ocean Eng. Sci. 2016, 1, 268–283. [Google Scholar] [CrossRef]
  12. Wang, R.-Q.; Ning, D.-Z. Dynamic analysis of wave action on an OWC wave energy converter under the influence of viscosity. Renew. Energy 2020, 150, 578–588. [Google Scholar] [CrossRef]
  13. Ning, D.-Z.; Wang, R.-Q.; Gou, Y.; Zhao, M.; Teng, B. Numerical and experimental investigation of wave dynamics on a land-fixed OWC device. Energy 2016, 115, 326–337. [Google Scholar] [CrossRef]
  14. Deng, Z.; Huang, Z.; Law, A.W.K. Wave power extraction by an axisymmetric oscillating-water-column converter supported by a coaxial tube-sector-shaped structure. Appl. Ocean Res. 2013, 42, 114–123. [Google Scholar] [CrossRef]
  15. Zhou, Y.; Zhang, C.; Ning, D. Hydrodynamic Investigation of a Concentric Cylindrical OWC Wave Energy Converter. Energies 2018, 11, 985. [Google Scholar] [CrossRef]
  16. Huang, Z.; Huang, S.; Xu, C. Characteristics of the flow around a circular OWC-type wave energy converter supported by a bottom-sitting C-shaped structure. Appl. Ocean Res. 2020, 101, 102228. [Google Scholar] [CrossRef]
  17. Xu, C.; Huang, Z. A dual-functional wave-power plant for wave-energy extraction and shore protection: A wave-flume study. Appl. Energy 2018, 229, 963–976. [Google Scholar] [CrossRef]
  18. He, F.; Huang, Z. Hydrodynamic performance of pile-supported OWC-type structures as breakwaters: An experimental study. Ocean Eng. 2014, 88, 618–626. [Google Scholar] [CrossRef]
  19. He, F.; Li, M.; Huang, Z. An Experimental Study of Pile-Supported OWC-Type Breakwaters: Energy Extraction and Vortex-Induced Energy Loss. Energies 2016, 9, 540. [Google Scholar] [CrossRef]
  20. Zhou, Y.; Ning, D.; Liang, D.; Cai, S. Nonlinear hydrodynamic analysis of an offshore oscillating water column wave energy converter. Renew. Sustain. Energy Rev. 2021, 145, 111086. [Google Scholar] [CrossRef]
  21. Zhou, Y.; Ning, D.; Shi, W.; Johanning, L.; Liang, D. Hydrodynamic investigation on an OWC wave energy converter integrated into an offshore wind turbine monopile. Coast. Eng. 2020, 162, 103731. [Google Scholar] [CrossRef]
  22. Chen, J.; Wen, H.; Wang, Y.; Ren, B. Experimental investigation of an annular sector OWC device incorporated into a dual cylindrical caisson breakwater. Energy 2020, 211, 118681. [Google Scholar] [CrossRef]
  23. Wan, C.; Yang, C.; Fang, Q.; You, Z.; Geng, J.; Wang, Y. Hydrodynamic Investigation of a Dual-Cylindrical OWC Wave Energy Converter Integrated into a Fixed Caisson Breakwater. Energies 2020, 13, 896. [Google Scholar] [CrossRef]
  24. Xu, C.; Huang, Z. Three-dimensional CFD simulation of a circular OWC with a nonlinear power-takeoff: Model validation and a discussion on resonant sloshing inside the pneumatic chamber. Ocean Eng. 2019, 176, 184–198. [Google Scholar] [CrossRef]
  25. Deng, Z.; Huang, Z.; Law, A.W.K. Wave power extraction from a bottom-mounted oscillating water column converter with a V-shaped channel. Proc. R. Soc. A Math. Phys. Eng. Sci. 2014, 470, 20140074. [Google Scholar] [CrossRef]
  26. Falco, A.F.O.; Sarmento, A.J.N.A.; Gato, L.M.C.; Brito-Melo, A. The Pico OWC wave power plant: Its lifetime from conception to closure 1986–2018. Appl. Ocean Res. 2020, 98, 102104. [Google Scholar] [CrossRef]
  27. Pawitan, K.A.; Vicinanza, D.; Allsop, W.; Bruce, T. Front Wall and In-Chamber Impact Loads on a Breakwater-Integrated Oscillating Water Column. J. Waterw. Port Coast. Ocean. Eng. 2020, 146, 16. [Google Scholar] [CrossRef]
  28. Gaidai, O.; Xu, X.; Wang, J.; Ye, R.; Cheng, Y.; Karpa, O. SEM-REV offshore energy site wind-wave bivariate statistics by hindcast. Renew. Energy 2020, 156, 689–695. [Google Scholar] [CrossRef]
  29. Li, Y.; Zhao, X.; Zou, Q.; Geng, J. Hydrodynamic performance of dual-chamber Oscillating Water Column array under oblique waves. Phys. Fluids 2022, 34, 117112. [Google Scholar] [CrossRef]
  30. Ning, D.-Z.; Mu, D.; Wang, R.-Q.; Mayon, R. Experimental and numerical investigations on the solitary wave actions on a land-fixed OWC wave energy converter. Energy 2023, 282, 128363. [Google Scholar] [CrossRef]
  31. Huang, Z.; Xu, C.; Huang, S. A CFD simulation of wave loads on a pile-type oscillating-water-column device. J. Hydrodyn. 2019, 31, 41–49. [Google Scholar] [CrossRef]
  32. Jacobsen, N.G.; Fuhrman, D.R.; Fredsøe, J. A wave generation toolbox for the open-source CFD library: OpenFoam®. Int. J. Numer. Methods Fluids 2012, 70, 1073–1088. [Google Scholar] [CrossRef]
  33. Hirt, C.W.; Nichols, B.D. Volume of fluid (VOF) method for the dynamics of free boundaries. J. Comput. Phys. 1981, 39, 201–225. [Google Scholar] [CrossRef]
  34. Rafiee, A.; Dutykh, D.; Dias, F. Numerical Simulation of Wave Impact on a Rigid Wall Using a Two–phase Compressible SPH Method. Procedia IUTAM 2015, 18, 123–137. [Google Scholar] [CrossRef]
  35. Khakimzyanov, G.; Dutykh, D. Numerical modelling of surface water wave interaction with a moving wall. Commun. Comput. Phys. 2017, 23, 1289–1354. [Google Scholar] [CrossRef]
  36. Khakimzyanov, G.; Dutykh, D. Long Wave Interaction with a Partially Immersed Body. Part I: Mathematical Models. Commun. Comput. Phys. 2020, 27, 321–378. [Google Scholar] [CrossRef]
Figure 1. Diagram of the 3D numerical wave tank.
Jmse 12 01161 g001
Figure 2. Dimensions of the OWC numerical model.
Jmse 12 01161 g002
Figure 3. OWC device grid.
Jmse 12 01161 g003
Figure 4. Comparison of numerical model results for horizontal vertical wave forces on the OWC (T = 1.40 s, d = 0.30 m, and H = 0.04 m): (a) horizontal direction; (b) vertical direction.
Jmse 12 01161 g004
Figure 5. Schematic diagram of the OWC device for monitoring dynamic water pressure at section y = 0.
Jmse 12 01161 g005
Figure 6. Comparison of theoretical and numerical model results at the outer monitoring point on the OWC front wall (T = 1.40 s, d = 0.30 m, and H = 0.04 m): (a) monitoring point S1; (b) monitoring point S2; (c) monitoring point S3.
Jmse 12 01161 g006
Figure 7. Comparison chart of the numerical model and pneumatic test (T = 0.80 s, d = 0.30 m, and H = 0.04 m).
Jmse 12 01161 g007
Figure 8. Dimensionless wave forces on the OWC device at different periods (T = 0.80–1.40 s, d = 0.30 m, and H = 0.04 m).
Jmse 12 01161 g008
Figure 9. Wave elevation in the vicinity of the OWC device.
Jmse 12 01161 g009
Figure 10. Variation in maximum and minimum wave forces with wave frequency (T = 0.80–1.40 s, d = 0.30 m, and H = 0.04 m).
Jmse 12 01161 g010
Figure 11. Variation in maximum and minimum dimensionless wave forces with relative water depth (T = 1.40 s, d = 0.26–0.32 m, and H = 0.04 m).
Jmse 12 01161 g011
Figure 12. Variation in horizontal and vertical wave forces with time at different water depths (T = 1.40 s, d = 0.26–0.32 m, and H = 0.04 m): (a) horizontal wave forces; (b) vertical wave forces.
Jmse 12 01161 g012
Figure 13. Variation in horizontal vertical wave force with time for different wave heights (T = 1.40 s, d = 0.30 m, and H = 0.01–0.05 m): (a) dimensionless wave force on the device; (b) gauge wave force on the device.
Jmse 12 01161 g013
Figure 14. Curves of [fx]/[fx]H=0.01 m and [fz]/[fz]H=0.01 m with wave height (period T = 1.40 s, water depth d = 0.30 m, and wave height H = 0.01–0.05 m).
Jmse 12 01161 g014
Figure 15. Variation in dynamic water pressure with time at each monitoring point on both sides of the front wall of the OWC unit (T = 0.80 s, d = 0.30 m, and H = 0.04 m): (a) outside of the front wall (S1, S2, and S3); (b) inside of the front wall (S01, S02, and S03).
Jmse 12 01161 g015
Figure 16. Variation in pressure amplitude at various points on the front wall with kd: (a) monitoring points S1 and S01; (b) monitoring points S2 and S02; (c) monitoring points S3 and S03.
Jmse 12 01161 g016
Disclaimer/Publisher’s Note: The statements, opinions and data contained in all publications are solely those of the individual author(s) and contributor(s) and not of MDPI and/or the editor(s). MDPI and/or the editor(s) disclaim responsibility for any injury to people or property resulting from any ideas, methods, instructions or products referred to in the content.