Article

The Effect of Corner Structure on the Optimisation of Fishable Flow Field in Aquaculture Tanks

1
Fishery Machinery and Instrument Research Institute, Chinese Academy of Fishery Sciences, Shanghai 200092, China
2
School of Navigation and Naval Architecture Engineering, Dalian Ocean University, Dalian 116023, China
*
Author to whom correspondence should be addressed.
J. Mar. Sci. Eng. 2024, 12(7), 1185; https://doi.org/10.3390/jmse12071185
Submission received: 18 June 2024 / Revised: 10 July 2024 / Accepted: 11 July 2024 / Published: 15 July 2024
(This article belongs to the Special Issue New Techniques and Equipment in Large Offshore Aquaculture Platform)

Abstract

:
As coastal waters face constraints such as the deterioration of the aquaculture environment and limitations on the scale of operation, aquaculture will move towards the deep and distant sea. Large-scale aquaculture vessels are a new method of deep-sea aquaculture, and improving the utilisation efficiency of aquaculture tanks to ensure the best growth conditions for fish inside while ensuring the efficient discharge of particulate matter in these tanks will affect the productivity of aquaculture and the profitability of aquaculture vessels. This study investigated the effects of the tank structure ratio on the flow field characteristics and particulate removal efficiency in the aquaculture tanks of an aquaculture vessel. Numerical simulations of the flow field characteristics in the aquaculture tanks of an 8000 t-class aquaculture vessel at anchor were conducted using the FLOW-3D software to quantitatively evaluate the effects of the corner ratio on the fishability of aquaculture tanks and the efficiency of particulate emission using the parameters related to flow velocity, turbulence intensity, capacity utilisation rate, and particulate removal efficiency. The simulation results show that the tanks with corner structures have better flow field characteristics, which include a higher flow velocity, turbulence intensity, and discharge effect. When the corner length is more than 1/3 of the tank length, increasing the corner distance does not significantly enhance the optimisation of the flow field characteristics in the tank. Overall, this study’s results provide a reference basis for the structural design and optimisation of aquaculture tanks in aquaculture vessels.

1. Introduction

According to a report by the Food and Agriculture Organization of the United Nations (FAO), driven by aquaculture expansion and the recovery of capture fisheries, aquaculture production exceeded capture fisheries production for the first time in 2022, with 94.4 million tonnes of aquaculture production, accounting for 51 percent of the world’s total aquatic animal production [1]. In search of more space and better water quality, aquaculture is moving into the deep sea [2,3]. The safety and fishability of aquaculture equipment are key to expanding the scale of deep-sea aquaculture, and many scholars have conducted experiments on the hydrodynamic response of deep-sea cages [4,5]. Deep-sea cage aquaculture is often exposed to deep waters, where poor sea conditions can lead to problems such as fish escape and structural safety [6]. Shipboard tank technology has provided a new approach to deep-sea aquaculture. Industrial aquaculture at sea was first proposed in the late 1970s [7] with the systematic study of aquaculture vessels by Xu and Cai et al. [3,8]. Cui et al. provided specific ideas for the construction of large-scale aquaculture vessels [9] and, together with Guo and Li et al., proposed the problem of the fishability of tanks and investigated the effects of external incentives, water entry modes, and other factors on the flow pattern [10,11,12,13]. The size of the flow rate and the uniformity of the flow in aquaculture tanks have a critical impact on the removal of particulate matter, such as feed, bait, and faeces, from the environment. An aquaculture water body with an appropriate flow rate not only enables the uniform distribution of dissolved oxygen in the limited aquaculture space but also facilitates the removal of particulate matter consisting of bait residues, faeces, and secondary metabolites from the tanks. Therefore, utilising a larger culture water body area and ensuring the comprehensive performance of the flow field are contradictory points. Determining the corner ratio that combines the comprehensive performance of the tank with the aquaculture vessel area can improve the vessel’s economic efficiency and provide a reference design basis.
Currently, fishability studies in confined environments have mostly been based on recirculating aquaculture systems (RASs), and rectangular and circular tanks are the most widely used among fully or semi-closed aquaculture tanks. Despite these problems, rectangular tanks are still widely used in aquaculture because they are easier to construct than other shapes and have a higher overall space efficiency. Aquaculture tanks that tend to be circular have the advantages of good hydrodynamic characteristics and high self-purification capacity but have a low space utilisation rate [14,15,16]. In 2004, Oca et al. compared the distribution of flow fields in rectangular aquaculture ponds with different intake structures. The results showed that horizontal tangential inlets resulted in higher and more uniform flow rates, thus preventing the deposition of solid particles [17]. In 2007, Oca et al. analysed the simplest inlet and outlet configurations to create uniform cyclonic pools in rectangular aquaculture ponds. They combined the advantages of rectangular and circular ponds, suggesting that higher flow rates can impact the self-cleaning performance of aquaculture ponds [18]. In 2013, Lee et al. modelled the effect of inlet structures on the flow field in flow tanks for tangential and normal flow in culture tanks [19]. In 2015, Davidson et al. also experimentally comparatively analysed the effect of the inlet structure of Cornell dual-channel aquaculture tanks on the hydraulic mixing performance and the movement of solid particles, with appropriately increased flow velocities at the walls of the tanks tending to favour the discharge of particulate matter [20]. In 2017, Liu et al. modelled the hydrodynamics of octagonal aquaculture ponds in a recirculation system and demonstrated 90% particle removal in octagonal aquaculture ponds [21]. The above study shows that the numerical model of spatial hydrodynamics of octagonal aquaculture can be further designed and optimised.
The optimisation of the tank structure has attracted much attention in the research field of ship and marine engineering. In marine engineering, the research on the ship’s tank focuses on the impact pressure of the liquid on the bulkhead and the safety problems it creates. An aquaculture vessel is a special vessel used for aquaculture with the characteristics of both the vessel and the aquaculture vessel. The vessel tank aquaculture technology features the newly emerging aquaculture mode, with fewer research results and a lack of practical application. The traditional land-based factory farming model and the marine and shipbuilding industries cannot be used to determine the effect of tank structure on the fishability of the flow field in the tank. As the construction of large-scale aquaculture fishing vessels is advancing, Cui and Guo studied the effect of changing external incentive conditions on the fishability of the flow field in tanks [10,11,12,22,23,24]. Xiong et al. investigated the effects of the number of intake pipes and the bottom water discharge rate on the exclusion rate of solid particles such as faeces and residual feed in aquaculture tanks. The results showed that the bottom water discharge rate did not have a significant effect on the discharge of solid particles [25]. Xue et al. investigated the effects of the tank structure on the fluid characteristics and solid particulate exclusion rate of the tank. They showed that the fluid characteristics of the rectangular tank were significantly improved after chamfering the two right-angled edges of the tank [26].
In the early stage of aquaculture vessel design, it is often necessary to consider the problem of the flow field in aquaculture tanks. The tank type is particularly important for improving the fishability of the flow field in these tanks. If the tank type is unreasonable, even if the inlet and outlet arrangement and flow rate are changed, an aquaculture tank cannot obtain a high fishability of the flow field. Therefore, it is particularly important to simulate the flow pattern in different tanks. As mentioned before, aquaculture tanks with square-shaped tanks have a higher aquaculture water body area, but the poor flow regime and low energy utilisation efficiency of the tanks lead to their poor economy, while circular tanks have an excellent tank flow field, but the decline in their space utilisation also affects the number of fish cultured, and the area of the aquaculture water body and the flow regime of the tanks become a pair of contradictions. The aim of this study was to find the corner ratio with higher comprehensive performance and to improve the aquaculture vessel’s overall economic efficiency by increasing the aquaculture water body area as much as possible while ensuring that the flow pattern in the tank is suitable for fishing.
Based on computational fluid dynamics (CFD) technology, this study used the FLOW-3D software to numerically simulate the flow pattern of aquaculture tanks in an 8000 t-class aquaculture vessel and analysed the influence of the proportion of the corner cut of the aquaculture tanks on the flow pattern of these tanks using mathematical and statistical methods. Numerical simulation was used to analyse the effect of the tank corner ratio on the tank culture flow state and provide theoretical guidance for the shipboard tank culture technology. In this study, statistical methods were used to evaluate the flow characteristics in tanks with different corner ratios. This study is organised as follows: Section 2 describes the data-processing methodology, the physical model of the cultured tank, and the setup in the CFD software. Numerical simulations are carried out in Section 3, and the results are analysed. The effect of the corner type on the flow velocity, energy utilisation efficiency, vortex strength, and particulate emission efficiency is described in detail. In Section 4, based on the numerical simulation, the proposed corner cut ratio is presented, and the findings of this study are summarised.

2. Research Object and Model Construction

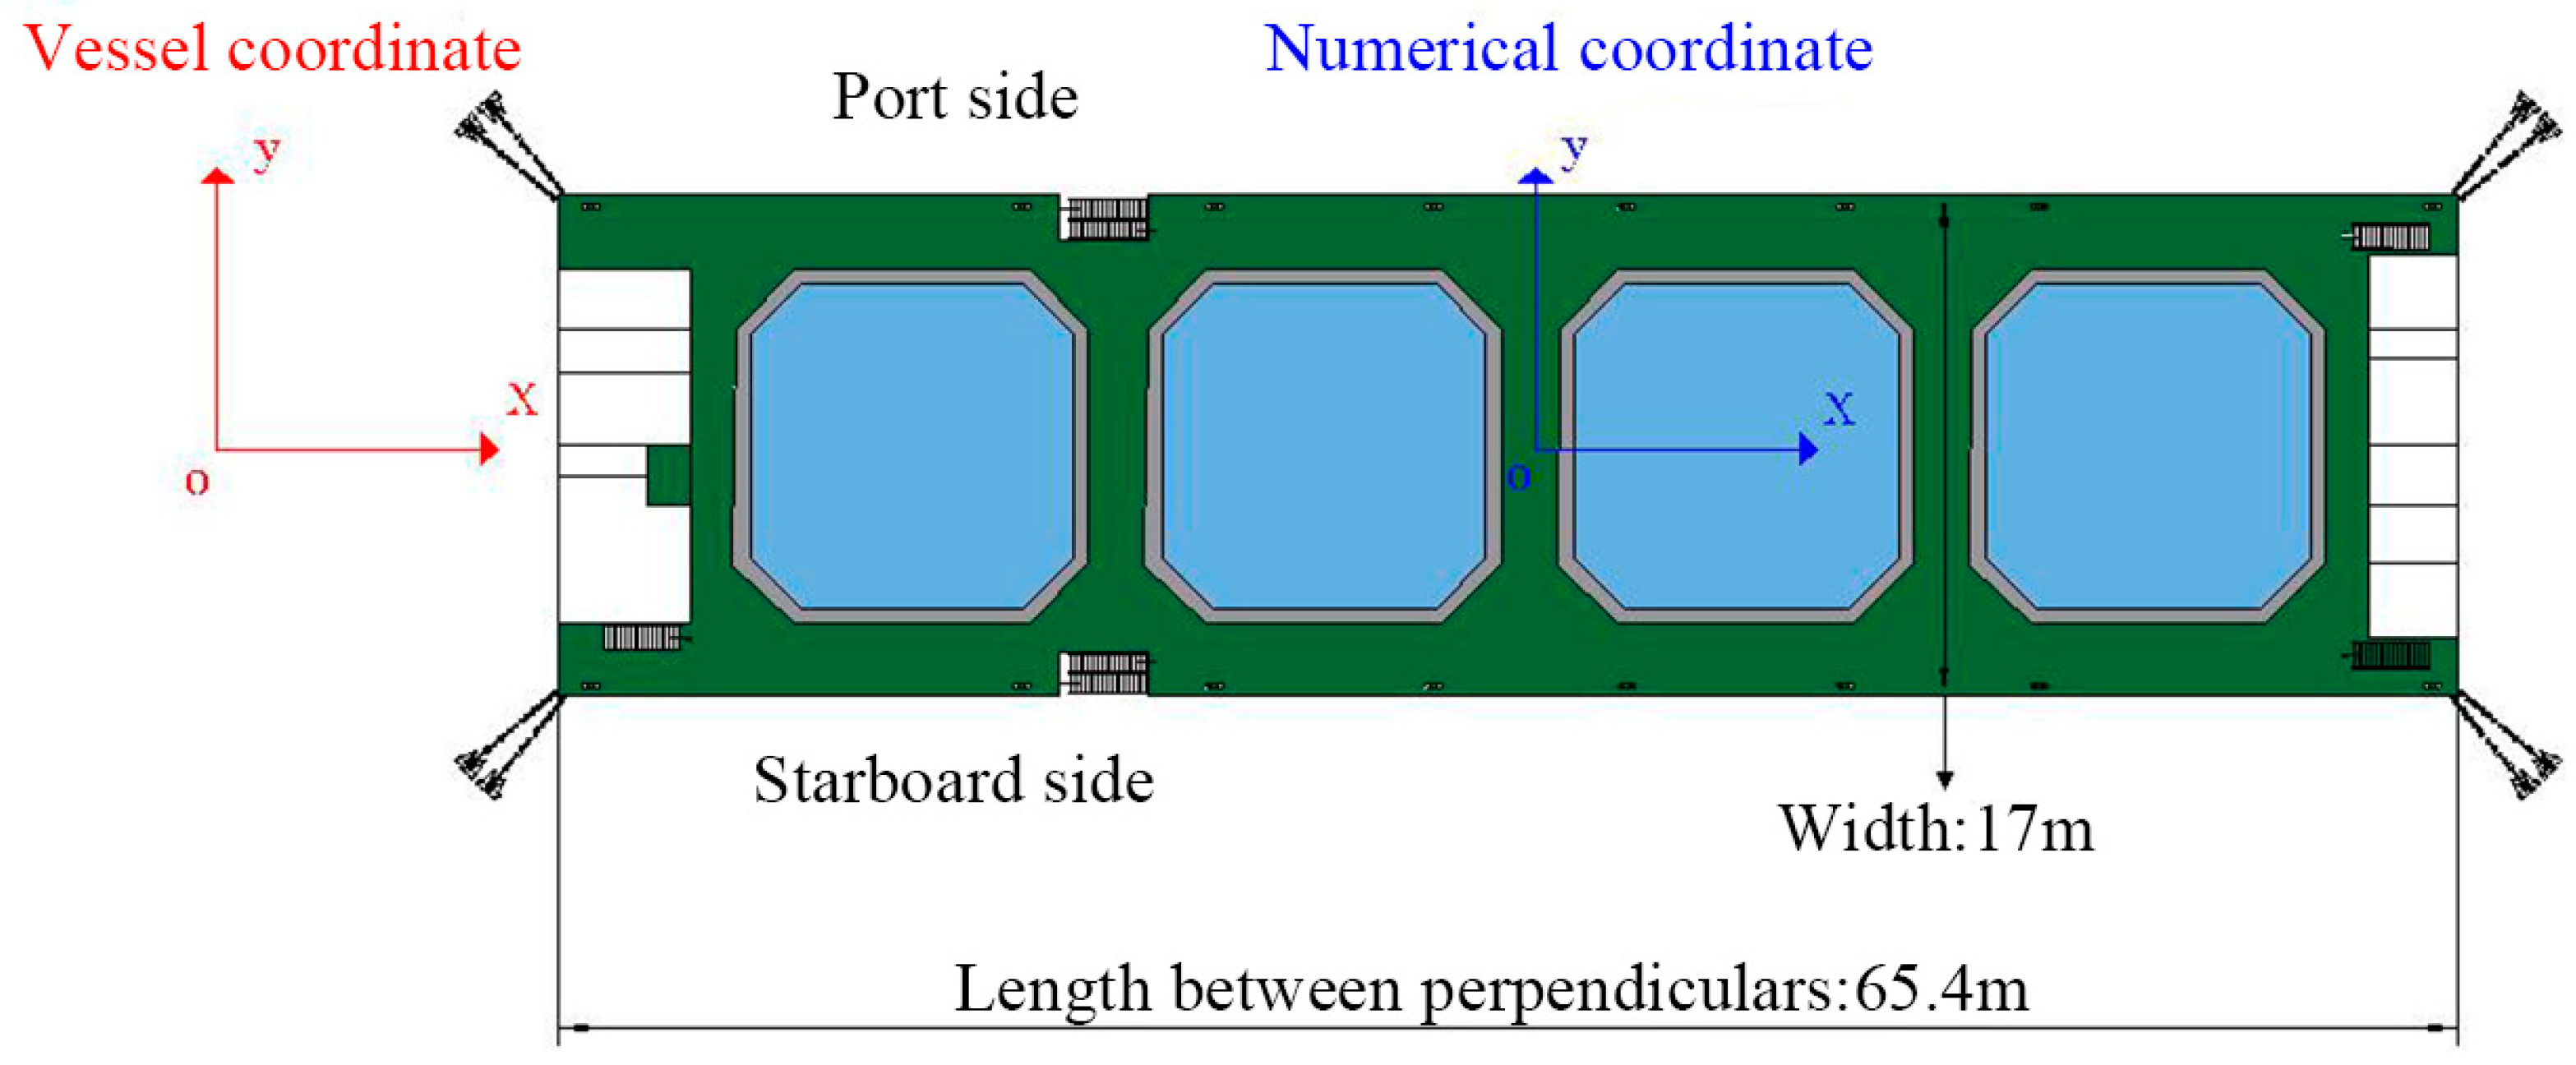
2.1. Study Objects and Numerical Model Setup

The 8000 t-class aquaculture vessel studied is shown in Figure 1, with a length of 64.5 m, a beam of 17.0 m, a depth of 10.2 m, a draught of 7.7 m, a displacement of 8654.0 tonnes, a longitudinal centre of gravity of 32.3 m, a transverse centre of gravity of 0 m, a vertical centre of gravity of 4.7 m, a rolling radius of 5.7 m, a pitching radius of 20.6 m, and a yawing radius of 20.9 m. Each tank was 12.0 m long, 12.0 m wide, and 9.75 m high, and the volume of the water body in the tank at the highest liquid level was 1190 m3. The bottom surface of the tank was about 1.5 m from the ship’s baseline, the working liquid level was about 10.5 m high compared with the ship’s baseline, and the maximum depth of the water in the tank was 9 m. Each tank was equipped with 16 inlet ports and 1 outlet port, with the inlet ports located at the corners of the wall surface of the aquaculture tank and the outlet ports located in the central position of the tank bottom. The inlet was located at the corner of the wall of the culture tank, and the outlet was located at the centre of the bottom. The inlets and outlets of the tanks were flow-controlled, but different tank types inevitably lead to changes in the volume of the water in the tanks. In order to ensure the one-way analysis of the corner ratio, the water in the tanks was always changed 16 times per day in this study.

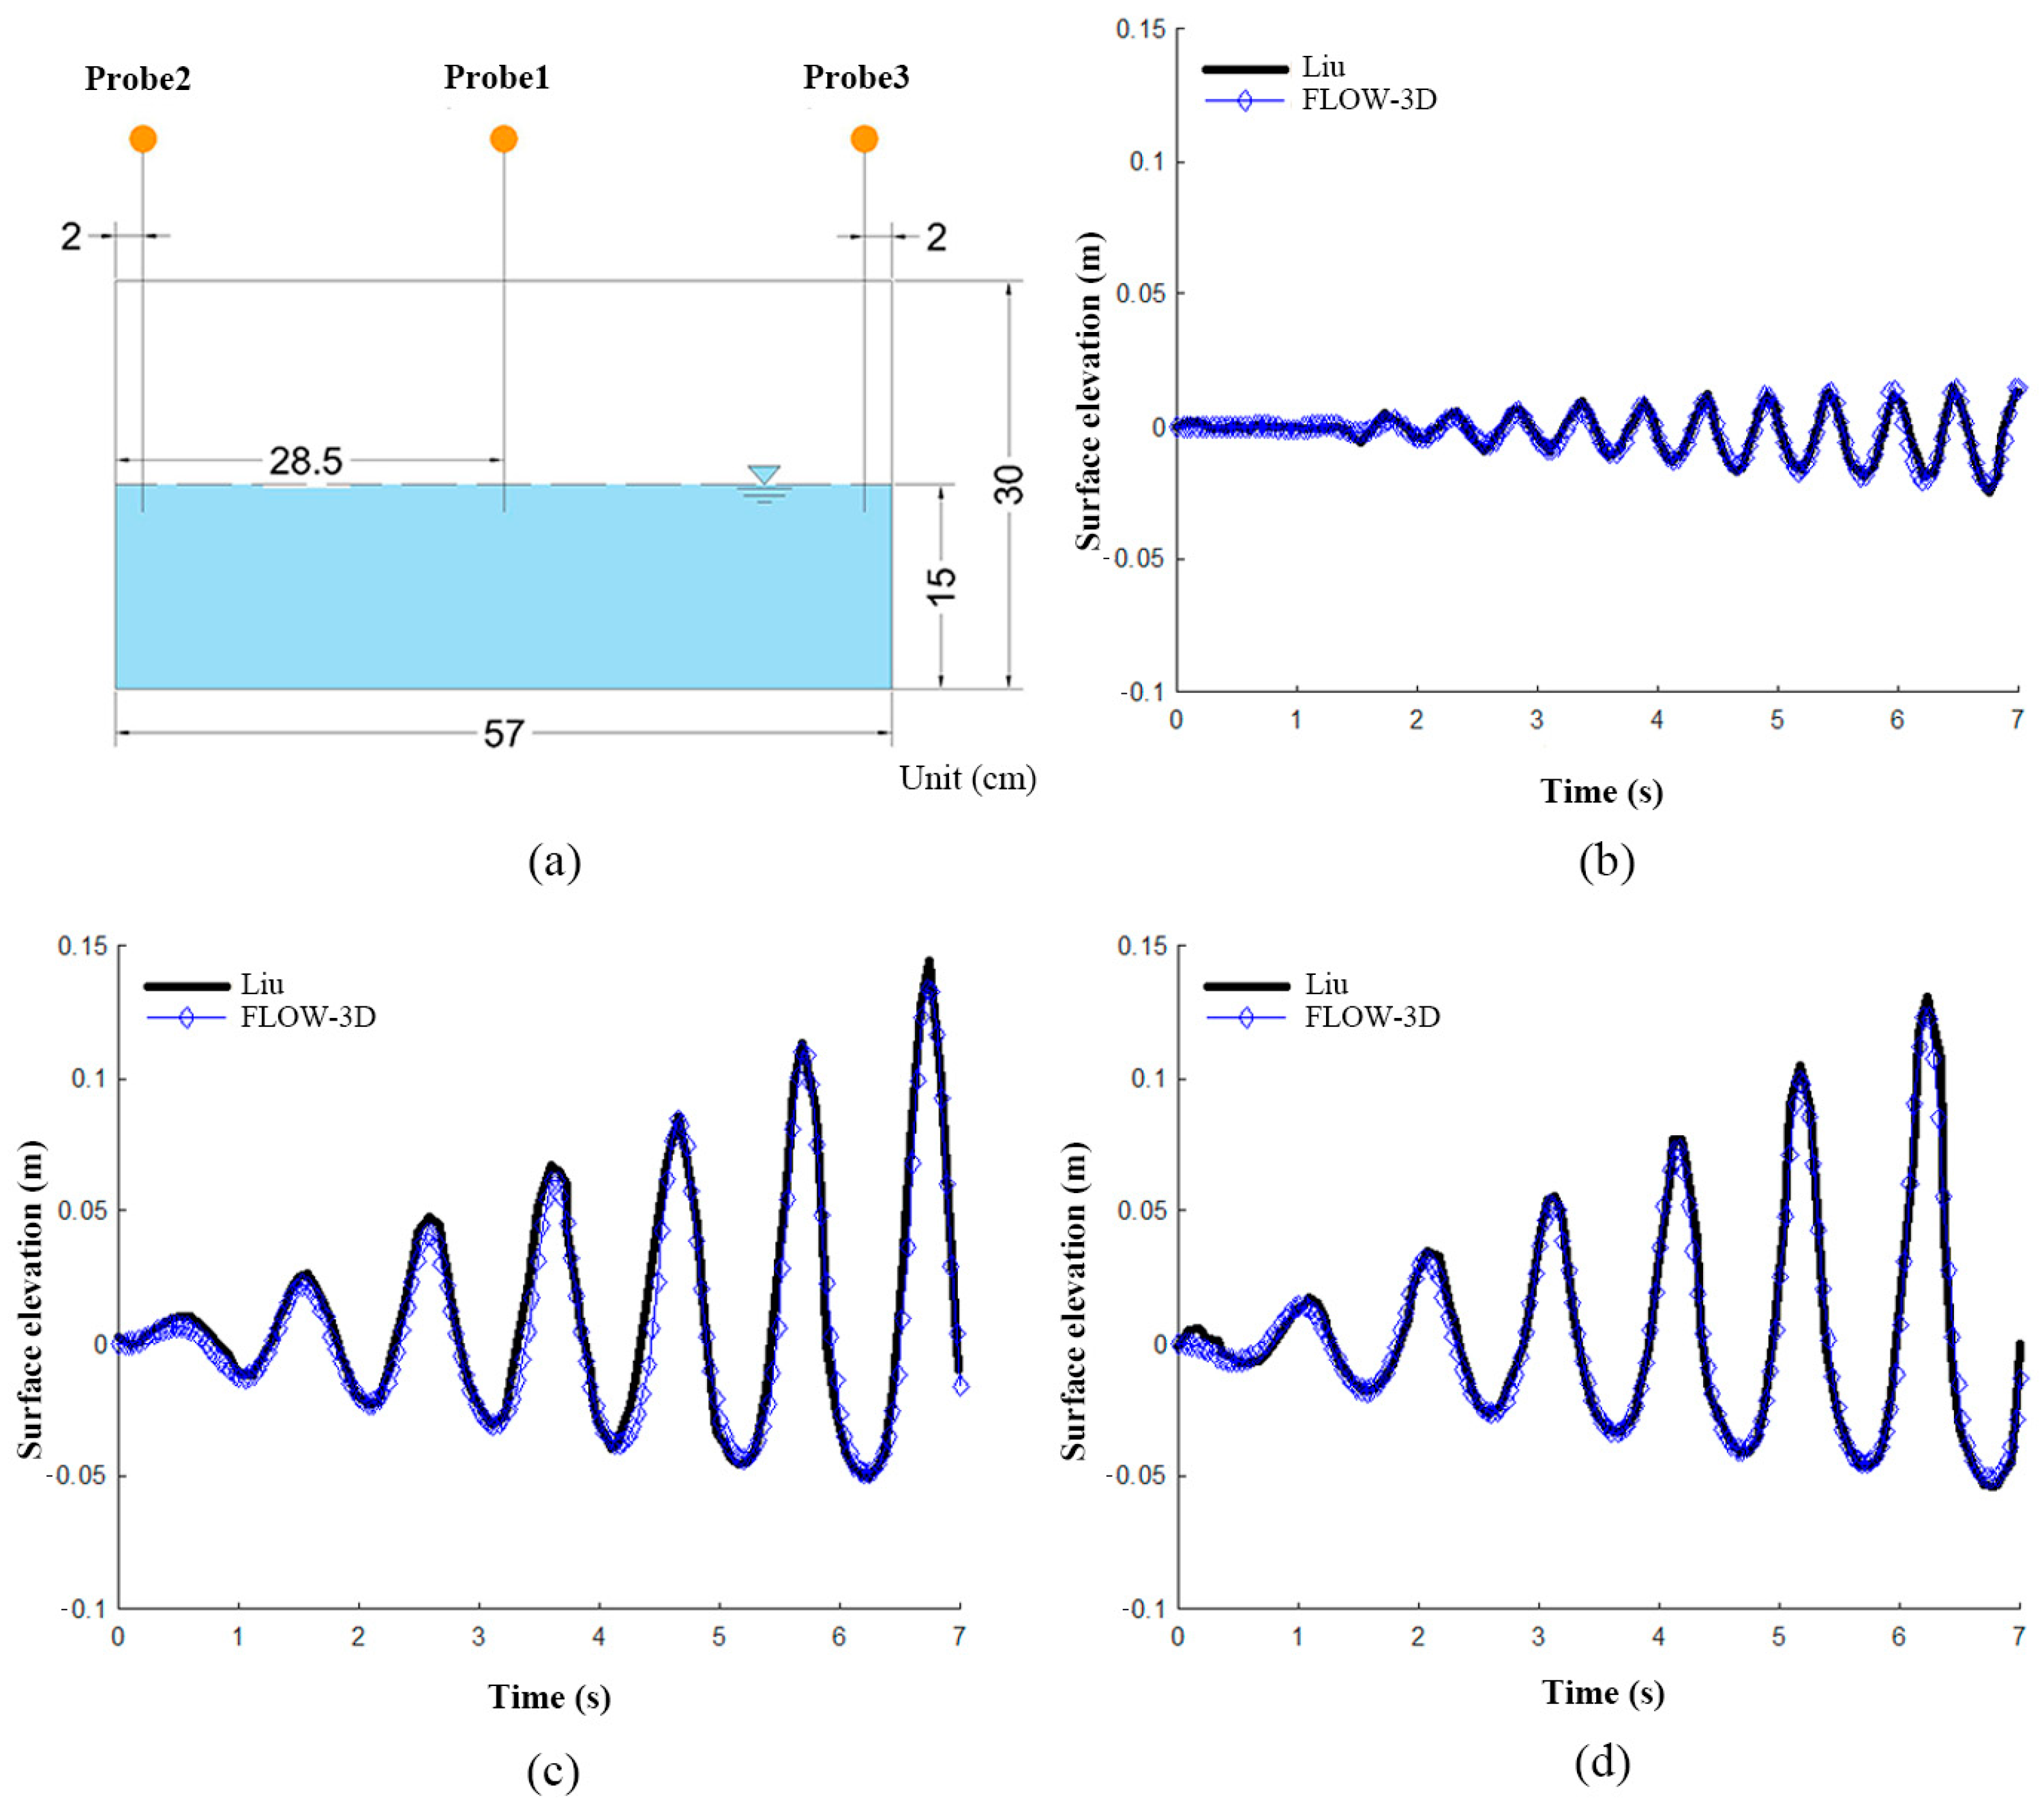
2.2. Model Construction

In this study, the water body in the aquaculture vessel was a three-dimensional incompressible fluid, and the continuity equation of the control equation is
u i x i = 0
The momentum equation is
u t + 1 V F u A x u x + v A y u y + w A z u z = 1 ρ p x + G x + f x R S O R ρ V F u u s v t + 1 V F u A x v x + v A y v y + w A z v z = 1 ρ p y + G y + f y R S O R ρ V F v v s w t + 1 V F u A x w x + v A y w y + w A z w z = 1 ρ p z + G z + f z R S O R ρ V F w w s
where ( u , v , w ) are the velocity components in the coordinate directions ( x , y , z ), respectively; ( A x , A y , A z ) are the fractional area open to flow in each coordinate direction; ( G x , G y , G z ) and ( f x , f y , f z ) are the body accelerations and the vicious accelerations, respectively; ( u s , v s , w s ) are the velocity components of the fluid from the surface of a source, where the shape and the normal direction of such surface can be arbitrary, and each velocity component is estimated according to the normal direction of the source surface; V F is the fractional volume open to flow; R S O R is the mass momentum source; ρ is the fluid density; and p is the pressure.
The turbulence model was the RNG K- ε turbulence model, which has a wider range of applicability and is better able to simulate rotating flows [27].
k T t + 1 V F u A x k T x + v A y k T y + w A z k T z = P T + D k T ε T
ε T t + 1 V F u A x ε T x + v A y ε T y + w A z ε T z = c 1 P T ε T k T + D ε T c 2 ε T 2 k T
where KT and PT are the turbulent kinetic energy and its generating term; ε T is the turbulent dissipation rate; D k T and D ε T are the turbulent kinetic energy diffusion term and the turbulent dissipation diffusion term, respectively; VF is the fractional volume; t is the time; and C1 and C2 are the coefficient constants, with C1 = 1.44 and C2 = 1.92 in the classical K- ε turbulence model.
To ensure the validity of the numerical model, the results obtained from the numerical model were compared with the experimental data of Liu [28]. Comparing the numerical simulation results with Liu’s experimental results, the two sets of results have good consistency, indicating that the numerical model developed in this study is correct, and its application to the simulation of the flow field in the aquaculture vessel’s tanks is feasible. The results of the numerical model validation are shown in Figure 2. In order to verify the influence of the number of model grids on the computational accuracy, a 7 s transverse rocking period and a 5° transverse rocking angle were used to verify the convergence of the grids. A uniform grid was used, and the grid was encrypted at the inlet and outlet of the ship, with sizes of 0.1 m, 0.15 m, and 0.4 m, respectively. The total number of grids was 28,000, 430,000, and 1,420,000, respectively, and the computational length was 1500 s. The velocity amplitude of the 0.1 m grid was calculated for the 0.1 s grid size. Taking the velocity amplitude calculated for the 0.1 m grid size as the reference, the velocity amplitudes for the 0.15 m and 0.4 m grids were 99.8% and 96.0%, respectively. Taking 98% as the convergence criterion and considering the calculation accuracy and efficiency, the following calculations were performed with a 0.15 m grid resolution.
The numerical simulation in this study was completed using the CFD software FLOW-3D, the solver version is 11.2.0.16. In the FLOW-3D software, the computational domain of the water body was realised by the Geometry module, and the model type was “Complement”. The mesh structure adopted a 0.15 m uniform mesh, and a 0.05 m mesh was encrypted at the inlet and outlet. The grid structure was a 0.15 m uniform grid, and a 0.05 m grid was encrypted at the inlet and outlet. The fluid was 20 °C water. The boundary condition of the solid–liquid coupling interface of the tank was set as a no-slip boundary (wall). The boundary conditions of the gas–liquid coupling interface were set as the atmospheric pressure with a fluid fraction of 0. The inlet and outlet water flow of the tank was realised using the inlet source of the mass momentum source; the generation of particles was set as the generation of particle sources, with the particle sources at the corners of the tank. The z-axis height of the particle sources was higher than that of the water surface by 0.5 m. The rate of the generation of each particle source was 250 per second. The z-axis height of the particle sources was 0.5 m above the water surface. The rate of generation of each particle source was 250 particles per second, and the four particle sources generated 5000 particles in 5 s. The numerical model was based on the Cartesian grid coordinate system, and the area and volume porosity functions were used to analytically calculate the area boundary and type, called the FAVOR method (fractional area–volume obstacle representation method) [29].

2.3. Experimental Group

In this study, based on the model scale setting of the culture tank, the number of daily water changes was fixed, and numerical simulation calculations were conducted for different working conditions to analyse the influence of the corner ratio on the characteristics of the flow field in the tank. Figure 3 shows the schematic diagrams of different corner ratios. The selection of corner ratios was based on the width of the tank of 12 m, and the ratio of the corner distance of the aquaculture tank to the half-length of the tank was defined as the corner ratio C. The grouping of the numerical conditions of the aquaculture tank is shown in Table 1.

2.4. Data Processing

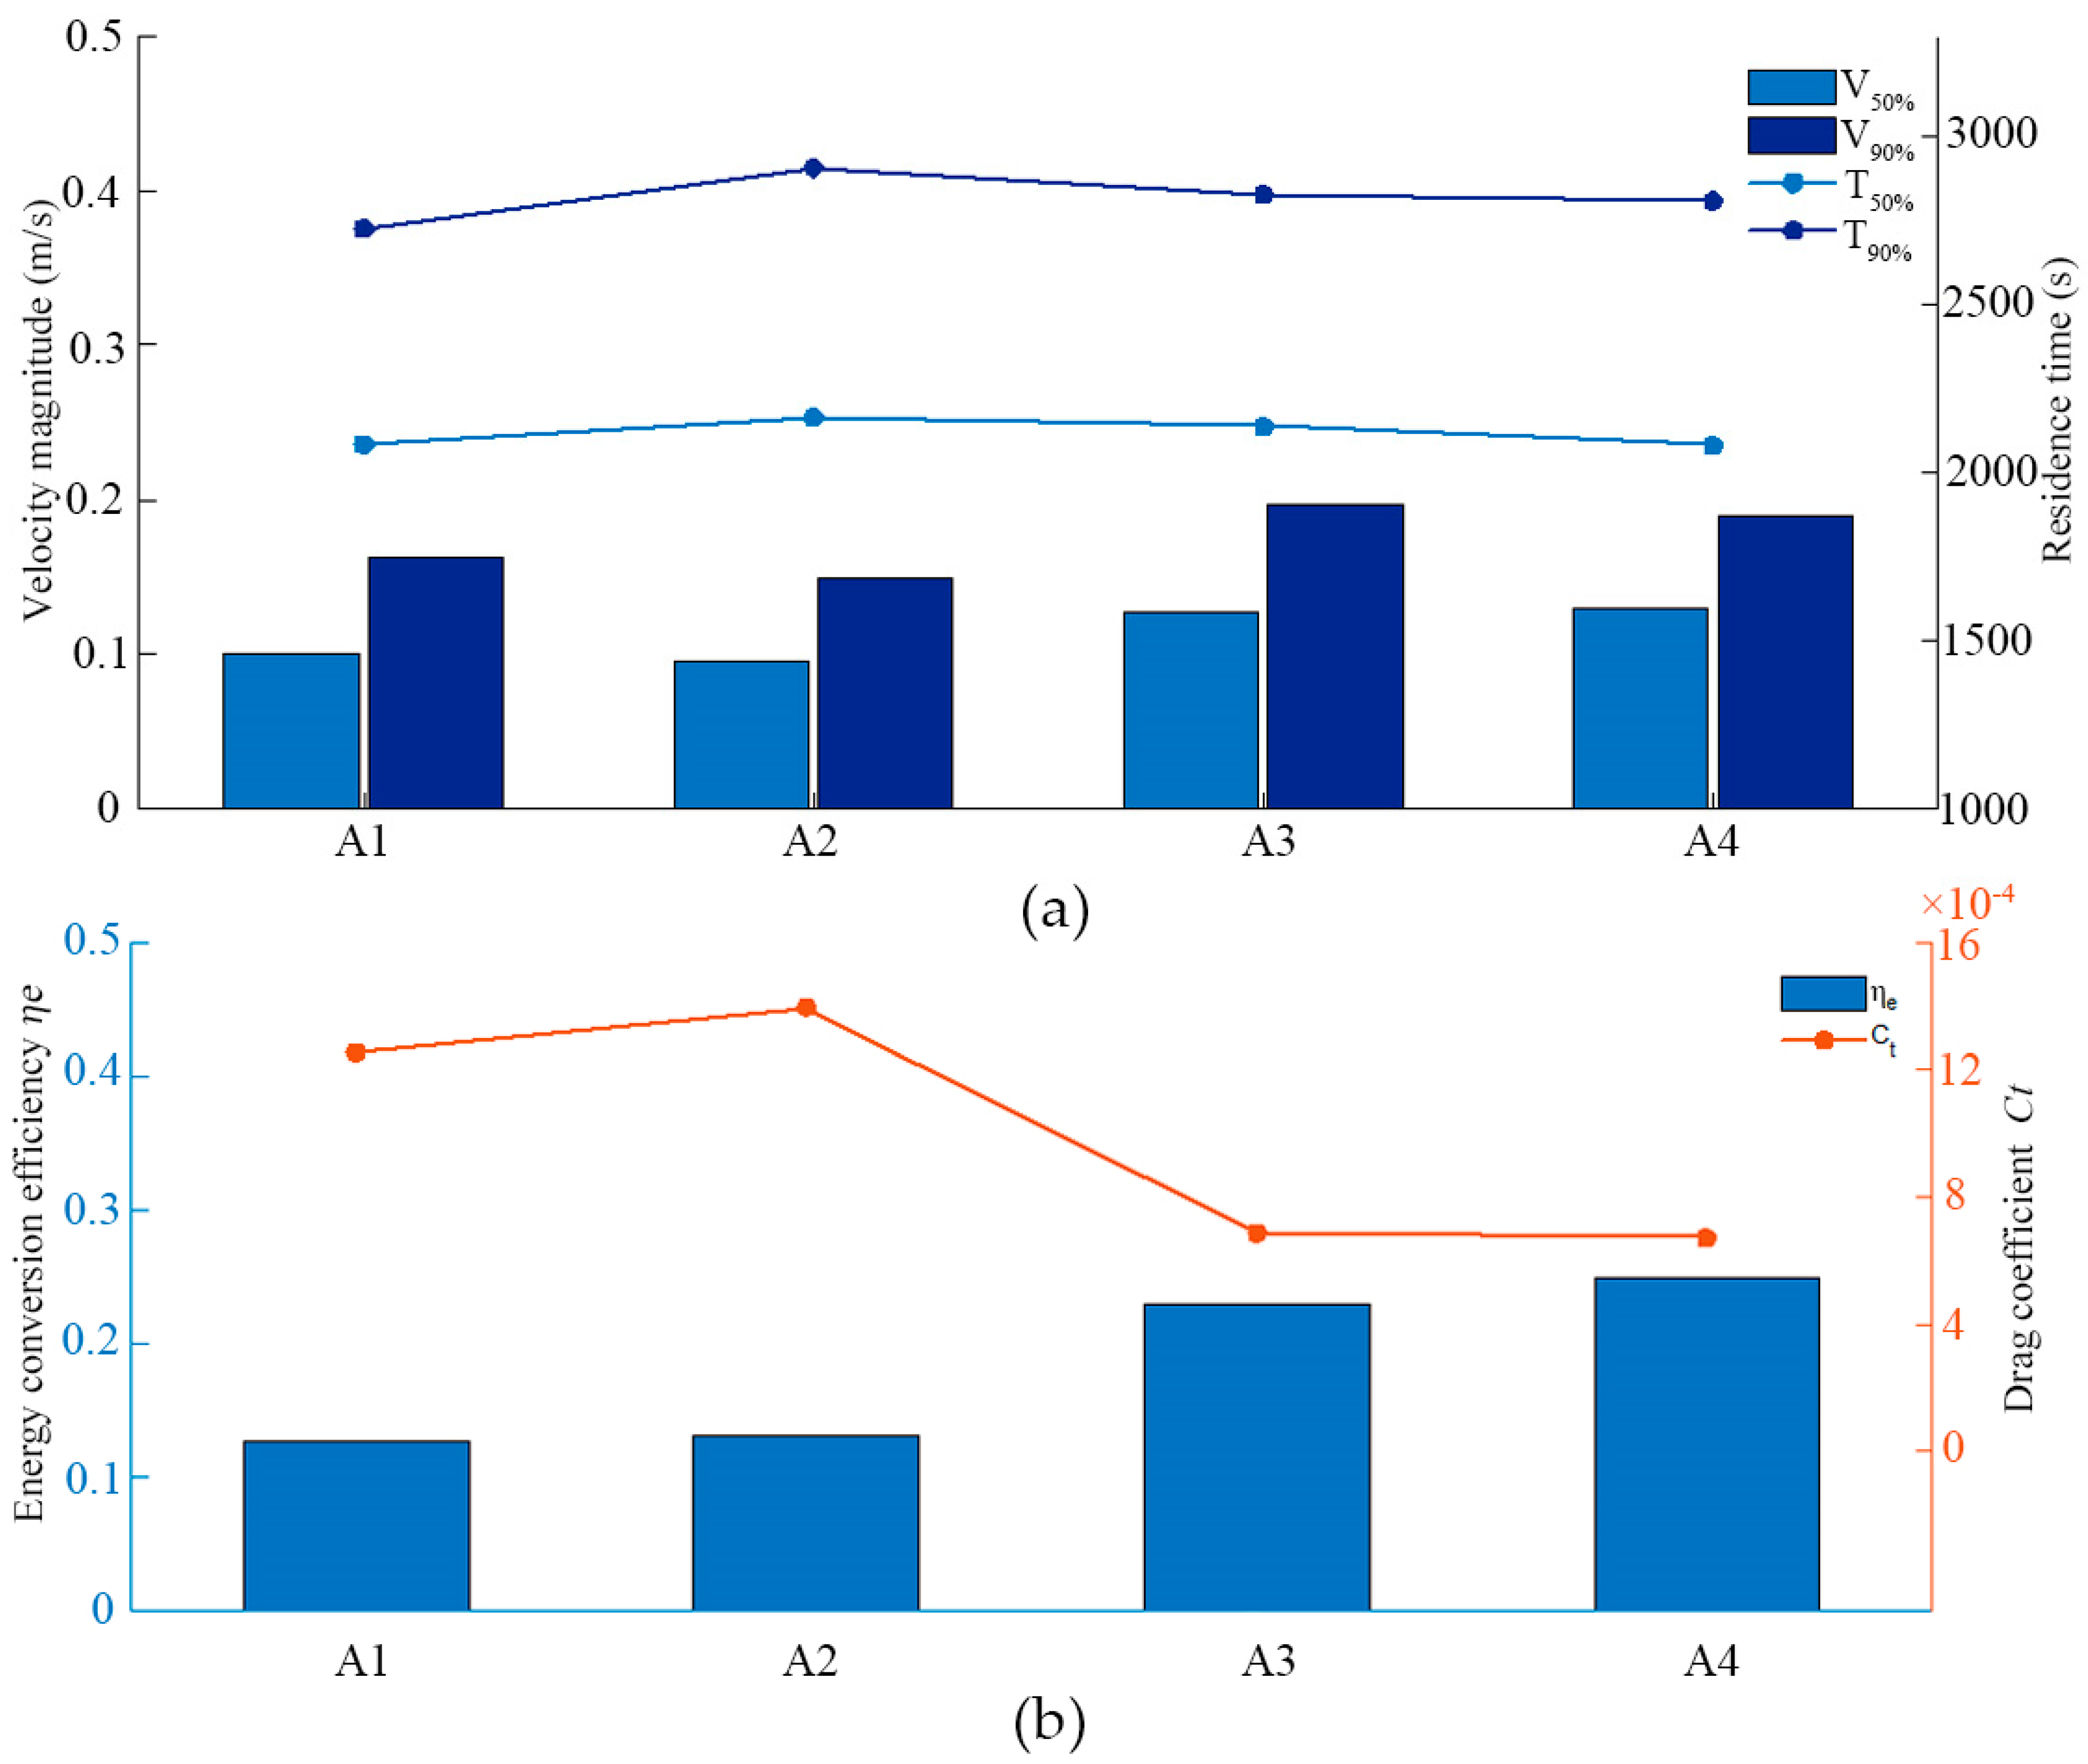
2.4.1. Drag Coefficient Ct

Oca et al. [18] defined the drag coefficient Ct as the energy consumed by a tank to overcome the drag that is equal to the energy supplied by the inlet impact force for a tank system operating in a steady-state flow field condition. The formula is as follows:
C t = 2 Q ( V i n V a v g ) A V a v g 2
where Q is the inlet flow rate, V i n is the inlet velocity, V avg is the average velocity in the pool, and A is the wet week.

2.4.2. Energy Use Efficiency η e

The energy of the water-body circulation motion is mainly provided by the inlet jet, and the energy loss mainly comes from overcoming the resistance of the breeding pool and the viscous resistance of the relative motion between the water-body mass points. Evaluating the energy conversion in the tank at different corner ratios, the change in the energy use efficiency η e was analysed [30], and the energy use efficiency η e was calculated as follows:
η e = D U 50 ( V a v g V i n ) 2
where D U 50 [31] is calculated by the formula
D U 50 = V 50 V a v g
where V50 is the average of 50 percent of the lower velocities in the breeding tank, V avg is the average velocity in the tank, and V in is the inlet velocity.

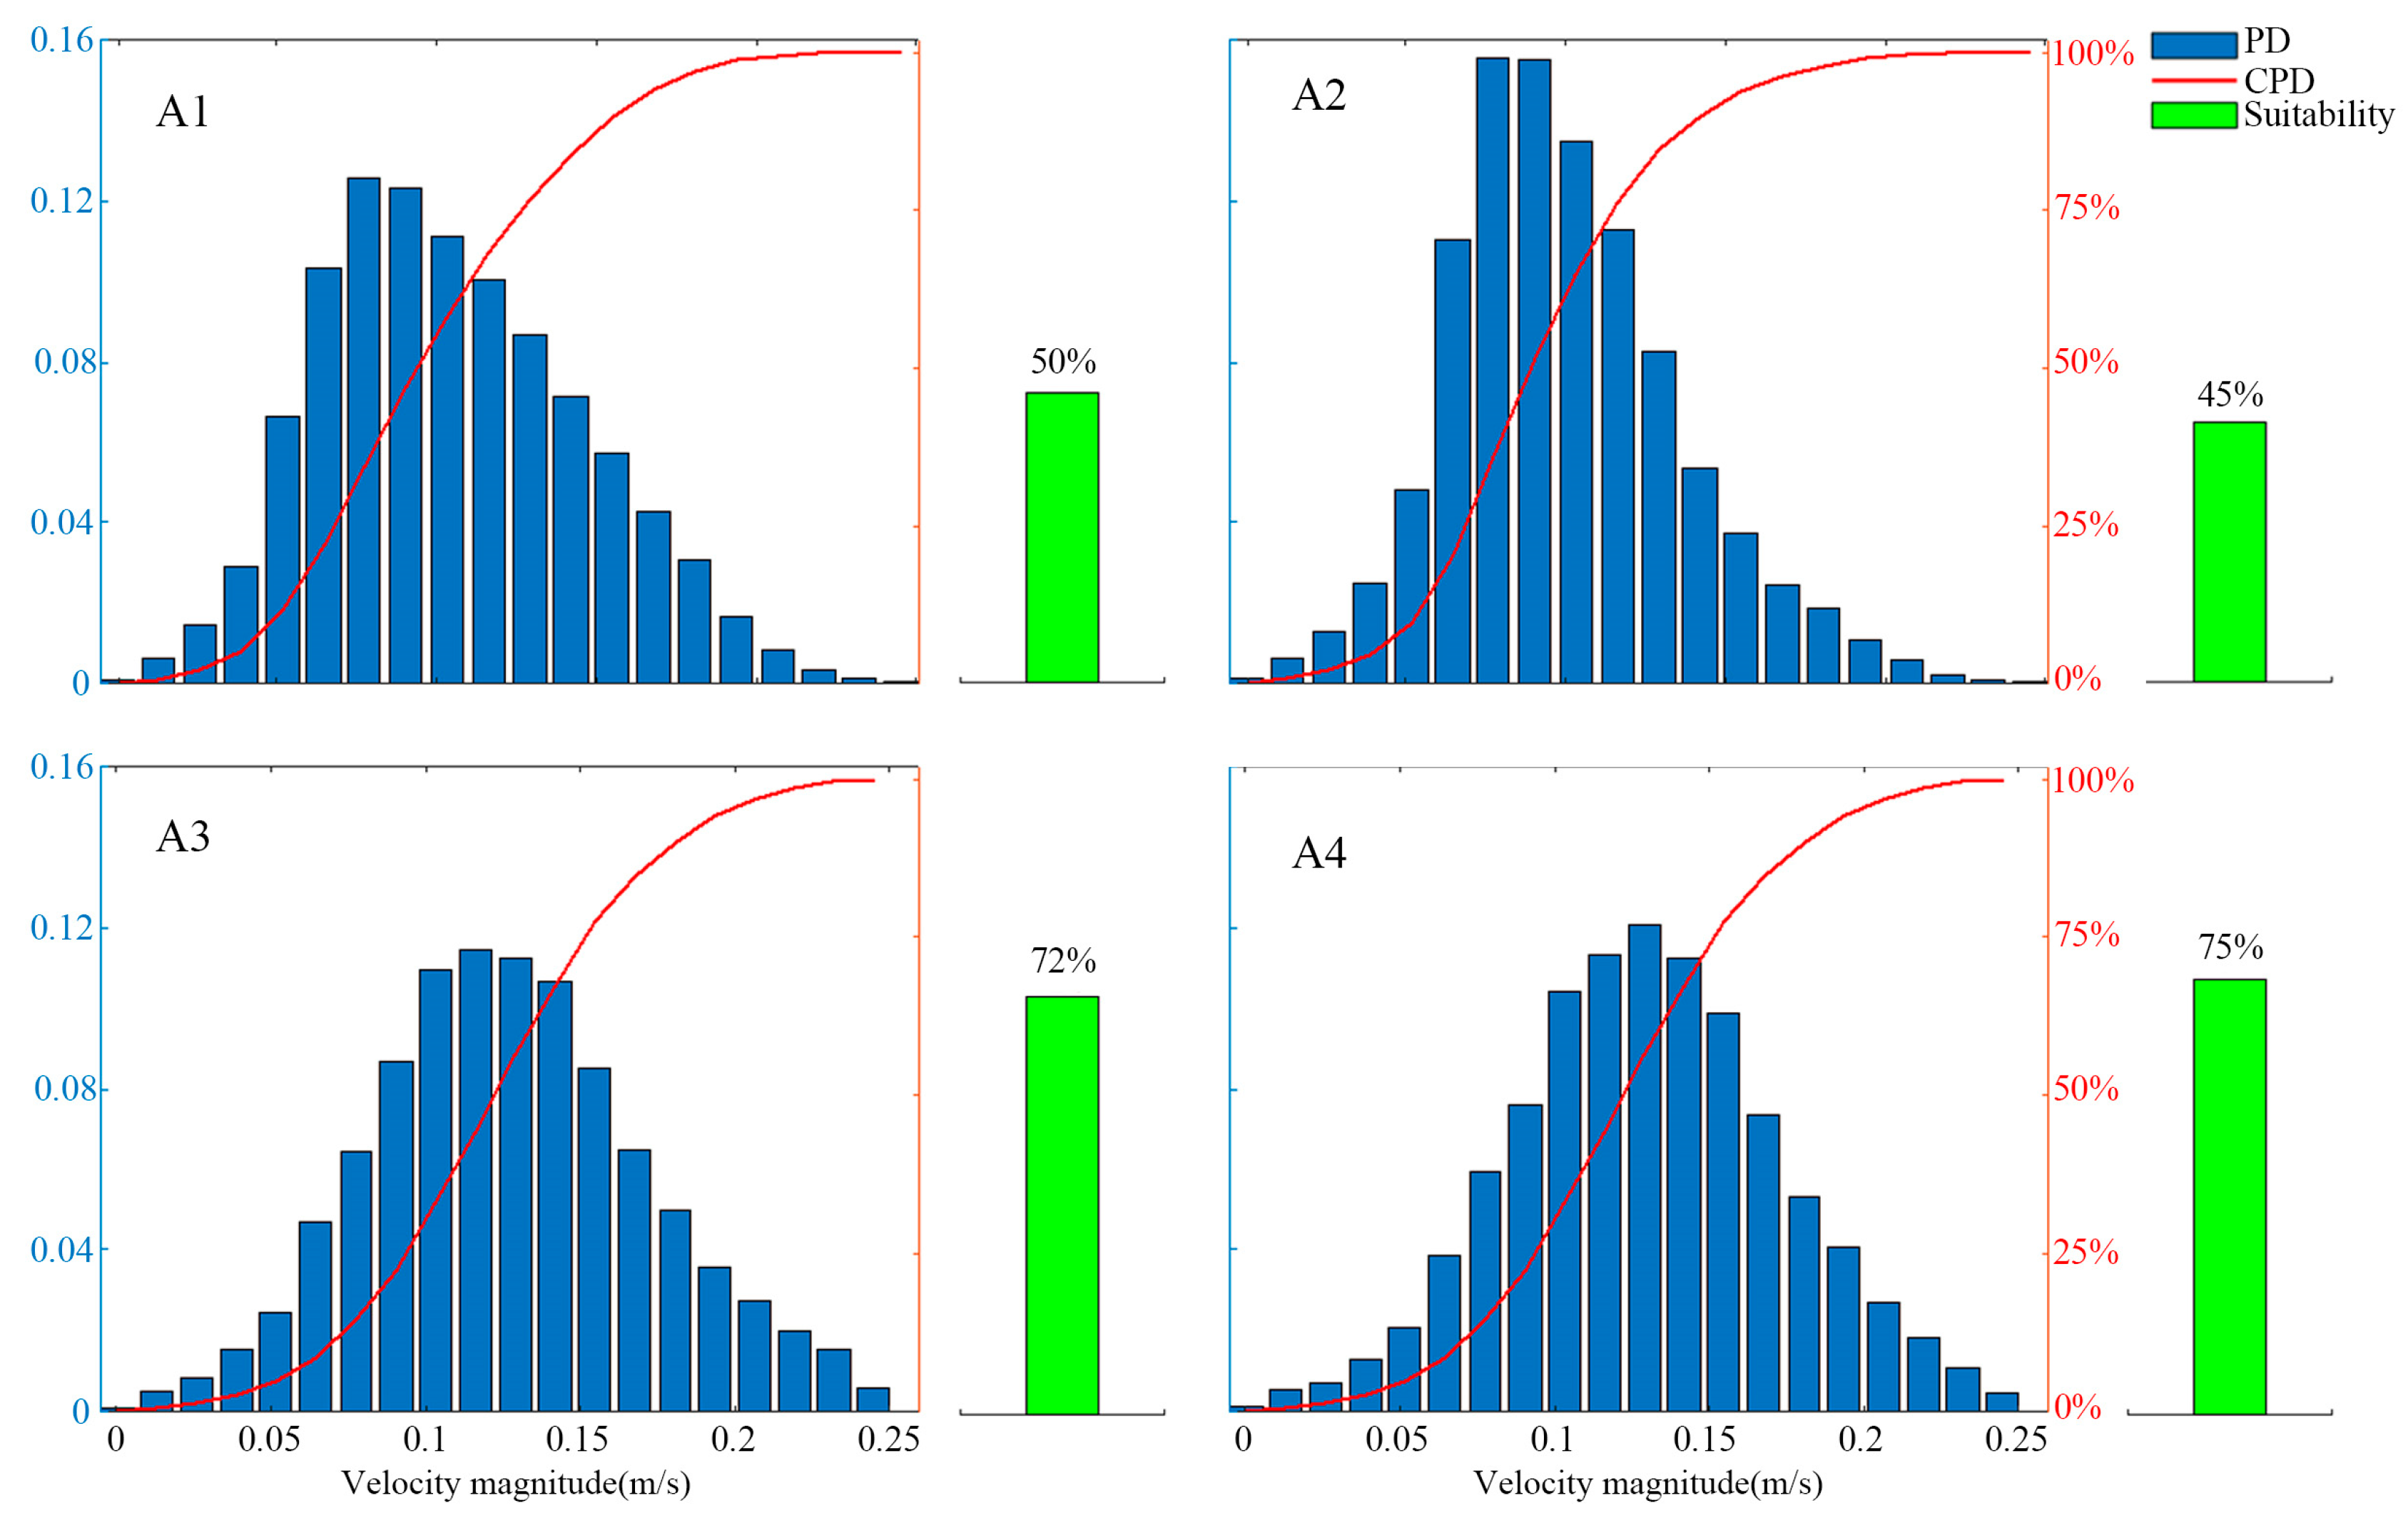
2.4.3. Percentage of Areas with Suitable Flow Rates

The size of the flow velocity in the aquaculture water environment has an important effect on the growth of fish and the discharge of particles, such as residual feed and faeces, to the environment [22,32,33]. The movement forced by the flow velocity can improve the muscle tone of cultured fish, which, in turn, improves the survival rate of the fish species after release [14]. However, too low a flow rate can lead to a significant decrease in the growth performance of cultured fish [33], while too high a flow rate can cause cultured fish to lose their swimming ability and even lead to fish death [34]. Many scholars have studied the appropriate flow rate for fish and found that the fishable flow rate is related to its body length (hereafter, “bl”) [34], which is usually the distance from the end of the muzzle to the base of the caudal fin. Wang et al. investigated the growth performance of juvenile Hsu’s flatfish at different flow rates and found that the growth performance of Hsu’s flatfish was significantly improved in the 1.5 bl/s flow rate group compared with the 0 bl/s and 0.5 bl/s flow rate groups [33]. Timmerhaus et al. studied the effects of different flow rates (0.5, 1.0, 1.8, and 2.5 bl/s) on the growth and muscle development of juvenile Atlantic salmon (Salmo salar) and found that the growth rate increased with an increase in the flow rate, but when the flow rate was greater than 1.8 bl/s, the number of inflamed muscle fibres, gill lesions, and fin lesions increased significantly. The upper limit of the fishable flow rate was related to the bl of cultured fish and varied between species [34].
At present, in aquaculture vessel production, we generally select fry with a body length of about 0.1 m to start aquaculture and salvage and sell the fish when they grow to about 0.5 m in body length. We took the flow velocity of the tank for 1 bl fish as a reference, i.e., when the flow velocity V is controlled at 0.1 m/s–0.5 m/s, the effect of the flow velocity on the fish is relatively small; therefore, in this study, we set the fishery-suitable flow velocity at 0.1 m/s < V < 0.5 m/s, the flow velocity V in the range of 0.1 m/s, and the proportion S of the fish-suitable flow velocity in the outboard chamber to 0.5 m/s (V < 0.5 m/s). The ratio of the number of grids in the range of 0.1 m/s and 0.5 m/s to the overall number of grids was taken as the proportion of the fishable flow velocity in the tank S. The formula for calculating the proportion of the fishable flow velocity S is as follows:
S = n ( 0.1 0.5 ) n t
where nt is the number of grids in the tank, and n ( 0.1 0.5 ) is the number of tanks with flow velocities V in the range of 0.1 m/s–0.5 m/s.
The flow field characteristics extracted by the RAS system are usually limited to a certain point and cross-section velocity. Compared with the RAS system, the size of an aquaculture tank in an aquaculture vessel is large, and the variation in the flow velocity data at individual points, lines, or planes in the flow field of the aquaculture tank cannot completely reflect the characteristics of the whole flow field. Therefore, in order to analyse the distribution characteristics of the flow velocity (V) in the tank more comprehensively, probability density (PD) and cumulative probability density (CPD) were used for statistical analysis in this study. By plotting CPD curves with variations in the flow velocity (V), the distribution of the flow velocity in the whole flow field of the tank can be more comprehensively investigated. In order to avoid the influence of the large flow velocity at the inlet and outlet on the overall data in the tank, the 99% quantile of the flow velocity data was used as the representative value of the maximum flow velocity. The maximum flow velocity in the tank was defined as the 99% quantile of the flow velocity data, denoted as V99%. In this study, the processing of data was performed using MATLAB R2021a.

3. Results and Discussion

3.1. Effect of Corner Ratio on the Percentage of Areas with Fishable Flow Rates

In order to analyse the effect of the ratio of the corner on the flow field in the tank, the flow field in the tank was numerically calculated for four working conditions, namely, C = 0, C = 0.26, C = 0.33, and C = 0.40. Figure 4 shows the distribution of the V99% flow velocity under different proportions of corners. As shown in Figure 4, the proportion of the corner has a significant effect on the distribution of the flow velocity in the tank. The flow velocity in the tank increases with the increase in the corner of the tank, and the average velocity of the four conditions shows a significant upward trend. For conditions A1 and A2, i.e., when the diameter-to-depth ratios are C = 0 and C = 0.26, the low-velocity area of the flow velocity in the tank (the area where the flow velocity is less than 0.1 m/s) is higher, the quality of the flow field in the tank is relatively low, and the flow velocity area that can satisfy the requirements of fish culture is 50% and 45%, respectively. Compared with conditions A1 and A2, the low-velocity area of the flow velocity in the tank is significantly reduced in conditions A3 and A4, i.e., when the diameter-to-depth ratio C > 0.33. Compared with the A1 and A2 conditions, the A3 and A4 conditions, i.e., when the diameter-to-depth ratio C > 0.33, the low-velocity region of the flow velocity in the tank is significantly reduced, and the quality of the flow field in the tank is higher at this time. The percentage of the flow velocity region that can satisfy the requirements of fish culture (0.1 m/s < V < 0.5 m/s) is 72% and 75%, respectively. The maximum flow velocities, V90% and V50%, in the tanks with a corner design (e.g., with a corner ratio of 0.33:1) were significantly increased, which was consistent with the findings of Milad et al. in their CFD simulation of land-based tanks, and proved that the corner structure had a significant effect on the velocity of the flow field in the tanks [35].

3.2. Energy Transfer Impact

Figure 5 shows the variation in the flow velocity, residence time, drag coefficient, and energy conversion efficiency for different corner ratios. As shown in Figure 5a, the characteristic velocities obtained through statistical analysis are positively correlated with the corner ratio. An increase in the corner ratio leads to a decrease in the probability of a low flow velocity in the tank, and the velocity V90% increases from 0.16 m/s to 0.19 m/s, while the velocity V50% increases from 0.1 m/s to 0.13 m/s. In contrast, the water residence time is not sensitive to the corner ratio, as shown in Figure 5a. The residence time T90% increases slightly, the median residence time changes less, the residence time T90% increases from 2727 s to 2811 s, and the residence time V50% always fluctuates above and below 2100 s. As shown in Figure 5b, the drag coefficient Ct and the energy conversion efficiency in the tank increase and then decrease and finally increase with an increase in the corner ratio C of the tank. When the ratio C > 0.26 in the corner of the tank, the value of the drag coefficient Ct in the tank shows a significant decline, and the efficiency of the energy utilisation shows a significant growth trend.
In the A3 and A4 conditions, the wall surface of the culture tank with a tangent angle smoothly guides the incident water movement trajectory to steer, which slows down the impact of the incident water flow. The energy loss caused by the water flow-steering process is changed into energy to maintain the movement of the water body, and the flow velocity in the tank is increased while the discharge capacity is enhanced. When the corner ratio C > 0.33, the effect of the corner ratio on the flow velocity and the proportion of the fishable area in the tank are small.

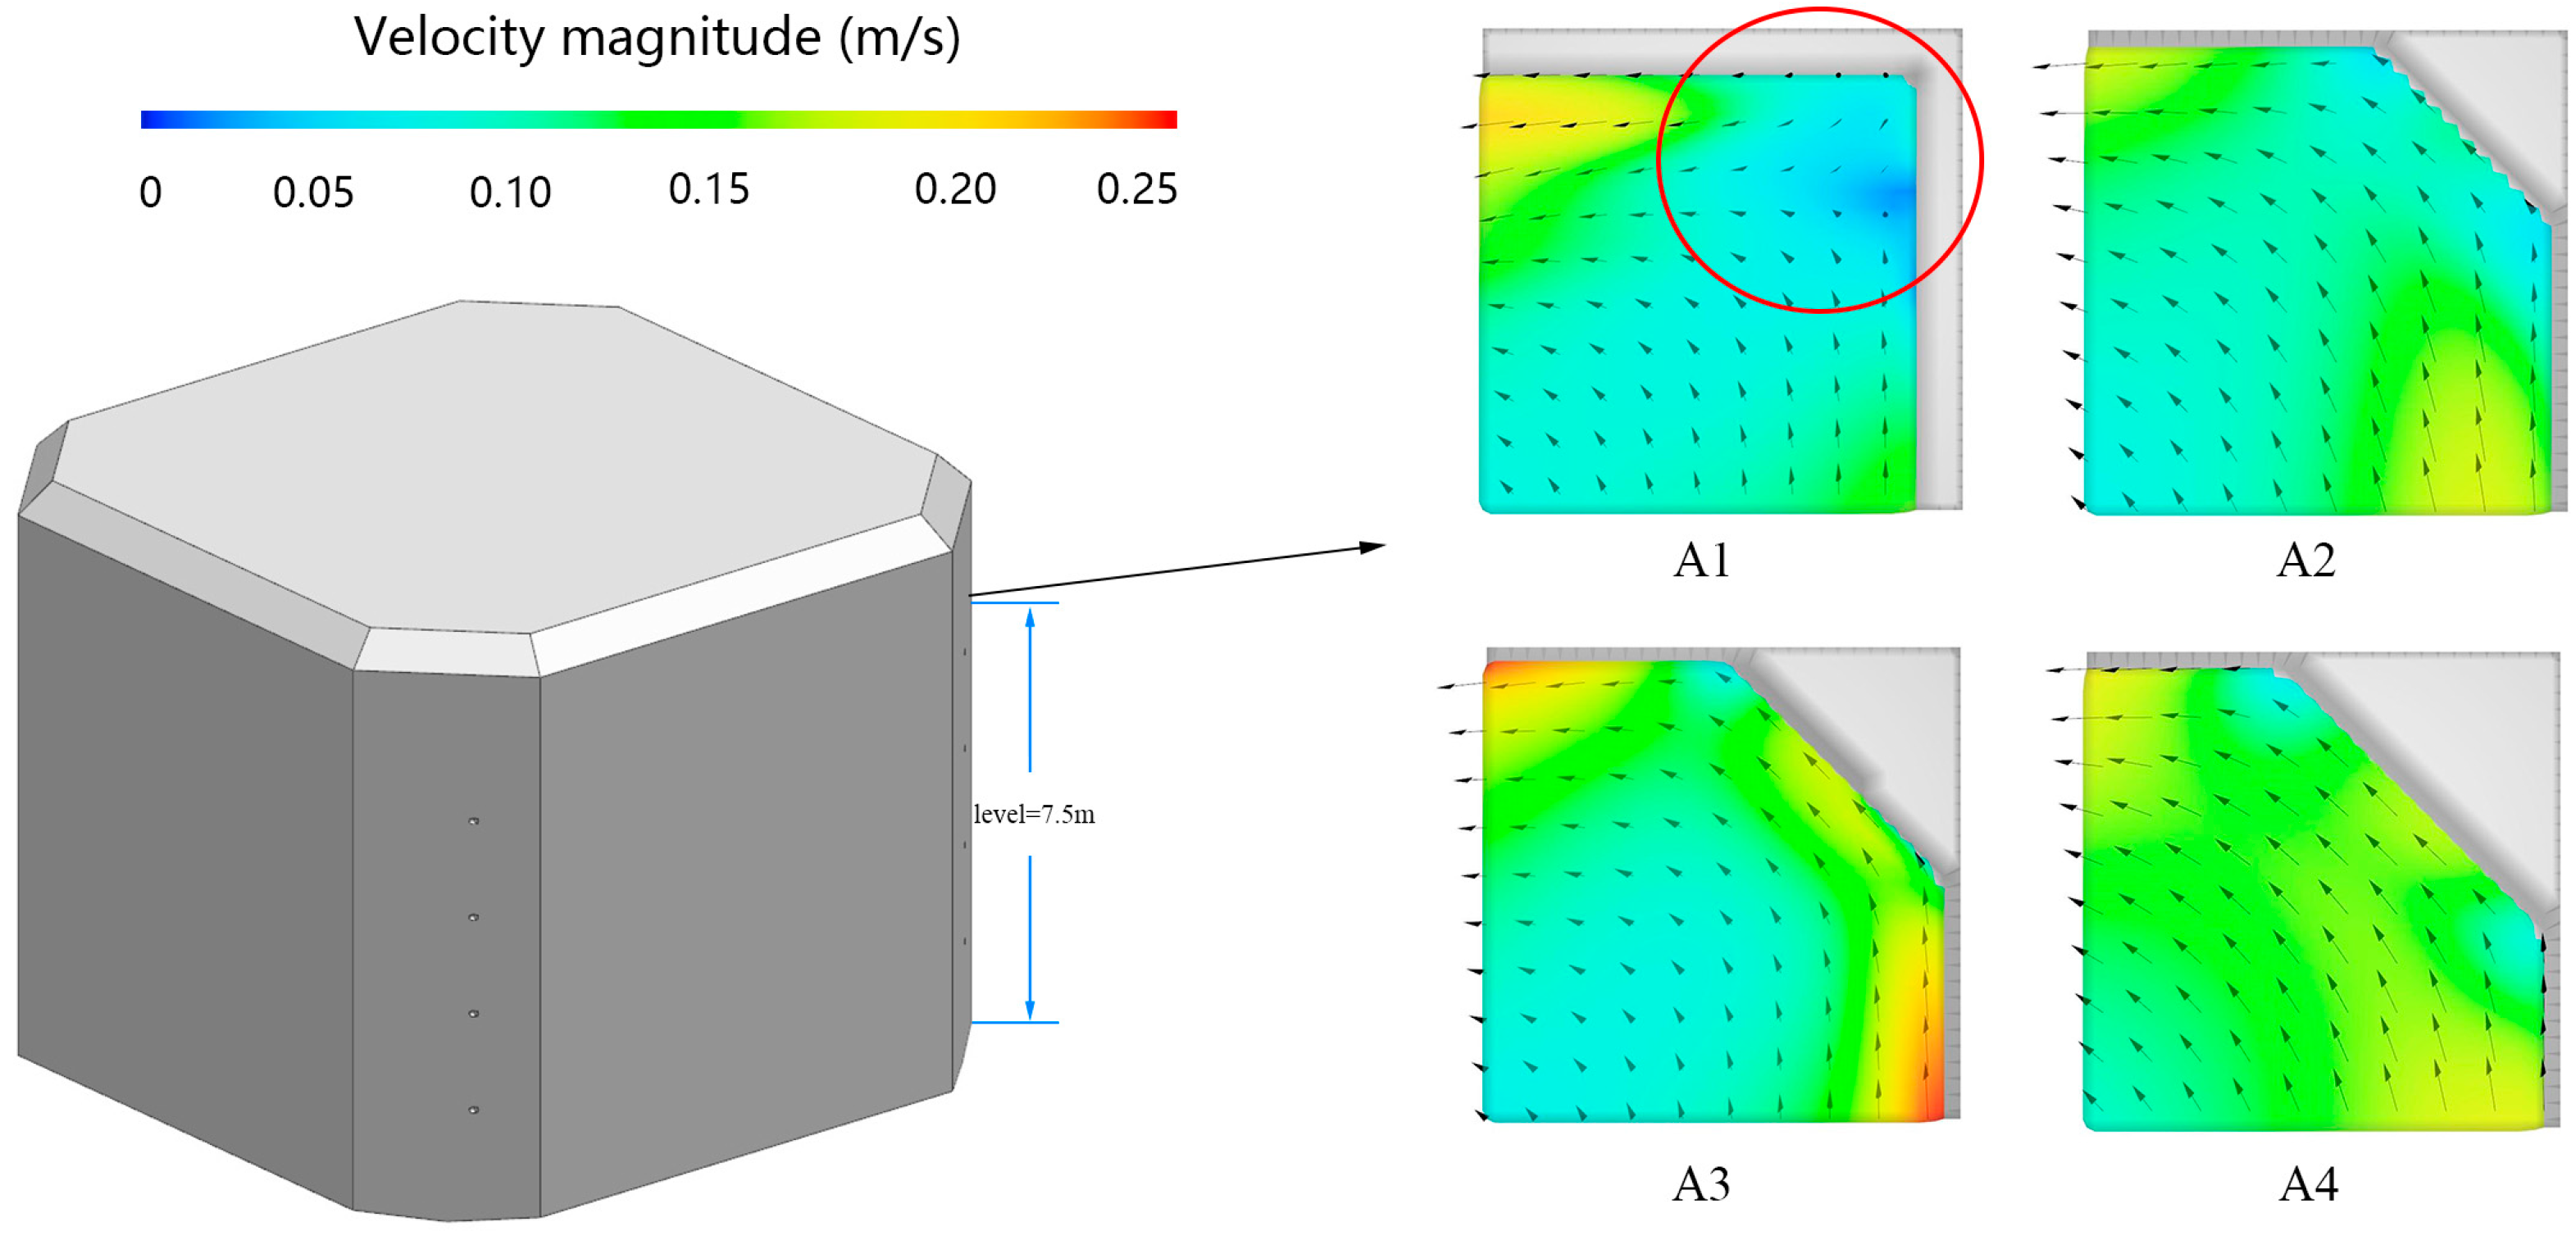
3.3. Local Vectors at Corners

Figure 6 shows the flow velocity distribution characteristics of the surface layer (Z = 7.5 m), middle layer (Z = 4.5 m), and bottom layer (Z = 0.5 m) profiles with four corner ratios. Overall, the water in the tank forms a counterclockwise-rotating flow under the inlet push current, and there is a low-flow velocity area in the centre of the tank. The magnitude of the flow velocity gradually increases from the vertical centre to the wall of the tank, and with the decrease in the liquid height, the flow velocity shows a decreasing trend. In the case of the square tanks, the corners of the tanks show a low flow velocity in the stagnant water area, and in the other three cases, no low-velocity area is found in the corners.
Figure 7 shows the flow velocity vector map at the corner. When the square culture tank without a corner or corner distance is small, the water body mass point movement regularity is poor, and the flow pattern is turbulent. With the increase in the corner distance of the square culture tank, the corner of the water flow guidance strengthens the role of the water body to reduce the water body mass point and the wall between the collision. The irregular collision between the water body mass point is also relatively reduced. The trajectory is gradually changed to the centre of the tank around the spinning flow, and the flow pattern is more stable. Its trajectory gradually changes to a rotating flow around the centre of the culture chamber, and the flow pattern is more stable. This proves that the corner structure can reduce the proportion of the low-speed zone in the tank, and the larger the distance between the corners of the square tank and the larger the distance between the corners, i.e., where the tank tends to be rounded, the better the tank’s velocity distribution.

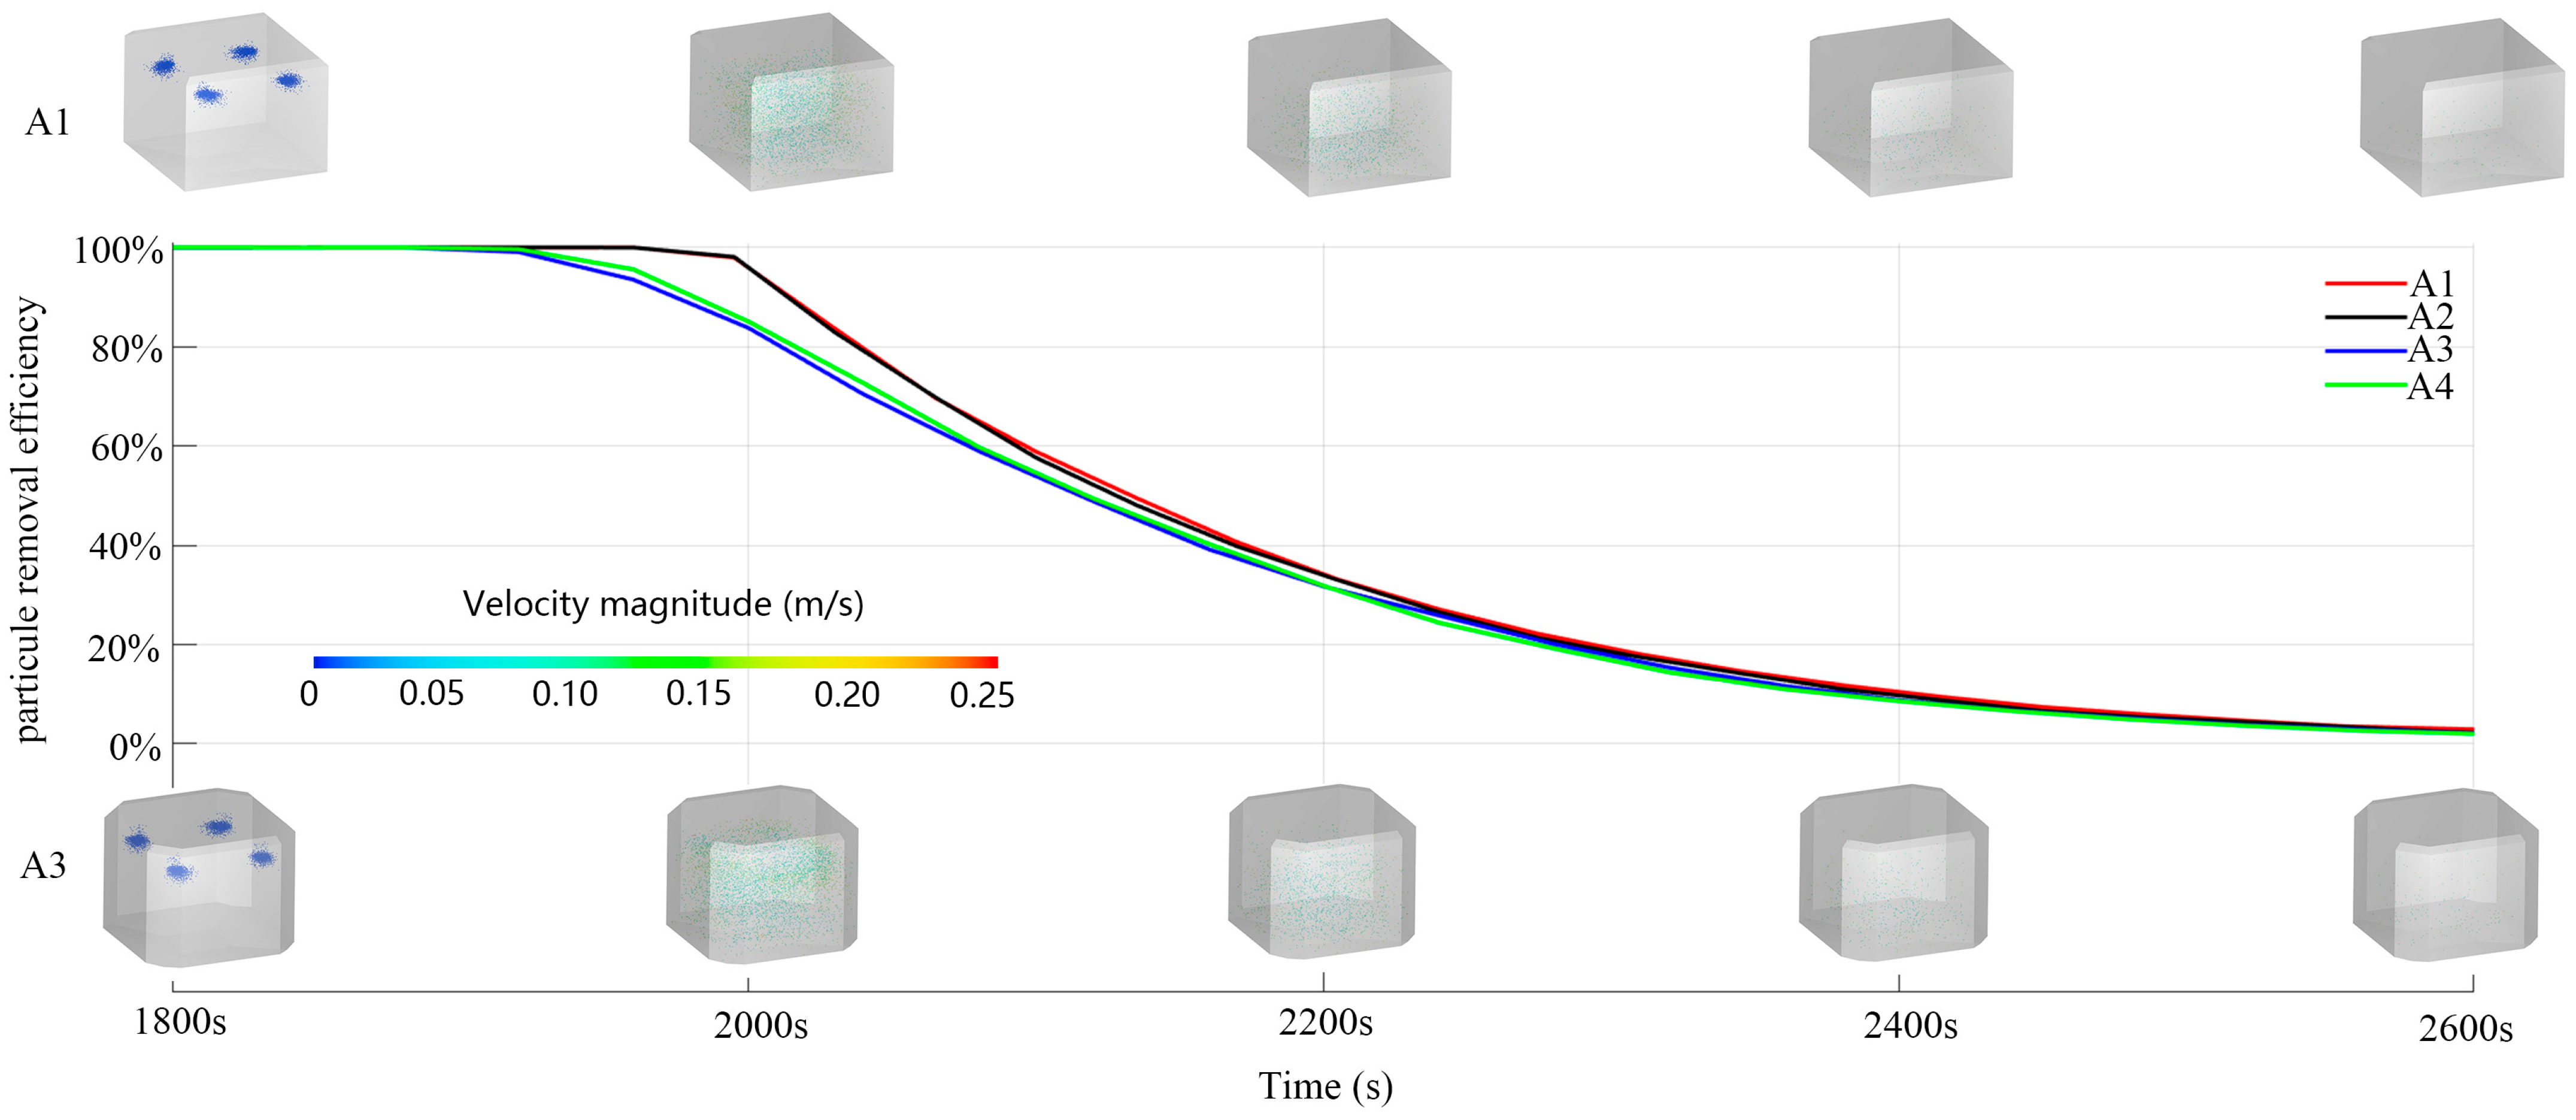
3.4. Impact of Effluent Efficiency

Solid particles produced by organisms in tanks need to be quickly removed as their hydrolysis, leading to decomposition, reduces dissolved oxygen levels and releases organic molecules, finely suspended solids, and ammonia, which can cause water quality problems. Another danger of using seawater in aquaculture vessels travelling for long periods of time in the deep sea is that toxic H2S can also accumulate in the tanks, and this can be harmful to fish if the solids are not rinsed away quickly [36,37]. To eliminate particle build-up, the design of the tanks needs to be self-cleaning so that fish growth and welfare are not negatively affected. By monitoring the mean kinetic energy and turbulent kinetic energy of the fluid in the computational grid in FLOW-3D, it was found that the computation converged to a steady state after 1500 s. At 1800 s, the particles started to drop, with a total of 5000 particles with a diameter of 1 cm, and the particles were released at the free surface with an initial downward velocity of 1 cm/s. Figure 8 shows the combined information on the particle dispersion in the tank.
As shown in Figure 8, the solid particle exclusion effect of the A1 and A2 conditions was always in the lead in the 1000 s after particle placement, and the particle visualisation also shows that there were more low-flow particles in the culture tanks in the A1 and A2 conditions compared with the A3 and A4 conditions. After 60% of the particles were excluded, the particle removal efficiencies of the four conditions gradually approached each other. As mentioned before, in condition A1, the overall flow velocity in the tank was low, and there were obvious low-flow velocity zones in the corners and centre of the tank. The existence of these low-flow velocity zones made it easy for impurities such as faeces and feed residues to be deposited and difficult to remove, which led to the accumulation of waste and pollution at the bottom water, which increases the risk of disease in the aquaculture and might even trigger the spread of parasites and diseases. In actual operation, the organisms in culture tanks continuously produce faeces; therefore, tanks with a corner-cutting design can strengthen the solid particle exclusion efficiency, which makes these tanks obtain better fishability and also ensures good water quality conditions. When the corner-cutting ratio C > 0.33, the corner-cutting ratio has a small effect on the particle exclusion efficiency, and the increase in the corner-cutting ratio yields limited improvement to the particle exclusion efficiency.

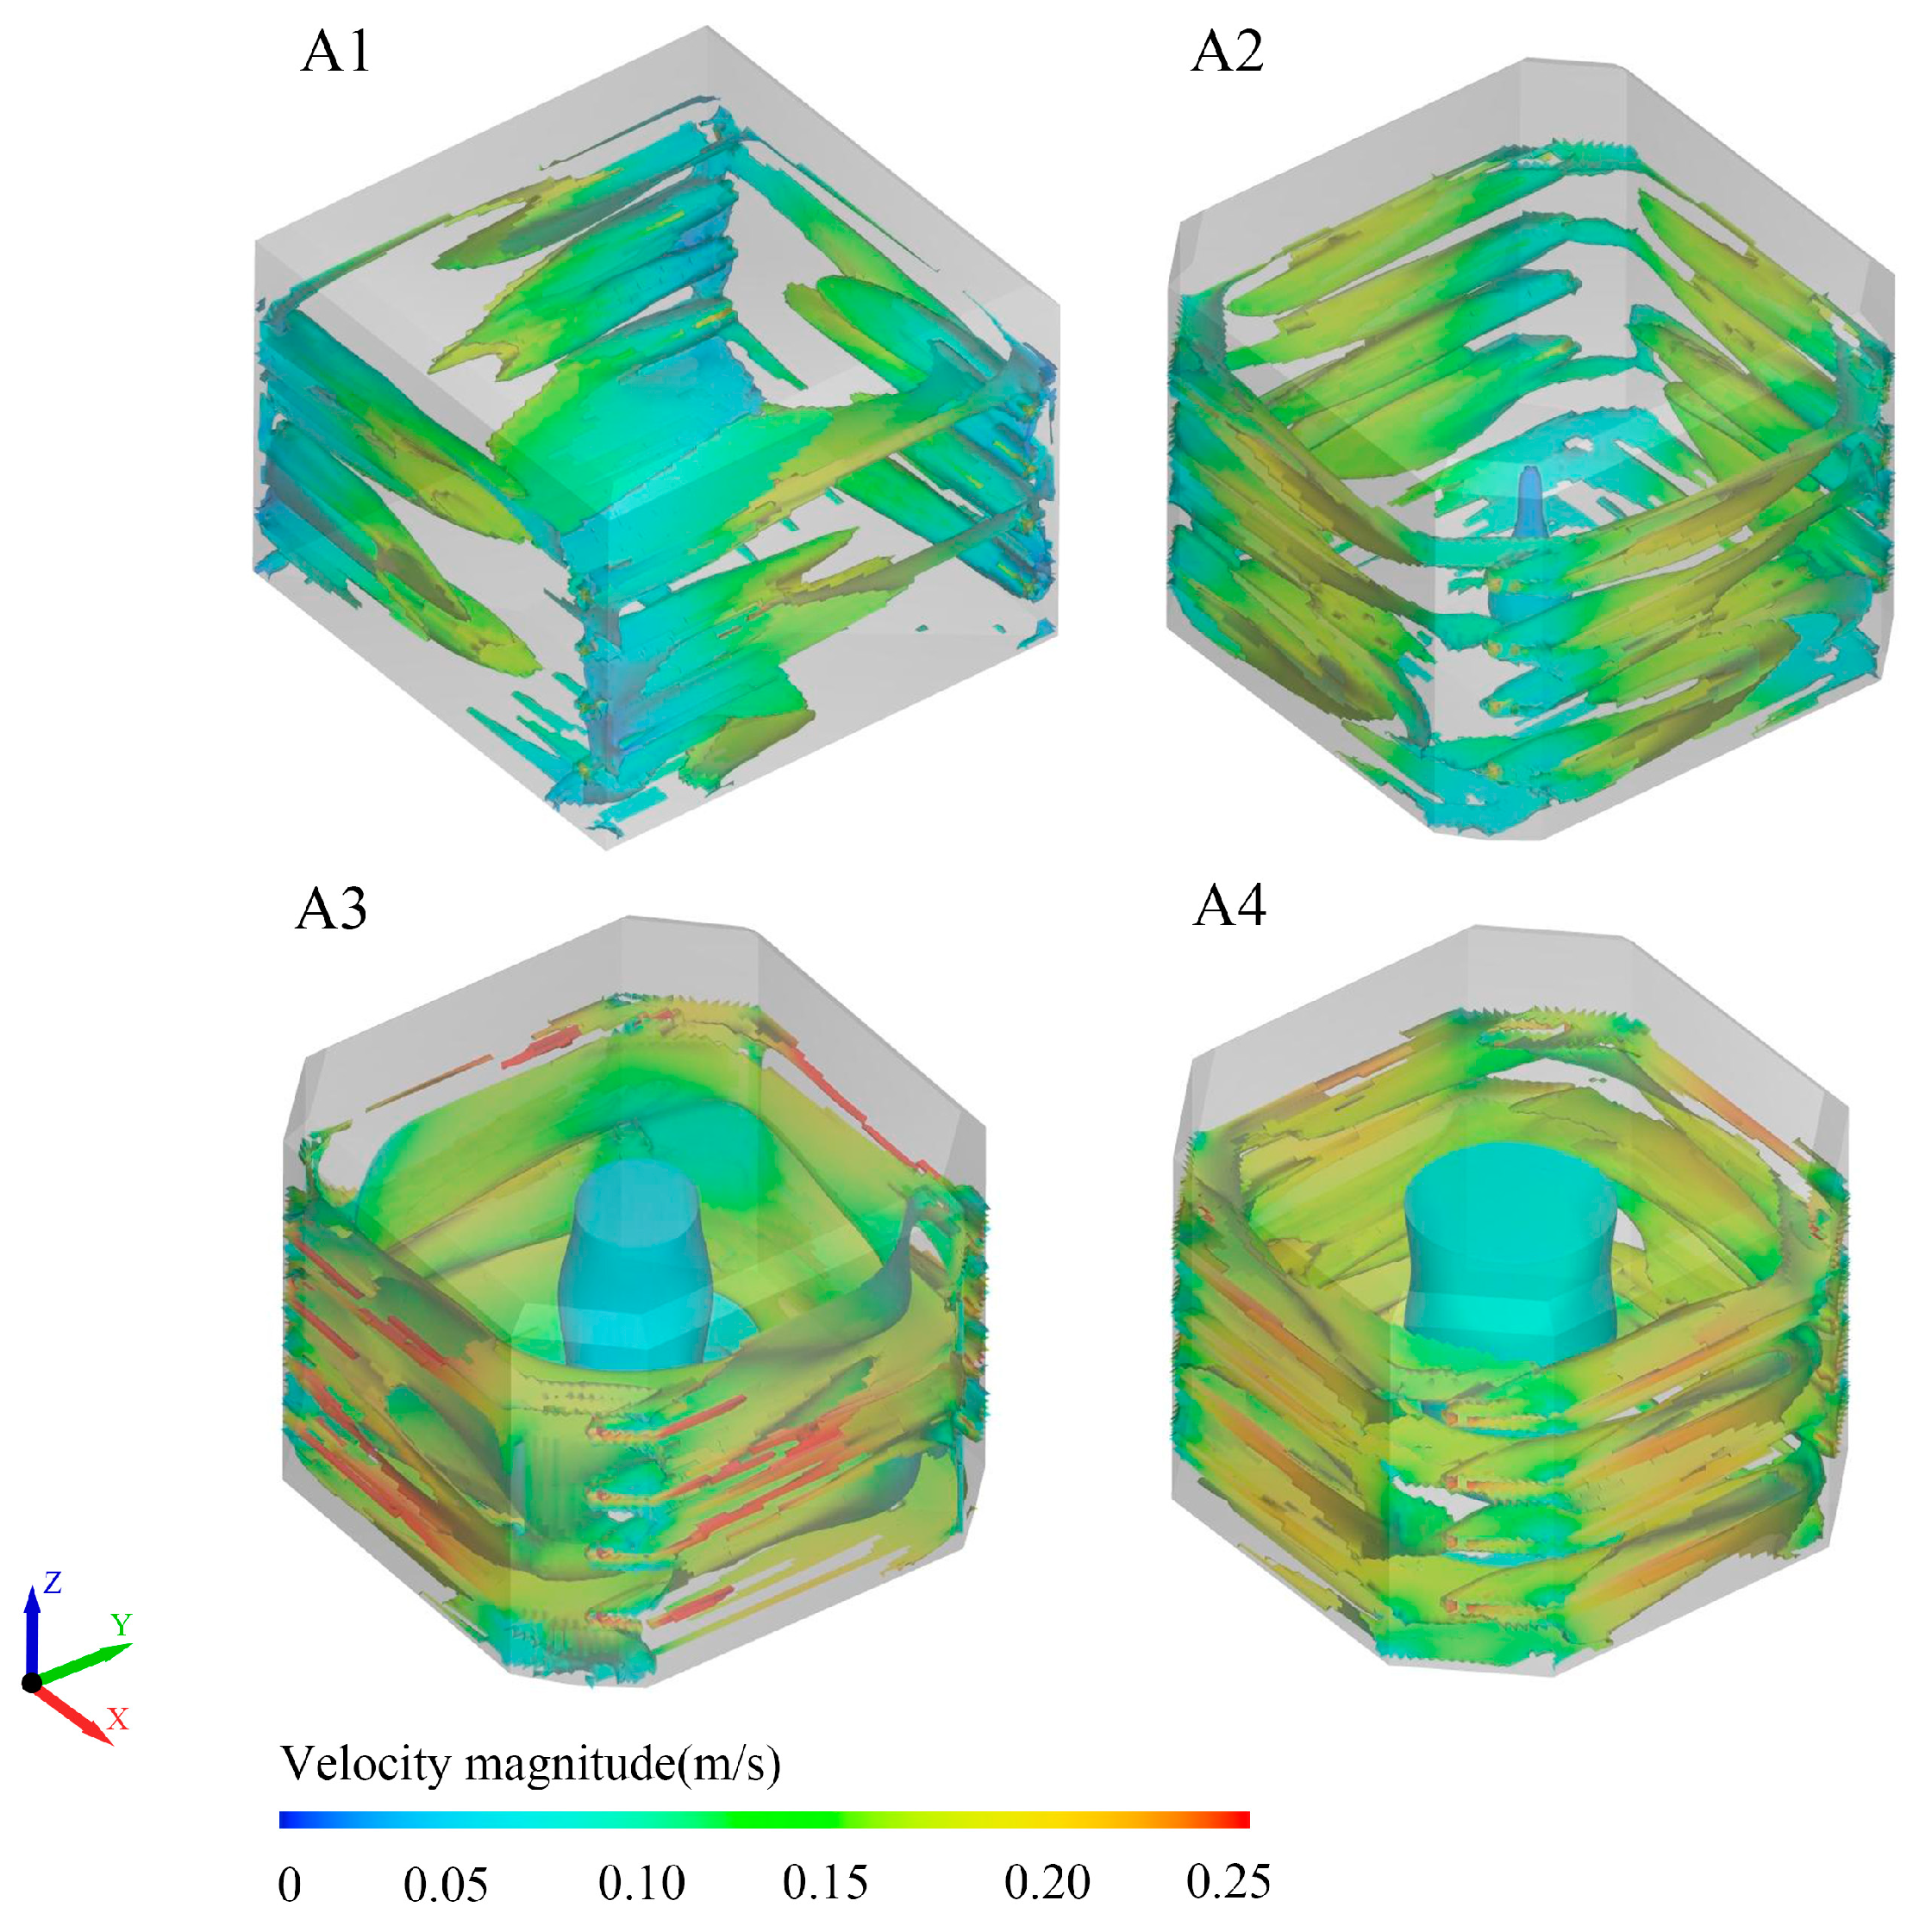
3.5. Vortex Structural Characteristics

In addition to flow velocities, vortices in the flow field are also important factors affecting the water environment in tanks. The combination of tangential and axial movements of fluids in tanks generates vortices and plays an important role in the transfer of momentum in the water column of the tanks [38,39]. In recent decades, many vortex identification methods have been developed to describe the vortex structure of fluid flow as a result of in-depth research by scholars. The q-method is one of the most commonly used vortex structure visualisation methods, and in practical applications, the Q-value is usually used to identify vortex structures in fluids [13]. When the Q-value is greater than zero, it indicates that the rotational rate is greater than the shear rate, which helps to identify potential vortex regions. Therefore, the Q-value is often used to visualise vortexes in fluids, especially in the study of complex flow phenomena (e.g., turbulence and vortex motions). An excellent and stable flow field forms a flow regime that generates rotation at the centre of the breeding tank. When monitoring the mean kinetic energy and mean turbulent kinetic energy of the fluid in the computational grid in FLOW-3D, the computation tended to exhibit a steady state after 1500 s.
Figure 9 shows the vortex intensity at 2500 s for each condition, and according to the Q criterion, the vortex maps at Q = 0.05 were selected. The vortex rings around the inlet and outlet are the two main vortex areas, which are closely related to the transfer of turbulent energy in the tank. An increase in the vortex intensity can strengthen the efficiency of tank discharge, but the torque generated by excessive vortex can cause fish to capsize and lose balance. Fish use their pectoral fins to restore balance and sharply increase their body’s hydrodynamic resistance and spatial equilibrium energy consumption to resist capsizing caused by vortex filaments of different scales, which make them swim slower or even lose their swimming ability [40,41]. As shown in Figure 9, when the corner ratio is less than 0.33, the large-scale vortex structure breaks down into many close-to-small-scale structures, vortex filament structures, and irregular vortex distributions. The colouring of the flow velocity also shows that the flow velocity is higher near the tank wall. When the ratio of the angle of tangency is greater than 0.33, the vortex column in the centre of the tank is gradually stabilised, and the water moves regularly inside the tank, gradually appearing as a large vortex ring.

4. Conclusions

In this study, the flow field in the aquaculture tank of an 8000 t-class aquaculture vessel was analysed using computational fluid dynamics (CFD) methods. The effect of the proportion of tank corners on the flow field of the aquaculture tank was calculated, and the efficiency of particle removal in the flow field was analysed. Based on the calculation results, a reasonable scheme was given, which provides the necessary parameters for the development and design of aquaculture tanks in aquaculture vessels and offers important reference engineering value.
(1) From the perspective of the fishability of tanks, for the same culture volume, tanks with a larger corner ratio C have better hydrodynamic characteristics, including a more uniform velocity distribution, a smaller share of the low-speed zone, and a high intensity of eddies, which also contribute to the mixing of dissolved oxygen and the aggregation and discharge of solid particles.
(2) From the point of view of circulating water utilisation efficiency, when the corner ratio C is small, the average speed of the aquaculture vessel is low, the input energy utilisation efficiency of the jet is low, and the jet speed has to be increased in order to maintain the appropriate speed range, which, in turn, generates more wastewater and reduces the overall circulating water utilisation and economic efficiency of the aquaculture vessel tanks.
(3) From the point of view of the space utilisation of culture tanks, the utilisation of the culture space is reduced when the proportion of corners in square tanks is large, thereby increasing the bioculture density, which is not conducive to fish welfare.
When the corner structure is not used, the overall flow pattern in the tank is poor, and problems such as low energy utilisation efficiency, poor particulate exclusion effect, and low vortex strength are present. This tank type is not recommended. When the corner ratio C = 0.26, the tank has a high volume of cultured water, but the flow field in the tank is weak. An excellent flow field can be maintained by changing the position of the inlet and outlet ports or by increasing the number of daily water exchanges and other measures. When the corner ratio C = 0.33, the square-cut aquaculture vessel has a higher comprehensive performance, including a higher fishable flow rate, energy use efficiency, and particulate removal efficiency, as well as higher flow field characteristics and aquaculture volume. This helps to improve the overall economic efficiency of the aquaculture vessel and should be considered a priority in the construction of aquaculture vessels. When the corner ratio C = 0.4, the tank has an excellent flow field performance and can reduce the number of daily water changes to save energy loss under the condition of meeting the requirements of fishability. When the corner ratio C = 0.4, the flow field in the chamber is excellent, and the number of daily water changes can be appropriately reduced to save energy losses, provided that the requirements for fishability are met.
When the aquaculture vessel is cruising, the large transverse rocking of the vessel will lead to a large increase in the flow velocity in the tanks. Hence, the above conclusions are only applicable to the case of vessels at anchor or operating in small winds and waves. This study’s results can still be used as a reference for the design and construction of aquaculture vessels, which are mostly at anchor, except when there is an impending typhoon or unsuitable water temperature.
During the actual operations of aquaculture vessels, both fish density and tail-swinging characteristics can impact the flow field in the tanks. Future work extending this study will consider the effect of fish characteristics on the flow field characteristics in the tanks, where flow velocities can be significantly reduced when fish densities are too high and where fish wagging can result in localised increases in flow velocities within the flow field. Fish characteristics will inevitably create complex flow dynamics within the tanks, so flow velocities and effluent efficiencies, for example, become more difficult to predict. In subsequent research, we plan to use the multiple reference frame (MRF) technique to model the cultured fish body. The MRF method can be used to complement and improve this study. The results of this study will be considered in future computational studies of tanks.

Author Contributions

Methodology, F.Z. and M.C.; validation, F.Z. and C.Z.; writing—original draft preparation, F.Z.; writing—review and editing, M.C. and H.L. All authors have read and agreed to the published version of the manuscript.

Funding

This study was supported by the Key R&D Program of Shandong Province, China (no. 2021SFGC0701), the National Key Research and Development Program of China (no. 2022YFD2401101), and the Central Public-Interest Scientific Institution Basal Research Fund (CAFS) (no. 2023TD84).

Institutional Review Board Statement

Not applicable.

Informed Consent Statement

Not applicable.

Data Availability Statement

The data supporting the reported results can be made available upon reasonable request.

Conflicts of Interest

This research was conducted in the absence of any commercial or financial relationships that could be construed as a potential conflict of interest.

References

  1. FAO. The State of World Fisheries and Aquaculture 2024; Blue Transformation in Action; FAO: Rome, Italy, 2024.
  2. Zhang, Y.; Ni, Q.; Liu, H.; Zhang, C. Status quo of industrialized aquaculture of Atlantic salmon in Norway and its implications for China. Trans. Chin. Soc. Agric. Eng. 2020, 36, 310–315. [Google Scholar]
  3. Xu, H.; Chen, Z.; Cai, J.; Huang, Y.; Liu, H. Research on the development of deep sea aquaculture engineering equipment in China. Fish. Mod. 2016, 43, 1–6. [Google Scholar]
  4. Guo, Y.C.; Mohapatra, S.C.; Guedes, S.C. Review of developments in porous membranes and net-type structures for breakwaters and fish cages. Ocean Eng. 2020, 200, 107027. [Google Scholar] [CrossRef]
  5. Xu, Z.; Qin, H. Fluid-structure interactions of cage based aquaculture: From structures to organisms. Ocean Eng. 2020, 217, 107961. [Google Scholar] [CrossRef]
  6. Huang, X.; Pang, G.; Yuan, T.; Hu, Y.; Wang, S.; Guo, G.; Tao, Q.Y. Review of engineering and equipment technologies for deep-sea cage aquaculture in China. Prog. Fish. Sci. 2022, 43, 121–131. [Google Scholar]
  7. Xu, H.; Jiang, T. Development strategy of offshore aquaculture engineering in China. Fish. Mod. 2012, 39, 1–7. [Google Scholar]
  8. Cai, J.; Zhang, Y.; Li, J. General technology research of 100 thousand ton deep sea aquaculture platform. Ship Eng. 2017, 39, 198–203. [Google Scholar]
  9. Cui, M.; Jin, J.; Huang, W. Discussion about system construction and general technology of aquaculture platform. Fish. Mod. 2019, 46, 61–66. [Google Scholar]
  10. Cui, M.; Wang, Q.; Zhang, B. Numerical Analysis on Water Flow Field Characteristics of Aquaculture Vessel under Pitch Motion. Ship Eng. 2020, 10, 56–60. [Google Scholar]
  11. Tao, Y.; Zhu, R.; Gu, J.; Li, Z.; Zhang, Z.; Xu, X. Experimental and numerical investigation of the hydrodynamic response of an aquaculture vessel. Ocean Eng. 2023, 279, 114505. [Google Scholar] [CrossRef]
  12. Wang, W.; Li, M.; Fan, G.; Zhang, K.; Huang, Y. Engineering. Analysis of Fluid Field in Fish Tank of Breeding Vessel with Perforated Broadsides under Wave Conditions. J. Mar. Sci. Eng. 2024, 12, 367. [Google Scholar] [CrossRef]
  13. Wang, Y.; Li, Z.; Guo, X.; Cui, M. Numerical investigation on the flow field in prototype aquaculture tanks. Fish. Mod. 2022, 49, 24–34. [Google Scholar]
  14. Burrows, R.E.; Chenoweth, H.H. The Rectangular Circulating Rearing Pond. Progress. Fish-Cult. 1970, 32, 67–80. [Google Scholar] [CrossRef]
  15. Zhang, J.; Wang, M.H.; Jia, G.C. Effect of Structures on Hydrodynamic Characteristics of Recirculating Aquaculture Pond. Trans. Chin. Soc. Agric. Mach. 2022, 53, 311–320. [Google Scholar]
  16. Summerfelt, S.T.; Davidson, J.W.; Waldrop, T.B.; Tsukuda, S.M.; Bebak-Williams, J. A partial-reuse system for coldwater aquaculture. Aquac. Eng. 2004, 31, 157–181. [Google Scholar] [CrossRef]
  17. Oca, J.; Masaló, I.; Reig, L. Comparative analysis of flow patterns in aquaculture rectangular tanks with different water inlet characteristics. Aquac. Eng. 2004, 31, 221–236. [Google Scholar] [CrossRef]
  18. Oca, J.; Masaló, I. Design criteria for rotating flow cells in rectangular aquaculture tanks. Aquac. Eng. 2007, 36, 36–44. [Google Scholar] [CrossRef]
  19. Lee, J.-V.; Loo, L.; Chuah, Y.; Tang, P.; Tan, Y.; Wong, C. The design of a culture tank in an automated recirculating aquaculture system. Int. J. Eng. Appl. Sci. 2013, 2, 67–77. [Google Scholar]
  20. Plew, D.R.; Klebert, P.; Rosten, T.W.; Aspaas, S.; Birkevold, J. Changes to flow and turbulence caused by different concentrations of fish in a circular tank. J. Hydraul. Res. 2015, 53, 364–383. [Google Scholar] [CrossRef]
  21. Liu, Y.; Liu, B.L.; Lei, J.L.; Guan, C.T.; Huang, B. Numerical simulation of the hydrodynamics within octagonal tanks in recirculating aquaculture systems. Chin. J. Oceanol. Limnol. 2017, 35, 912–920. [Google Scholar] [CrossRef]
  22. Guo, X.; Li, Z.; Cui, M.; Wang, B. Numerical investigation on flow characteristics of water in the fish tank on a force-rolling aquaculture platform. Ocean Eng. 2020, 217, 107936. [Google Scholar] [CrossRef]
  23. Li, Z.; Guo, X.; Cui, M. Numerical investigation of flow characteristics in a rearing tank aboard an aquaculture vessel. Aquac. Eng. 2022, 98, 102272. [Google Scholar] [CrossRef]
  24. Cui, M.; Li, Z.; Zhang, C.; Guo, X. Statistical investigation into the flow field of closed aquaculture tanks aboard a platform under periodic oscillation. Ocean Eng. 2022, 248, 110677. [Google Scholar] [CrossRef]
  25. Xiong, Z.X.; He, M.X.; Zhu, W.Y.; Sun, Y.; Hou, X.R. Analysis of Flow Field Characteristics of Aquaculture Cabin of Aquaculture Ship. J. Mar. Sci. Eng. 2023, 11, 390. [Google Scholar] [CrossRef]
  26. Xue, B.R.; Zhao, Y.P.; Bi, C.W.; Cheng, Y.; Ren, X.Z.; Liu, Y. Investigation of flow field and pollutant particle distribution in the aquaculture tank for fish farming based on computational fluid dynamics. Comput. Electron. Agric. 2022, 200, 107243. [Google Scholar] [CrossRef]
  27. Pope, S.B. Turbulent flows. J. Meas. Sci. Technol. 2001, 12, 2020–2021. [Google Scholar] [CrossRef]
  28. Liu, D.; Lin, P. Three-dimensional liquid sloshing in a tank with baffles. Ocean Eng. 2009, 36, 202–212. [Google Scholar] [CrossRef]
  29. Hirt, C.; Sicilian, J. A porosity technique for the definition of obstacles in rectangular cell meshes. In Proceedings of the International Conference on Numerical Ship Hydrodynamics, 4th, Washington, DC, USA, 24–27 September 1985. [Google Scholar]
  30. Xue, B.-r.; Yu, L.-p.; Zhang, Q.; Ren, X.-z.; Bi, C.-w. A numerical study of the effect of relative inflow distance on hydrodynamic characteristics in the single-drain rectangular aquaculture tank with arc angles. J. Fish. China 2021, 45, 444–452. [Google Scholar]
  31. Masalo, I.; Oca, J. Influence of fish swimming on the flow pattern of circular tanks. Aquac. Eng. 2016, 74, 84–95. [Google Scholar] [CrossRef]
  32. Gorle, J.M.R.; Terjesen, B.F.; Summerfelt, S.T. Hydrodynamics of Atlantic salmon culture tank: Effect of inlet nozzle angle on the velocity field. Comput. Electron. Agric. 2019, 158, 79–91. [Google Scholar] [CrossRef]
  33. Wang, J.; Zhang, J.; Zhang, X.; Li, H.-X.; Hu, Y.; Ma, Z. Flow velocity on growth and behavior in black rockfish (Sebastes schlegelii). Acta Hydrobiol. Sin. 2023, 47, 973–981. [Google Scholar]
  34. Timmerhaus, G.; Lazado, C.C.; Cabillon, N.A.R.; Reiten, B.K.M.; Johansen, L.-H. The optimum velocity for Atlantic salmon post-smolts in RAS is a compromise between muscle growth and fish welfare. Aquaculture 2021, 532, 736076. [Google Scholar] [CrossRef]
  35. Moghadam, M.M.; Islami, H.R.; Ezam, M.; Mousavi, S.A. Optimizing flow uniformity and velocity fields in Aquaculture Tanks by modifying water inlets and nozzles arrangement: A Computational Fluid Dynamics Study. Aquac. Eng. 2024, 106, 102431. [Google Scholar] [CrossRef]
  36. Letelier-Gordo, C.O.; Aalto, S.L.; Suurnäkki, S.; Pedersen, P.B. Increased sulfate availability in saline water promotes hydrogen sulfide production in fish organic waste. Aquac. Eng. 2020, 89, 102062. [Google Scholar] [CrossRef]
  37. Gorle, J.M.R.; Terjesen, B.F.; Summerfelt, S.T. Influence of inlet and outlet placement on the hydrodynamics of culture tanks for Atlantic salmon. Int. J. Mech. Sci. 2020, 188, 105944. [Google Scholar] [CrossRef]
  38. Lingfei, Z.; Boru, X.; Yunpeng, Z. The influence of The bend ratios on The hydrodynamic characteristics in The tank of aquaculture vessel. Fish. Mod. 2024, 51, 22–31. [Google Scholar]
  39. Schlatter, P.; Orlu, R. Quantifying the interaction between large and small scales in wall-bounded turbulent flows: A note of caution. Phys. Fluids 2010, 22, 051704. [Google Scholar] [CrossRef]
  40. Lupandin, A.I. Effect of flow turbulence on swimming speed of fish. Biol. Bull. 2005, 32, 461–466. [Google Scholar] [CrossRef]
  41. Hockley, F.A.; Wilson, C.; Brew, A.; Cable, J. Fish responses to flow velocity and turbulence in relation to size, sex and parasite load. J. R. Soc. Interface 2014, 11, 20130814. [Google Scholar] [CrossRef]
Figure 1. Sketch and marks of the aquaculture fish vessel.
Jmse 12 01185 g001
Figure 2. (a) Rectangular tank geometry model for numerical model validation; (bd) show the variation curves of the flow velocity in Probes 1, 2, and 3, respectively.
Jmse 12 01185 g002
Figure 3. Situation groups.
Jmse 12 01185 g003
Figure 4. Probability density distribution of the streamflow and proportion of fishable area at each corner ratio.
Jmse 12 01185 g004
Figure 5. (a) The variation in the statistical flow rate versus the variation in the residence time. (b) The variation in the drag coefficient Ct versus the capacity utilisation efficiency in the tank.
Jmse 12 01185 g005
Figure 6. Flow velocity cloud at Z = 7.5 m, Z = 4.5 m, and Z = 0.5 m profiles for different corner scales.
Jmse 12 01185 g006
Figure 7. Vector diagram of the flow field at the corners.
Jmse 12 01185 g007
Figure 8. Efficiency of particulate exclusion in tanks.
Jmse 12 01185 g008
Figure 9. Characteristics of vortex strength for different corner ratios.
Jmse 12 01185 g009
Table 1. Simulation working condition groups.
Corner RatioCorner Distance (m)Water Inflow (m3/s)Water Outflow (m3/s)
A10:1043.43694.81
A20.26:11.5642.00672.04
A30.33:12.041.06656.88
A40.40:12.440.02640.34
Disclaimer/Publisher’s Note: The statements, opinions and data contained in all publications are solely those of the individual author(s) and contributor(s) and not of MDPI and/or the editor(s). MDPI and/or the editor(s) disclaim responsibility for any injury to people or property resulting from any ideas, methods, instructions or products referred to in the content.

