
The Production Analysis and Exploitation Scheme Design of a Special Offshore Heavy Oil Reservoir—First Offshore Artificial Island with Thermal Recovery


Abstract
:1. Introduction
1.1. Offshore Heavy Oil
1.2. Existing Problems
- (1)
- The target heavy oil reservoir is a special type of reservoir
- (2)
- Production of oil and water differs from conventional heavy oil
- (3)
- Steam huff and puff parameter optimization and reasonable exploitation scheme
1.3. Research Methodology
2. Geological Description and Analysis
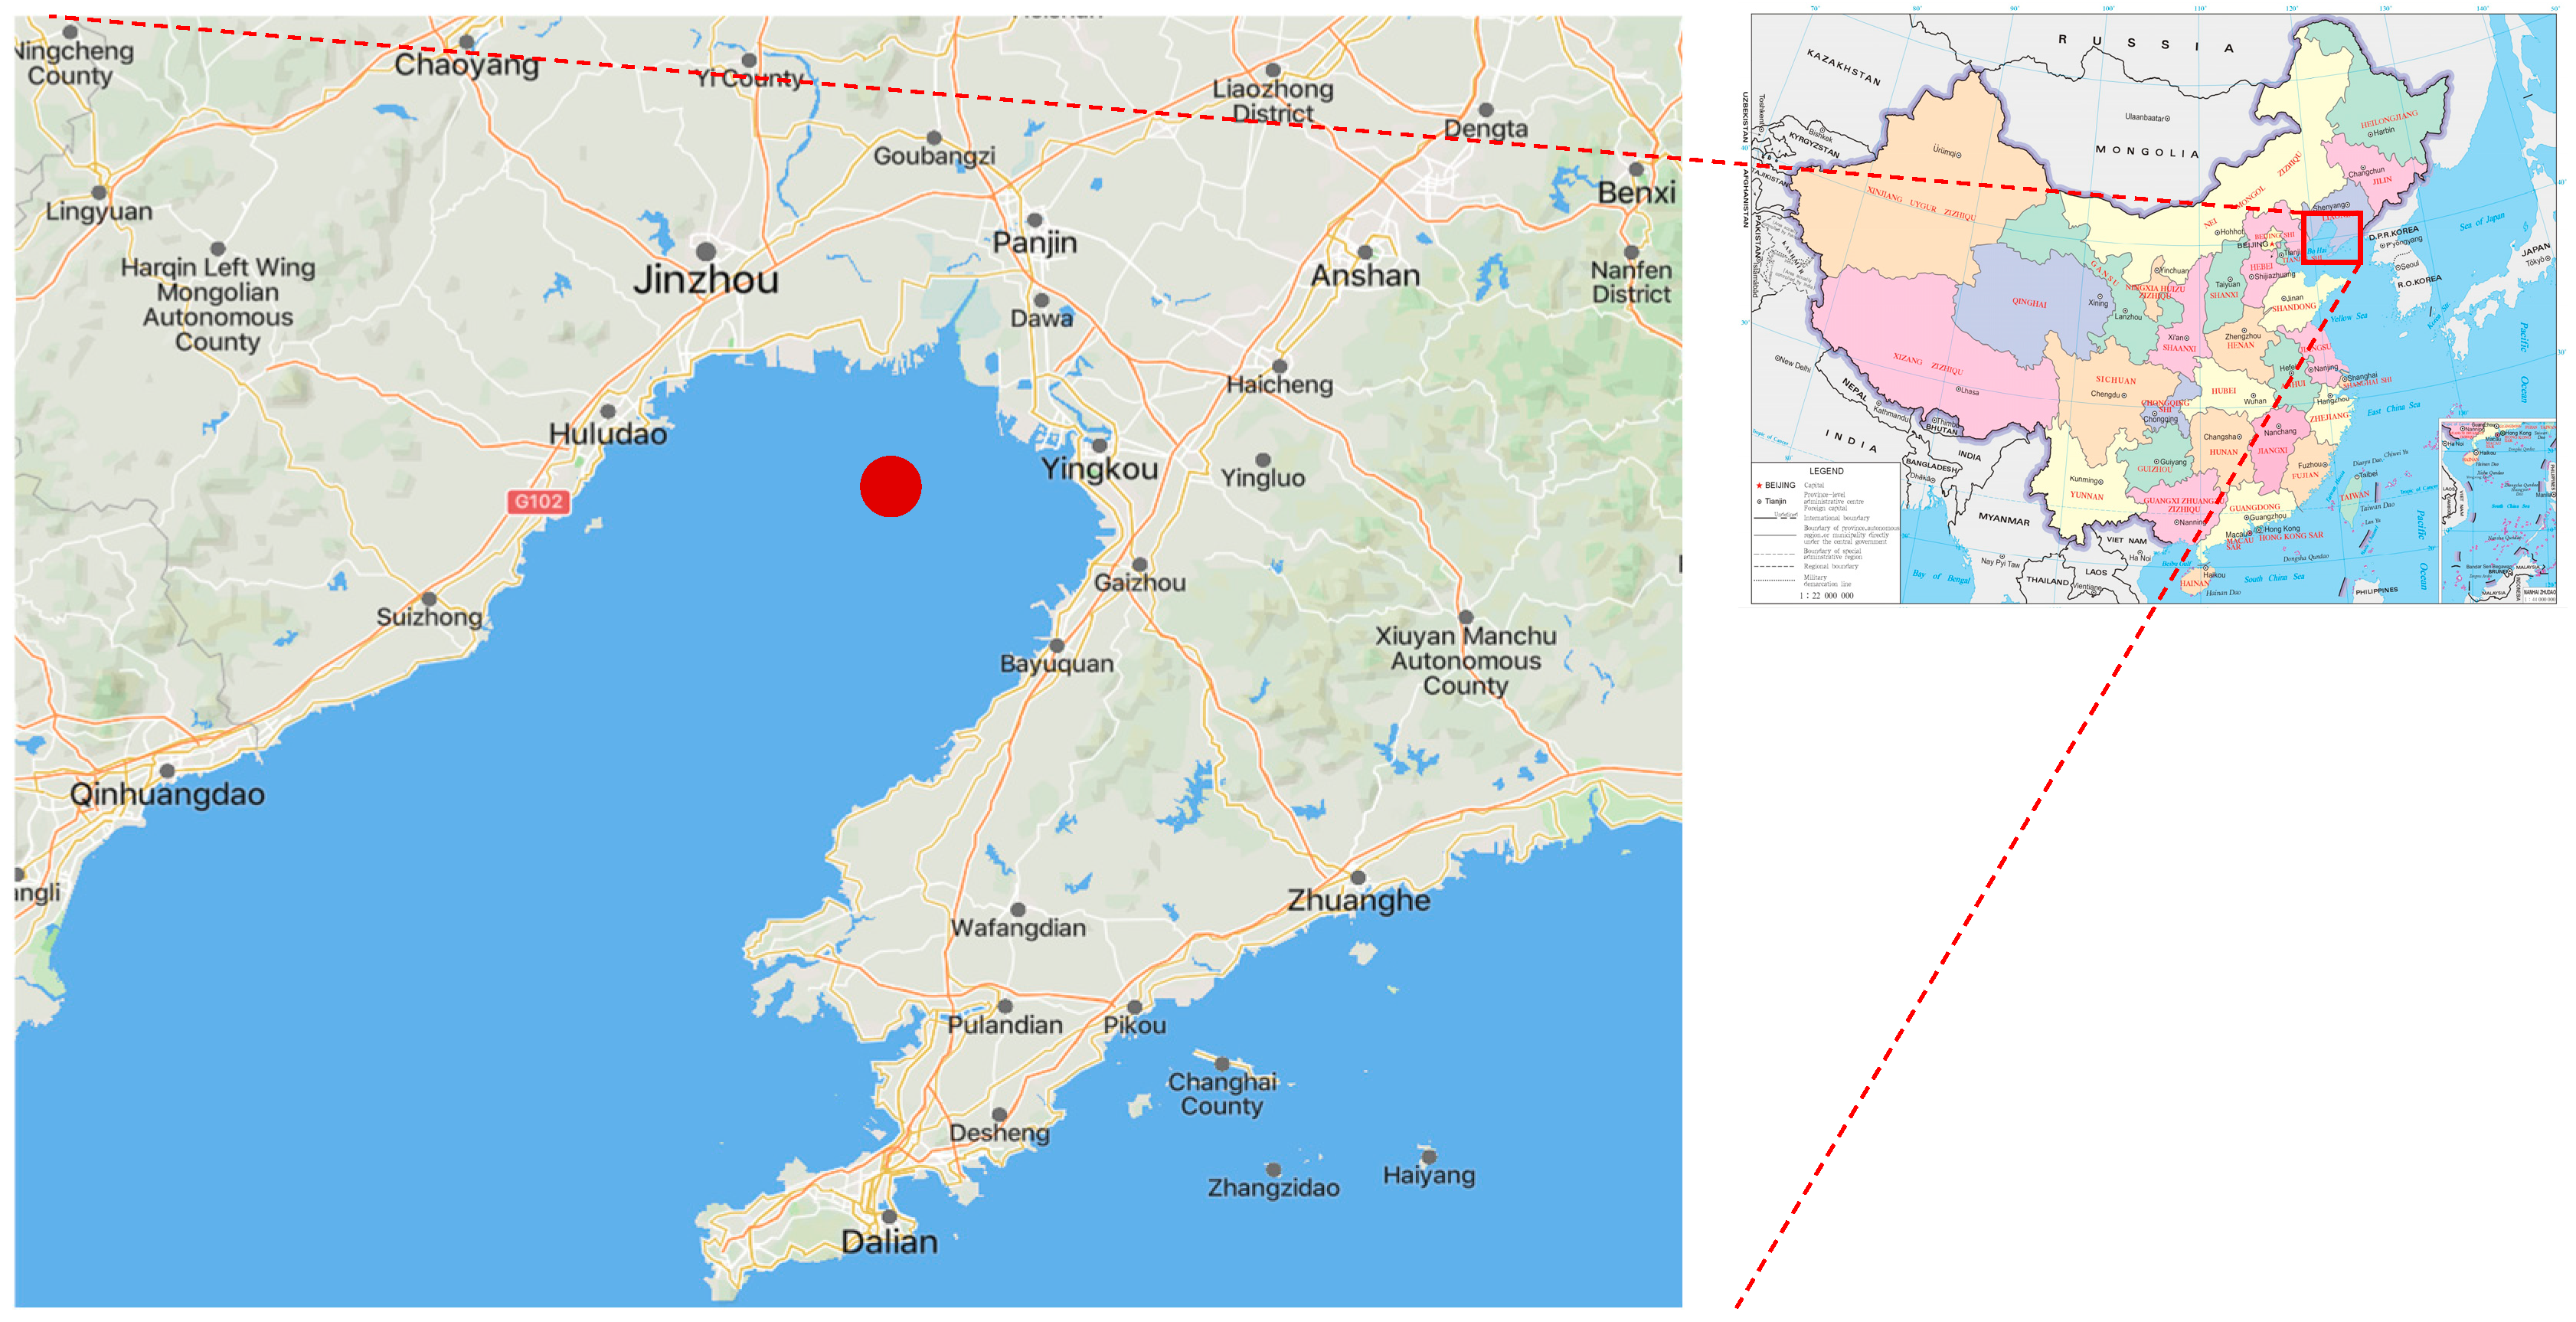
2.1. Site Location
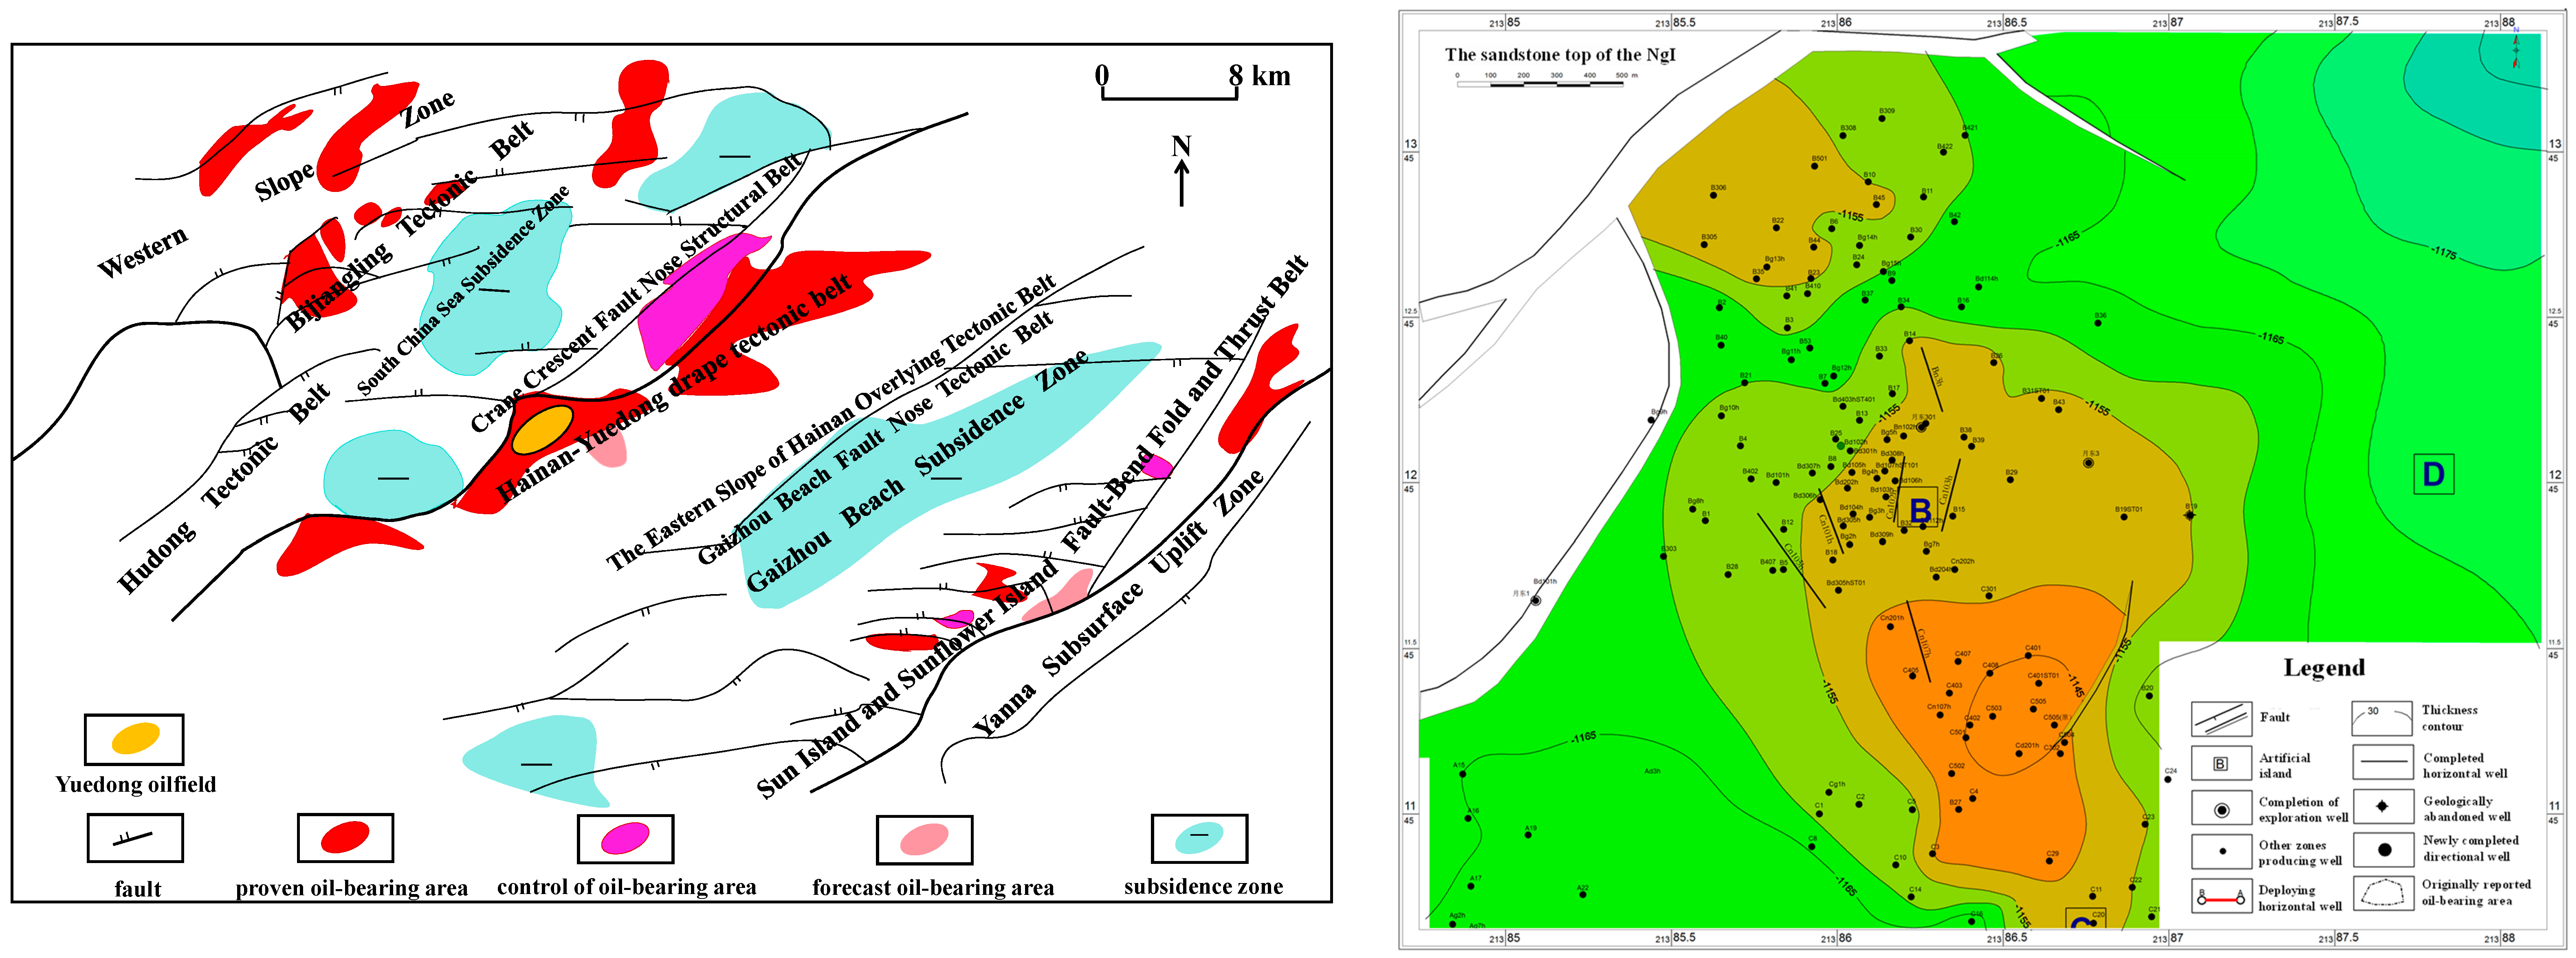
2.2. Geological Structure Characteristic
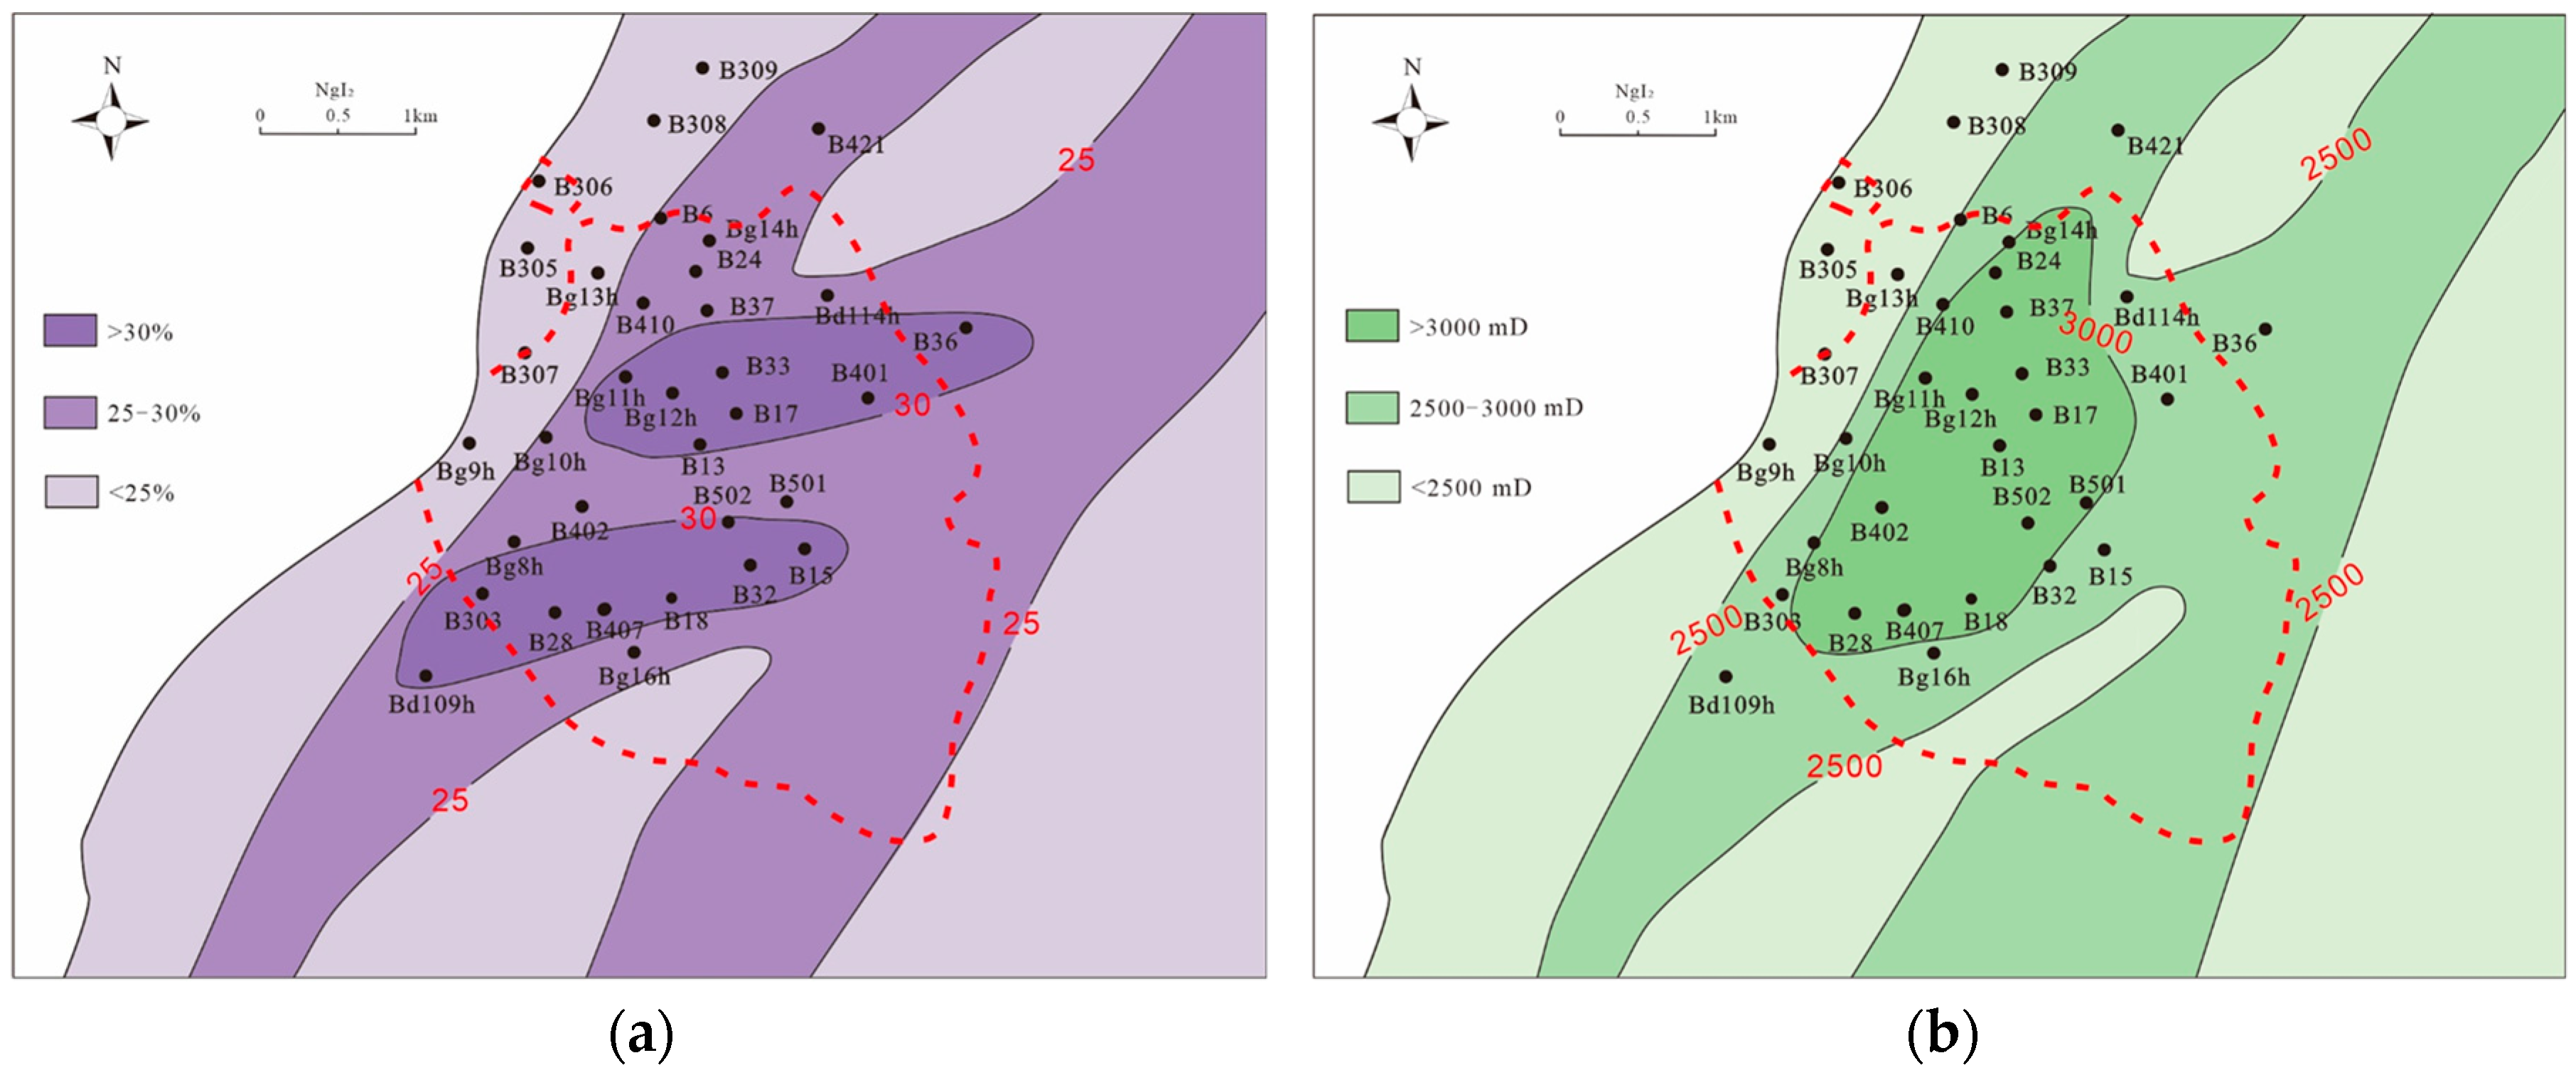
2.3. Sedimentary Characteristics
2.4. Formation Characteristic
2.5. Oil Migration Analysis
3. Analysis of Current Production
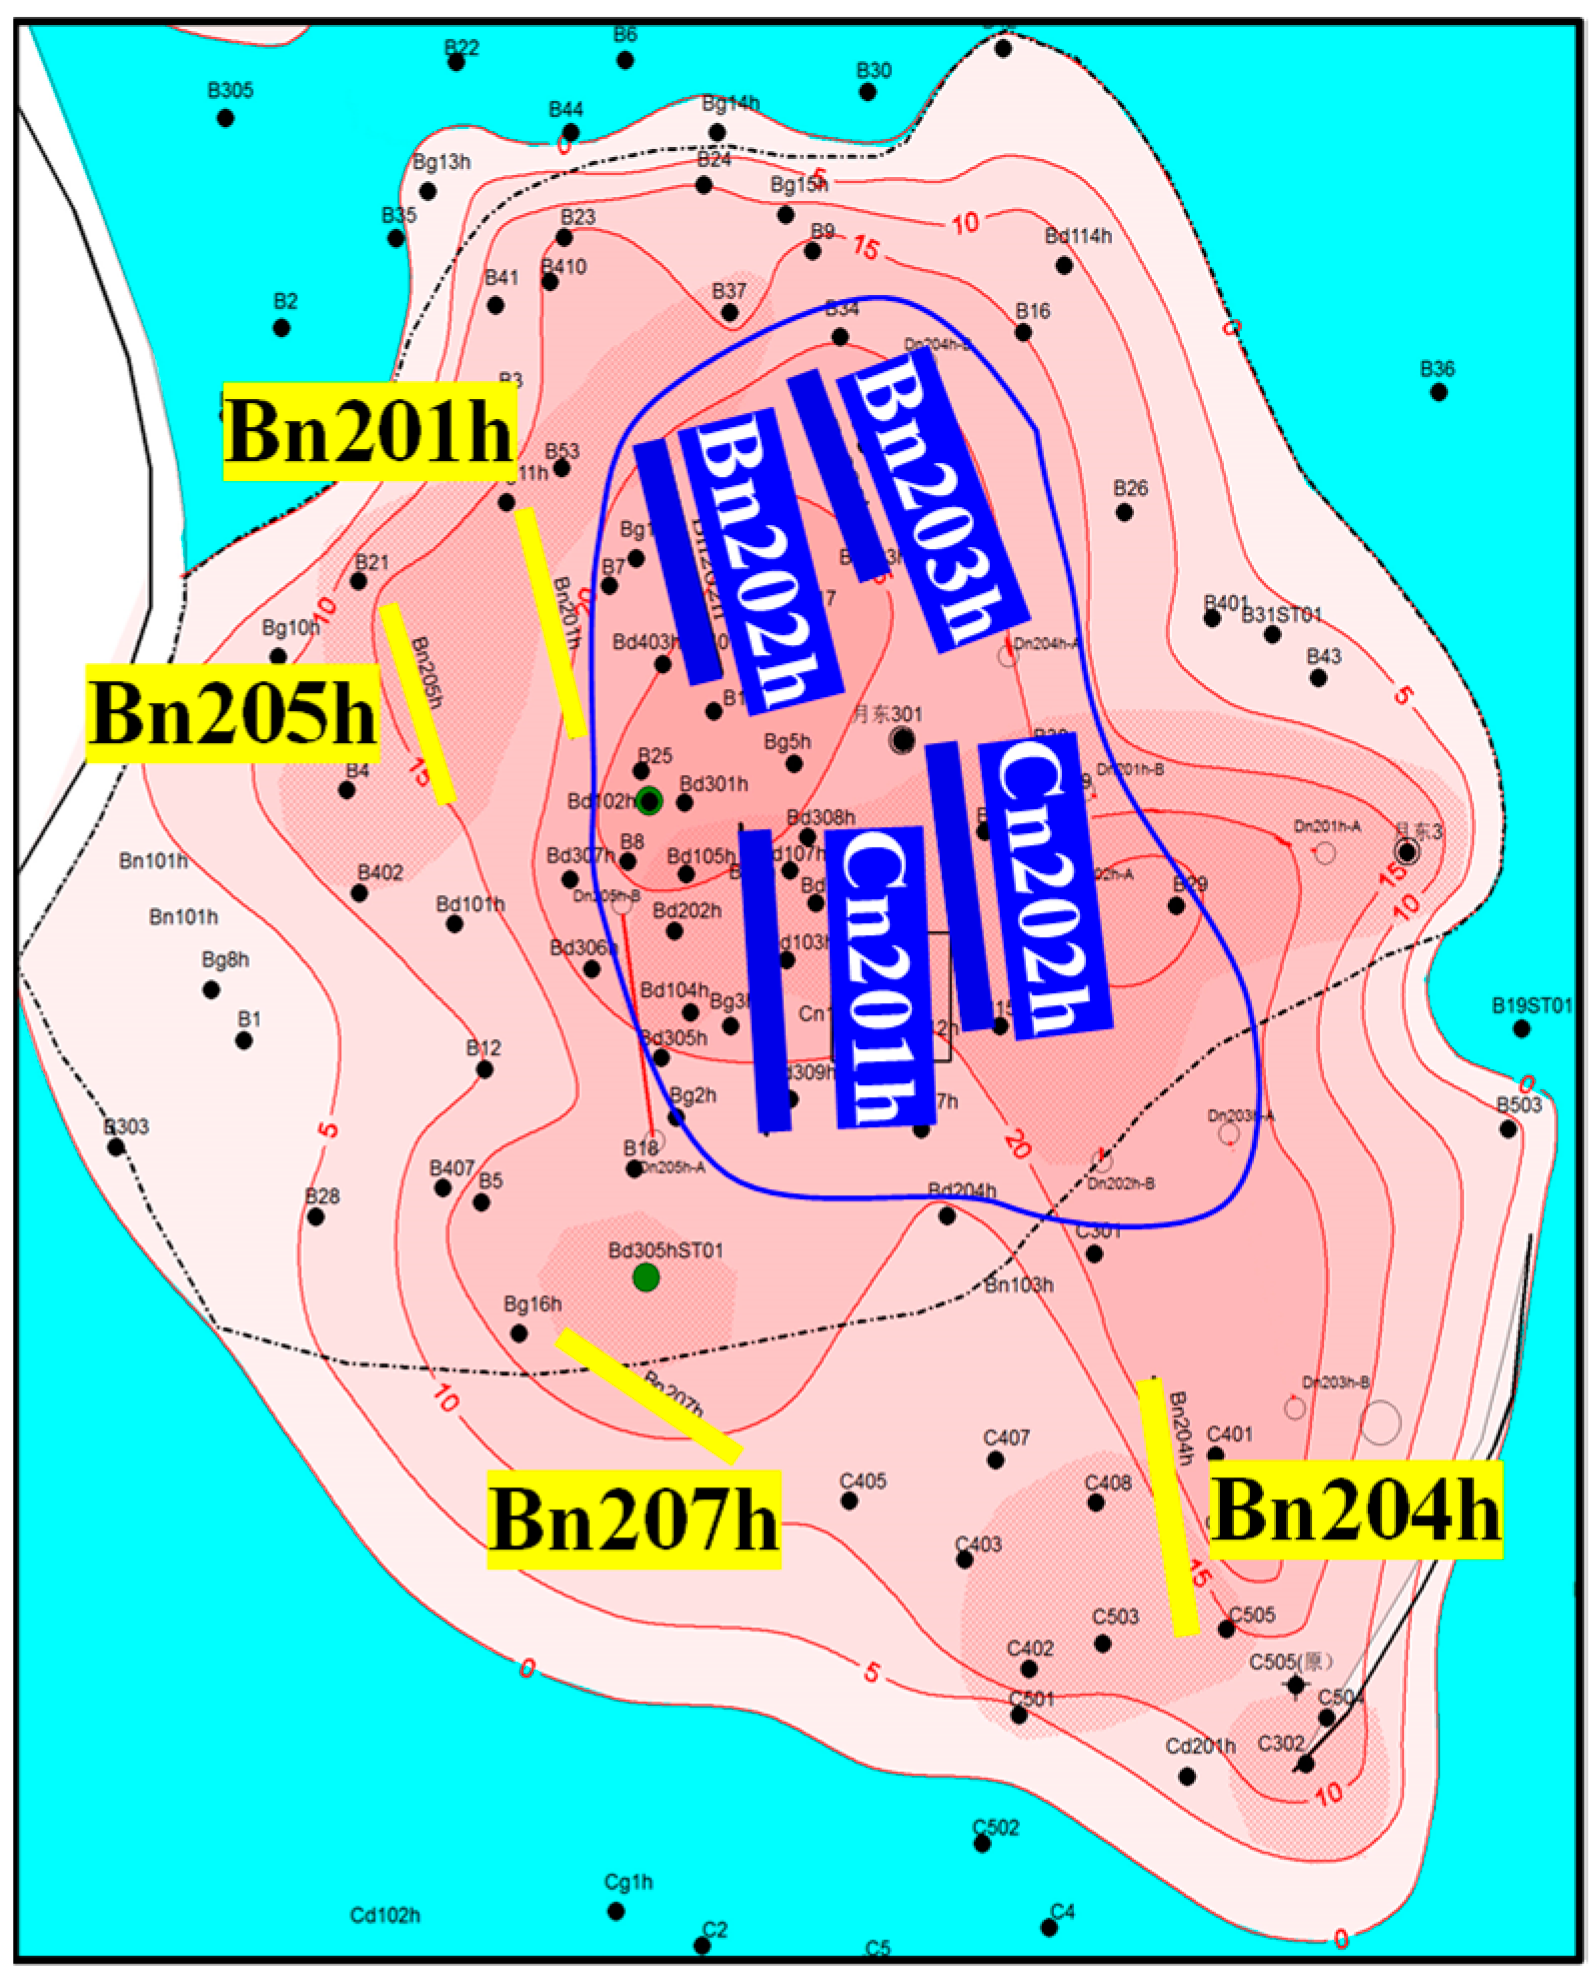
3.1. Overall Development Status
3.2. Oil and Water Production
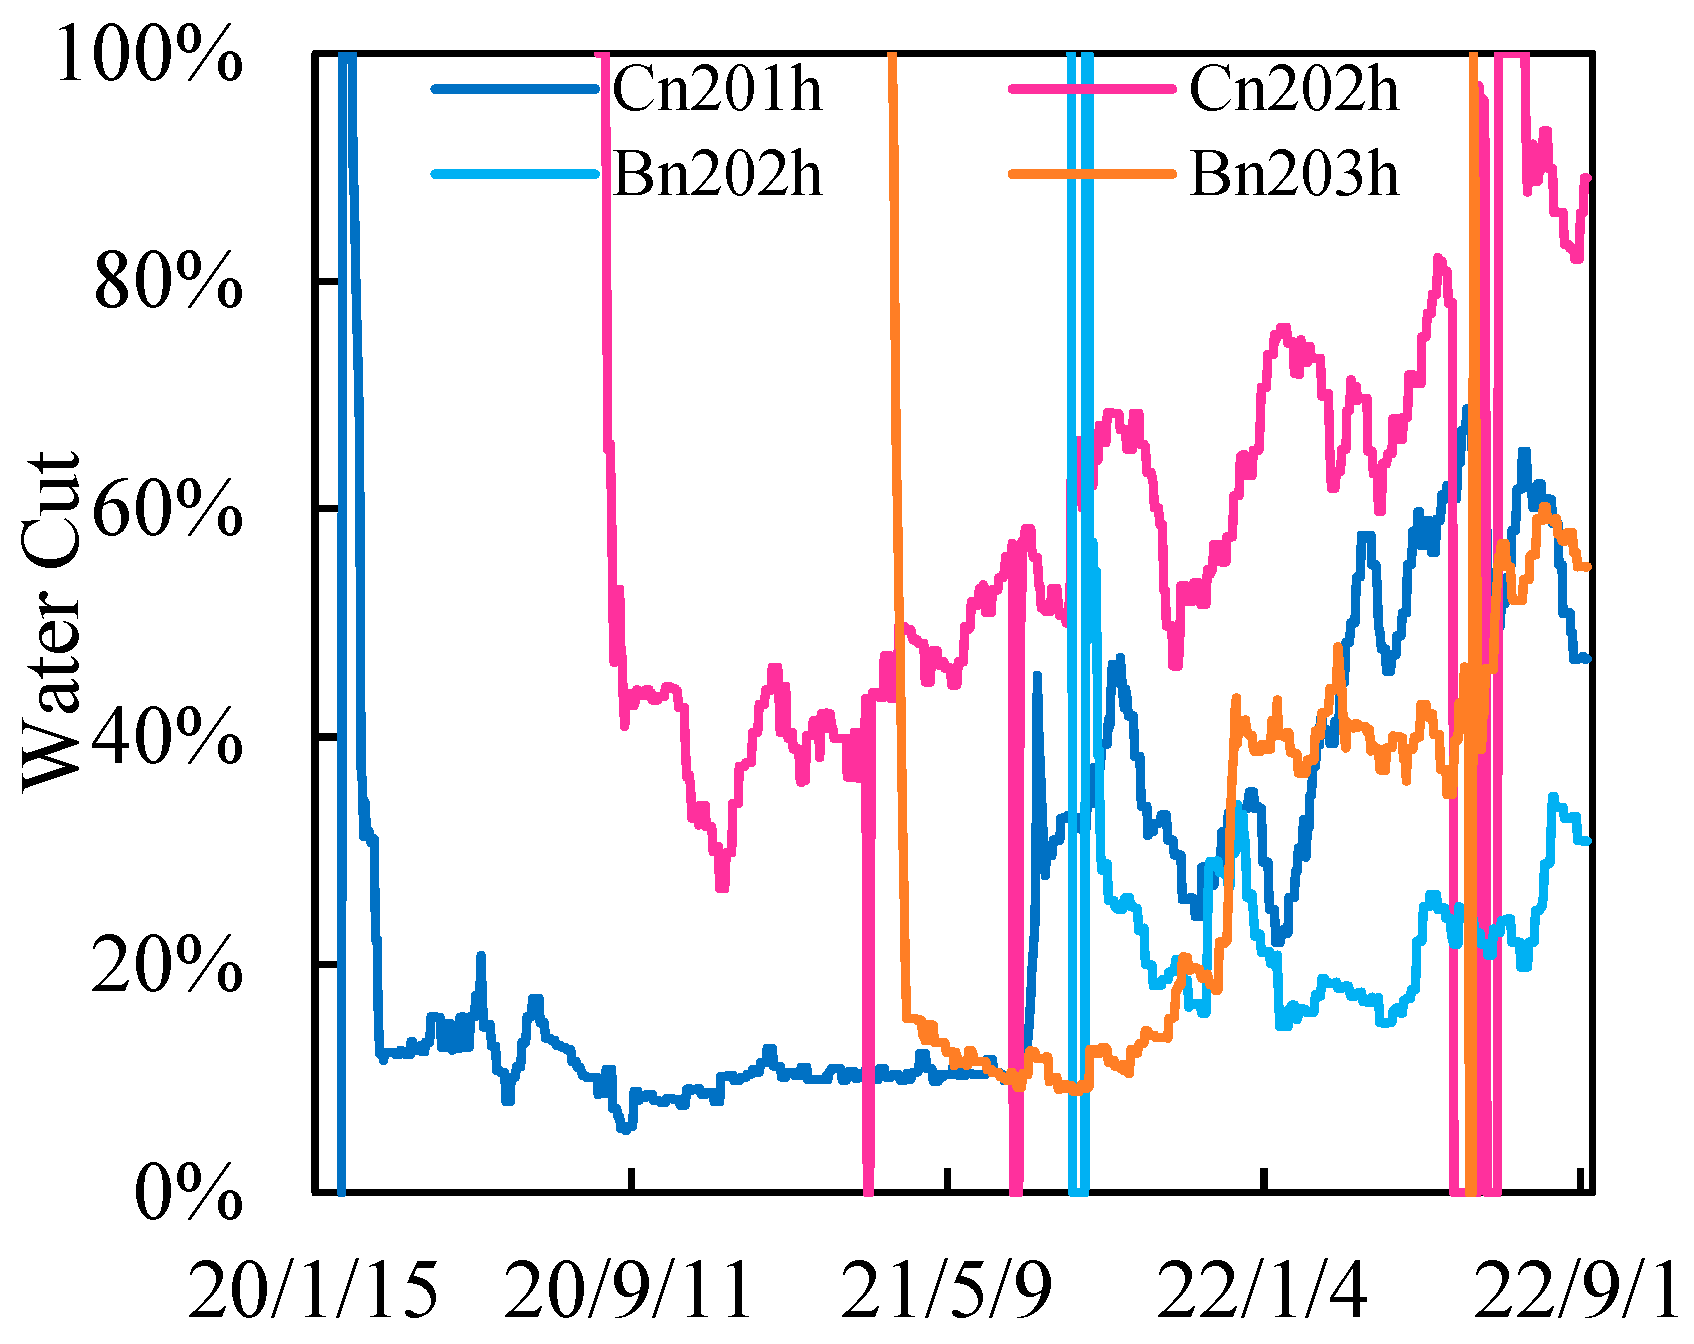
3.2.1. Middle Area
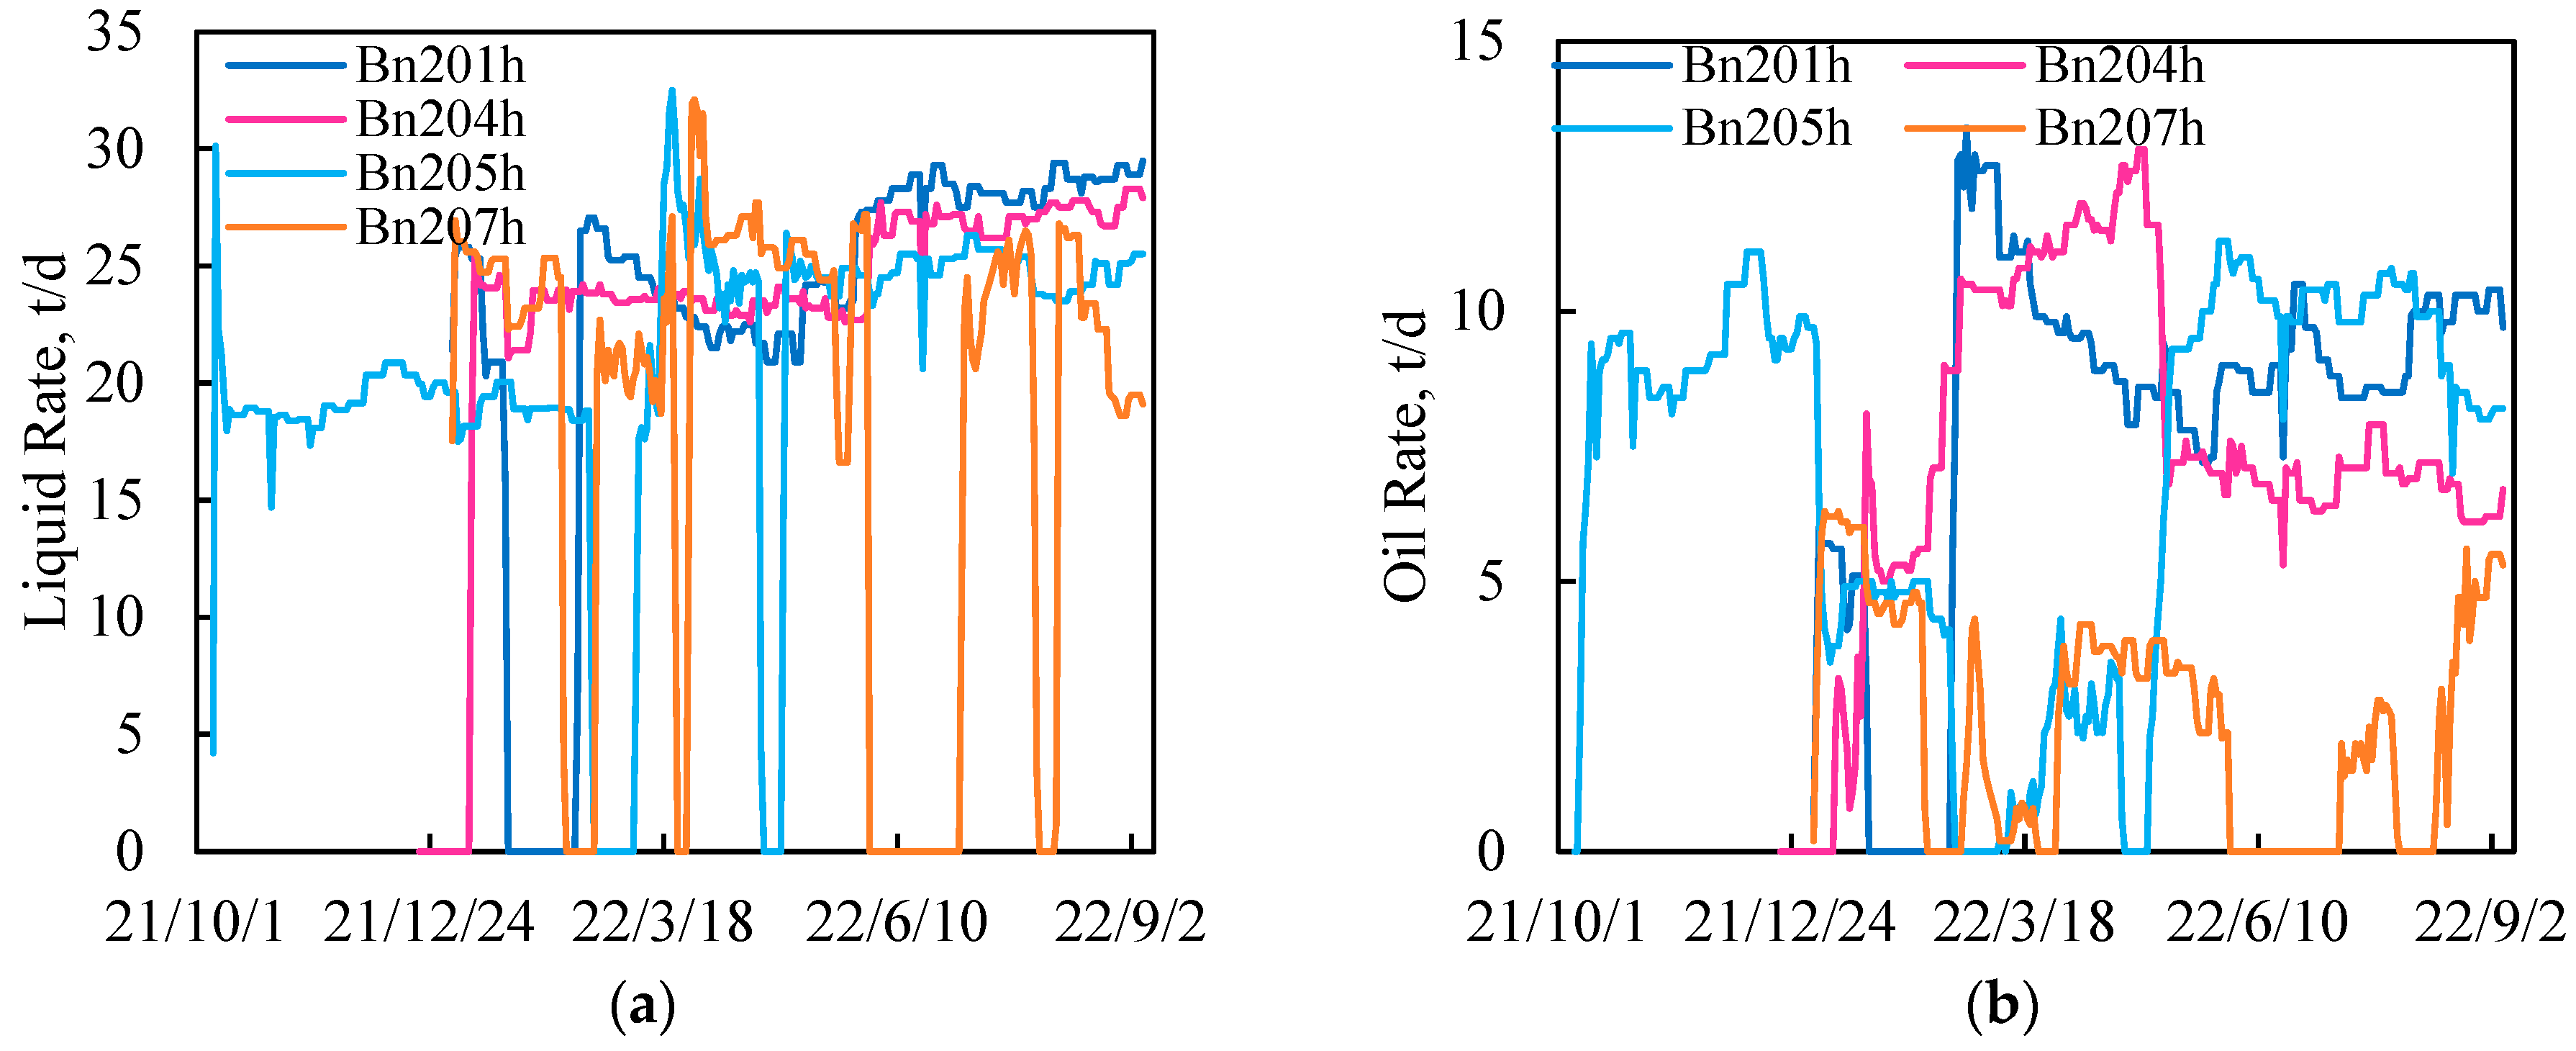
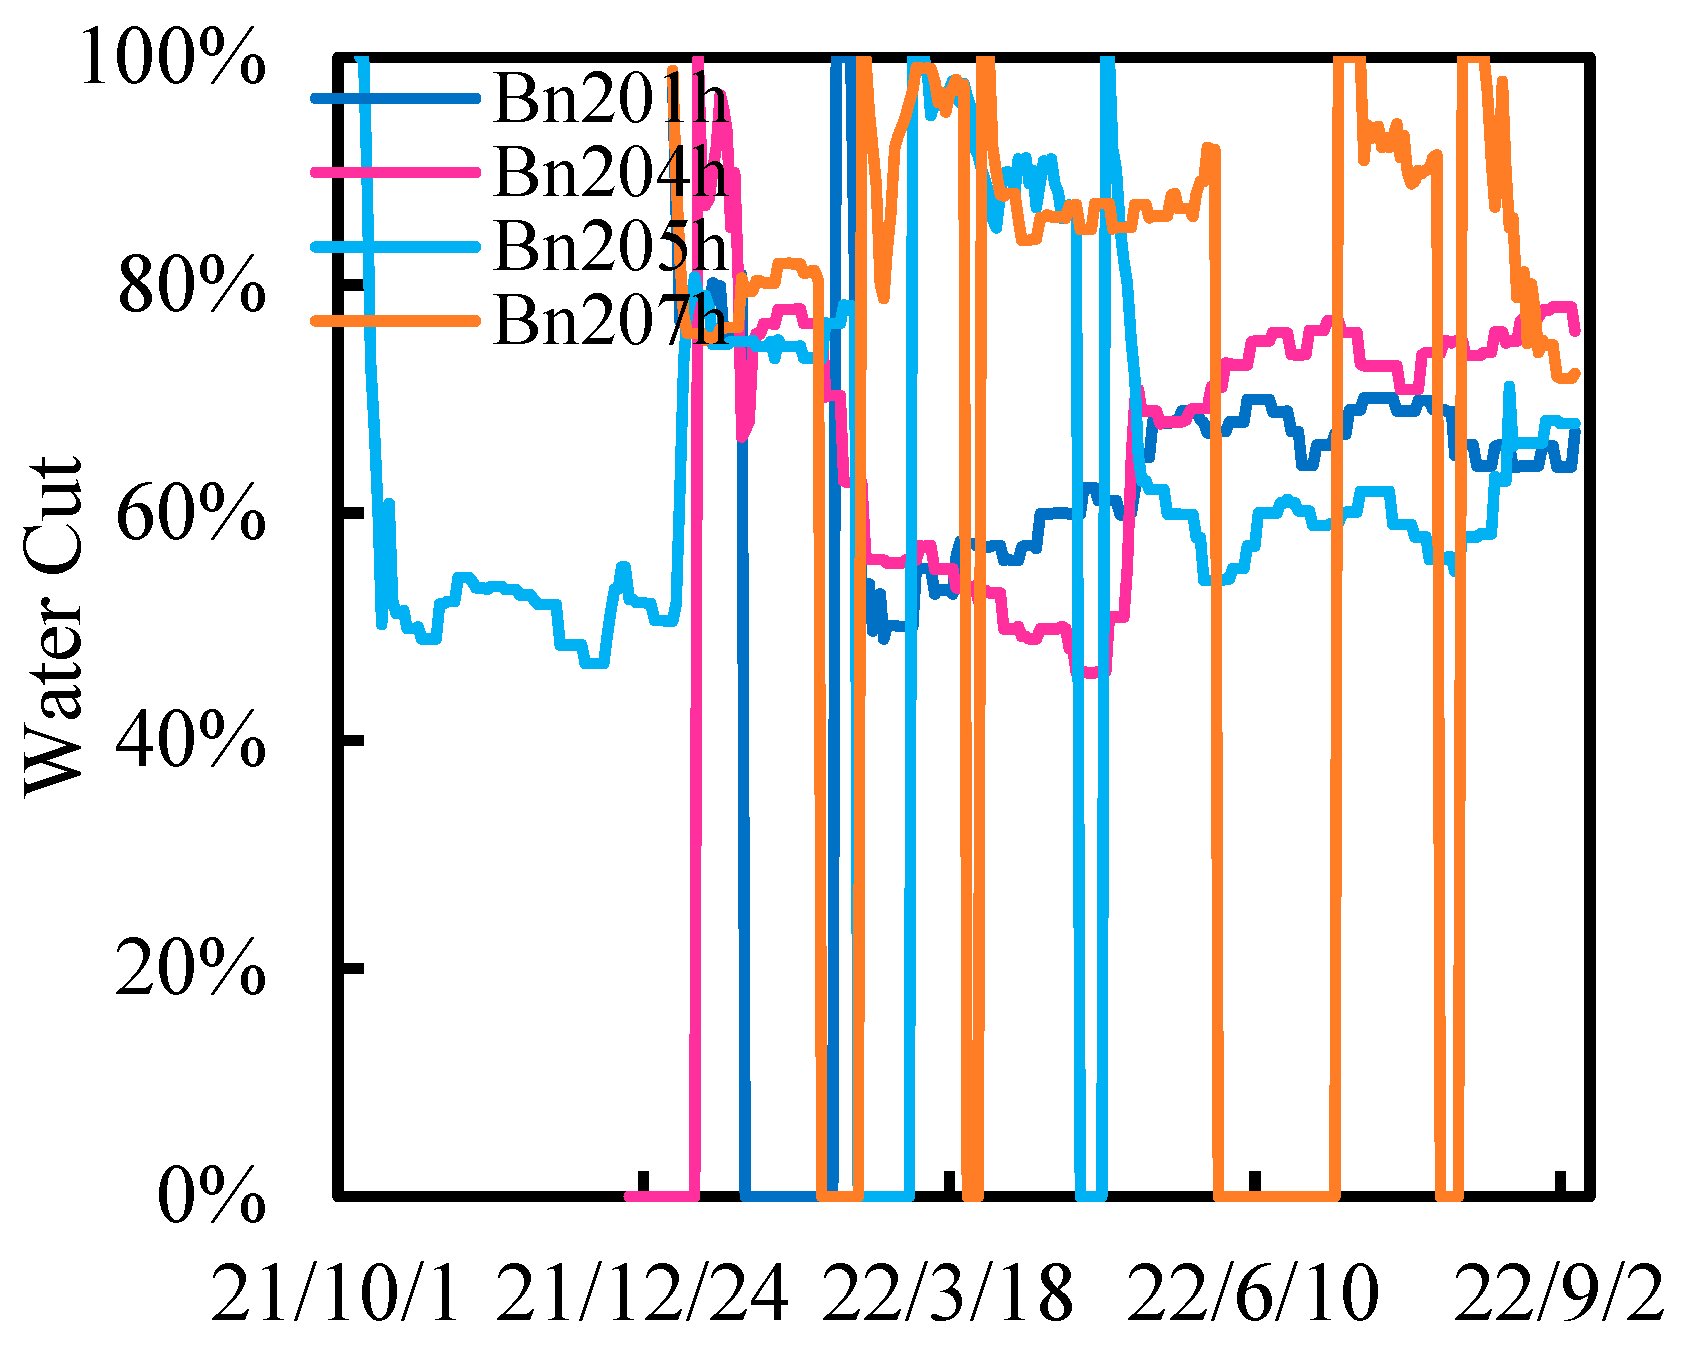
3.2.2. Edge Area
3.3. Current Evaluation
4. Geological and Simulation Models
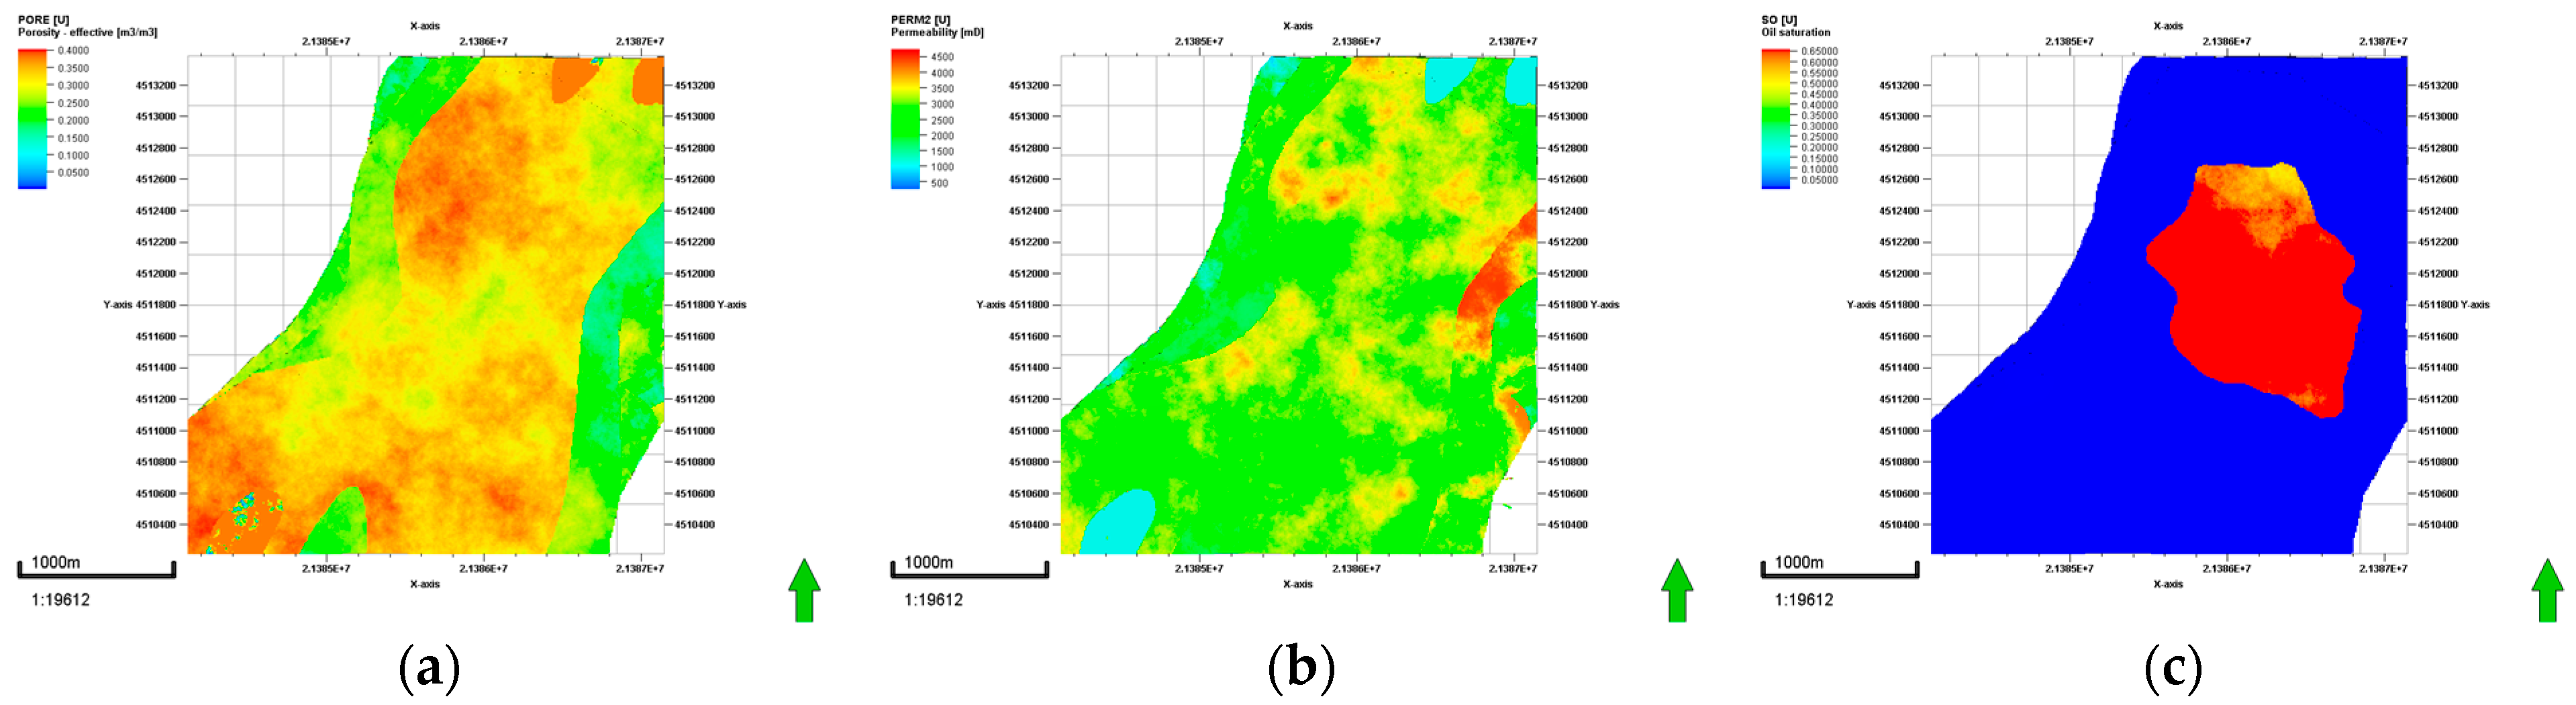
4.1. Geologic Modeling
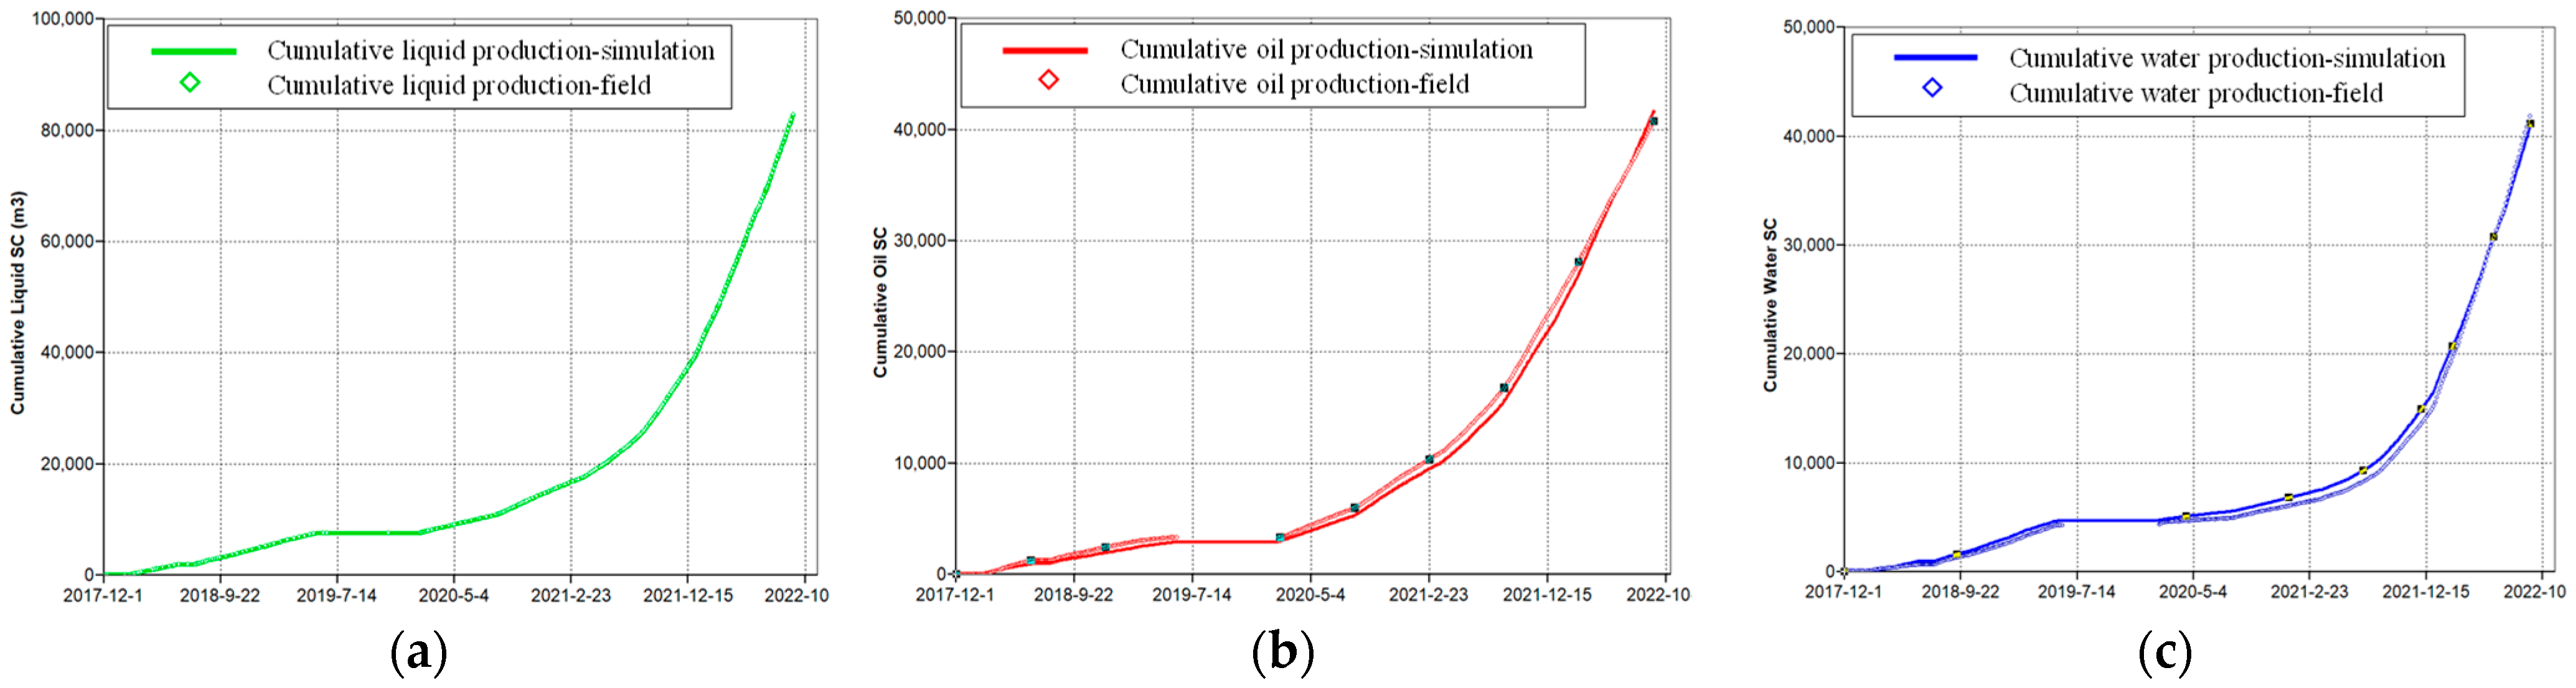
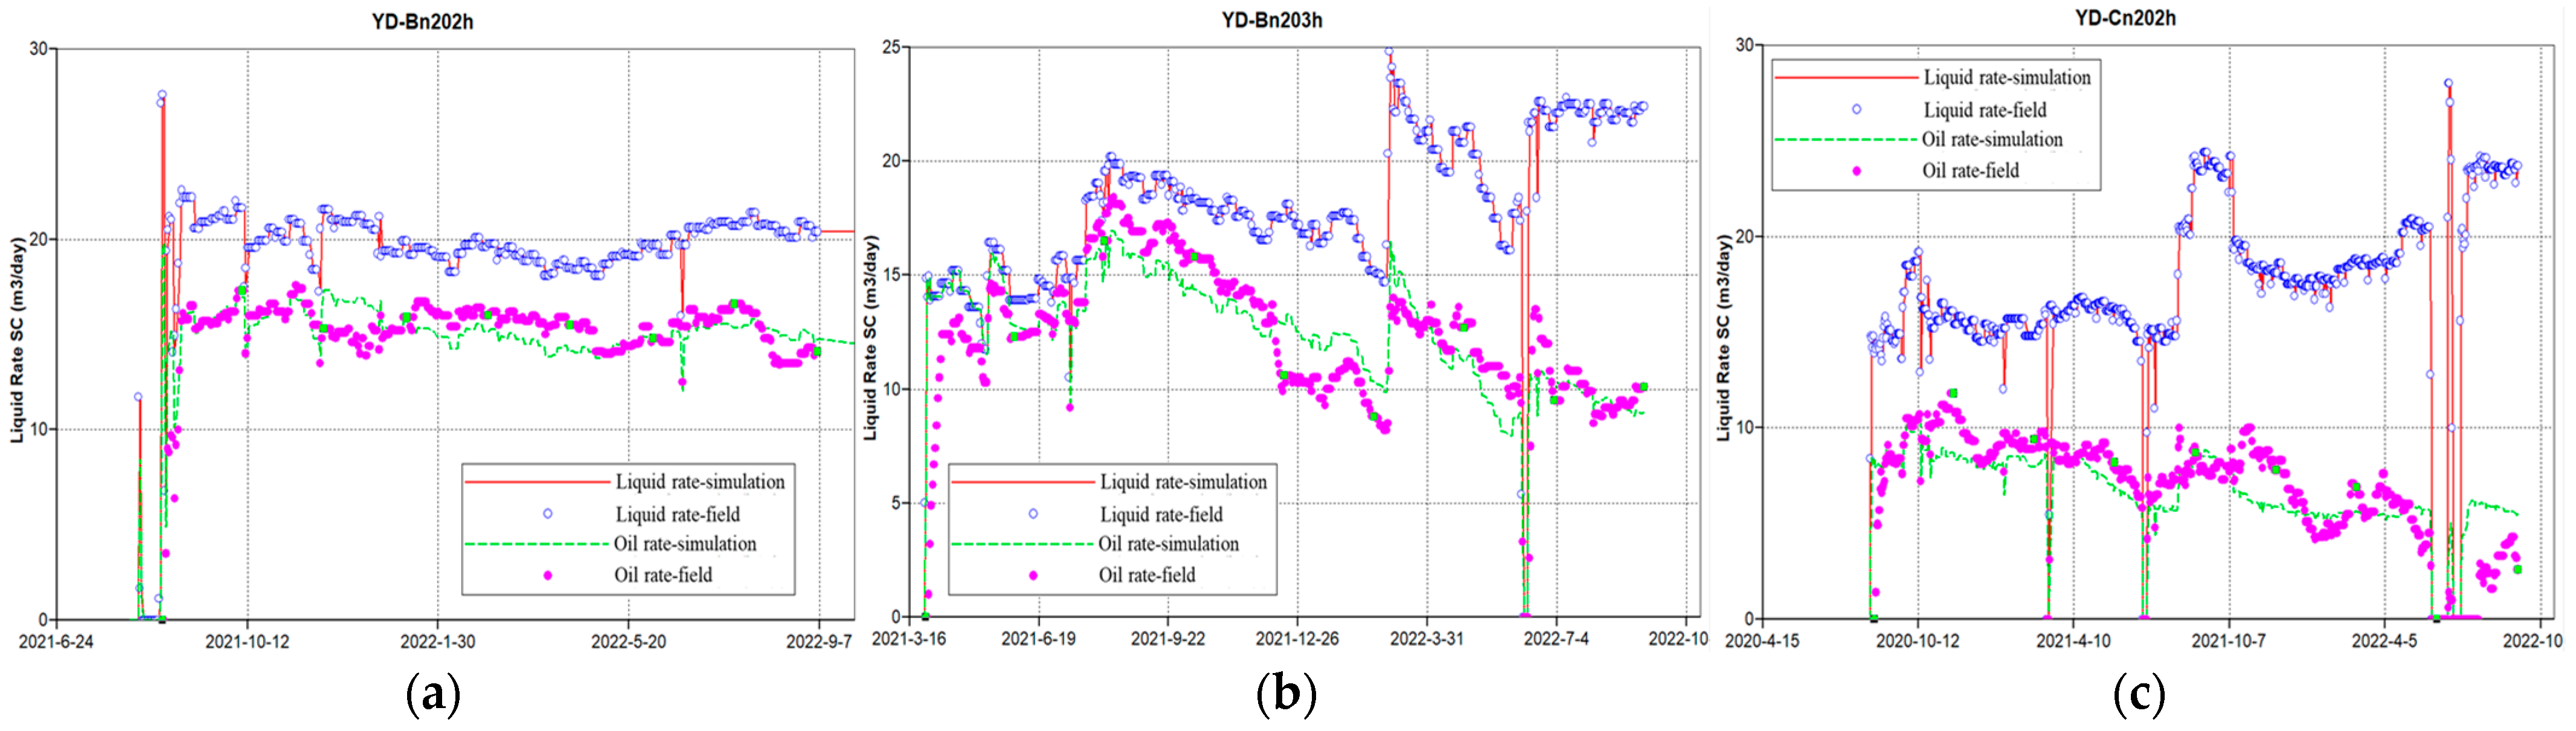
4.2. Simulation Model and History Matching
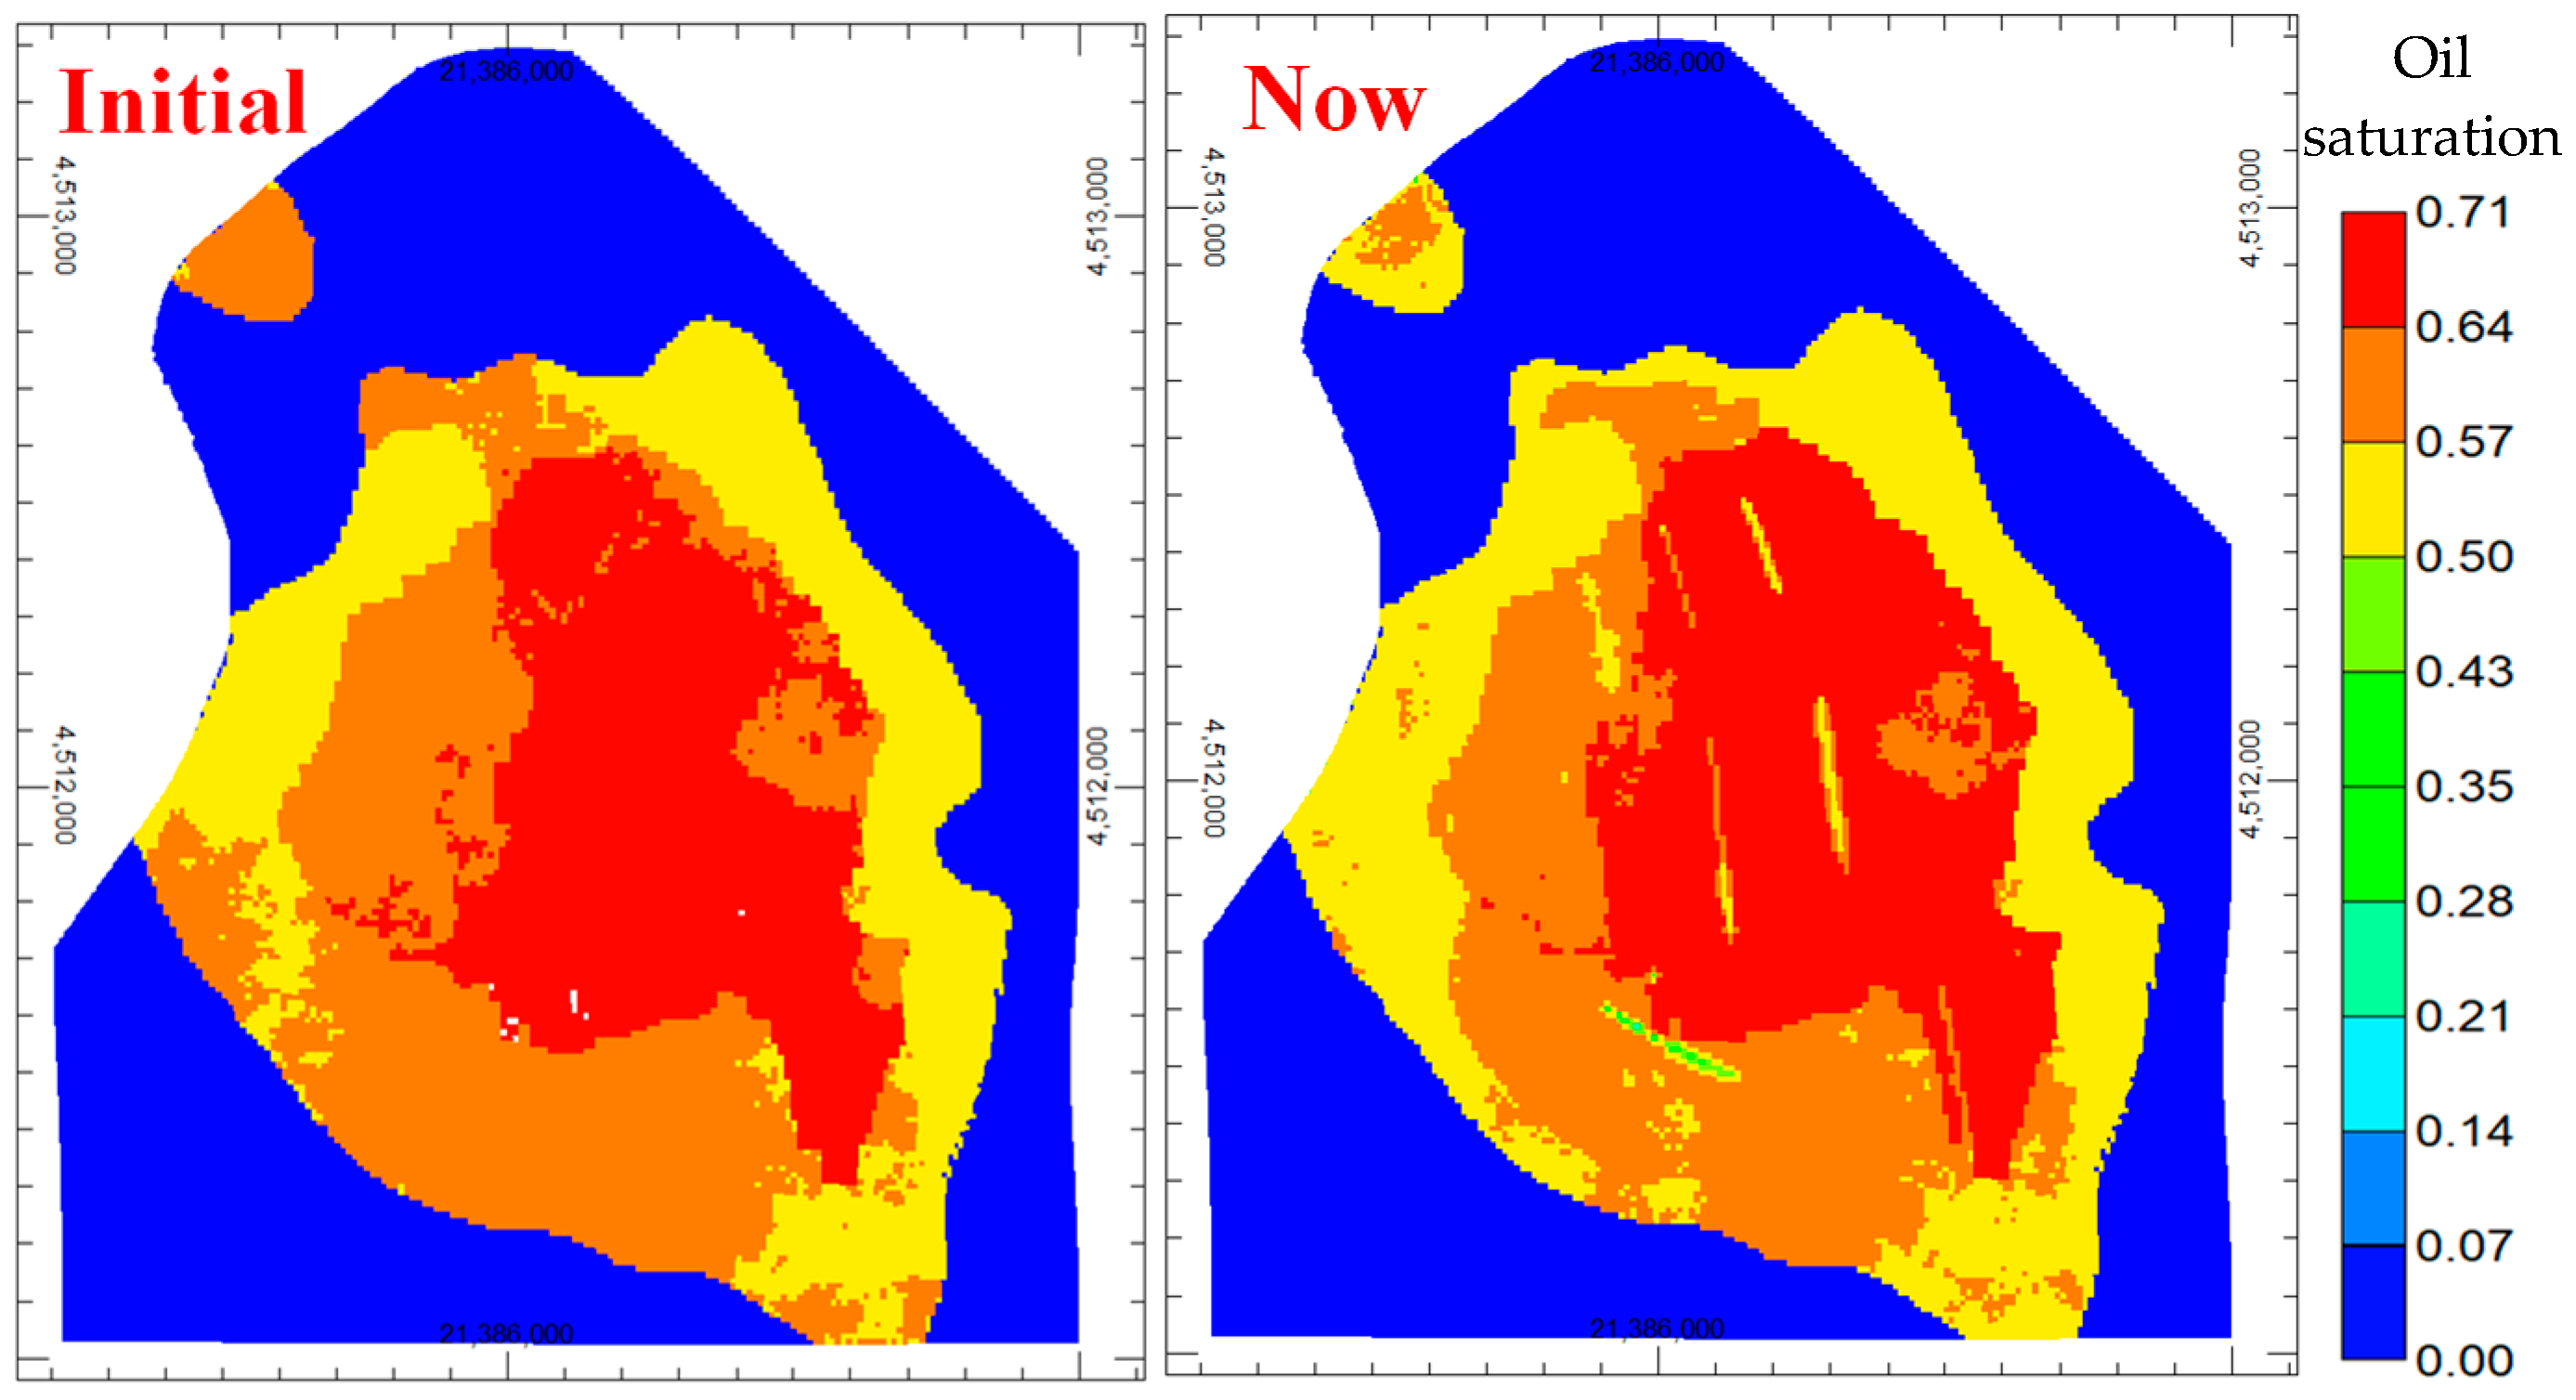
4.3. Residual Oil Distribution
5. Exploitation Scheme Design
5.1. Steam Huff and Puff Optimization
5.1.1. Steam Injection Parameters
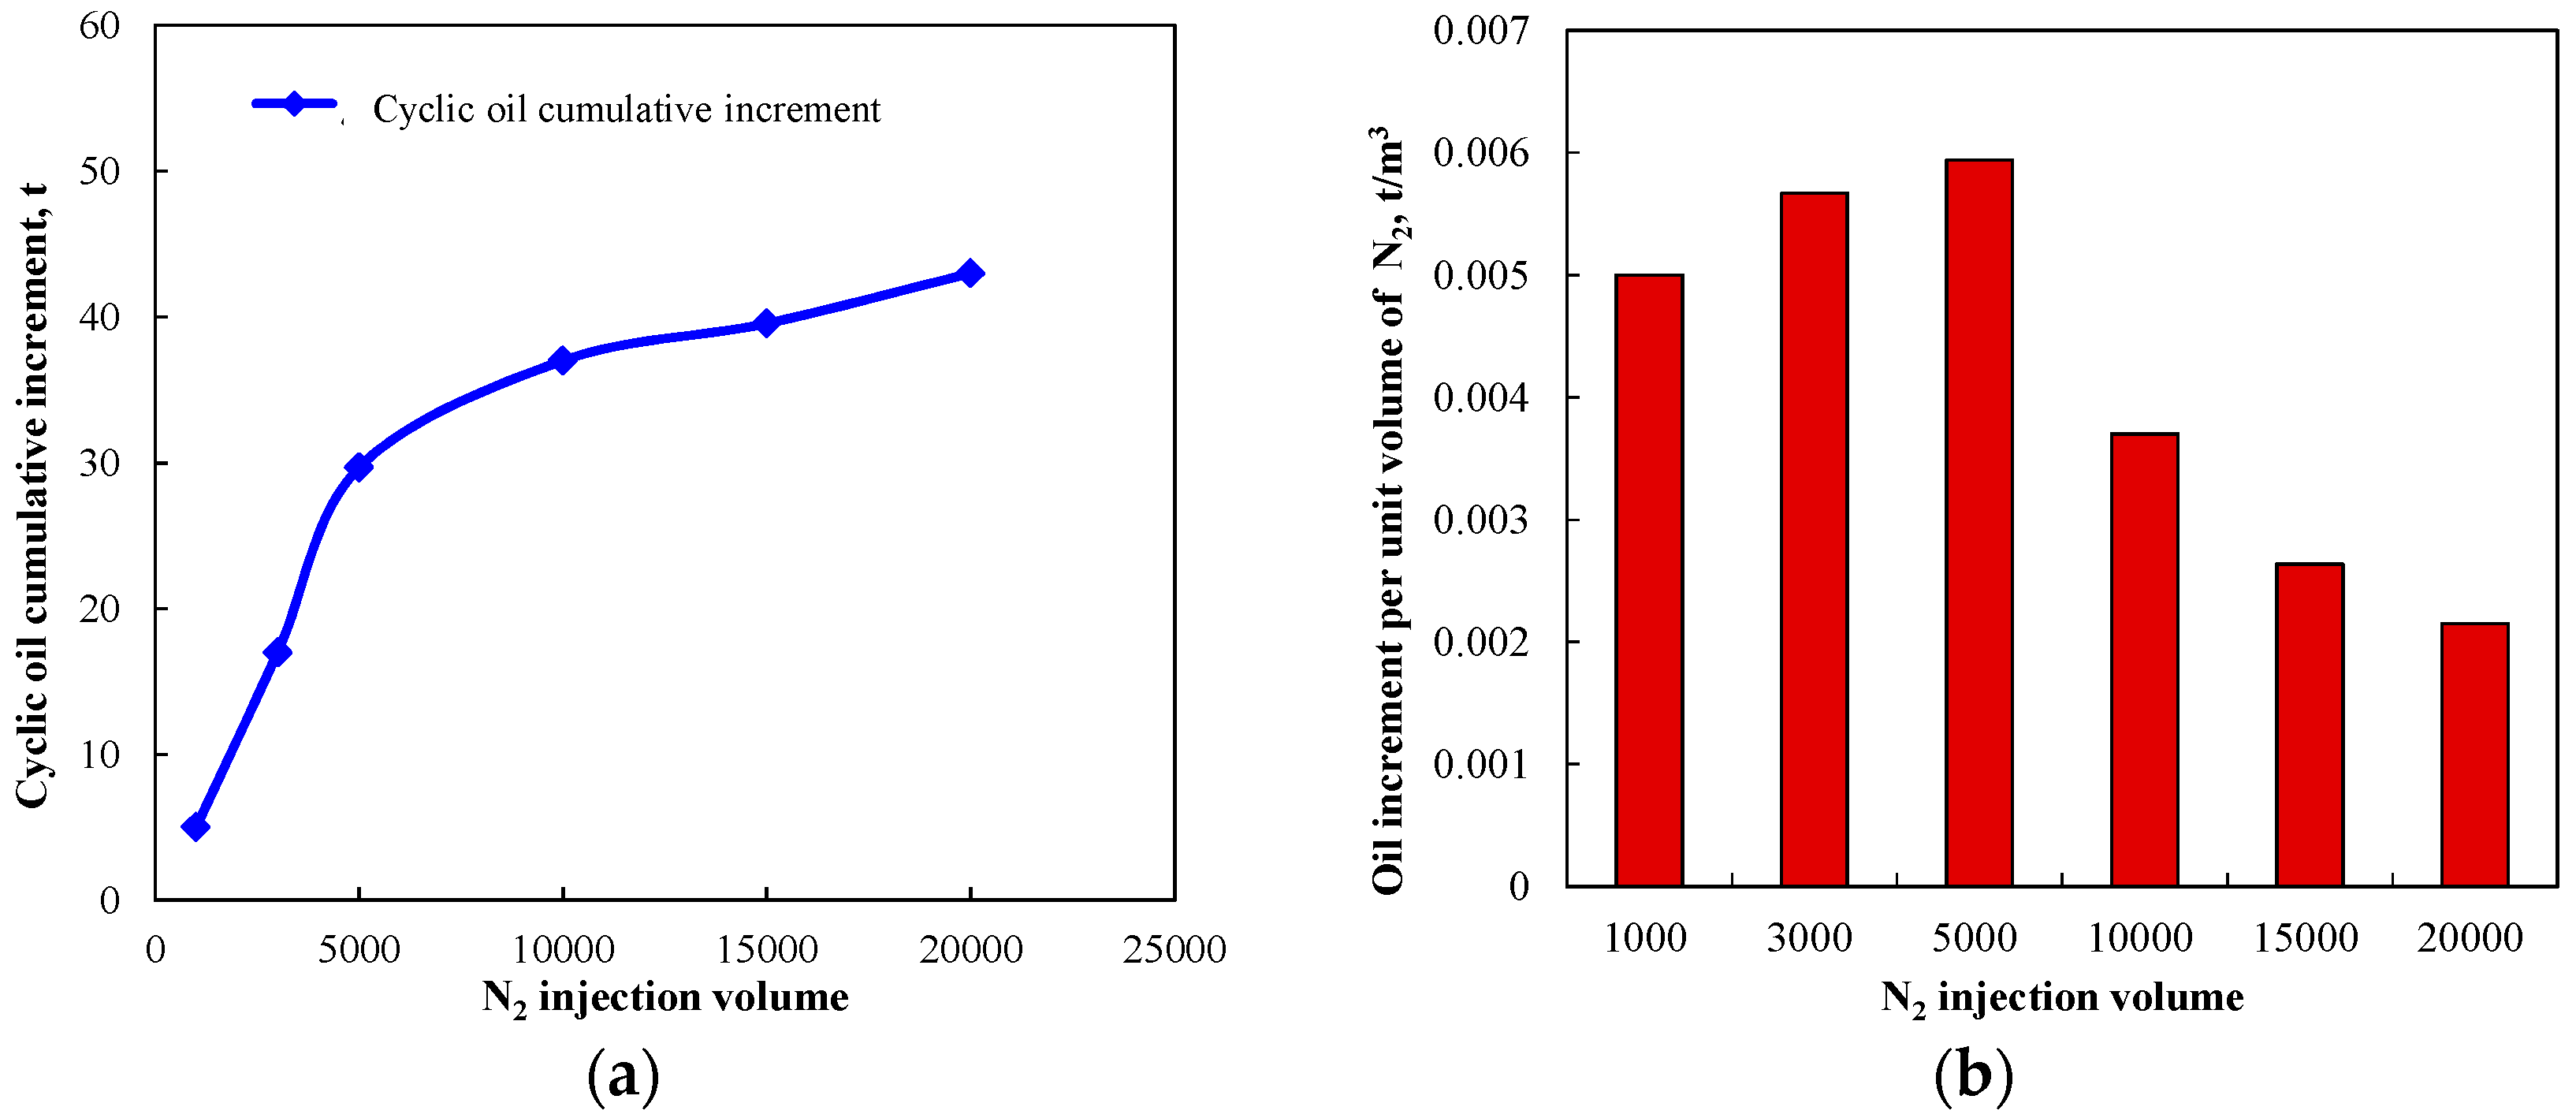
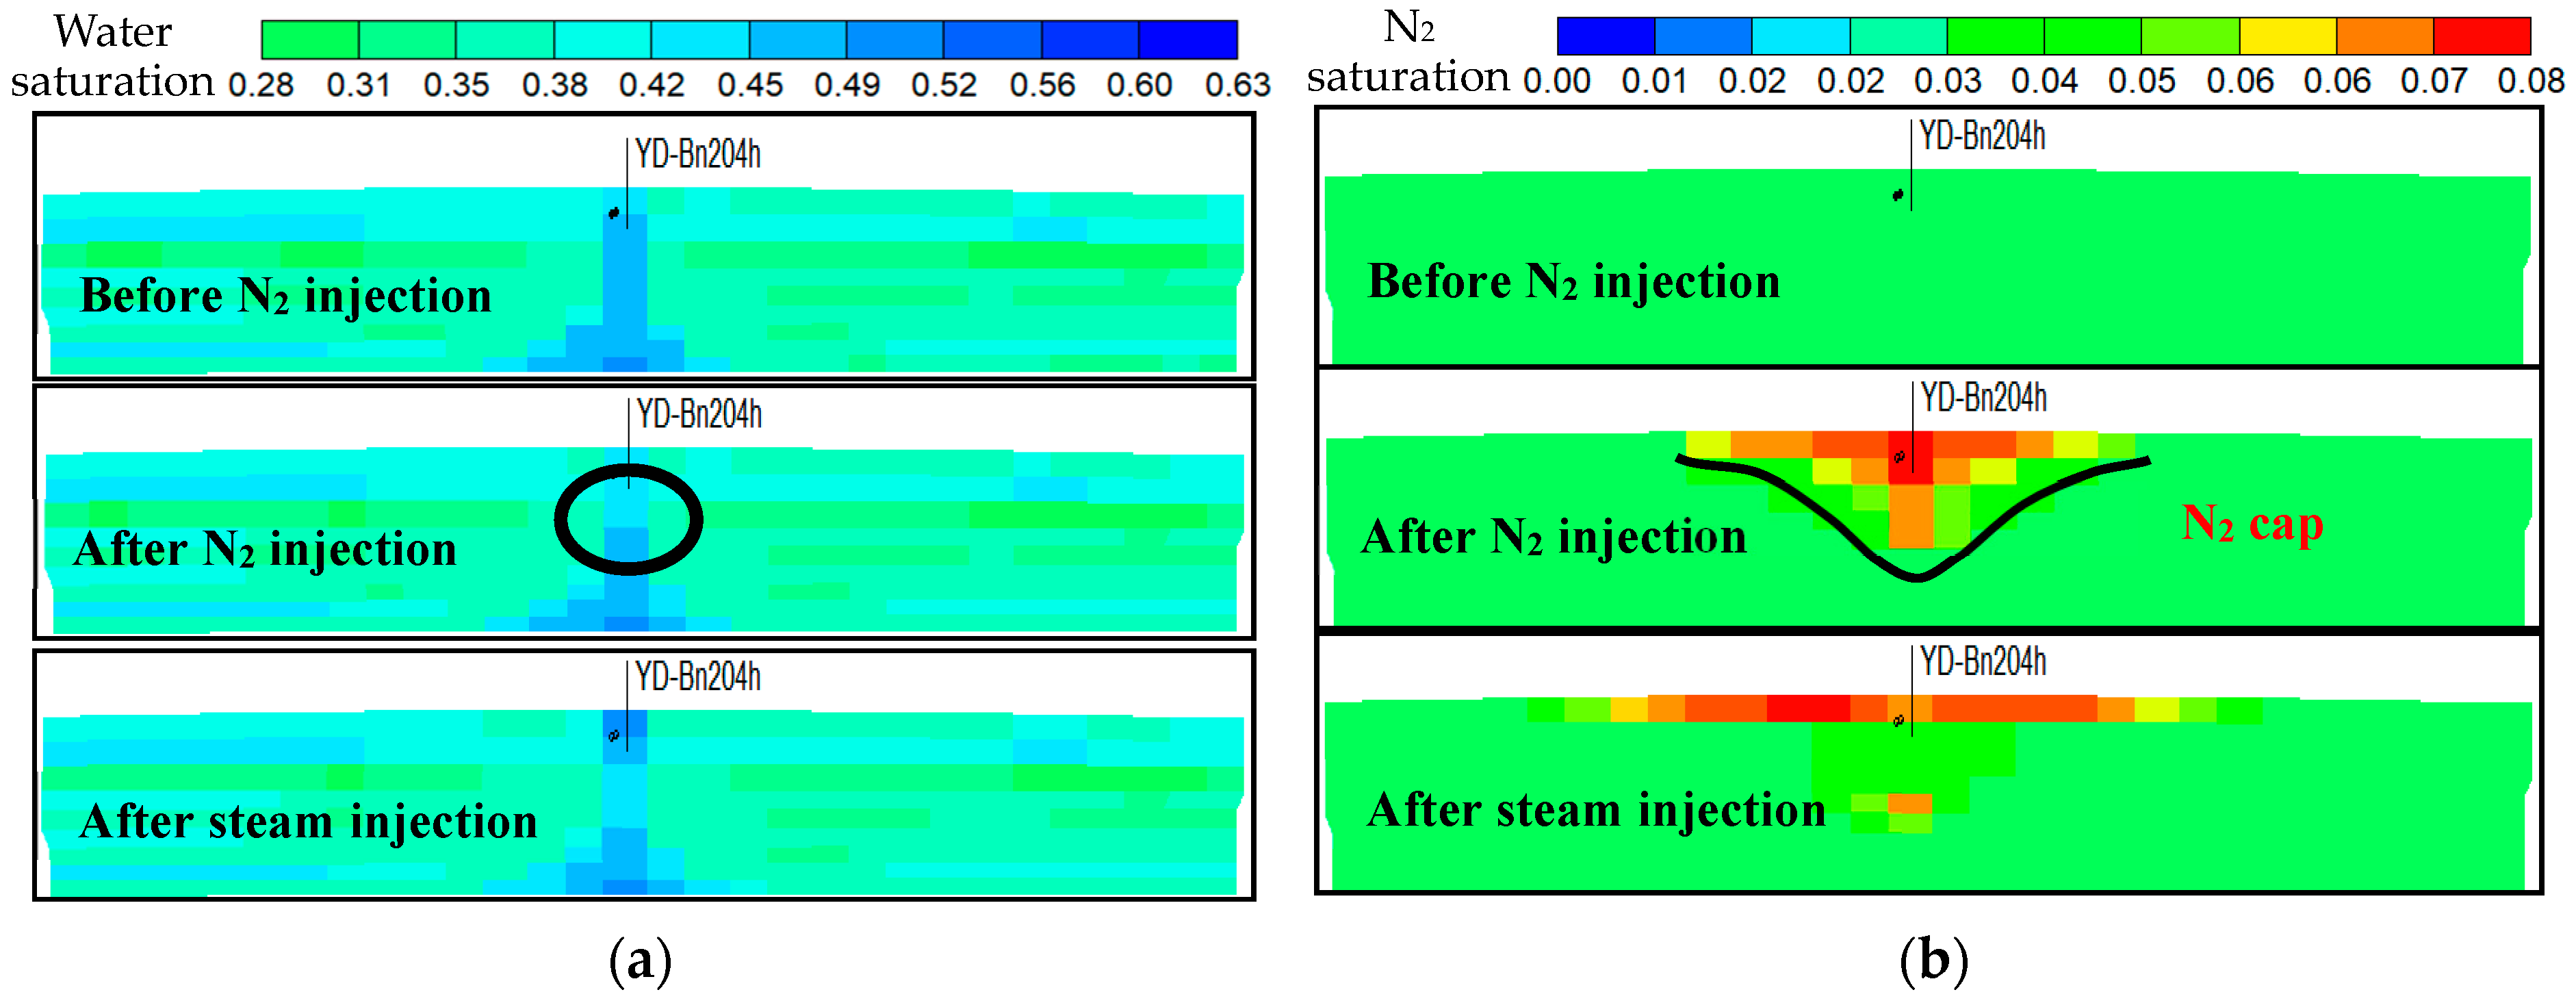
5.1.2. N2-Assisted Steam Huff and Puff
5.1.3. CO2-Assisted Steam Huff and Puff
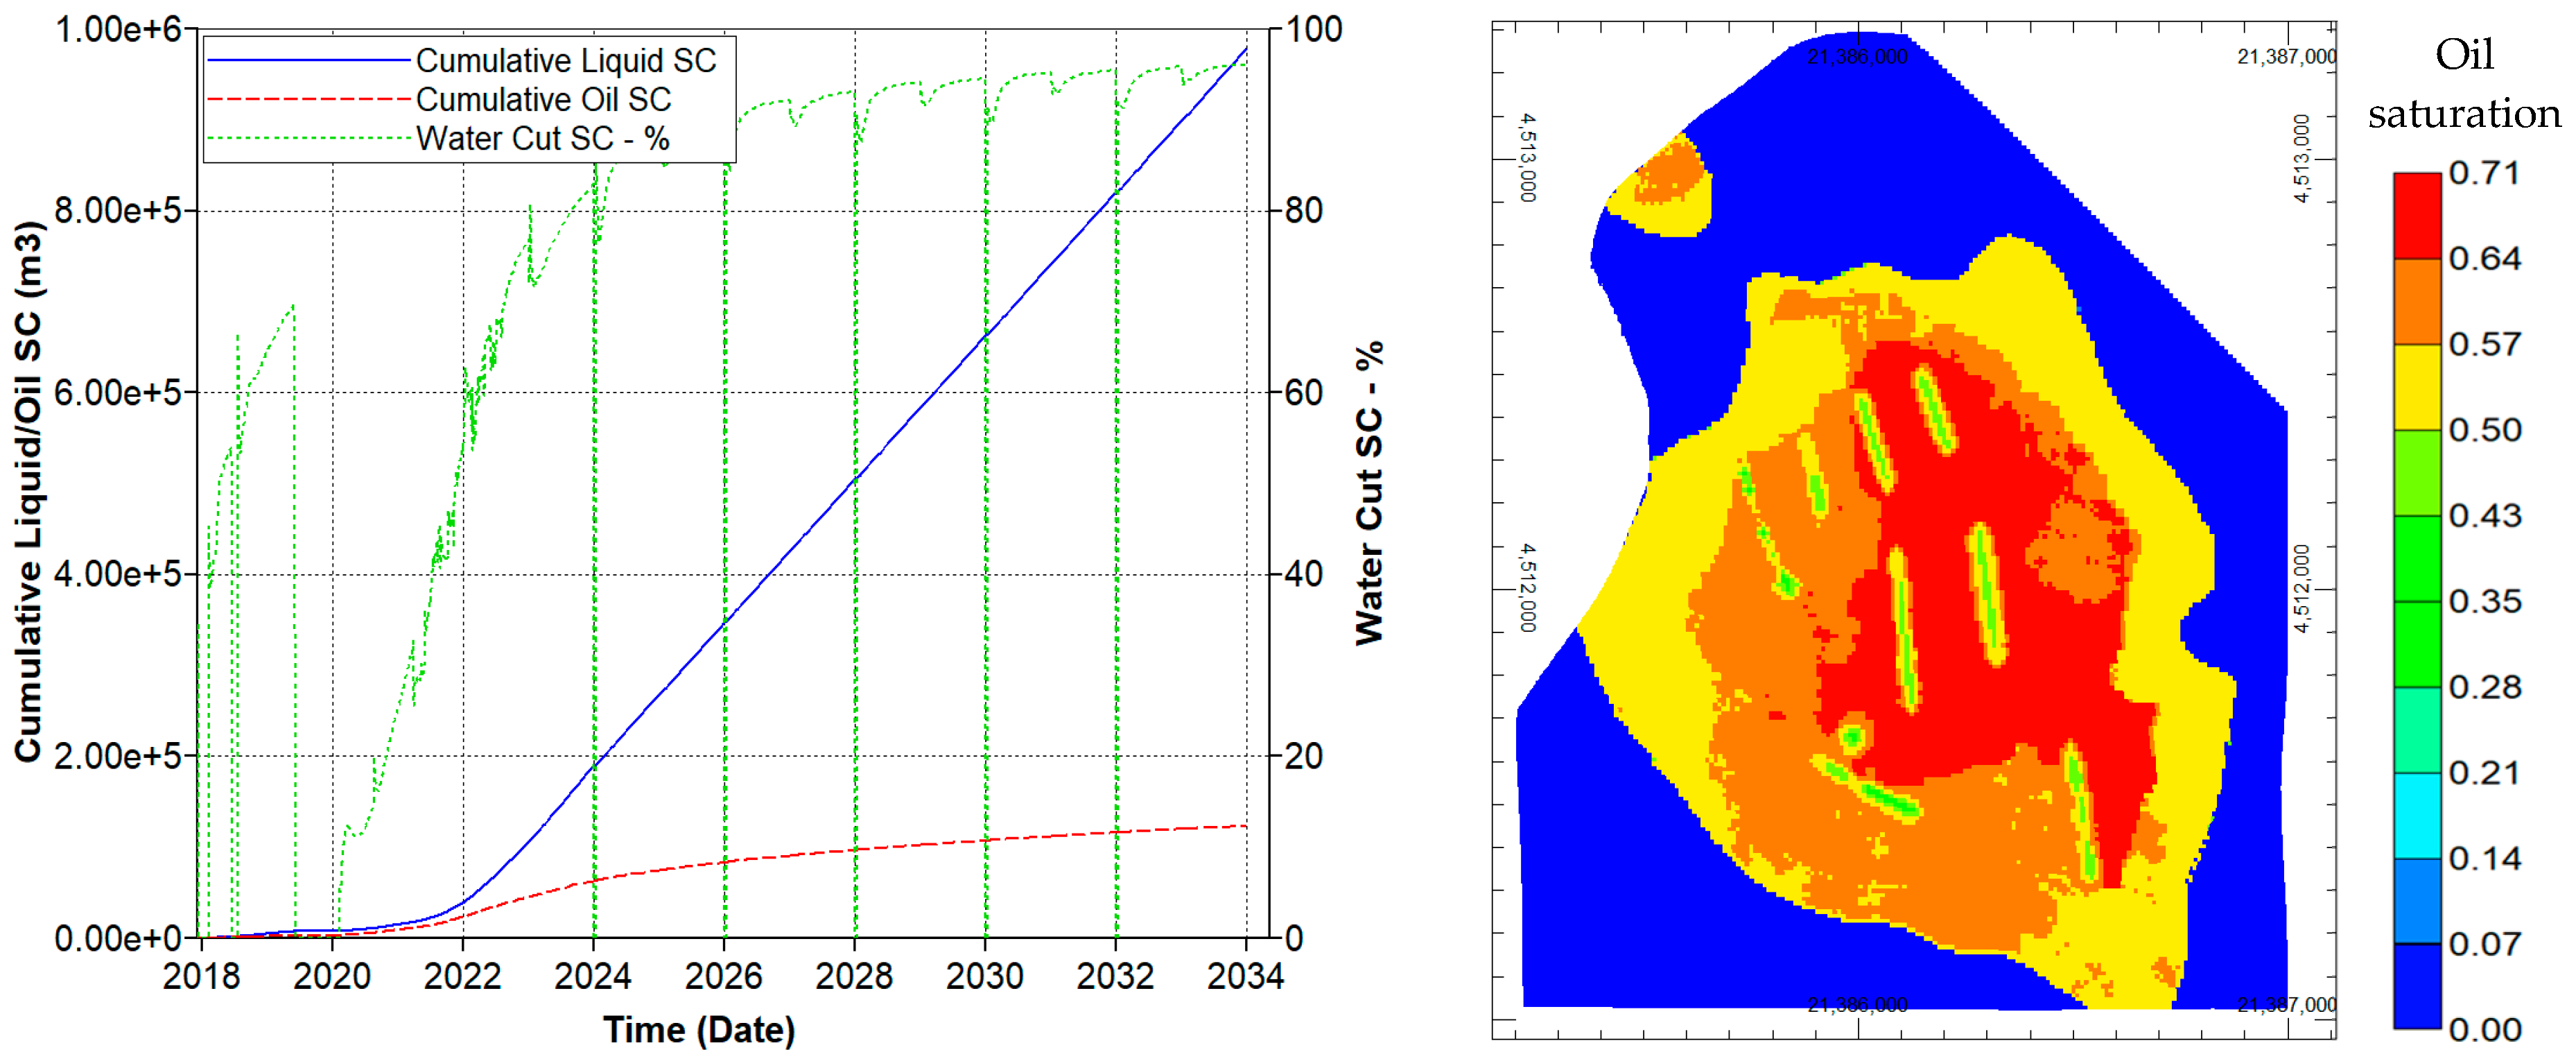
5.2. Exploitation Optimization and Production Forecast
6. Conclusions
- (1)
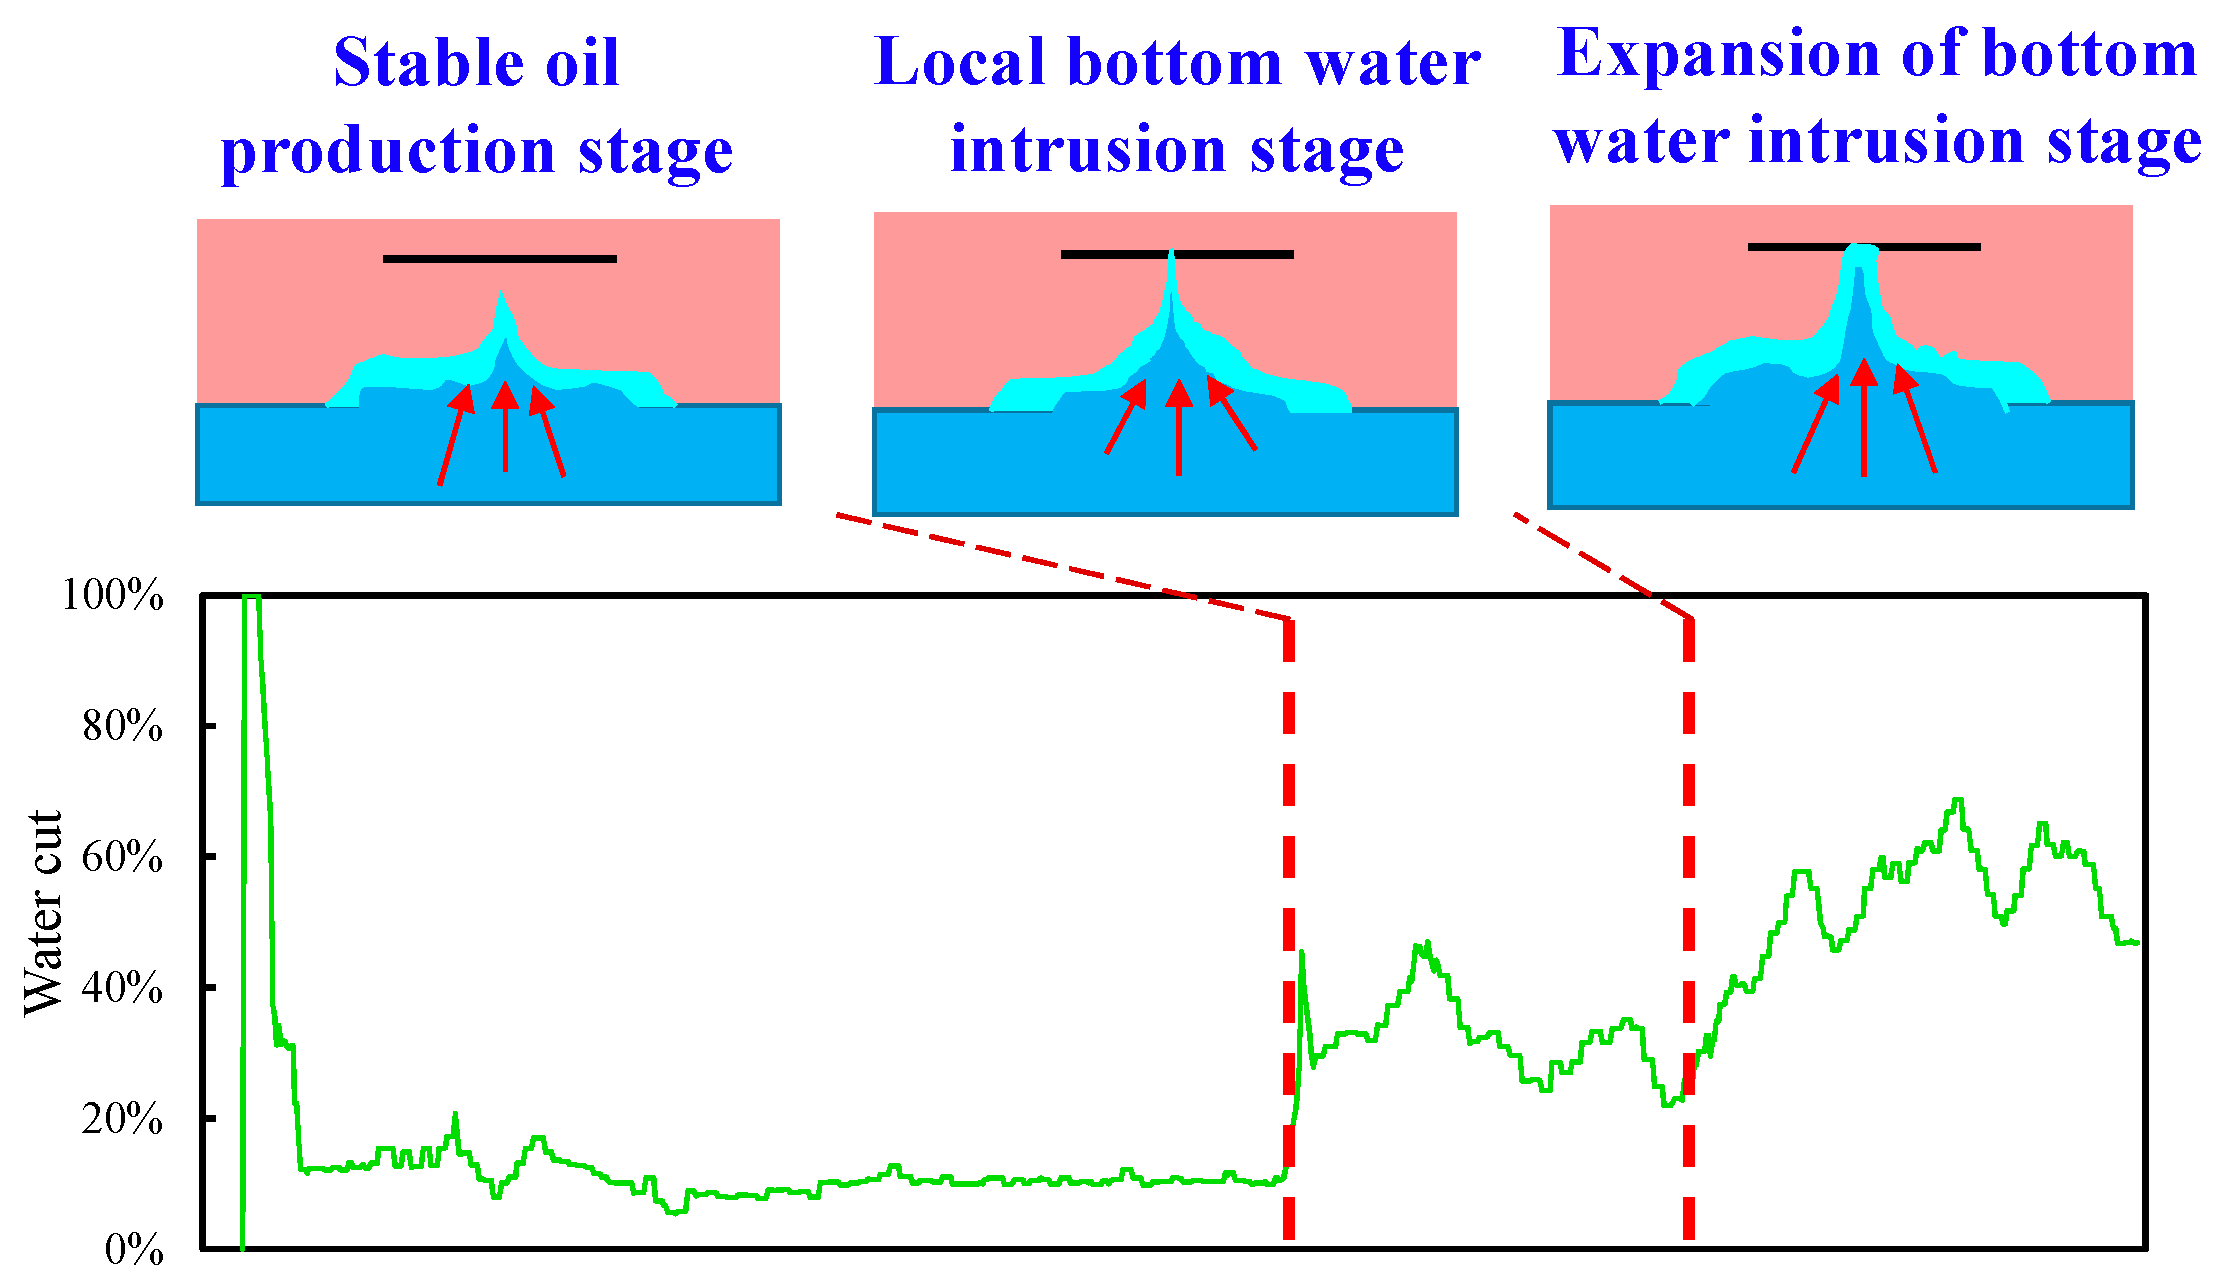
- The oil in the NgI reservoir comes from the lower formation along the fault, and the migrated oil contacts with groundwater for a long time due to insufficient force. During the long-term contact between oil and water, the oil undergoes oxidation reactions, and the viscosity of the oil at the migration front becomes higher due to the oxidation reaction. Combined with the abundant edge and bottom water, the reservoir may be identified as a self-sealing bottom water heavy oil reservoir.
- (2)
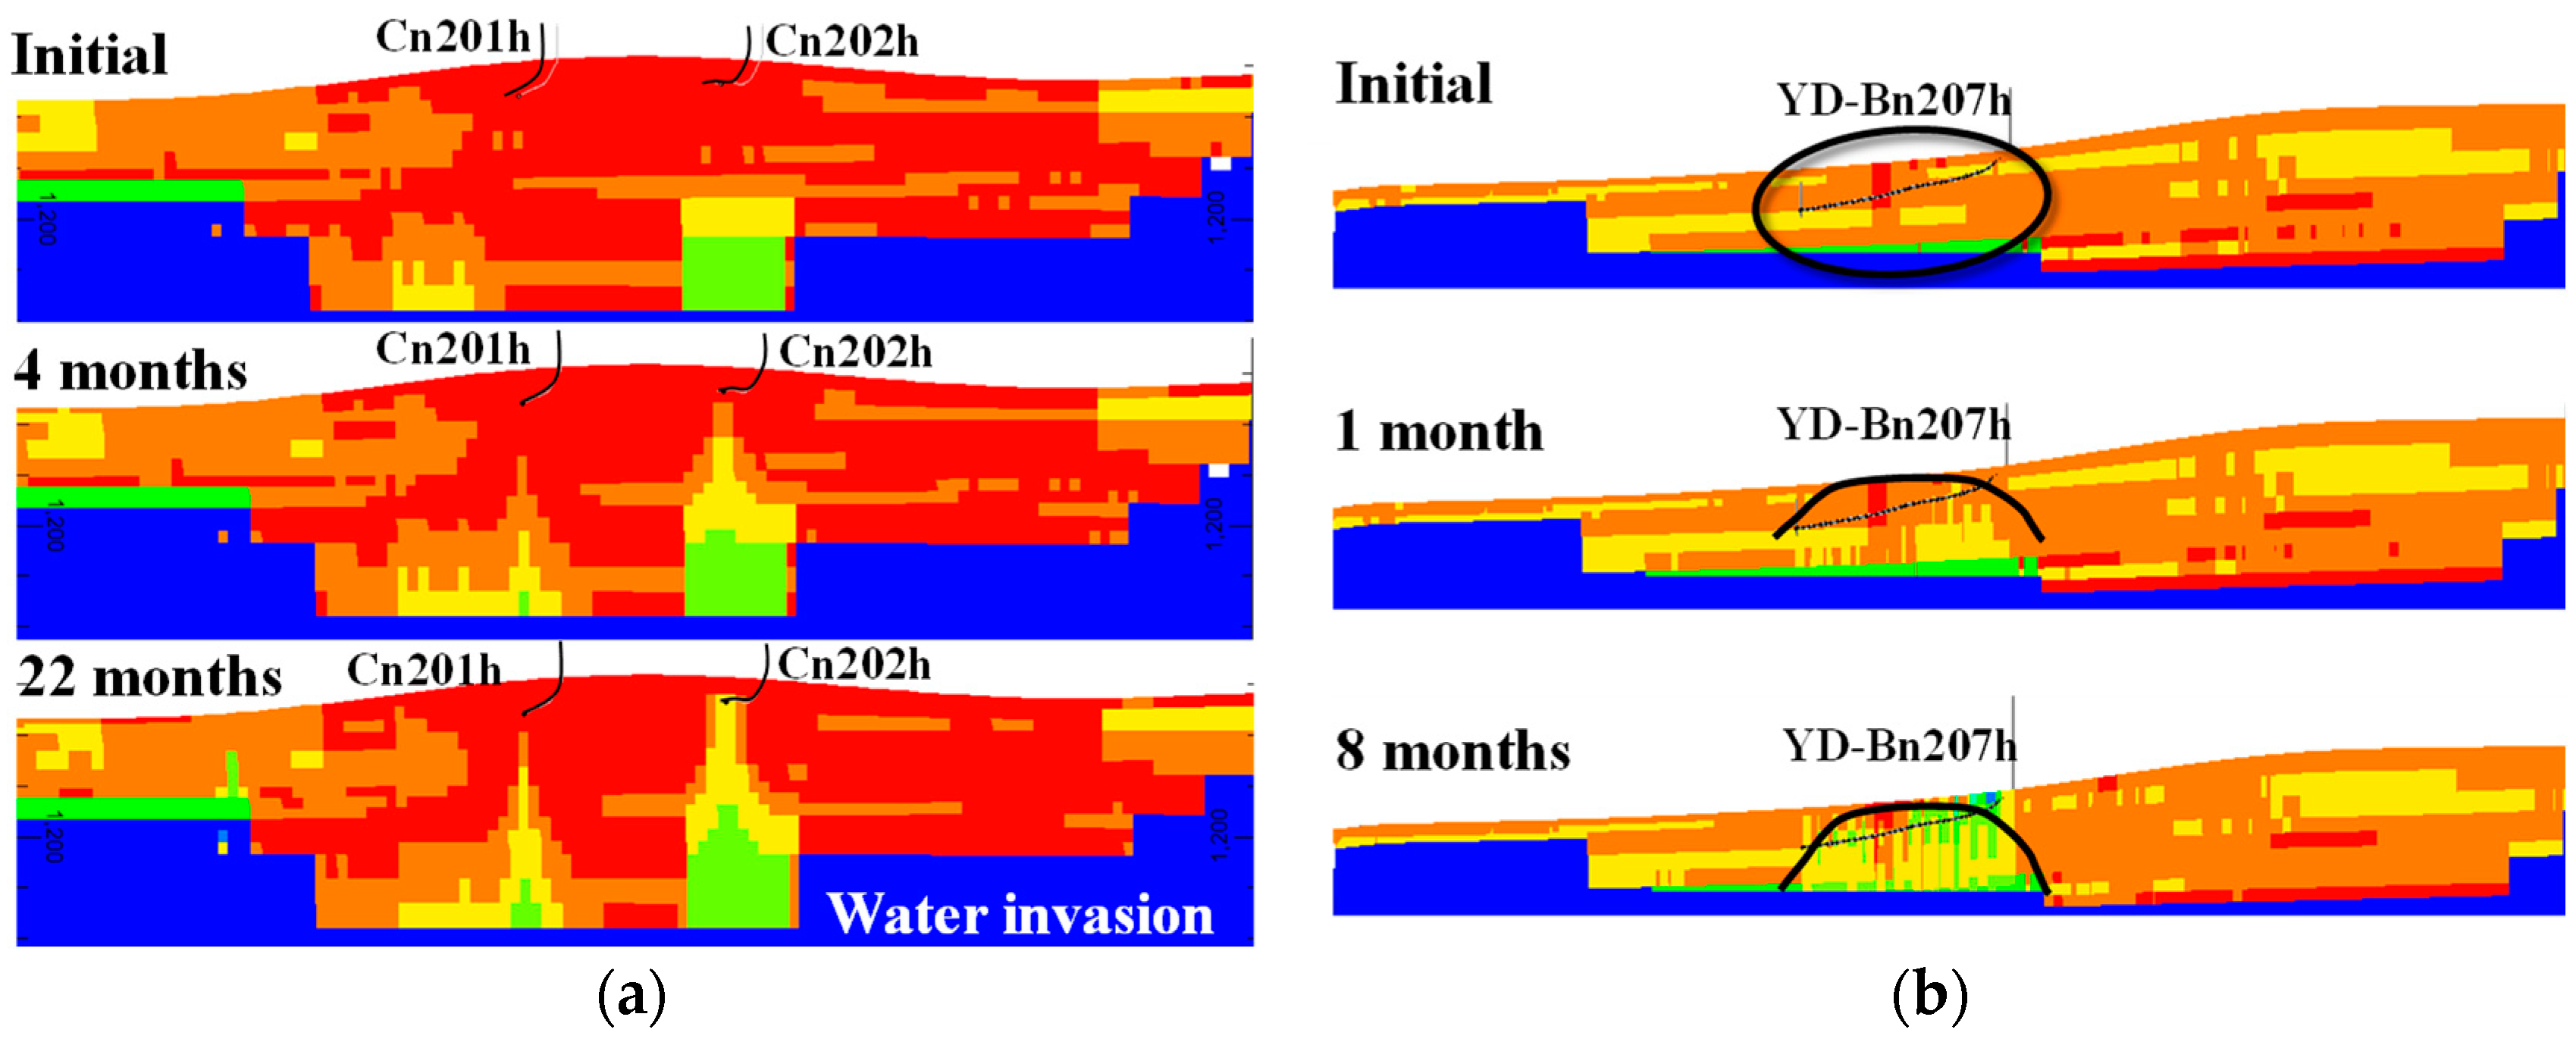
- The oil viscosity in the middle area is high while the oil viscosity in the edge area is relatively low, so the steam huff and puff was adopted to exploit oil in the edge area. Although the water cut in the middle area has risen to about 60% after a long period of oil exploitation without steam injection, the effect of steam huff and puff on oil increment is not obvious. At present, the cyclic steam injection volume in the edge area is controlled at about 1000 tons, which can barely achieve stable oil production. However, the oil production can be maintained only by increasing the cyclic steam injection volume in some wells in the edge area. Therefore, the current parameters of steam huff and puff still need to be optimized in combination with the accurate geological model.
- (3)
- Generally, whether steam huff and puff is adopted or not, the thinner the reservoir thickness, the higher the bottom water invasion rate and the faster the water cut rise, so it is crucial to identify the accurate bottom oil–water contact. To this end, based on the existing seismic and logging data, we re-corrected the oil–water boundary at the bottom of the reservoir through a reduplicative history matching of wells and reservoir, and then established a 3D reservoir geological model. This geological modeling method with accurate oil–water contact can be extended to other oil reservoirs.
- (4)
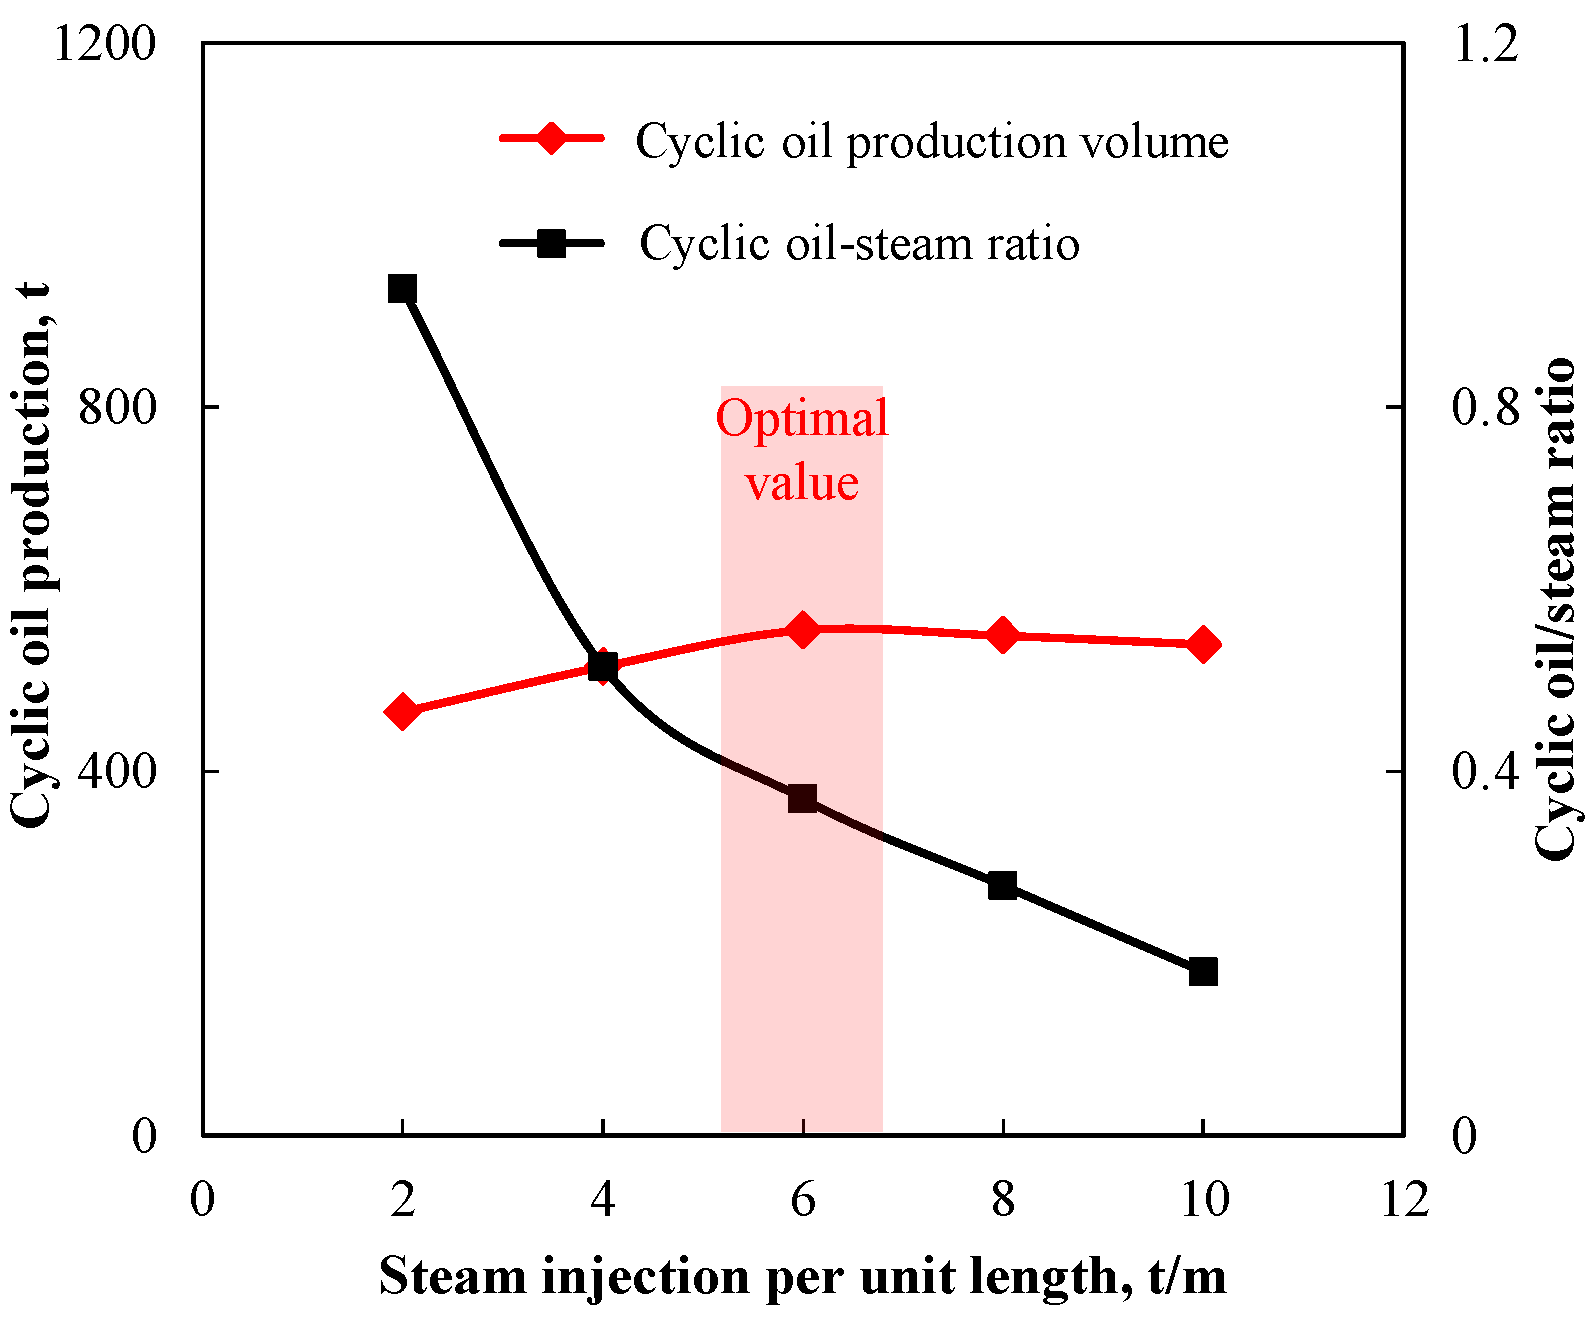
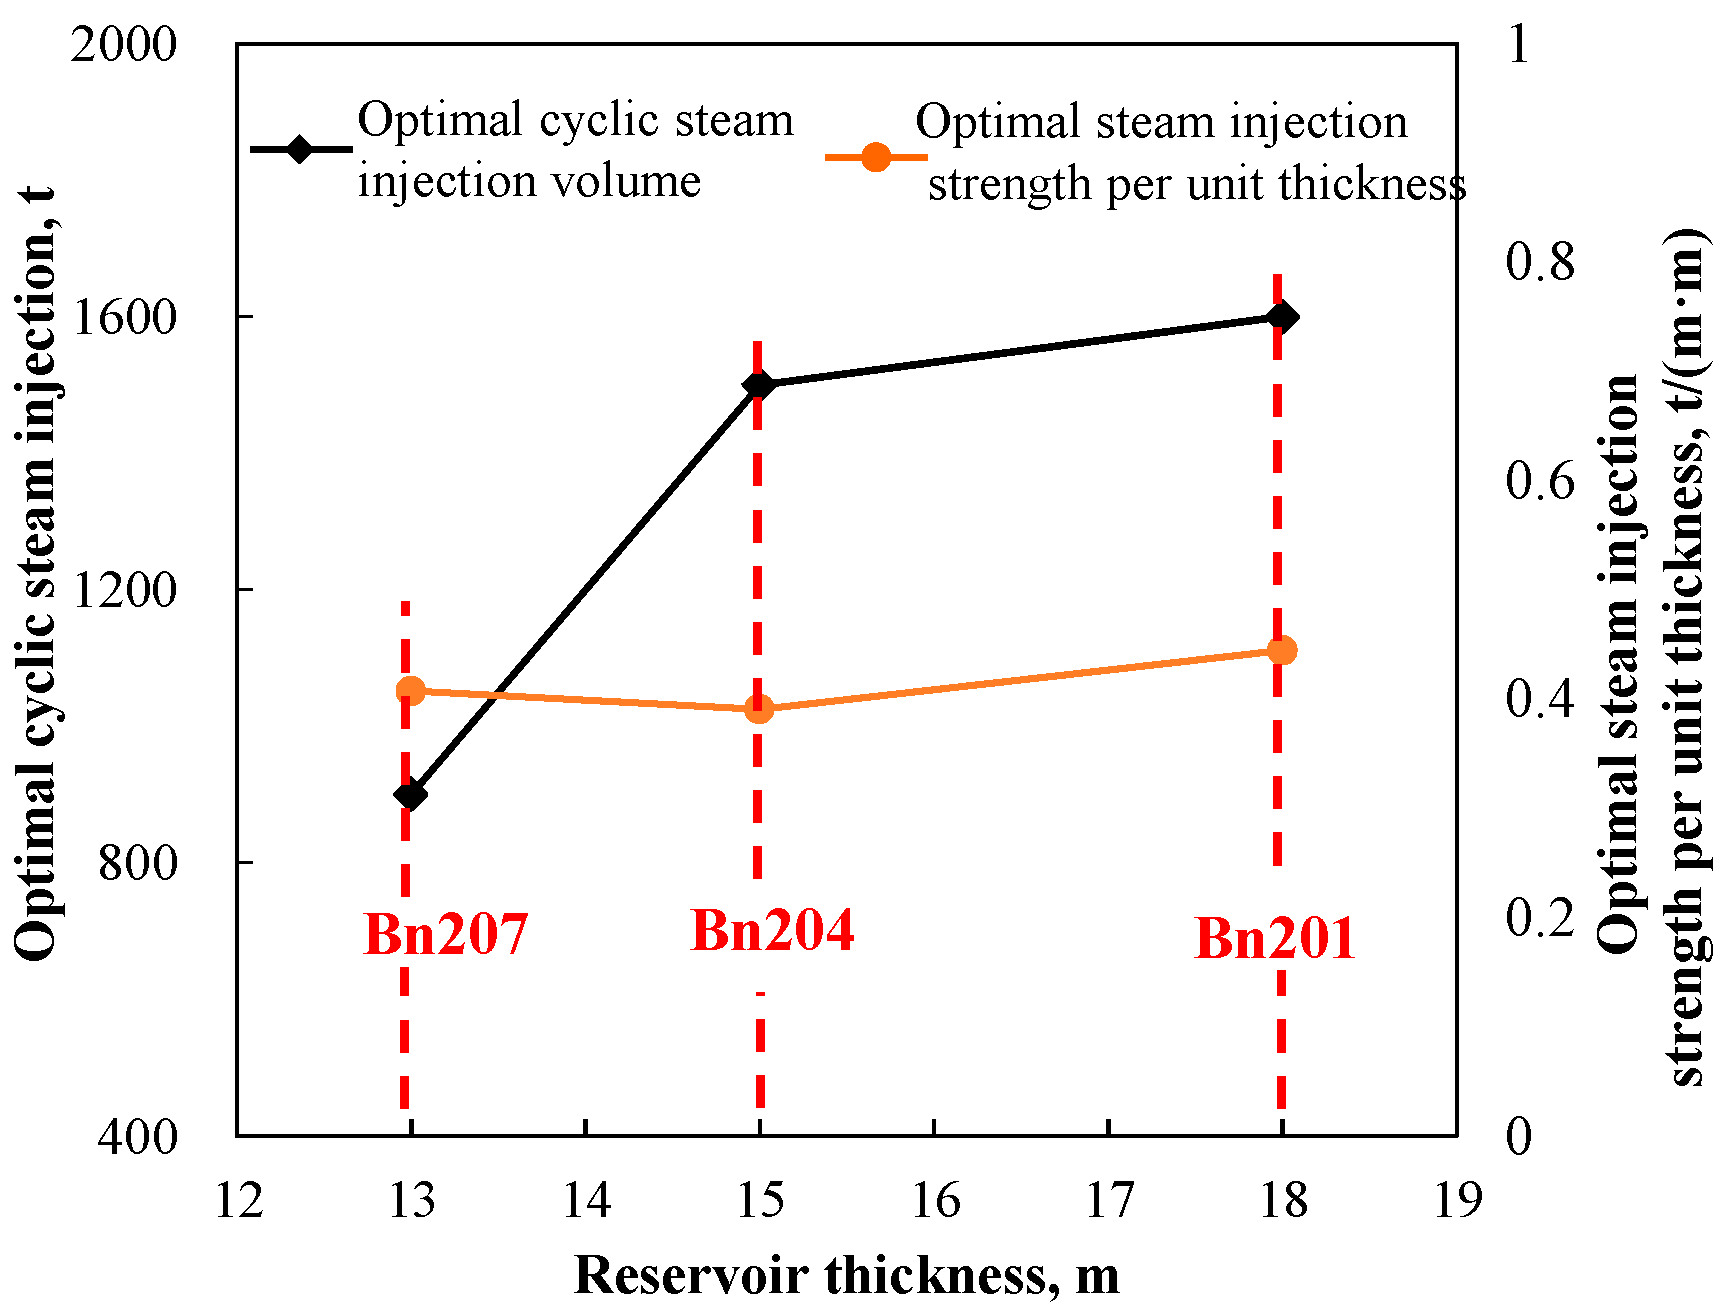
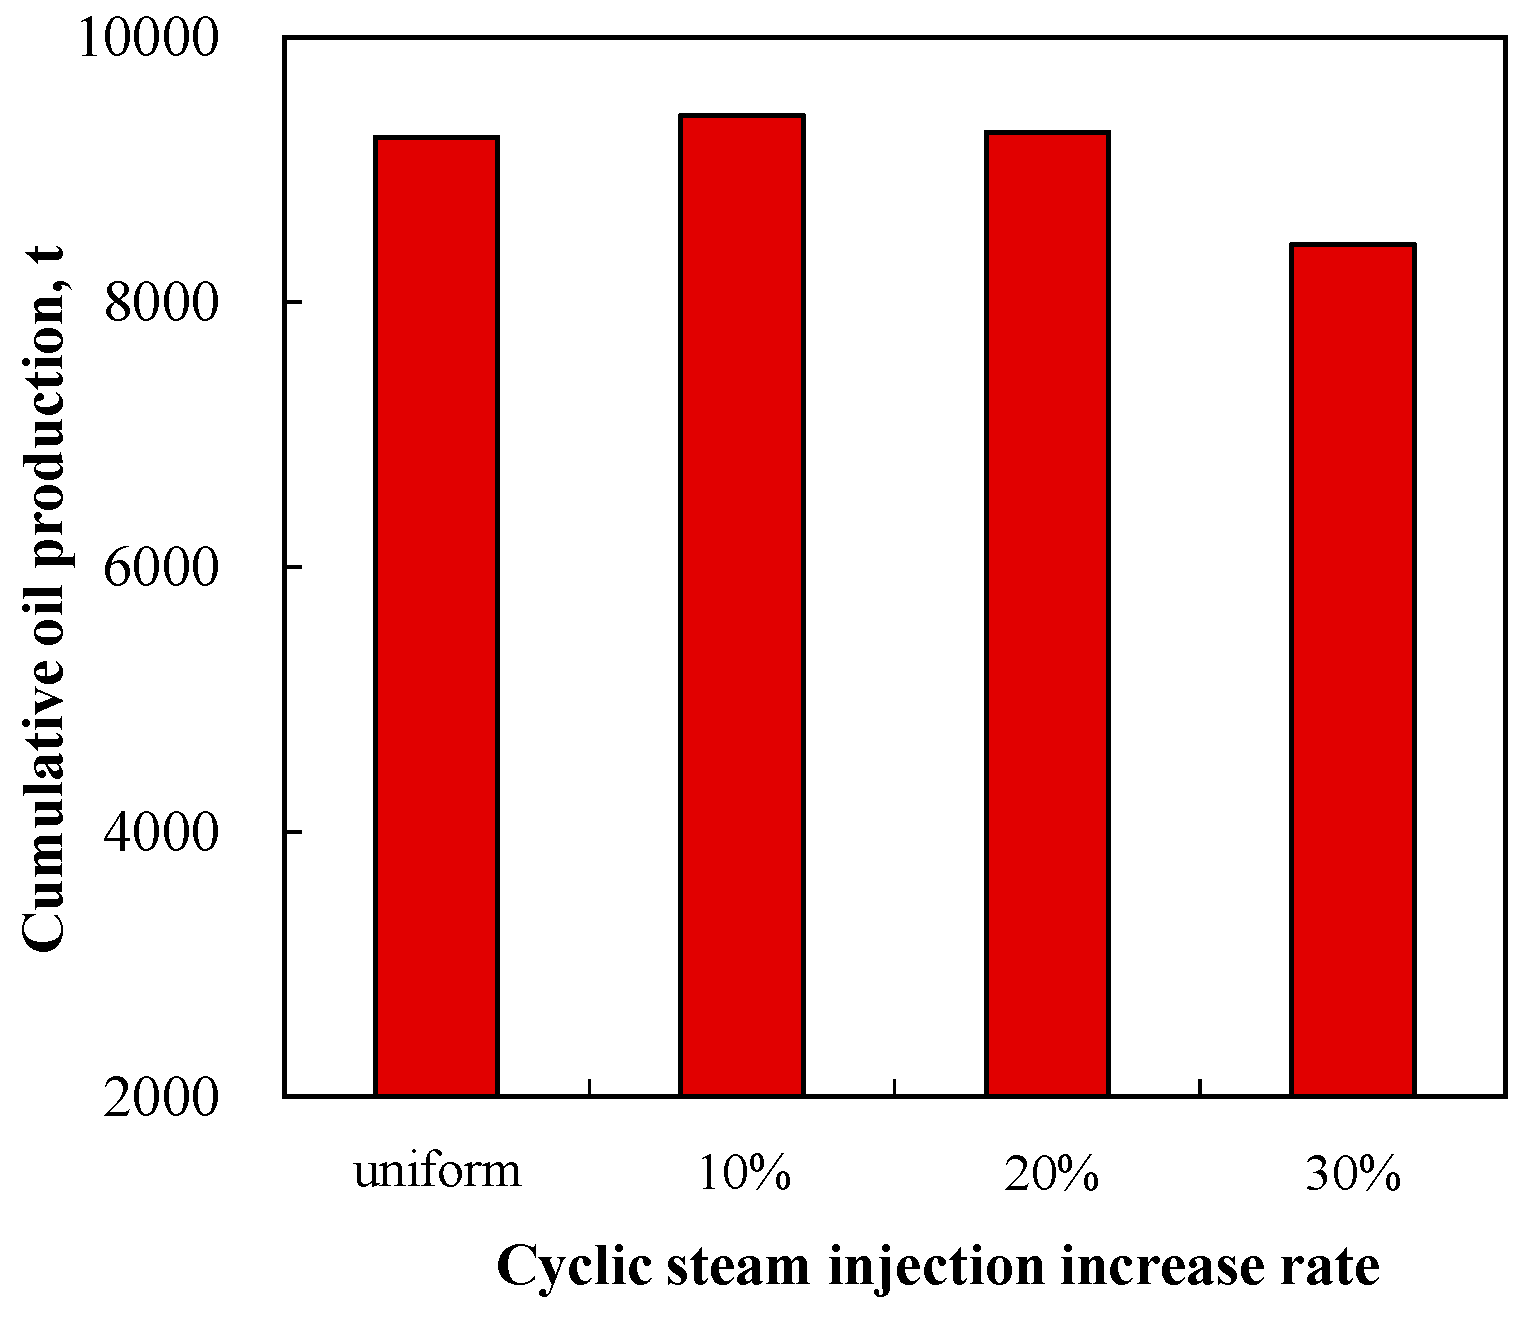
- All of these kinds of offshore heavy oil reservoirs can be developed by a combination of thermal production and cold production. The specific production and steam injection values depend on the specific reservoir condition, and more importantly, the cyclic steam injection volume should be designed after considering the reservoir thickness. For this case study, the value of dividing the cyclic steam injection volume per unit length by the reservoir thickness is suggested to be 0.4 t/(m·m). The steam injection rate is set to 400 t/d, and the liquid production rate is set to 20 m3/d. The optimal exploitation scheme predicts that 84 thousand tons of oil could be exploited by 2034.
Author Contributions
Funding
Data Availability Statement
Conflicts of Interest
References
- Yu, L.D. The distribution of the world’s heavy oil resources and the status quo and prospects of their exploitation technologies. Spec. Oil Gas Reserv. 2001, 8, 98–103. [Google Scholar]
- Sun, H.; Liu, H.; Wang, H.; Shu, Q.; Wu, G.; Yang, Y. Development technology and direction of thermal recovery of heavy oil in China. Acta Pet. Sin. 2022, 43, 1664–1674. [Google Scholar]
- Dong, X.; Liu, H.; Hou, J.; Zhang, Z.; Chen, Z. Multi-thermal fluid assisted gravity drainage process: A new improved-oil-recovery technique for thick heavy oil reservoir. J. Pet. Sci. Eng. 2015, 133, 1–11. [Google Scholar] [CrossRef]
- Wang, Y. Air Injection Assisted Cyclic Steam Stimulation Process for Enhanced Ultra Heavy Oil Recovery. Ph.D. Thesis, China University of Petroleum, Qingdao, China, 2020. [Google Scholar]
- Cui, G.; Liu, T.; Xie, J.; Rong, G.; Yang, L. A review of SAGD technology development and its possible application potential on thin-layer super-heavy oil reservoirs. Geosci. Front. 2022, 13, 101382. [Google Scholar] [CrossRef]
- Pei, S.; Cui, G.; Wang, Y.; Zhang, L.; Wang, Q.; Zhang, P.; Huang, L.; Ren, S. Air assisted in situ upgrading via underground heating for ultra heavy oil: Experimental and numerical simulation study. Fuel 2020, 279, 118452. [Google Scholar] [CrossRef]
- Hemmati-Sarapardeh, A.; Alamatsaz, A.; Dong, M.; Li, Z. Thermal Methods; Gulf Professional Publishing: Houston, TX, USA, 2023. [Google Scholar]
- He, H.; Li, Q.; Zheng, H.; Liu, P.; Tang, J.; Ma, Y. Simulation and evaluation on enhanced oil recovery for steam huff and puff during the later phase in heavy oil Reservoir—A case study of block G in Liaohe oilfield, China. J. Pet. Sci. Eng. 2022, 219, 111092. [Google Scholar] [CrossRef]
- Liu, P.; Zhang, Y.; Liu, P.; Zhou, Y.; Qi, Z.; Shi, L.; Xi, C.; Zhang, Z.; Wang, C.; Hua, D. Experimental and numerical investigation on extra-heavy oil recovery by steam injection using vertical injector-horizontal producer. J. Pet. Eng. 2021, 205, 108945. [Google Scholar] [CrossRef]
- Dong, X.; Liu, H.; Chen, Z.; Wu, K.; Lu, N.; Zhang, Q. Enhanced oil recovery techniques for heavy oil and oilsands reservoirs after steam injection. Appl. Energy 2019, 239, 1190–1211. [Google Scholar] [CrossRef]
- Pan, G.; Wu, J.; Zhang, C.; Li, H.; Liu, D. Oil enhancement analysis of weak-gel-assisted soak in offshore heavy oil reservoir. Spec. Oil Gas Reserv. 2017, 24, 134–138. [Google Scholar]
- Cheng, D. Recovery Countermeasures and Potential Indicators of Horizontal Well in Commination Well Pattern. Spec. Oil Gas Reserv. 2019, 26, 88–92. [Google Scholar]
- Wang, T.; Liu, F.; Li, X. Optimization of Efficient Development Modes of Offshore Heavy Oil and Development Planning of Potential Reserves in China. Water 2023, 15, 1897. [Google Scholar] [CrossRef]
- Zhang, H.; Liu, P.; Wang, Q.; Bai, J.; Zhang, W.; Zhang, H.; Han, X. Artificial Lift System Applications for Thermally Developed Offshore Heavy Oil Reservoirs. In Proceedings of the Offshore Technology Conference Asia, Virtual and Kuala Lumpur, Malaysia, 22–25 March 2022. [Google Scholar]
- Li, L.; Yang, J.; Zou, X.; Jia, L.; Zhang, C.; Wang, Q. A new production string for improving the thermal recovery of offshore heavy oil in small block reservoirs. J. Pet. Sci. Eng. 2022, 211, 110131. [Google Scholar] [CrossRef]
- Liu, Y.; Zou, J.; Meng, X.; Zhong, L.; Wang, Q.; Zhang, W.; Zhou, F.; Han, X. Progress in Bohai Offshore Heavy Oil Thermal Recovery. In Proceedings of the Offshore Technology Conference Asia, Kuala Lumpur, Malaysia, 22–25 March 2016. [Google Scholar]
- Bai, J.; Yu, F.; Jiang, Z.; Li, Y.; Shang, B.; Yan, M. First attempt of injection-production integrated technology for steam stimulation in Bohai Bay, China. In Proceedings of the International Petroleum Technology Conference, Virtual, 23 March–1 April 2021. [Google Scholar]
- Wei, B.; Pang, S.; Pu, W.; Lu, L.; Wang, C.; Kong, L. Mechanisms of N2 and CO2 assisted steam huff-n-puff process in enhancing heavy oil recovery: A case study using experimental and numerical simulation. In Proceedings of the SPE Middle East Oil & Gas Show and Conference, Manama, Bahrain, 6–9 March 2017. [Google Scholar]
- Gu, Z.; Zhang, C.; Lu, T.; Wang, H.; Li, Z.; Wang, H. Experimental analysis of the stimulation mechanism of CO2-assisted steam flooding in ultra-heavy oil reservoirs and its significance in carbon sequestration. Fuel 2023, 345, 128188. [Google Scholar] [CrossRef]
- Zou, X. Investigation of Drilling Fluid System and It’s Application in Yuedong Oilfield. Master’s Thesis, Northeast Petroleum University, Daqing, China, 2017. [Google Scholar]
- Wang, Z. Geological characteristics of heavy oil reservoirs in offshore Yuedong Oilfield. China Pet. Chem. Stand. Qual. 2016, 36, 110–112. [Google Scholar]
- Qi, J.; Chen, F. Structural Analysis of Cenozoic Rift Basin of Lower Liaohe-Liaodong Bay; Geological Publishing House: Beijing, China, 1995. [Google Scholar]
- Lin, L. Palaeogeomorphology Characteristics of the Central up Lift Zone in Neritic Area of Liaohe and Its Control to the Sandbodies on the Both Sides. Master’s Thesis, China University of Geosciences, Beijing, China, 2010. [Google Scholar]
- Guo, Y. Reservoir Characteristics and Prediction of Guantao Formation in Shengshun Oilfield, Liaodongdong Area. J. Shandong Inst. Pet. Chem. Technol. 2021, 35, 1753–1759. [Google Scholar]
- Dai, L.M.; Li, J.P.; Zhou, X.H.; Cui, Z.; Cheng, J. Depositional system of the Neogene shallow water delta in Bohai Sea area. Lithol. Reserv. 2007, 19, 75–81. [Google Scholar]
- Zhu, W.; Li, J.; Zhou, X.; Guo, Y. Neogene Shallow Water Deltaic System and Large Hydrocarbon Accumulations in Bohai Bay, China. Acta Sedimentol. Sin. 2008, 26, 575–582. [Google Scholar]
- Zhu, W. Hydrocarbon Accumulation and Exploration in Bohai Sea; Science Press: Beijing, China, 2009. [Google Scholar]
- Xu, C.; Jiang, P.; Wu, F.; Yang, P.; Li, D. Sedimentary Characteristics of the Neogene Delta in Bozhong Depression and its Significance for Oil and Gas Discovery and Exploration. Acta Sedimentol. Sin. 2002, 20, 588–593. [Google Scholar]
- Xu, C.; Wang, B.; Wang, F.; Wan, L.; Zhang, R. Neogene extra heavy oil accumulation model and process in Liaodong Bay depression: A case study of Lvda 5-2 N oilfield. Acta Pet. Sin. 2016, 37, 599–609. [Google Scholar]
- Jassam, S.A.; Al-Fatlawi, O. Development of 3D geological model and analysis of the uncertainty in a tight oil reservoir in the Halfaya Oil Field. Iraqi Geol. J. 2023, 56, 128–142. [Google Scholar] [CrossRef]
- Radwan, A.E. Three-dimensional gas property geological modeling and simulation. In Sustainable Geoscience for Natural Gas Subsurface Systems; Gulf Professional Publishing: Oxford, UK, 2022; pp. 29–49. [Google Scholar]
- Feng, G.; Li, Y.; Yang, Z. Performance evaluation of nitrogen-assisted steam flooding process in heavy oil reservoir via numerical simulation. J. Pet. Sci. Eng. 2020, 189, 106954. [Google Scholar] [CrossRef]
- Kondrat, O.; Lukin, O.; Smolovyk, L. Analysis of possibilities to increase oil recovery with the use of nitrogen in the context of deep oil deposits of the Dnipro-Donetsk oil-and-gas Ukrainian province. Min. Miner. Depos. 2019, 13, 107–113. [Google Scholar] [CrossRef]
- Mohamed, A.S.; Omran, A.A.; Mohamed, M.T.; Nabawy, B.S. Petrophysical analysis and hydrocarbon potential of the Matulla Formation in the Muzhil Field, central part of the Gulf of Suez, Egypt. Min. Miner. Depos. 2023, 17, 121–139. [Google Scholar] [CrossRef]
- Lin, J. Proceedings of the International Field Exploration and Development Conference 2023. In Proceedings of the International Field Exploration and Development Conference 2023, Wuhan, China, 20–22 September 2023. [Google Scholar]
- Xi, C.; Qi, Z.; Zhang, Y.; Liu, T.; Shen, D.; Mu, H.; Dong, H.; Li, X.; Jiang, Y.; Wang, H. CO2 assisted steam flooding in late steam flooding in heavy oil reservoirs. Pet. Explor. Dev. 2019, 46, 1242–1250. [Google Scholar] [CrossRef]
- Wang, Z.; Du, H.; Li, S.; Li, S. Experimental study on gas-assisted cyclic steam stimulation under heavy-oil sandstone reservoir conditions: Effect of N2/CO2 ratio and foaming agent. Geoenergy Sci. Eng. 2023, 228, 211976. [Google Scholar] [CrossRef]
- Gao, J. Study on Mechanism of CO2-assisted Water Control for Steam Stimulation Horizontal Well with Bottom Water. Master’s Thesis, China University of Petroleum, Beijing, China, 2020. [Google Scholar]
- Cui, G.; Zhu, L.; Zhou, Q.; Ren, S.; Wang, J. Geochemical reactions and their effect on CO2 storage efficiency during the whole process of CO2 EOR and subsequent storage. J. Greenh. Gas Control. 2021, 108, 103335. [Google Scholar] [CrossRef]
- Cui, G.; Yang, L.; Fang, J.; Qiu, Z.; Wang, Y.; Ren, S. Geochemical reactions and their influence on petrophysical properties of ultra-low permeability oil reservoirs during water and CO2 flooding. J. Pet. Sci. Eng. 2021, 203, 108672. [Google Scholar] [CrossRef]


| Erathem | System | Series | Formation | Thickness, m | |
|---|---|---|---|---|---|
| Cenozoic | Neogene | Miocene | Guantao | 100~500 | Sand conglomerate and sandstone, and there is a set of oil-rich sandstone, pebbled sandstone, and sand conglomerate assemblages at the bottom |
| paleogene | Oligocene | Dongying | 150~190 | Gray-white medium coarse sandstone, medium sandstone, fine sandstone with greenish-gray mudstone | |
| 90~280 | Grey fine sandstone, siltstone interbedded with grey, dark grey mudstone, and silty mudstone | ||||
| Paleozoic | 0~225 | Dense dark gray limestone, argillaceous limestone, calcareous dolomite, dolomitic limestone interbedded with quartz sandstone, gabbro, and basalt | |||
| Archaeozoic | 0~750 | Light red mixed granite | |||
| Well | Steam Injection Parameter | Production Parameter before Steam Huff and Puff | Production Parameter after Steam Huff and Puff | ||||||
|---|---|---|---|---|---|---|---|---|---|
| Cyclic Steam Injection, t | Steam Quality, % | Steam Injection Rate, t/h | Liquid, t/Day | Oil, t/Day | Water Cut, % | Liquid, t/Day | Oil, t/Day | Water Cut, % | |
| YD-Cn202h | 1000 | 69.6 | 12.9 | 19.9 | 4.0 | 79.9 | 23.6 | 2.6 | 89 |
| YD-Bn201h | 1055 | 65.7 | 12.9 | 22.4 | 5.0 | 77.7 | 24 | 11 | 54.2 |
| YD-Bn205h | 1215 | 72.5 | 13.8 | 24.3 | 2.7 | 88.9 | 23.7 | 9.5 | 59.9 |
| Parameters | Density at Standard Condition | PCrit, MPa | TCrit, C | Compressibility, 1/kPa |
|---|---|---|---|---|
| Water | 1000 | 22.12 | 374.15 | 5 × 10⁻⁷ |
| Oil | 995 | 0 | 0 | 3 × 10⁻⁶ |
| N2 | 1.142 | 3394 | −146.95 | - |
| CO2 | 1.803 | 7.53 | 31.05 | - |
| Case | Parameters in Steam Huff and Puff in the Edge Area | Parameters in the Edge Area | |||
|---|---|---|---|---|---|
| τ,/(m·m) | Steam Injection Rate, t/Day | Assistant Gas | Liquid Production Rate, t/Day | Liquid Production Rate, t/Day | |
| 1 | 0.4 | 400 | 20 | 5 | |
| 2 | 0.4 | 400 | - | 20 | 10 |
| 3 | 0.4 | 400 | - | 20 | 20 |
| 4 | 0.4 | 400 | - | 20 | 30 |
| 5 | 0.4 | 400 | - | 20 | 40 |
| 6 | 0.4 | 400 | N2 | 20 | 20 |
| 7 | 0.4 | 400 | CO2 | 20 | 20 |
Disclaimer/Publisher’s Note: The statements, opinions and data contained in all publications are solely those of the individual author(s) and contributor(s) and not of MDPI and/or the editor(s). MDPI and/or the editor(s) disclaim responsibility for any injury to people or property resulting from any ideas, methods, instructions or products referred to in the content. |
© 2024 by the authors. Licensee MDPI, Basel, Switzerland. This article is an open access article distributed under the terms and conditions of the Creative Commons Attribution (CC BY) license (https://creativecommons.org/licenses/by/4.0/).
Share and Cite
Cui, G.; Niu, Z.; Hu, Z.; Feng, X.; Chen, Z. The Production Analysis and Exploitation Scheme Design of a Special Offshore Heavy Oil Reservoir—First Offshore Artificial Island with Thermal Recovery. J. Mar. Sci. Eng. 2024, 12, 1186. https://doi.org/10.3390/jmse12071186
Cui G, Niu Z, Hu Z, Feng X, Chen Z. The Production Analysis and Exploitation Scheme Design of a Special Offshore Heavy Oil Reservoir—First Offshore Artificial Island with Thermal Recovery. Journal of Marine Science and Engineering. 2024; 12(7):1186. https://doi.org/10.3390/jmse12071186
Chicago/Turabian StyleCui, Guodong, Zheng Niu, Zhe Hu, Xueshi Feng, and Zehao Chen. 2024. "The Production Analysis and Exploitation Scheme Design of a Special Offshore Heavy Oil Reservoir—First Offshore Artificial Island with Thermal Recovery" Journal of Marine Science and Engineering 12, no. 7: 1186. https://doi.org/10.3390/jmse12071186