Abstract
Marine transportation is pivotal in the rapid development of global trade, significantly enhancing international economic and trade connectivity and impacting the sustainable development of the global economy. In this study, we developed a novel technical framework based on the Laplacian matrix to evaluate the node significance and edge connectivity of the global shipping network using 2019 vessel schedule data from the top 30 liner shipping companies, as ranked by Alphaliner. Our analyses were conducted in both L-space, characterizing the connectivity function, and P-space, characterizing the transfer function. The findings indicate the following. (1) There is no consistent relationship between node significance and centrality for most ports. Ports with high node significance are mainly located in the Asia–Pacific region, with Singapore Port being the port with the highest node significance in L-space and Shanghai Port being the port with the highest node significance in P-space. (2) In L-space, the structures with significant improvements in edge connectivity in the shipping network have at least one port node that exhibits both low degree centrality and low betweenness centrality; these are primarily found on East African routes. (3) In P-space, the structures with significant improvements in edge connectivity in the shipping network are more complex but are notably linked to the ports of Assaluyeh and Bandar Abbas in Iran. The proposed node evaluation and edge addition strategy effectively analyze port significance and edge connectivity, providing decision-making support for optimizing port layouts, supporting container route planning, and enhancing the overall performance of the shipping network.
1. Introduction
The container shipping network is a complex system consisting of a large number of port nodes, routes, etc., which can realize cargo transportation and container transshipment, and can satisfy the demand for port cargo through a networked layout. According to statistics, 80% of the current international trade is completed by sea transportation. In particular, container shipping, by virtue of its unique scale and economic advantages, has rapidly become an important carrier to support the development of global trade and maintain the connectivity and stability of the global supply chain system [1,2].
As a complex system, the shipping network inevitably requires some key nodes and core structures as the underlying support to ensure the functional integrity and stable operation of the entire maritime transportation system [3]. There is significant spatial heterogeneity in the importance of ports in the global shipping network due to their different functions and connectivity roles. According to the traditional perception, hub ports that undertake more route connectivity and cargo transshipment are of higher importance in the global shipping network, and they tend to provide transshipment services for short-distance intercontinental shipping through a hub-and-spoke structure to realize the integration of feeder ports into the global shipping network. Therefore, extensive research has evaluated and determined the importance of ports from the perspectives of network centrality, network robustness, and network resilience in order to identify important ports with critical transshipment functions [4,5,6,7,8]. However, the importance of some intermediate nodes connecting key hub ports has been somewhat overlooked in the ongoing integration of global maritime transportation networks. These nodes may involve less shipping activity or container throughput, but they control the connectivity between regional hub ports and play a crucial role in the connectivity structure of the entire shipping network. The importance of such port nodes in maintaining the overall connectivity of the maritime network has become even more prominent, especially with the emergence of the trend towards the communalization of the global shipping network.
In recent years, the global geo-environmental crisis, regional conflicts, and public emergencies have adversely affected the development of global ports and maritime transportation, significantly impacting the connectivity of the global shipping network [9]. The connectivity of the global shipping network and the significance of ports have increasingly captured attention. However, previous studies comprehensively explored the evaluation metrics and methodological systems of global shipping network connectivity, focusing on the impact of port and link failures on network connectivity. Considering the real-world development of the global shipping network, with an emphasis on network structural features and the absence of link failures, enhancing existing routes to bolster network connectivity has emerged as a critical research question. Consequently, there is a pressing need to examine node significance and edge connectivity within the context of the current shipping network structure.
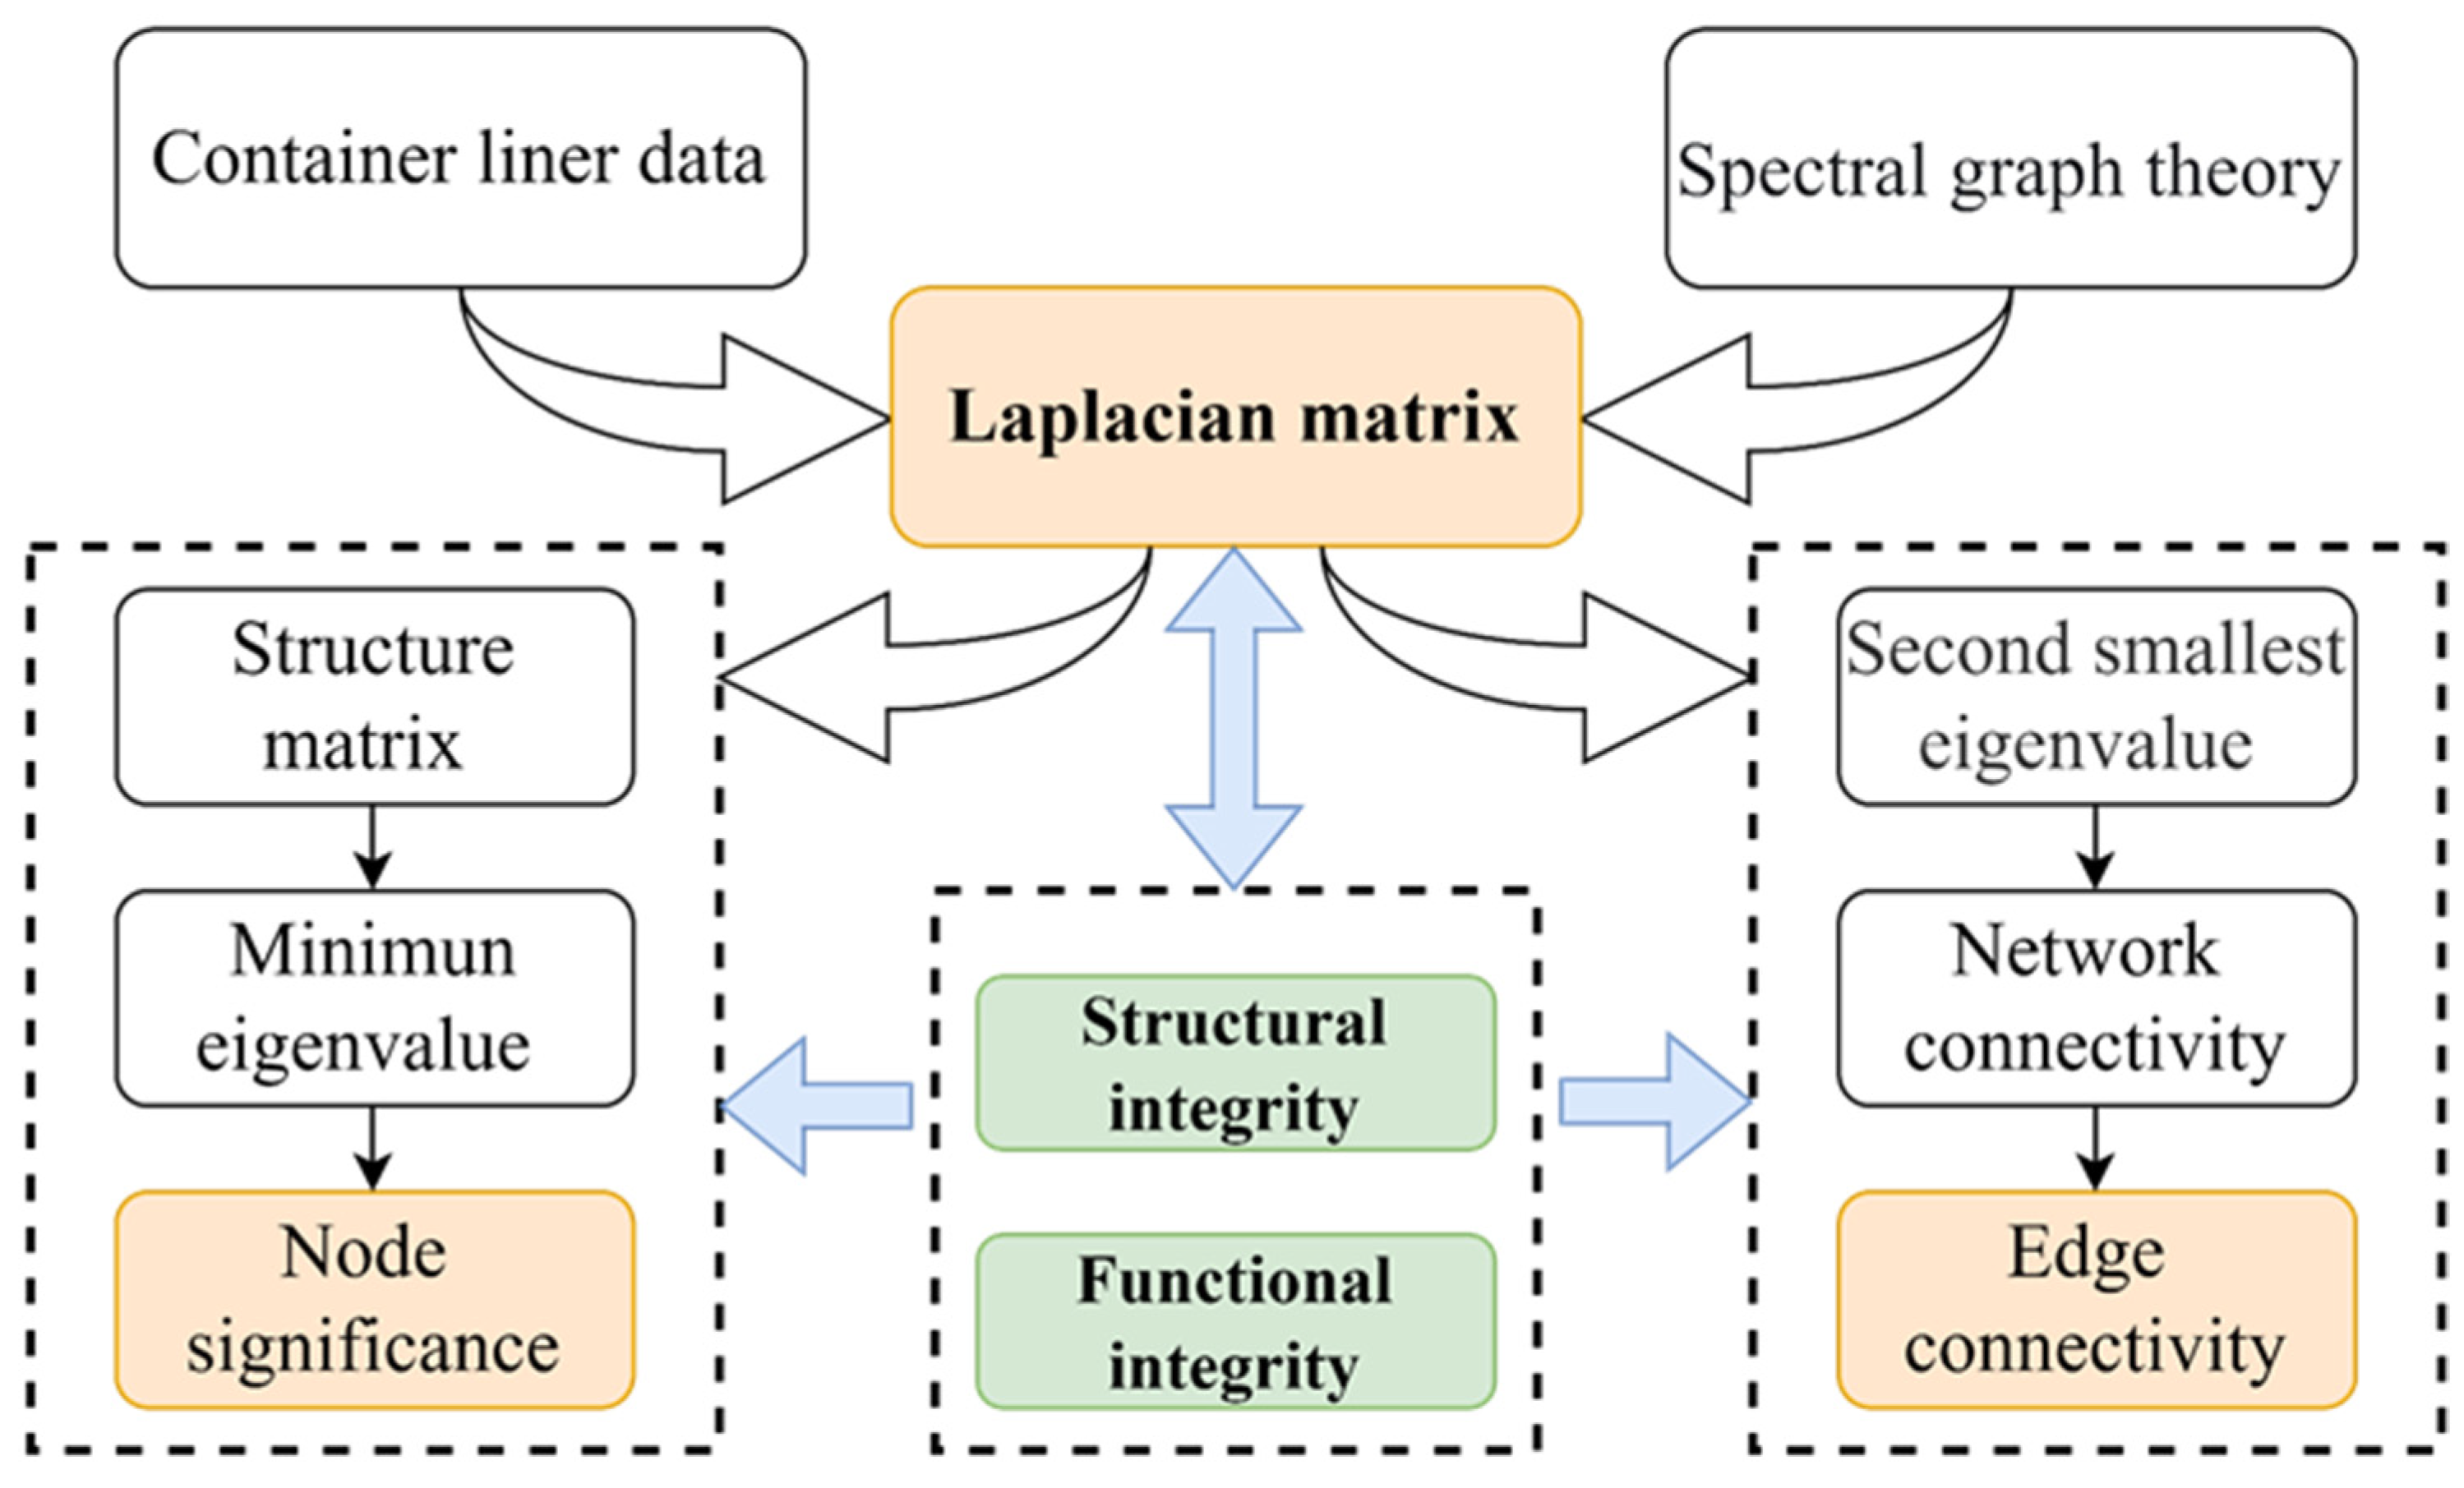
This study develops a technical framework for evaluating node significance and edge connectivity based on the Laplacian matrix, with a focus on network integrity (Figure 1). By designing an edge addition strategy and a node significance identification strategy, we provide a solution to enhance the connectivity of the global maritime network. The main innovations of this study are as follows. Firstly, we construct a novel technical framework based on the Laplacian matrix from a network integrity perspective. This framework includes node significance and edge connectivity, highlighting the importance of port nodes in maintaining the network’s structure and function. Secondly, we design an edge connectivity evaluation strategy that considers the addition of edges to identify shipping connectivity schemes that significantly improve the network’s overall connectivity. Finally, we report a study on the node significance and edge connectivity of the global shipping network based on the L-space for expressing the connectivity function and the P-space for expressing transfer function, exploring the differences in different spaces.
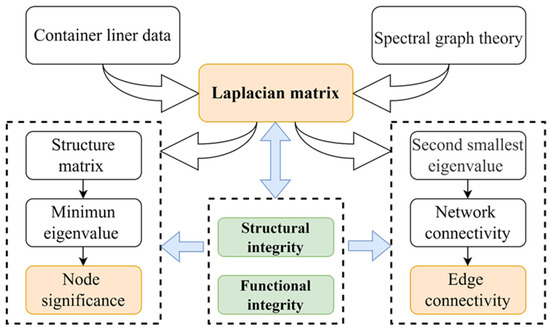
Figure 1.
Technical framework diagram.
2. Literature Review
In this section, the focus is on sorting and summarizing the measurement methods for port importance and shipping network connectivity, clarifying the shortcomings of previous publications and research methods, and introducing the innovation of the research perspective and methods in this study.
2.1. Port Importance Evaluation
The importance of port nodes in the maritime network determines their internal and external hub functions and network efficiency, as well as the degree to which port node countries participate in global and regional economies [10,11,12]. Therefore, researchers used complex network topology attributes to measure the importance of shipping network nodes [13], with network centrality being the most widely used. Representative studies on the centrality-based importance evaluation of shipping network nodes are shown in Table 1.

Table 1.
Brief summary of the significance of ports in shipping networks.
In the assessment of port nodes within a complex shipping network, centrality is consistently regarded as a key indicator for evaluating the strategic position and development of ports [21,22]. The centrality of ports indicates their position in the shipping network, their ability to attract goods, and their ability to provide shipping services [23]. With the deepening of research and the refinement of evaluation scenarios, the combination of centrality indicators and the use of centrality indicators in combination with other indicators have become important means for researchers to improve the accuracy of the evaluation of node significance [14,15,16]. In this process, the concepts of port robustness and port resilience have also been introduced [4,5,6,24,25]. In addition, researchers have employed various modeling techniques to assess the influence of port nodes within networks [7,8,26]. For instance, Yang and Liu developed a model for the Maritime Silk Road’s maritime network, pinpointing critical nodes through interruption-based simulations [27]. Zhang et al. applied structural hole theory to investigate key ports within global liner networks, particularly those in a hub position [28]. Assessing the significance of nodes within the global shipping network and determining the functional role of port nodes are vital for the network’s stable development.
The economic and trade landscape is a pivotal factor influencing the global footprint of shipping companies, and the swift ascent of emerging economies has further propelled the speedy evolution of maritime transportation. For example, Asia, Europe, and the Americas are important regions for global trade, and the global shipping network, which is made up of the three major trade zones, has resulted in the emergence of key nodes. Key port nodes play an important role in promoting functional connectivity throughout the global shipping network. Current measures of port node importance do not fully reflect their position in the global shipping network [5,28,29]. However, complex network analysis based on graph theory provides an effective tool for the study of global shipping networks, and the application of graph theory methods to the practice of global maritime transportation has been confirmed by relevant studies [30,31,32,33].
The development of ports depends not only on their own node importance but also on the connectivity performance between ports. Great shipping network connectivity can effectively leverage the functions of port nodes, thereby improving the efficiency of the entire shipping network. The study of connectivity provides important theoretical support for optimizing the layout and improving the topology of shipping networks, and it has gradually become a major research focus in the study of maritime networks.
2.2. Shipping Network Connectivity
The primary function of the shipping network is to achieve global economic and trade connectivity, and effective network connectivity is crucial for fulfilling the demand for goods across countries and regions. Currently, there is still no universally accepted definition of shipping network connectivity. As a key indicator for the stable development of the shipping network, connectivity is initially characterized by the number of connections to the target port [34]. With the introduction of the Global Port Liner Shipping Connectivity Index (PLSCI), the shipping network’s connectivity has begun to emphasize the capacity of port services [35]. For example, some scholars have focused on the relationship between shipping network connectivity and factors such as liner freight rates, international trade flows, and port infrastructure [36,37,38]. There are also studies that focus on measuring the connectivity between originating- and destination-port services [29,39]. Existing research provides a large number of measurement standards and methods for network connectivity, as shown in Table 2.
Table 2.
Brief summary of connectivity analysis approach in shipping network.
As shown in Table 2, existing research on shipping network connectivity has mostly focused on analyzing port node characteristics without exploring the degree of connectivity from the perspective of network integrity. In order to highlight the economic attributes and service capabilities of ports, scholars have conducted connectivity evaluations on indicators such as the number of liner services docked, vessel capacity, transportation time, and capacity [7,35,40,41]. However, the impact of ports on the shipping network should not only depend on port information, such as port statistics, the number of connecting links, or the number of shortest paths; it should also reflect the network structure [47].
Most existing research is based on the logistics perspective, aiming to optimize the design of the shipping network and enhance its connectivity, with the aim of maximizing operational profits [48,49]. There is also a scarcity of research on network connectivity that concentrates on edge connectivity between ports. In recent years, graph theory methods have been increasingly used to study shipping networks and analyze network connectivity characteristics. The research results mainly provide insights on network topology structure, ship safety, etc. [50,51]. For example, Wang and Cullinane measured port accessibility in a shipping network, based on eigenvector centrality, and research has shown that eigenvector centrality plays an important role in measuring network connectivity [52]. Pan et al. analyzed shipping network connectivity based on graph theory methods and proved that graph theory is feasible for enhancing connectivity [45]. In addition, the Laplacian matrix in graph theory methods is gradually being applied to the study of shipping networks [43]. The Laplacian matrix of a graph has many excellent features that can be used to determine and estimate a series of invariants of the graph, such as its spanning tree, connectivity, and diameter.
Overall, the research on port importance and network connectivity in shipping networks based on graph theory methods is relatively rich, but there are still two gaps in current research. Firstly, there is a lack of research on shipping networks under different spatial models. The existing research on the port importance and network connectivity of shipping networks is mostly conducted in a single space, ignoring the expression of the structural functions of shipping networks in different spaces. Secondly, there is a lack of research on the connectivity of shipping networks from an edge perspective. Existing research on shipping networks mostly focuses on the multiple attributes of port nodes, neglecting the overall structure of the network and the role of network edges. It is also impossible to examine the importance of nodes and the impact of edges on the overall connectivity performance of shipping networks within a unified theoretical framework.
Therefore, this study addresses the relevant gaps in three respects. (1) Different spatial models for network evaluation. We introduce different spatial models to evaluate the shipping network. This study includes the L-space model, which represents the connectivity function, and the P-space model, which represents the transfer function. (2) A unified evaluation framework. We construct an evaluation framework based on the Laplacian matrix. This framework unifies the theory for assessing node significance and edge connectivity in the shipping network, providing a perspective of the entire network. (3) Novel evaluation strategies. We develop a novel node significance evaluation strategy to highlight the importance of port nodes in maintaining networks’ structural functions. Additionally, we propose an edge addition strategy to identify shipping connection schemes that significantly enhance network connectivity.
3. Data and Research Methodology
3.1. Data Source and Network Construction
In order to build a global shipping network, we selected Alphaliner capacity data in 2019 (https://public.alphaliner.com/, accessed on 30 June 2019) as a data collection object. This was the year before COVID-19, when the world’s container-shipping trade volume was the largest and most balanced. Although the global shipping trade volume in 2021 exceeded the level of 2019, the economic recovery in the post-pandemic era was not balanced, and the number of voyages between many ports did not return to pre-pandemic levels. Therefore, the study features pre-pandemic and more representative shipping data, which were sourced from the top 30 shipping companies in Alphaliner’s capacity ranking in May 2019. These companies accounted for 92% of the world’s top 100 container shipping companies in terms of capacity share. Their schedule tables can be used to characterize global container shipping route data, and the statistical results include 2457 shipping routes and 758 ports. In our study, we maintain that the fundamental connectivity of the shipping network remains unchanged. On the one hand, the container shipping network is a relatively stable and intricate system. Despite a significant imbalance in container cargo supply and demand during the pandemic, no notable changes were observed in the connectivity of global container shipping routes. On the other hand, the scheduling of container liners is established prior to departure, ensuring the route remains absolutely stable throughout a voyage cycle, barring any major emergencies.
To articulate the unique attributes of shipping routes between ports, we established shipping networks in L-space and P-space, respectively. Studies indicate that L-space networks are best for examining network connectivity, while P-space networks are designed for transfer studies [53].
The L-space model originates from the abstraction of the connection status of urban rail transit, identifying stations as nodes in the network. If two nodes are continuous stopping points on the line, then there is a link between these two nodes [54]. Similarly, in the shipping network depicted by the L-space model, we consider ports as nodes, linking two ports if they are adjacent on a route. It can be seen that the L-space network is a spatial network formed by connecting each port in the order of container ships docking based on route data, serving as a visual representation of the shipping schedule. The P-space model originates from the abstraction of the direct capability of urban rail transit, identifying stations as nodes in the network and considering trains stopping at any two stations as links between nodes [55]. Similarly, in the shipping network depicted by the P-space model, we consider ports as nodes, linking two ports if they belong to the same route [55,56]. It can be seen that the P-space network characterizes all scenarios that can be reached between ports through route transitioning, which has more practical physical significance. Therefore, integrating both spatial models is critical for conducting a comprehensive analysis of the structure and function of the shipping network. During network construction in L-space and P-space, if multiple voyages or routes appear between the same port node pairs, they are recorded as multiple edges. The specific connection method is shown in Figure 2.
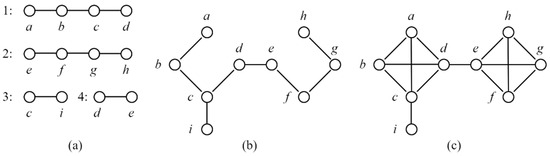
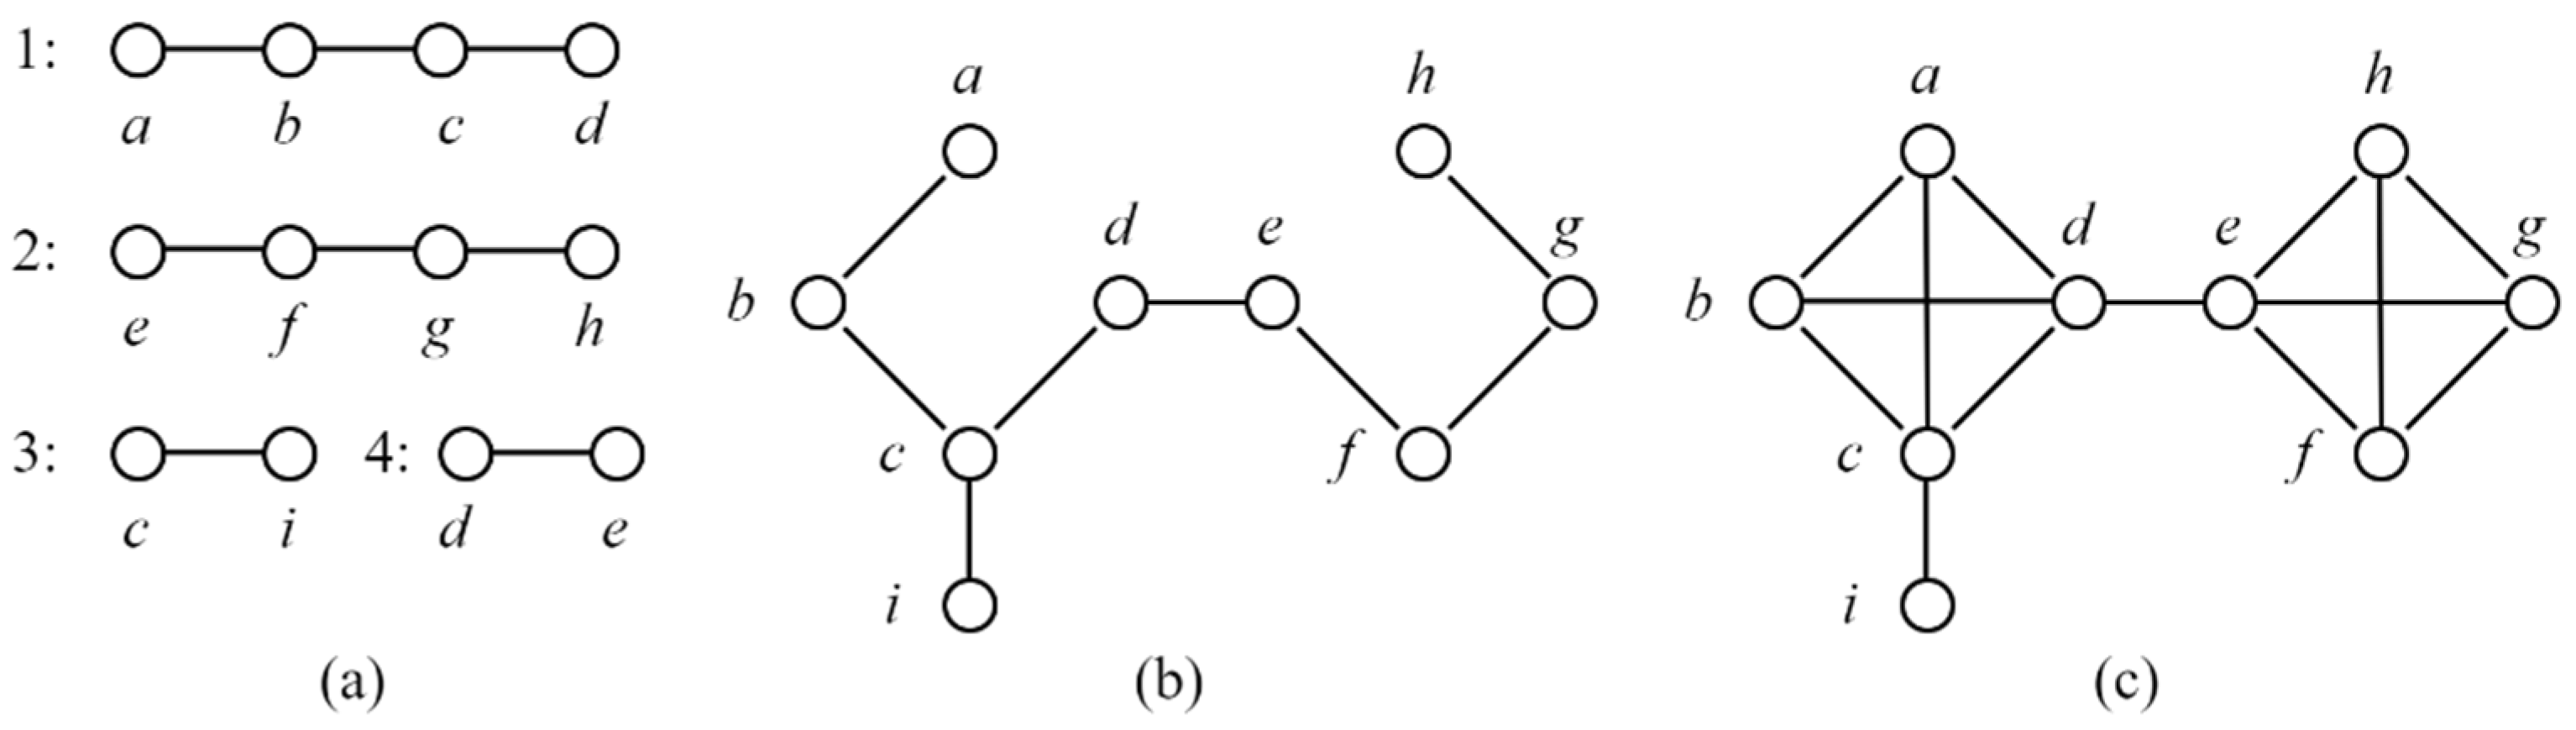
Figure 2.
Schematic diagram of shipping network generation in L-space and P-space: (a) represents routes, (b) represents the network generated by routes in L-space, and (c) represents the network generated by routes in P-space. a–h represent nodes.
In Figure 2a, there are 4 shipping routes, with a total of 9 ports, only the return of the liner to the original route is considered, and the connecting edges between the ports are all undirected. Figure 2b shows the L-space network corresponding to the 4 shipping routes, and Figure 2c shows the P-space network corresponding to the 4 shipping routes.
3.2. Degree and Degree Centrality
The degree value of a node in a network represents the number of edges connected to it, reflecting the node’s influence within the network [57]. Degree centrality is used to quantify the importance of a node in a network. The larger the degree value of a node, the higher its degree centrality in the network. The calculation formula is:
where represents the degree centrality of the node , represents the degree value of the node , and represents the number of network nodes. Degree centrality is a typical local feature in complex networks.
3.3. Betweenness and Betweenness Centrality
A node may be passed by the shortest path between other non-adjacent node pairs in the network. The higher the number of shortest paths through the node, the more important the node is in the network [58], and its importance is defined as betweenness value. The calculation formula is:
where is the number of shortest paths between node and node , and is the number of shortest paths between node and node that passes through node . In an ideal situation, the node will be on all the shortest paths, and the maximum number of shortest paths is . With this value, the betweenness value can be normalized to obtain the betweenness centrality. The calculation formula is as follows:
betweenness centrality is a typical global feature in complex networks.
3.4. Laplacian Matrix
Define an undirected network , where is the set of network nodes and is the set of network edges. The network’s adjacency matrix can be derived from its connections,
where represents the number of edges, and a symmetric degree matrix can be obtained,
The general form of Laplacian matrix can be obtained from adjacency matrix and degree matrix. The calculation method is . In order to eliminate errors caused by high-frequency nodes, is generally subjected to symmetric normalization in research, that is, . The Laplacian matrix simultaneously records the connections between network nodes and the degree values of each node, reflecting more comprehensive structural information. Delete the corresponding row and column of any one node in the Laplacian matrix of the network to obtain the structure matrix that can describe the original adjacency features of the node. The minimum eigenvalue of the structure matrix can be used to measure the importance of the deleted node in the entire network [59]. These eigenvalues of satisfy . The second smallest eigenvalue is called the algebraic connectivity of a matrix [60,61]. The larger the value of , the closer the connections between nodes in the network, which is an appropriate measure of network connectivity for the entire network [62].
4. Design of Evaluation Strategies
4.1. Network Integrity Perspective
This study evaluates node significance and edge connectivity in the shipping network from the perspective of network integrity, which includes two aspects. The first aspect is the network’s structural integrity. We hope to use this method to measure the node significance of a port, which must take into account not only node connection characteristics and neighboring port structure information, but also the impact of other non-neighboring nodes on the port; that is, we evaluate the port’s node importance using the network’s connection structure characteristics. Similarly, we also evaluate the connectivity of edges within the entire network structure. Therefore, in the design of evaluation strategies, we need to simultaneously retain the connection information and node degree value information between all nodes, which can be achieved through the Laplacian matrix of the network. The second aspect is the network’s functional integrity. In complex networks, the structure of the network affects its functionality, which in turn affects the evolution of the network structure. Functional integrity in research refers to the impact of the functions of port nodes or edge connections on the entire network. We define node significance as the control function of nodes over the entire network, and edge connectivity as the improvement function of edges in the connectivity performance of the entire network. Therefore, we need to construct indicators that reflect the control of nodes over the network and the improvement function of edges in the network connectivity, which can be achieved by using the eigenvalues of the matrix.
4.2. Evaluation Strategy for Node Significance
We use the Laplacian matrix properties to design the following strategy for evaluating the node significance in the shipping network. Firstly, each port is sequentially identified as a node to be evaluated. Secondly, delete the row and column where the node to be evaluated is located in the Laplacian matrix of the shipping network and obtain the structural matrix used to evaluate the node. Finally, calculate the minimum eigenvalue of the structural matrix as the port’s node significance. The node significance algorithm process is shown in Algorithm 1.
| Algorithm 1: Node significance based on the structure matrix |
| Input: The adjacency matrix of a shipping network containing ports Output: Node . |
Update the Laplace matrix , where ; Delete the row and column of the node to be evaluated from the , and obtain a structure matrix ; is calculated from the minimum eigenvalue of the structure matrix . |
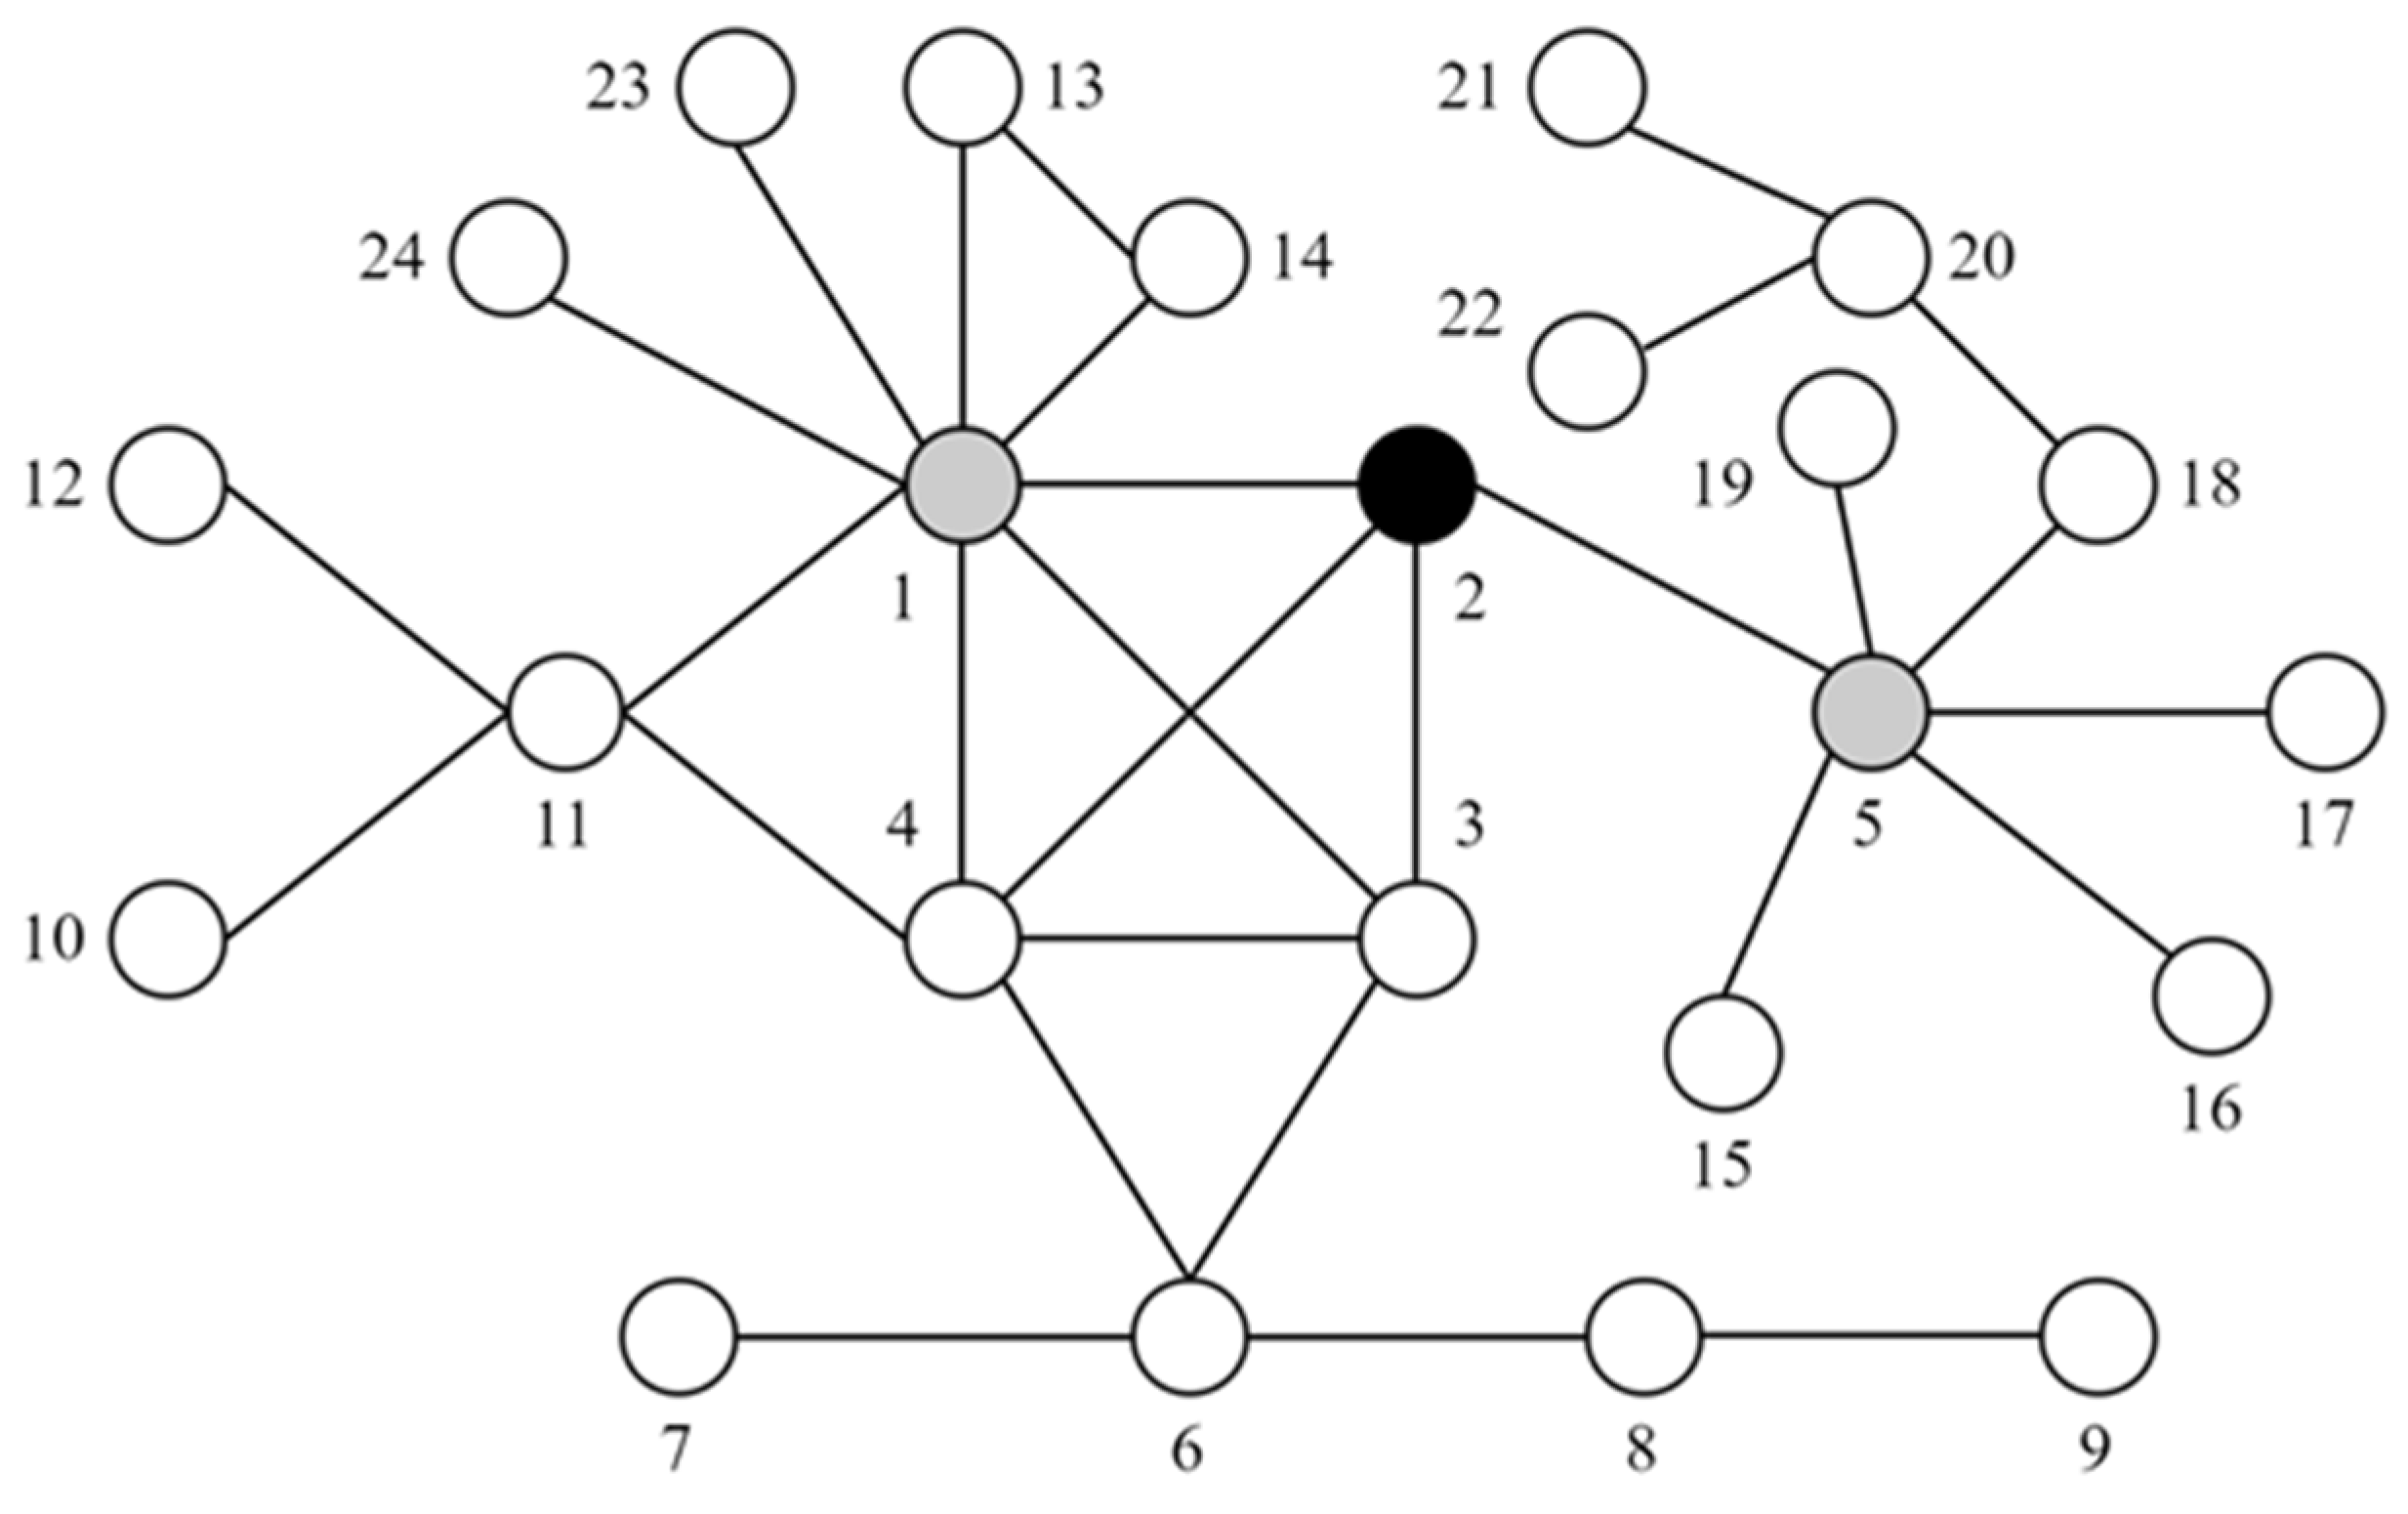
In complex networks, the node with the highest degree value of betweenness may not necessarily have the greatest impact on the entire network structure. For example, in Figure 3, node 1 has the highest degree value, with degree centrality and betweenness centrality of (0.3478, 0.0015), while node 5 has the highest betweenness value, with (0.2609, 0.0022). However, in terms of network integrity, node 2 is significantly more important than nodes 1 and 5 because node 2 connects more nodes with higher centrality and that have typical structural functions, such as nodes 1 and 5, i.e., node 2 is the nub node between numerous structural functional port nodes and has the greatest control over and impact on the entire network. Using Algorithm 1, the node significance for nodes 1, 2, and 5 were determined to be 0.0562, 0.0738, and 0.0469, respectively. This suggests that node 2 holds a paramount position within the network’s entire structure, with the influence wielded by the other nodes being comparatively weaker than that of node 2.
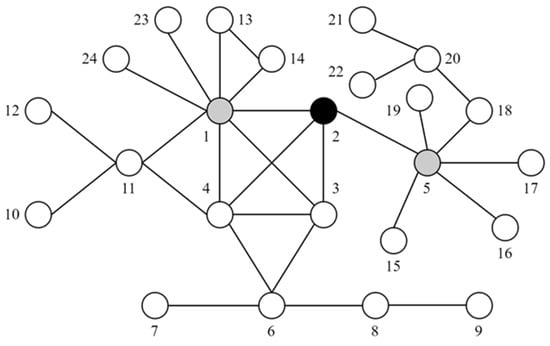
Figure 3.
Example of node significance. (Different numbers represent different port nodes).
The results of using Algorithm 1 to measure the importance of each node in Figure 2b,c, are shown in Table 3. In L-space and P-space, nodes d and e are respectively connected to a connected structure, and their node significance ranks highly, indicating that nodes play a more prominent role in maintaining network structure and function. In addition, we found that the connected structure with node d is more complex, resulting in the node significance of node d being greater than that of node e. In addition, the closer the node is to nodes d and e, the greater its significance becomes. Comparing L-space and P-space, it can be found that the significance of nodes is significantly greater in P-space. This is because in the transfer expression of complex networks, nodes have more connections, and their Laplacian matrix and structure matrix also increase accordingly. In P-space, we find that there are nodes (a and b, f, g, and h) with the same connection structure in the connected structures on both sides of nodes d and e, and their node significance is also the same. This indicates that in P-space, the method we proposed can perform consistency evaluation on nodes with the same connection structure and function.
Table 3.
Node-significance evaluation for Figure 1.
4.3. Evaluation Strategy for Edge Connectivity
Unlike the concept of connectivity in geography [63,64], the concept in this study is based on measuring the connectivity performance of a network from its entire connectivity structure, using algebraic connectivity as the connectivity of the shipping network. We designed an evaluation strategy for the impact of each edge on the connectivity performance of the shipping network. Firstly, calculate the algebraic connectivity of the shipping network and sequentially select the port pairs with connected edges as the objects to be evaluated. Secondly, by increasing the number of voyages between the port node pairs (i.e., adding an edge between the port pairs to be evaluated), we measure the change in network connectivity. The network connectivity calculated after adding an edge is called edge connectivity. In this process, we also calculated the centrality of each port node in order to discover the structural rules that improve the connectivity performance of the shipping network. The specific process for calculating the edge connectivity of the network is shown in Algorithm 2.
| Algorithm 2: Edge connectivity based on the Laplacian matrix |
| Input: The adjacency matrix of a shipping network containing ports Output: Original network connectivity ; Edge connectivity descending set . |
for do if : Update the Laplace matrix , where ; Process of adding edge , ; Calculate and based on ;
|
We use Algorithm 2 to measure the edge connectivity of the edges in Figure 2b,c. When evaluating the connectivity performance of various edges in the shipping network, we define an increase in capacity and voyage as the addition of an edge between port nodes. On the one hand, adding an edge is intuitively reflected in the relationship matrix, making it easier to measure connectivity performance. On the other hand, adding only one edge improves connectivity performance the most significantly (Table 4).
Table 4.
Convergence of edge connectivity.
In Table 4, the numbers in parentheses represent the increases in the number of voyages between nodes. If there is an increase in edge connectivity by more than one percentage point, we record the value and the increased number of voyages until convergence. Moreover, certain changes in edge connectivity are not significant or tend to converge, indicating that increasing the number of voyages may not effectively enhance the entire connectivity of the shipping network. Table 4 illustrates that there is variability in the degree of improvement in the network’s entire connectivity performance as the number of voyages between different node pairs increases. Firstly, the bridging structure (d–e) serves as the edge connecting two larger-scale routes, and its connectivity improvement is most significant. Secondly, on larger-scale routes connected to the bridging structure, the closer to the edge of the bridging structure, the more significant the improvement in connectivity. Finally, on the edges that are not connected to the bridging structure, there is no significant improvement in the entire connectivity performance of the network, and the further away from the bridging structure, the smaller the improvement in edge connectivity.
Furthermore, the extent to which increasing the voyage numbers enhances network connectivity varies across different spaces. Firstly, in L-space, differences in position and connection structure lead to varying edge connectivity. In P-space, as the network topology reflects transfer functions, many edges share the same connection structure and connectivity, as illustrated with a–d, b–d, e–f, e–g, and e–h. Moreover, increasing the voyage numbers for a–b, f–h, f–g, and g–h does not enhance the network connectivity. Secondly, the increase in edge connectivity is significantly greater in P-space than in L-space, suggesting that the network’s transfer representation is more critical to the entire connectivity than its connection representation. Lastly, route c–i, consisting of two ports, demonstrated varying improvements in connectivity across different spaces. In L-space, c–i showed the least significant enhancement in network connectivity, whereas simple routes distant from bridging structures can fulfill more connectivity roles in P-space.
In conclusion, increasing the number of voyages between port nodes can effectively improve the connectivity performance of the shipping L-space network and the shipping P-space network. In particular, augmenting the voyages at crucial positions that ensure structural integrity greatly enhances the shipping network’s connectivity. In addition, the connectivity of the shipping network in P-space is higher than that in L-space, and as the number of voyages increases, the connectivity enhancement becomes more significant. This demonstrates that expanding routes that include port node pairs significantly improves network connectivity compared to merely increasing the number of voyages between these pairs.
5. Empirical Analysis and Discussion
5.1. Traditional Ports’ Importance: Centrality
Based on the shipping schedule and route data for the top 30 Alphaliner shipping companies in 2019, the connection matrices of the global shipping network in L-space and P-space were constructed, respectively. Using degree centrality (Formula (1)) and betweenness centrality (Formula (2)) as typical key ports identification methods, we explored traditionally important ports and used them as comparative objects in our node significance research. Table 5 shows the top 20 port nodes in the degree centrality and betweenness centrality rankings of the shipping network in two different spaces.
Table 5.
Top 20 ports in terms of centrality.
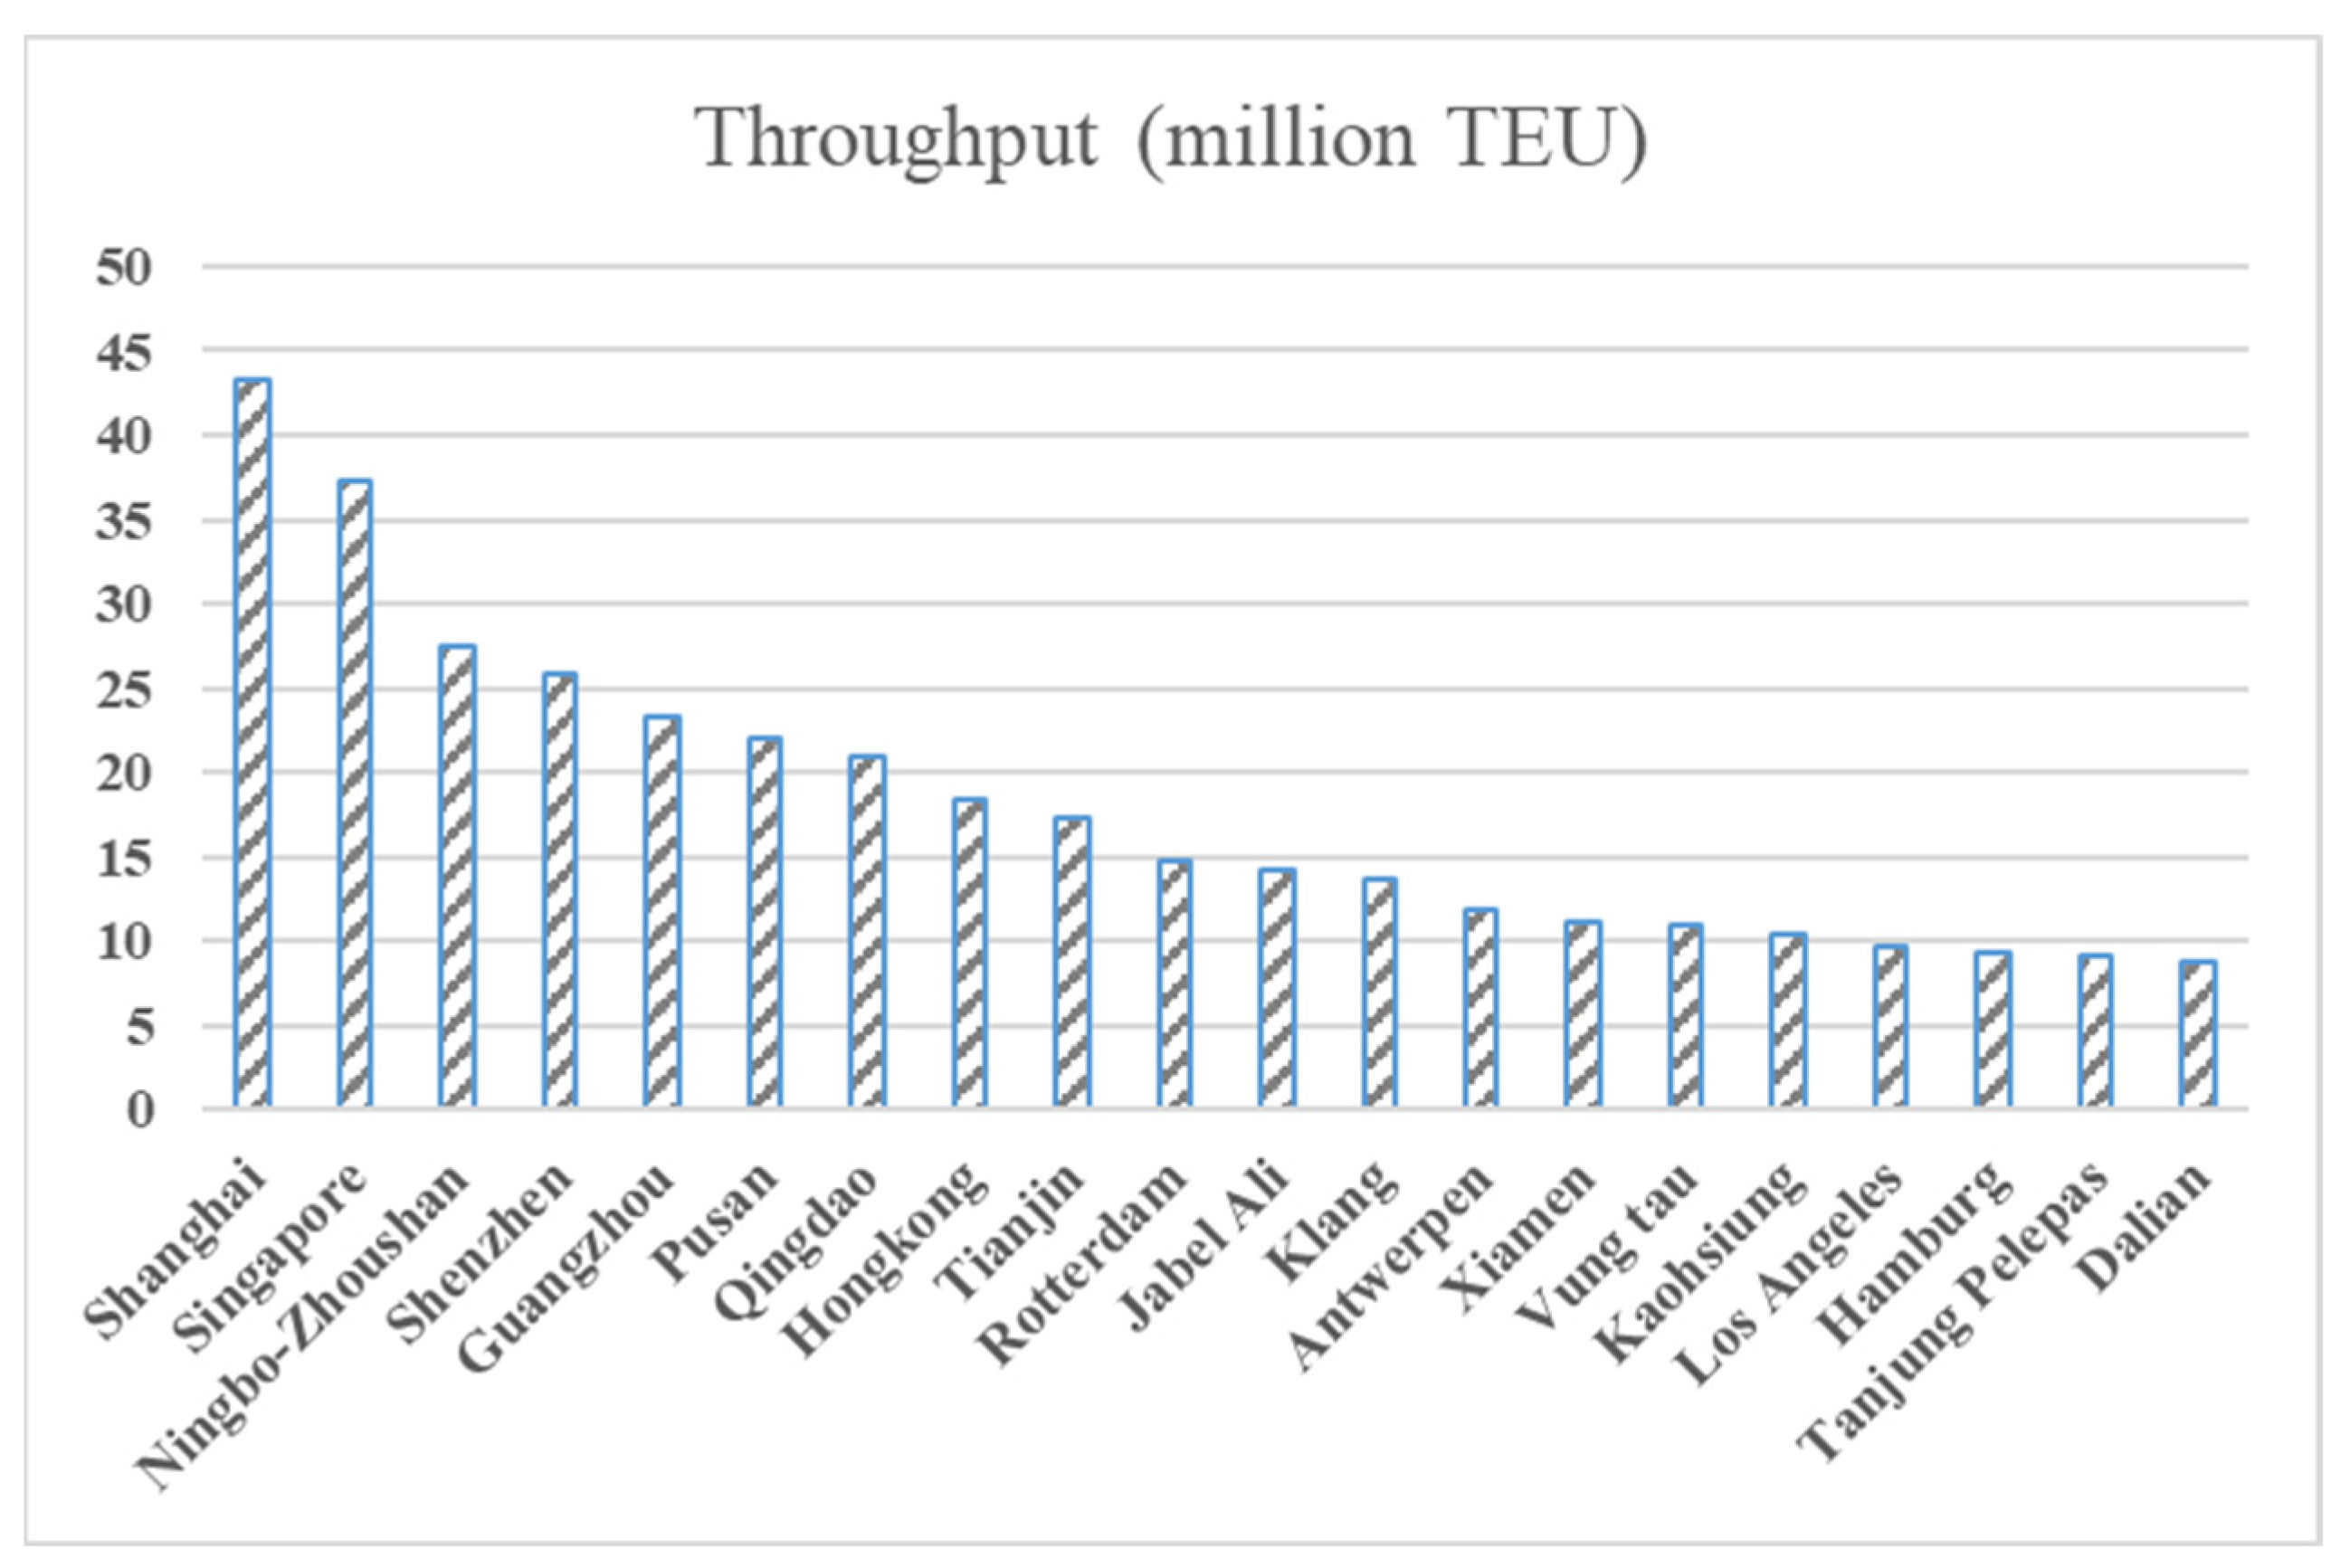
Port nodes with high degree centrality and high betweenness centrality are largely consistent with their trade volume. Comparing Figure 4 and Table 5, it can be observed that among the top 20 ports in the global port throughput ranking, the matching degree with the top 20 ports in L-space degree centrality reaches 70%, the matching degree with the top 20 ports in L-space betweenness centrality reaches 60%, the matching degree with the top 20 ports in P-space degree centrality reaches 85%, and the matching degree with the top 20 ports in P-space betweenness centrality reaches 70%. In addition, it can be found that the matching degree in P-space is higher than in L-space, indicating that the network in P-space can better reflect the transfer function and actual transportation situation of the shipping network.
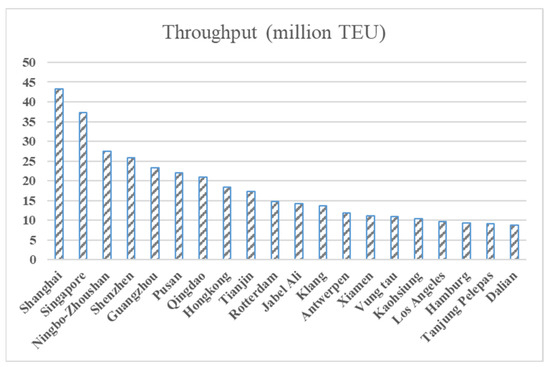
Figure 4.
The top 20 ports in terms of port throughput.
Descriptive statistics were conducted on the degree centrality and betweenness centrality values in different spaces, including the mean, median, mode, minimum, maximum, standard error, standard deviation, variance, kurtosis, and skewness. The results are shown in Table 6.
Table 6.
Top 20 ports in terms of centrality.
According to Table 6, the degree centrality range of the shipping network in L-space is 0.0013–0.1612, with a mean of 0.0118, a median of 0.0066, and a mode of 0.0026. Its standard error, standard deviation, and variance reflect the low degree of dispersion of the data, indicating that the shipping network is a relatively sparse connection network. Its connection characteristics are that the number of adjacent ports at most port nodes is low, and only a few ports maintain high-degree connections. If the kurtosis value of the degree centrality is greater than 0, it indicates that the data distribution is steeper than the normal distribution. If the skewness value is greater than 1, it indicates that the degree centrality of the shipping network follows a normal skewed distribution, that is, mean > median > mode, which also verifies the connectivity characteristics of the shipping network. The betweenness centrality range of the shipping network in L-space is 0–0.1783, with a mean of 0.0032, a median of 0.0001, and a mode of 0. Its standard error, standard deviation, and variance reflect the low degree of data dispersion, indicating that the shipping network is a relatively inefficient intermediary network, characterized by the presence of a large number of peripheral nodes in the network that are not in any of the shortest paths. Obviously, the distribution of betweenness centrality in shipping network is steeper than a normal distribution and exhibits a normal skewed distribution.
According to Table 6, the degree centrality range of the shipping network in P-space is 0.0013–0.4227, with a mean of 0.0393, a median of 0.0185, and a mode of 0.0040. Its standard error, standard deviation, and variance reflect a low degree of data dispersion, indicating that there is a large gap in the transfer ability of port nodes in the shipping network, and only a few ports can reach more ports without transferring to other routes. The distribution of degree centrality in the shipping network in P-space is steeper than the normal distribution and exhibits a normal skewed distribution, but the degree of steepness and offset are smaller than the degree centrality distribution in L-space. The betweenness centrality range of the shipping network in P-space is 0–0.1229, with a mean of 0.0020, a median of 0.0185, and a mode of 3.5478 × 10⁻⁵. Its standard error, standard deviation, and variance also reflect a lower degree of data dispersion, indicating that there is little difference in the intermediary function of most port nodes. The distribution of betweenness centrality in the P-space shipping network is steeper than the normal distribution and exhibits a positive skewed distribution, but the degree of steepness and offset is smaller than the betweenness centrality distribution in the L-space.
We use the natural breakpoint method to categorize the degree and betweenness centralities of the shipping network. In L-space, the degree centrality range of the shipping network is 0.0013–0.1612, with natural breakpoints of 0.0013, 0.0528, 0.0581, and 0.1612. The degree centrality values between adjacent breakpoints are marked, in order, as LD, MD, HD, representing low degree centrality, medium degree centrality, and high degree centrality, respectively; the betweenness centrality range of the shipping network is 0–0.1783, with natural breakpoints at 0, 0.0193, 0.0605, and 0.1783. The values of betweenness centrality between adjacent breakpoints are denoted, in order, as LB, MB, HB, representing low betweenness centrality, medium betweenness centrality, and high betweenness centrality, respectively. In P-space, the degree centrality range of the shipping network is 0.0013–0.4227, with natural breakpoints at 0.0013, 0.0172, 0.1731, and 0.4227. The degree centrality values between adjacent breakpoints are marked, in order, as LD, MD, HD, representing low degree centrality, medium degree centrality, and high degree centrality, respectively; the betweenness centrality range of the shipping network is 0–0.1299, with natural breakpoints at 0, 0.0118, 0.0369, and 0.1229. The values of betweenness centrality between adjacent breakpoints are denoted, in order, as LB, MB, HB, representing low betweenness centrality, medium betweenness centrality, and high betweenness centrality respectively. In future connectivity studies, we will utilize these classification labels to delineate the connectivity characteristics at both ends of the shipping network’s edges.
5.2. Node Significance of Port
Based on the two connection matrices constructed in Section 5.1, we use Algorithm 1 to evaluate the node significance of the shipping network: The range of the node significance in the L-space is 0.0004–0.1620, and the port with the highest node significance is Singapore Port, followed by Klang Port, Shenzhen Port, Hong Kong Port, and Shanghai Port. The range of the node significance in the P-space is 0.0013–0.7095, and the port with the highest node significance is Shanghai Port, followed by Shenzhen Port, Singapore Port, and Ningbo-Zhoushan Port. In different spaces, most of the ports with high node significance are distributed in the Asia–Pacific region, the top 20 of which are shown in Table 7. In addition, there are relatively few ports with high node significance in the European region, with Rotterdam Port being the port with high node significance in the L-space and Rotterdam Port, Antwerpen Port, and Hamburg Port being the ports with high node significance in the P-space.
Table 7.
Ranking of 20 ports with highest node significance in different spaces.
For the L-space, we compared Table 5 and Table 7 and found that the 20 ports with the highest degree centrality, betweenness centrality, and node significance have a higher degree of repetition, but that there are some differences in consistency. There are three specific types. The first type is the port that maintains the same ranking of node significance and centrality, with Singapore Port being the only representative, indicating that this port is superior to other ports worldwide in terms of connectivity, intermediary function, and entire-network control. Singapore Port is a shipping hub located between the Pacific and Indian Oceans, making it the most utilized port in the world and the most influential port in the shipping connectivity network. The second type, represented by Shanghai Port, Pusan Port, Guangzhou Port, Jabel Ali Port, and Rotterdam Port, showed a decrease in node significance compared to their centrality ranking. These ports showed outstanding performance in terms of degree centrality or betweenness centrality, but their node significance ranking is lower than their centrality ranking. This indicates that although Shanghai Port, Pusan Port, and Rotterdam Port maintained a large number of voyage connections based on their strong hinterland economic strength, their impact on the entire network is not especially prominent. In addition, the centrality and node significance of Guangzhou Port and Jabel Ali Port are relatively low. On the one hand, there are strong competitive ports near these two ports, such as Shenzhen Port and Abu Dhabi Port, respectively, which make Guangzhou Port and Jabel Ali Port less prominent in terms of centrality. On the other hand, Jabel Ali Port’s location conditions determine that it can only become an important port in the Middle East, while Guangzhou Port is an important node connecting southern China and Southeast Asia, so their impact on the entire shipping network is relatively weak. The third type is ports for which node significance ranks higher than centrality. The research found that the node significance ranking in most ports improved compared to their centrality ranking, indicating that these ports have unique advantages in controlling the entire shipping network. Among them, Klang Port, Hong Kong Port, Pusan Port, Tanjung Pelepas Port, and Colombo Port are all at key positions in world shipping. Although the centrality of ports such as Shenzhen Port, Xiamen Port, Tianjin Port, and Tokyo Port is not prominent, they are connected to some of the world’s major ports through container route networks, which has led to an increase in the node significance of these ports.
In addition, in L-space, the node significance of ports in other regions is relatively low. Among them, the ports with the highest node significance in the European region are Rotterdam Port, Algeciras Port, Antwerpen Port, Hamburg Port, etc.; the ports with the highest node significance in the Americas are Manzanillo Port, Savannah Port, Newport Port, etc.; and in Africa, there are ports such as Tangier Port, Port Said, and Damietta Port. Ports in East Asia and Southeast Asia exhibit a notably high node significance, surpassing that of ports across other continents. This pronounced significance is intricately linked to the economic surge in East Asia and the strategic geographical positioning of Southeast Asia.
For the P-space, we compared Table 5 and Table 7 and found that the top 20 ports for degree centrality, betweenness centrality, and node significance have a higher degree of repetition, but that there are more differences in consistency. There are five specific types. The first type is the port that maintains the same ranking of node significance and centrality, with Shanghai Port being the only representative, indicating that this port is superior to other ports worldwide in terms of transfer function and control over the entire transfer network. The second type, represented by Pusan Port, Rotterdam Port, Antwerpen Port, and Hamburg Port, showed a decrease in node significance compared to the centrality ranking. Although these ports can connect to a larger number of routes, their role in controlling the entire shipping transfer network is not prominent. The third type is ports whose node significance ranks higher than their centrality, including Shenzhen Port, Hong Kong Port, Klang Port, Qingdao Port, Kaohsiung Port, Xiamen Port, Colombo Port, Laem Chabang Port, Tanjung Pelepas Port, Jabel Ali Port, Ho Chi Minh Port, and Yokohama Port. These ports are either located in key positions in world shipping or connected to major ports in the world, and they have certain advantages in controlling the entire shipping transfer network. The fourth type comprises ports whose node significance ranks lower only than the degree centrality ranking, such as Singapore Port and Ningbo-Zhoushan Port. Singapore Port and Ningbo-Zhoushan Port have advantageous geographical locations and excellent natural conditions, with access to extensive shipping routes (surpassed only by Shanghai Port). Their node significance is also relatively high (albeit lower than that of Shenzhen Port). Specifically, Singapore Port serves as a hub for shipping routes to all the major oceans, while Ningbo-Zhoushan accesses routes that span nearly the entire globe. However, their intermediary role within the network is less significant than their transfer role. This is due to the P-space model’s construction method, which emphasizes accessibility and diminishes the intermediary concept, allowing many ports to reach each other directly without the need for intermediaries. The fifth type includes ports whose node significance ranks just below their betweenness centrality, with Guangzhou Port as a prime example. Guangzhou Port has a superior geographical location and is an important node connecting southern China and Southeast Asia. Research has found that Guangzhou Port has fewer routes compared to Shanghai Port and Singapore Port, but that its intermediary role in the transfer network is more prominent, indicating that Guangzhou Port performs a relatively important intermediary function in the transfer network. In addition, Guangzhou Port’s node significance is not pronounced, largely due to the numerous simple routes involving two ports, which in turn diminishes its role in maintaining the structural and functional integrity of the transfer network.
Moreover, ports in Asia retain a significantly high node significance in P-space, followed by those in Europe, while ports in other regions continue to have lower importance. In the Americas, ports with node significance include Savannah Port, Manzanillo Port, and Newport Port, while in Africa, they include Port Said, Tangier Port, and Damietta Port. Overall, ports of significant importance are primarily located in Asia, particularly in East and Southeast Asia, which correlates closely with regional economic development trends and geographical locations.
5.3. Edge Connectivity of Network
Based on the two connection matrices constructed in Section 5.1, we use Algorithm 2 to assess the connectivity of the shipping network, finding a connectivity value of 0.1631 in L-space, and the voyages that notably enhance the shipping network’s connectivity are primarily on the East African route. In P-space, the shipping network’s connectivity value is 0.7143, and the transfer routes that significantly improve the connectivity performance of the shipping network are mainly distributed on the Middle East routes. LD, MD, and HD represent low degree centrality, medium degree centrality, and high degree centrality, respectively. LB, MB, and HB represent low betweenness centrality, medium betweenness centrality, and high betweenness centrality, respectively. We selected edges with edge connectivity improvements above the tens of thousands for our research, and the results are shown in Table 8 and Table 9, respectively.
Table 8.
Edge connectivity of shipping network in L-space.
Table 9.
Edge connectivity of shipping network in P-space.
According to Table 8, in L-space, the shipping network contains two types of structure that can improve network connectivity. The first type is the LDLB-LDLB structure, with representative ports including Longoni Port, Majunga Port, Nosy Be Port, Mutsamudu Port, and Mogadishu Port. These ports are all distributed on the East African route, with advantageous geographical locations and mostly natural goods ports. They are import and export channels for local participation in international trade, but they are not the main ports on the East African route. The LDLB-LDLB structure, which includes the representative ports mentioned above, has the most significant effect on improving the connectivity of the shipping network. Although the busyness and transportation values for the East African route may not be as high as those for other major global routes such as the North Atlantic route and the Suez route, they are also important components of the global shipping network. As a branch line, the LDLB-LDLB structure has completed the export of certain agricultural products and mineral imports. These low-degree and low-betweenness ports have fewer edges, and their edge connectivity did not reach a convergence level. Therefore, increasing the number of voyages can improve the connectivity performance of the shipping network. The second type is comprised of the LDLB-MD and LDLB-HD structures, with representative ports including Port Louis, Jebel Ali Port, and Durban Port. This type of structure does not significantly improve the connectivity performance of the shipping network. Specifically, although Port Louis has low centrality, as an important stop for international shipping in the South Indian Ocean, it can connect to ports with higher node importance. Furthermore, Jebel Ali Port is one of the largest ports in the Middle East region, and Durban Port is the largest container port in South Africa. These ports are all important local ports that connect with a large number of international routes. In addition, these ports already have a certain number of connections with other ports with relatively high centrality, and even further increasing the number of voyages cannot significantly improve the connectivity of the shipping network.
According to Table 9, in the P-space, the shipping network contains three types of structure that can improve network connectivity. The first type is the LDMB-LDLB structure, with one end of the structure being the Assaluyeh Port on the Middle East route. This port mainly undertakes the export of Iranian petroleum derivatives, and its centrality is at a relatively low level. On the other end of the structure are Abadan Port, Dubai Port, Bushehr Port, Mahshahr Port, and Chabahar Port, among which Abadan Port, Bushehr Port, and Chabahar Port are important ports in Iran. Mahshahr Port is an important port for Middle East routes, while Dubai Port, located at the intersection of Asia, Europe, and Africa, is the largest free trade port in the Middle East. These ports have medium betweenness centrality and low degree centrality in the shipping network. The LDLB-LDMB structure has the most significant effect on improving the connectivity of the shipping network. On the one hand, it indicates that adding routes containing the aforementioned low-centrality ports can effectively enhance network connectivity. On the other hand, it also reflects the importance of some ports in Iran in the entire shipping transfer network. The second type is the LDMB-HD structure, which still has one end at Assaluyeh Port. On the other end of the structure, ports are concentrated in East Asia and Southeast Asia, all of which have high degree centrality. Most of these ports are of high node significance, such as Shanghai Port, Shenzhen Port, and Singapore Port. Compared to the LDLB-LDMB structure, the LDMB-HD structure has more reachable connections. Therefore, increasing the number of reachable voyages has a relatively insignificant effect on improving the connectivity performance of the shipping transfer network. The third type includes the LDLB-HD and LDLB-MD structures, featuring Bandar Abbas Port at one end and showing minimal enhancement in edge connectivity. Bandar Abbas Port, a primary Iranian port and crucial for Middle Eastern shipping, has low centrality. Compared to Assaluyeh Port, Bandar Abbas Port links to more high-centrality ports within the shipping transfer network, including prominent ports like Pusan, Ningbo-Zhoushan, and Kaohsiung. The LDLB-HD and LDLB-MD structures are already well-connected, and Bandar Abbas Port, positioned at the periphery of the shipping transfer network, is approaching a state of convergent edge connectivity, thus offering limited connectivity enhancement.
For L-space, significant improvements in shipping network connectivity were primarily observed on East African routes, featuring the LDLB-LDLB, LDLB-MD, and LDLB-HD structures, with the enhancing effect gradually weakening. For P-space, notable connectivity enhancements are on the Middle East routes, involving Iranian Assaluyeh Port and Bandar Abbas Port, exhibiting the LDMB-LDLB, LDMB-HD, LDLB-HD, and LDLB-MD structures, with the enhancing effect gradually weakening. Furthermore, ports of high node significance contribute less to enhancing the shipping network connectivity.
5.4. Discussion
This study presents a novel research framework for the shipping network, in which we attempt to reveal the positions of ports in the shipping network and the impact of edges on network connectivity from a new perspective. From the perspective of research methods, our node evaluation strategy differs significantly from existing robustness studies of shipping networks based on attacks and cascading failures [1,5,24]. The structural matrix can ensure the integrity of the information on the shipping network structure, and the importance of any port node is given by the structural information on all the nodes, ensuring consistency of evaluation. This method has a solid theoretical foundation and is applicable to various types of complex network. For example, Li et al. used similar matrices to discover important node clusters in Scale Free and Small World Networks, Dolphin Networks, and real E-Mail Networks and compared them with other algorithms [59]. The results showed that this method has significant advantages in accuracy, computational speed, and compatibility. In terms of connectivity evaluation, Pan et al. also attempted to use algebraic connectivity to solve the structural optimization problem of shipping networks [45]. In that study, the authors aimed to maximize algebraic connectivity by adjusting each edge to the most connected number. The results showed that linking ports of lesser connectivity with those of greater connectivity can greatly improve the connectivity of the entire shipping network. However, the huge operating costs generated by the increase in routes also affect the optimization of routes due to policies and cargo demand, resulting in a more ideal design of maximum optimized algebraic connectivity. We adopt a more guiding and practical strategy, which is to discover port pairs that significantly improve network connectivity by adding an inter-port route. This not only avoids the situation of excessive optimization that does not match reality, but also makes it easier to discover the structural characteristics of port pairs that significantly improve network connectivity. The technical framework we designed and the relevant conclusions we obtained can provide decision-making support for optimizing port layout, supporting container route planning, and improving the connectivity performance of shipping networks.
From the perspective of node significance, this study identifies that the ports with high node significance are predominantly concentrated in the Asia–Pacific region, particularly in East Asia and Southeast Asia. Conversely, fewer ports in other regions exhibit significant node significance. Notably, Colombo Port and Jebel Ali Port stand out as high-importance nodes in South Asia and West Asia, respectively. In Europe, the distribution of ports with high node significance differs between the L-space and P-space models. Rotterdam Port emerges as a prominent node in the L-space model, while Rotterdam, Antwerpen, and Hamburg Ports hold significant positions in the P-space model. These spatial variations in node significance are attributed not to geographic biases, but rather to disparities in global economic and port development. The Asia–Pacific region’s substantial economic scale underpins the rapid growth of its ports and shipping routes, thus elevating the importance of regional port nodes globally. Meanwhile, Rotterdam, Antwerpen, and Hamburg Ports serve as pivotal hub ports in Europe, facilitating robust economic and trade linkages between Asia and Europe due to their extensive port infrastructure and extensive shipping routes. This analysis underscores the critical role played by Rotterdam Port, Antwerpen Port, Hamburg Port, and other major ports in the global shipping network [21,24].
From the perspective of edge connectivity, this study explores the impact of edges on the connectivity of shipping networks in order to discover port pair features that effectively improve network connectivity performance. The research focuses on edge connectivity algorithms and edge addition strategy design, analyzing empirical data from the 2019 shipping schedules and routes of the top 30 Alphaliner shipping companies. Simulation experiments conducted by Pan et al. demonstrate that connecting ports with weak connectivity to ports with strong connectivity (mostly hub ports) can greatly improve the connectivity of the entire shipping network [45]. This finding supports our observation that adding routes containing LDLB type ports does indeed significantly improve the overall connectivity of the maritime network. Moreover, our study offers a more comprehensive view by identifying specific structural improvements that enhance maritime network connectivity, thereby providing targeted insights for planning container shipping routes between ports. However, based on the current research data and themes, we are unable to confirm the impact of connectivity on the economy, nor can we provide operational feasibility for new shipping links. In comparison to prior studies [7,43,45], our study follows a similar framework, employing connectivity research methodologies and empirical case studies. Future research endeavors could focus on analyzing the economic implications of enhancing connectivity and evaluating the practical feasibility of introducing new shipping connections for specific route scenarios.
6. Conclusions
In order to examine port node significance and the impact of edge connectivity on network connectivity from a network integrity perspective, we constructed a technical evaluation framework based on the Laplacian matrix. On the one hand, the structure matrix derived from the Laplacian matrix preserves the original network connection information and node degree information, and its minimum eigenvalue can be used to evaluate the impact of nodes on the entire network, i.e., node significance. On the other hand, the algebraic connectivity obtained from the Laplacian matrix can effectively measure the connectivity performance of the entire network. Combined with our designed edge connectivity evaluation strategy, we can effectively evaluate the impact of each edge on network connectivity performance. In addition, in order to examine the connection and transfer functions of port nodes, we separately constructed L-space and P-space networks for the route data.
This research mainly draws the following conclusions. (1) Singapore Port and Shanghai Port are the ports with the highest node significance in L-space and P-space, respectively, and their centrality ranking is consistent with node significance ranking, indicating that in the shipping network, Singapore’s connectivity function is the most prominent, while Shanghai Port’s transfer function is the most prominent. (2) Except for Singapore and Shanghai ports, the node significance ranking and centrality ranking of other ports are not consistent, and ports with higher node significance in different spaces are mostly distributed in the Asia–Pacific region, with China’s coastal ports making up the majority of these. (3) In L-space, the structures with significant increases in edge connectivity in the shipping network are the LDLB-LDLB, LDLB-MD, and LDLB-HD structures, which are mainly distributed on the East African routes. (4) In P-space, the structures with significant increases in edge connectivity in the shipping network are the LDMB-LDLB, LDMB-HD, LDLB-HD, and LDLB-MD structures, which are mainly distributed on the East African routes. These structures include the ports of Assaluyeh and Bandar Abbas in Iran.
Although the framework developed in this study effectively evaluates the node significance and edge connectivity of shipping networks comprehensively, it does possess some limitations. Specifically, it currently lacks the capability to directly inspire the design of new shipping routes based on structures that enhance network connectivity or analyze the operational feasibility of introducing new shipping connections. Future efforts will concentrate on addressing these shortcomings to bolster the framework’s scientific rigor and practical applicability.
Author Contributions
Conceptualization, W.D. and Z.L.; methodology, W.D.; software, W.D.; validation, W.D.; formal analysis, W.D. and Y.Z.; investigation, W.D.; resources, W.D. and Z.D.; data curation, W.D. and Y.Z.; writing—original draft preparation, W.D.; writing—review and editing, Z.L., Y.Z. and Z.D.; visualization, W.D. and Y.Z.; supervision, Z.L.; project administration, Z.L.; funding acquisition, Z.L. All authors have read and agreed to the published version of the manuscript.
Funding
This research was funded by the National Social Science Foundation of China, grant number 23&ZD147; Natural Science Foundation of Hebei grant number D2024203010; Science Research Project of Hebei Education Department, grant number BJS2024067; and National Social Science Foundation Cultivation Project of Yanshan University, grant number 2023PY010.
Institutional Review Board Statement
Not applicable.
Informed Consent Statement
Not applicable.
Data Availability Statement
Dataset available on request from the authors.
Conflicts of Interest
The authors declare no conflicts of interest.
References
- Xu, X.; Zhu, Y.; Xu, M.; Deng, W.; Zuo, Y. Vulnerability analysis of the global liner shipping network: From static structure to cascading failure dynamics. Ocean Coast. Manag. 2022, 229, 106325. [Google Scholar] [CrossRef]
- UNCTAD. Review of Maritime Transport 2019; United Nations: Geneva, Switzerland, 2019.
- Marcus, E.; Alejandro, T.; Yamir, M.; Efi, F.; Chaouki, K. DomiRank Centrality reveals structural fragility of complex networks via node dominance. Nat. Commun. 2024, 15, 56. [Google Scholar]
- Li, Z.; Li, H.; Zhang, Q.; Qi, X. Data-driven research on the impact of COVID-19 on the global container shipping network. Ocean Coast. Manag. 2024, 248, 106969. [Google Scholar] [CrossRef]
- Qin, Y.F.; Guo, J.K.; Liang, M.X.; Feng, T. Resilience characteristics of port nodes from the perspective of shipping network: Empirical evidence from China. Ocean Coast. Manag. 2023, 237, 106531. [Google Scholar] [CrossRef]
- Guo, S.; Lu, J.; Qin, Y. Analysis of the coupled spatial and temporal development characteristics of global liner shipping connectivity driven by trade. Ocean Coast. Manag. 2024, 251, 107071. [Google Scholar] [CrossRef]
- Pisit, J.; Amar, R.; Jorge, L.B. A connectivity-based approach to evaluating port importance in the global container shipping network. Marit. Econ. Logist. 2022, 25, 602–622. [Google Scholar]
- Zhu, J.; Liu, W.; Yang, Y. A port importance evaluation method based on the projection pursuit model in shipping networks. J. Mar. Sci. Eng. 2023, 11, 724. [Google Scholar] [CrossRef]
- Notteboom, T.; Pallis, T.; Rodrigue, J.P. Disruptions and resilience in global container shipping and ports: The COVID-19 pandemic versus the 2008-2009 financial crisis. Marit. Econ. Logist. 2021, 23, 179–210. [Google Scholar] [CrossRef]
- Guo, J.K.; Guo, S.; Lv, J. Potential spatial effects of opening Artic shipping routes on the shipping network of ports between China and Europe. Mar. Pol. 2022, 136, 104885. [Google Scholar] [CrossRef]
- Deng, Z.; Duan, W.; Zhou, Y.T. Analysis of port transportation function based on the structure of cargo types. Appl. Spat. Anal. Policy 2023, 16, 437–459. [Google Scholar] [CrossRef]
- Deng, Z.; Li, Z.F.; Duan, W. Research on the symbiosis of port and city based on symbiosis theory: Empirical evidence from China’s coastal port groups. Int. J. Shipp. Transp. Logist. 2023, 16, 210–230. [Google Scholar]
- Sui, Z.; Wen, Y.; Huang, Y.; Zhou, C.; Xiao, C. Empirical analysis of complex network for marine traffic situation. Ocean Eng. 2020, 214, 107848. [Google Scholar] [CrossRef]
- Ducruet, C.; Zaidi, F. Maritime constellations: A complex network approach to shipping and ports. Marit. Policy Manag. 2012, 39, 151–168. [Google Scholar] [CrossRef]
- Ducruet, C. Network diversity and maritime flows. J. Transp. Geogr. 2013, 30, 77–88. [Google Scholar] [CrossRef]
- Tovar, B.; Hernández, R.; Rodríguez-Déniz, H. Container port competitiveness and connectivity: The Canary Islands main ports case. Transp. Policy 2015, 38, 40–51. [Google Scholar] [CrossRef]
- Fraser, D.R.; Notteboom, T.; Ducruet, C. Peripherality in the global container shipping network: The case of the Southern African container port system. GeoJournal 2016, 81, 139–151. [Google Scholar] [CrossRef]
- Wu, J.; Zhang, D.; Wan, C.; Zhang, J.; Zhang, M. Novel Approach for Comprehensive Centrality Assessment of Ports along the Maritime Silk Road. Transp. Res. Record 2019, 2673, 461–470. [Google Scholar] [CrossRef]
- Wan, C.; Zhao, Y.; Zhang, D.; Yip, T.L. Identifying important ports in maritime container shipping networks along the Maritime Silk Road. Ocean Coast. Manag. 2021, 211, 105738. [Google Scholar] [CrossRef]
- Yang, Y.; Liu, W.; Xu, X. Identifying Important ports in Maritime Silk Road shipping network from local and global perspective. Transp. Res. Record 2022, 2676, 798–810. [Google Scholar] [CrossRef]
- Liu, Q.; Yang, Y.; Ke, L.; Ng, A.K.Y. Structure of port connectivity, competition, and shipping networks in Europe. J. Transp. Geogr. 2022, 102, 103360. [Google Scholar] [CrossRef]
- Low, J.M.W.; Tang, L.C. Network effects in the East Asia container ports industry. Marit. Policy Manag. 2012, 39, 369–386. [Google Scholar] [CrossRef]
- Wang, G.W.Y.; Zeng, Q.; Li, K.; Yang, J. Port connectivity in a logistic network: The case of Bohai Bay, China. Transp. Res. Pt. e-Logist. Transp. Rev. 2016, 95, 341–354. [Google Scholar] [CrossRef]
- Xu, M.; Deng, W.; Zhu, Y.; LÜ, L. Assessing and improving the structural robustness of global liner shipping system: A motif-based network science approach. Reliab. Eng. Syst. Saf. 2023, 240, 109576. [Google Scholar] [CrossRef]
- Liu, J.; Qi, Y.; Lyu, W. Port resilience in the post-COVID-19 era. Ocean Coast. Manag. 2023, 238, 106565. [Google Scholar] [CrossRef]
- Fan, H.; Gong, X.; Lyu, J. Resilience assessment of strait/canal: A rule-based Bayesian network framework. Transport. Res. Part D-Transport. Environ. 2023, 124, 103960. [Google Scholar] [CrossRef]
- Yang, Y.B.; Liu, W. Resilience Analysis of Maritime Silk Road Shipping Network Structure under Disruption Simulation. J. Mar. Sci. Eng. 2022, 10, 617. [Google Scholar] [CrossRef]
- Zhang, Q.; Pu, S.; Luo, L.; Liu, Z.; Xu, J. Revisiting important ports in container shipping networks: A structural hole-based approach. Transp. Policy 2022, 126, 239–248. [Google Scholar] [CrossRef]
- Low, J.M.W.; Lam, S.W.; Tang, L.C. Assessment of hub status among Asian ports from a network perspective. Transp. Res. Pt. A-Policy Pract. 2009, 43, 593–606. [Google Scholar]
- Rousset, L.; Ducruet, C. Disruptions in Spatial Networks: A comparative study of major shocks affecting ports and shipping patterns. Netw. Spat. Econ. 2020, 20, 423–447. [Google Scholar] [CrossRef]
- Wong, E.Y.C.; Tai, A.H.; So, S. Container drayage modelling with graph theory-based road connectivity assessment for sustainable freight transportation in new development area. Comput. Ind. Eng. 2020, 149, 106810. [Google Scholar] [CrossRef]
- Laxe, F.G.; Seoane, M.J.F.; Montes, C.P. Maritime degree, centrality and vulnerability: Port hierarchies and emerging areas in containerized transport (2008–2010). J. Transp. Geogr. 2012, 24, 33–44. [Google Scholar] [CrossRef]
- Cullinane, K.; Wang, Y.H. The hierarchical configuration of the container port industry: An application of multiple linkage analysis. Marit. Policy Manag. 2012, 39, 169–187. [Google Scholar] [CrossRef]
- Wan, C.; Tao, J.L.; Wu, L.; Zhang, D. An analysis of influences of the COVID-19 on the spatial structure of the China’s global shipping network. J. Transp. Inf. Saf. 2020, 38, 129–135. [Google Scholar]
- Jiang, J.; Lee, H.L.; Chew, E.P.; Gan, C.C. Port connectivity study: An analysis framework from a global container liner shipping network perspective. Transp. Res. Pt. e-Logist. Transp. Rev. 2015, 73, 47–64. [Google Scholar] [CrossRef]
- Wilmsmeier, G.; Hoffmann, J. Liner shipping connectivity and port infrastructure as determinants of freight rates in the Caribbean. Marit. Econ. Logist. 2008, 10, 130–151. [Google Scholar] [CrossRef]
- Wilmsmeier, G.; Martinez-Zarzoso, I. Determinants of maritime transport costs—A panel data analysis for Latin American trade. Transp. Plan. Technol. 2010, 33, 105–121. [Google Scholar] [CrossRef]
- Lei, Q.; Bachmann, C. Assessing the role of port efficiency as a determinant of maritime transport costs: Evidence from Canada. Marit. Econ. Logist. 2019, 22, 562–584. [Google Scholar] [CrossRef]
- Tang, C.L.; Low, W.M.J.; Lam, W.S. Understanding port choice behavior—A network perspective. Netw. Spat. Econ. 2011, 11, 65–82. [Google Scholar] [CrossRef]
- Lam, L.S.J.; Yap, Y.W. Dynamics of liner shipping network and port connectivity in supply chain systems: Analysis on East Asia. J. Transp. Geogr. 2011, 19, 1272–1281. [Google Scholar] [CrossRef]
- Calatayud, A.; Mangan, J.; Palacin, R. Connectivity to international markets: A multi-layered network approach. J. Transp. Geogr. 2017, 61, 61–71. [Google Scholar] [CrossRef]
- Ducruet, C.; Wang, L. China’s global shipping connectivity: Internal and external dynamics in the contemporary Era (1890–2016). Chin. Geogr. Sci. 2018, 282, 202–216. [Google Scholar] [CrossRef]
- Pan, J.; Bell, M.G.H.; Cheung, K.F.; Perera, S.; Yu, H. Connectivity analysis of the global shipping network by eigenvalue decomposition. Marit. Policy Manag. 2019, 8, 957–966. [Google Scholar] [CrossRef]
- Cheung, K.F.; Bell, M.G.H.; Pan, J.; Perera, S. An eigenvector centrality analysis of world container shipping network connectivity. Transp. Res. Pt. e-Logist. Transp. Rev. 2020, 140, 101991. [Google Scholar] [CrossRef]
- Pan, J.; Zhang, Y.; Fan, B. Strengthening container shipping network connectivity during COVID-19: A graph theory approach. Ocean Coast. Manag. 2022, 229, 106338. [Google Scholar] [CrossRef] [PubMed]
- Li, J.; Zhao, H.; Xu, B. Optimization of Container Shipping Network Reconfiguration under RCEP. J. Mar. Sci. Eng. 2022, 10, 873. [Google Scholar] [CrossRef]
- Wang, Y.; Cullinane, K. Determinants of port centrality in maritime container transportation. Transp. Res. Pt. e-Logist. Transp. Rev. 2016, 95, 326–340. [Google Scholar] [CrossRef]
- Chen, J.; Ye, J.; Zhuang, C.; Qin, Q.; Shu, Y. Liner shipping alliance management: Overview and future research directions. Ocean Coast. Manag. 2022, 219, 106039. [Google Scholar] [CrossRef]
- Christiansen, M.; Hellsten, E.; Pisinger, D.; Sacramento, D.; Vilhelmsen, C. Liner shipping network design. Eur. J. Oper. Res. 2020, 286, 1–20. [Google Scholar] [CrossRef]
- Saito, T.; Shibasaki, R.; Murakami, S.; Tsubota, K.; Matsuda, T. Global Maritime Container Shipping Networks 1969-1981: Emergence of Container Shipping and Reopening of the Suez Canal. J. Mar. Sci. Eng. 2022, 10, 602. [Google Scholar] [CrossRef]
- Zhu, J.; Gao, M.; Zhang, A.; Hu, Y.; Zeng, X. Multi-Ship Encounter Situation Identification and Analysis Based on AIS Data and Graph Complex Network Theory. J. Mar. Sci. Eng. 2022, 10, 1536. [Google Scholar] [CrossRef]
- Wang, Y.; Cullinane, K. Measuring container port accessibility: An application of the Principal Eigenvector Method (PEM). Marit. Econ. Logist. 2008, 10, 75–89. [Google Scholar] [CrossRef]
- Manjalavil, M.M.; Ramadurai, G. Topological properties of bus transit networks considering demand and service utilization weight measures. Physica A 2020, 555, 124683. [Google Scholar] [CrossRef]
- Sienkiewicz, J.; Holyst, J.A. Statistical analysis of 22 public transport networks in Poland. Phys. Rev. E 2005, 72, 046127. [Google Scholar] [CrossRef]
- Sen, P.; Dasgupta, S.; Chatterjee, A.; Sreeram, P.A.; Mukherjee, G. Small-world properties of the Indian railway network. Phys. Rev. E 2003, 67, 036106. [Google Scholar] [CrossRef]
- Xu, X.; Hu, J.; Liu, F.; Liu, L. Scaling and correlations in three bus-transport networks of China. Physica A 2007, 374, 441–448. [Google Scholar] [CrossRef]
- Yang, L.J.; Wang, J.; Yang, Y.C. Spatial evolution and growth mechanism of urban networks in western China: A multi-scale perspective. J. Geogr. Sci. 2022, 32, 517–536. [Google Scholar] [CrossRef]
- Zhou, Z.P.; Irizarry, J. Integrated framework of modified accident energy release model and network theory to explore the full complexity of the Hangzhou subway construction collapse. J. Manag. Eng. 2016, 32, 05016013. [Google Scholar] [CrossRef]
- Liu, H.; Xu, X.; Lu, J.A.; Chen, G.; Zeng, Z. Optimizing Pinning Control of Complex Dynamical Networks Based on Spectral Properties of Grounded Laplacian Matrices. IEEE Trans. Syst. Man Cybern. Syst. 2019, 51, 786–796. [Google Scholar] [CrossRef]
- Fiedler, M. Algebraic connectivity of graphs. Czech. Math. J. 1973, 23, 298–305. [Google Scholar] [CrossRef]
- Afshari, B. Algebraic connectivity of the second power of a graph. J. Graph Theory 2023, 104, 275–281. [Google Scholar] [CrossRef]
- Phillips, J.D. Why everything is connected to everything else. Ecol. Complex. 2023, 54–55, 101051. [Google Scholar] [CrossRef]
- Guo, J.; Feng, T.; Wang, S.; Qin, Y.; Yu, X. Shipping network vulnerability assessment integrated with geographical locations. Transport. Res. Part D-Transport. Environ. 2024, 130, 104166. [Google Scholar] [CrossRef]
- Nguyen, N.P.; Kim, H. The effects of the COVID-19 pandemic on connectivity, operational efficiency, and resilience of major container ports in Southeast Asia. J. Transp. Geogr. 2024, 116, 103835. [Google Scholar] [CrossRef]
Disclaimer/Publisher’s Note: The statements, opinions and data contained in all publications are solely those of the individual author(s) and contributor(s) and not of MDPI and/or the editor(s). MDPI and/or the editor(s) disclaim responsibility for any injury to people or property resulting from any ideas, methods, instructions or products referred to in the content. |
© 2024 by the authors. Licensee MDPI, Basel, Switzerland. This article is an open access article distributed under the terms and conditions of the Creative Commons Attribution (CC BY) license (https://creativecommons.org/licenses/by/4.0/).