Article

Unveiling the Sensitivity Analysis of Port Carbon Footprint via Power Alternative Scenarios: A Deep Dive into the Valencia Port Case Study

by
Seyed Behbood Issa-Zadeh
1,*,
M. Dolores Esteban
1,*,
José-Santos López-Gutiérrez
1 and
Claudia Lizette Garay-Rondero
2
1
Escuela Técnica Superior de Ingenieros de Caminos, Canales y Puertos, Universidad Politécnica de Madrid, 28040 Madrid, Spain
2
Institute for the Future of Education, School of Engineering and Sciences Tecnologico de Monterrey, Ave. Eugenio Garza Sada 2501, Monterrey 64849, Mexico
*
Authors to whom correspondence should be addressed.
J. Mar. Sci. Eng. 2024, 12(8), 1290; https://doi.org/10.3390/jmse12081290
Submission received: 25 June 2024 / Revised: 25 July 2024 / Accepted: 30 July 2024 / Published: 31 July 2024
(This article belongs to the Special Issue Smart Seaport and Maritime Transport Management)

Abstract

:
The Port of Valencia, a prominent maritime center, is actively working towards minimizing its carbon emissions and aims to become a completely carbon-neutral port soon. This research uses data-driven sensitivity analysis to explore realistic power-generating options for a seaport to reduce its emissions. This approach comprises changing key parameters in power consumption and deploying renewable energies (rather than electricity and infrastructure prices, which are beyond the scope of this study) to assess their impact on the port’s overall emissions profile. Through sensitivity analysis, policymakers and managers discover each scenario’s efficacy and find the best decarbonization strategies. After thoroughly examining four realistic scenarios, our research findings show that each scenario’s emission reduction share and sensitivity are practical and feasible. It becomes clear that gradually replacing traditional fossil fuels for electricity generation with renewables is a reasonable and realistic option for emissions reduction. The results demonstrate that focusing on reasonable targets, such as replacing 30% and 50% of electricity generation with renewables, is more achievable and beneficial in the medium term than ambitious goals, like replacing all electricity with renewable energy. This research contributes to reducing emissions of the Port of Valencia by using data-driven sensitivity analysis to find practical renewable energy strategies. It provides actionable insights for managers and policymakers to implement feasible decarbonization plans, emphasizing gradual adoption of renewables over ambitious goals, thus supporting sustainable maritime operations.

1. Introduction

The integration of renewable energies into maritime logistics and ports has become a significant focus in contemporary research. This is primarily driven by the need to reduce carbon footprints through innovative energy solutions. Reducing electrical power use and transitioning to renewable energy at seaports are critical to reducing emissions and increasing sustainability in these vital marine regions [1,2,3].
Moreover, the importance of mitigating electrical power consumption in seaports arises from the fact that these facilities typically require large amounts of energy to carry out and to support different tasks, including cargo handling, ship operations, and maintenance services [4].
Seaports may drastically minimize their carbon footprint (CF) and emissions related to power issues by limiting energy use or generating energy from renewables [5,6,7]. Implementing energy-efficient technology and practices, such as adequate lighting systems, intelligent grid options, optimal power management tactics, and cold ironing (CI) (which is the process of providing shoreside electrical power to a ship at berth, allowing its main and auxiliary engines to be turned off, thereby reducing emissions), may result in significant energy savings and lower seaport emissions [8,9,10,11,12].
In addition, renewable energy sources like solar, wind, and tidal power provide long-term alternatives to fossil-fuel-based power production. In this regard, seaports, which are often exposed to abundant sunshine, high winds, and tidal movements, may use these natural resources to generate clean power [13,14].
Furthermore, solar cells, wind turbines, and wave energy converters installed at seaports may reduce emissions and offer a dependable and decentralized electrical power system, enhancing power resilience in the marine industry [15,16]. Moreover, embracing renewable energy at seaports is consistent with global efforts to tackle climate change and may serve as a model for other companies looking to lessen their environmental effect [17,18].
In this context, the “Main objective” of this research study is to investigate and evaluate some possibilities for reducing the CF of ports, notably by using renewables in power generation. This emphasis on sensitivity analysis enables a thorough knowledge of the possible consequences and efficacy of alternative mitigation solutions.
The “Novelty of the issue” addressed in this study is found in the context of seaports and their distinct energy generation. On the other hand, because seaports frequently constitute energy-intensive places, knowing how different scenarios of reduced power generation might influence the CF becomes critical for sustainable port management.
This research study’s primary “Target audience” would be port authorities, politicians, and academics in marine and environmental sciences. This study strives to provide helpful knowledge and inform decision-making processes regarding achieving a more sustainable and environmentally friendly port industry by identifying a “Research gap” in the existing literature regarding the sensitivity analysis for potential port CF reduction scenarios.
Nevertheless, there is a significant deficiency in the implementation of sensitivity analysis specifically for seaports’ greenhouse gas (GHG) emissions, especially in European settings. Although numerous studies examine the overall integration of renewable energy and the application of modern technology, a dearth of comprehensive case studies analyze the carbon footprint and power consumption effects at individual ports using sensitivity analysis. To fill this need, this study centers on extensive analysis of a particular port in Spain, particularly the Port of Valencia.
The following section will describe the materials and procedures for preparing this research article. After that, the authors will move on to Section 3, illustrating the research’s primary concern, sensitivity analyses, in the case of the study. Section 4 will review the findings, and Section 5 will serve as the research’s conclusion.

2. Materials and Methods

This research paper focuses on the sensitivity analyses of four different alternative scenarios for power generation at the Port of Valencia, which acts as the case study in this analysis research. The authors primarily conduct a narrative literature evaluation in this section to identify research gaps and provide the most important contributions. Then, in the following subsection, they examine the sensitivity analysis methods and the difficulties surrounding this.

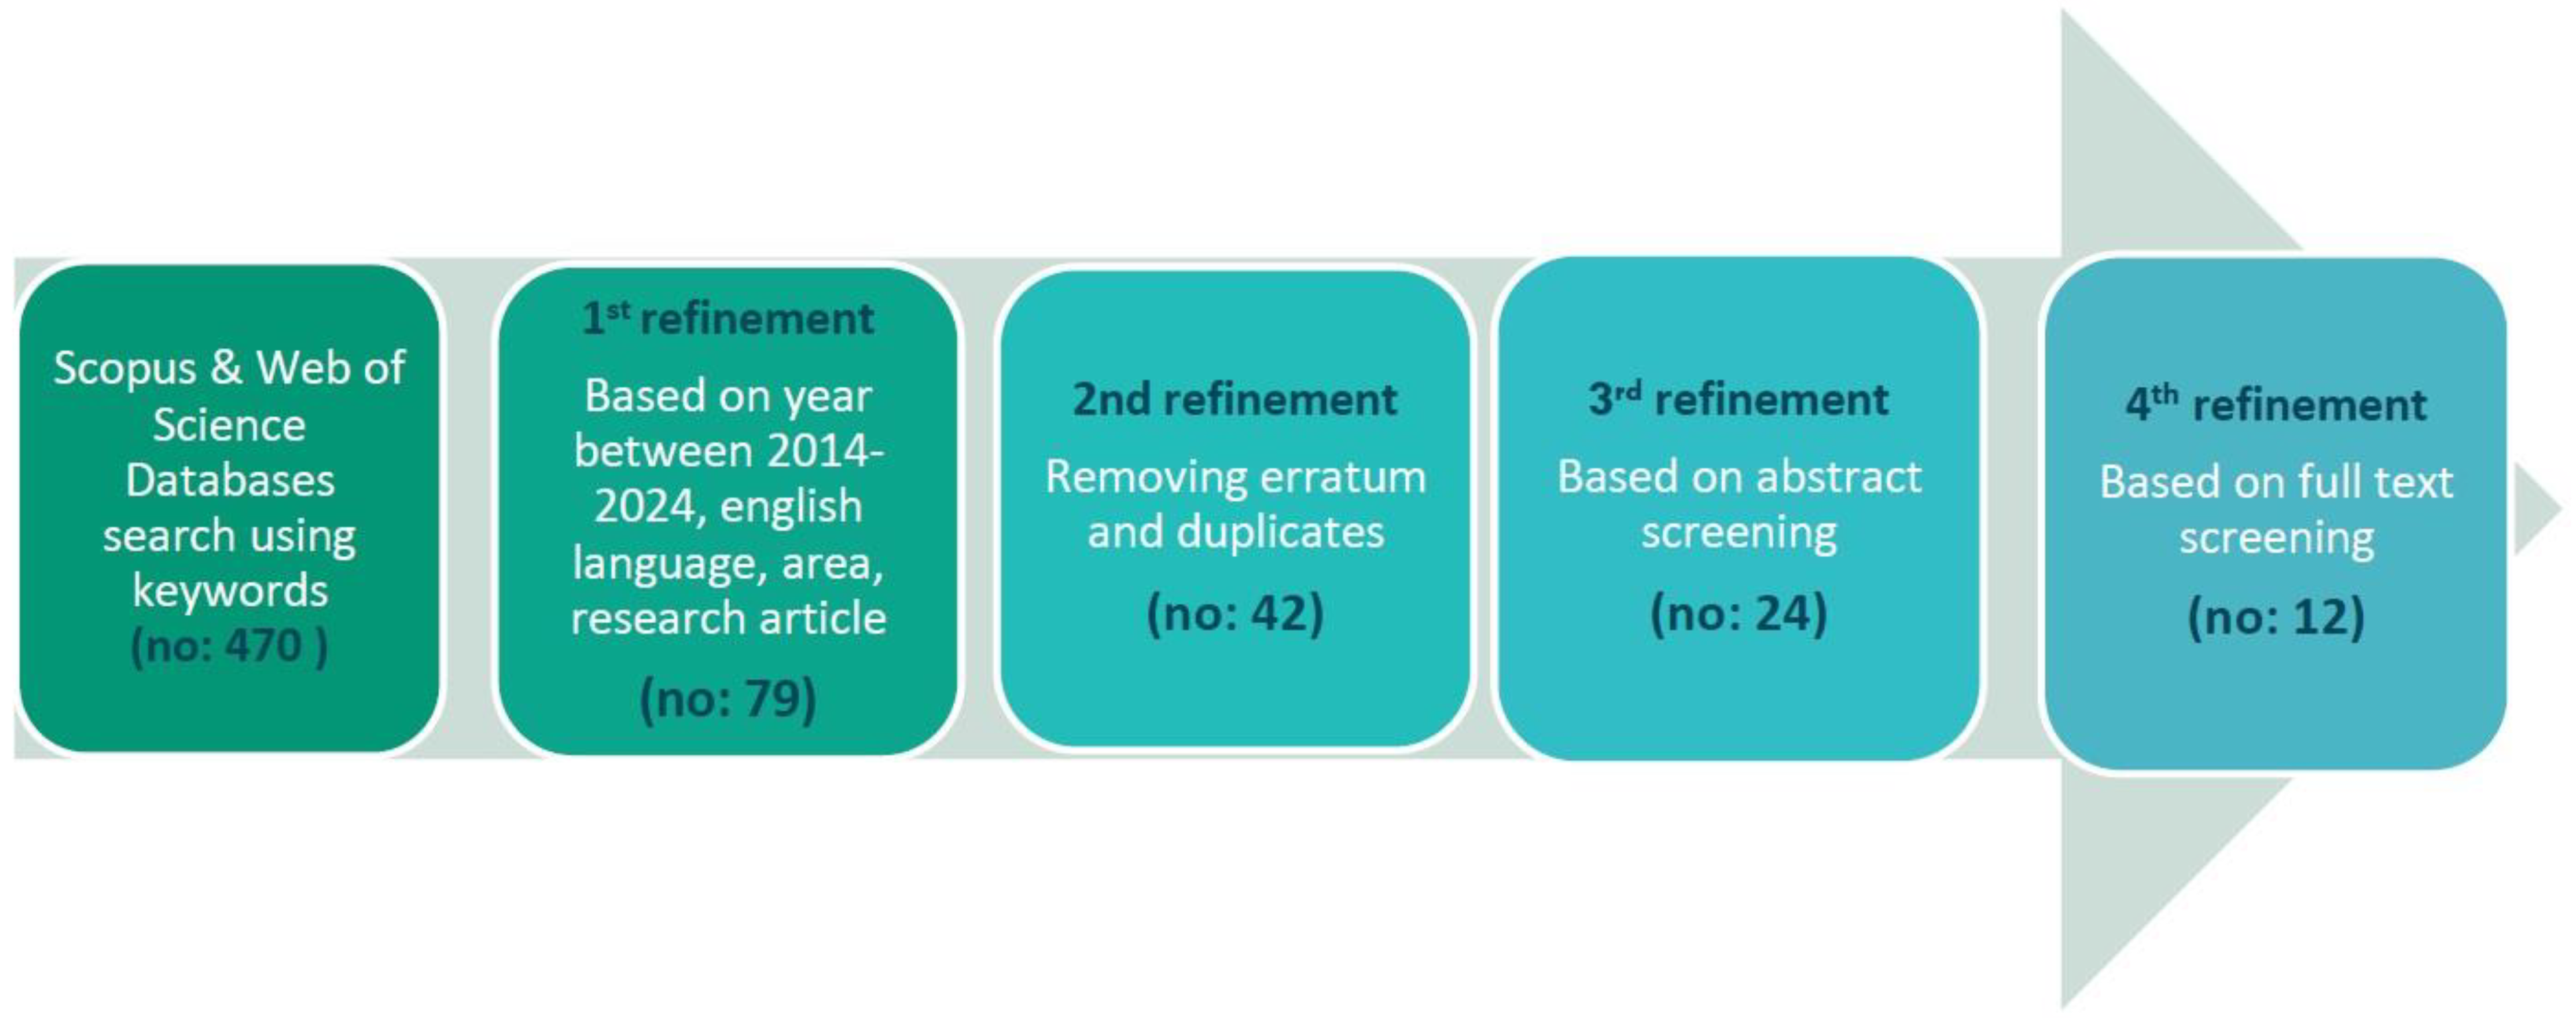
2.1. Literature Review

A narrative literature review is conducted as part of the materials and methods section to begin the research. Using two databases, “Scopus” and “Web of Science”, provides some basic information about sensitivity analysis, particularly in maritime logistics and ports, and provides a theoretical background about the applied sensitivity analysis method in the field, as well as applications and studies related to the emission share, carbon footprint, and port power alternatives.
These two data sources are used because of their comprehensive coverage in scientific research and filtering facilities to find more relevant resources. In this context, the following keywords were used to search for possible articles and filter them, including (“sensitivity analysis” OR “sensitivity evaluation” OR “sensitivity assessment”) AND (“maritime” OR “ports” OR “seaports” OR “marine”) AND “carbon footprint” AND “renewable energies.”
Figure 1 illustrates the process of literature acquisition, which involved keyword-based searches on abstracts and titles in databases, resulting in 470 records. The next stage was the initial refinement process, which screened the identified literature from 2014 to 2024, selecting only English-language research articles in the areas of engineering, energy fuels, environmental sciences, ecology, urban studies, business management accounting, and Earth planetary sciences. This resulted in a total of 79 articles. A second refinement was then carried out to remove errata and duplicate articles. After this third refinement, 42 abstracts were screened, resulting in a shortlist of 24 publications.
The final refinement involved thoroughly reading 24 research papers to identify the most relevant and related articles. This step was undertaken by considering specific criteria such as adherence to rigorous research methods, utilization of reliable techniques, and inclusion of extensive datasets that accurately represent real-world situations. After applying these filtering procedures, 12 articles were identified.
Subsequently, the following paragraphs describe the 12 most relevant articles using sensitivity analysis and applications on renewable energies in the maritime industry, logistics, and transport.

2.1.1. Theoretical Background in Sensitivity Analysis

Recent research has focused on integrating renewable energies in maritime logistics and ports, particularly reducing carbon footprints through innovative energy solutions. In addition, sensitivity analysis has emerged as a crucial methodology in these studies, providing insights into the optimization and feasibility of various renewable energy technologies.
For this, it is pertinent to note the four primary studies on the state of the art of sensitivity analysis discovered throughout this literature review. In the book of Saltelli et al. (n.d.), a comprehensive guide on global sensitivity analysis is given, focusing on techniques like the method of Morris and variance-based methods to assess the importance of input factors in scientific models [19].
Another relevant work in the field, by Le Gratiet et al. (2015), discusses using polynomial chaos expansions and Gaussian processes for global sensitivity analysis, demonstrating the efficiency of these methods in computing Sobol’s indices for computationally expensive models [20].
Later, Borgonovo (2017) introduces the sensitivity analysis methodology for model output, covering deterministic methods like tornado diagrams and probabilistic methods such as variance-based approaches, aiming to guide analysts in effectively applying these techniques to gain insights from quantitative models [21].
Finally, as a practical foundation in this research, the work of Razavi et al. (2015) emphasizes the need for comprehensive sensitivity analysis in water resources research, advocating for methods that capture complex interactions within models to improve robustness and interpretability [22].

2.1.2. Relevant Studies in Empirical Research: Renewable Energies in the Maritime Industry

As a result of the literature review in empirical and applied research on case studies and specific analyses in the field of renewable energy in seaports, sensitivity analysis, carbon footprint, electricity generation, emission share, and decarbonization, we can classify the findings in the literature into five main groups:
(i)
Integration of hydrogen and renewable energy in marine applications: Gabbar et al. (2021) and Wang et al. (2023) delve into integrating nuclear–renewable hybrid energy systems and hydrogen-fueled ships, respectively. Gabbar et al. (2021) utilizes sensitivity analysis to evaluate various energy scenarios, aiming to reduce GHG emissions and optimize the energy mix for marine ships [23,24].
Similarly, Wang et al. (2023) employ a life cycle assessment framework to quantify the environmental impact and economic feasibility of hydrogen-fueled ships, emphasizing sustainability and the reduction in the carbon footprint through renewable energy integration [24] Additionally, Berna-Escriche et al. (2023) focus on the potential of hydrogen as a renewable energy vector for marine applications. Sensitivity analysis is employed to assess the viability and impact of hydrogen integration on energy efficiency and carbon footprints [25].
Thaler et al. (2023) optimize carbon capture and renewable energy systems in marine vessels, demonstrating the benefits of advanced renewable technologies like hydrogen through extensive sensitivity analysis [26]. Finally, Song et al. (2023) examines the maritime supply chains for emerging fuels such as hydrogen, ammonia, and methanol, comparing them to liquefied natural gas (LNG) [27].
They conduct a sensitivity analysis on ambient temperature, storage time, and pipeline length. Their results show that methanol is the most energy-efficient when produced from renewable sources, followed by ammonia. Hydrogen, despite its potential, requires efficient boil-off gas handling systems to be competitive.
(ii)
Enhancing marine microgrids and offshore energy hubs: In maritime microgrids, Daraz (2023) offers an optimized cascaded controller that improves frequency stability. Sensitivity analysis provides consistent performance under changing load conditions, which is critical for the dependability of renewable energy systems in maritime applications [28].
Meanwhile, Zhang et al. (2022) concentrate on modeling and assessing offshore energy hubs that incorporate a variety of renewable sources. Their sensitivity analysis reveals the best configurations and performance under various environmental and operational conditions, which is critical for developing clean offshore energy [29].
(iii)
Green strategies for ports and seaports: Integrating renewable energies in ports and seaports is a critical area of study. Vakili et al. (2022) benchmark fossil fuel reduction strategies in maritime logistics by utilizing sensitivity analysis to compare the effectiveness of various renewable energy technologies in reducing GHG emissions [30].
Moreover, Gabbar et al. (2021) introduce nuclear–renewable hybrid energy systems (N-R HESs) as an effective solution for reducing GHG emissions in ocean-going ships. The study confirms the viability of N-R HESs as a cost-effective, reliable alternative for maritime energy, combining renewable energy with small-scale nuclear reactors [31]. Finally, Błażejewski T et al. (2021) demonstrate how a milk reusable packaging system using stainless-steel churns and glass bottles can significantly reduce CO2 emissions and resource depletion compared to single-use bottles. Sensitivity analysis underscores the robustness of these findings, revealing that recycling rates, water consumption for cleaning, reuse rates, and electricity sources critically influence environmental outcomes [32].
(iv)
Technological innovations and environmental sustainability: Chen et al. (2023) explore renewable energy solutions for marine applications using sensitivity analysis to evaluate the feasibility and benefits of integrating solar, wind, and hydrogen energy. Their research aims to enhance sustainability and reduce the carbon footprint of marine operations [33].
Zhai et al. (2021) present a lifecycle assessment (LCA) of a wave energy converter, using sensitivity analysis to understand the uncertainties and impacts of various environmental factors on the lifecycle impact assessment results. Finally, the impact of control parameters in the DE algorithm is assessed using the Adaptive Differential Evolution (ADE) algorithm. A sensitivity analysis is carried out to assess the impact of different system parameters on this study’s findings [34].
(v)
Renewable methanol and onboard carbon capture: Thaler et al. (2023) investigate the use of synthetic fuels, particularly renewable methanol, in ship propulsion systems. They utilize a mixed-integer optimization framework and sensitivity analysis to evaluate the techno-economic performance of systems integrating onboard carbon-capture technologies. The results indicate significant cost advantages and emission reductions, demonstrating the potential for sustainable shipping solutions [26].
This thorough literature review highlights the importance of sensitivity analysis in attaining environmental sustainability in the maritime industry. It focuses on optimizing energy configuration to reduce GHG emissions, thereby decreasing the seaport’s CF. This energy configuration prioritizes using several technologies, such as hydrogen fuel cells, microgrids, and renewable energies, to generate power. These technologies aim to reduce GHG emissions and enhance operational efficiency.
Nevertheless, there is a significant deficiency in implementing sensitivity analysis specifically for assessing the CF of seaports, especially in European settings. Many studies examine integrating renewable energy and advanced technologies, but specific case studies are insufficient to analyze the CF effects at individual ports.
To address this gap, this study utilizes sensitivity analysis to evaluate the influence of fossil fuel consumption as the main variable in demonstrating how the use of renewable energies can lead to a reduction in this consumption. The subsequent phase of this research focuses on conducting a comprehensive case analysis of a specific harbor in Spain, specifically the Port of Valencia.

2.2. Methods

The method of preparing this research article includes two main steps. The first step is to collect information described in Section 2.1 and gather related information about reducing power consumption and deploying renewable energies, particularly in seaports that are intensive power use hubs.
The second step is to gather information about the different sensitivity analysis methods to have a helpful command of each type, try to merge some of them, and prepare the research work. After providing a sensitivity analysis technique, it is time to perform it in the case of the study. The general methodology of the selected technique involves the following steps:
A. 
Define the model and its inputs: Define the model and determine the critical input factors influencing its output. In this research case study, these input variables may be parameters, coefficients, or external elements that impact the model’s behavior, such as power generation or the use of renewable energies.
B. 
Determine the range of values for each input variable: Determine the feasible range of values for each input variable. This range should represent the uncertainty or unpredictability of the input data and real-world situations, ranging from 0 to 100 percent of power generation by traditional resources, shown with generating electricity by renewables in this research study.
C. 
Select a sensitivity analysis method: Based on the model’s properties and the research issue, choose an appropriate sensitivity analysis approach. Different methodologies have different strengths and weaknesses, and the context of the study determines the decision. This research project employs a model that can combine localized sensitivity analysis, variance-based methodology, and metamodel-based approaches, which will be discussed in the following sections.
D. 
Perform the sensitivity analysis: Apply the selected model and its input variables. This might include running the model numerous times with varied input values or utilizing a computational tool to create random input situations.
E. 
Analyze the results: Interpret the sensitivity study findings to identify the most crucial and feasible input variables, evaluate the model’s overall sensitivity, and analyze potential emission shares associated with uncertainty in input data.
F. 
Draw conclusions: Based on the analysis findings, conclude the model’s robustness, suggest areas for additional exploration, and provide recommendations to improve the model’s dependability and applicability.
The following section will apply the mentioned steps to elucidate the sensitivity analysis, preceded by a concise explanation of the necessary statistical information about the case study.

3. Sensitivity Analysis on the Case Study

The CF of the Valencia Port Authority (APV) was computed by Issa Zadeh et al. (2023) as a continuation of the research line in this case of the study [35]. Then, sensitivity analysis for the four possible scenarios will be computed, and the findings will be explained.
The Valencia Port Authority (Autoridad Portuaria de Valencia (APV)), located in the east of Spain, manages the Port of Valencia, one of the Mediterranean’s busiest ports. As a crucial international trade logistics hub, it handles significant cargo traffic, including containers, bulk commodities, and vehicles. The APV’s total cargo traffic in 2023 was 77,163,936 tons and 7575 ships, which shows its continued improvement in maritime traffic from 2012, even considering the COVID-19 pandemic and other crises in the European area [36].
The case study in this mentioned work-study is the CF evaluation of the Valencia Port Authority in 2016, which comprises the three ports of Valencia, Sagunto, and Gandia.
The study utilized 2016 as the timeframe. It selected this period because emissions data from that year are the most recent information publicly accessible via the APV’s official website and inventories.
In addition, in 2023, the number of vessels traveling to or from the APV was 7575, as indicated by the APV traffic statistics [36]. As a result, the transferred cargo and total ship volume increased by 18% and 19% (76,746,424 t and 302,474,267 mt).
In this regard, the amount of electricity necessary for more cargo operations in 2023 was more significant than in 2016; therefore, the conclusions of this research sensitivity analysis, which reveals the impact of electrical generation factors, can be applied to the APV in 2023 as well.
In 2016, this port authority’s overall shipment volume was 64,361,045 tons, with 7702 registered ships totaling 255,888,000 tons [37].
According to this research work, port emissions are separated into three major scopes. Scope 1 indicates total emissions inside the seaport’s boundaries that are directly controlled by the port authority. Scope 2 includes all emissions caused by the port authority’s electrical consumption and is considered the first indirect emissions. Scope 3 is the emissions created by companies and activities inside port boundaries but are not directly regulated by the port authorities and includes the rest of the emissions not included in Scopes 1 and 2; this scope is considered the second indirect emissions and is controlled and supervised indirectly by the port authority [35].
The three scopes in Table 1 show the Port of Valencia’s total CF in 2016, as computed by the author in the last-mentioned research work [34]. All emission statistics in these calculations came directly from the Port of Valencia’s 2016 Statistical Yearbook [38].
The emissions in each row of Table 1 are calculated using a linear formula that involves multiplying the amount of fossil fuel consumption by the fuel’s emission factor (EF), which is available in official Spanish inventories of including “Guía Metodologíca para el Cálculo de la Huella de Carbono en Puertos” and the “APV 2016 statistical yearbook” [38,39].
An EF is a coefficient that describes the rate at which a given activity releases GHGs into the atmosphere [35].
However, for port commuters’ emissions, the authors of the mentioned research developed a framework and formula known as the “Commuters Calculation Factor” or “Commuters Cal. F.” Due to its amount, which is almost 0.001 of total ports emissions, the calculation factor assumes equal fuel consumption in this research study in the sensitivity analysis.
The emissions calculation is based on several factors, including the number of employees, annual working days, the average distance traveled within the port boundaries, and the average fuel consumption of personal cars, which is determined using the “Inventario Nacional de Emisiones de Gases de Efecto Invernadero” of Spain. These factors are multiplied by the fuels’ EF to calculate the commuters’ total emissions. In this regard, the total emissions calculated in Table 1 can be illustrated as follows:
E m i s s i o n   T o t a l = i = 1 3 E m i s s i o n S c o p e i
EmissionTotal = 164,838,868.2 kg (or 164,838.86 tons) of CO2eq
The Port of Valencia’s total emissions in 2016 were 164,838.8 tons of CO2eq. On the other hand, the total volume of goods traffic within the APV was 64,361,045 tons in 2016 [37]. Finally, in 2016, the CF of the Port of Valencia will be determined using the following formula and shown in Table 2:
C F = T o t a l   E m i s s i o n T o t a l   A m o u n t   o f   T r a n s p o r t e d   C a r g o
On the other hand, the authors of this research have examined the total fuel consumption in various activities within three scopes, which amounted to 425,252,171 kWh.
They have also analyzed the fuel consumption related explicitly to electricity generation (which includes Scope 2 and the initial parts of Scope 3, which accounts for the electricity required by companies and concessionaires within the port boundaries), amounting to 65,005,449 kWh.
This represents approximately 15% of the overall fuel consumption of port activity. Furthermore, the emissions of Scope 2 and part of Scope 3 engaged for electrical generation is 20,144,923 kg, which can be considered 12% of the total port emissions in the mentioned year.
On the other hand, the APV is actively involved in implementing CI, or Onshore Power Supply (OPS), to reduce emissions and improve sustainability. This initiative is part of the broader EALING project, which aims to deploy OPS solutions across EU maritime ports by 2025. The EALING Works APV project focuses specifically on preparing the port’s electrical grid for OPS, which includes constructing a new electrical substation and connecting it to the general grid [40].
These efforts are supported by the European Commission’s Connecting Europe Facility (CEF). In full operation, OPS would increase emissions caused by Scopes 1 and 2 because its electricity includes Scope 2. However, it drastically reduces ships’ emissions inside the port boundary. The next step is to generate this electricity with renewable power as much as possible and practicable.
In this research work, due to the timeframe of 2016, the issue of cold ironing is not separated. It can be included in the electricity consumed by the APV, which is included in Scope 2. On the other hand, ship emissions, while berthed, which are mostly for electricity generation, are included in their total emissions, which are included in Scope 3.
However, due to the significance of this issue and the importance of replacing conventional fuels with renewable energy sources, the authors have focused on four scenarios aimed at reducing CF by implementing renewable energy solutions for power generation.
As a result, and with consideration of materials in Table 1, this analysis will not change other variables in direct emissions (Scope 1 emissions) and indirect emissions other than electricity in Scope 3, and the amount of their emissions will be calculated and inserted as a fixed amount in the following tables.
Sensitivity analysis is valuable in many fields, particularly financial management, engineering, and decision making [19,41]. It assists analysts in determining how alterations to hypotheses or input parameters impact a model or system’s outputs. By meticulously investigating multiple situations, sensitivity analysis helps understand the consistency, robustness, and reliability of a model’s production [21,22].
In this regard, the authors considered several types of sensitivity analysis, including “Local Sensitivity Analysis”, “Global Sensitivity Analysis”, “Variance-Based Methods”, and “Metamodel-Based Techniques”, before concluding that an analysis of sensitivity for a CF determination technique at a seaport would most likely fall into the following sensitivity study categories: a model that combines localized and variance-based global sensitivity analysis methodologies [20].
The local sensitivity method studies the influence of a single input parameter on the model output while keeping the remaining input parameters fixed. A variance-based global sensitivity analysis is often used to rank the importance of input factors based on their contribution to the variance of the output quantity of interest [20].
Finally, the purpose of sensitivity analysis for a CF estimation technique in a seaport by considering power generation issues is to determine how changes in input data affect the output of a model or computation. Sensitivity analysis may be depicted in this context as the percentage alteration of the CF to the percentage change in electricity generation (here, it can be assumed electricity consumption too) [21].
S e n s i t i v i t y = P e r c e n t a g e   c h a n g e   i n   o u t p u t P e r c e n t a g e   c h a n g e   i n   i n p u t = P e r c e n t a g e   Δ   C F P e r c e n t a g e   Δ   E l e c t r i c i t y   C o n s u m p t i o n = Baseline   C . F - New   C . F Baseline   C . F B a s e l i n e   I n p u t N e w   I n p u t B a s e l i n e   I n p u t
In the above formula, the “Δ CF” refers to the change in total CF after applying the scenario, whereas the “Δ Electricity Consumption” represents the change in fuel consumption required for electricity generation after applying the scenario. This refers to the total consumption changes in the given department or section, which this research article considers to only apply to Scope 2 and parts of Scope 3, which are related to electricity consumption.
In this respect, and considering the concerns above, four scenarios have been selected to replace power sources or power generation within port boundaries or, alternatively, minimize electricity usage that may occur by replacing traditional fuel for generation with renewable energy.
On the other hand, it should be noted that the concern in this research work is about reducing electricity generation emissions by replacing fossil fuels with renewables in the process of generation. The issue of trade and commercial interest and the increasing efficiency of the supply network are not the concerns of this research paper. Then, the authors’ assumption is to achieve the mentioned emissions reduction while maintaining maritime and land logistical operations to avoid losing financial interest. Scenarios are provided in the paragraphs that follow.

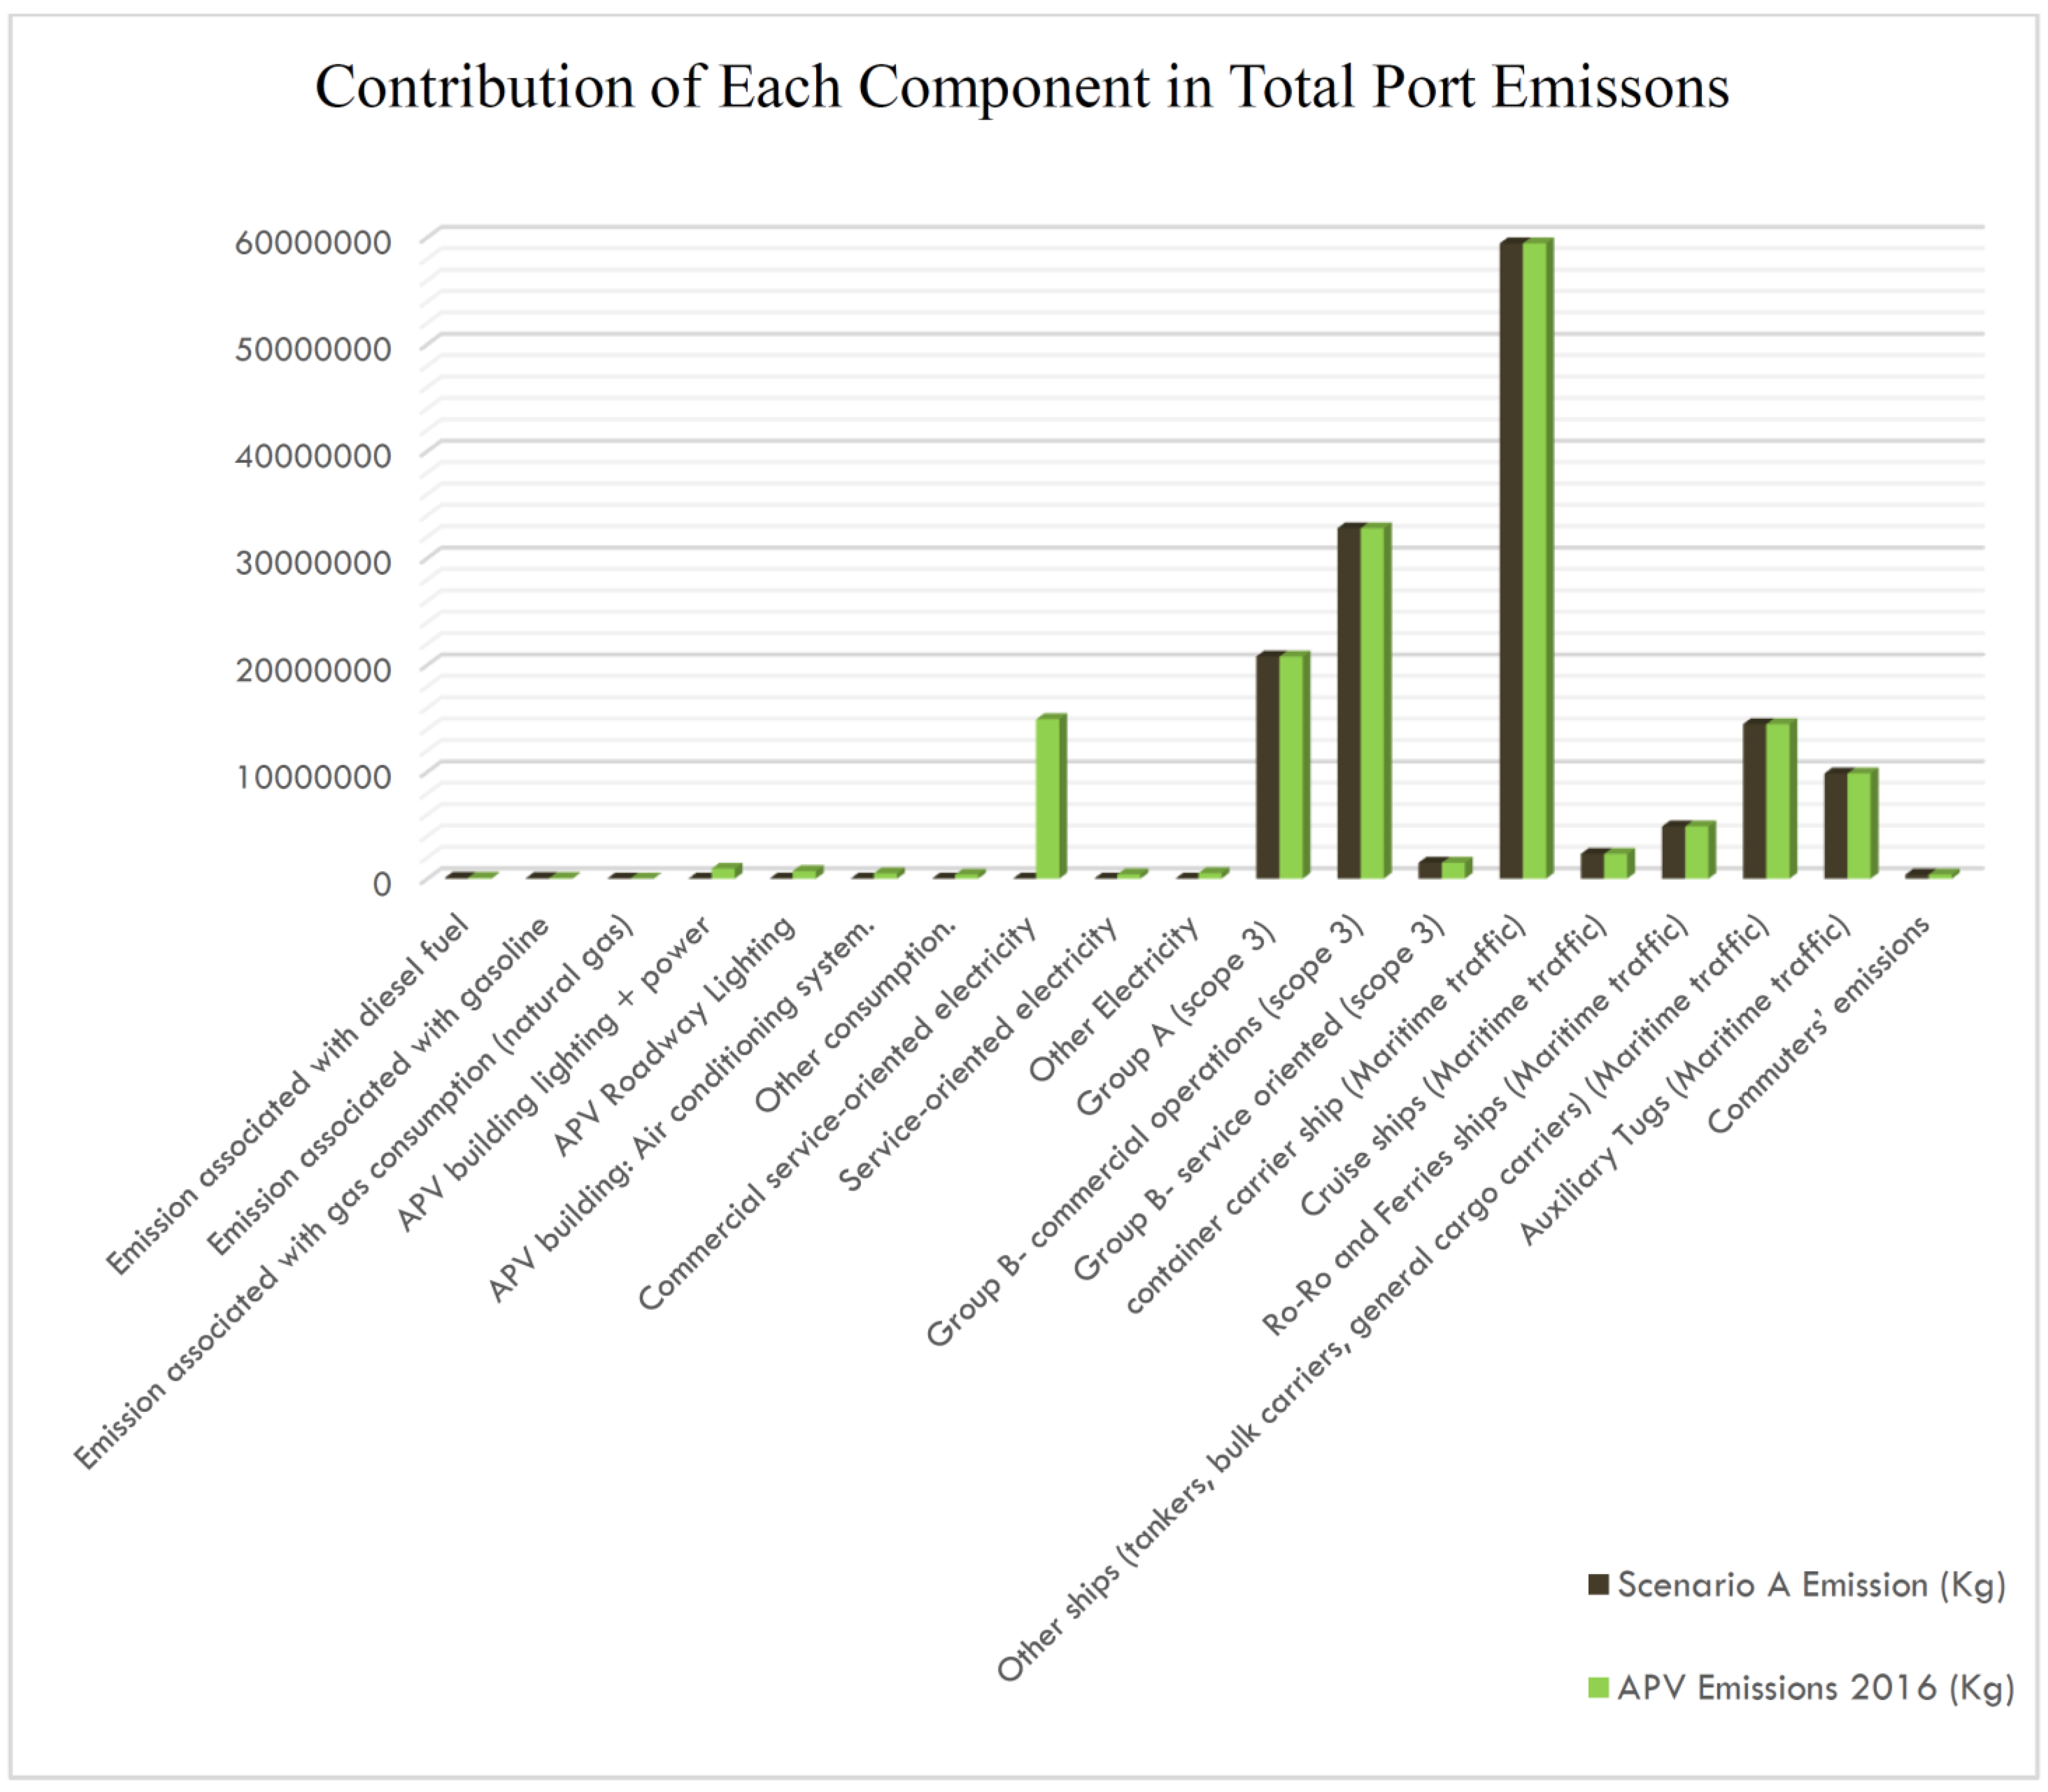
3.1. Scenario “A”: Supplying the Whole Port’s Electrical Energy Needs with Renewables

In this scenario, all power energy needs for ports in Scopes 2 and 3 are generated with renewables. Therefore, the electricity consumption in Table 3, which solely displays the amount of power generated by fossil fuels, is regarded as zero.
On the other hand, in Table 3, the emission sources for Scope 1, which includes emissions associated with diesel, gasoline, and gas consumption (natural gas), are not specified, and only the total emission of 160,599.46 tons is mentioned. Furthermore, other than electricity consumption emissions in Scope 3—including Group A, Group B, container carriers, cruise ships, Ro-Ro and ferries, and other ships—auxiliary tugs and commuters’ emissions are not listed, and only the total emissions, which are equal to 146,849,306.4 tones, are mentioned in the table. This approach for table listing will also be used for all other scenarios’ tables. The following emissions are listed in Table 3:
Table 3. The total emissions of the Port of Valencia in 2016 in Scenario A.
Emission SourceEF (kg CO2eq/kWh)Fuel Cons (kWh)Electricity Cons (kWh)Emissions (Kg)
SCOPE 1160,599.46
SCOPE 2APV building lighting + power, APV roadway lighting, APV building: air conditioning system and other consumption0.2829-00
SCOPE 3 Commercial service-oriented electricity, service-oriented electricity, and other electricity0.2820-0
Other than electricity operation issues (Group A to commuters’ emissions)146,849,306.4
Total Emission147,009,905.86
For Scenario “A”, the criteria for substituting renewable energy for fossil and conventional resources for all ports’ required electricity, following SDG 7, and the progressively reducing emission rate because of environmental factors causing emissions by producing electricity are examined. Figure 2 displays the emissions by component ratio:
Consequently, annual total emissions will decrease by 17,828,962.34 kg, or 10.82%, to reach 147,009,905.86 kg. The new CF can be computed using formula two, which is 2.276.
C F S c e n a r i o   A = T o t a l   E m i s s i o n T o t a l   A m o u n t   o f   T r a n s p o r t e d   C a r g o = 147,009,905.86 64,361,045 = 2.284 k g C O 2 e q t o n
In addition, based on the sensitivity calculation, this scenario’s sensitivity is as follows:
Sensitivity = 2.5645 2.284 2.5645 425,252,171 398 , 938 , 349.5 425,252,171 = 1.528

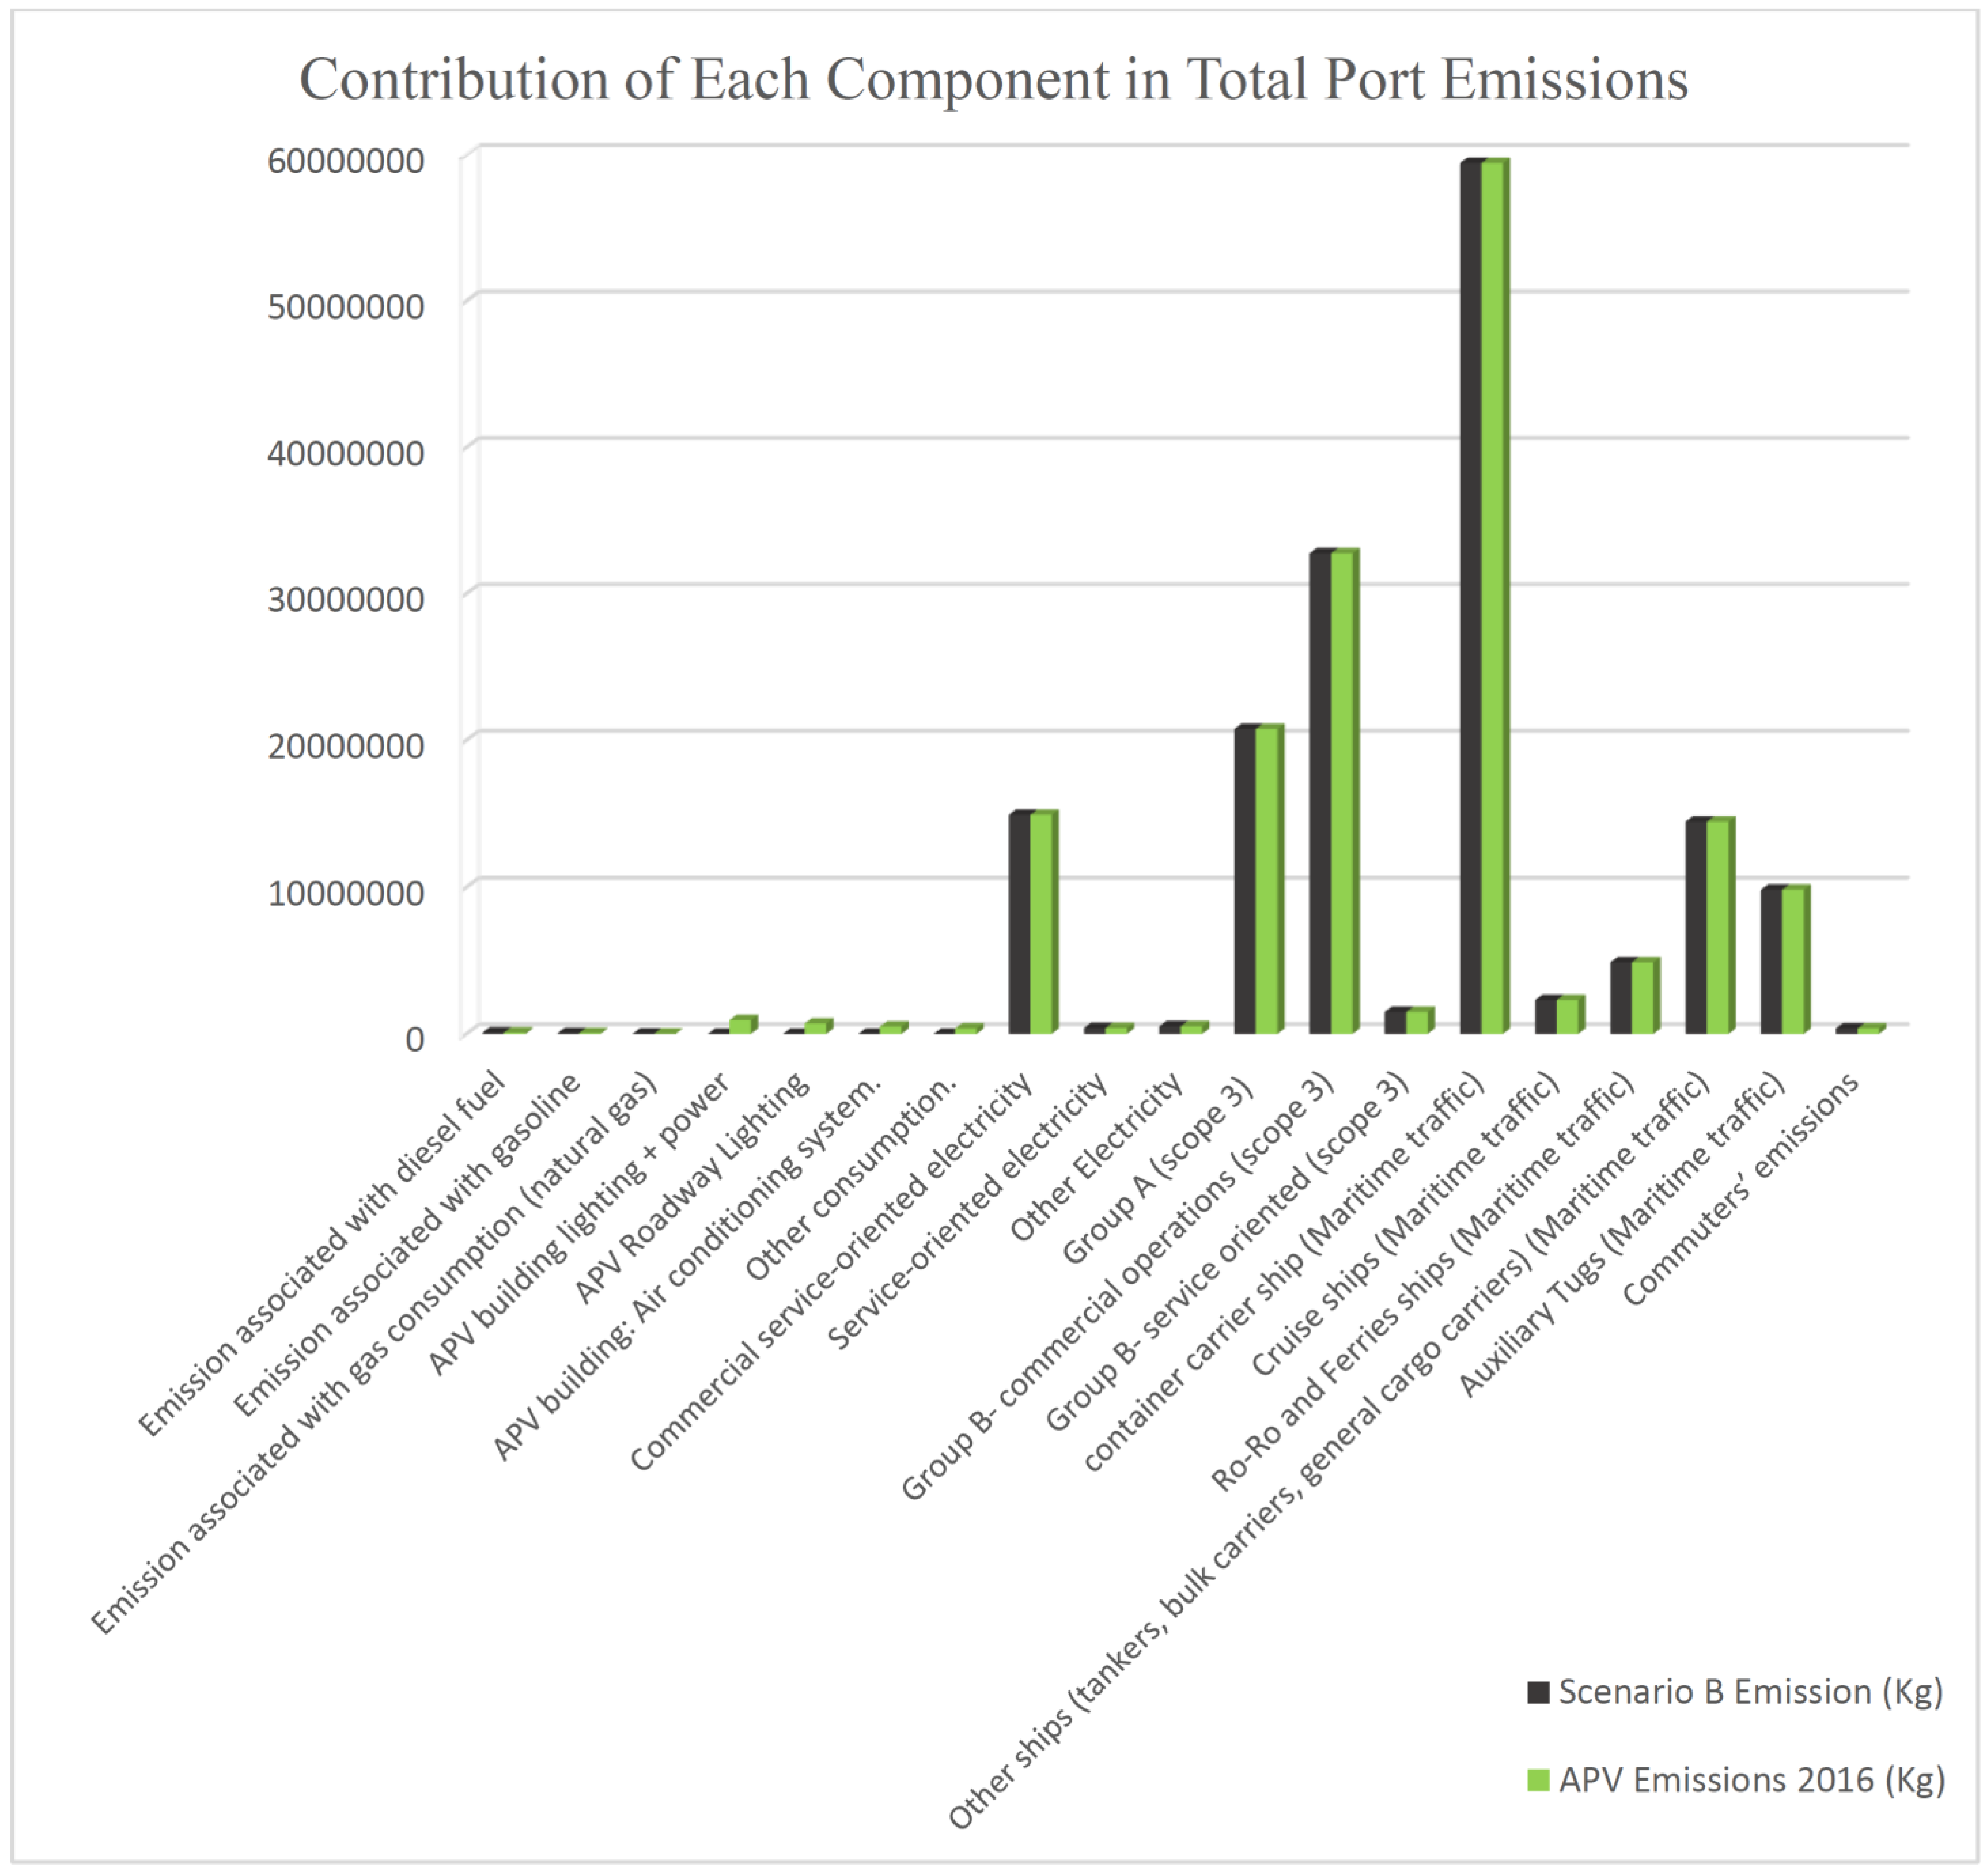
3.2. Scenario “B”: Supplying All Electricity Power in Scope 2 with Renewables

In this case, only the port authority’s electrical demands are provided by renewable energy sources, which falls only in Scope 2. However, since they are produced domestically or acquired from companies not controlled by port authorities, the power requirements for Scope 3 are not prepared by renewable sources. Consequently, Scope 2’s total electrical consumption in the table is zero, as it will be assumed that renewable energy sources will supply power in this scope. Table 4 shows the emissions at the Port of Valencia for the same year:
Scenario “B” studies substituting renewable energy sources for fossil fuels while producing power for Scope 2, which requires electricity from the port authority. Figure 3 illustrates emissions in this manner:
The resultant emissions, 162,838,782.44 kg, show that the decrease in emissions was only 2,000,085.76 kg or 1.21% of the total emissions. Still, it nevertheless shows how significant the power bought by commercial businesses at ports is. The new CF for this situation will be 2.529 in this context.
C F S c e n a r i o   B = T o t a l   E m i s s i o n T o t a l   A m o u n t   o f   T r a n s p o r t e d   C a r g o = 162,838,782.44 64,361,045 = 2.529 k g C O 2 e q t o n
In addition, the following describes how sensitive this situation is:
Sensitivity = 2.5645 2.529 2.5645 425,252,171 416,377,490 425,252,171 = 0.661

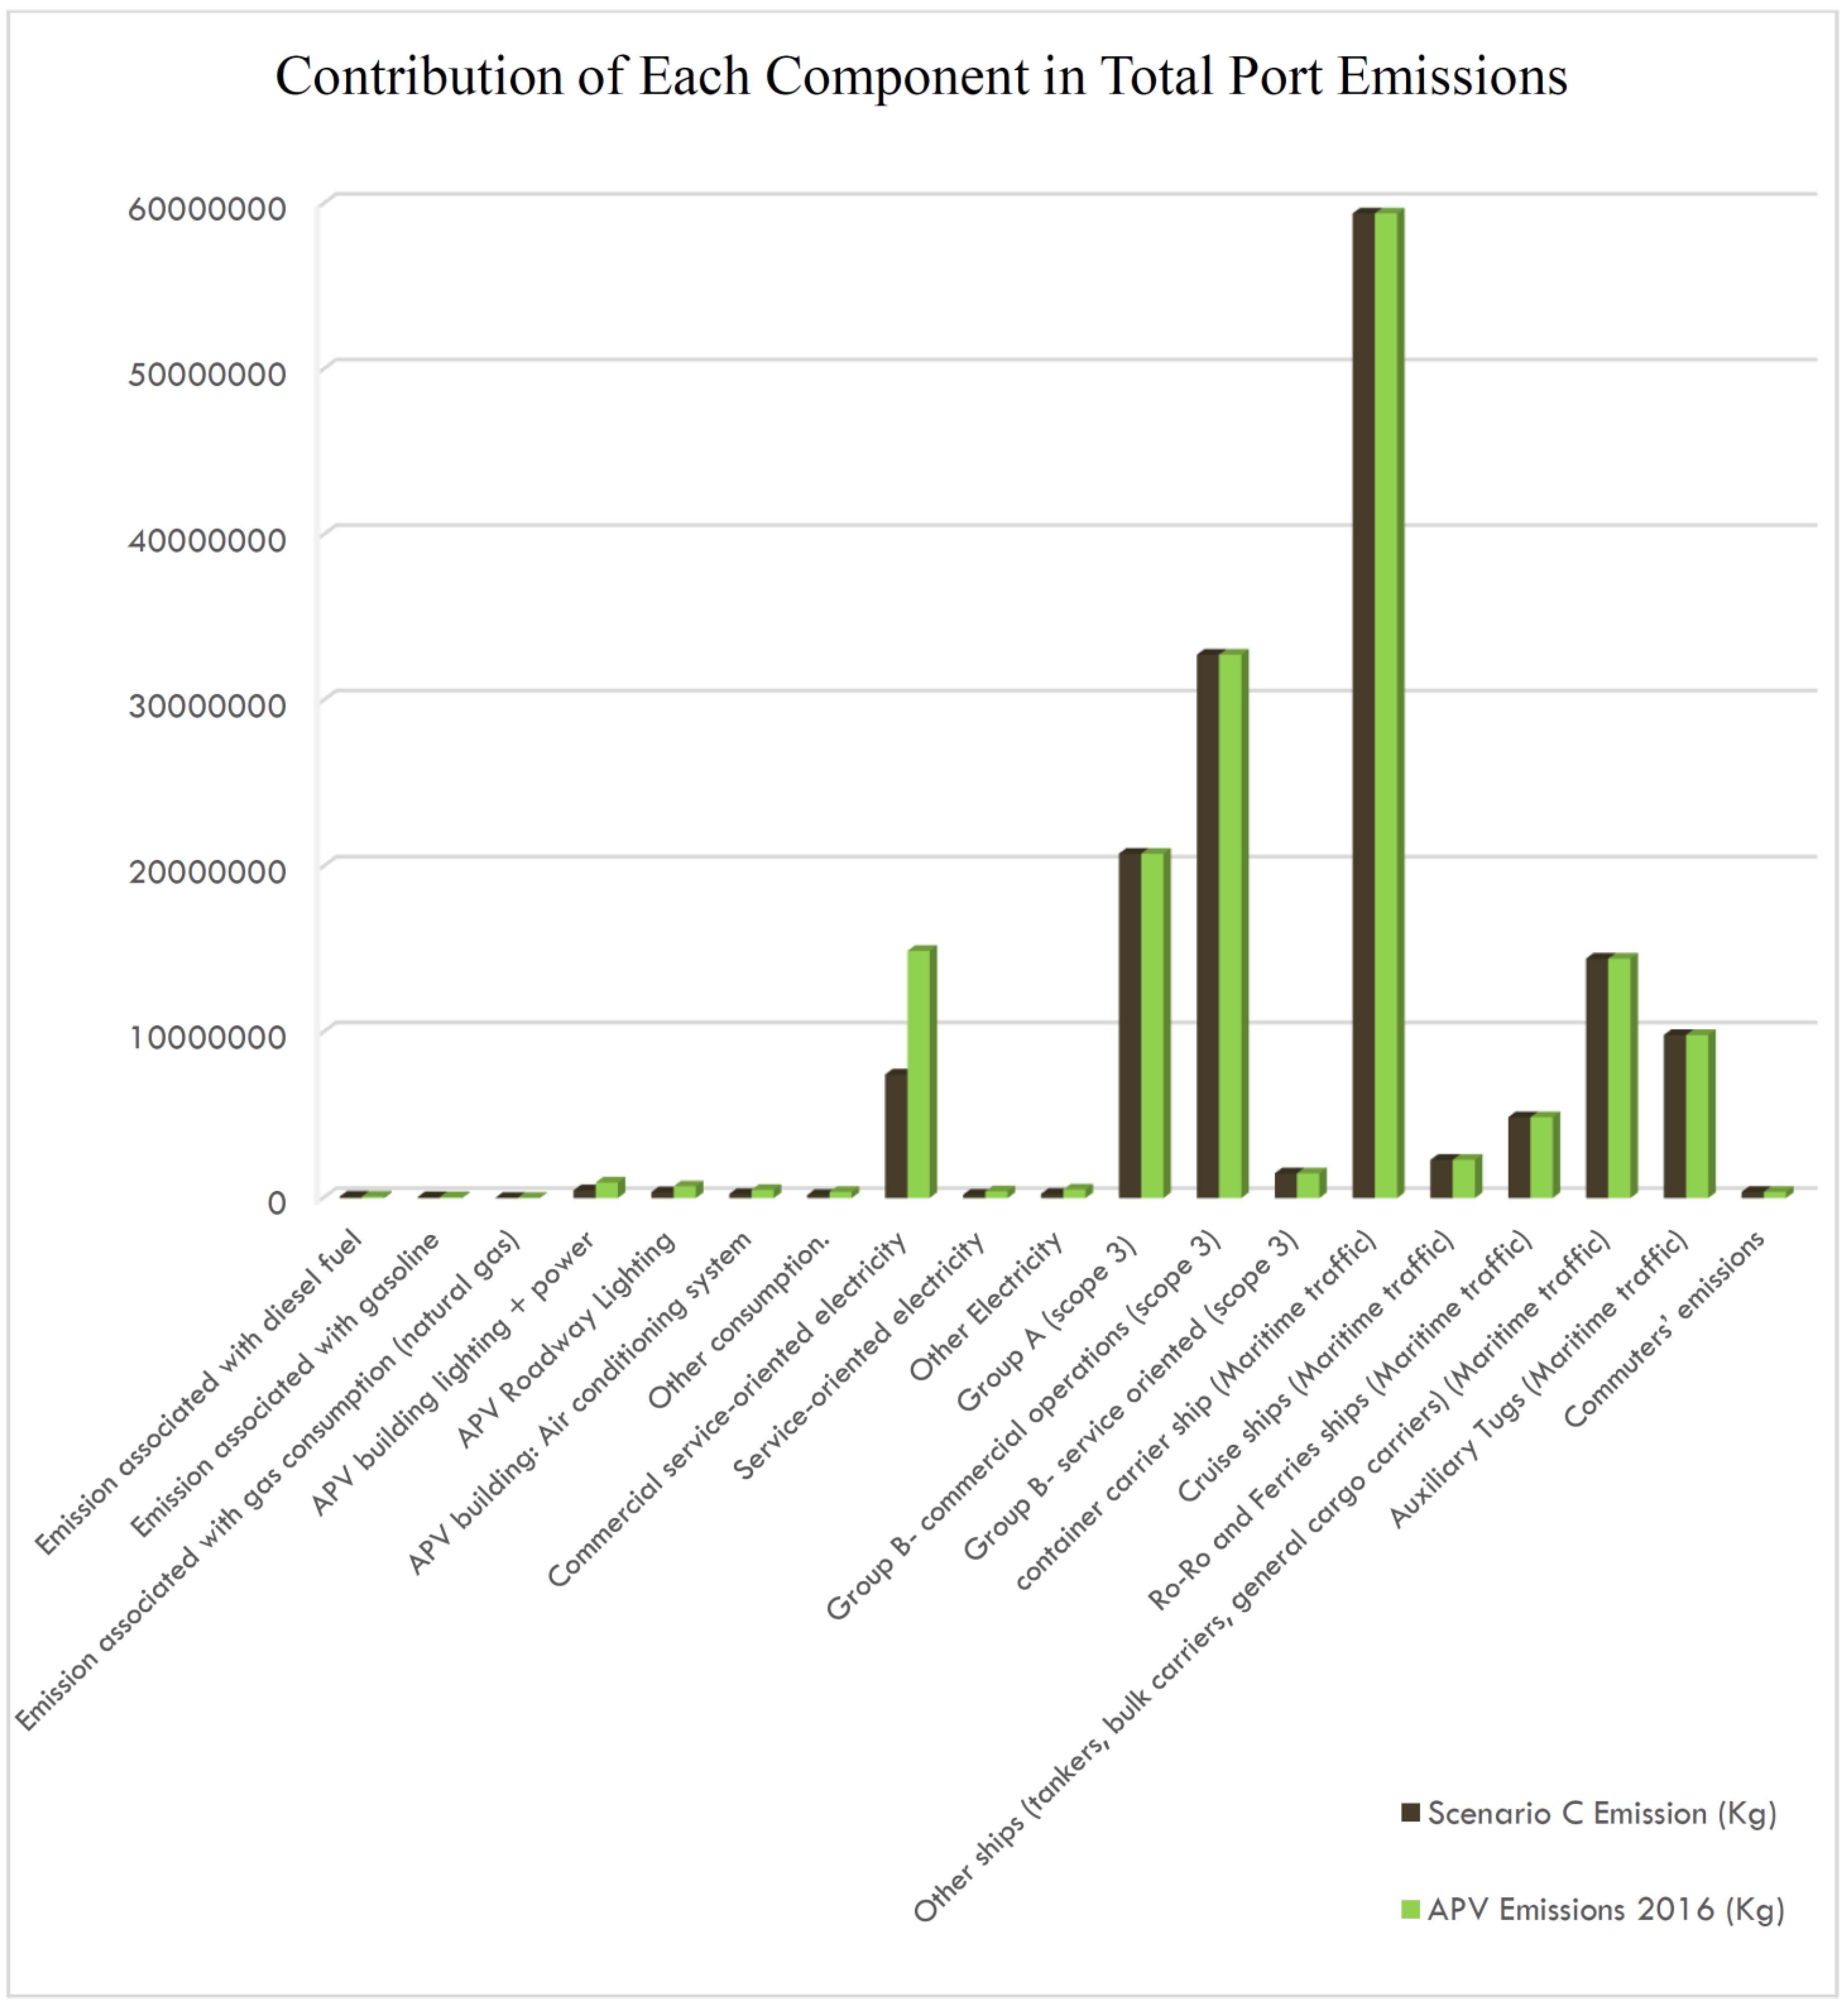
3.3. Scenario “C”: Supplying Half of the Entire Port’s Required Electricity from Renewables

In this scenario, the port would require half its power from fossil fuels and conventional means and the other half from renewable sources. Consequently, half of the electricity consumption, which is, in this research study, deemed equivalent to the amount of generation, is mentioned to calculate the emissions. Table 5 shows the emissions based on this scenario:
As a result, Scenario “C” looks at the possibility of substituting just half of the port’s entire electrical requirements. This scenario may be considered more realistic than scenarios “A” or “B” since the remaining energy can be generated using traditional techniques and fossil fuels. Figure 4 displays the percentage of emissions by each variable:
This might reduce the final emissions by as much as 8,659,160.88 kg annually, more than 5.25% of the total annual emissions. The new CF in this scenario would be 2.426.
C F S c e n a r i o   C = T o t a l   E m i s s i o n T o t a l   A m o u n t   o f   T r a n s p o r t e d   C a r g o = 156,179,707.32 64,361,045 = 2.426 k g C O 2 e q t o n
Furthermore, the scenario’s level of sensitivity is as follows:
Sensitivity = 2.5645 2.426 2.5645 425,252,171 392,749,447 425,252,171 = 0.707

3.4. Scenario “D”: Supplying 30% of the Entire Port’s Required Electricity from Renewables

In this scenario, the port must obtain 70% of its electrical power from fossil fuels and conventional methods, while the other 30% would come from renewable sources. Therefore, 70% of the fuel consumption in Scope 2 and electrical-related activities in Scope 3 of this study, representing electrical generation by traditional fossil fuels, are utilized to compute emissions. Table 6 displays the emissions corresponding to this situation:
As a result, Scenario “D” looks at the possibility of substituting just 30% of the port’s entire electrical requirements with renewables. This scenario may be considered more achievable in the short term than scenarios “A”, “B”, and “C” since the remaining energy can be generated using traditional techniques and fossil fuels. Figure 5 displays the percentage of emissions by each variable.
This might reduce the final emissions by as much as 4,991,241.7 kg annually, more than 3.1% of the total annual emissions. The new CF in this scenario would be 2.484.
C F S c e n a r i o   D = T o t a l   E m i s s i o n T o t a l   A m o u n t   o f   T r a n s p o r t e d   C a r g o = 159 , 847 , 626.5 64,361,045 = 2.484 k g C O 2 e q t o n
Furthermore, the scenario’s level of sensitivity is as follows:
Sensitivity = 2.564 2.484 2.564 425,252,171 405,750,537 425,252,171 = 0.684
In addition, the emission reduction shares for all scenarios were determined by calculating the ratio of the total emissions reduction for each scenario to the total emissions from the port as follows:
E m i s s i o n   R e d u c t i o n   S h a r e = T o t a l   E m i s s i o n s   r e d u c t i o n   f o r   S c e n a r i o T o t a l   P o r t   E m i s s i o n s
The total port emissions amount is 164,838,868.2 kg CO2eq. For Scenario A, the total emission reduction is 17,828,962.34 kg CO2eq, resulting in an emission reduction share of approximately 10.8%. In Scenario B, the total emissions reduction reaches 2,000,085.76 kg CO2eq, leading to an emission reduction share of approximately 1.2%. For Scenario C, with a total emissions reduction of 8,659,160.88 kg CO2eq, the emission share is approximately 5.3%. Lastly, Scenario D presents a total emissions reduction of 4,991,241.7 kg CO2eq, resulting in an emission share reduction of approximately 3%.
The upcoming section will delve into the analysis of the scenarios and explore the potential outcomes of each.

4. Discussion

In this section, the outcomes of sensitivity analysis from the four mentioned scenarios will be discussed in terms of possibilities and emissions reduction share to provide a helpful overview for academia, stakeholders, and port managers.
According to the most recent statistics from the International Energy Agency (IEA), the trend of using renewable energies around the globe is increasing, which implies ports as commercial and transportation hubs must shift toward this usage, too. Figure 6 depicts the trend of renewable energy utilization from 2000 to 2025 [42]:
In this context, the authors decided to provide scenarios based on the use of renewable energy. According to the sensitivity analysis of four scenarios regarding power generation, which is assumed to equal consumption, the new CF and sensitivity and emission reduction share are estimated; the comparison is shown in Figure 7 as follows:
It is time to proceed to the scientific analysis using the revised rankings. Because of the significance of renewable energy consumption, the scenarios include utilizing renewable energy instead of fossil fuels.
The table ranks Scenarios “A” to “D” regarding sensitivity and emissions reduction share. Following an analysis of the rankings, the following conclusions may be drawn:
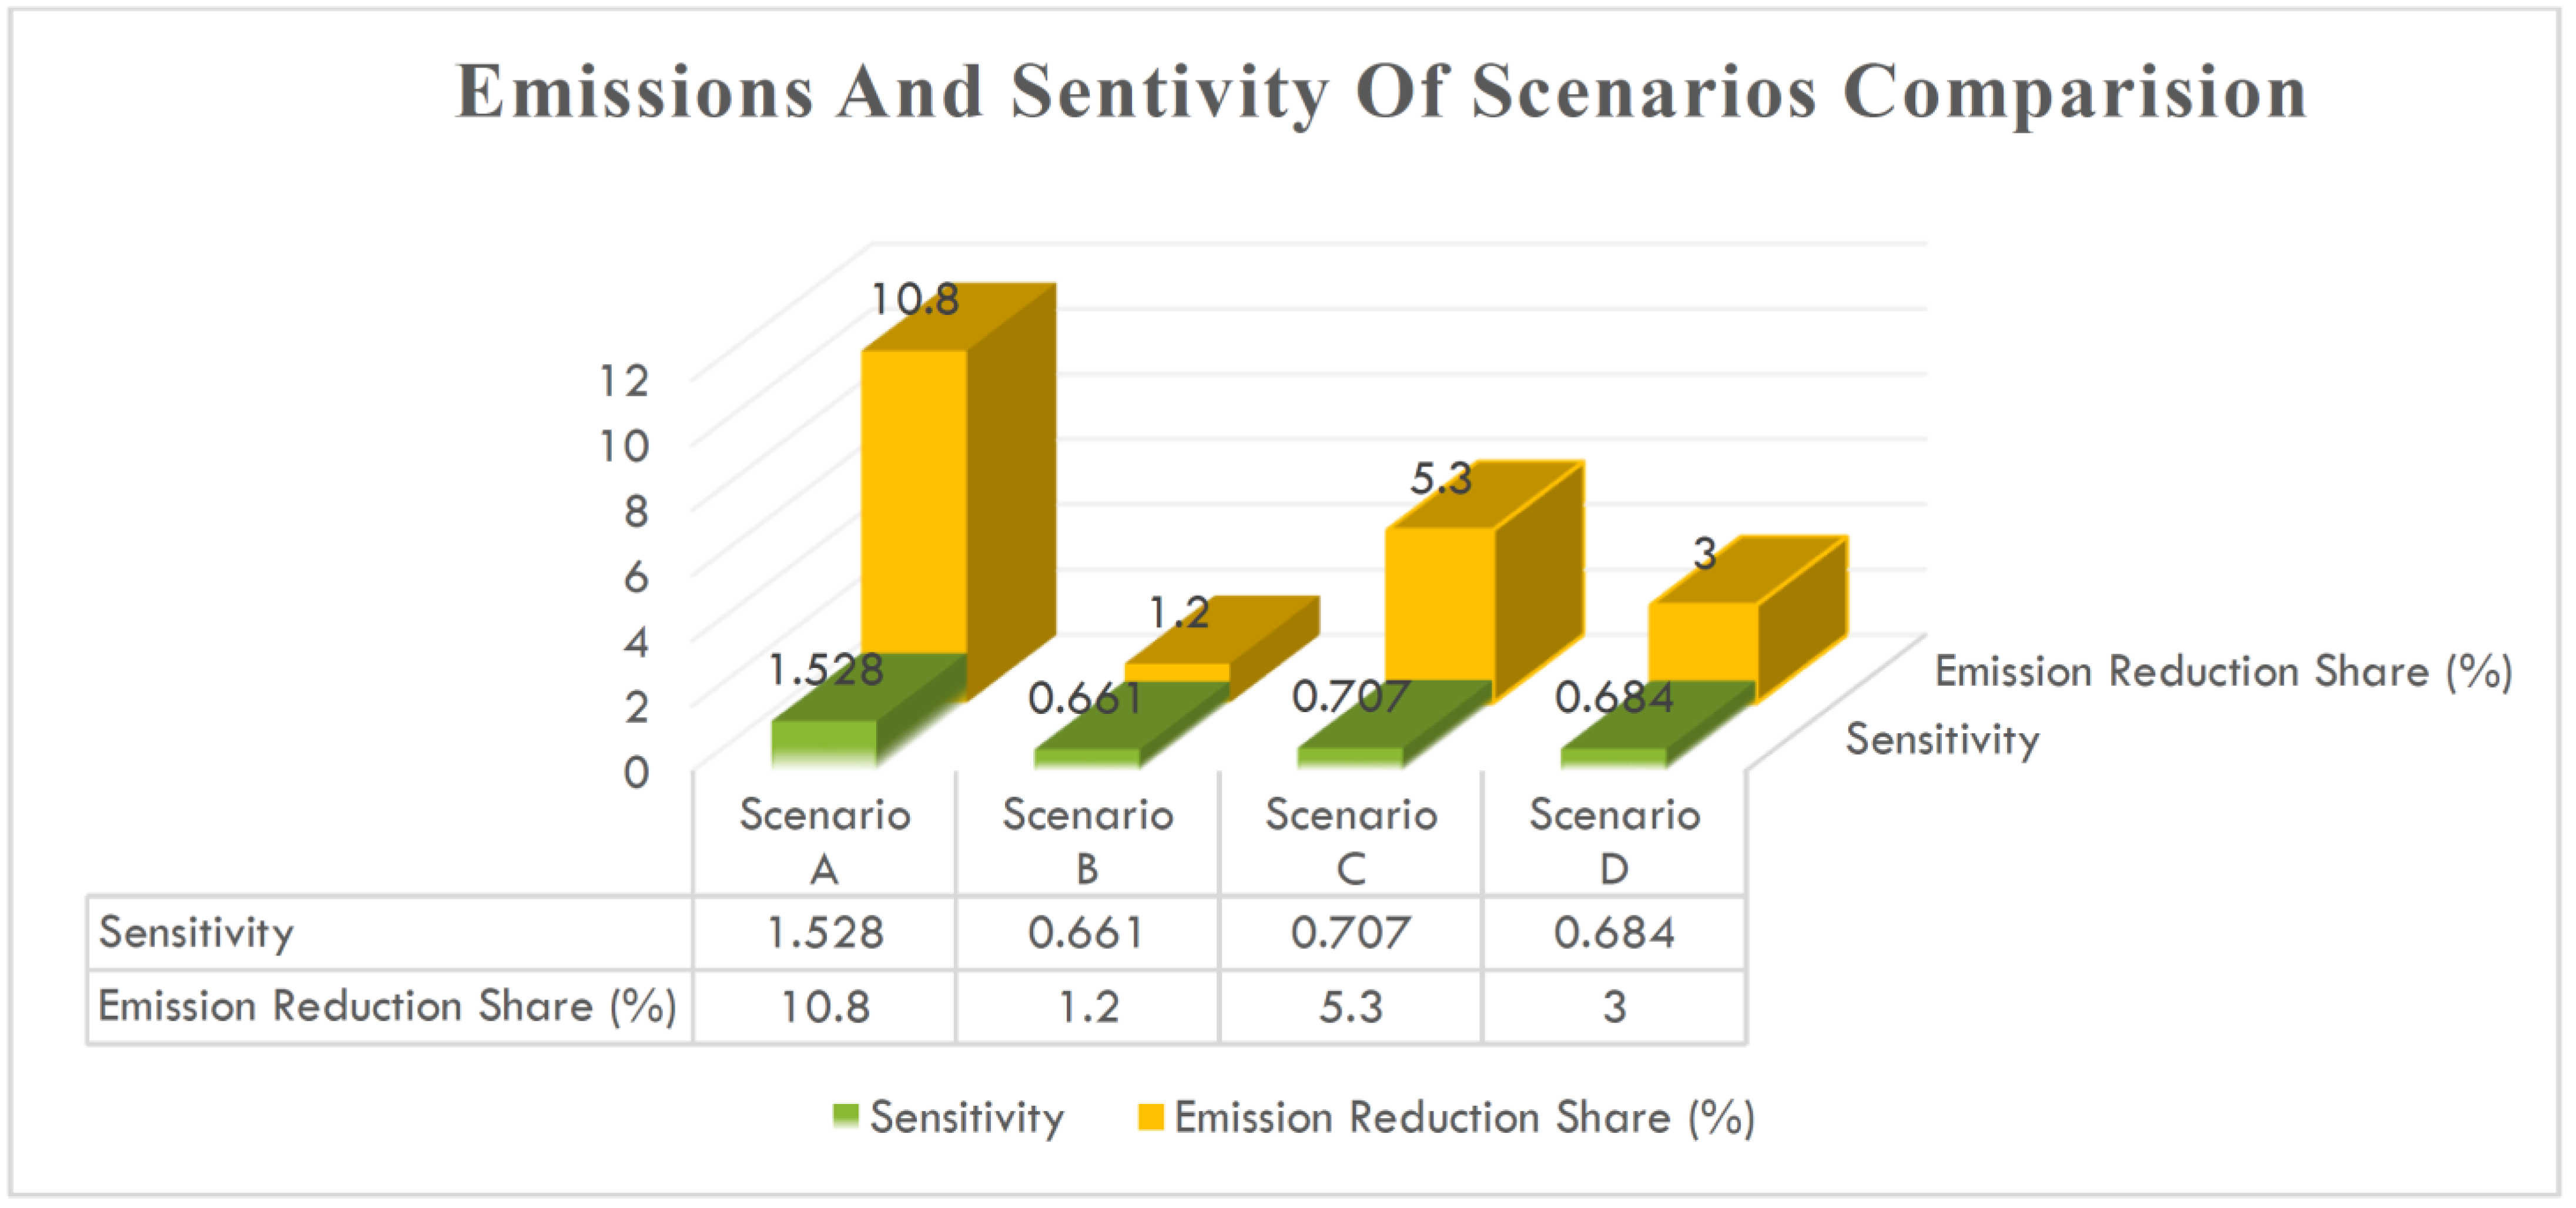
  • Sensitivity: Scenario “A” is most sensitive to outside influences, followed by Scenario “C.” Scenario “D” is moderately sensitive, while Scenario “B” is least affected by changes.
  • Emissions reduction share: Scenario “A” has the highest emissions reduction share. Scenario “C” has a slightly lower share, followed by Scenario “D.” Scenario “B” has the lowest emissions reduction share among the scenarios.
These four possibilities are weighed in terms of importance and likelihood. The first consideration is their contribution to a port’s emissions, and the second is the scenario’s feasibility. The APV’s most important source of emissions in 2016 was maritime traffic [34]. However, the authors of this research specifically concentrated on analyzing the electrical use of the entire port. The emissions from the total required electricity of the port are responsible for approximately 15% of the overall port’s emissions, depending on the scenario. Therefore, it has a significant role and might be a helpful issue to examine based on alternative production scenarios [34].
On the other hand, the mix of emission reduction share and sensitivity, indicated by the author of this research as “β”, is critical and highlights the issue’s importance for investment and focus. Factor “β”, derived by multiplying the emission reduction share and sensitivity in a linear formula, is a crucial metric for evaluating different scenarios in emission reduction initiatives at a seaport.
A higher “β” value signifies a more efficient scenario in decreasing emissions, emphasizing the significance of prioritizing scenarios with higher “β” values for maximum impact. By prioritizing scenarios with higher “β” values, resources and efforts can focus on prioritizing efficient techniques to achieve significant reductions in emissions.
The comparison of “β” values can assist in decision making and scenario planning by offering a mathematical foundation for assessing and choosing the most favorable emission reduction scenarios. It empowers stakeholders and policymakers to make well-informed decisions about investments, regulations, and activities to reduce emissions at the seaport. With the above explanations in mind, the formula is as follows:
β = Emission Reduction Share × Sensitivity Ratio
The following is a list of scenarios from highest to lowest β value, and Figure 8 shows a comparison of these three scenarios while considering the following:
-
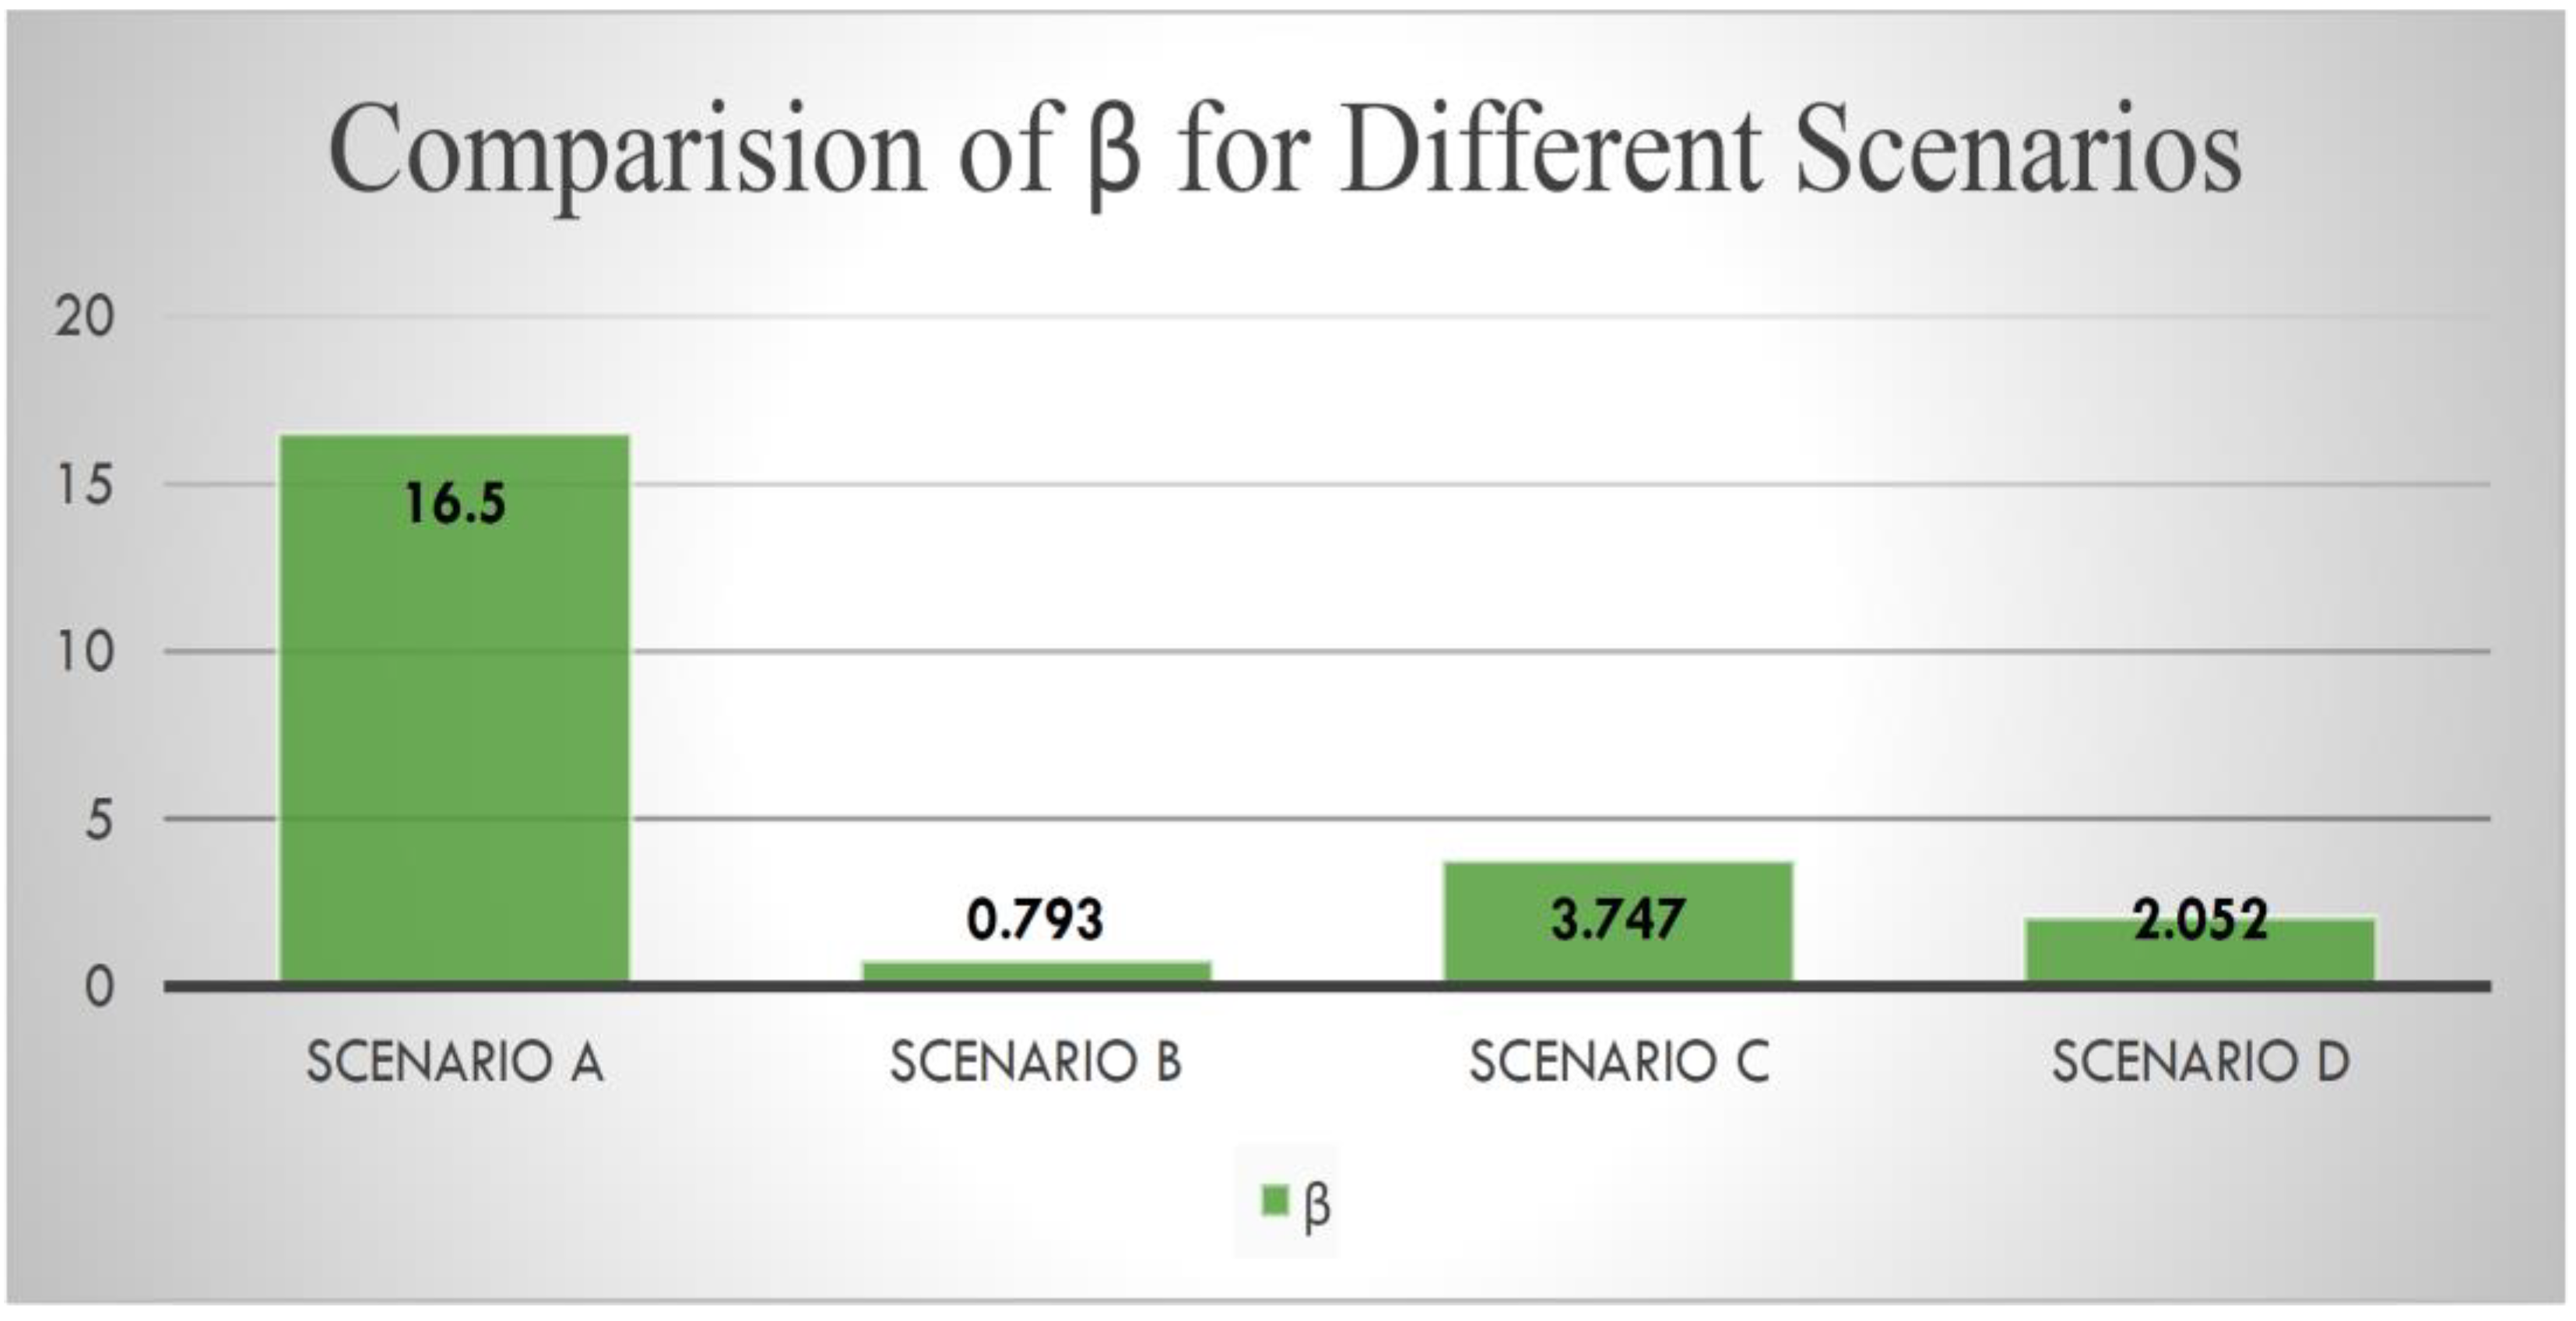
Scenario “A” with the amount of β = 16.5;
-
Scenario “B” with the amount of β = 0.793;
-
Scenario “C” with the amount of β = 3.747;
-
Scenario “D” with the amount of β = 2.052.
The amount of “β” may assist policymakers in determining which areas to invest in and pay attention to. This scientific debate emphasizes considering sensitivity and the emissions reduction ratio when evaluating scenarios. It highlights the need to balance flexibility and environmental sustainability, striving for scenarios sensitive to changes while reducing emissions.
Further, this revised scientific analysis includes the factor of sensitivity and emissions ratio ratings, which need to be reviewed. Scenario “A” demonstrates a significant reduction in emissions with a β value of 16.5, indicating a balanced approach between emission reduction and sensitivity to change.
Scenario ‘B’ is less susceptible, with a β value of 0.793, and contributes less to emission reduction. This means that although Scenario “B” has lower sensitivity, it is also less responsive to changes in power consumption.
Scenario ‘C’ has a β value of 3.747, lower than Scenario “A.” This shows that Scenario “C” is less sensitive but effectively reduces emissions. Having less sensitivity with a lower β, as that of Scenario “A”, signifies the feasibility and effectiveness of emission reduction while being less sensitive to changes.
Scenario ‘D’ has a β value of 2.052, which indicates a moderate balance in reducing emissions and sensitivity. While not as influential as Scenario “A”, it is still a robust option with a balanced approach.
In summary, if the analytical results are to be utilized effectively by managers and policymakers at the APV, the calculations and the magnitude of β suggest that Scenario A offers significant efficiency. However, its implementation is currently impractical and unrealistic in the near term due to its ambitious nature. Conversely, Scenario B yields minimal reduction in the port’s carbon footprint.
Therefore, it is crucial for port managers, policymakers, and stakeholders to focus additional resources and strategic efforts on Scenarios C and D, which present more feasible and impactful options for reducing emissions and enhancing sustainability at the port. Further investigation into these scenarios could provide more detailed insights and actionable strategies for effective carbon management.
Furthermore, given the significance of β, Scenario D is the most feasible in the short term, capable of reducing the CF by 3.1%. Conversely, Scenario C represents a more ambitious, longer-term goal, with β values 50% higher than Scenario D. Scenario C can achieve a 5.25% reduction in the port’s CF, which is a 70% greater reduction compared to Scenario D.
In addition, it is important to note that the information on the APV’s electricity consumption in the specified year, obtained from an approved inventory called the “GHG Emissions Report of the APV—Port of Valencia”, only includes the amount of electricity consumed and the EF. It does not include the name of the provider company or the price of electricity.
Therefore, this research does not consider the price of electricity and the expenditures associated with building infrastructure for renewable power plants, as these aspects are not adequately documented and publicly available.

5. Conclusions

In recent years, there has been a growing concern regarding the environmental impact of industrial operations, particularly in the transportation industry. Ports, as essential centers for international trade and business, may help to solve these challenges. Furthermore, Valencia, Spain’s important port in the Mediterranean area, has been actively seeking methods to decrease its carbon impact while contributing to sustainable development.
This article strives to analyze the sensitivity of different mitigation scenarios in the port’s electricity consumption alternatives to reduce CF effectively. The significant results of this research show that using renewable energy sources in the generation of electricity instead of traditional resources may drastically lower the Port of Valencia’s CF.
This calculation shows that Scenario A’s well-balanced sensitivity and emission sharing are capable of lowering emissions. Scenario B has low sensitivity. Still, it emits less, so the change in power consumption will not affect much. Scenario C’s sensitivities are an overly achievable yet effective way to cut emissions drastically. Scenario D has mild sensitivities, and the emission reduction technique helps balance emission source sensitivities, giving policymakers another alternative. Hence, the primary aim of this study is to demonstrate how port authorities might allocate resources toward renewable energy alternatives to mitigate the CF at ports in a feasible range.
However, it is critical to recognize the “research’s limitations”. This study is mainly dependent on assumptions and estimates derived from available data. As a result, there may be uncertainty about the actual efficiency or accessibility of sources of renewable energy. Following this, the Valencia Port Authority has only made available the latest GHG emission data for 2016 in official inventories and on its official website. Therefore, conducting a sensitivity analysis for more recent years was impossible.
Nevertheless, this research study considers the increasing operations and transshipment of commodities in ports, which leads to higher energy usage. As a result, as mentioned, the findings of this study can be applied to current policymaking.
Furthermore, the analysis focuses only on the sensitivity to electricity generation choices without considering other possible mitigation techniques, such as logistics optimization and cleaner fuel technologies and/or power price. Future research should thoroughly review all accessible possibilities to acquire a more accurate picture of the possible CF reduction measures at the Port of Valencia and could also focus on the power price as an important issue in a circular economy which is aligned with the sustainability issues in transportation.
In conclusion, this research article provides valuable insights into the sensitivity analysis of port CF mitigation scenarios via power consumption alternatives in the Port of Valencia. The results emphasize the significance of renewable energy sources in reducing emissions and promoting sustainable practices in the maritime industry. However, due to certain limitations, further research is warranted to assess the feasibility and effectiveness of various mitigation strategies comprehensively.
Moreover, future studies should explore additional avenues, including optimizing logistics and exploring cleaner fuel technologies, to enhance ports’ overall environmental performance. By adopting these recommendations and conducting further research, the Port of Valencia and other ports worldwide can contribute to a greener and more sustainable future.

Author Contributions

Conceptualization, methodology, formal analysis, investigation, resources, data curation, validation, writing—original draft preparation, project administration, visualization, and writing—review and editing, and supervision S.B.I.-Z. and C.L.G.-R; and funding acquisition, M.D.E. and, J.-S.L.-G. All authors have read and agreed to the published version of the manuscript.

Funding

This research received no external funding.

Institutional Review Board Statement

The study did not require ethical approval.

Informed Consent Statement

Not applicable.

Data Availability Statement

The qualitative data regarding the scoping review presented in this study are available on request from the corresponding authors (S.B.I.-Z.).

Acknowledgments

The authors want to thank Hamid Reza Soltani from the University of Science and Technology for his help and guidance during the mathematical analysis of this research paper.

Conflicts of Interest

The authors declare no conflicts of interest. The funders had no role in the study’s design, data collection, analysis, interpretation, manuscript writing, or decision to publish the results.

References

  1. Psaraftis, H.N.; Kontovas, C.A. Decarbonization of Maritime Transport: Is There Light at the End of the Tunnel? Sustainability 2020, 13, 237. [Google Scholar] [CrossRef]
  2. Makram, M.; Bassam, A.M.; Tawfik, A.A.; Yehia, W. Assessment of Onshore Renewable Energy Power Supply for Ship’s Emissions Reduction in Port Said West Port. J. Mar. Sci. Appl. 2024, 23, 506–524. [Google Scholar] [CrossRef]
  3. Lei, J.; Zhang, H.; Pan, J.; Zhuo, Y.; Chen, A.; Chen, W.; Yang, Z.; Feng, K.; Li, L.; Wang, B.; et al. Techno-Economic Assessment of a Full-Chain Hydrogen Production by Offshore Wind Power. Energies 2024, 17, 2447. [Google Scholar] [CrossRef]
  4. Zadeh, S.B.I.; Perez, M.D.E.; López-Gutiérrez, J.-S.; Fernández-Sánchez, G. Optimizing Smart Energy Infrastructure in Smart Ports: A Systematic Scoping Review of Carbon Footprint Reduction. J. Mar. Sci. Eng. 2023, 11, 1921. [Google Scholar] [CrossRef]
  5. Fang, S.; Wang, Y.; Gou, B.; Xu, Y. Toward Future Green Maritime Transportation: An Overview of Seaport Microgrids and All-Electric Ships. IEEE Trans. Veh. Technol. 2020, 69, 207–219. [Google Scholar] [CrossRef]
  6. Notteboom, T.; Haralambides, H. Seaports as green hydrogen hubs: Advances, opportunities and challenges in Europe. Marit. Econ. Logist. 2023, 25, 1–27. [Google Scholar] [CrossRef]
  7. Neumann, J.; da Rocha, R.C.; Debiagi, P.; Scholtissek, A.; Dammel, F.; Stephan, P.; Hasse, C. Techno-economic assessment of long-distance supply chains of energy carriers: Comparing hydrogen and iron for carbon-free electricity generation. Appl. Energy Combust. Sci. 2023, 14, 100128. [Google Scholar] [CrossRef]
  8. Zadeh, S.B.I.; Gutiérrez, J.S.L.; Esteban, M.D.; Fernández-Sánchez, G.; Garay-Rondero, C.L. Scope of the Literature on Efforts to Reduce the Carbon Footprint of Seaports. Sustainability 2023, 15, 8558. [Google Scholar] [CrossRef]
  9. UN Trade and Development Department. Maritime Transport 2015 Review, UNCTAD. 2015. Available online: https://unctad.org/webflyer/review-maritime-transport-2015 (accessed on 20 June 2024).
  10. Tang, D.; Jiang, T.; Xu, C.; Chen, Z.; Yuan, Y.; Zhao, W.; Guerrero, J.M. Assessing the Potential for Energy Efficiency Improvement through Cold Ironing: A Monte Carlo Analysis with Real Port Data. J. Mar. Sci. Eng. 2023, 11, 1780. [Google Scholar] [CrossRef]
  11. Kumar, N.; Panda, S.K. A Multipurpose and Power Quality Improved Electric Vessels Charging Station for the Seaports. IEEE Trans. Ind. Inform. 2023, 19, 3254–3261. [Google Scholar] [CrossRef]
  12. Tao, Y.; Qiu, J.; Lai, S.; Sun, X.; Zhao, J. Flexible Voyage Scheduling and Coordinated Energy Management Strategy of All-Electric Ships and Seaport Microgrid. IEEE Trans. Intell. Transp. Syst. 2023, 24, 3211–3222. [Google Scholar] [CrossRef]
  13. Misra, A.; Venkataramani, G.; Gowrishankar, S.; Ayyasam, E.; Ramalingam, V. Renewable Energy Based Smart Microgrids—A Pathway to Green Port Development. Strateg. Plan. Energy Environ. 2017, 37, 17–32. [Google Scholar] [CrossRef]
  14. Zadeh, S.B.I.; Soltani, H.R.; Ghoneim, N.I. Revamping Seaport Operations with Renewable Energy: A Sustainable Approach to Reducing Carbon Footprint. GMSARN Int. J. 2024, 18, 315–324. Available online: http://gmsarnjournal.com/home/wp-content/uploads/2023/12/vol18no3-4.pdf (accessed on 27 December 2023).
  15. Lazaroiu, C.; Roscia, M. The Sustainable port through sea wave energy converter. In Proceedings of the 2017 6th International Conference on Renewable Energy Research and Applications, ICRERA 2017, San Diego, CA, USA, 5–8 November 2017; pp. 462–467. [Google Scholar] [CrossRef]
  16. Tang, D.; Chai, Z.; Zhang, Q.; Yuan, Y.; Xu, W.; Gu, Y. Practice and Perspectives towards Sustainable Carbon Neutral Green Ports. In Proceedings of the 7th IEEE International Conference on Transportation Information and Safety, ICTIS 2023, Xi’an, China, 4–6 August 2023; pp. 13–18. [Google Scholar] [CrossRef]
  17. Heikkilä, M.; Saarni, J.; Saurama, A. Innovation in Smart Ports: Future Directions of Digitalization in Container Ports. J. Mar. Sci. Eng. 2022, 10, 1925. [Google Scholar] [CrossRef]
  18. Zadeh, S.B.I. Environmental Benefits of Reducing Greenhouse Gas Emissions from Smart Ports via Implementation of Smart Energy Infrastructure. GMSARN Int. J. 2024, 18, 431–439. Available online: https://gmsarnjournal.com/home/wpcontent/uploads/2024/03/vol18no4-3.pdf (accessed on 20 March 2024).
  19. Saltelli, A.; Tarantola, S.; Campolongo, F.; Ratto, M. Sensitivity Analysis in Practice: A Guide to Assessing Scientific Models; John Wiley & Sons, Ltd : Hoboken, NJ, USA, 2002. [Google Scholar]
  20. Le Gratiet, L.; Marelli, S.; Sudret, B. Metamodel-Based Sensitivity Analysis: Polynomial Chaos Expansions and Gaussian Processes. In Handbook of Uncertainty Quantification; Springer International Publishing: Berlin/Heidelberg, Germany, 2015; pp. 1–37. [Google Scholar] [CrossRef]
  21. Borgonovo, E. Sensitivity Analysis; Springer Nature: Dordrecht, The Netherlands, 2017; Volume 251. [Google Scholar] [CrossRef]
  22. Razavi, S.; Gupta, H.V. What do we mean by sensitivity analysis? the need for comprehensive characterization of ‘global’ sensitivity in Earth and Environmental systems models. Water Resour. Res. 2015, 51, 3070–3092. [Google Scholar] [CrossRef]
  23. Gabbar, H.A.; Adham, M.I.; Abdussami, M.R. Analysis of nuclear-renewable hybrid energy system for marine ships. Energy Rep. 2021, 7, 2398–2417. [Google Scholar] [CrossRef]
  24. Wang, Z.; Zhao, F.; Dong, B.; Wang, D.; Ji, Y.; Cai, W.; Han, F. Life cycle framework construction and quantitative assessment for the hydrogen fuelled ships: A case study. Ocean Eng. 2023, 281, 114740. [Google Scholar] [CrossRef]
  25. Berna-Escriche, C.; Rivera-Durán, Y.; Córdova-Chávez, Y.; Muñoz-Cobo, J.L. Maximizing the use of hydrogen as energy vector to cover the final energy demand for stand-alone systems, application and sensitivity analysis for the Canary Archipelago by 2040. Prog. Nucl. Energy 2023, 163, 104791. [Google Scholar] [CrossRef]
  26. Thaler, B.; Kanchiralla, F.M.; Posch, S.; Pirker, G.; Wimmer, A.; Brynolf, S.; Wermuth, N. Optimal design and operation of maritime energy systems based on renewable methanol and closed carbon cycles. Energy Convers. Manag. 2022, 269, 116064. [Google Scholar] [CrossRef]
  27. Song, Q.; Tinoco, R.R.; Yang, H.; Yang, Q.; Jiang, H.; Chen, Y.; Chen, H. A comparative study on energy efficiency of the maritime supply chains for liquefied hydrogen, ammonia, methanol and natural gas. Carbon Capture Sci. Technol. 2022, 4, 100056. [Google Scholar] [CrossRef]
  28. Daraz, A. Optimized cascaded controller for frequency stabilization of marine microgrid system. Appl. Energy 2023, 350, 121774. [Google Scholar] [CrossRef]
  29. Zhang, H.; Tomasgard, A.; Knudsen, B.R.; Svendsen, H.G.; Bakker, S.J.; Grossmann, I.E. Modelling and analysis of offshore energy hubs. Energy 2022, 261, 125219. [Google Scholar] [CrossRef]
  30. Vakili, S.; Schönborn, A.; Ölçer, A.I. Techno-economic feasibility of photovoltaic, wind and hybrid electrification systems for stand-alone and grid-connected shipyard electrification in Italy. J. Clean. Prod. 2022, 366, 132945. [Google Scholar] [CrossRef]
  31. Gabbar, H.A.; Adham, M.I.; Abdussami, M.R. Optimal Planning of Integrated Nuclear-Renewable Energy System for Marine Ships Using Artificial Intelligence Algorithm. Energies 2021, 14, 3188. [Google Scholar] [CrossRef]
  32. Błażejewski, T.; Walker, S.R.; Muazu, R.I.; Rothman, R.H. Reimagining the milk supply chain: Reusable vessels for bulk delivery. Sustain. Prod. Consum. 2021, 27, 1030–1046. [Google Scholar] [CrossRef]
  33. Chen, L.J.; Zhang, L.; Kung, C.C. An economic analysis on Taiwanese wind power and regional development. Energy Explor. Exploit. 2020, 38, 1228–1247. [Google Scholar] [CrossRef]
  34. Zhai, Q.; Li, T.; Liu, Y. Life cycle assessment of a wave energy converter: Uncertainties and sensitivities. J. Clean. Prod. 2021, 298, 126719. [Google Scholar] [CrossRef]
  35. Zadeh, S.B.I.; Gutiérrez, J.S.L.; Esteban, M.D.; Fernández-Sánchez, G.; Garay-Rondero, C.L. A Framework for Accurate Carbon Footprint Calculation in Seaports: Methodology Proposal. J. Mar. Sci. Eng. 2023, 11, 1007. [Google Scholar] [CrossRef]
  36. Authoridad Puertaria de Valencia. Statistical Report Port Authority of Valencia 2023. 2023. Available online: https://www.valenciaport.com/wp-content/uploads/2312-Statistical-Report-December-2023_Definitivo.pdf (accessed on 21 July 2024).
  37. Port Authority of Valencia. GHG Emissions Report of the APV, 2016. 2018. Available online: https://www.valenciaport.com/wp-content/uploads/Memoria-Verificaci%C3%B3n-GEI-2016.pdf (accessed on 27 April 2023).
  38. Valencia Port Authority. Statistical Yearbook 2016. 2018. Available online: https://www.valenciaport.com/wp-content/uploads/Anuario_estadistico_2016_APV_ENG.pdf (accessed on 20 June 2024).
  39. de E. Puertos del Estado, G. Methodological Guide for the Calculation of the Carbon Footprint in Ports. 2020. Available online: https://www.puertos.es/es-es/medioambiente/Documents/Guia%20Huella%20de%20Carbono%20-%20Puertos%20del%20Estado%20-%20Web.pdf (accessed on 23 July 2024).
  40. Fundación Valencia Port. EALING–European Flagship Action for Cold Ironing in Ports. Available online: https://www.fundacion.valenciaport.com/en/project/ealing-european-flagship-action-for-cold-ironing-in-ports/ (accessed on 21 July 2024).
  41. Valencia Port Authority. Statistical Report APV. 2021. Available online: https://www.valenciaport.com/wp-content/uploads/APV-Environmental-Declaration-2021.pdf (accessed on 20 June 2024).
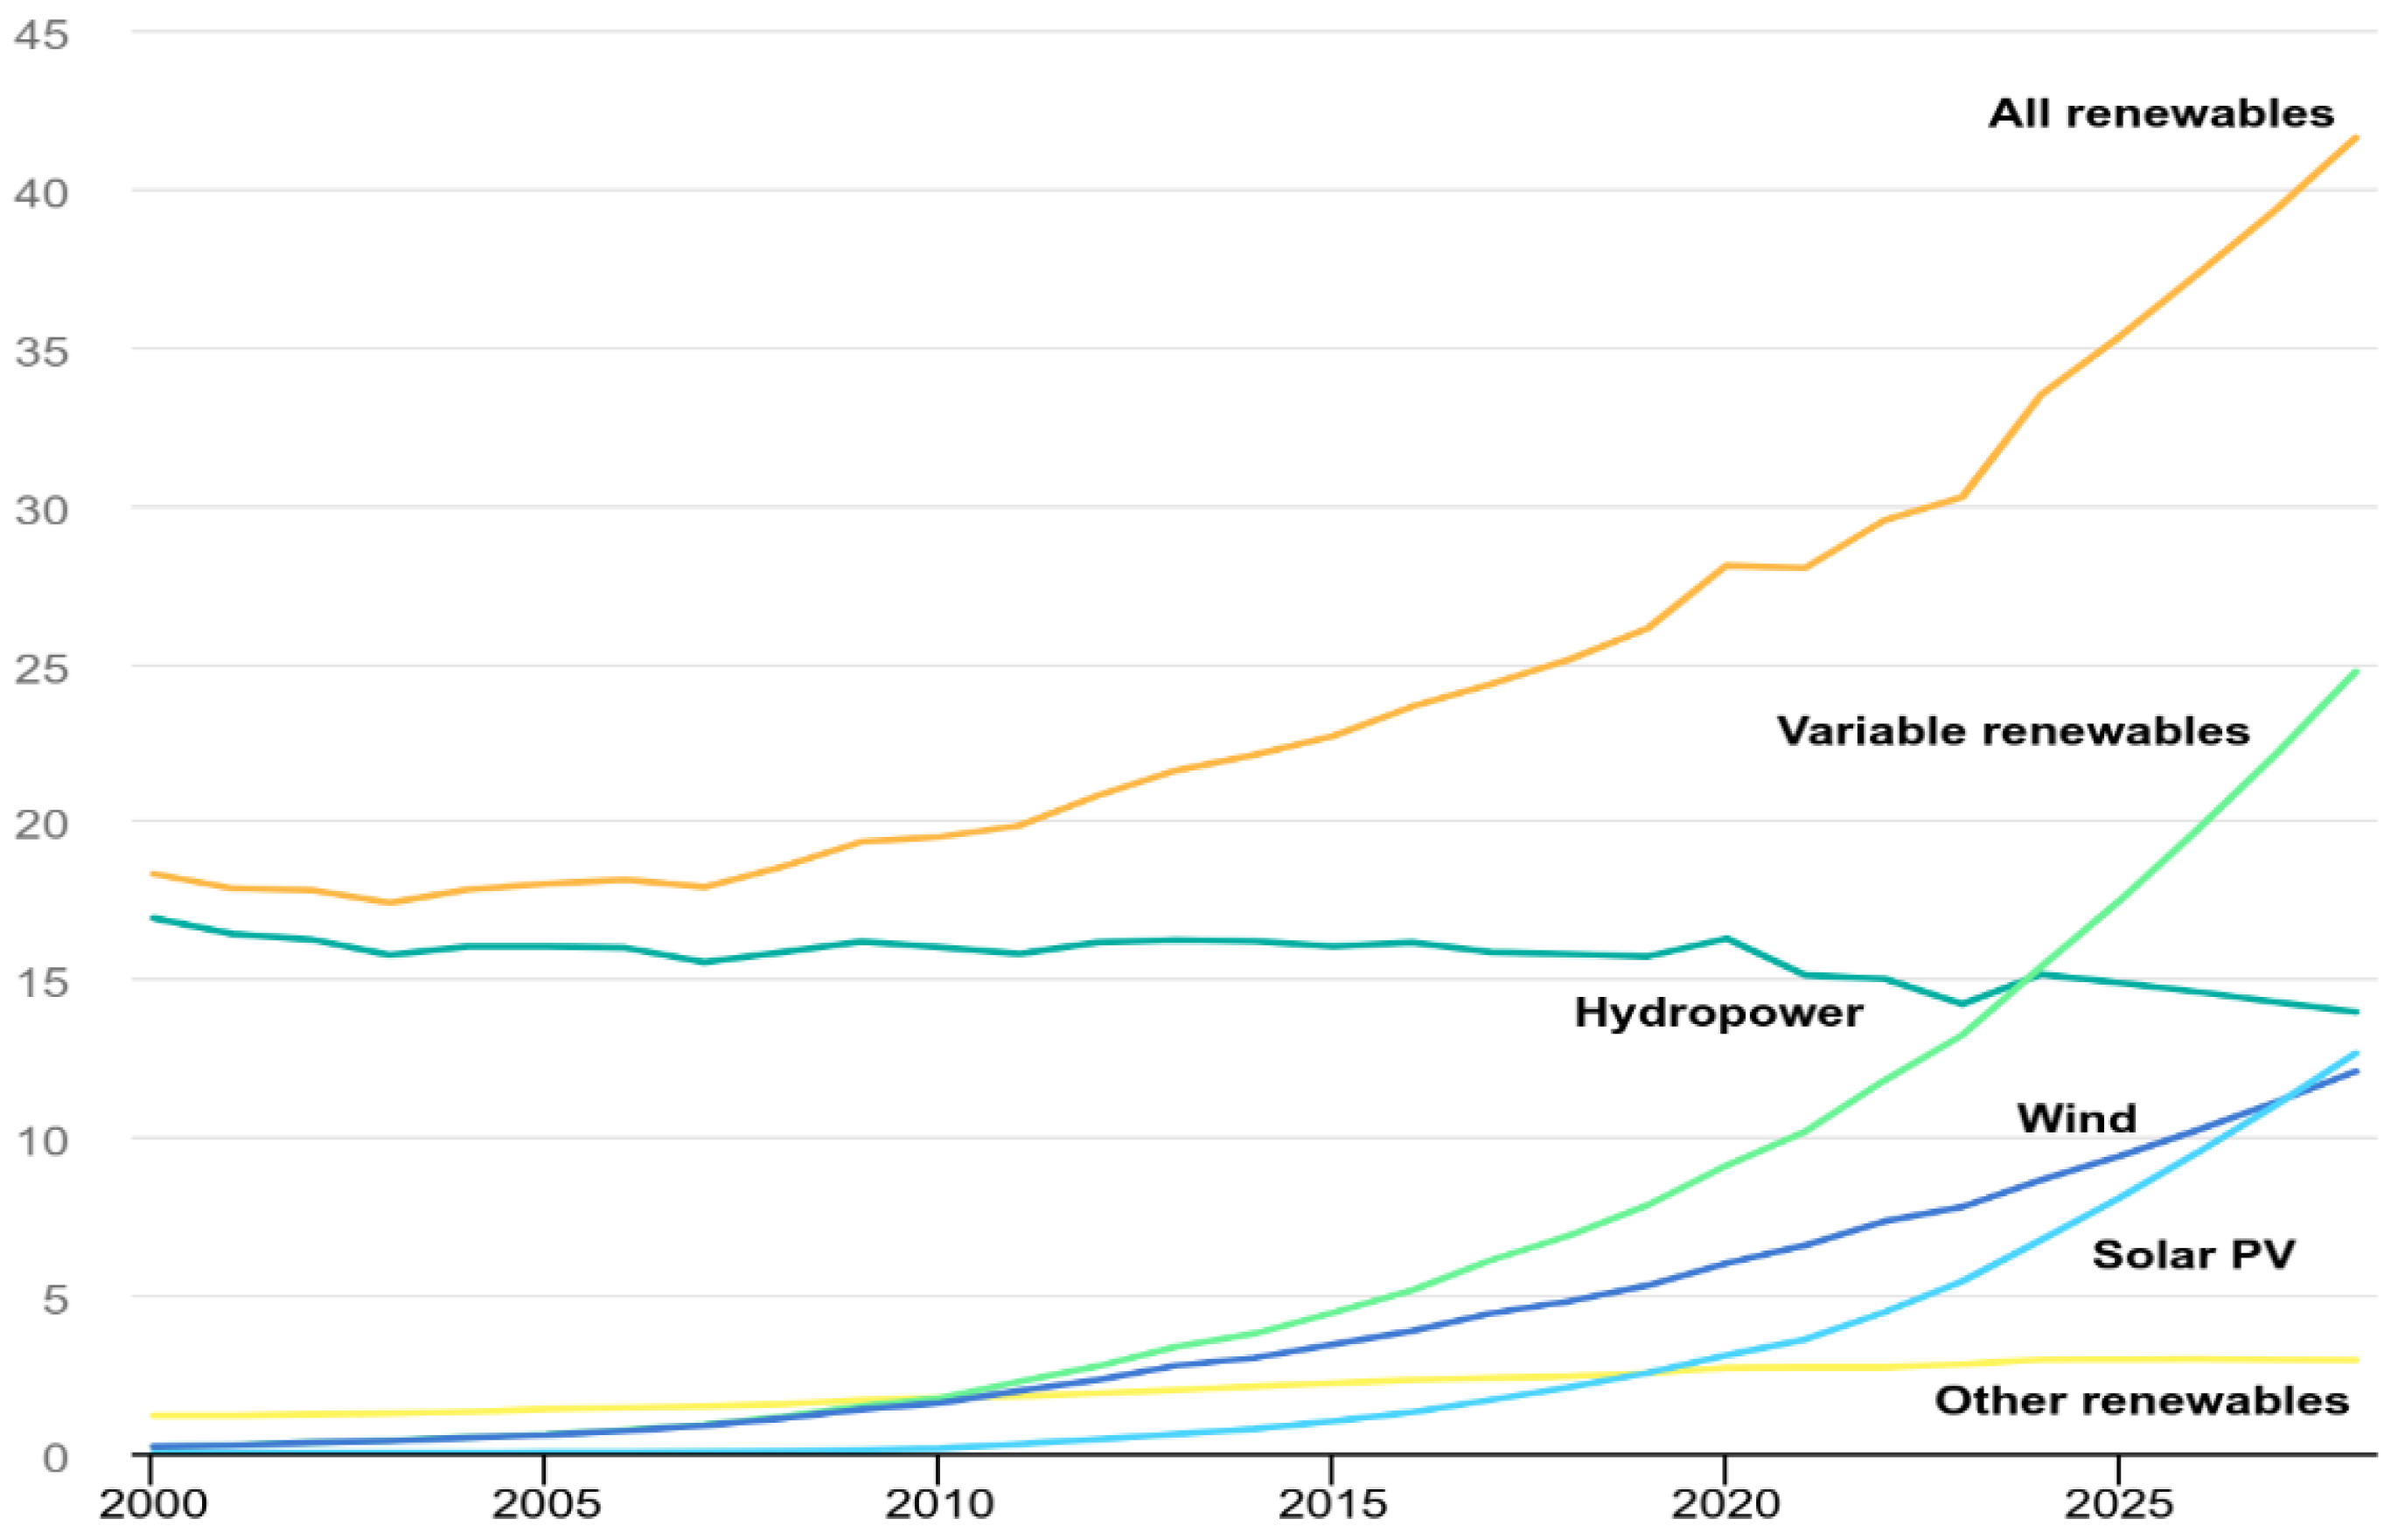
  42. International Energy Agency. Renewables 2023 (Analysis and Forecast to 2028). Available online: www.iea.org (accessed on 20 June 2024).
Figure 1. Resources refinement procedures.
Jmse 12 01290 g001
Figure 2. Emissions from Scenario A and actual emissions comparison.
Jmse 12 01290 g002
Figure 3. Emissions from Scenario B and actual emissions comparison.
Jmse 12 01290 g003
Figure 4. Emissions from Scenario C and actual emissions comparison.
Jmse 12 01290 g004
Figure 5. Emissions from Scenario D and actual emissions comparison.
Jmse 12 01290 g005
Figure 6. Share and forecast of renewable energies for global power generation between 2000 and 2024, based on the IEA report [42].
Jmse 12 01290 g006
Figure 7. Comparison of sensitivity analysis and emission reduction share of different scenarios.
Jmse 12 01290 g007
Figure 8. Comparison of β in different scenarios.
Jmse 12 01290 g008
Table 1. Total emissions of the Port Authority of Valencia in 2016 [35].
Emission SourceEFFuel Cons (kWh)Electricity Cons (kWh)Commuters Calculation FactorEmissions (kg)
SCOPE 1Emissions associated with diesel fuel2.703 kg CO2eq/L336,702.42--89,677.43
Emissions associated with gasoline2.196 kg CO2eq/L239,985.75--55,787.18
Emissions associated with gas consumption (natural gas)0.202 kg CO2eq/kWh74,925--15,134.85
SCOPE 2APV building lighting
+ power
0.2829 kg CO2eq/kWh-3,309,969.53-936,390.4
APV roadway lighting-2,493,451.62-705,397.5
APV building: air conditioning system-1,750,656.82-495,260.8
Other consumption-1,320,876-373,675.8
SCOPE 3Commercial service-oriented electricity0.282 kg CO2eq/kWh52,895,613--14,916,563
Service-oriented electricity1,420,833--400,674.9
Other electricity1,814,322--511,638.8
Group A (Scope 3)0.27 kg CO2eq/kWh76,978,166--20,784,105
Group B—commercial operations (Scope 3)121,392,432--32,775,957
Group B—service-oriented (Scope 3)5,523,956.8--1,491,468
Container carrier ship (maritime traffic)0.673 kg CO2eq/kWh88,305,890--59,429,864
Cruise ships (maritime traffic)0.75 kg CO2eq/kWh3,077,724.6--2,308,293
Ro-Ro and ferries (maritime traffic)0.721 kg CO2eq/kWh6,769,347.9--4,880,700
Other ships (tankers, bulk carriers, general cargo carriers) (maritime traffic)0.686 kg CO2eq/kWh21,071,067--14,454,752
Auxiliary tugs (maritime traffic)0.271 kg CO2eq/kWh36,305,933--9,838,908
Commuters’ emissions2.196 kg CO2eq/L--170,592.24374,620.6
Total Emissions164,838,868.2
Table 2. CF of the Port Authority of Valencia in 2016 [35].
DescriptionValue
Total GHG emissions in tons of CO2eq164,838.86
Total volume of goods traffic of the Port of Valencia in tons64,361,045
Carbon footprint (Kg of CO2eq/tons of transported goods)2.56
Carbon Footprint (t of CO2eq/tons of transported goods)0.00256
Table 4. The total emissions of the Port of Valencia in 2016 in Scenario B.
Emission SourceEF (kg CO2eq/kWh)Fuel Cons (kWh)Electricity Cons (kWh)Emissions (Kg)
SCOPE 1160,599.46
SCOPE 2APV building lighting + power, APV roadway lighting, APV building: air conditioning system and other consumption0.2829-00
SCOPE 3Commercial service-oriented electricity0.28252,895,613-14,916,562.87
Service-oriented electricity1,420,833400,674.906
Other electricity1,814,322511,638.804
Other than electricity operation issues (Group A to commuters’ emissions)146,849,306.4
Total Emissions162,838,782.44
Table 5. The total emissions of the Port of Valencia in 2016 in Scenario C.
Emission SourceEF (kg CO2eq/kWh)Fuel Cons (kWh)Electricity Cons (kWh)Emissions (Kg)
SCOPE 1160,599.46
SCOPE 2APV building lighting + power0.2829-1,654,984.65468,195.15
APV roadway lighting1,246,725.81352,698.73
APV building: air conditioning system875,328.41247,630.4
Other consumption660,438186,837.9
SCOPE 3Commercial service-oriented electricity0.28226,447,806.5-7,458,281.43
Service-oriented electricity710,416.5200,337.45
Other electricity907,161255,819.40
Other than electricity operation issues (Group A to commuters’ emissions)146,849,306.4
Total Emissions156,179,707.32
Table 6. The total emissions of the Port of Valencia in 2016 in Scenario D.
Emission SourceEF (kg CO2eq/kWh)Fuel Cons (kWh)Electricity Cons (kWh)Emissions (Kg)
SCOPE 1160,599.46
SCOPE 2APV building lighting + power0.2829-2,316,978.67655,473.26
APV roadway lighting1,745,416.13493,778.22
APV building: air conditioning system1,225,459.77346,682.56
Other consumption924,613.2261,573.07
SCOPE 3Commercial service-oriented electricity0.28237,026,929-10,441,593.97
Service-oriented electricity994,583280,472.4
Other electricity1,270,025.4358,147.16
Other than electricity operation issues (Group A to commuters’ emissions)146,849,306.4
Total Emissions159,847,626.5
Disclaimer/Publisher’s Note: The statements, opinions and data contained in all publications are solely those of the individual author(s) and contributor(s) and not of MDPI and/or the editor(s). MDPI and/or the editor(s) disclaim responsibility for any injury to people or property resulting from any ideas, methods, instructions or products referred to in the content.

