
A Data-Driven DNN Model to Predict the Ultimate Strength of a Ship’s Bottom Structure


Abstract
:1. Introduction
1.1. Research Background
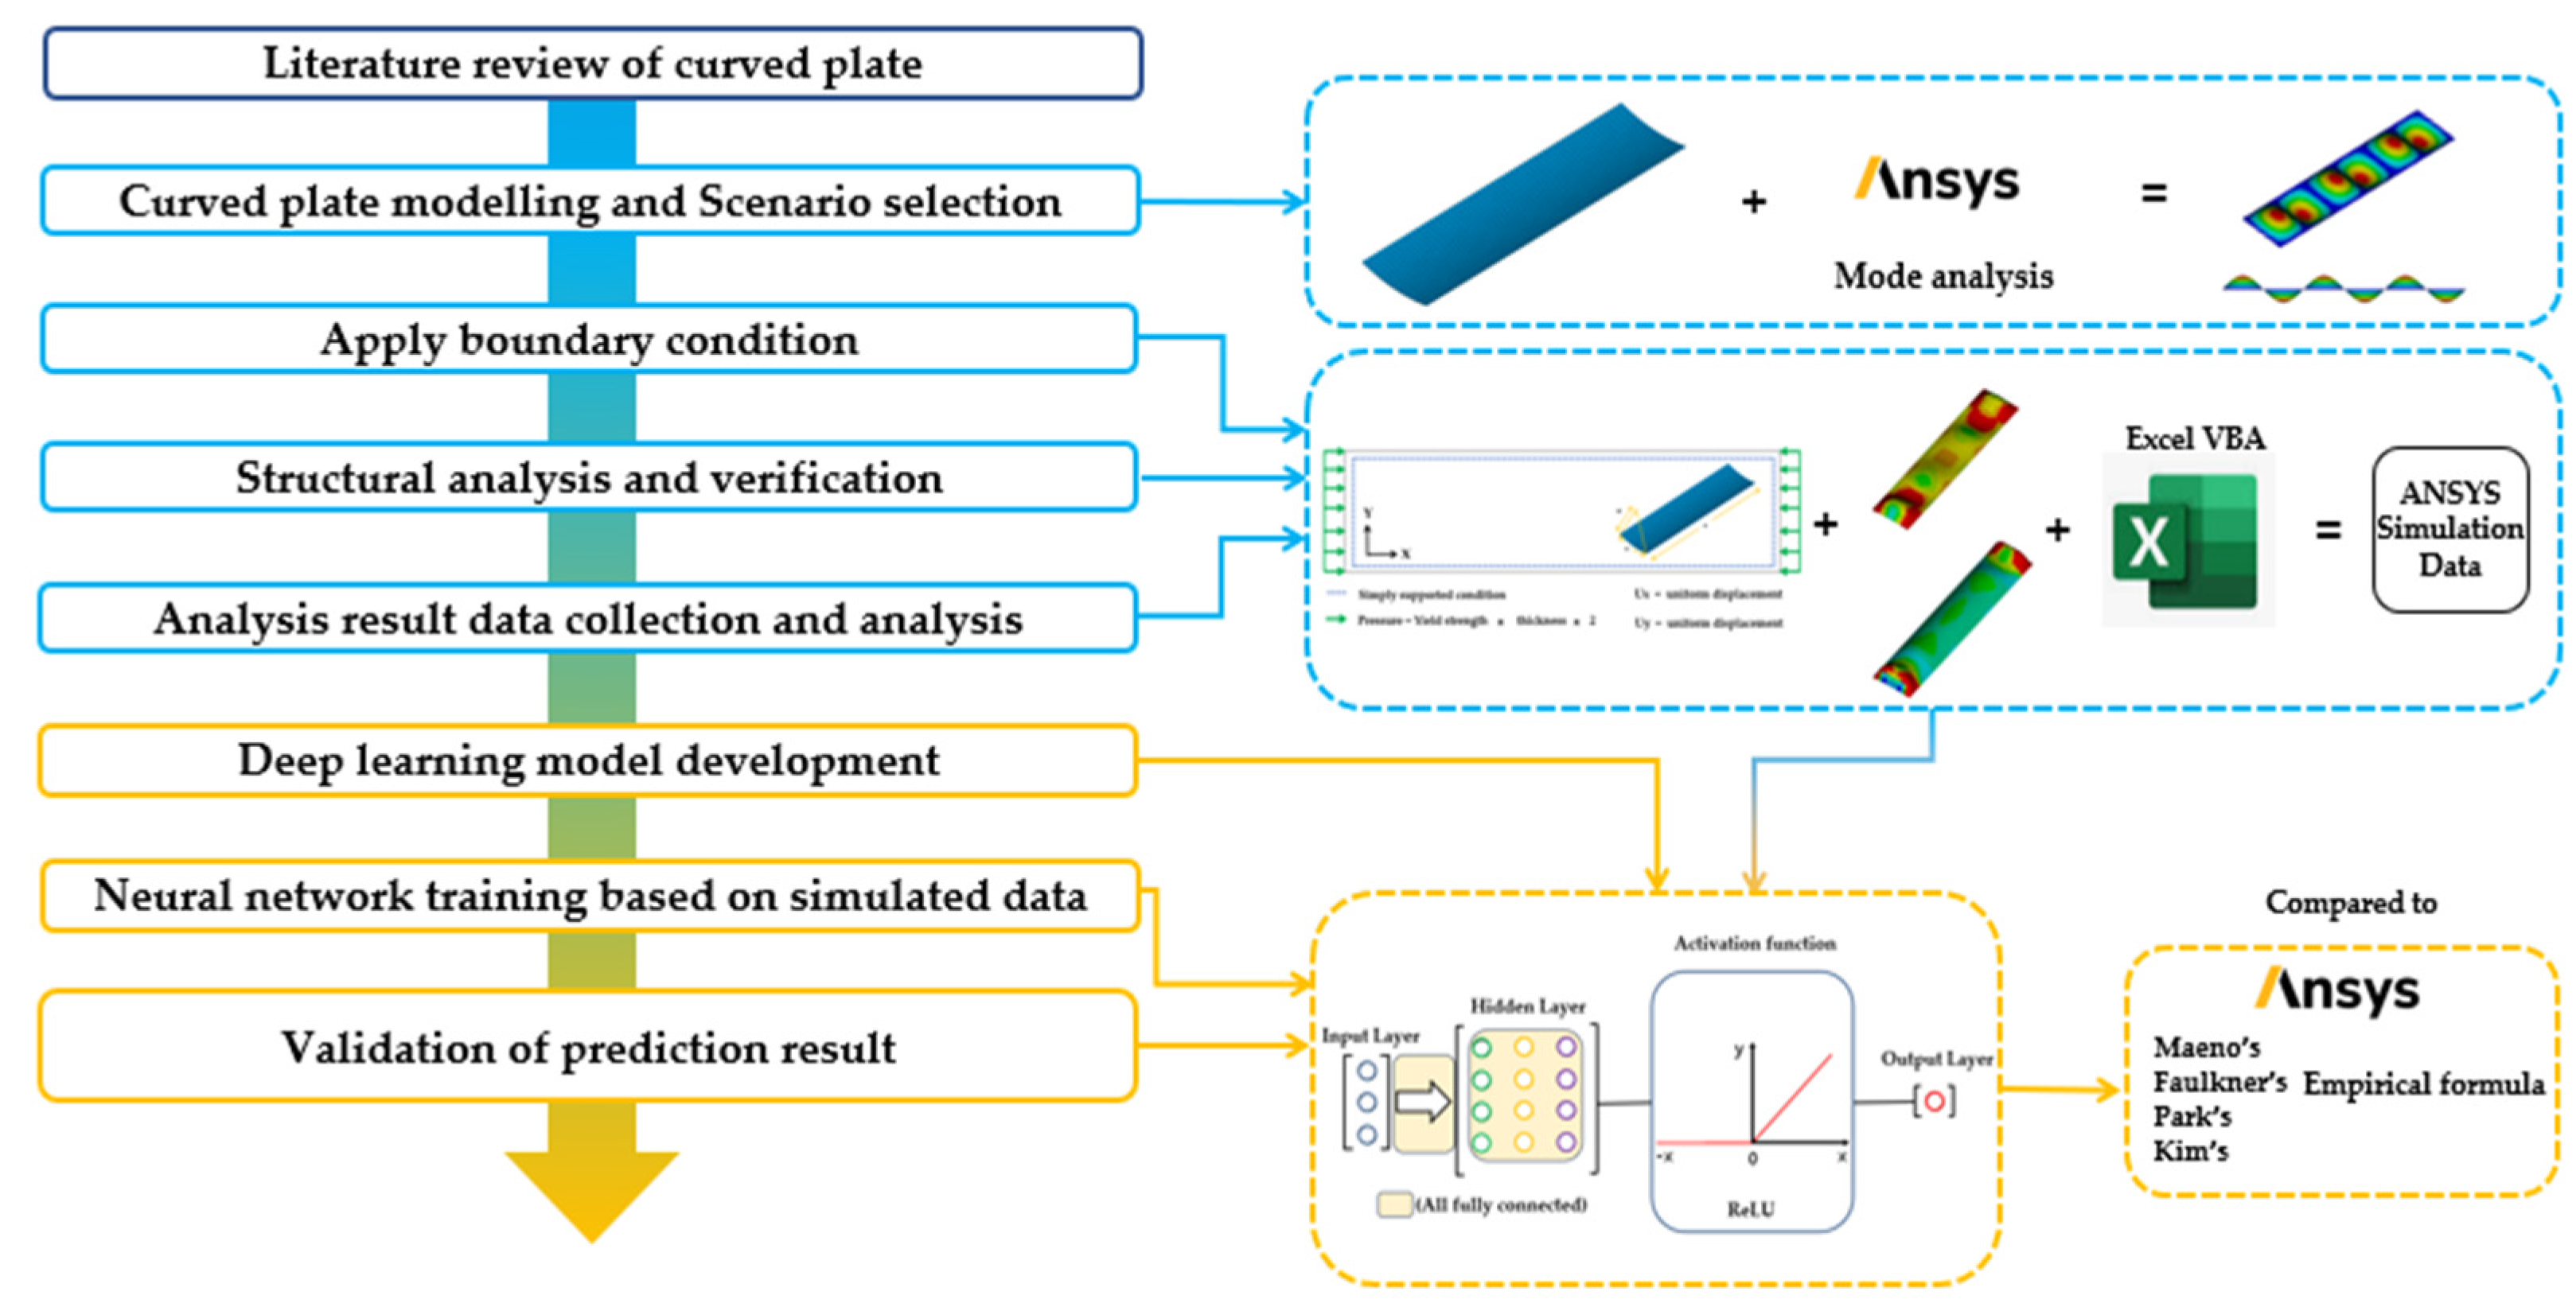
1.2. Research Motivation and Methods
2. Modeling and Structural Analysis of Curved Plates
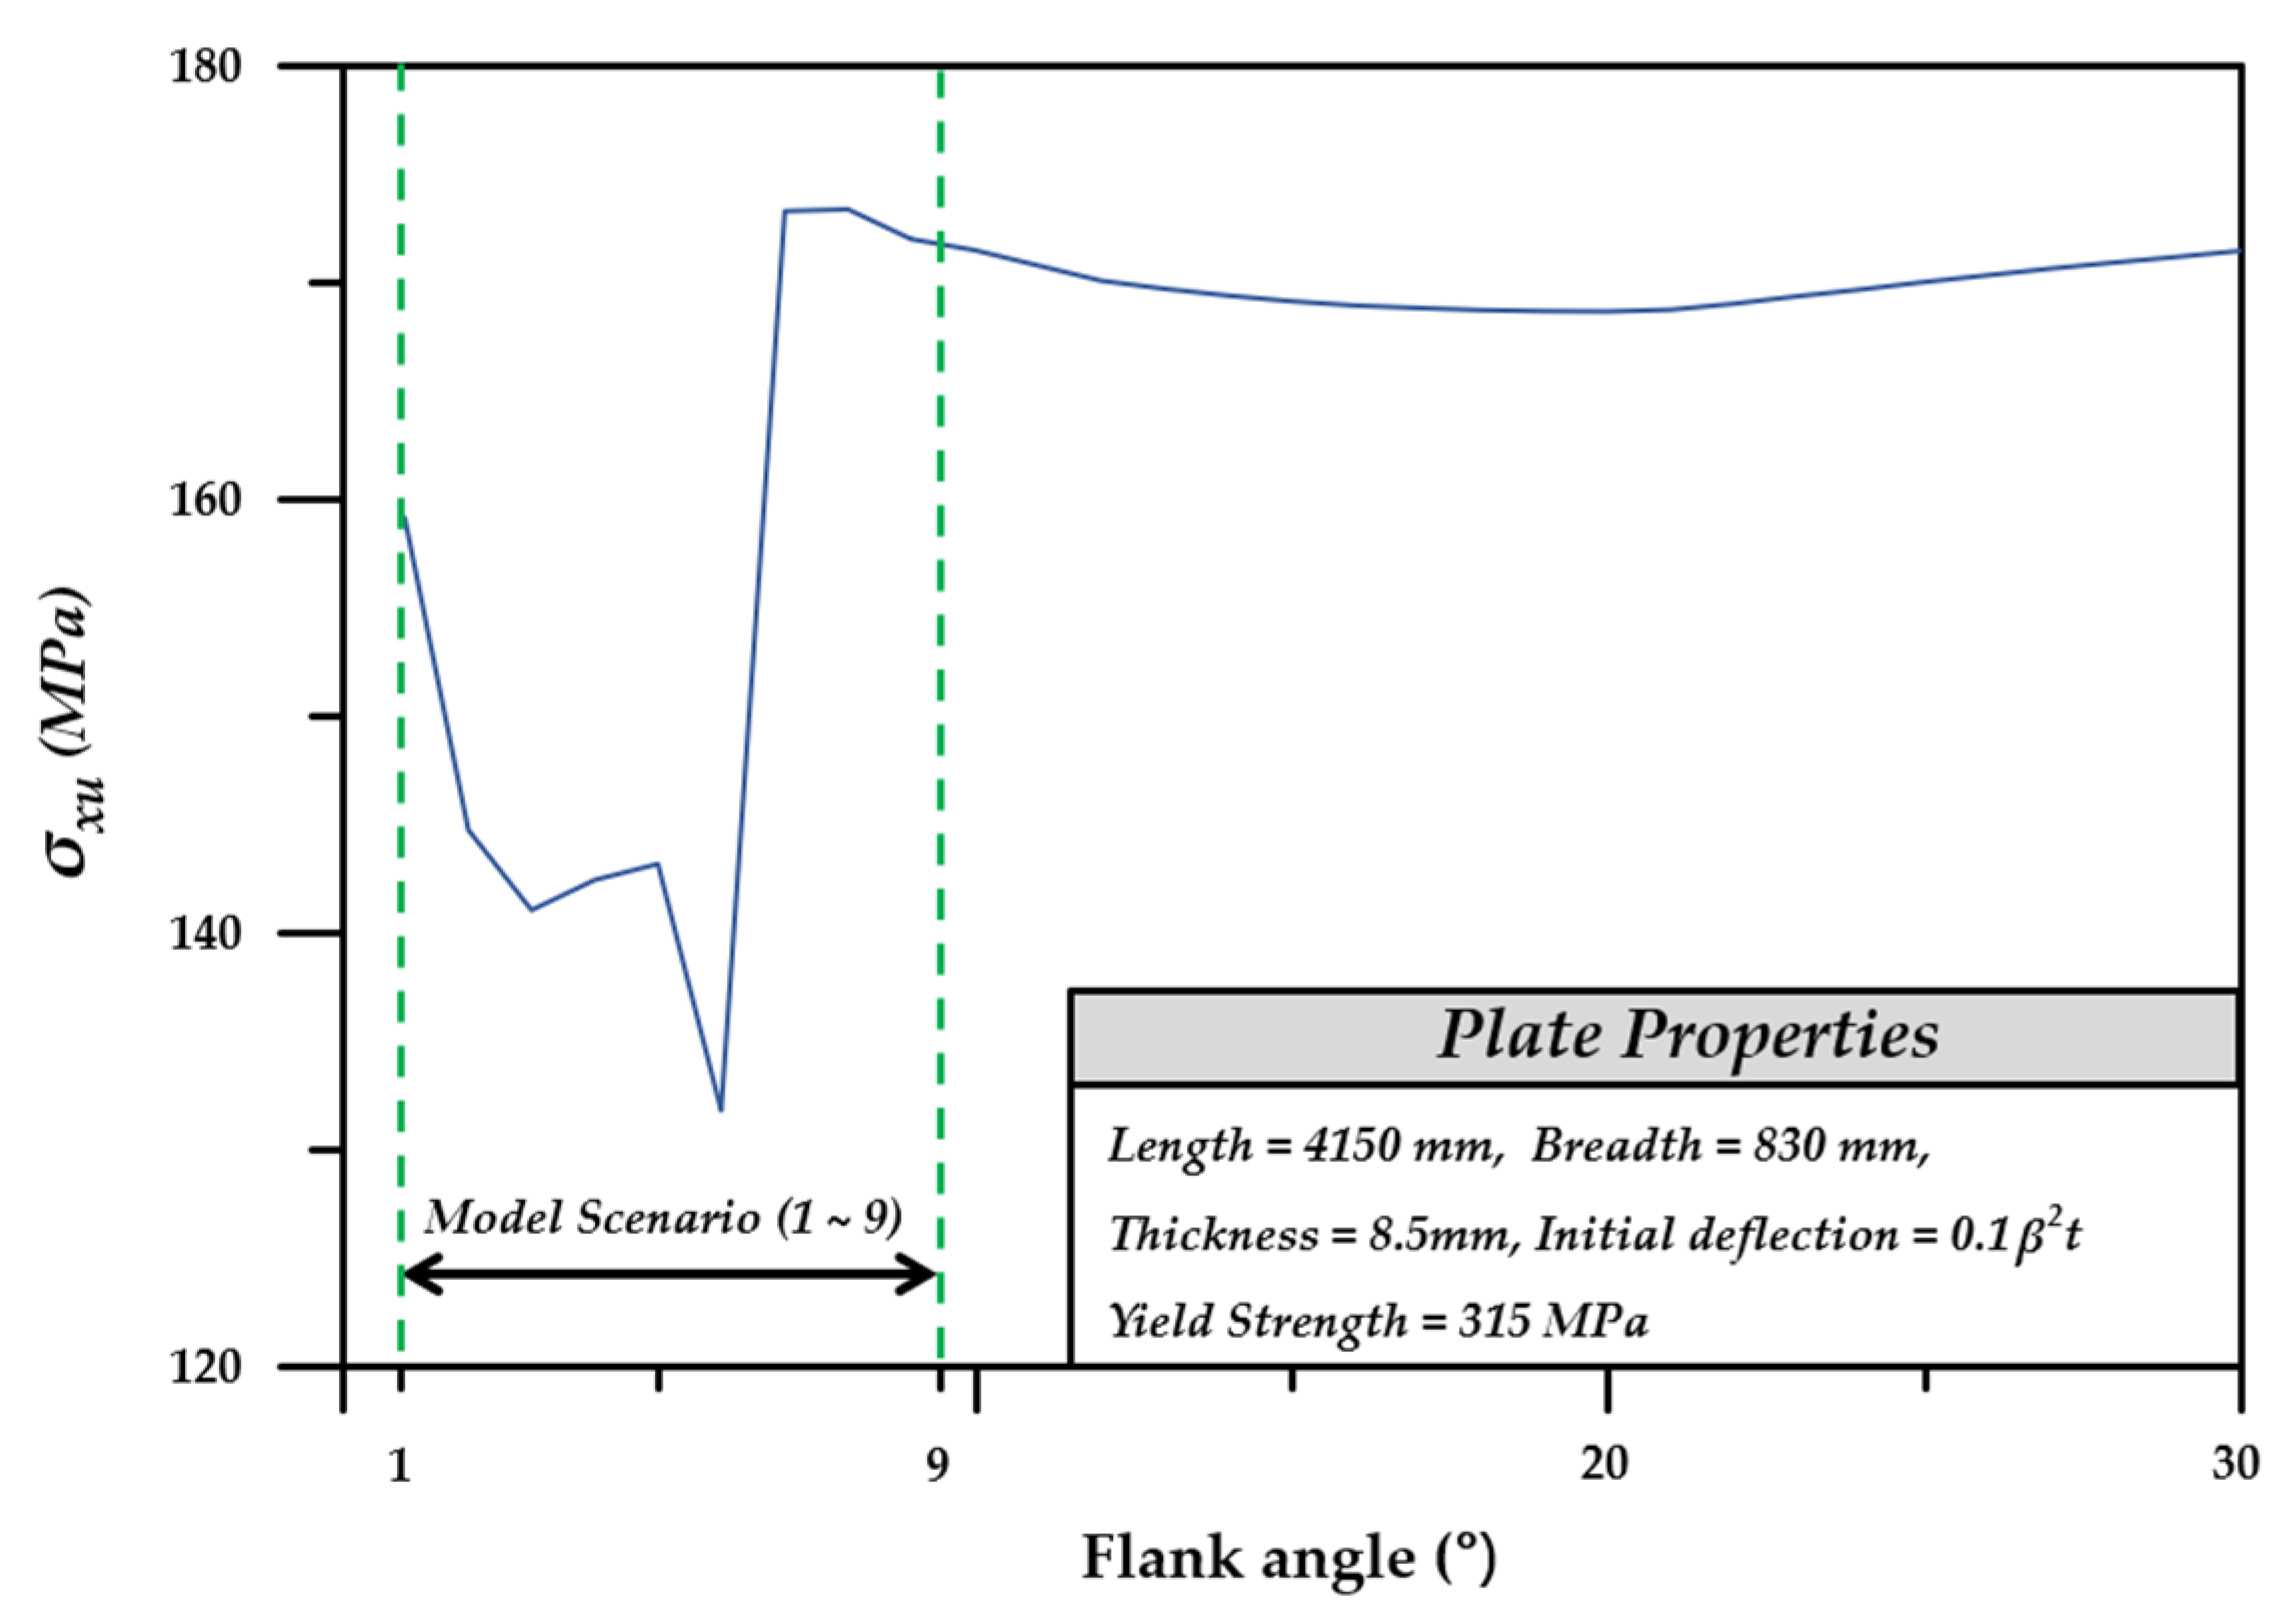
2.1. Selection of the Curved Plate Analysis Scenario
2.2. Components of the Curved Plate
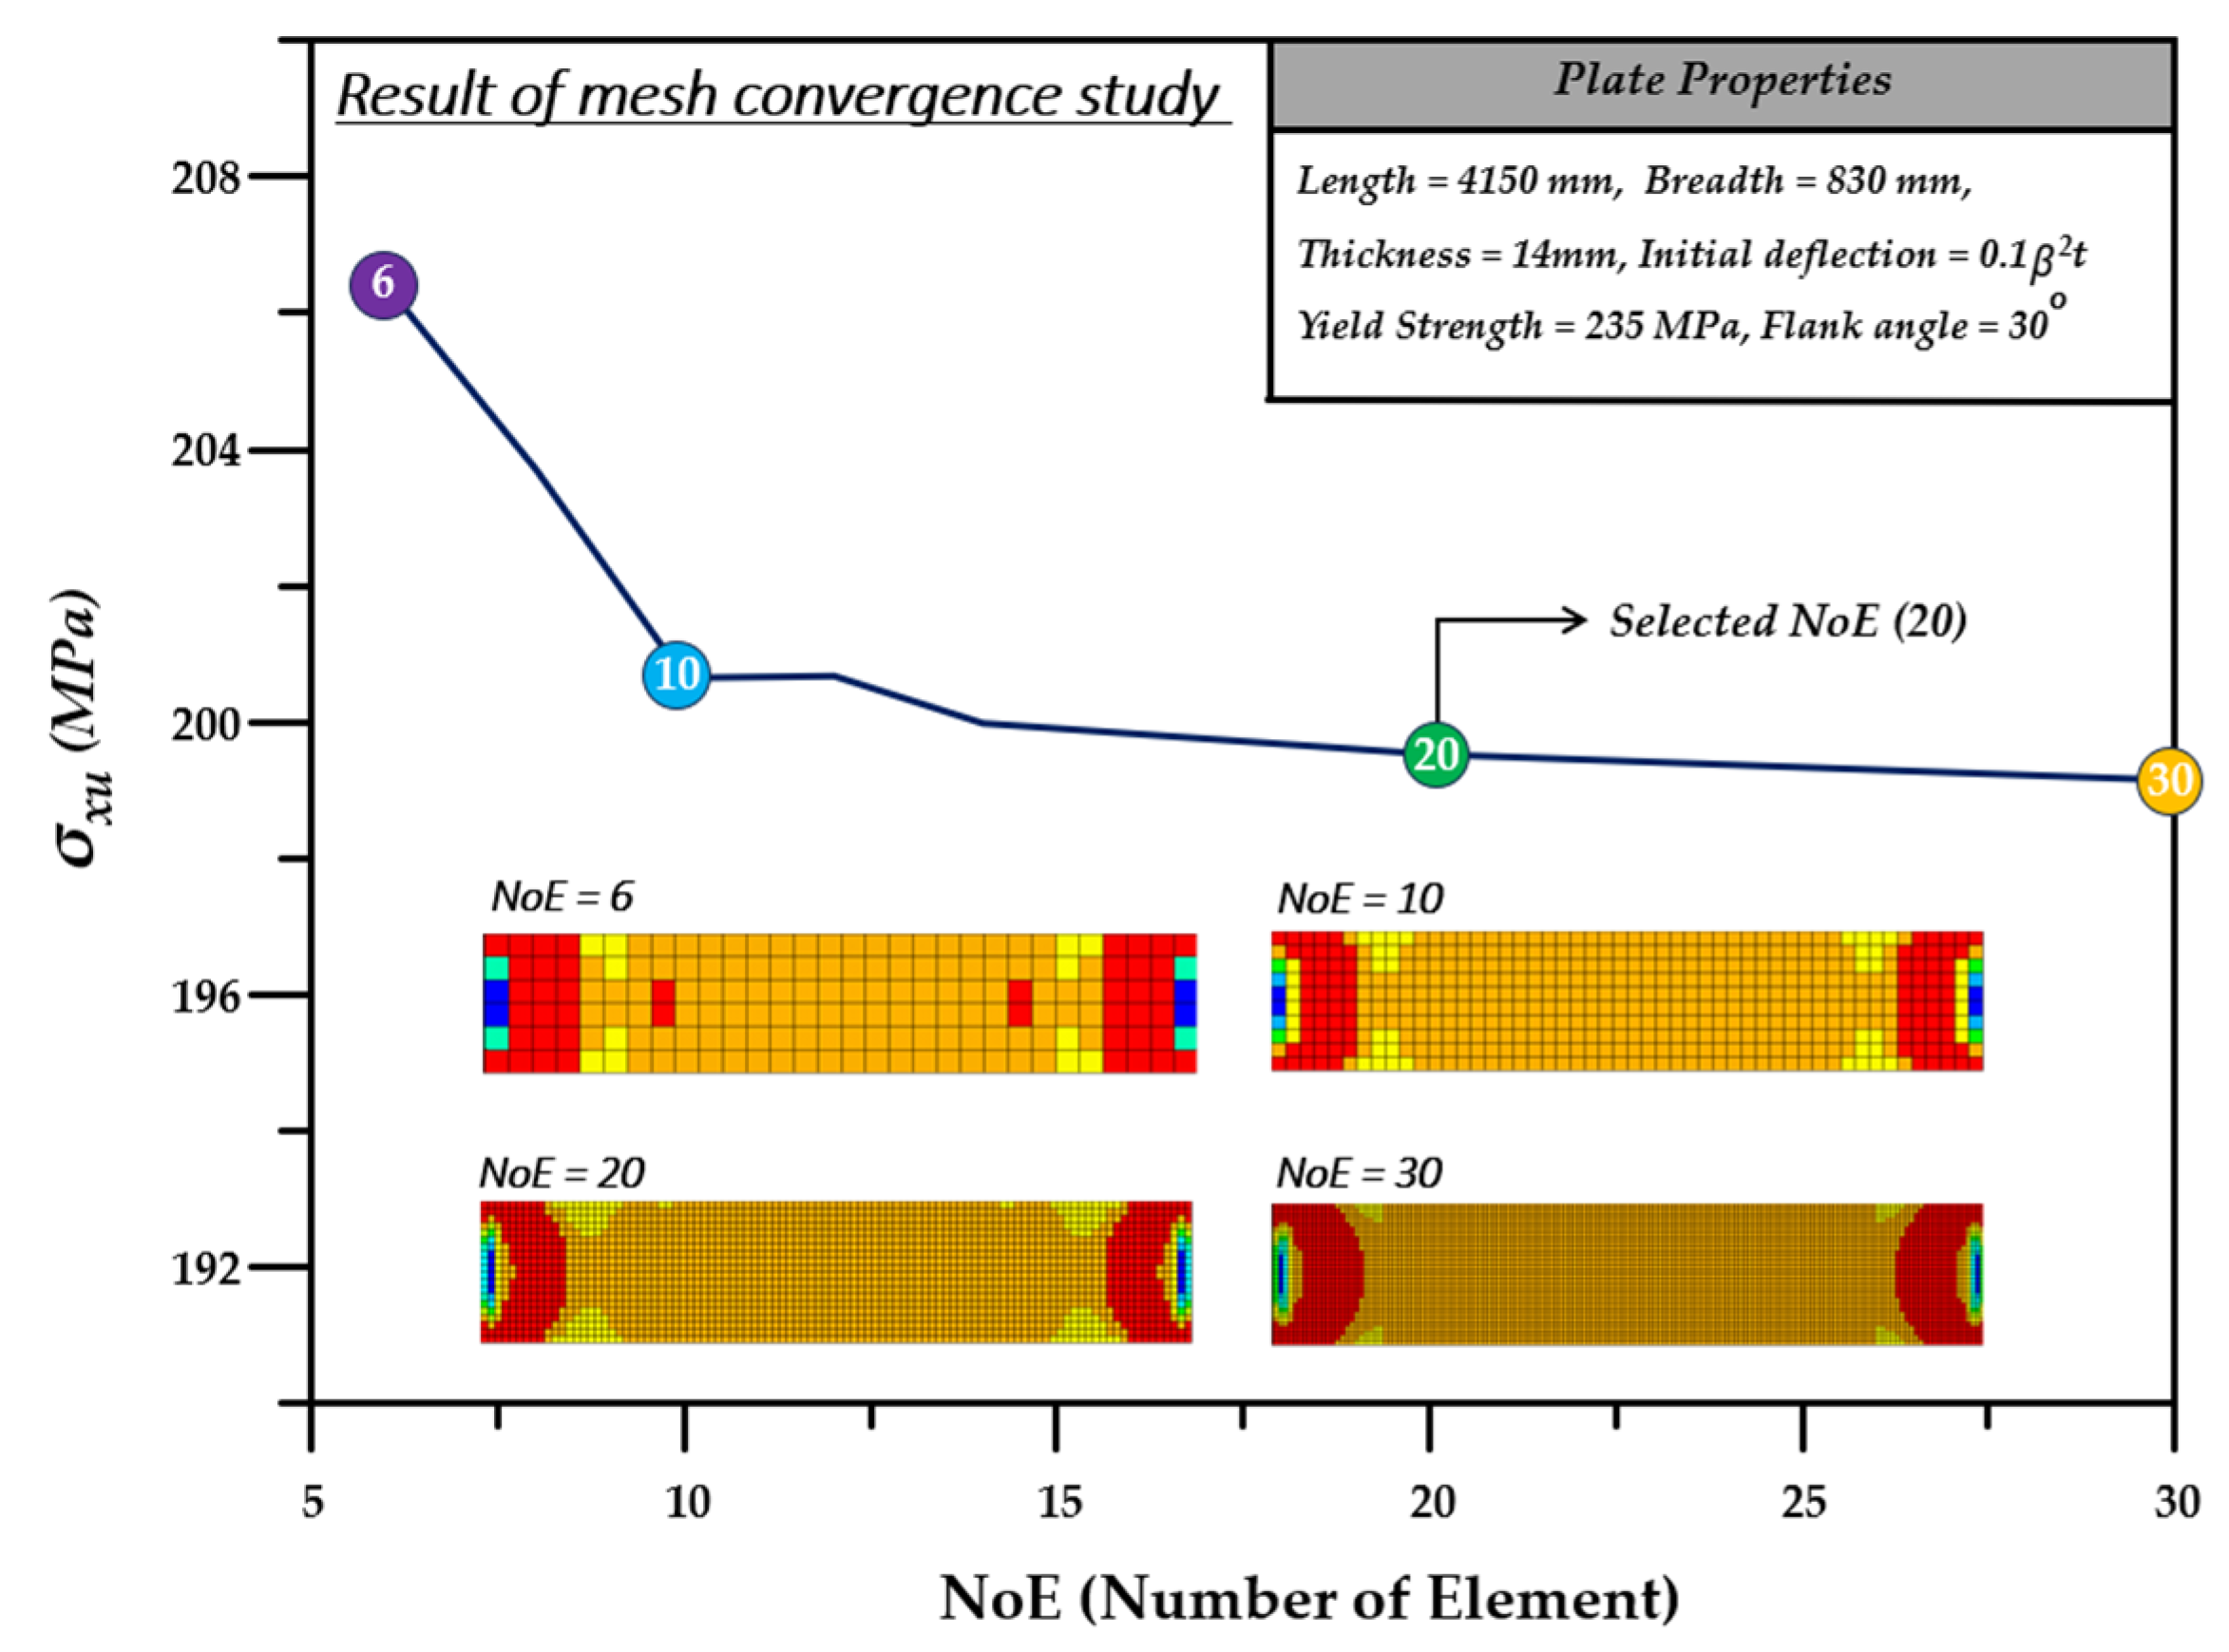
2.3. FE Modeling
2.4. Boundary Conditions of the Curved Plate
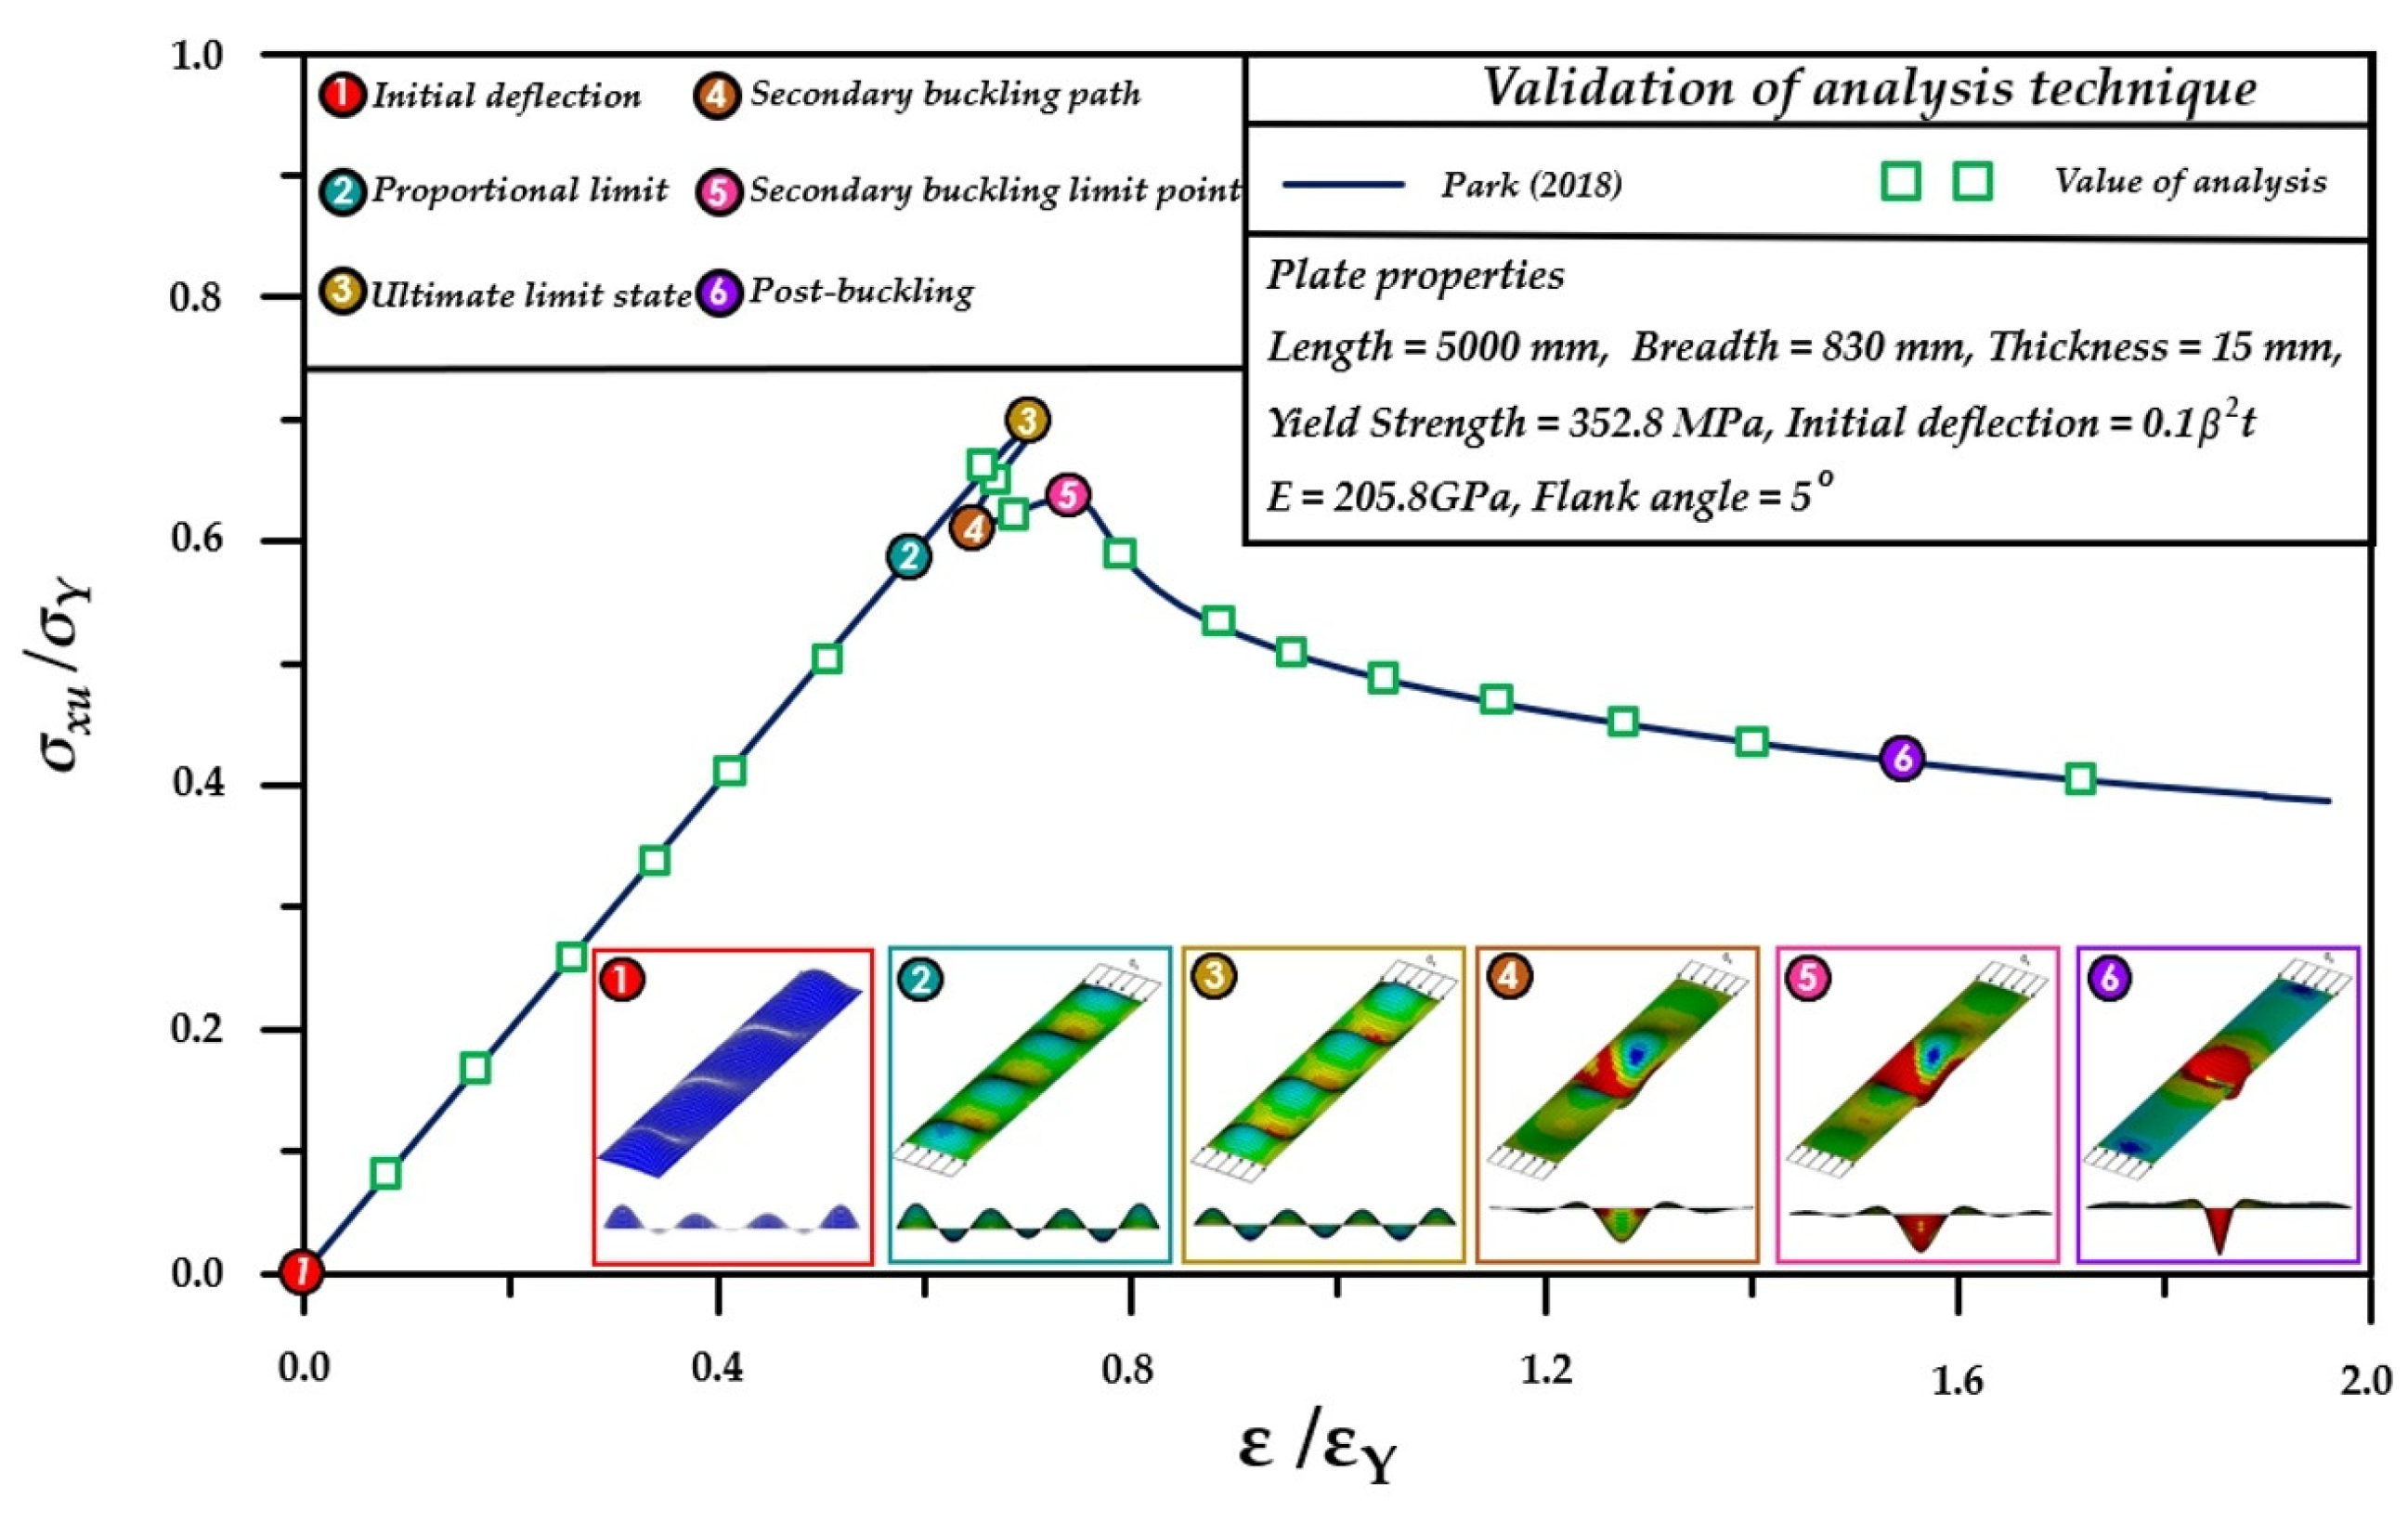
2.5. Verification of FE Analysis Technique
3. Development of Deep Learning Model
3.1. Composition of Deep Learning Model
3.2. Selection of Parameters of the Deep Learning Model
3.3. Normalization of Parameter Data
3.4. Loss Function and Optimization Function of the Deep Learning Model
4. Prediction Results of Ultimate Strength Using Deep Learning Model
4.1. Prediction of Ultimate Strength of the Curved Plate
4.2. Prediction of the Ultimate Strength of the Curved Plate in Which Secondary Buckling Occurred
4.3. Prediction of Ultimate Strength of Unlearned Curved Plate
5. Conclusions
5.1. Overall Summary
- Utilizing the FEM analysis and empirical formulas, the ultimate strength of the curved plate can be predicted more rapidly compared with nonlinear cases and complicated empirical formulas.
- If the empirical formula is utilized, it can be applied in a limited range of the plate width, length, and slenderness ratio, but it can also predict the ultimate strength of the unlearned plate.
- Based on the prediction results for the ultimate strength of the curved plate utilizing the deep learning model, the developed model indicated a higher accuracy compared with the empirical formulas.
5.2. Limitation of This Study and Future Work
Author Contributions
Funding
Institutional Review Board Statement
Informed Consent Statement
Data Availability Statement
Conflicts of Interest
Appendix A

| Yield (MPa) | Length (mm) | Breadth (mm) | Thickness (mm) | Plate Slenderness Ratio |
|---|---|---|---|---|
| 235 | 830 1660 2490 3320 4150 | 830 | 7 | 4.0067 |
| 10 | 2.8047 | |||
| 13.5 | 2.0776 | |||
| 16.5 | 1.6998 | |||
| 20 | 1.4024 | |||
| 24 | 1.1686 | |||
| 28.5 | 0.9841 | |||
| 32 | 0.8765 | |||
| 36.5 | 0.7684 | |||
| 42 | 0.6678 | |||
| 315 | 830 1660 2490 3320 4150 | 830 | 8.5 | 3.8202 |
| 12 | 2.7060 | |||
| 15.5 | 2.0950 | |||
| 18.5 | 1.7552 | |||
| 22 | 1.4760 | |||
| 26 | 1.2489 | |||
| 30 | 1.0824 | |||
| 34 | 0.9551 | |||
| 38.5 | 0.8434 | |||
| 44.5 | 0.7297 | |||
| 355 | 830 1660 2490 3320 4150 | 830 | 9 | 3.8302 |
| 12 | 2.8727 | |||
| 17 | 2.0278 | |||
| 19 | 1.8143 | |||
| 23 | 1.4988 | |||
| 26.5 | 1.3008 | |||
| 30.5 | 1.1302 | |||
| 34.5 | 0.9992 | |||
| 42 | 0.8208 | |||
| 50 | 0.6894 |
References
- Paik, J.K.; Kim, D.K.; Kim, M.S. Ultimate strength performance of Suezmax tanker structures: Pre-CSR versus CSR designs. In Analysis and Design of Marine Structures; CRC Press: Boca Raton, FL, USA, 2009; pp. 205–216. [Google Scholar]
- Paik, J.K.; Kim, B.J.; Seo, J.K. Methods for ultimate limit state assessment of ships and ship-shaped offshore structures: Part I—Unstiffened plates. Ocean. Eng. 2008, 35, 261–270. [Google Scholar] [CrossRef]
- Paik, J.K.; Seo, J.K. Nonlinear finite element method models for ultimate strength analysis of steel stiffened-plate structures under combined biaxial compression and lateral pressure actions—Part I: Plate elements. Thin-Walled Struct. 2009, 47, 1008–1017. [Google Scholar] [CrossRef]
- Paik, J.K. Ultimate limit state performance of oil tanker structures designed by IACS common structural rules. Thin-Walled Struct. 2007, 45, 1022–1034. [Google Scholar] [CrossRef]
- Bäseler, W.; Bauer, G.; Dreyfus, L.; Düll, R.; Föppl, L.; Föppl, O.; v Kármán, T. Die mittragende Breite. In Beiträge zur Technischen Mechanik und Technischen Physik: August Föppl zum Siebzigsten Geburtstag am 25. Januar 1924; Springer: Berlin/Heidelberg, Germany, 1924; pp. 114–127. [Google Scholar]
- Paik, J.K.; Amlashi, H.; Boon, B.; Branner, K.; Caridis, P.; Das, P.; Fujikubo, M.; Huang, C.-H.; Josefson, L.; Kaeding, P.; et al. Committee III. 1 ultimate strength. In Proceedings of the 18th International Ship and Offshore Structures Congress Schiffbautechnische Gesellschaft eV, Rostock, Germany, 9–13 September 2012; pp. 285–363. [Google Scholar]
- Kim, D.K.; Lim, H.L.; Yu, S.Y. A technical review on ultimate strength prediction of stiffened panels in axial compression. Ocean Eng. 2018, 170, 392–406. [Google Scholar] [CrossRef]
- Kim, D.K.; Poh, B.Y.; Lee, J.R.; Paik, J. Ultimate strength of initially deflected plate under longitudinal compression: Part I = An advanced empirical formulation. Struct. Eng. Mech. 2018, 68, 247–259. [Google Scholar]
- Lim, H.L.; Yu, S.Y. Ultimate strength prediction of T-bar stiffened panel under longitudinal compression by data processing: A refined empirical formulation. Ocean Eng. 2019, 192, 106522. [Google Scholar]
- Oh, S.J.; Lim, C.O.; Park, B.C.; Lee, J.C.; Shin, S.C. Deep neural networks for maximum stress prediction in piping design. Int. J. Fuzzy Log. Intell. Syst. 2019, 19, 140–146. [Google Scholar] [CrossRef]
- Paik, J.K.; Kim, S.J.; Kim, D.H.; Kim, D.C.; Frieze, P.A.; Abbattista, M.; Vallascas, M.; Hughes, O.F. Benchmark study on use of ALPS/ULSAP method to determine plate and stiffened panel ultimate strength. In Proceedings of the 3rd Advances on Marine Structures, Hamburg, Germany, 28–30 March 2011. [Google Scholar]
- Smith, C.S.; Davidson, P.C.; Chapman, J.C. Strength and stiffness of ships’plating under in-plane compression and tension. R. Inst. Nav. Archit. Trans. 1988, 130, 277296. [Google Scholar]
- Park, J.S.; Fujikubo, M.; Iijima, K.; Yao, T. Prediction of the secondary buckling strength and ultimate strength of cylindrically curved plate under axial compression. In ISOPE International Ocean and Polar Engineering Conference; ISOPE: Mountain View, CA, USA, 2009; p. ISOPE-I. [Google Scholar]
- Kim, J.H.; Park, D.H.; Kim, S.K.; Kim, M.S.; Lee, J.M. Experimental study and development of design formula for estimating the ultimate strength of curved plates. Appl. Sci. 2021, 11, 2379. [Google Scholar] [CrossRef]
- Park, J.S.; Paik, J.K.; Seo, J.K. Numerical investigation and development of design formula for cylindrically curved plates on ships and offshore structures. Thin-Walled Struct. 2018, 132, 93–110. [Google Scholar] [CrossRef]
- Kim, D.K.; Ban, I.; Poh, B.Y.; Shin, S.C. A useful guide of effective mesh-size decision in predicting the ultimate strength of flat-and curved plates in compression. J. Ocean Eng. Sci. 2023, 8, 401–417. [Google Scholar] [CrossRef]
- Kee Paik, J.; Kyun Kim, D.; Lee, H.; Lae Shim, Y. A method for analyzing elastic large deflection behavior of perfect and imperfect plates with partially rotation-restrained edges. J. Offshore Mech. Arct. Eng. 2012, 134, 021603. [Google Scholar] [CrossRef]
- Rodrigues, M.V. Probabilistic Characterization of the Ultimate Strength of Plates with Initial Geometrical Imperfections. Master’s Thesis, Technical University of Lisbon, Lisbon, Portugal, 2011. [Google Scholar]
- Lim, C.; Han, I.S.; Kang, J.Y.; Ban, I.J.; Lee, B.; Park, J.S.; Shin, S.C. Shear Force and Bending Moment Tuning Algorithm of Shuttle Tanker Model for Global Structural Analysis. J. Mar. Sci. Eng. 2023, 11, 1900. [Google Scholar] [CrossRef]
- Kim, D.K.; Li, S.; Lee, J.R.; Poh, B.Y.; Benson, S.; Cho, N.K. An empirical formula to assess ultimate strength of initially deflected plate: Part 1= propose the general shape and application to longitudinal compression. Ocean. Eng. 2022, 252, 111151. [Google Scholar] [CrossRef]
- Faulkner, D. A review of effective plating for use in the analysis of stiffened plating in bending and compression. J. Ship Res. 1975, 19, 1–17. [Google Scholar] [CrossRef]
- Cho, S.J.; Ban, I.J.; Shin, S.C. A Novel Deep Learning Model to Predict Ultimate Strength of Ship Plates under Compression. Appl. Sci. 2022, 12, 2522. [Google Scholar] [CrossRef]
- Hastie, T.; Tibshirani, R.; Friedman, J.H.; Friedman, J.H. The Elements of Statistical Learning: Data Mining, Inference, and Prediction; Springer: New York, NY, USA, 2009; Volume 2, pp. 1–758. [Google Scholar]
- Goodfellow, I.; Bengio, Y.; Courville, A. Deep Learning; MIT Press: Cambridge, MA, USA, 2016. [Google Scholar]
- Patro, S.G.O.P.A.L.; Sahu, K.K. Normalization: A preprocessing stage. arXiv 2015, arXiv:1503.06462. [Google Scholar] [CrossRef]
- Hu, Z.; Zhang, J.; Ge, Y. Handling vanishing gradient problem using artificial derivative. IEEE Access 2021, 9, 22371–22377. [Google Scholar] [CrossRef]
- Maeno, Y.; Yamaguchi, H.; Fujii, Y.; Yao, T. Buckling/Plastic Collapse Behaviour And Strength of Bilge Circle and Its Contribution to Ultimate Longitudinal Strength of Ship’s Hull Girder. In ISOPE International Ocean and Polar Engineering Conference; ISOPE: Mountain View, CA, USA, 2004; p. ISOPE-I. [Google Scholar]
- Kim, D.K.; Wong, A.M.K.; Hwang, J.; Li, S.; Cho, N.K. A novel formula for predicting the ultimate compressive strength of the cylindrically curved plates. Int. J. Nav. Archit. Ocean Eng. 2024, 16, 100562. [Google Scholar] [CrossRef]


| Length (mm); 830, 1660, 2490, 3320, 4150 |
| Thickness (mm); 235 MPa (7, 10, 13.5, 16.5, 20, 24, 28.5, 32, 36.5, 42) 315 MPa (8.5, 12, 15.5, 18.5, 22, 26, 30, 34, 38.5, 44.5) 335 MPa (9, 12, 17, 19, 23, 26.5, 30.5, 34.5, 42, 50) |
| Flank angle (°); 1~9 |
| Material (MPa); 235, 315, 335 |
| Initial Deflection Shapes of the Curved Plate | |||||
|---|---|---|---|---|---|
| θ = Flank angle, Scale factor = 200 | |||||
| θ = 1 |  | θ = 4 |  | θ = 7 |  |
| θ = 2 | 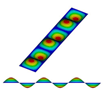 | θ = 5 |  | θ = 8 | 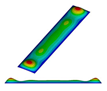 |
| θ = 3 |  | θ = 6 |  | θ = 9 | 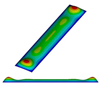 |
| Geometric Properties | Material Properties | Design Parameter | ||||||
|---|---|---|---|---|---|---|---|---|
| a (mm) | b (mm) | t (mm) | W0pl (mm) | θ (°) | σY (MPa) | E (GPa) | β | |
| Park (2018) [15] | 5000 | 1000 | 15 | 0.15 | 5 | 352 | 205.8 | 2.7603 |
| Number of hidden layers | 5 |
| Activation function | ReLU |
| Input features | 10 |
| Epoch | 1500 |
| No. of training sets | 3240 |
| No. of test sets | 810 |
| Initial deflection | 0.510 |
| Plate length (a) | 0.032 |
| Flank angle | 0.049 |
| Plate slenderness ratio (β) | 0.700 |
| Plate thickness (t) | 0.720 |
| Yield strength | 0.600 |
| Radius | 0.049 |
| Plate length/Radius | 0.035 |
| Plate breadth/Radius | 0.027 |
| Radius/plate thickness | 0.490 |
| Epoch | Training Data MSE | Test Data MSE |
|---|---|---|
| 1 | 0.4618 | 0.9370 |
| 100 | 0.0031 | 0.0049 |
| 200 | 0.0010 | 0.0044 |
| 300 | 0.0011 | 0.0047 |
| 500 | 0.0005 | 0.0028 |
| 1300 | 0.0001 | 0.0024 |
| 1500 | 0.0001 | 0.0024 |
| Empirical Formula | Average (%) | Max (%) | Min (%) |
|---|---|---|---|
| DNN | 0.86 | 11.63 | 0.00 |
| Maeno (2004) Equation (8) [27] | 2.06 | 5.11 | 0.13 |
| Faulkner (1975) Equation (9) [21] | 3.67 | 29.44 | 0.00 |
| Park (2018) Equation (10) [15] | 5.43 | 20.90 | 0.00 |
| Kim (2024) Equation (11) [28] | 2.16 | 24.09 | 0.00 |
| Empirical Formula | Average (%) | Max (%) | Min (%) |
|---|---|---|---|
| DNN | 0.77 | 9.51 | 0.00 |
| Maeno (2004) Equation (8) [27] | - | - | - |
| Faulkner (1975) Equation (9) [21] | 8.50 | 20.25 | 0.42 |
| Park (2018) Equation (10) [15] | 7.41 | 15.51 | 0.00 |
| Kim (2024) Equation (11) [28] | 7.24 | 14.03 | 0.45 |
| Error | Average (%) | Max (%) | Min (%) |
|---|---|---|---|
| DNN | 2.47 | 7.71 | 0.05 |
Disclaimer/Publisher’s Note: The statements, opinions and data contained in all publications are solely those of the individual author(s) and contributor(s) and not of MDPI and/or the editor(s). MDPI and/or the editor(s) disclaim responsibility for any injury to people or property resulting from any ideas, methods, instructions or products referred to in the content. |
© 2024 by the authors. Licensee MDPI, Basel, Switzerland. This article is an open access article distributed under the terms and conditions of the Creative Commons Attribution (CC BY) license (https://creativecommons.org/licenses/by/4.0/).
Share and Cite
Ban, I.-j.; Lim, C.; Kim, G.-y.; Choi, S.-y.; Shin, S.-c. A Data-Driven DNN Model to Predict the Ultimate Strength of a Ship’s Bottom Structure. J. Mar. Sci. Eng. 2024, 12, 1328. https://doi.org/10.3390/jmse12081328
Ban I-j, Lim C, Kim G-y, Choi S-y, Shin S-c. A Data-Driven DNN Model to Predict the Ultimate Strength of a Ship’s Bottom Structure. Journal of Marine Science and Engineering. 2024; 12(8):1328. https://doi.org/10.3390/jmse12081328
Chicago/Turabian StyleBan, Im-jun, Chaeog Lim, Gi-yong Kim, Seo-young Choi, and Sung-chul Shin. 2024. "A Data-Driven DNN Model to Predict the Ultimate Strength of a Ship’s Bottom Structure" Journal of Marine Science and Engineering 12, no. 8: 1328. https://doi.org/10.3390/jmse12081328