Article

Numerical Analysis of the Sediment Erosion of the Balance Valve in a Buoyancy Regulation System

1
China Ship Scientific Research Center, Wuxi 214082, China
2
State Key Laboratory of Deepsea Manned Vehicle, Wuxi 214082, China
3
School of Mechanical Engineering, Jiangnan University, Wuxi 214122, China
4
Jiangsu Key Laboratory of Advanced Food Manufacturing Equipment and Technology, Jiangnan University, Wuxi 214122, China
*
Authors to whom correspondence should be addressed.
J. Mar. Sci. Eng. 2024, 12(8), 1344; https://doi.org/10.3390/jmse12081344 (registering DOI)
Submission received: 3 July 2024 / Revised: 3 August 2024 / Accepted: 6 August 2024 / Published: 7 August 2024
(This article belongs to the Section Ocean Engineering)

Abstract

:
Numerical analysis of the sediment erosion of the balance valve in a buoyancy regulation system was performed. A numerical model for the two-phase flow inside the balance valve was constructed based on the discrete phase model. The sediment erosion rate on the balance valve was discussed, and the effects of five parameters were considered. The effects of the sediment concentration and valve opening were found to be significant, while the effects of the pressure difference, sediment density, and size were found to be moderate. The erosion rate, according to the numerical results, increased linearly with the sediment concentration, so long-term operation of a buoyancy regulation system in high-concentration areas should be avoided. The erosion rate was the highest when the valve opening was 46.3%, so half-open operating conditions are not recommended. The erosion rate was proportional to the square root of the pressure difference. However, adjusting the pressure difference may not be an effective method for regulating the total erosion. The superposition of the secondary flow and the main stream caused particles to spiral along with the fluid, resulting in asymmetric erosion at the working edge. The erosion rate on the working edge decreased with the increase in the sediment size. Conversely, the erosion rate on the valve ball surface increased with the sixth power of the sediment size. Considering that large particles are more likely to cause a blockage, it is recommended to install a seawater pretreatment device at the inlet to prevent large sediments from entering the valve and to improve the working life of the buoyancy regulation system.

1. Introduction

Buoyancy adjustment of underwater submersibles is important in deep-sea operations. The seawater hydraulic balance valve plays a role in the buoyancy regulation system, ensuring the maneuverability of the submersible’s operation. However, the presence of a large number of suspended sand particles in seawater can cause erosion of the buoyancy regulation system balance valve port due to sand-laden seawater, leading to failure of the valve seal, increased zero leakage, and reduced pressure gain, thereby decreasing the volumetric efficiency of the buoyancy regulation system [1,2]. However, if high-precision filters are used to filter the suspended sand, the seawater hydraulic system is prone to clogging and cannot operate normally [3]. Therefore, studying the erosion characteristics of sediments on the balance valve and optimizing the design of the valve are of great significance.
Previous research on the erosion of balance valves mainly focused on erosion induced by impurity particles in the oil. Du et al. [4] carried out a numerical study of the erosion of solid particles in hydraulic spool valves. They found that an increase in oil viscosity caused a decrease in the erosion rate (ER), which was opposite to the conclusion obtained by Liu et al. [1]. Li et al. [5] developed a three-dimensional prediction model for the orifice erosion of high-speed on/off valves. Their model takes into account the influence of a fluid vortex at the valve orifice. They revealed that valve erosion is mainly caused by the combination of main stream flow and valve cavity vortex centrifugal particle erosion. Particle motion visualization tests and computational fluid dynamics (CFD) calculations were conducted by Liu et al. [1,6,7,8,9] to study the particle motion and erosion morphology in an electro-hydraulic servo valve. The research findings indicated that the predominant factors contributing to erosion wear were microscopic scraping and the collision of particles with the working edges. The valve orifice erosion resulted in the formation of fillets on the working edges, a phenomenon known as edge collapse, and led to an increase in the dispersion of the circumferential distribution. The erosion wear rate of the working edge was found to be proportional to both the pressure difference and the non-roundness of the particles. Furthermore, it was observed that the erosion rate of the working edge in the incident flow zone was approximately one time higher than that in the backflow zone. In a previous study, Li et al. [10] developed a predictive model for the orifice throttling coefficient and worn profile in engineering applications. This was based on the E/CRC erosion wear model and took into account the probability of collision. The results indicated that the number of solid particles and the hardness of the valve orifice material had the greatest influence on the prediction results. The numerical results reported by Yin et al. [11] showed that secondary damage resulting from particle fracturing may have an impact on the outcomes of laboratory experiments. Furthermore, the data indicated that the maximum erosion rate for particles of a diameter of 10 µm exhibited no significant variation with changes in the spool opening.
With the development of water hydraulic technology, seawater is gradually being used as a pressure medium in hydraulic systems instead of mineral oil [12]. The viscosity of seawater is smaller than that of oil, resulting in a greater flow velocity under the same conditions and more severe erosion and wear compared to those with oil. A CFD-DEM (discrete element method) was used by Lin et al. [13] to investigate the two-phase flow and erosion characteristics of ball valves with varying valve openings and particle sizes. Furthermore, it was postulated that the number of particles was a significant determinant of the erosion rate. The maximum erosion value of the pipeline situated behind the valve demonstrated an exponential decline with the increase in particle size, a finding that contrasts with the results reported by Yin et al. [11]. Cheng et al. [14] studied the solid–liquid flow inside a centrifugal pump by coupling Fluent and EDEM software, and the numerical results were validated by particle image velocimetry (PIV) experiments. The particle concentration at the pump inlet had a significant impact on the wall wear when conveying large-sized particles. It may be reasonably assumed that an increase in particle concentration will result in a proportional increase in wear severity.
Song et al. [15,16,17] conducted an analysis to investigate the impact of alterations in particle distribution and trajectory on the erosion of the blade surface in a centrifugal pump operating with a sediment-laden medium. The findings indicated that the erosion patterns on the impeller surface of the centrifugal pump exhibited an asymmetrical distribution. The free surface vortex (FSV) and the secondary flow in the impeller had significant influences on the particle movement, which aggravated the local friction and erosion near the walls. The particle concentration exerted a negligible effect on the morphology and location of the erosion process. However, it exerted a pronounced influence on the erosion rate and the extent of the eroded area. They also found that air entrainment by the FSV could reduce the surface erosion at some instants. The synergistic erosion by cavitation and sediment is a complicated phenomenon [18,19,20] that should be further discussed. They also investigated the sediment erosion (SE) in a Francis turbine [21,22,23], which can be accurately predicted by the Tabakoff particle erosion model. As the guide vane opening increased, the wear of the runner blade heads increased, while the friction and wear on the outlet side of the blade surface decreased. They divided the SE of hydraulic turbines into general SE and local SE, which were caused by sand-laden flow and deterioration flow, respectively. SE can result in the dissipation of energy within the unit. The extent of this energy dissipation is directly proportional to the severity of the SE.
The erosion characteristics of T-pipes in offshore platforms were numerically investigated based on a mixture model, the renormalization group (RNG) k-ε model, the discrete phase model (DPM), and the Oka model by Shan et al. [24]. The particle size distribution of sand in the Bohai oil field is consistent with the Rosin–Rammler function. The most severe erosion is observed at the lower surface of the downstream branch, as well as at the point of connection between the inlet and outlet branches. This is due to a combination of gravitational and inertial forces exerted on the particulate matter in question. In their investigation of the dynamic erosion characteristics of a control valve in blackwater flash systems, Ou et al. [25] found that the valve core is predominantly influenced by low impact angles, resulting in a 56.4% reduction in the overall erosion rate of the valve. Wang et al. [26,27] studied the erosion characteristics of centrifugal pumps caused by mixed sand. The study revealed a positive correlation between the average erosion rates on different flow-through walls and the average mass concentration. Furthermore, sand diameter and density emerged as the key factors influencing this phenomenon. Hu et al. [28] investigated the erosion performance of a normally open arrow-type check valve spool. Their research findings indicated that the most significant erosion damage was observed at the lower end of the sealing surface, with the degree of damage increasing in line with the increase in the sealing surface angle. Zheng et al. [29] investigated the evolution of erosion hot spots under the higher particle flow rates of a drain valve and observed that the erosion hot spot consistently shifted from the original region to nearby regions. Furthermore, the actual flow rates were introduced in order to ascertain the failure route of the valve. Research on slurry flow erosion by Graham et al. [30] pointed out that erosion caused by a vortex can reach 80 times that of background erosion. Perera et al. [31] studied the erosion characteristics of Aluminium Oxide particle slurry flow on a butterfly valve using the DPM model and found that a smaller valve opening led to larger wear at the leading and trailing edges.
In summary, the erosion of hydraulic valves in previous studies was mostly based on particles in oil. There has been relatively little research on the erosion of balance valves in which seawater is a continuous phase and suspended sediment is a discrete phase. The properties of deep-sea sediments are also different from those of particles in oil. Therefore, this study focused on the suspended sediment erosion characteristics of the balance valve in a buoyancy regulation system, exploring the influences of various factors on the erosion rate under operating conditions in order to improve the reliability of the balance valve in a buoyancy-regulation system.

2. Numerical Model

2.1. Governing Equations and Phase Interactions

The governing equations are as follows:
ρ t + · ρ U = 0 t ( ρ U ) + ρ U U = p + ρ g + · T = + F
where U , p, ρ, g, T, and F are the velocity, pressure, density, dynamic viscosity, gravity, viscous deformation tensor and capillary force, respectively.
The turbulent flow in the balance valve is described using the Realizable k-ε model:
t ρ k + x j ρ k u j = x j μ + μ t σ k k x j + G k + G b ρ ε Y M t ρ ε + x j ρ ε u j = x j μ + μ t σ ε E x j + ρ C 1 S ε ρ C 2 ε 2 k + ν ε + C 1 ε ε k C 3 ε G b
where C 1 = max 0.43 , η η + 5 ,   η = S k ε ,   S = 2 S i j S i j . Gk represents the generation of turbulence kinetic energy due to the mean velocity gradients, Gb is the generation of turbulence kinetic energy due to buoyancy, and YM represents the contribution of the fluctuating dilatation in compressible turbulence, which was zero in this study. The enhanced wall function is employed to capture the fluid flow near the wall accurately.
The DPM model is used to track the particle movement, and the equation of the motion of a sediment particle is:
m s d U s d t = F D + F G + F P + F L + F V M
where FD is the drag force, FG is the gravity, FP is the pressure-gradient force, FL is the lift force, and FVM is the virtual mass force. FD, FG, and FP can be determined by:
F D = 18 24 C D m s μ R e s ρ s d s 2 ( U s f U s ) F G = m s g 1 ρ f ρ s F P = m s ρ f ρ s P x
where CD is the drag coefficient described by the spherical drag model. Res is the relative Reynolds number. In the context of general hydraulic systems, the lift forces (FL) and virtual mass forces (FVM) can be considered to be negligible.
The rebound coefficient with the collision angle is calculated according to the Grant model [32]. The normal bounce coefficient and tangential bounce coefficient en and et can be calculated as:
e n = 0.993 1.76 α + 1.56 α 2 0.49 α 3 e t = 0.988 1.66 α + 2.11 α 2 0.67 α 3
where α is defined as the angle between the particle and the wall at the moment of impact.
Surface erosion is caused in part by the impact on equipment walls by sea-sand particles entrained within a fluid flow. Wall erosion leads to equipment degradation, decreased performance, and reduced service life. The McLaury Erosion model [31] was used to predict the erosion rate of sediment in the buoyancy regulation system:
E R = A B h D V n f α
where A and D are empirical constants determined by the material, Bh is the Brinell’s hardness number of the wall material, V is the particle impact velocity, and f( α ) is the impact angle function, which can be calculated as:
f α = b α 2 + c α , f o r α α l i m x c o s 2 α s i n w α + y s i n 2 α + z , f o r α > α l i m
where α lim is the transition angle. The model constants for sand–steel erosion are given in Table 1.

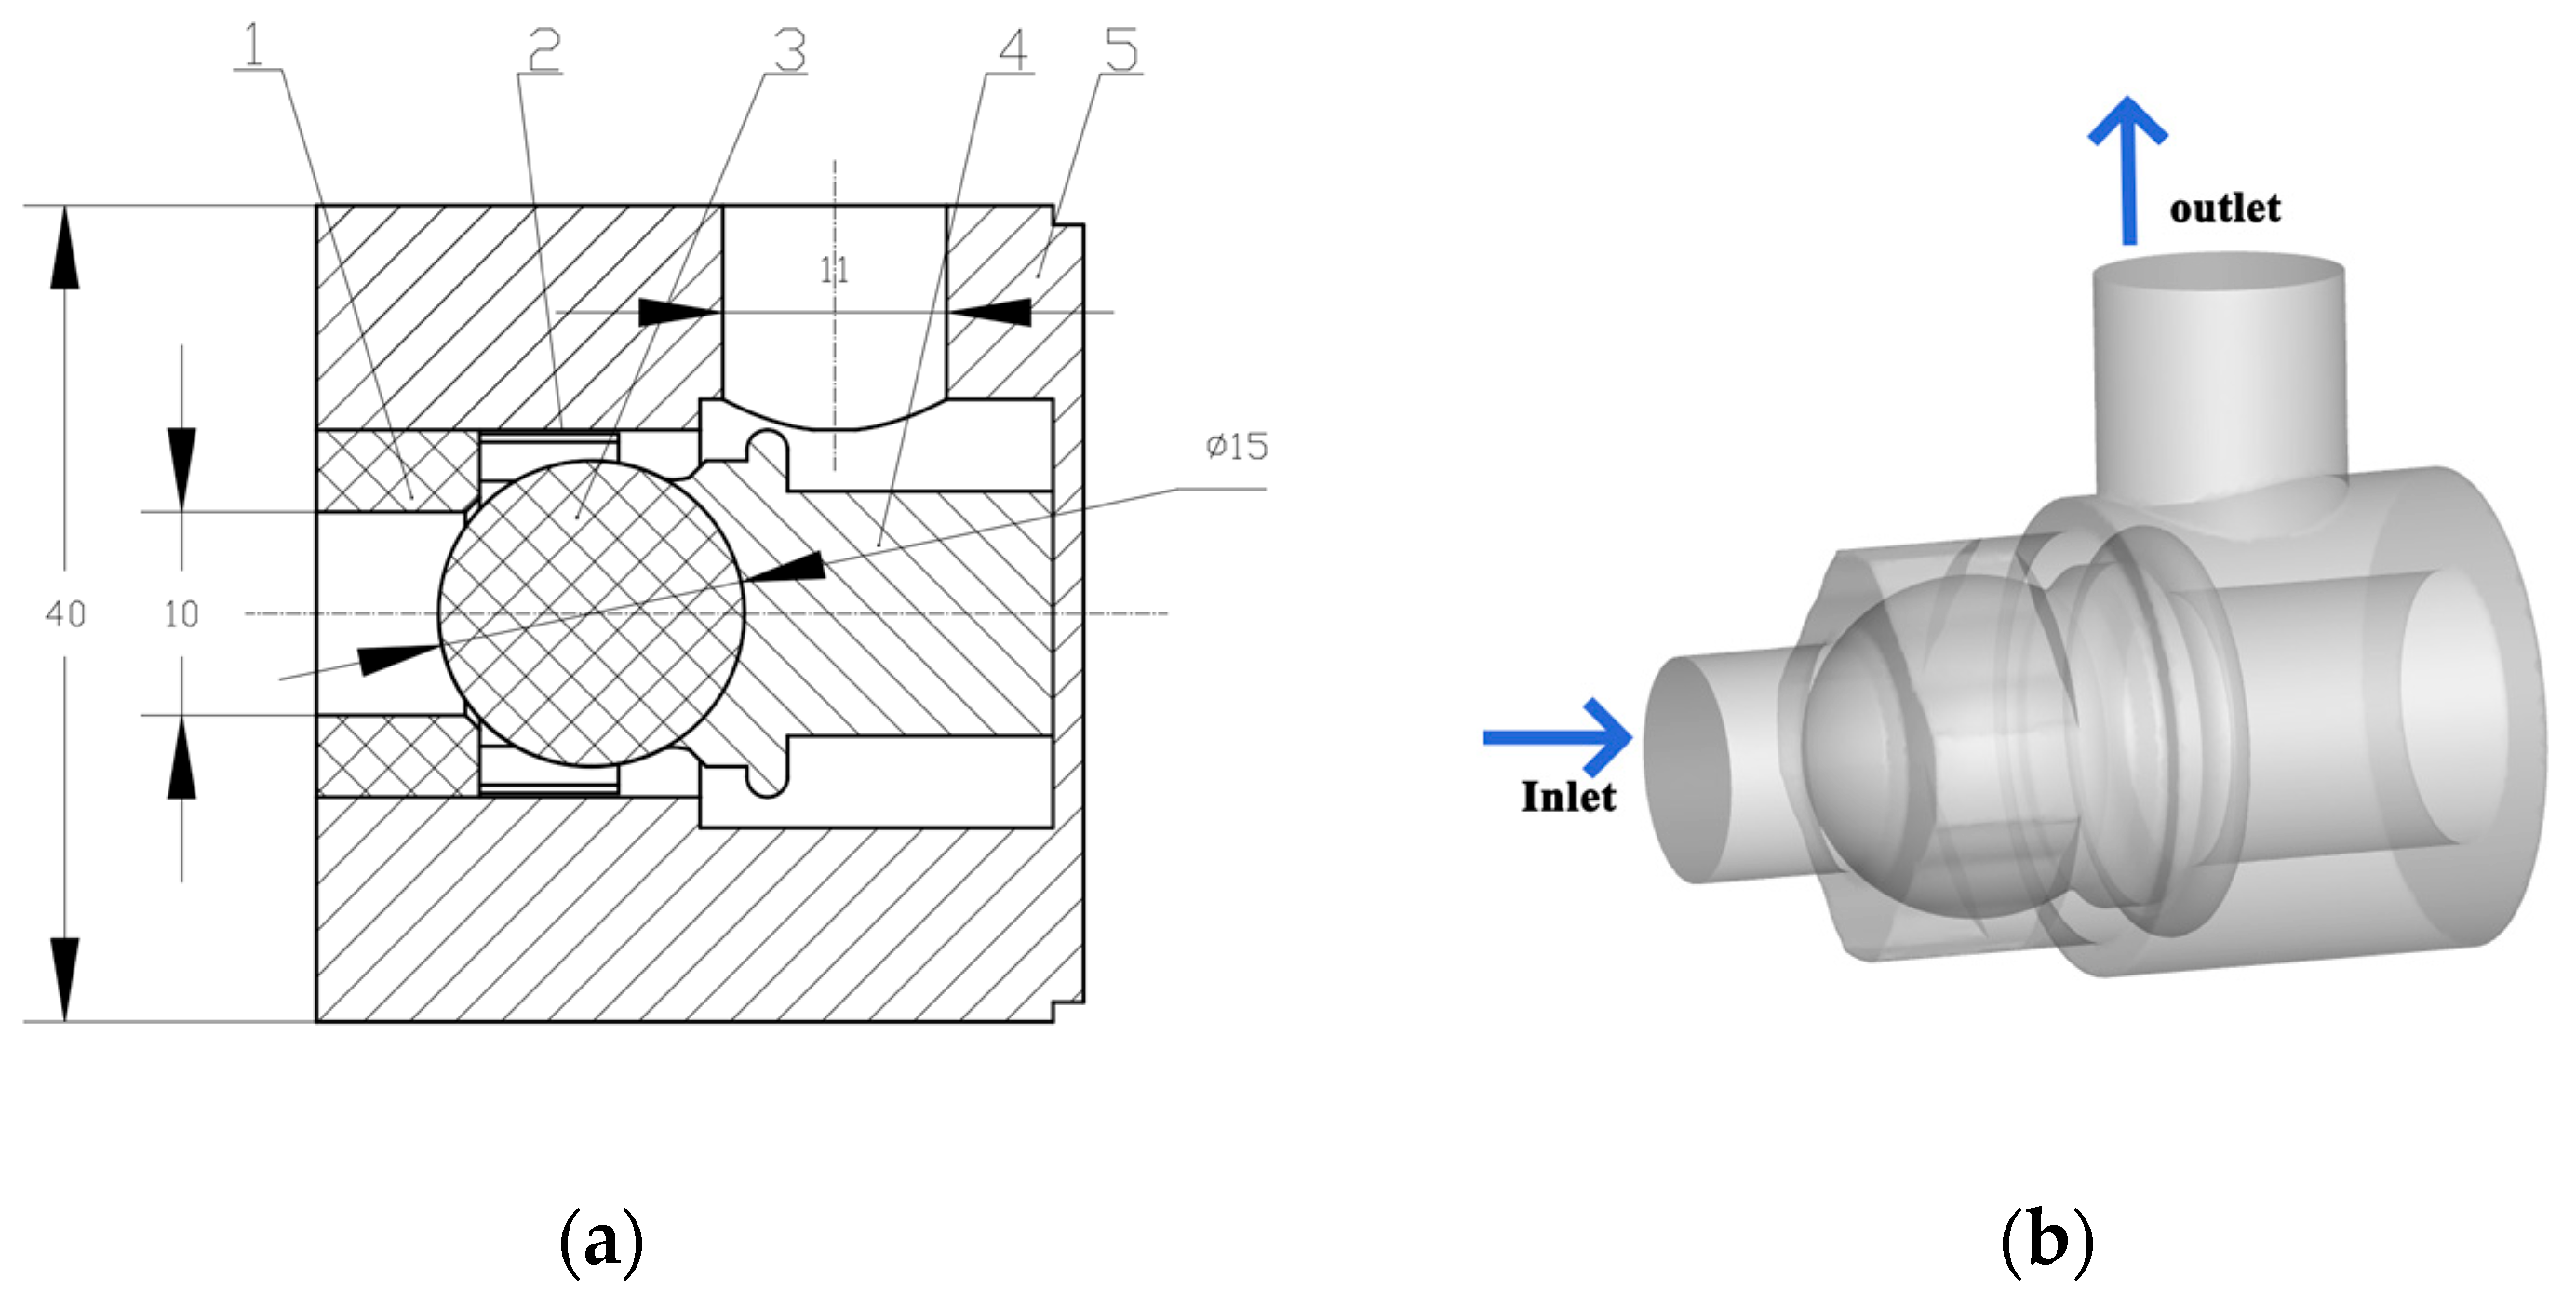
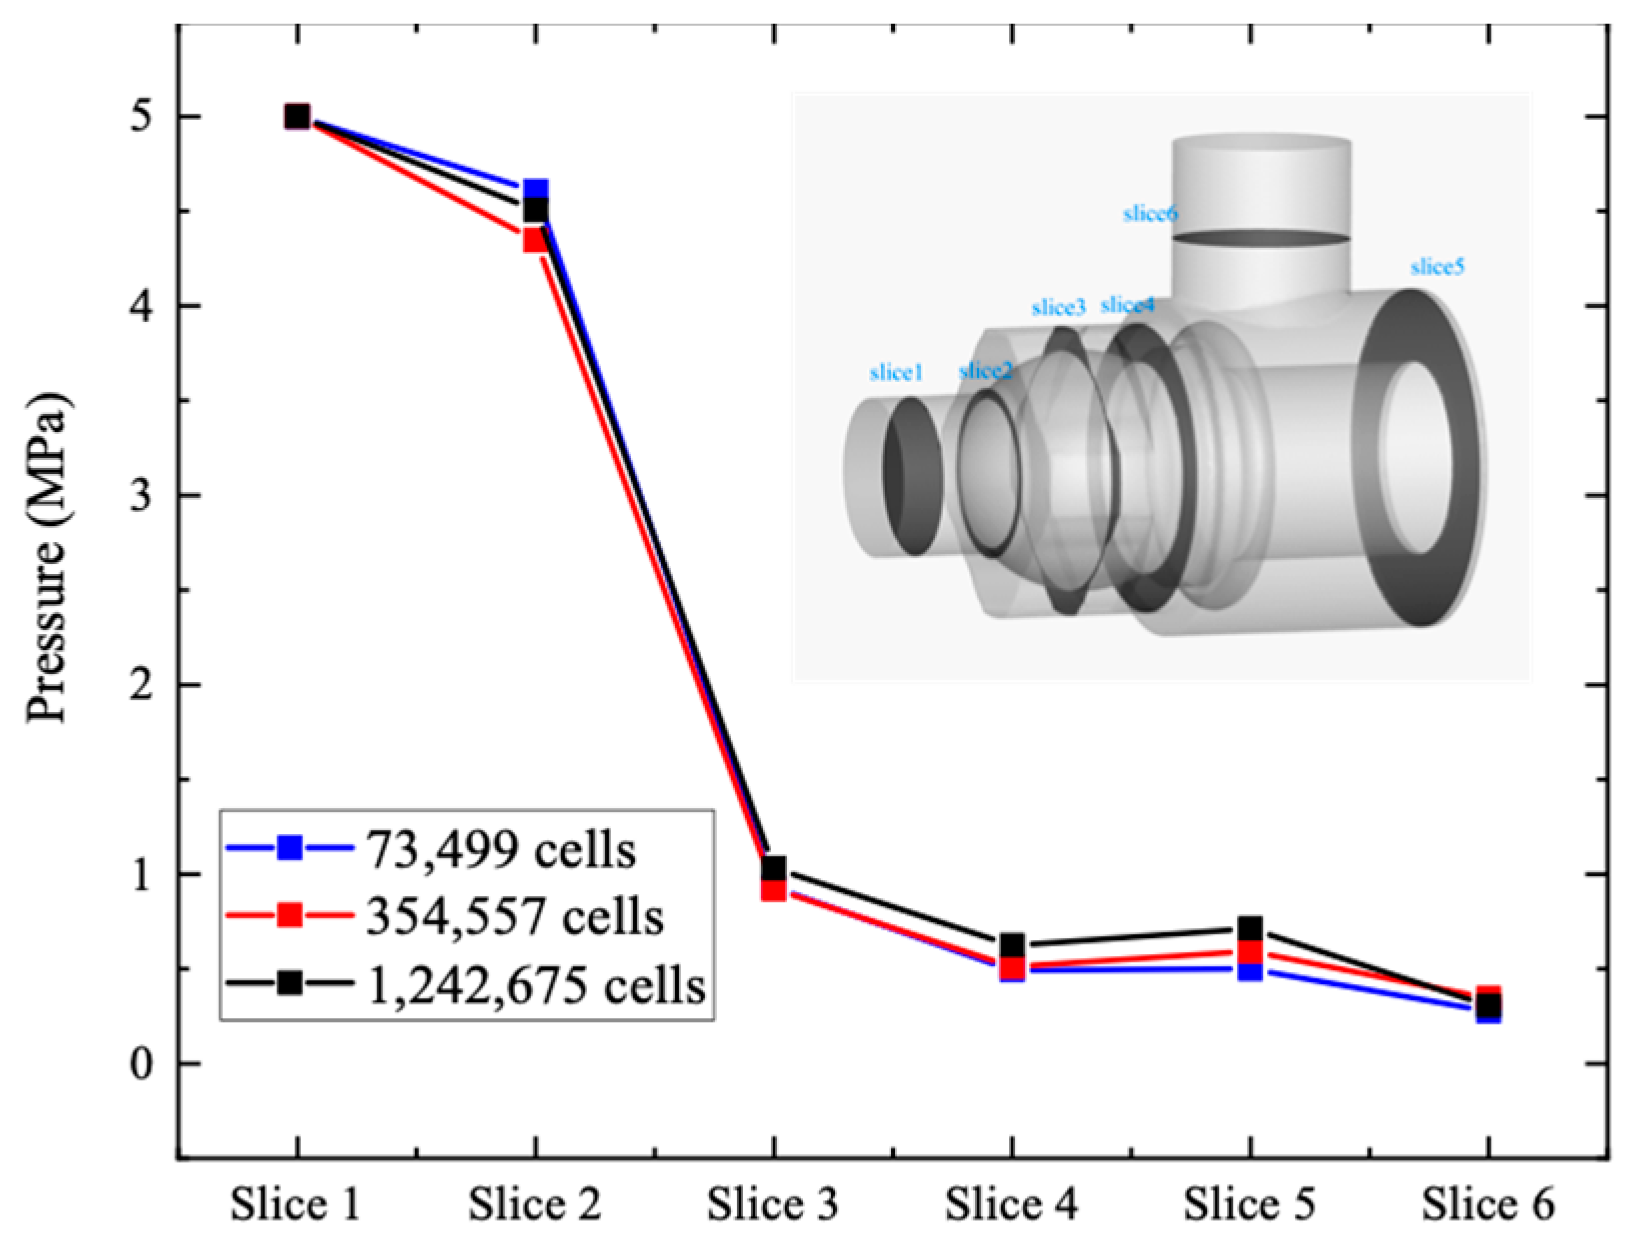
2.2. Physical Model and Mesh Generation

A seawater balance valve used to adjust the pressure of a deep-sea submersible was designed as shown in Figure 1a, where the key dimensions were marked. The fluid domain is shown in Figure 1b. Three mesh schemes were generated using ANSYS Meshing. A mesh independent test was done when the pressure difference was 5 MPa, as shown in Figure 2. Pressures at six slices were plotted, and the medium scheme with 354,457 cells was selected for further calculations.

2.3. Parameters and Boundary Conditions

The inlet and outlet were set as pressure boundaries, with the pressure difference varying from 5 to 20 MPa. The distribution of sediment at the inlet was set as uniform. The wall of the valve inside the flow channel was set as a non-slip wall boundary, with a reflect condition for sediment particles according to Equation (5). The wear of suspended sea sand in seawater is the most significant. Therefore, the erosion of the valve by sea sand was mainly considered in this study. The physical parameters of the seawater and sea sand are listed in Table 2. The sea sand particles were considered to be spherical, and the sea sand properties were determined according to the literature [33,34]. The valve opening varied from 27.8% to 100%. Sediment concentration refers to the mass of suspended sediment per cubic meter of seawater. The suspended sediment flow rate in the manuscript was calculated based on seawater flow rate and mass concentration.

2.4. Numerical Methods

Numerical simulations were conducted in parallel using ANSYS Fluent 2021 software. The fluid was assumed to be incompressible and steady when solving the pressure–velocity coupling. The PRESTO! scheme was adopted for the pressure term, and the second-order upwind scheme was used for the momentum terms. The first-order upwind scheme was adopted for the turbulent kinetic energy and turbulent dissipation rate.

3. Results and Discussion

The sediment erosion rate on the balance valve was examined by considering the effects of the valve pressure difference and openings, as well as the sediment density, size, and concentration. The contact type between the valve core and valve seat was line contact. Surface roughness and roundness errors of the valve core and valve seat can affect the sealing performance of the valve port. The sealing force acting on the valve core should first be sufficient to compensate for surface roughness and roundness errors between the valve core and valve seat in order to avoid gaps between them. Erosion can exacerbate roundness errors, so this study focused on analyzing the non-uniformity of the erosion-rate distribution on the sealing working edge and valve ball, as shown in Figure 3. It is worth noting that the guide sleeve was designed with a petal shape, meaning that the flow channels in the upper, lower, left, and right positions (θ = 0, π, −π/2, and π/2, respectively) are larger than those in other positions.

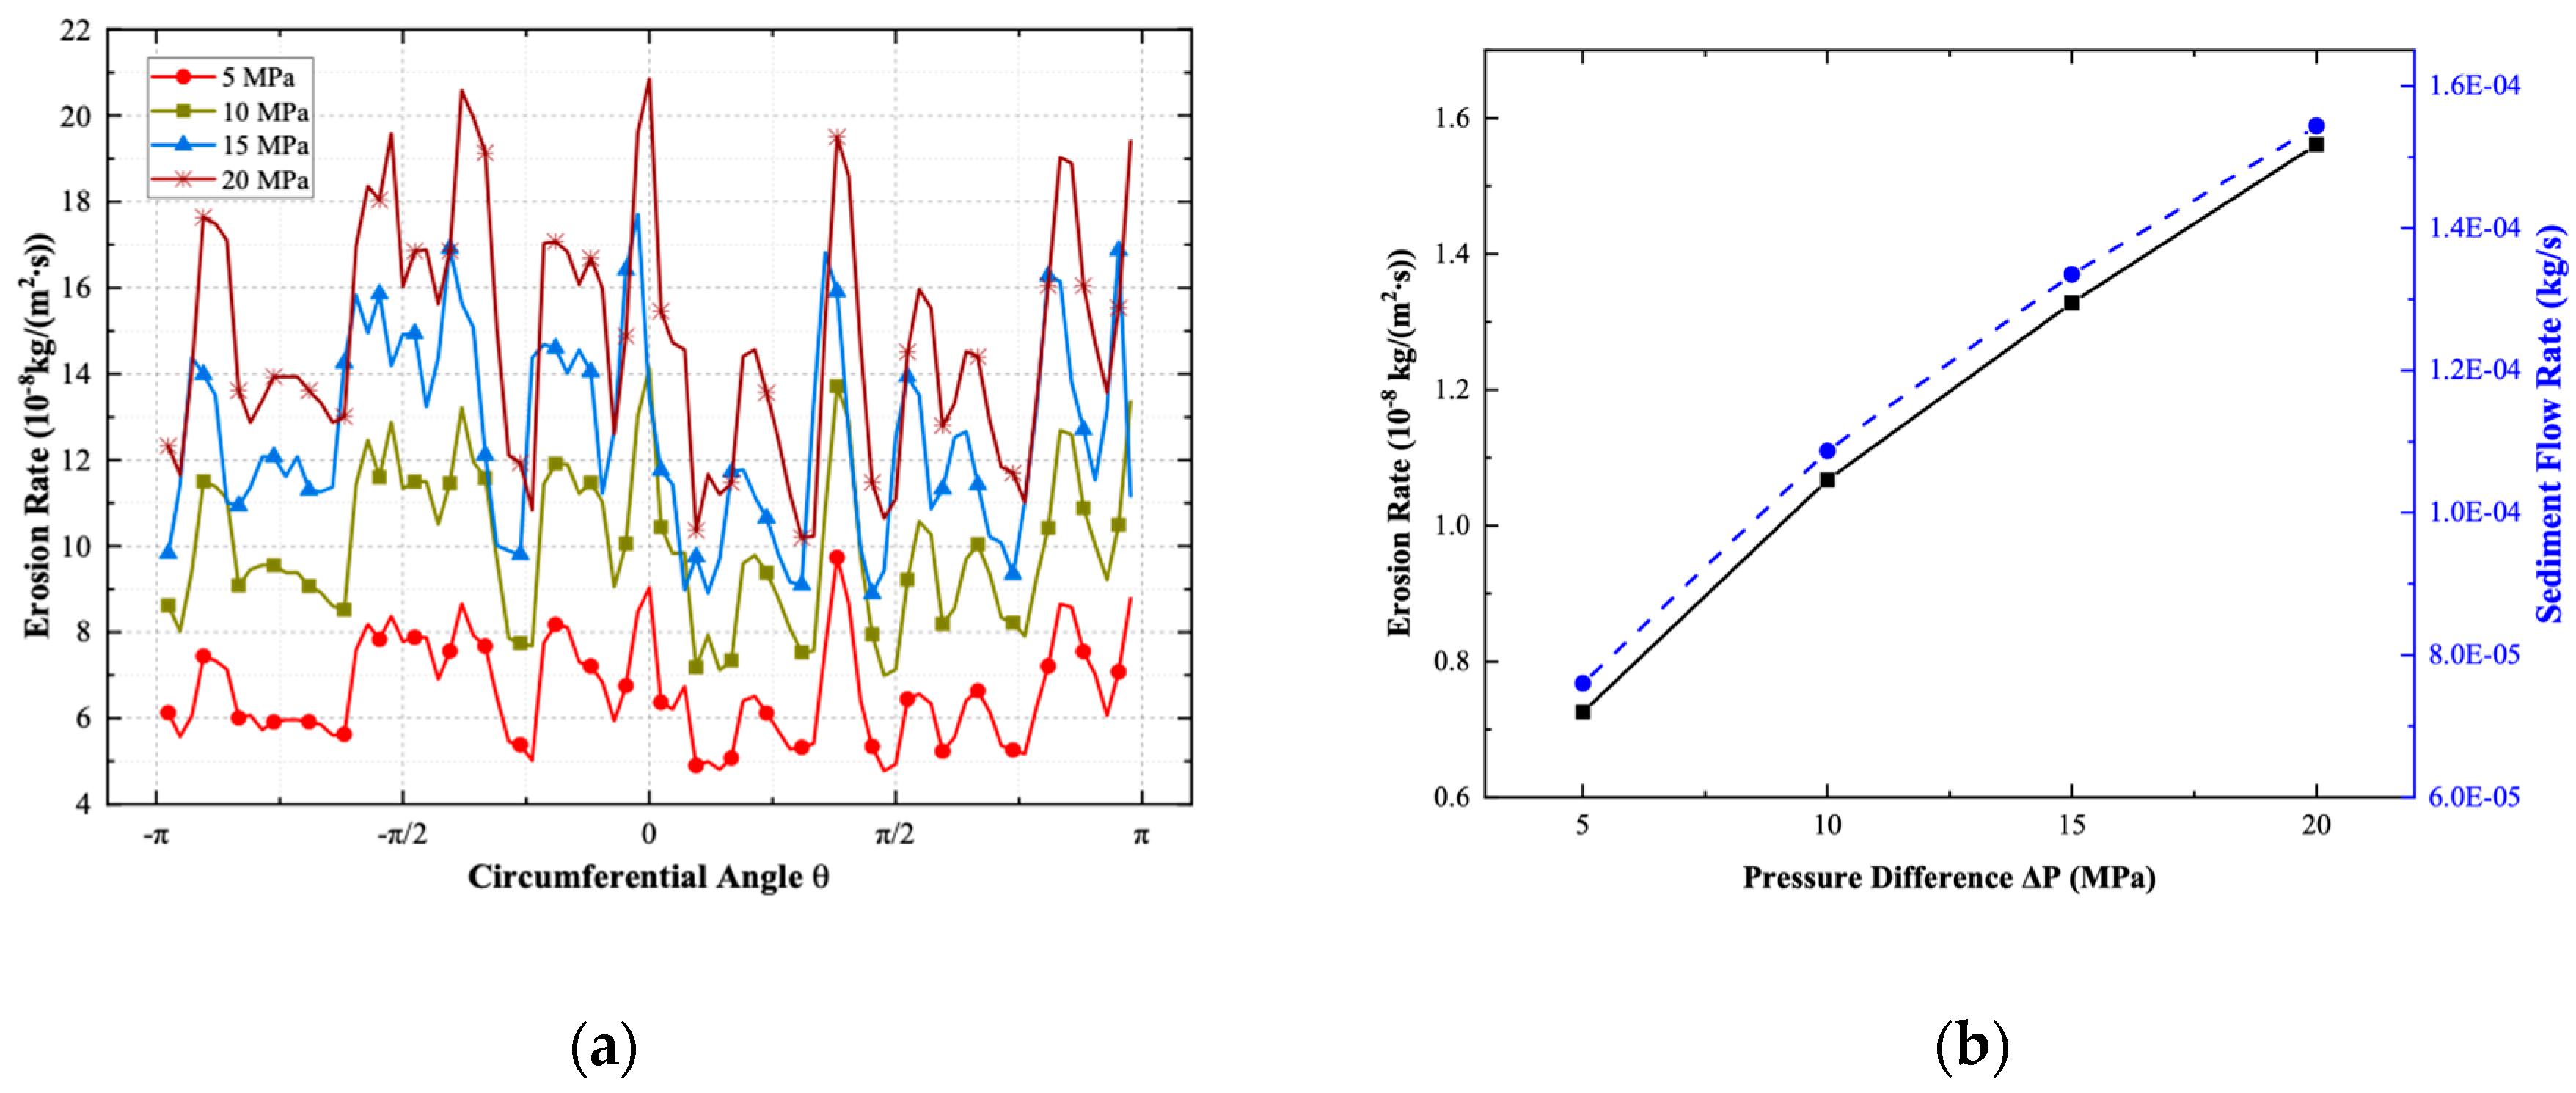
3.1. Effect of Pressure Difference

The pressure difference between the inlet and outlet of the seawater balance valve was relatively high. Figure 4 shows erosion rate contours at different pressure differences, ranging from 5 to 20 MPa. When the valve opening was determined, the seawater flow velocity and flow rate increased with the increase in the valve pressure difference, resulting in an increase in the inlet sediment mass flow rate. The movement velocity and kinetic energy of the sediment particles suspended in the seawater were higher, so the erosion rate at the working edge also increased accordingly.
Figure 5a shows the erosion rates at the working edge for different pressure differences. The erosion rate showed large values near the four petal positions, and the circumferential distribution exhibited asymmetry. The erosion rates on the left and right sides were not symmetric, due to the asymmetry of the seawater flow field on both sides. Overall, the structure of the balance valve was close to a curved pipe, with changes in the flow direction between the inlet and outlet. This not only caused vortex zones to appear on the inner and outer sides of the flow channel (θ = 0 and π, respectively) but also generated a secondary flow phenomenon [35], as shown in Figure 6a. The fluid moving along the curved channel experienced centrifugal force, which increased the pressure on the outer side and decreased the pressure on the inner side. The pressure changes on the left and right sides (θ = −π/2 and π/2) were not significant, so a pair of vortices were generated near the outlet [30]. The superposition of this secondary flow and the main stream caused particles to spiral along with the fluid, resulting in asymmetric erosion at the working edge.
Figure 5b shows the average erosion rate at the surface of the valve ball. The erosion rate increased with the pressure difference. When the concentration of sediment was constant, it was mainly caused by an increase in the flow rate. As shown on the right axis, the sediment flow rate was directly proportional to the square root of the pressure difference. Therefore, the erosion rate of the valve ball surface was also proportional to P 0.5 . It is not difficult to find from Figure 5a that the erosion rate at a certain point on the working edge also followed this characteristic.

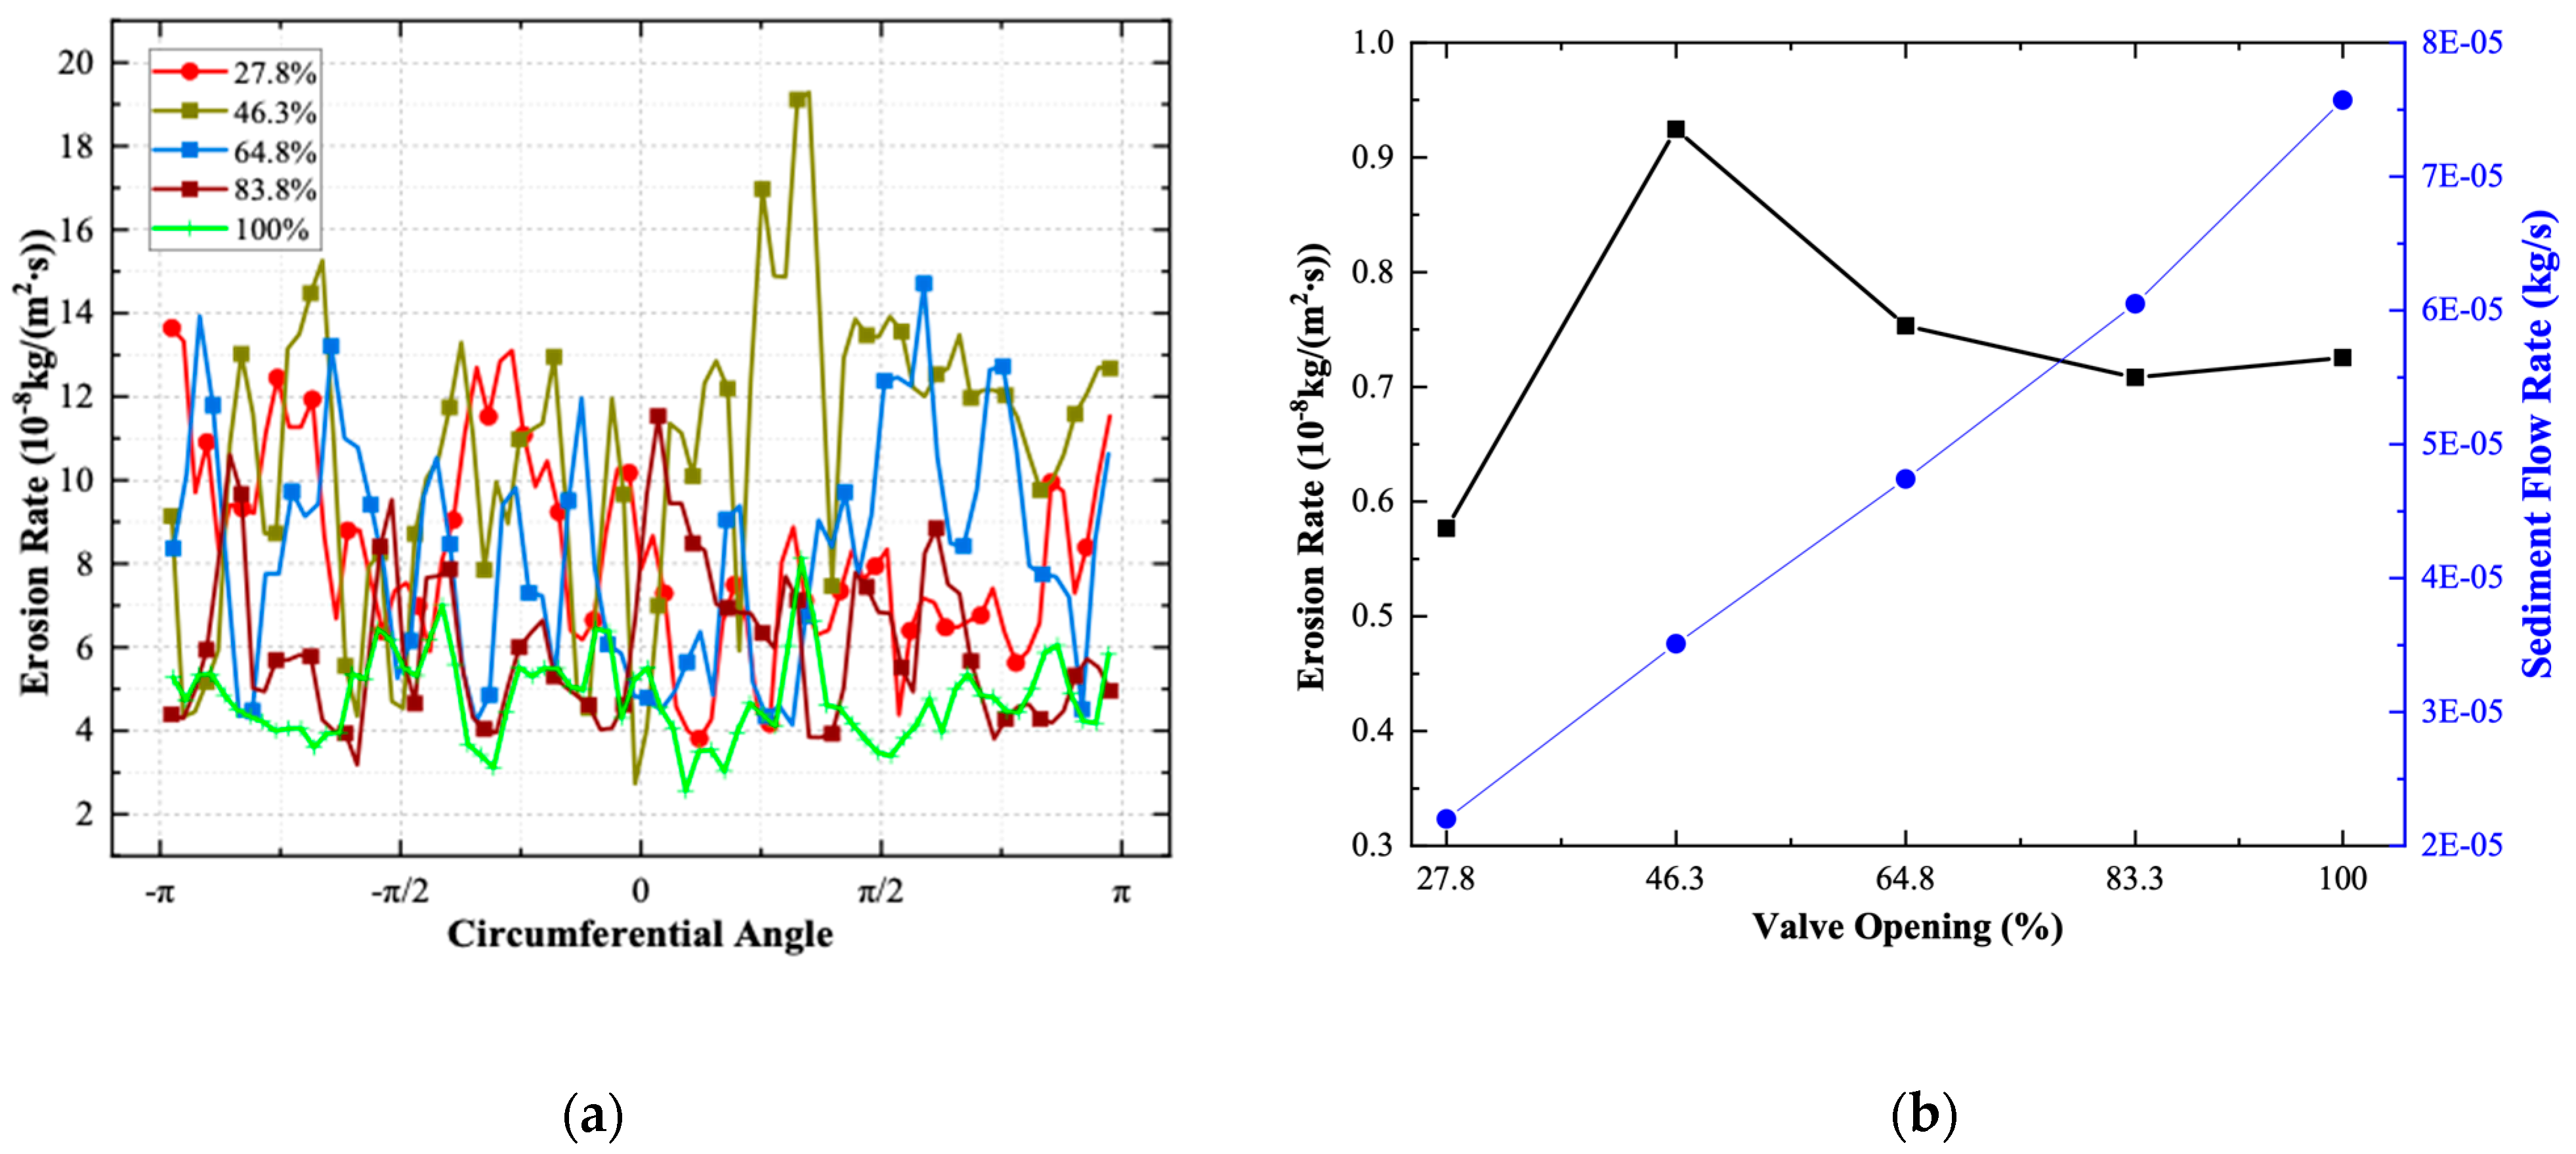
3.2. Effect of Valve Opening

The valve opening refers to the position of the valve ball when changing the throttling area of the flow channel, and it is usually related to valve flow coefficient (Cv). The larger the valve opening is, the stronger the overcurrent capacity is. In this study, the valve stem positions x = 0.15, 0.25, 0.35, 0.45, and 0.57 mm corresponded to 27.8%, 46.3%, 64.8%, 83.3%, and 100% valve openings, respectively.
Figure 7 shows erosion rate contours at different valve openings. When the valve opening was small, the erosion mainly occurred near the working edge. As the valve opening increased, the erosion rates at the front face of the valve ball and the guide sleeve wall increased, resulting in a more uniform distribution of the erosion rate. Regardless of the opening size, the maximum erosion rate occurred at the working edge, but the location of the maximum erosion rate was uncertain. The erosion rate at the working edge was much higher when the valve opening was 46.3% than at other openings. Except for the lower erosion rate at the four petals, the high erosion rate areas were almost connected into four arcs. At a working edge with a θ of approximately 60°, the erosion rate reached 1.93 × 10⁻⁷ kg/(m2 × s), which was much higher than the ER value at the other openings. Figure 8b also shows that the erosion rate of the valve ball was the highest when the valve opening was 46.3%. At this valve opening, the sediment flowing through the valve has both high flow velocity and high flow rate [36]. As the valve opening increased, the erosion rate first increased and then decreased, which was consistent with the experimental observations of Liu et al. [1]. When the pressure difference was determined, the amount of suspended sediment passing through the valve increased linearly with the valve opening (as shown on the right axis of Figure 8b), thereby increasing the collision rate with the valve ball. As the valve opening further increased, although the particle mass flow rate was relatively high, most particles followed the main stream of the liquid flow and moved downstream from the middle area of the valve opening, resulting in a decrease in the number of collisions between particles and the working edge and an increase in the number of secondary collisions with the wall surface. As shown in Figure 7e, the erosion rates on the wall surface (outer circle) and the side of the valve ball were greater when the valve opening was larger. Therefore, the erosion rate of the valve ball slightly increased when the valve was fully open, compared to that at an opening of 83.3%.

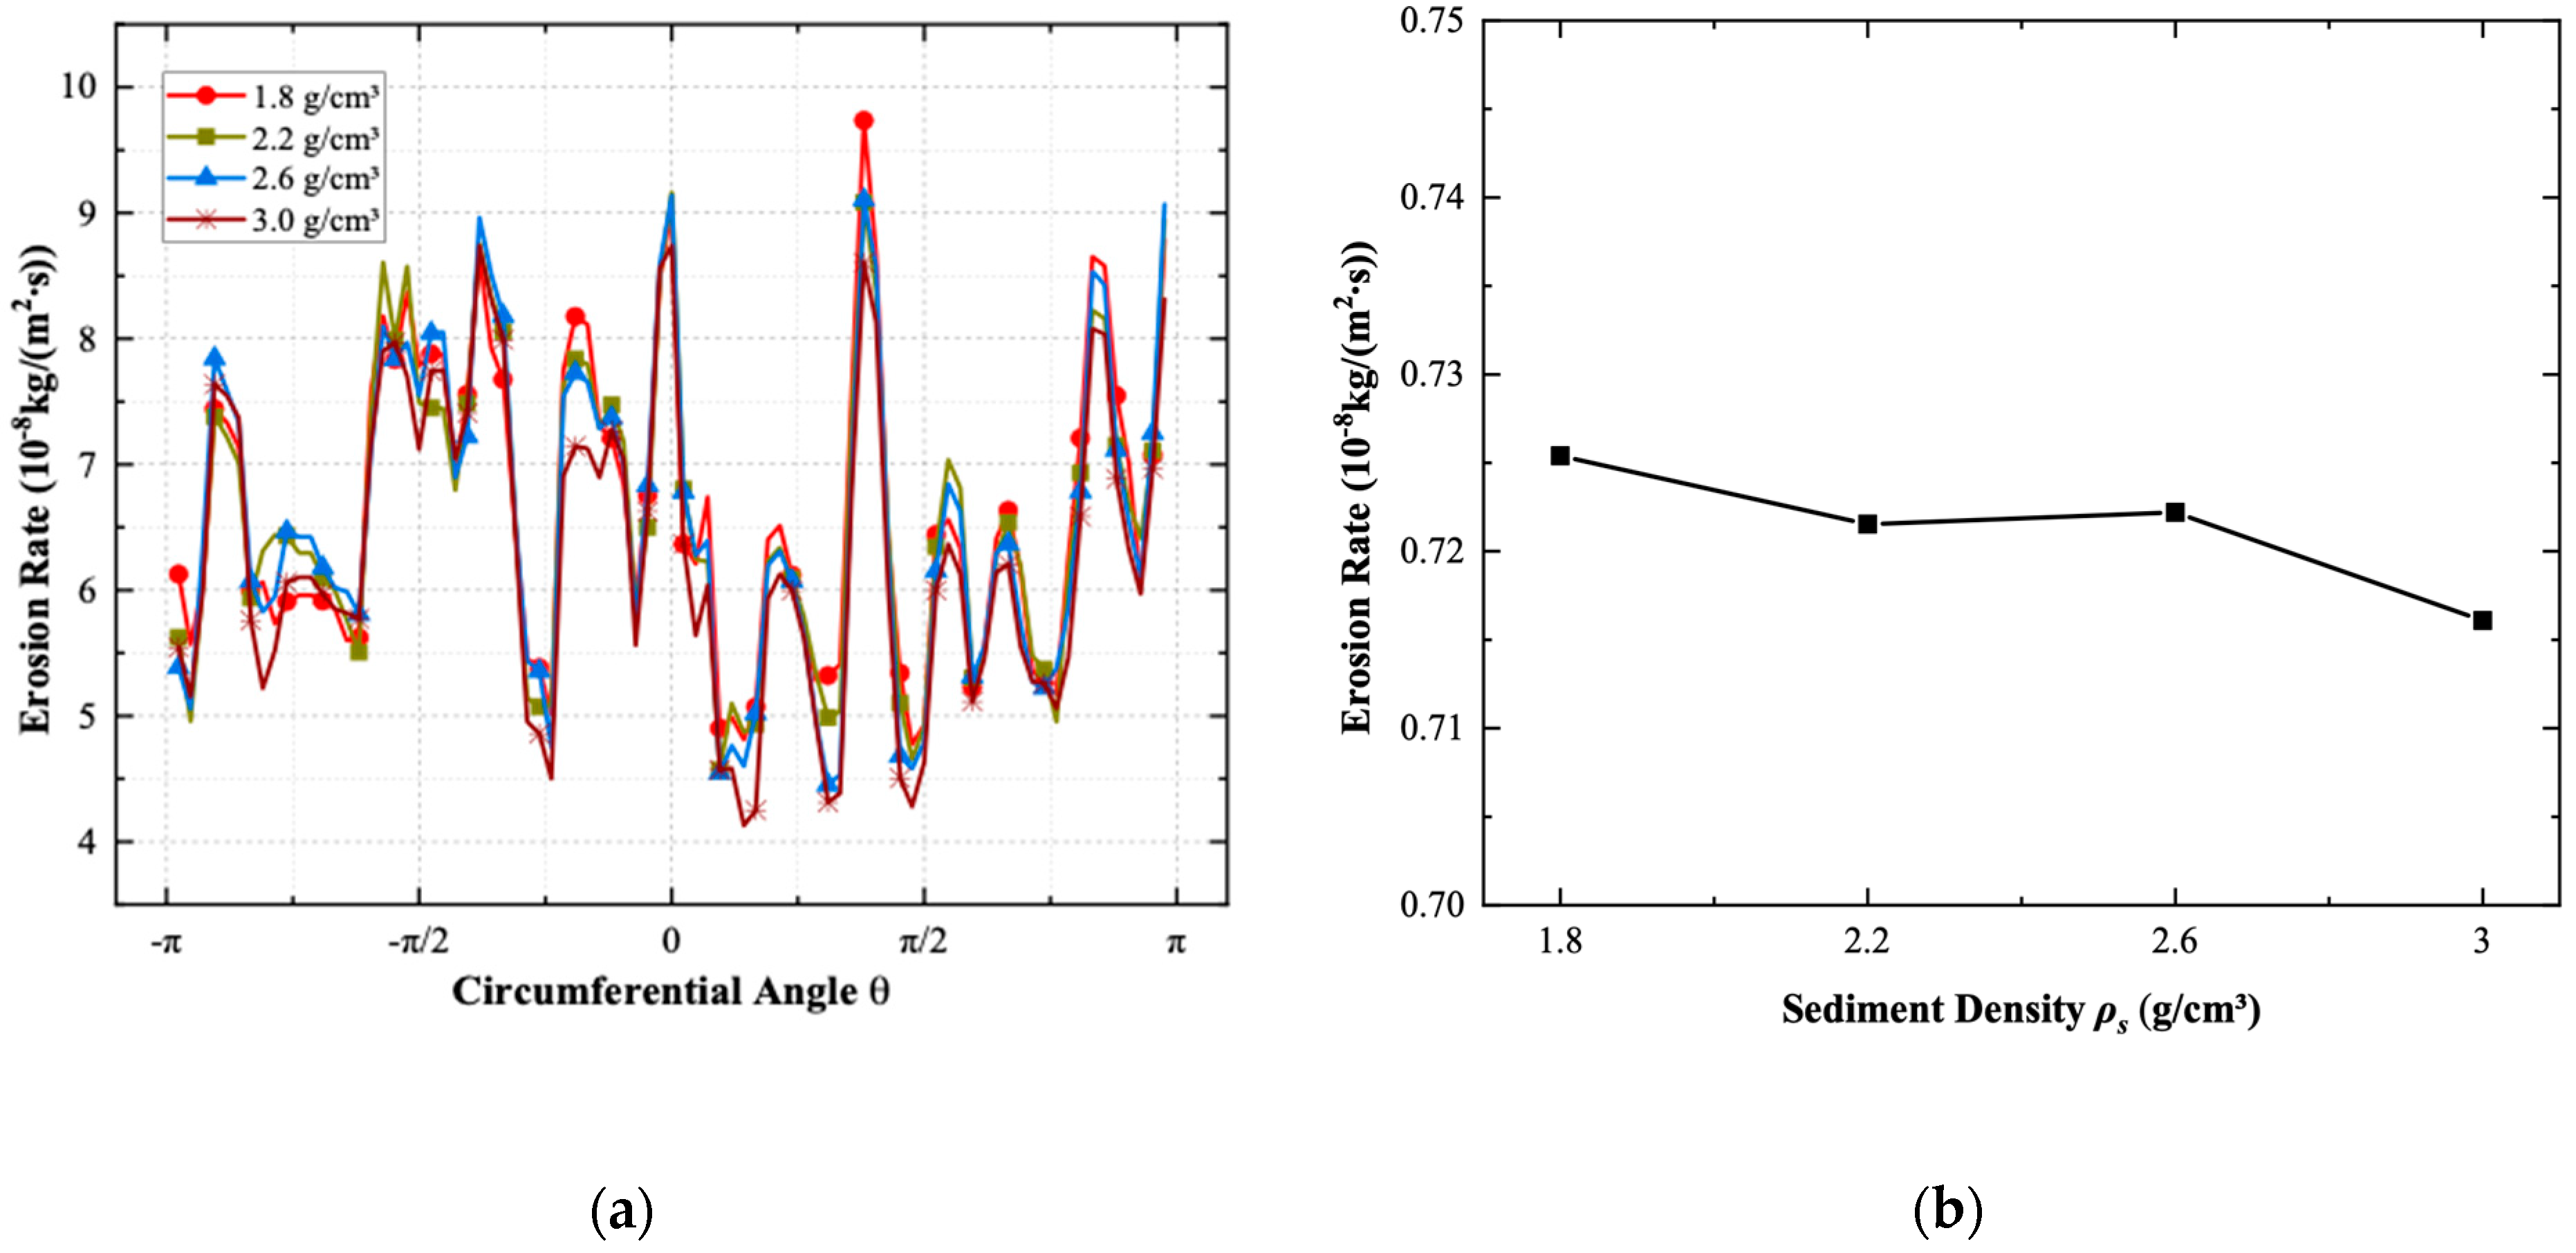
3.3. Effect of Sediment Density

Figure 9 shows erosion rate contours with different sediment densities, ranging from 1.8 to 3.0 g/cm3. The impact of the suspended sediment density on the erosion rate was not significant. The erosion rate at the working edge and at the surface of the valve ball in Figure 10 also prove this. The higher the density was, the greater the inertia of the particles became, causing them to be less affected by other forces, thereby reducing the probability of collision between the particles and the working edge and surface of the valve ball. However, due to the low density of the sediments, the impact of density on the erosion at the valve ball surface was not significant, with a variation rate of only 1.29%.

3.4. Effect of Sediment Diameter

Figure 11 shows erosion rate contours with different sand diameters, ranging from 20 to 50 µm. As the sediment size increased, the erosion rate of suspended sediments on the front surface of the valve ball increased, and it also increased the secondary collisions on the guide sleeve wall and the valve ball. As shown in Figure 11d, significant erosion rates were observed on the wall at circumferential angles of 0°, −60°, and 140°. In contrast, the probability of sediment collision with the working edge decreased slightly as the sediment size increased when passing through the valve port. Overall, the erosion rate on the working edge was relatively uniform, not exceeding 10 kg/(m2 ∗ s). Figure 12b shows that the erosion rate on the valve ball increased with the increase in the sediment size, and the erosion rate was roughly proportional to the sixth power of the sediment diameter. The cubic power of the diameter corresponded to the mass of the particles. Therefore, an increase in the particle diameter not only had a mass effect but also an increase in collisions with the wall. The following behavior of large particles was worse, resulting in a smaller reflection angle after the first impact on the front of the valve ball and increasing the probability of colliding with the wall and the side of the valve ball again. Based on the power-law relationship between the valve ball erosion rate and the particle diameter, as well as the fact that large particles were more likely to cause a blockage in the flow channel, it is recommended to install a seawater pretreatment device at the inlet to prevent large sediments from entering the valve.

3.5. Effect of Sediment Concentration

Figure 13 shows erosion rate contours with different sediment concentrations. The erosion rate on the surface and working edge of the valve ball increased with the increase in the sediment concentration. Figure 14a shows that when the concentration increased from 50 to 350 g/m3, the peak erosion rate at the working edge increased from 10 to 70 kg/(m2 ∗ s). Figure 14b reveals that the erosion rate at the valve ball surface increased linearly with the sediment concentration. Considering that there was more sediment near the deep-sea seabed, there would be significant turbid currents during deep-sea operations in this area [37], where the concentration of suspended sediment would increase exponentially. In addition, the higher the current velocity was, the higher the concentration of suspended sediments became. Therefore, the long-term operation of a buoyancy regulation system in high concentration areas should be avoided as much as possible.

3.6. Parameter Significance on Sediment Erosion

The effects of five investigated parameters (Pm) on sediment erosion have been discussed above. Here, we define an index called the relative significance (RS) to compare the significance of the investigated parameters on sediment erosion:
RS = E R max / E R min P m max / P m min ,
where ERmax and ERmin are the maximum and minimum erosion rates at the working edge, respectively, and Pmmax and Pmmin are the larger and smaller values of the parameter when the erosion rates at the working edge were the highest and the lowest, respectively. The index represents the proportion of parameters that need to be changed for an equivalent improvement in the sediment erosion rate. Table 3 lists the relative significance values and assessments of the investigated parameters in descending order. RSave and RSmax are the relative significances of the average and highest erosion rates at the working edge, respectively, because the determination of the valve sealing force should take into account both the maximum and average erosion of the working edge.
We considered an RS smaller than 0.8 to correspond to a moderate effect and an RS larger than 0.8 to correspond to a significant effect. As shown in Table 3, the RSave and RSmax values were very close for each investigated parameter. Hence, RSave is used to discuss the effects on sand erosion. The maximum relative significance was 1.032 for the elevated sediment concentration. The buoyancy regulation system should avoid long-term operation in environments with high concentrations of suspended sediments. Another significant effect is the valve opening, which suggests that the buoyancy regulation system should avoid half-open operating conditions. The pressure difference is another operating parameter that had a moderate effect on the working edge erosion. Reducing the pressure difference can reduce the erosion rate by reducing the flow rate. However, if a balance valve is used in a buoyancy regulation system, its total flow rate is determined when the regulation target is set. Reducing the pressure difference will prolong the adjustment time, resulting in longer erosion times. Therefore, adjusting the pressure difference may not be an effective method for regulating total erosion. The decrease in the particle diameter and density increased the erosion of the working edge, with RSave values of 0.437 and 0.630, respectively. Considering that sediment particles with smaller diameters and lower densities are more likely to be suspended in seawater, the effect of the sediment properties cannot be ignored. It is worth noting that the sediment density had little effect on the surface of the valve ball, while the sediment diameter had a significant effect on the erosion of the valve ball surface. Therefore, it is necessary to consider strengthening the wear resistance of the valve seat and valve ball surface that constitute the working edge, in order to improve the working life of the valve.

4. Conclusions

Numerical analysis of the sediment erosion of the balance valve in a buoyancy regulation system was performed. A numerical model for the two-phase flow inside the balance valve was constructed based on the discrete phase model. The sediment erosion rate on the balance valve was discussed, and the effects of five parameters were considered. The effects of the sediment concentration and valve opening were found to be significant, while the effects of the pressure difference, sediment density and size were found to be moderate. The erosion rate, according to the numerical results, increased linearly with the sediment concentration, so long-term operation of a buoyancy regulation system in high-concentration areas should be avoided. The erosion rate was the highest when the valve opening was 46.3%, so half-open operating conditions are not recommended. The erosion rate was proportional to the square root of the pressure difference. However, adjusting the pressure difference may not be an effective method for regulating the total erosion. The superposition of the secondary flow and the main stream caused particles to spiral along with the fluid, resulting in asymmetric erosion at the working edge. The erosion rate on the working edge decreased with the increase in the sediment size. Conversely, the erosion rate on the valve ball surface increased with the sixth power of the sediment size. Considering that large particles are more likely to cause a blockage, it is recommended to install a seawater pretreatment device at the inlet to prevent large sediments from entering the valve and to improve the working life of the buoyancy regulation system.

Author Contributions

Conceptualization, H.L. and F.Y.; methodology, C.Y.; software, Y.L. and L.M.; validation, H.L. and F.Y.; investigation, H.L.; resources, S.Y.; data curation, L.W.; writing—original draft preparation, H.L.; writing—review and editing, F.Y.; visualization, Y.L.; supervision, C.Y.; project administration, C.Y.; funding acquisition, H.L. All authors have read and agreed to the published version of the manuscript.

Funding

This research was funded by the National Key Research and Development Program of China (No. 2021YFC2800600), the National Natural Science Foundation of China (No. 12172152), and the Jiangsu Key Laboratory of Advanced Food Manufacturing Equipment & Technology (FMZ202305).

Institutional Review Board Statement

Not applicable.

Informed Consent Statement

Not applicable.

Data Availability Statement

Data are contained within the article.

Conflicts of Interest

The authors declare no conflicts of interest.

Nomenclature

List of Symbols
Amaterial constant
BhBrinell’s hardness number of wall material (N/mm2)
C s sediment concentration (g/m3)
CDdrag coefficient
C v valve flow coefficient
d s sediment diameter (μm)
Dmaterial constant
ennormal bounce coefficient
ettangential bounce coefficient
Eenergy (J)
Fcapillary force (N)
f(γ) impact angle function
FDdrag force (N)
FGgravity force (N)
FPpressure-gradient force (N)
F L lift force (N)
Fvmvirtual mass forces
ggravity acceleration (m/s2)
Gkgeneration of turbulence kinetic energy due to the mean velocity gradients
Gbgeneration of turbulence kinetic energy due to buoyancy
kturbulence kinetic energy
Ppressure (Pa)
Q s sediment flow rate (kg/s)
Tviscous deformation tensor
vvelocity (m/s)
Vparticle impact velocity (m/s)
YMcontribution of the fluctuating dilatation in compressible turbulence
Greek Symbols
α angle between the particle and the wall when it hits the wall (rad)
ρdensity (kg/m3)
ρ s sediment density (kg/m3)
μdynamic viscosity (N·s/m2)
τ viscous deformation tensor
ϵ turbulent dissipation rate (m2/s3)
σ stresses (Pa)
θ circumferential angle (rad)
γangle of impact (rad)
Abbreviations
CFDcomputational fluid dynamics
DEMdiscrete element method
FSVfree surface vortex
DPMdiscrete phase model
ERerosion rate
ERmaxmaximum erosion rate at the working edge (kg/(m2·s))
ERminminimum erosion rate at the working edge (kg/(m2·s))
OkaOka model
RNGrenormalization group
MMMixture Model
Pmmaxlarger values of the parameter when the erosion rate at the working edge is the highest
Pmminssmaller values of the parameter when the erosion rate at the working edge is the lowest
RSrelative significance

References

  1. Liu, X.q.; Liu, F.; Ji, H.; Li, N.; Wang, C.; Lin, G. Particle erosion transient process visualization and influencing factors of the hydraulic servo spool valve orifice. Flow Meas. Instrum. 2023, 89, 102273. [Google Scholar] [CrossRef]
  2. Moses, D.; Haider, G.; Henshaw, J. An investigation of the failure of a 1/4” ball valve. Eng. Fail. Anal. 2019, 100, 393–405. [Google Scholar] [CrossRef]
  3. Huang, H.; Zhu, C.; Zhang, W.; Hao, S.; Zhang, S.; Leng, J.; Wei, Y. Design and analysis of the multifunctional oil-injection equipment for deep-sea hydraulic systems. IEEE Access 2020, 8, 143679–143691. [Google Scholar] [CrossRef]
  4. Du, R.; Zhou, Y.; Zhang, A.; Du, Z.; Zhang, X.; Yuan, X. An optimized E/CRC erosion model of round particles for hydraulic spool valves with Euler–Lagrange two-phase simulation. Tribol. Trans. 2021, 64, 795–812. [Google Scholar] [CrossRef]
  5. Li, Y.; Du, J.; Lan, Y.; Du, H.; Huang, H. Numerical analysis of the factors influencing the erosion of the valve port of a high-speed on/off valve. Appl. Sci. 2022, 12, 6212. [Google Scholar] [CrossRef]
  6. Liu, X.; Ji, H.; Liu, F.; Li, N.; Zhang, J.; Ren, W. Particle motion and erosion morphology of the spool orifice in an electro-hydraulic servo valve under a small opening. Proc. Inst. Mech. Eng. Part C J. Mech. Eng. Sci. 2022, 236, 3160–3173. [Google Scholar] [CrossRef]
  7. Liu, X.; Ji, H.; Min, W.; Zheng, Z.; Wang, J. Erosion behavior and influence of solid particles in hydraulic spool valve without notches. Eng. Fail. Anal. 2020, 108, 104262. [Google Scholar] [CrossRef]
  8. Liu, X.; Ji, H.; Liu, F.; Li, N.; Wang, C.; Lin, G. Experimental study on the correlation between erosion microstructure and performance degradation of hydraulic servo spool valve. Surf. Topogr. Metrol. Prop. 2023, 11, 015005. [Google Scholar] [CrossRef]
  9. Liu, X.; Ji, H.; Liu, F.; Lin, G.; Wang, C.; Li, N. Erosion microscopic morphology and formation mechanism of hydraulic servo spool valve. Proc. Inst. Mech. Eng. Part C J. Mech. Eng. Sci. 2023, 237, 4017–4035. [Google Scholar] [CrossRef]
  10. Li, D.; Liu, X.; Liao, H.; Bing, L.; Hou, P.; Nie, R.; Jiao, Z. A prediction model of fluid–solid erosion wear in hydraulic spool valve orifice. Wear 2024, 540–541, 205235. [Google Scholar] [CrossRef]
  11. Yin, Y.; Yuan, J.; Guo, S. Numerical study of solid particle erosion in hydraulic spool valves. Wear 2017, 392–393, 174–189. [Google Scholar] [CrossRef]
  12. He, X.; Zhu, B.; Liu, Y.; Jiang, Z. Study on a seawater hydraulic piston pump with check valves for underwater tools. Proc. Inst. Mech. Eng. Part A J. Power Energy 2012, 226, 151–160. [Google Scholar] [CrossRef]
  13. Lin, Z.; Yu, H.; Yu, T.; Zhu, Z. Numerical study of solid–liquid two-phase flow and erosion in ball valves with different openings. Adv. Powder Technol. 2022, 33, 103542. [Google Scholar] [CrossRef]
  14. Cheng, W.; Fan, H.; Cheng, W.; Shao, C. Investigation on wear induced by solid-liquid two-phase flow in a centrifugal pump based on EDEM-Fluent coupling method. Flow Meas. Instrum. 2024, 96, 102542. [Google Scholar] [CrossRef]
  15. Song, X.; Wang, Z. Numerical prediction of the effect of free surface vortex air-entrainment on sediment erosion in a pump. Proc. Inst. Mech. Eng. Part A J. Power Energy 2022, 236, 1297–1308. [Google Scholar] [CrossRef]
  16. Song, X.; Qi, D.; Xu, L.; Shen, Y.; Wang, W.; Wang, Z.; Liu, Y. Numerical simulation prediction of erosion characteristics in a double-suction centrifugal pump. Processes 2021, 9, 1483. [Google Scholar] [CrossRef]
  17. Song, X.; Yao, R.; Shen, Y.; Bi, H.; Zhang, Y.; Du, L.; Wang, Z. Numerical prediction of erosion based on the solid-liquid two-phase flow in a double-suction centrifugal pump. J. Mar. Sci. Eng. 2021, 9, 836. [Google Scholar] [CrossRef]
  18. Sun, J.; Ge, X.; Zhou, Y.; Liu, D.; Liu, J.; Li, G.; Zheng, Y. Research on synergistic erosion by cavitation and sediment: A review. Ultrason. Sonochemistry 2023, 95, 106399. [Google Scholar] [CrossRef] [PubMed]
  19. Gohil, P.P.; Saini, R.P. Coalesced effect of cavitation and silt erosion in hydro turbines—A review. Renew. Sustain. Energy Rev. 2014, 33, 280–289. [Google Scholar] [CrossRef]
  20. Han, L.; Guo, C.; Yuan, Y.; Li, D.; Liu, Y.; Iranzo, A.; Qin, D. Investigation on sediment erosion in bucket region of Pelton turbine considering cavitation. Phys. Fluids 2024, 36, 023305. [Google Scholar] [CrossRef]
  21. Song, X.; Luo, Y.; Wang, Z. Mechanism of the influence of sand on the energy dissipation inside the hydraulic turbine under sediment erosion condition. Energy 2024, 294, 130794. [Google Scholar] [CrossRef]
  22. Song, X.; Zhou, X.; Song, H.; Deng, J.; Wang, Z. Study on the effect of the guide vane opening on the band clearance sediment erosion in a Francis turbine. J. Mar. Sci. Eng. 2022, 10, 1396. [Google Scholar] [CrossRef]
  23. Wang, J.; Song, X.; Wang, H.; Tao, R.; Wang, Z. Numerical prediction of erosion of Francis turbine in sediment-laden flow under different heads. Processes 2023, 11, 2523. [Google Scholar] [CrossRef]
  24. Shan, Y.; Jing, J.; Zhang, Z.; Sun, J.; Wang, N.; Zhuang, L.; Guo, Y. Investigation of erosion behavior of particle-fluid flow in offshore platform T-pipes. Int. J. Press. Vessel. Pip. 2024, 209, 105174. [Google Scholar] [CrossRef]
  25. Ou, G.F.; Wang, C.G.; Jin, H.Z. Erosion characteristics and flashing flow of high-differential-pressure control valves: A numerical study using an erosion-coupled dynamic mesh. J. Appl. Fluid Mech. 2024, 17, 559–570. [Google Scholar] [CrossRef]
  26. Wang, Y.; Wang, X.; Chen, J.; Li, G.; Liu, H.; Xiong, W. An experimental insight into dynamic characteristics and wear of centrifugal pump handling multi-size particulate slurry. Eng. Fail. Anal. 2022, 138, 106303. [Google Scholar] [CrossRef]
  27. Wang, Y.; Wang, X.; Chen, J.; Li, G.; Liu, H.; Xiong, W. Numerical simulation of the influence of mixed sand on erosion characteristics of centrifugal pump. Eng. Comput. 2022, 39, 2053–2080. [Google Scholar] [CrossRef]
  28. Hu, G.; Wu, W.; Xu, J.; Liao, H. Research on the erosion performance of a new normally open arrow-type check valve spool. J. Fail. Anal. Prev. 2022, 22, 1725–1732. [Google Scholar] [CrossRef]
  29. Zheng, S.; Cheng, H.; Bie, Q.; Zhong, L.; Tong, J. Erosion hot spots of drain valve under higher particle flow rates. Nat. Gas Ind. B 2022, 9, 289–307. [Google Scholar] [CrossRef]
  30. Graham, L.J.W.; Wu, J.; Short, G.; Solnordal, C.B.; Wong, C.Y.; Brown, G.; Celliers, O.; Whyte, D. Laboratory modelling of erosion damage by vortices in slurry flow. Hydrometallurgy 2017, 170, 43–50. [Google Scholar] [CrossRef]
  31. Perera, P.; Hayward, K.; Guzzomi, F.; Vafadar, A. Erosion wear characterisation of an open Ductile Iron butterfly valve subjected to Aluminium Oxide particle slurry flow. Tribol. Int. 2024, 191, 109199. [Google Scholar] [CrossRef]
  32. Grant, G.; Tabakoff, W. Erosion prediction in turbomachinery resulting from environmental solid particles. J. Aircr. 1975, 12, 471–478. [Google Scholar] [CrossRef]
  33. Peacock, T.; Ouillon, R. The fluid mechanics of deep-Sea mining. Annu. Rev. Fluid Mech. 2023, 55, 403–430. [Google Scholar] [CrossRef]
  34. Gillard, B.; Purkiani, K.; Chatzievangelou, D.; Vink, A.; Iversen, M.H.; Thomsen, L. Physical and hydrodynamic properties of deep sea mining-generated, abyssal sediment plumes in the Clarion Clipperton Fracture Zone (eastern-central Pacific). Elem. Sci. Anthr. 2019, 7, 5. [Google Scholar] [CrossRef]
  35. Kim, J.; Yadav, M.; Kim, S. Characteristics of secondary flow induced by 90-degree elbow in turbulent pipe flow. Eng. Appl. Comput. Fluid Mech. 2014, 8, 229–239. [Google Scholar] [CrossRef]
  36. Pandey, A.; Ghimire, A.; Bijukchhe, P.L.; Pokharel, N.; Kapali, A.; Chitrakar, S. Numerical simulation of erosion in Pelton spear valve at different openings. J. Phys. Conf. Ser. 2023, 2629, 012019. [Google Scholar] [CrossRef]
  37. Leal Filho, W.; Abubakar, I.R.; Nunes, C.; Platje, J.; Ozuyar, P.G.; Will, M.; Nagy, G.J.; Al-Amin, A.Q.; Hunt, J.D.; Li, C. Deep seabed mining: A note on some potentials and risks to the sustainable mineral extraction from the oceans. J. Mar. Sci. Eng. 2021, 9, 521. [Google Scholar] [CrossRef]
Figure 1. Structure of the balance valve: (a) sectional view and key dimensions, 1—valve seat, 2—guide sleeve, 3—valve core, 4—valve stem, 5—valve body. and (b) inside flow channel.
Jmse 12 01344 g001
Figure 2. Pressure evolution for different grid schemes.
Jmse 12 01344 g002
Figure 3. Working edge and its circumferential angle.
Jmse 12 01344 g003
Figure 4. Erosion rate contours at different pressure differences ( ρ s = 1.8 g/cm3, d s = 20 μ m ,   c s = 50 g/m3, valve opening = 100%). (a) p = 5 MPa, Q s = 7.6 × 10⁻⁵ kg/s, (b) p = 10 MPa, Q s = 1.087 × 10⁻⁴ kg/s, (c) p = 15 MPa, Q s = 1.335 × 10⁻⁴ kg/s, (d) p = 20 MPa, Q s = 1.544 × 10⁻⁴ kg/s.
Jmse 12 01344 g004aJmse 12 01344 g004b
Figure 5. Erosion rates at the working edge and surface of the valve ball at different pressure differences: (a) working edge distribution and (b) valve ball surface.
Jmse 12 01344 g005
Figure 6. Flow field and its secondary flow: (a) vortex at the section near the outlet and (b) typical particle trajectories.
Jmse 12 01344 g006
Figure 7. Erosion rate contours at different valve openings ( p = 5 MPa, d s = 20 μ m ,   ρ s = 1.8 g/cm3, c s = 50 g/m3). (a) valve opening = 27.8%, Q s = 2.2 × 10⁻⁵ kg/s, u i n = 5.61 m/s, (b) valve opening = 46.3%, Q s = 3.51 × 10⁻⁵ kg/s, u i n = 8.95 m/s, (c) valve opening = 64.8%, Q s = 4.74 × 10⁻⁵ kg/s, u i n = 12.06 m/s, (d) valve opening = 83.3%, Q s = 6.05 × 10⁻⁵ kg/s, u i n = 15.4 m/s, (e) valve opening = 100%, Q s = 7.57 × 10⁻⁵ kg/s, u i n = 19.29 m/s.
Jmse 12 01344 g007
Figure 8. Erosion rates at the working edge and surface of the valve ball at different valve openings: (a) working edge distribution and (b) valve ball surface.
Jmse 12 01344 g008
Figure 9. Erosion rate contours with different sediment densities ( p = 5 MPa, d s = 20 μ m , c s = 50 g/m3, valve opening = 100%). (a) ρ s = 1.8 g/cm3, (b) ρ s = 2.2 g/cm3, (c) ρ s = 2.6 g/cm3, (d) ρ s = 3.0 g/cm3.
Jmse 12 01344 g009aJmse 12 01344 g009b
Figure 10. Erosion rates at the working edge and surface of the valve ball with different sediment densities: (a) working edge distribution and (b) valve ball surface.
Jmse 12 01344 g010
Figure 11. Erosion rate contours with different sediment diameters ( p = 5 MPa, ρ s = 1.8 g/cm3, c s = 50 g/m3, valve opening = 100%). (a) d s = 20   μ m , (b) d s = 30   μ m , (c) d s = 40   μ m , (d) d s = 50   μ m .
Jmse 12 01344 g011
Figure 12. Erosion rates at the working edge and surface of the valve ball with different sediment diameters: (a) working edge distribution and (b) valve ball surface.
Jmse 12 01344 g012
Figure 13. Erosion rate contours with different sediment concentrations ( p = 5 MPa, ρ s = 1.8 g/cm3, d s = 20 μ m , valve opening = 100%). (a) c s = 50 g/m3, Q s = 7.6 × 10⁻⁵ kg/s, (b) c s = 150 g/m3, Q s = 2.28 × 10⁻⁴ kg/s, (c) c s = 250 g/m3, Q s = 3.8 × 10⁻⁴ kg/s, (d) c s = 350 g/m3, Q s = 5.32 × 10⁻⁴ kg/s.
Jmse 12 01344 g013aJmse 12 01344 g013b
Figure 14. Erosion rates at the working edge and surface of the valve ball with different sediment concentrations: (a) working edge distribution and (b) valve ball surface.
Jmse 12 01344 g014
Table 1. McLaury Erosion Model Constants.
ConstantsValues
α lim15°
A1.997 × 10−7
D−0.59
n1.73
b−13.3
c7.85
x1.09
y0.125
w1.0
Table 2. Physical parameters of the seawater and sea sand.
ParametersValue
Seawater density1040 kg/m3
Dynamic viscosity0.001 Pa·s
Sediment densities1800–3000 kg/m3
Sediment diameters20–50 μm
Sediment concentrations50–350 g/(m3 seawater)
Table 3. Relative enhancement and assessment of investigated parameters on sediment erosion at the working edge (listed in descending order).
Investigated ParametersRSaveRSmaxOverall Effect Assessment
Sediment concentration (↑)1.0331.032Significant
Valve opening (↑ then ↓)0.9210.963Significant
Sediment density (↓)0.6300.668Moderate
Pressure difference (↑)0.5590.535Moderate
Sediment diameter (↓)0.4370.401Moderate
Disclaimer/Publisher’s Note: The statements, opinions and data contained in all publications are solely those of the individual author(s) and contributor(s) and not of MDPI and/or the editor(s). MDPI and/or the editor(s) disclaim responsibility for any injury to people or property resulting from any ideas, methods, instructions or products referred to in the content.

