Article

Exploring Fault Geometry and Holocene Deformation of the Littoral Fault Zone within the Seismic Gap South of Greater Bay Area, China

1
Guangdong Provincial Key Lab of Geodynamics and Geohazards, School of Earth Sciences and Engineering, Sun Yat-sen University, Guangzhou 510275, China
2
Southern Marine Science and Engineering Guangdong Laboratory, Zhuhai 519000, China
3
Department of Geological Sciences, San Diego State University, San Diego, CA 92182, USA
4
School of Science, Shantou University, Shantou 515063, China
*
Author to whom correspondence should be addressed.
J. Mar. Sci. Eng. 2024, 12(8), 1350; https://doi.org/10.3390/jmse12081350
Submission received: 22 July 2024 / Revised: 2 August 2024 / Accepted: 7 August 2024 / Published: 8 August 2024

Abstract

:
Over the past 424 years, the Littoral Fault Zone (LFZ), located offshore of the South China coast, has experienced four destructive earthquakes (M ≥ 7). These events have resulted in an approximately 700 km seismic gap centered on the Greater Bay Area of China, home to over 70 million people. Despite previous studies on deeper crustal structures and geodynamic processes, the shallow structural architecture and recent tectonic activity of the LFZ within the seismic gap remain poorly understood due to limited offshore geophysical investigations. Here, we present new offshore geophysical data to explore the shallow crustal architecture and Holocene activity of the LFZ within this seismic gap. Multichannel seismic data reveal that the LFZ comprises a high-angle listric main normal fault along with several secondary normal faults. The main fault trends northeast and dips southeast in the shallow crustal architecture, serving as the basin-controlling fault in the north of the Pearl River Mouth Basin, with accumulated displacements ranging from 1.5 to 1.8 km. Furthermore, analysis of single-channel seismic data, and 14C dating results from the borehole, indicate that the most recent movement of the main fault occurred within the last ~10,000 years, with minimum vertical offsets of 1.2 m. Based on these findings, we emphasize the LFZ’s potential to generate a significant earthquake, estimated at Mw 7.0–7.5, within the inferred seismic gap. Our study highlights the potential earthquake hazard posed by the LFZ to the Greater Bay Area of China, while also providing valuable insights for the assessment of active submarine faults worldwide.

1. Introduction

The boundaries of continental and oceanic plates are the primary locations for earthquakes, with over 90% of global earthquake activity occurring in these regions [1]. The earthquake activity of these areas is relatively well known, benefiting from extensive research support [2]. In contrast to these plate boundary areas, continental interior regions with low seismic activity and limited historical earthquake records are often overlooked by researchers, thereby impeding the assessment of earthquake hazard in these areas. Among continental interior regions, offshore zones hold particular significance due to their proximity to densely urbanized areas. Determining the location of active faults, understanding their geometric structure, and evaluating their activity are crucial for assessing earthquake hazards in these regions. However, many of these offshore active faults remain poorly understood due to limitations in offshore geophysical surveys.
The Littoral Fault Zone (LFZ) stands out as the most active offshore fault along the northern extensional continental margin of the South China Sea (SCS, Figure 1), delineating the boundary between the thinned continental block of the SCS and the typical continental block of South China [3]. This fault zone has experienced a complex tectonic evolution related to rifting and the spreading of the South China Sea [4,5,6]. The most recent activity of the LFZ is characterized by a series of historically destructive earthquakes, including four M ≥ 7.0 (M7.0 in 1600, M8.0 in 1604, M7.5 in 1605, and M7.25 in 1918) and eighteen M 6.0–7.0 earthquakes since the 17th century from historical seismicity catalogues (Figure 1) [7,8,9,10]. It is noteworthy that the region facing the Guangdong–Hong Kong–Macau Greater Bay Area has not experienced earthquakes larger than magnitude 7.0 in the past 424 years. This region is a part of the seismic gap which extends approximately 800 km, and it faces the densely populated area that accommodates over 70 million people. The seismic gap hypothesis suggests that a segment of an active plate boundary that, relative to the rest of the boundary, has not recently ruptured is considered a seismic gap and is more likely to produce an earthquake in the future [11]. Therefore, it is necessary to conduct a quantitative assessment of the seismic hazard posed by the LFZ in the seismic gap.
Despite the significance of the structural and recent activity of the LFZ within the seismic gap, there has been a paucity of studies in this region. Previous research on offshore active faults, including the LFZ, has primarily relied on satellite imagery, aeromagnetism, seismicity [12,13], and surface rupture studies [8,14,15]. Recent geophysical surveys have provided insights into crustal velocity models beneath the LFZ [3,16,17,18,19,20], but many questions remain unanswered, including the precise location of the LFZ [9,21,22,23,24]. Given the LFZ’s proximity to the densely populated and economically developed Greater Bay Area and its history of large earthquakes, systematic studies of its structural and recent activity are urgently needed.
In this paper, we present a quantitative analysis of the LFZ’s structures and Holocene activity in the seismic gap near the Greater Bay Area of China, using a combination of multiple data sources, including multi-channel and single-channel seismic reflection profiles, and continuously cored boreholes. These data sources enable us to image the structural architecture of the LFZ at various depths, offering insights into fault geometry, offsets, and recent rupture activity. Additionally, borehole surveys and dating results help constrain the ages of the observed offset features and assess seismic hazards in the region.

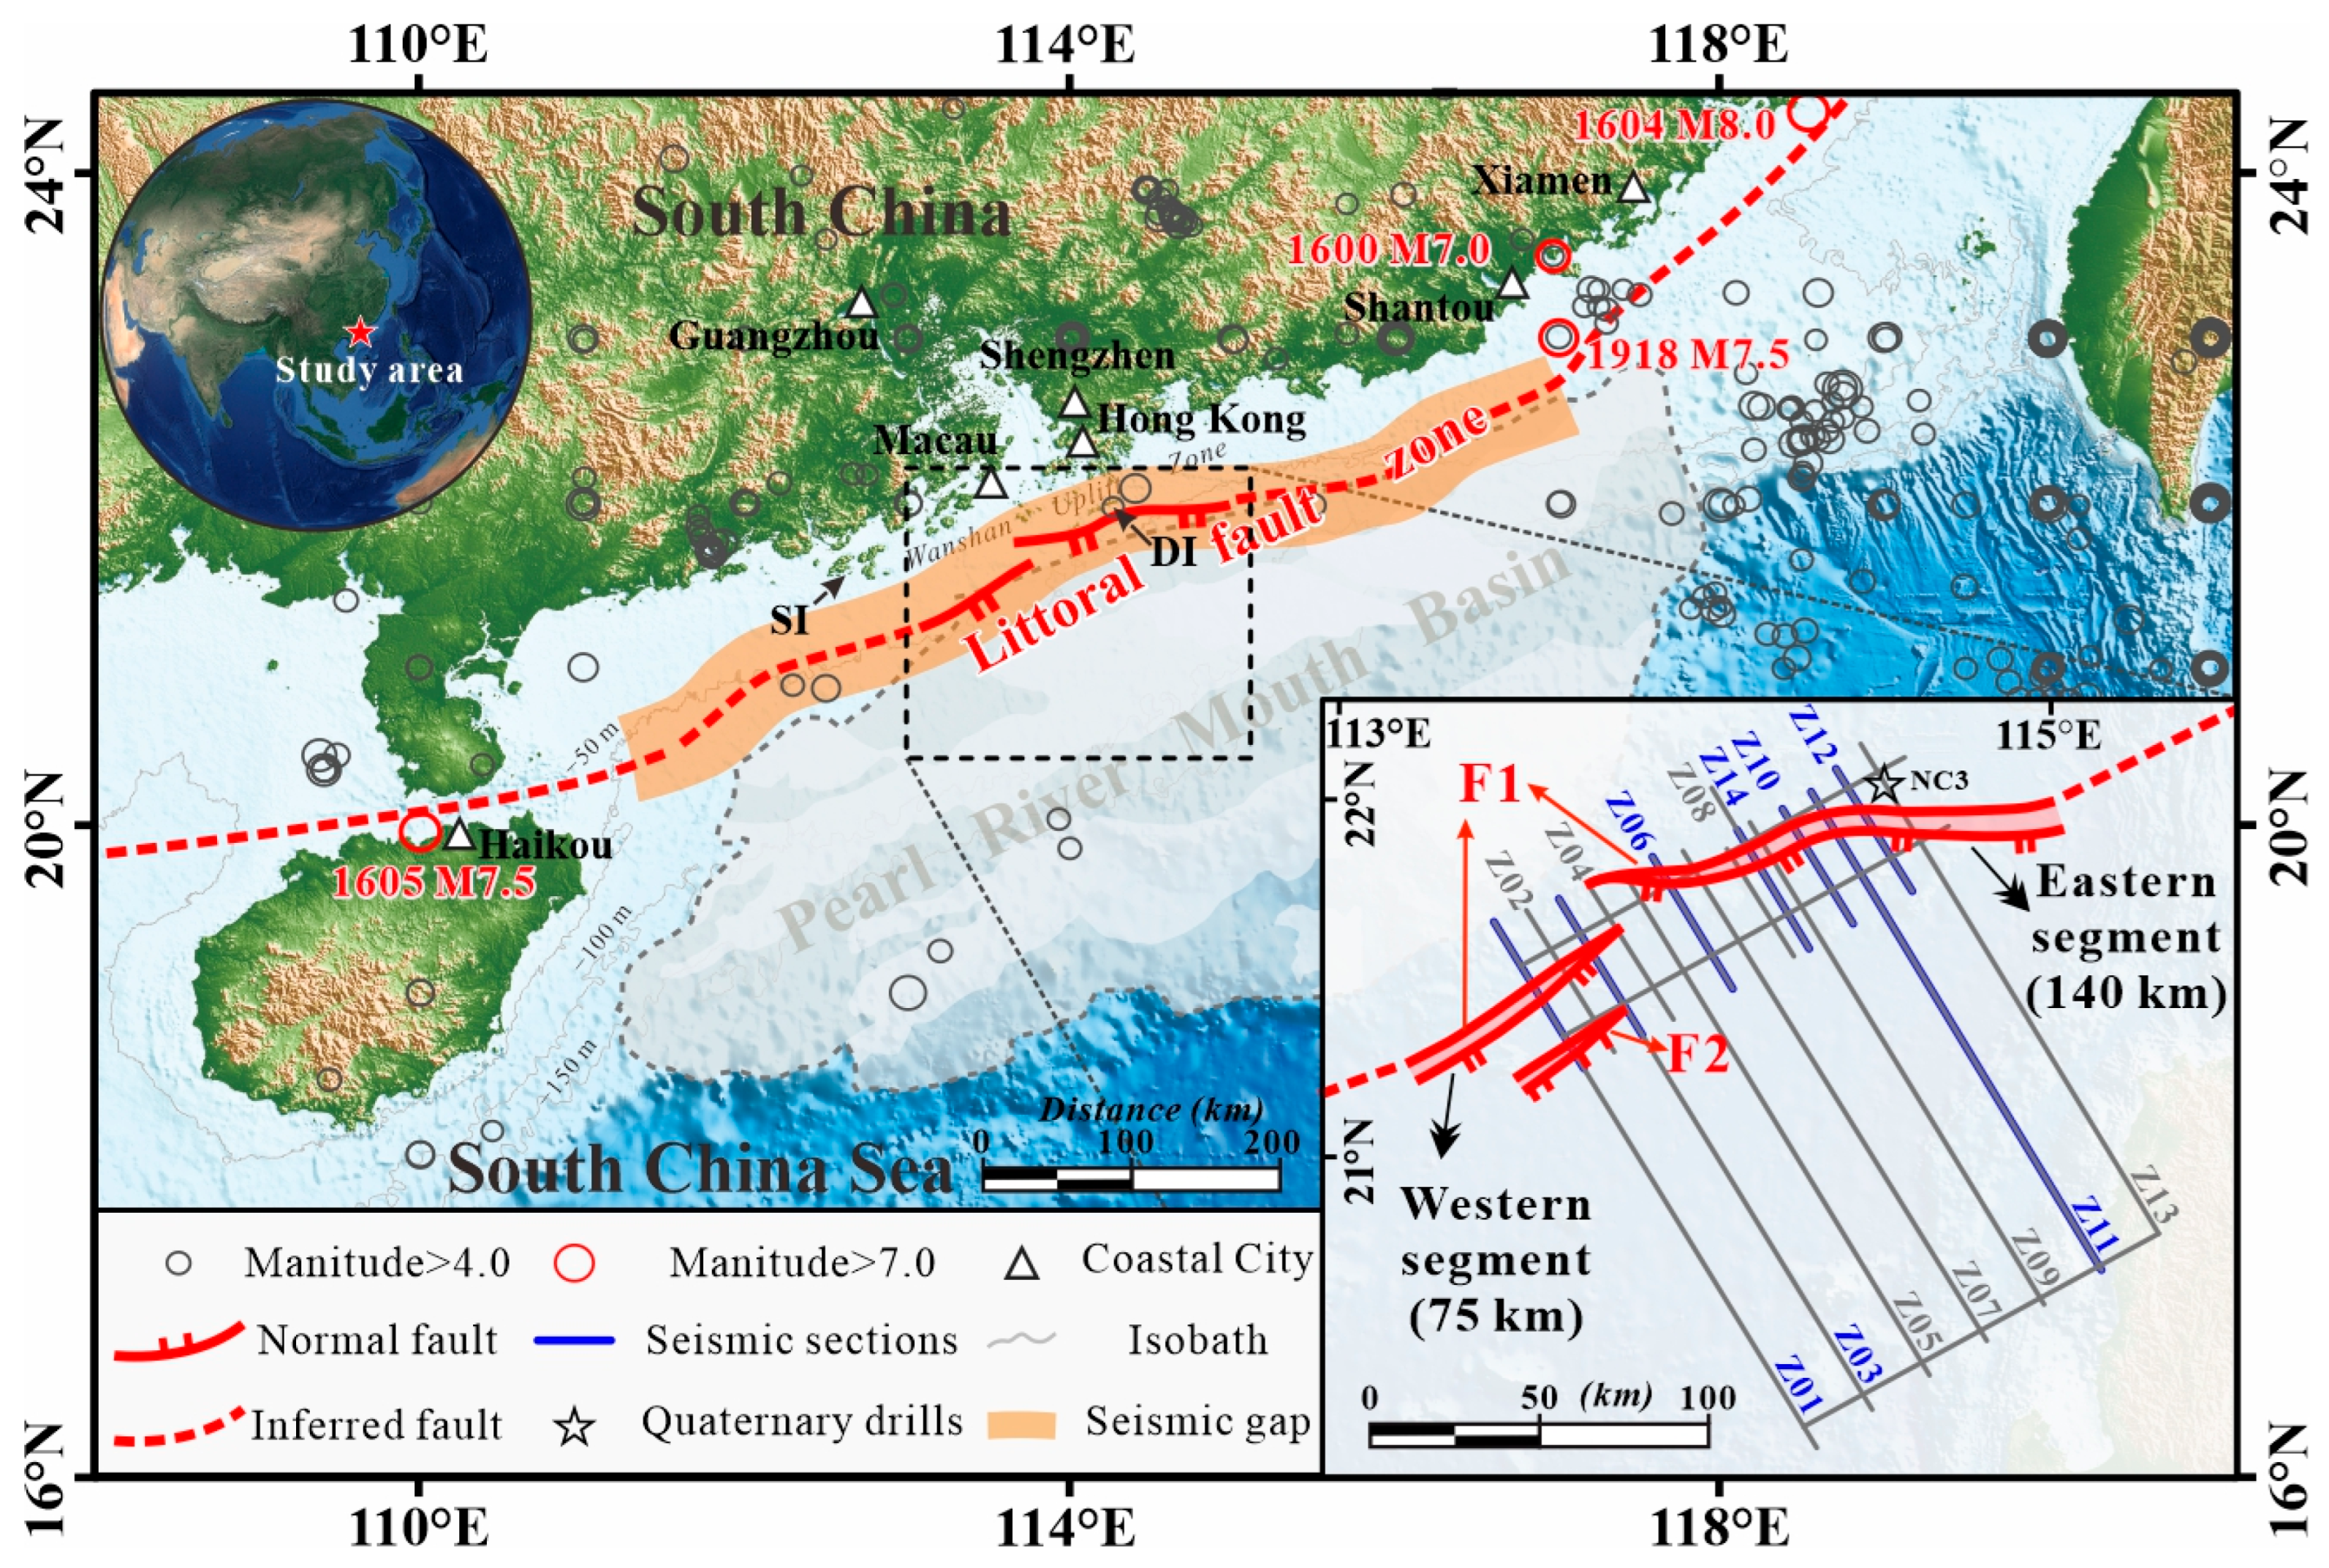
2. Geological Setting

The study area is situated in the shallow waters of the northern continental shelf boundary of the South China Sea (SCS). This seismically active continental margin is characterized by an intersecting network of faults with varying strikes [25,26], including principal NE-trending, NEE-E-trending, and secondary NW-trending groups. The NE-trending faults, predominantly oblique extensional faults with dextral strike–slip movement, are associated with the seafloor spreading of the SCS [13], and represent the primary structural trend along the coastline of South China.
The NE-trending LFZ is located in the inner to middle continental shelf transition zone in shallow waters and is distinguished by prominent gravity and magnetic anomalies [27] (Figure 1). The LFZ, dipping south or southeast, is interpreted to form a steeply dipping low-velocity zone, at depths of 15 to 20 km [3]. The crustal architecture exhibits notable differences on both flanks of the LFZ [3,17]. The wide-angle seismic profile of the Pearl River Estuary shows that the LFZ acts as a low-velocity zone [17,18] and that the fault cuts through the entire crust, offsetting the Moho discontinuity [3]. The northwestern flank comprises a normal continental block, while the southeastern flank displays characteristic extensional thinning of the continental block. Consequently, based on the distinct sedimentary fill and deep crustal architecture on both flanks of the LFZ, it is proposed that the LFZ delineates the boundary between the SCS block and the South China block [3,16,17,19,20].
Seismic activity in the region is characterized as low to moderately strong, low-frequency, and shallow (Figure 1), primarily controlled by NE-trending and NW-trending faults [28]. However, despite this description, the region has the potential to experience seismic intensities reaching level 8 [29,30], and it is considered a zone in which destructive strong earthquakes with magnitudes of M7.0 or M7.5 are likely to occur [31,32].

3. Data and Methods

3.1. Multichannel, Single-Channel Seismic Data

In this study, we utilized 1950 km of seismic data acquired in 2017 (Figure 1). These data include 7 multichannel seismic profiles with a two-way travel time (TWTT) of 5 s and 1 single-channel seismic profile with a two-way travel time of 200 milliseconds that were obtained near the Dangan Islands (DI) (Figure 1). The multi-channel seismic survey was conducted aboard by the Kan407 ship, equipped with an array of six airguns with a combined volume of 260 cubic inches, operating at an air pressure of 2000 pounds per square inch. The airguns were fired at intervals of 80 s, corresponding to approximately 200 m at a ship speed of 5 knots, and were towed at a depth of 5 m. The receiver array consisted of a 600 m long 96-channel MicroEel Analog Seismic Solid Streamer manufactured by Geometrics with a group spacing of 6.25 m, 5 s, and a sampling rate of 0.5 ms. For the depth conversion, we used a velocity of 2000 m/s to transform the time values into depth measurements. Additionally, high-resolution single-channel seismic surveys were obtained through the SIG 2 mille sub-bottom profiling instrument with a Boomer seismic source. Global navigation satellite systems (GNSSs) were utilized for navigation and shot timing, as well as for recording the location of each shot. The cable acquisition operated within the frequency range of 10–1000 Hz, with a sound source energy ranging between 200 and 300 J. The seismic data acquisition parameters were optimized, including a sound source energy of 250 J and a sampling frequency of 12,000 Hz. The vertical resolution of the seismic data in the investigated section ranged between 0.5 and 1 m.
The interpreted layers in these seismic sections corresponded to stratigraphy derived from published petroleum boreholes, dividing the Cenozoic fill into five sequences (Figure 2). These reflect layers correlated with the borders of lithostratigraphic units delimited along the inner to middle continental shelf [3,16,17,18,19,33,34]. The locations of the faults were identified through fault surface reflections, as well as fault cutoffs of the hanging wall and footwall.

3.2. Chronology Data from the Borehole

One borehole (NC3) with a depth of 110 m was drilled along the single-channel profile S6 with a water depth of 42.4 m. The continuously cored NC3 (114.53° E, 22°05′ N) borehole penetrated late Pleistocene and Holocene sedimentary sequences composed of clay, mud, and fine sand. The core was dated using AMS 14C and calibrated using OxCal v4.4 and Marine 20 curve with 2δ error. Samples NC3-65, NC3-515, and NC3-704-706 corresponded to times 3110–2707, 9413–8877, and 9927–9373 cal. yr B.P, respectively, indicating a reliable stratigraphic age.

3.3. The Expansion Index

The expansion index (E) is an indicator that reflects the activity of a particular fault during geologic time. It is denoted as E = Td/Tu, where Td represents the thickness of the hanging wall, and Tu is the footwall thickness [35,36]. There are three scenarios for interpreting the expansion index: (1) Positive Expansion Index (E > 1): Indicates that the fault has been active, causing significant extension and displacement over time. This suggests that the region has experienced tectonic activity such as rifting or normal faulting. (2) Zero Expansion Index (E = 1): Implies that the fault has not been active or has shown minimal activity. This indicates a period of tectonic stability with no significant extension or displacement. (3) Negative Expansion Index (E < 1): Suggests that the fault has experienced compressional forces, leading to shortening rather than extension. This could be due to tectonic processes such as thrust faulting or folding.

4. Structural Architecture of the LFZ

To elucidate the geometry of the LFZ near the Greater Bay Area of China, we display one regional multi-channel seismic reflection profile across the northern part of the Pearl River Mouth Basin, as well as six multichannel seismic reflection profiles that cover the main fault (purple lines in the right bottom inset, Figure 1). Based on their structure characteristics, the LFZ in the study area can be divided into eastern and western segments along its strike. The eastern segment of the fault is described by four seismic profiles, and the western segment is constrained by two seismic profiles (Figure 1).

4.1. Regional Structure of the LFZ in the Pearl River Estuary

The regional multichannel seismic profile Z11 (Figure 3) provides clear insights into the faults and sedimentary characteristics. This profile reveals significant variations in basement depth. Near the Dangan Islands (expressed as the abbreviation DI in Figure 1) to the northwest of the seismic profile, the basement is remarkably shallow, measuring only about 0.25 s (TWTT) (~250 m). In contrast, towards the southwestern portion, the basement is deeply buried, reaching depths of approximately 1.6–3.0 s (TWTT) (~1600–3000 m). This abrupt change in sediment thickness, coupled with evidence of fault plane reflections, suggests the presence of a seaward-dipping normal fault (F1) governing the regional structural framework.
The basement (Tg) progressively becomes shallower towards the south, forming an asymmetric extensional half-graben filled with Cenozoic sediments under the influence of F1. Moving southwest from the half-graben, the basement depth gradually increases before stabilizing at 2.5–3.0 s (TWTT) (~2500–3000 m), punctuated by the intersection of several northeast-trending secondary normal faults (Figure 3).
The normal fault F1, interpreted as the main fault of the LFZ, has experienced a complex structural evolution, including transpressional events and the reactivation of syn-rift extension or transtensional deformation. The cumulative throw of F1 increases with depth, with the maximum accumulated displacement at 2.2 s (TWTT) (~2200 m), as evidenced by basement offsets. Meanwhile, the secondary normal faults exhibit a maximum accumulated displacement ranging from 10 to 50 milliseconds (TWTT) (~20–50 m) (Figure 3). For a more detailed analysis of the structure of this fault zone, we have selected six representative multichannel seismic profiles across the LFZ. These profiles will provide further insights into the fault geometry and deformation patterns within the study area.

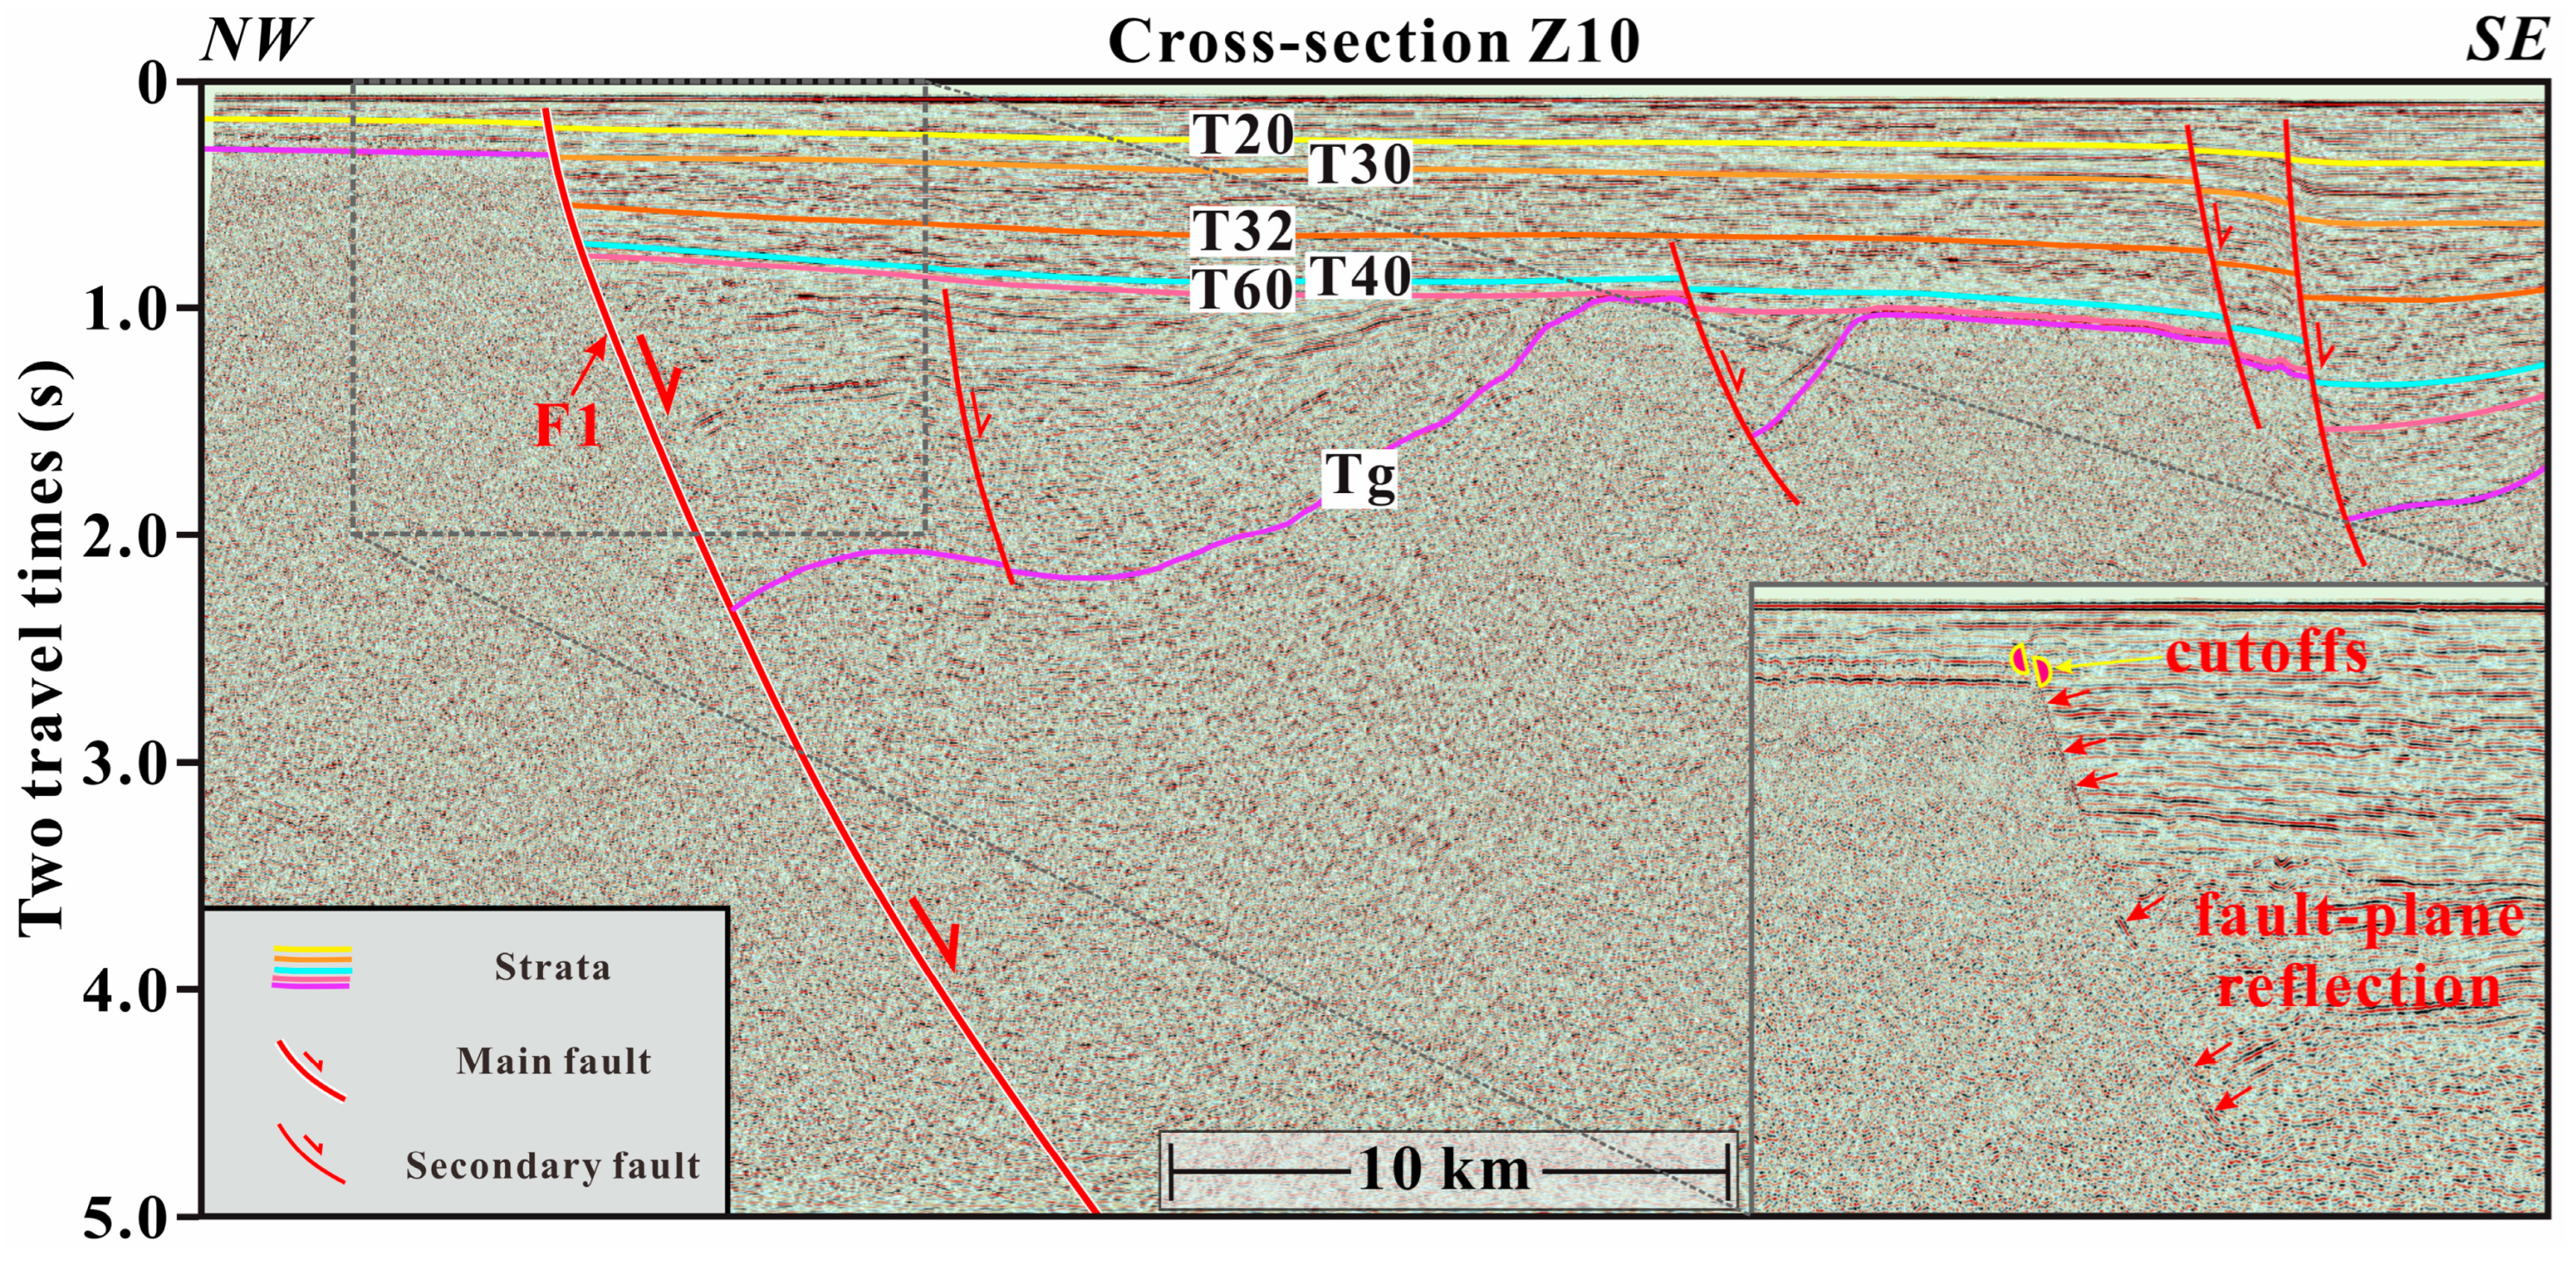
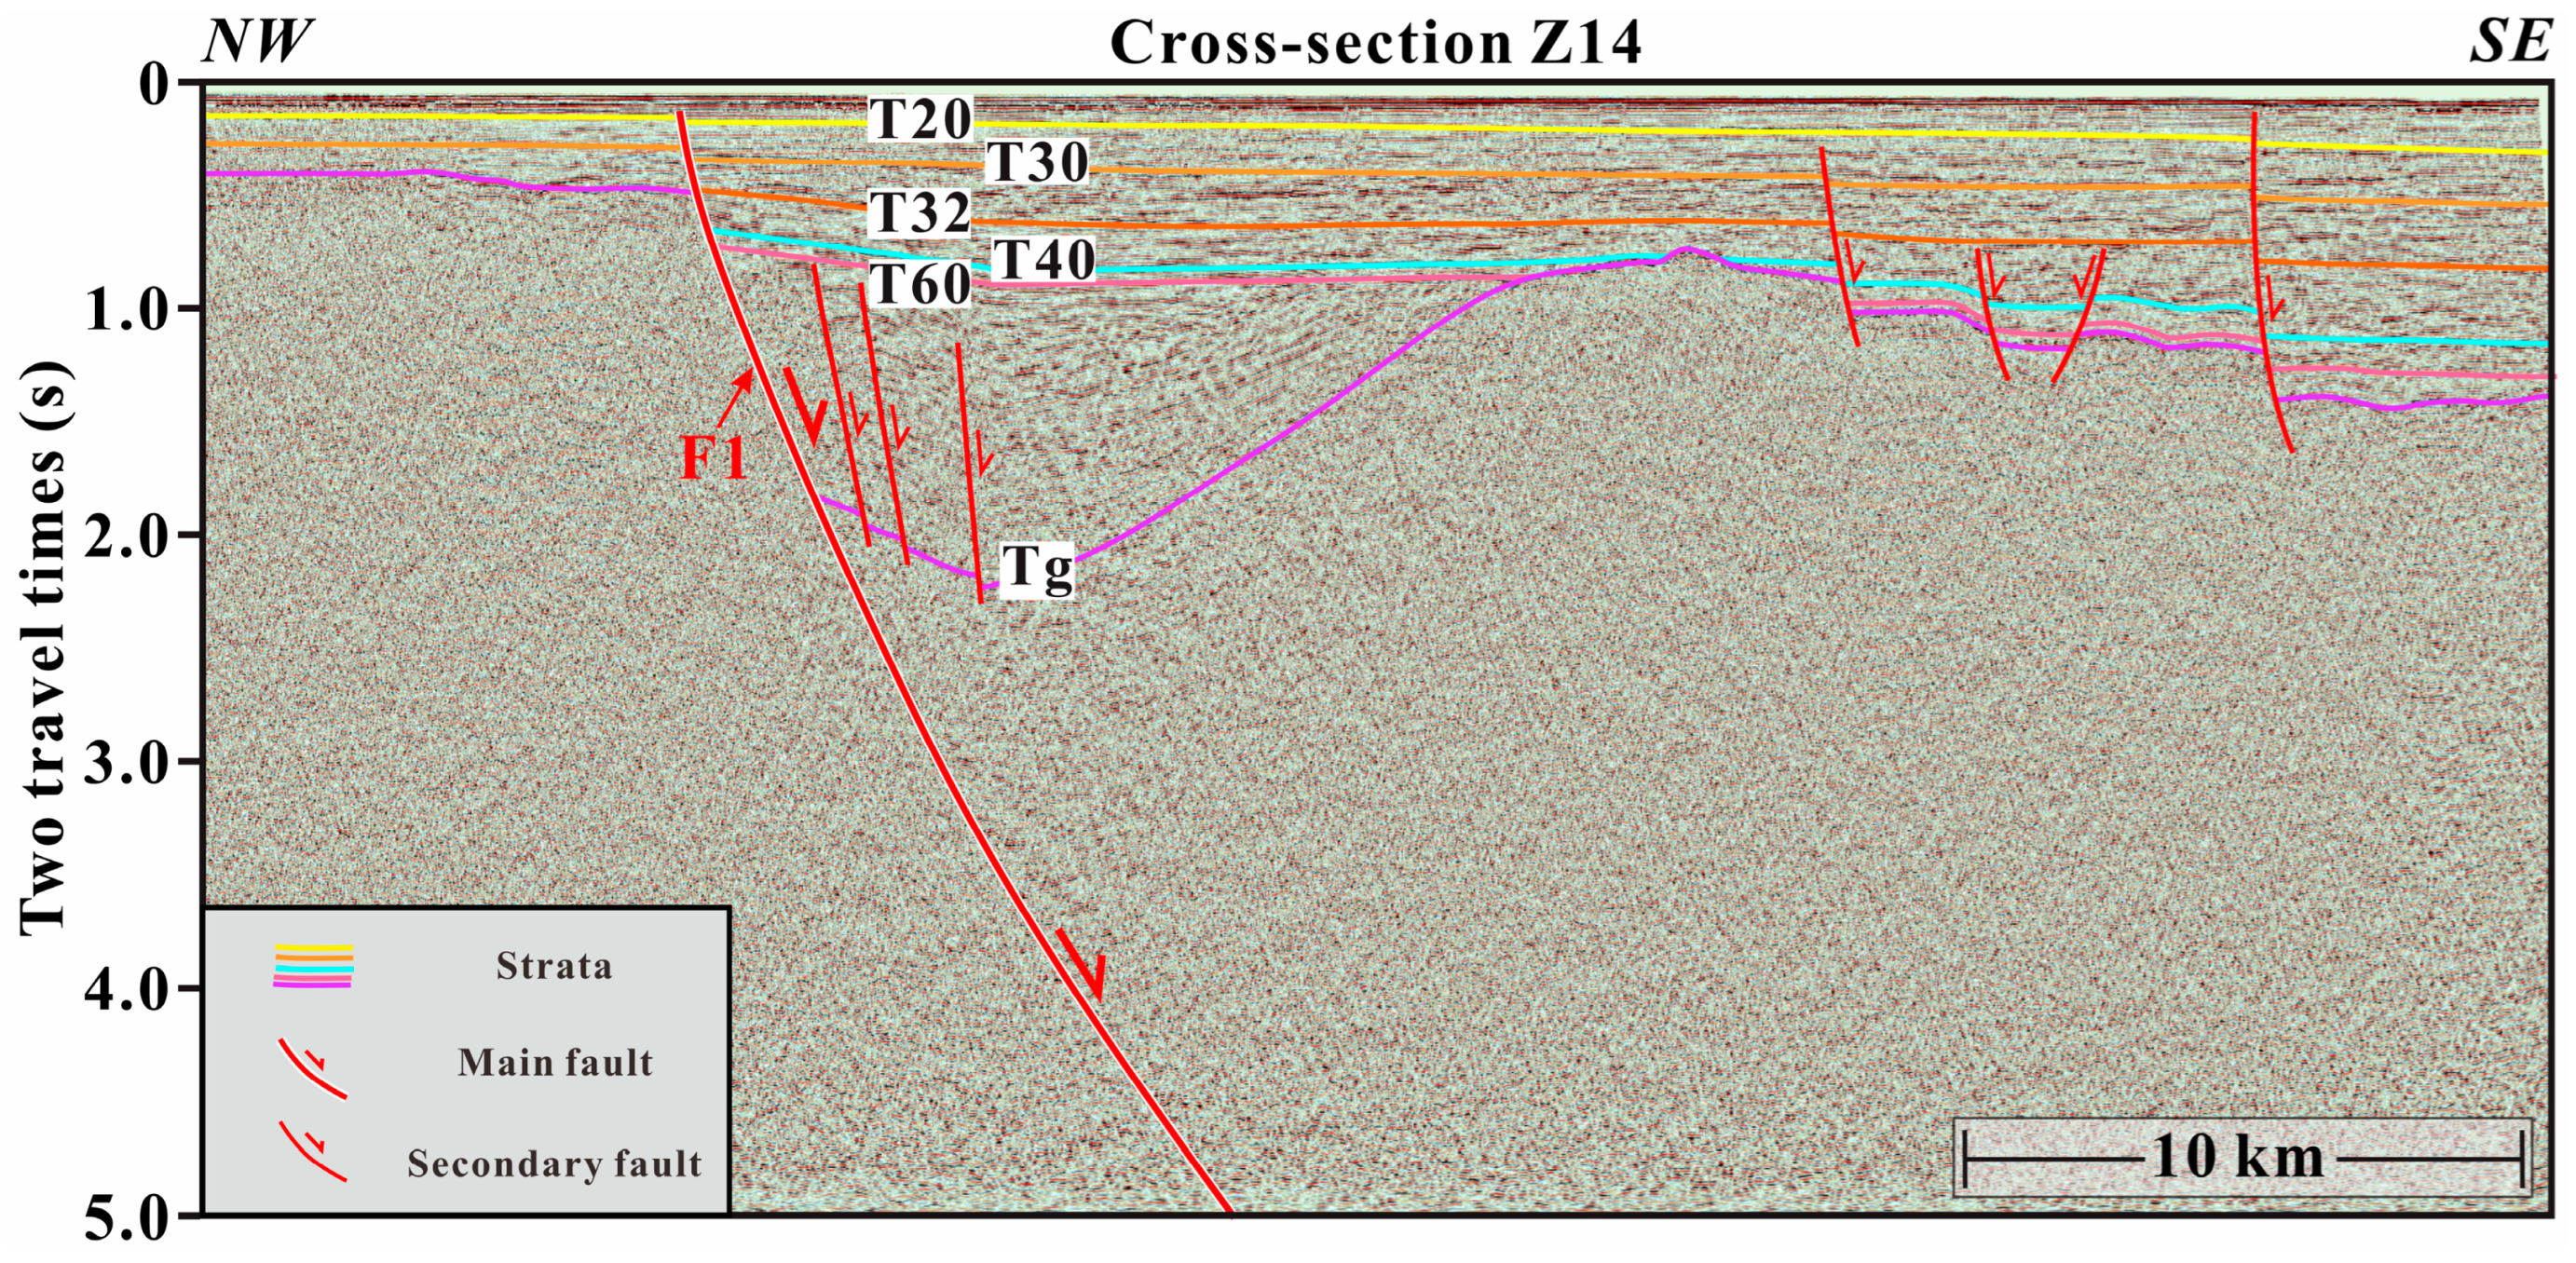
4.2. Eastern Segment

To gain a better understanding of the structure within the eastern segment of the LFZ, we present a representative multichannel seismic profile, Z12, and subsequently compare it with three other multichannel seismic profiles within this segment. The interpretation of profile Z12 (Figure 4) reveals an extensional half-graben filled with Cenozoic sediments, characterized by distinct fault-plane and fault cutoffs that delineate the shallow portion of the fault (Figure 4 inset). Although the fault breaks through to very shallow depths, it does not reach the seafloor. The sedimentary thickness in the footwall of F1 measures about 0.2 s (TWTT) (~200 m), but this abruptly increases across the fault to 3.0 s (TWTT) (~3000 m) over its hanging wall. Overall, profile Z12 exhibits a structure similar to the northern part of the adjacent Z11 profile (Figure 3). The throw of F1, measured across different profiles, exhibits a downdip increase with a maximum accumulated displacement of 2.6 s (TWTT) (~2600 m), recorded by the offset of the basement.
Profiles Z10, Z14, and Z6 (Figure 5, Figure 6 and Figure 7) also demonstrate similar characteristics to profiles Z11 and Z12 (Figure 3 and Figure 4), including the presence of the main normal fault F1, which controls the geometry of the half-graben in the northern portion of the Pearl River Mouth Basin. To quantify the differences in slip in F1 along its strike, we measure the offset of the top of the basement in all multichannel seismic profiles. The results for profiles Z12, Z11, Z10, Z14, and Z6 are 2.6, 2.2, 2.0, 1.7, and 1.2 s (TWTT) (~2600, 2200, 2000, 1700, 1200 m), respectively. The slip in F1 decreases toward the southwest, and correspondingly, the width of the half-graben also decreases. This observation leads us to infer that the northeastern part has undergone more extensive and longer-lived tectonic deformation than the southwestern part (Figure 3, Figure 4, Figure 5, Figure 6 and Figure 7).

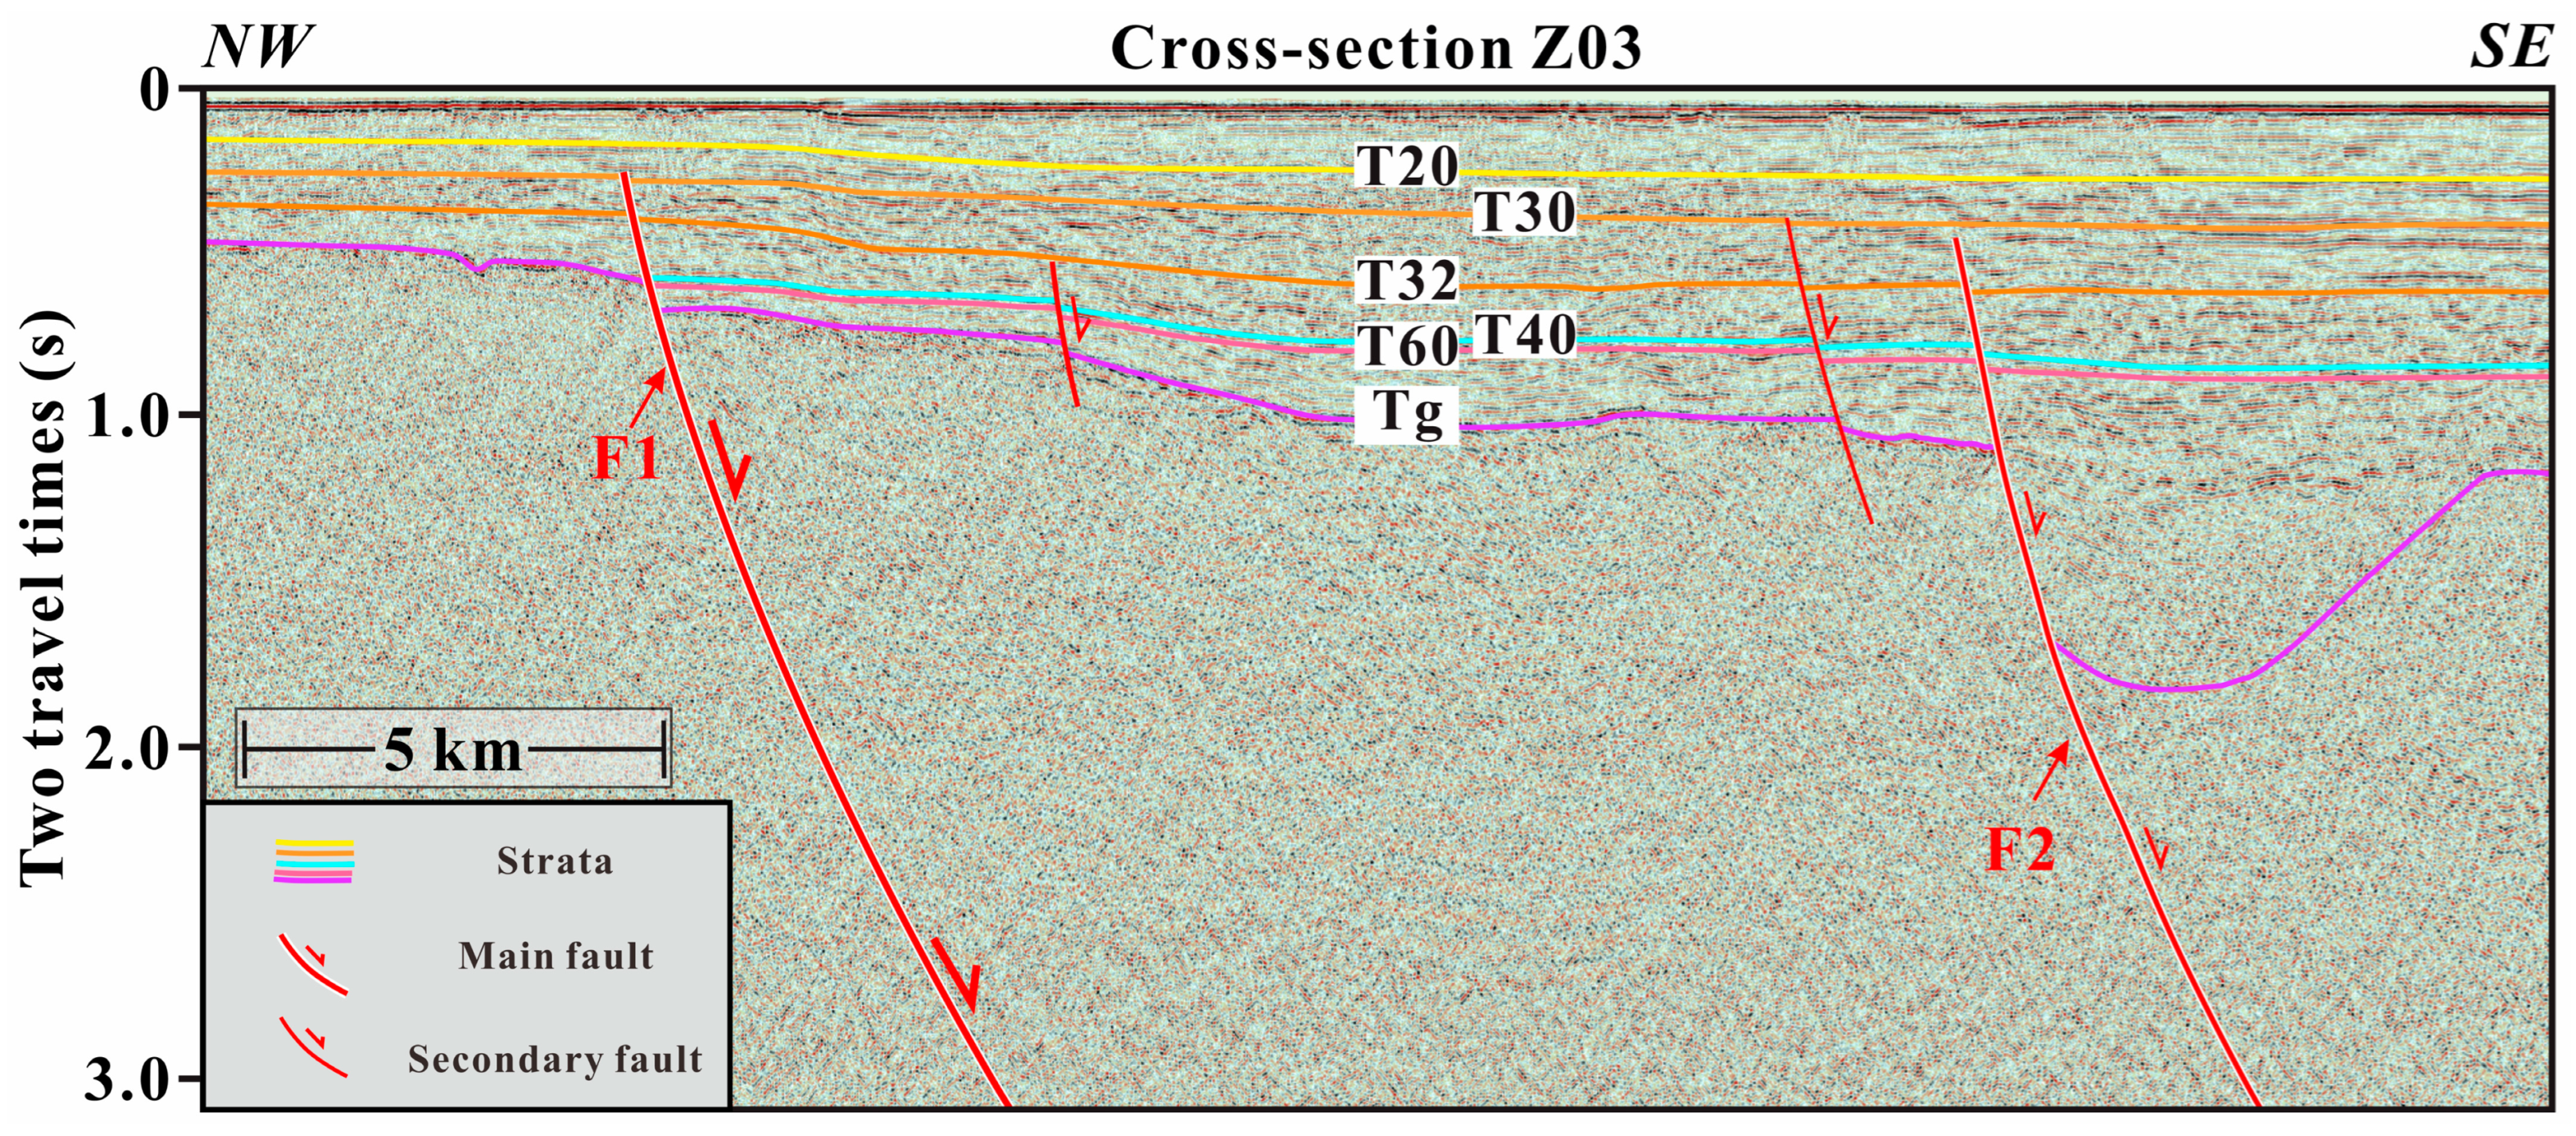
4.3. Western Segment

The western segment of the LFZ in our study area exhibits distinct structures and geometries at depth, contrasting with those observed in the eastern segment. Profile Z03 (Figure 8) serves as a representative example of this pattern, displaying the presence of two faults, F1 and F2, whose tips overlap in the map view (Figure 1). The depth of the basement in the footwall of F1 is approximately 0.6 s (TWTT) (~600 m) and increases to 0.65 s (TWTT) (~650 m) in the hanging wall of F1. Across F2, the depth of the basement abruptly increases from 1.0 to 1.8 s (TWTT) (~1000–1800 m). However, profile Z01 (Figure 9) depicts a different scenario, with the depth of the basement increasing across F1 from 0.9 to 1.9 s (TWTT) (~900–1900 m), while the depth increases by only 0.3 s (TWTT) (~300 m) across F2. Consequently, upon comparing the accumulated displacement and width of the half-grabens in sections Z01 and Z03, it is evident that the southwestern part has undergone more extensive and longer-lived structural deformation than the northeastern part (Figure 8 and Figure 9).

5. Evolution of Fault Displacement over Time

Our investigation into the long-standing structural evolution and recent rupture activity of the LFZ focuses on the shallower portions of the seismic profiles and the high-resolution single-channel seismic profile in the offshore region close to the Dangan Islands (Figure 4). Through the interpretation and measurement of the seismic data (Figure 10a,d and Figure 11b), we utilize the expansion (growth) index (Figure 10b,e and Figure 11c) and fault throw-depth profile (Figure 10c,f and Figure 11d) to characterize the kinematic history of Cenozoic normal faulting and Late Quaternary activity, respectively.
The expansion index diagram (Figure 10) reveals the following insights: The expansion indices are greater than 1 (E > 1), indicating the presence of syn-extensional deposits during the Cenozoic. The expansion indices exhibit an increase with depth, signifying a decrease in activities over time during the Cenozoic period. A comparison of the values of the expansion index of the half-grabens in profiles Z10 and Z01 (Figure 10a,d), which cover the same stratigraphic intervals, indicates that the fault slip rate of the eastern segment is greater than that of the western segment. The fault throw plot illustrates the accumulated displacements with depth, affirming that fault F1 is a long-lived active normal fault. These results collectively suggest that fault F1 in the northern portion of the Pearl River Mouth Basin remained active throughout the deposition of intervals Tg to T20.

6. Discussion

6.1. Structural Architecture of the LFZ

Our findings indicate that the LFZ comprises several NE-striking parallel normal faults, including prominent ones like F1 and F2 spanning a width of 25 to 60 km (Figure 3), and is situated at isobaths approximately between 40 m and 50 m. The LFZ is characterized by a main high-angle normal fault trending mainly northeast to northeast-to-east and dipping south-eastward, along with several secondary normal faults. This main fault serves as the basin-controlling fault in the northern region of the Pearl River Mouth Basin, exhibiting a maximum accumulated displacement of 1.5 and 1.8 km when considering a constant velocity of ~2000 m/s within 3 s TWTT (Figure 10). While previous studies have suggested that the LFZ is a deep crustal fault with a south-eastward dip and significant accumulated displacement, our research highlights the varied geometrical characteristics observed across [3,19,20,23,37,38] the different multichannel seismic profiles of the segmented fault zone [25]. The Wanshan uplift zone acts as the northern margin of the LFZ (Figure 1), and is characterized by a fault scarp of nearly 130 m in height in this region [32]. We compare the locations of faults to free-air gravity anomalies in the area (Figure 12); the results shows that the segments of the LFZ constrained in this study correspond to a steep velocity gradient between elongated gravity highs and broad gravity lows, and we interpret these as the footwall highs and hanging wall depocenters associated with the fault, respectively.
In the northeastern margin of the LFZ in our study area, near Shantou coastal waters, the major active stage of the fault occurred in the late Jurassic, cutting through the lower Pliocene sedimentary layer but having no effect on the Quaternary sedimentary layer [39]. In the western segment, near Shangchuan Island (expressed as the abbreviation SI in Figure 1), the intensive active stage of the fault primarily occurred in the early–middle Pleistocene, whereas the fault in the Dangan Islands in the Pearl River Estuary was active during the late Pleistocene period [8]. Overall, the LFZ consists of an array of faults initiated at various geological periods, with significant fault activities since the Pliocene, particularly close to the Dangan islands.

6.2. Holocene Deformation of the LFZ

To identify the recent activity of fault F1, we interpreted single-channel seismic profile S06 (Figure 11a), situated in the uppermost part of fault F1 along multichannel seismic profile Z12 (Figure 4). We identified five depositional interfaces above layer T20, labeled L5 to L1, and interpreted six secondary interfaces, to reveal the latest activity of fault F1 (Figure 11a,b). Comparing the accumulated displacements of L5 to L1 along F1, we observed a decreasing trend in slip, with a minimum displacement value of 1.4 milliseconds (TWTT) located at a depth of 15 milliseconds (TWTT). Employing a constant velocity of ~1700 m/s for the upper 150 milliseconds (TWTT), we calculated that the minimum fault offset in section S06 was 1.4 milliseconds (TWTT), equivalent to a depth of 1.2 m, and that its distance from the sea bottom was 12.8 m (Figure 11c,d). The expansion index diagram and fault throw plot reveal that syn-extensional deposits occurred until the late Quaternary (younger than T20).
Furthermore, between the point of minimum fault offset, we dated two 14C samples with the time window of 9413–8877 and 9927–9373 cal yr B.P (Figure 11). This finding is consistent with dating based on geomagnetic paleointensity and 14C ages obtained from samples from shallow boreholes in adjacent areas. This indicates that sediments at a ~16 m depth in the hanging wall of fault F1 have an age of ~10 ka [40,41,42]. The sedimentation rate also demonstrates noticeable differences between the hanging wall and footwall of the main fault F1, with accumulation rates of 160 cm/ka and ~4 cm/ka over the past 10 ka [42], respectively. These results highlight that the most recent rupture activity of fault F1 occurred during the Holocene, a finding documented for the first time.

6.3. Implications for Earthquake Hazard in Seismic Gap

One of the primary objectives of our study was to assess the potential for strong earthquakes in the study area. However, there was no direct justification for assessing the earthquake risk. To evaluate the earthquake hazard of the LFZ in the seismic gap, we applied empirical relationships to relate the subsurface rupture length (RLD) and average displacement (AD) to the maximum possible earthquake magnitude. For the first set of relations, moment magnitude (Mw) is a function of RLD: Mw = 4.34 + 1.54 × Log (RLD) [43], and Mw = 3.5 + 2.17 × Log (RLD) [44]. Using measured fault lengths for each segment (75 km and 140 km, Figure 12), we estimate that the eastern and western segments of the fault are capable of producing Mw 7.2 and 7.5, and 7.6 and 8.1 earthquakes, respectively. Using an average displacement of 1.2 m, the scaling laws predict an Mw of 7.0 (Mw = 6.64 + 0.16 × Log (AD)) [43] (Figure 10 and Figure 11). Assuming an average surface displacement of 2.0 m, the scaling laws predict an Mw of 7.1, with a fixed rupture width of 30 kilometers [3,16,17,18,19,20] (Figure 3 and Figure 8).
The maximum possible earthquake magnitudes (Mw 7.0–7.5) assessed in this research are approximately compatible with documented historical seismicity in the neighboring area [8,9]. However, there is uncertainty regarding whether each segment of the seismic gap might rupture as a single through-going event or in several en-echelon events. In either case, the steep dip of the fault will cause the significant displacement of the seafloor, enhancing the risk of a tsunami. These magnitude estimates suggest the possibility of significantly stronger ground motion and potentially more destructive effects for the Guangdong–Hong Kong–Macau Greater Bay Area than previously proposed [45,46,47].
Despite a very slow late Quaternary slip rate (less than 1 mm/yr), our work suggests that the LFZ may be an important source of seismic hazard in the Greater Bay Area and neighboring communities. This underscores the need for further studies to better constrain slip rates, earthquake magnitudes, and recurrence intervals during the late Quaternary. Such studies of the LFZ will enable us to continue refining its along-strike structural architecture and recent activity, which will help improve the assessment of seismic hazards in this densely populated and industrialized region.

7. Conclusions

Our study provides new insights into the structural architecture and recent rupture activity of the LFZ in the Pearl River Estuary. Through the acquisition and analysis of seismic reflection profiles, we identified a main high-angle normal fault along with several secondary normal faults within the LFZ. The main fault, which predominantly trends northeast and dips southeast, plays a significant role as the basin-controlling fault in the northern region of the Pearl River Mouth Basin, with a maximum accumulated displacement between 1.5 km and 1.8 km. Utilizing the single-channel seismic data, 14C dating, and published borehole geomagnetic paleointensity, we determined that the latest activity of the main fault occurred in the Holocene, with minimum offsets of 1.2 m. This finding underscores the seismic hazard posed by the LFZ, suggesting its potential as a source of strong destructive earthquakes with estimated magnitudes ranging from Mw 7.0 to 7.5 along the inferred seismic gap. Overall, our study contributes to a better understanding of the structural characteristics and seismic activity of the LFZ in the Pearl River Estuary, emphasizing the importance of further research to refine our understanding of earthquake hazards in this region.

Supplementary Materials

The following supporting information can be downloaded at: https://www.mdpi.com/article/10.3390/jmse12081350/s1, Figure S1: Uninterpreted multichannel seismic profiles Z11; Figure S2: Uninterpreted multichannel seismic profiles Z12; Figure S3: Uninterpreted multichannel seismic profiles Z10; Figure S4: Uninterpreted multichannel seismic profiles Z14; Figure S5: Uninterpreted multichannel seismic profiles Z06; Figure S6: Uninterpreted multichannel seismic profiles Z03; Figure S7: Uninterpreted multichannel seismic profiles Z01; Figure S8: Uninterpreted single channel seismic profiles S06.

Author Contributions

X.D.: Methodology, Supervision, Validation, Visualization, Writing—original draft, Writing—review and editing. Z.L.: Conceptualization, Funding acquisition, Investigation, Methodology, Project administration, Supervision, Writing—review and editing. L.H.: Data curation, Formal analysis. P.Z.: Conceptualization, Funding acquisition, Supervision, Validation. X.Y.: Conceptualization, Data curation, Formal analysis, Investigation. R.A.: Methodology, Writing—review & editing, Validation. G.L.: Data curation, Formal analysis. All authors have read and agreed to the published version of the manuscript.

Funding

This work was jointly funded by the National Key R&D Program of China (2023YFC3008602), National Natural Science Foundation of China (42172233), Guangdong Province Introduced Innovative R&D Team of Geological Processes and Natural Disasters around the South China Sea (2016ZT06N331), and Fundamental Research Funds for the Central Universities, Sun Yat-sen University (24pnpy301).

Institutional Review Board Statement

Not applicable.

Informed Consent Statement

Not applicable.

Data Availability Statement

The full un-interpreted seismic profiles are provided in the Supplementary Information.

Acknowledgments

We thank the captains and crews of the Kan407 ship for their support during our research. We are very thankful to Weitao Wang, Linlin Li, Chuang Sun, Hao Liang, Yipeng Zhang, and Gege Hui for their valuable conversations.

Conflicts of Interest

The authors declare no conflicts of interest.

References

  1. Rocha, M.P.; de Azevedo, P.A.; Marotta, G.S.A.; Schimmel, M.; Fuck, R. Causes of Intraplate Seismicity in Central Brazil from Travel Time Seismic Tomography. Tectonophysics 2016, 680, 1–7. [Google Scholar] [CrossRef]
  2. Zoback, M.D. Climate and Intraplate Shocks Century of Phytoplankton Change. Nature 2010, 466, 568–569. [Google Scholar] [CrossRef] [PubMed]
  3. Cao, J.H.; Sun, J.L.; Xu, H.L.; Xia, S.H. Seismological Features of the Littoral Fault Zone in the Pearl River Estuary. Chin. J. Geophys. 2014, 57, 498–508. [Google Scholar] [CrossRef]
  4. Li, S.Z.; Suo, Y.H.; Liu, X.; Dai, L.M.; Yu, S.; Zhao, S.J.; Ma, Y.; Wang, X.F.; Cheng, S.X.; Xue, Y.C.; et al. Basic Structural Characteristics and Genetic Models of the South China Sea: Problems, Progress and Controversies. Mar. Geol. Quat. Geol. 2012, 32, 35–53. [Google Scholar] [CrossRef]
  5. Zhu, J.J.; Li, J.; Sun, Z.X.; Li, S.Z. Crustal Thinning and Extension in the Northwestern Continental Margin of the South China Sea. Geol. J. 2015, 51, 286–303. [Google Scholar] [CrossRef]
  6. Hui, G.G.; Li, S.Z.; Li, X.Y.; Guo, L.L.; Suo, Y.H.; Somerville, I.D.; Zhao, S.J.; Hu, M.Y.; Lan, H.Y.; Zhang, J. Temporal and Spatial Distribution of Cenozoic Igneous Rocks in the South China Sea and Its Adjacent Regions: Implications for Tectono-Magmatic Evolution. Geol. J. 2016, 51, 429–447. [Google Scholar] [CrossRef]
  7. Zhan, W.H.; Sun, Z.X.; Tang, C.; Zhu, J.J.; Sun, L.T. Littoral Active Fault Belt of South China and Its Control on Seismic Activity in Taiwan Strait. J. Trop. Oceanogr. 2004, 23, 19–24. [Google Scholar]
  8. Xu, H.L.; Qiu, X.L.; Zhao, M.H.; Sun, J.L.; Zhu, J.J. Characteristics of the Crustal Structure and Hypocentral Tectonics in the Epicentral Area of Nan’ao Earthquake (M7.5), the Northeastern South China Sea. Chin. Sci. Bull. 2006, 51, 95–106. [Google Scholar] [CrossRef]
  9. Xu, H.L.; Ye, C.M.; Qiu, X.L.; Sun, J.L.; Xia, S.H. Studies on the Binhai Fault Zone in the Northern South China Sea by the Deep Geophysical Exploration and Its Seismogenic Structure. South China J. Seismol. 2010, 30, 10–18. [Google Scholar] [CrossRef]
  10. Chen, D.Q.; Shao, Y.; Tan, Z.G.; Huan, Y.M. Spatial-Temporal Clustering Characteristics of M≥5 Moderate and Strong Seismic Activities in the Southeast Coastal Seismic Belt. South China J. Seismol. 2020, 40, 10–17. [Google Scholar] [CrossRef]
  11. Kagan, Y.Y.; Jackson, D.D. Seismic Gap Hypothesis: Ten Years After. J. Geophys. Res. 1991, 96, 21419–21431. [Google Scholar] [CrossRef]
  12. Liu, Y.X. The Active Fractures in South China Coast. Mar. Geol. Quat. Geol. 1985, 5, 11–21. [Google Scholar]
  13. Tan, M.T.; Qiu, Y.X.; Zou, H.P. Regional Tectonic Study in the Coastal of Guangdong. Geol. Miner. Explor. Bur. Guangzhou 2000, 45–71. [Google Scholar]
  14. Dong, H.G. The Basic Features of Shawan Fault and Analysis of the Coupling with the Landform. Geol. Miner. Resour. South China 2016, 32, 238–248. [Google Scholar] [CrossRef]
  15. Yu, Z.X.; Zhang, K.; Liang, H.; Li, Z.Y. Late Quaternary Tectonic Movements in the Pearl River Delta, China, Revealed from Stratigraphic Profiles. Trop. Geogr. 2016, 36, 334–342. [Google Scholar] [CrossRef]
  16. Zhao, M.H.; Qiu, X.L.; Ye, C.M.; Xia, K.Y.; Huang, C.L.; Xie, J.B.; Wang, P. Analysis on Deep Crustal Structure along the Onshore-Offshore Seismic Profile across the Binhai (Littoral) Fault Zone in Northeastern South China Sea. Acta Geophys. Sin. 2004, 47, 954–961. [Google Scholar] [CrossRef]
  17. Xia, S.H.; Zhao, M.H.; Qiu, X.L.; Xu, H.L.; Shi, X. Bin Crustal Structure in an Onshore-Offshore Transitional Zone near Hong Kong, Northern South China Sea. J. Asian Earth Sci. 2010, 37, 460–472. [Google Scholar] [CrossRef]
  18. Xia, S.H.; Qiu, X.L.; Tong, C.H.; Xu, H.L.; Zhao, M.H. Three-Dimensional Tomographic Model of the Crust beneath the Hong Kong Region. Geology 2012, 40, 59–62. [Google Scholar] [CrossRef]
  19. Cao, J.H.; Xia, S.H.; Sun, J.L.; Zhao, F.; Wan, K.Y.; Xu, H.L. Offshore Fault Geometrics in the Pearl River Estuary, Southeastern China: Evidence from Seismic Reflection Data. J. Ocean Univ. China 2018, 17, 799–810. [Google Scholar] [CrossRef]
  20. Xia, S.H.; Cao, J.H.; Sun, J.L.; Lv, J.S.; Xu, H.L.; Zhang, X.; Wan, K.Y.; Fan, C.Y.; Zhou, P.X. Seismogenic Structures of the 2006 ML4.0 Dangan Island Earthquake Offshore Hong Kong. J. Ocean Univ. China 2018, 17, 169–176. [Google Scholar] [CrossRef]
  21. Cheng, S.X.; Li, S.Z.; Suo, Y.H.; Liu, X.; Yu, S.; Dai, L.M.; Ma, Y.; Zhao, S.J.; Wang, X.F.; An, H.T.; et al. Cenozoic Tectonics and Dynamics of Basin Groups of the Northern South China Sea. Mar. Geol. Quat. Geol. 2012, 32, 79–93. [Google Scholar] [CrossRef]
  22. Suo, Y.H.; Li, S.Z.; Yu, S.; Somerville, I.D.; Liu, X.; Zhao, S.J.; Dai, L.M. Cenozoic Tectonic Jumping and Implications for Hydrocarbon Accumulation in Basins in the East Asia Continental Margin. J. Asian Earth Sci. 2014, 88, 28–40. [Google Scholar] [CrossRef]
  23. Zhang, Y.F.; Kuo-Chen, H.; Alvarez-Marron, J.; Brown, D.; Lin, A.T.S.; Xie, Z.Z.; Jin, X. Imaging Active Faulting in the Western Taiwan Strait. Sci. Rep. 2020, 10, 3703. [Google Scholar] [CrossRef] [PubMed]
  24. Hui, G.G.; Zhang, P.Z.; Li, Z.G.; Wang, W.T.; Hu, L.T.; Li, G.H.; Zhang, Y.P.; Sun, C.; Li, S.Z.; Liang, H.; et al. Opening of the South China Sea Marginal Basin: Insights from the Tectonic Evolution of the ENE-Striking Littoral Fault Zone. Mar. Pet. Geol. 2022, 145, 105854. [Google Scholar] [CrossRef]
  25. Sun, J.L.; Xu, H.L.; Zhan, W.H.; Cao, J.H. Activity and Triggering Mechanism of Seismic Belt along the Northern South China Sea Continental Margin. J. Trop. Oceanogr. 2012, 31, 40–47. [Google Scholar] [CrossRef]
  26. Cao, J.H.; Xia, S.H.; Sun, J.L.; Xu, H.L. Comparison of Fault Structure Characteristics in the Northern Pearl River Mouth Basin and Its Geological Implication. Prog. Geophys. 2014, 29, 2364–2369. [Google Scholar] [CrossRef]
  27. Hao, T.Y.; Liu, J.H.; Song, H.B.; Xu, Y. Geophysical Evidences of Some Important Faults in South China and Adjacent Marginal Seas Region. Prog. Geophys. 2002, 17, 13–23. [Google Scholar]
  28. Lee, C.M.; Workman, D.R. Earthquakes in the South China Region and Their Impact on Hong Kong. Seism. East. Asia Geol. Soc. Hong Kong Bull. 1996, 5, 92–103. [Google Scholar]
  29. Bureau, G.S. Earthquake Prevention and Disaster Reduction in 12th Five-Year Plan of Guangdong Province; Guangdong Seismological Bureau: Guangzhou, China, 2011. [Google Scholar]
  30. Pappin, J.W.; Koo, R.C.H.; Jiang, H.; Kwan, J.S.H.; Yu, Y.B.; So, M.M.L.; Shiu, Y.K.; Ho, K.K.S.; Pun, W.K. A Rigorous Probabilistic Seismic Hazard Model for Southeast China: A Case Study of Hong Kong. Bull. Earthq. Eng. 2015, 13, 3597–3623. [Google Scholar] [CrossRef]
  31. Chandler, A.M.; Mice, C. Review of Hong Kong Seismic Parameters and Determination of Design Level Earthquake Events. HKIE Trans. 2000, 7, 1–12. [Google Scholar] [CrossRef]
  32. Chau, K.T.; Wong, R.H.C.; Wong, Y.L.; Lai, K.W.; Chan, Y.W.; Wong, W.T.; Guo, Y.S.H.; Zhu, W. Three-Dimensional Surface Cracking and Faulting in Dangan Islands Area, South of Hong Kong. In Proceedings of the 3rd International Conference on Continental Earthquakes, Beijing, China, 8–11 August 2004; pp. 1–14. [Google Scholar]
  33. Zhang, Y.X.; Ye, X.W.; Wan, K.Y.; Lv, Z.Y.; Wen, G.G.; Xu, S.S. Fault Structure, Seismicity, and Magmatism of the Littoral Fault Zone, Northern South China Sea: Insights from High-Resolution Seismic Reflection Data. Mar. Pet. Geol. 2024, 160, 106605. [Google Scholar] [CrossRef]
  34. Lv, L.W.; Li, Z.G.; Wang, D.W.; Wang, W.T.; Dai, X.M.; Zeng, F.C.; Li, L.L.; Liang, H.; Hui, G.; Long, W.W.; et al. The Latest Activity of the Slope Fault Zone (Pearl River Mouth) in Northern South China Sea and Implications for Earthquake Hazard Assessments. Mar. Pet. Geol. 2024, 166, 106937. [Google Scholar] [CrossRef]
  35. Thorsen, C.E. Age of Growth Faulting in the Southern Louisiana. Trans. Gulf Coast Assoc. Geol. Soc. 1963, 13, 103–110. [Google Scholar]
  36. Groshong, R.H. 3-D Structural Geology: A Practical Guide to Quantitative Surface and Subsurface Map Interpretation; Springer: Berlin/Heidelberg, Germany, 2006; ISBN 9783540310549. [Google Scholar]
  37. Xiong, C.; Cao, J.H.; Sun, J.L.; Xia, S.; Wan, K.Y.; Fan, C.Y.; Yang, B. Variation Characteristics along the Strike of the Littoral Fault Zone in Offshore Pearl River Estuary. Earth Sci. 2018, 43, 3682–3697. [Google Scholar] [CrossRef]
  38. Xia, S.H.; Zhou, P.X.; Zhao, D.P.; Cao, J.H. Seismogenic Structure in the Source Zone of the 1918 M7.5 NanAo Earthquake in the Northern South China Sea. Phys. Earth Planet. Inter. 2020, 302, 106472. [Google Scholar] [CrossRef]
  39. Zhu, J.; Cai, F.; Xu, J.; Zhang, Y.B. Active Characters of Offset Structure in East Fujian Coast Area. J. Oceanogr. Taiwan Strait 2008, 27, 393–402. [Google Scholar]
  40. Yang, X.Q.; Heller, F.; Wu, N.Y.; Yang, J.; Su, Z.H. Geomagnetic Paleointensity Dating of South China Sea Sediments for the Last 130 Kyr. Earth Planet. Sci. Lett. 2009, 284, 258–266. [Google Scholar] [CrossRef]
  41. Wang, Q.Q.; Yang, X.Q.; Zhang, T. Quaternary Activity of Pearl River Estuary Segment of the Binhai Fault Zone. In Proceedings of the Annual Meeting of Chinese Geoscience Union (CGU), Taipei, Taiwan, 30 May–6 June 2021. [Google Scholar]
  42. Wang, Q.Q. Sedimentary Cycles and Environmental Evolution near Binhai Fault Zone since Middle Pleistocene. Master’s Thesis, Sun Yat-sen University, Guangzhou, China, 2022. [Google Scholar]
  43. Wells, D.L.; Coppersmith, K.J. New Empirical Relationships among Magnitude, Rupture Length, Rupture Width, Rupture Area, and Surface Displacement. Bull. Seismol. Soc. Am. 1994, 84, 974–1002. [Google Scholar] [CrossRef]
  44. Blaser, L.; Krüger, F.; Ohrnberger, M.; Scherbaum, F. Scaling Relations of Earthquake Source Parameter Estimates with Special Focus on Subduction Environment. Bull. Seismol. Soc. Am. 2010, 100, 2914–2926. [Google Scholar] [CrossRef]
  45. Okal, E.A.; Synolakis, C.E.; Kalligeris, N. Tsunami Simulations for Regional Sources in the South China and Adjoining Seas. Pure Appl. Geophys. 2011, 168, 1153–1173. [Google Scholar] [CrossRef]
  46. Ren, Y.F.; Wen, R.Z.; Zhang, P.; Yang, Z.B.; Pan, R.; Li, X.J. Implications of Local Sources to Probabilistic Tsunami Hazard Analysis in South Chinese Coastal Area. J. Earthq. Tsunami 2017, 11, 1740001. [Google Scholar] [CrossRef]
  47. An, C. Tsunamis and Tsunami Warning: Recent Progress and Future Prospects. Sci. China Earth Sci. 2021, 64, 191–204. [Google Scholar] [CrossRef]
Figure 1. Tectonic map of South China showing fault segments in the Pearl River Estuary of the LFZ. The dotted rectangle box in the inset map displays the study region’s position. Red lines depict faults. Black lines indicate all acquired seismic reflection profiles, while blue lines display the positions of interpreted seismic profiles used in this study. Black stars represent the location of the quaternary borehole drilled in the area. DI, Dangan Islands. SI, Shangchuan Island.
Jmse 12 01350 g001
Figure 2. Tectono-stratigraphic chart of the Pearl River Mouth Basin (modified from [33,34]).
Jmse 12 01350 g002
Figure 3. Interpreted regional multichannel seismic reflection profile Z11 across the Pearl River Mouth Basin with constraints from other seismic reflection profiles [24,33,34].
Jmse 12 01350 g003
Figure 4. Interpreted multichannel seismic reflection profile Z12 crossing the eastern segment of the LFZ in the study region (location shown in Figure 1). F1 represents the main fault of the LFZ.
Jmse 12 01350 g004
Figure 5. Interpreted multichannel seismic reflection profile Z10 crossing the eastern segment of the LFZ in the study region (location shown in Figure 1).
Jmse 12 01350 g005
Figure 6. Interpreted multichannel seismic reflection profile Z14 crossing the eastern segment of the LFZ in the study region (location shown in Figure 1).
Jmse 12 01350 g006
Figure 7. Interpreted multichannel seismic reflection profile Z06 crossing the eastern segment of the LFZ in the study region (location shown in Figure 1).
Jmse 12 01350 g007
Figure 8. Interpreted multichannel seismic reflection profile Z03 crossing the western segment of the LFZ in the study region (location shown in Figure 1).
Jmse 12 01350 g008
Figure 9. Interpreted multichannel seismic reflection profile Z01 crossing the western segment of the LFZ in the study region (location shown in Figure 1).
Jmse 12 01350 g009
Figure 10. Expansion Index diagrams and fault throw sections derived from seismic interpretations illustrate changes in strata thickness and fault throw along the fault plane. (a) Seismic interpretation of Z10. (b) Expansion Index diagrams of different strata in Z10. (c) Throws of different strata along the fault plane in Z10. (d) Seismic interpretation of Z01. (e) Expansion Index diagrams of different strata in Z01. (f) Throws of different strata along the fault plane in Z01. Note that different color lines represent the different strata.
Jmse 12 01350 g010
Figure 11. Expansion Index diagrams and fault throw sections based on seismic interpretation of S06, providing further analysis of strata thickness and fault slip. (a) The single seismic data S06 with interpretations. The white line indicates the location of NC3, and the age of three key horizons have been revealed by the 14C dating. (b) Enlargement of S06 with interpretations. (c) Expansion Index diagrams of different strata in (b). (d) Throws of different strata along the fault plane in (b). Note that different color lines represent the different strata.
Jmse 12 01350 g011
Figure 12. Free−air gravity anomaly map of the research region. Red solid and dotted lines represent the locations of the LFZ. Black lines indicate the spatial distribution of seismic reflection profiles.
Jmse 12 01350 g012
Disclaimer/Publisher’s Note: The statements, opinions and data contained in all publications are solely those of the individual author(s) and contributor(s) and not of MDPI and/or the editor(s). MDPI and/or the editor(s) disclaim responsibility for any injury to people or property resulting from any ideas, methods, instructions or products referred to in the content.

