Article

Study of Physical and Mechanical Relationships during the Natural Dewatering of River Sediments and a Kaolin

by
Dalel Azaiez
1,2,
Beatriz Boullosa Allariz
2 and
Daniel Levacher
2,*
1
Laboratoire de Recherche Ingénierie Géotechnique, LRI4ES03, Ecole Nationale d’Ingénieurs de Tunis, Université de Tunis El Manar, BP37, Le Belvédère, Tunis 1002, Tunisia
2
M2C, UMR 6143 CNRS, University of Caen Normandy, 14000 Caen, France
*
Author to whom correspondence should be addressed.
J. Mar. Sci. Eng. 2024, 12(8), 1354; https://doi.org/10.3390/jmse12081354
Submission received: 10 July 2024 / Revised: 2 August 2024 / Accepted: 3 August 2024 / Published: 8 August 2024
(This article belongs to the Special Issue Advance in Sedimentology and Coastal and Marine Geology—2nd Edition)

Abstract

:
This paper investigated the relationships of some physical and mechanical parameters of sediments and a typical clay during a natural dewatering process. Four sediments from different French river dams sampled by the Électricité De France group (EDF group) and a commercial kaolin clay used for comparative purposes were the focus of this study. Continuous dewatering was monitored in a laboratory by quantifying the percentage of water remaining in sediments or clay, drained and evaporated. Undrained shear strength was also assessed during the sediment or clay dewatering process, using the laboratory vane shear test. The samples were controlled along different dimensions during the dewatering process throughout the whole experiment. The results showed a certain interdependence between the physical parameters and the water content (ω), which was normalized by the liquidity limit (ω/LL) over time. This led to sigmoidal and exponential correlations when considering the percentage of water drained. The percentage of water remaining in the sediments or clay was characterized using the normalized water content, leading to exponential and power correlations. Both exponential and linear correlations were perfect for describing the evolution of the percentage of water evaporated. Other correlations were established for variations in void index, dry unit weight/solid unit weight ratio and undrained shear strength during the dewatering process.

1. Introduction

Sediment dredging is an essential and inevitable operation for ensuring the safety and navigability of ships in shipping lanes and their access to ports. It involves maintenance and investment dredging for many ports. Throughout the world, a significant quantity of sediment is dredged annually. Each year, it is around 50 × 106 m3 in France, 300 × 106 m3 in Europe and more than double worldwide [1,2,3,4]. In Tunisia, it averages just 8.5 × 10⁶ m3 [5]. The dumping of dredged sediments at sea is regulated by national and international conventions, such as the London Convention [6]. It is an easy way and an economic solution for sediment management even if it implies the need for a thorough study of its impact on the aquatic environment. In France, around 90–95% of marine and estuarine dredged sediments are immersed in the sea [7]. However, regulations on dumping of sediments in the sea are becoming stricter in every country, and onshore sediment management needs to be implemented. Moreover, sediments can be a renewable resource and a source of materials for long-term recycling. Many beneficial uses of dredged sediments have been investigated worldwide such as materials in construction and for filling and materials in road engineering [8,9,10,11,12,13,14,15,16,17,18,19,20].
Onshore sediment management involves storing a large volume of dredged sediment with a very highwater content, which makes it difficult to transport, for instance, to storage areas for recycling. This necessarily means that the sediment has to be dewatered. Mechanical dewatering processes have been recently developed for dredged sediments but the rate of volume of sediments to be dewatered is limited. Moreover, the placement of the machinery must be near the dredging operations that pose a problem [21,22,23]. Natural dewatering is considered the most economical and environmentally friendly way to eliminate water from dredged sediments even if this technique requires significant onshore deposit areas. This is a time-consuming method, but it is possible to accelerate the dewatering by returning the sediment. Such an operation requires earthmoving machinery on the site and a certain bearing capacity of deposited sediments to ensure safe and smooth traffic for the machinery. Loss of water induces reduced volume and weight for the final transport towards the recycling area and could be considered as an economic and environmental benefit.
If the natural dewatering technique is a sustainable, eco-friendly and economical solution, it is important to understand how the sediment is dewatered and what the physical and mechanical parameters which govern dewatering are. Laboratory dewatering tests were performed on four river sediments and a typical clay to study their behavior throughout the dewatering process by assessing the quantity of water drained, evaporated and remaining in the sediments and clay. The choice of river sediments was made because their dumping at sea is not economically feasible due to the distance from the coastline, and mechanical dewatering could not be performed due to difficult access near the rivers. During these tests, other physical parameters were measured such as the dimensions of tested samples, geotechnical parameters and the undrained shear strength Su [24,25,26]. Relationships between physical and mechanical parameters were proposed in such a way that it represents the dewatering process of river sediments and reduces the duration of laboratory tests which can take more than one month.

2. Materials and Methods

2.1. Samples

The four river sediments were proposed by Electricité de France (EDF Group) because they were located near river dams (IS, RA and SA) and near a nuclear power station (RH) where dredging operations have been planned in the short term. The IS sediment came from samples extracted in the Sautet dam, located in the region of Auvergne-Rhone Alps. These alpine sediments were dredged in 2012 from 50 m under water. The SA sediment from St-Aignan in Brittany region (West of France) were sampled from the downstream part of the Guerlédan dam from a 2 m depth. For these sediments, the geotechnical campaign was performed in March 2015 [23]. Estuarine sediment was also included; the RA sediment was from the Rance dam located at the mouth of the coastal river of Rance between the municipalities of Richardais and Saint-Malo. These sediments were extracted during November 2014 and March 2015 to be desalted. They were delivered in 2017 after being completely dried [22]. RH sediment from the Great East region (Rhin river), exactly from the Marckolsheim river dam near a nuclear power station, were also investigated in this study. These RH sediments were sampled in 2012 from a depth that ranges between 1.3 m and 9 m under the water [27]. In addition, a kaolin (KA) sample completed the four sediment samples. It was chosen as a typical laboratory clay for comparing the different behaviors during the dewatering process. These four river sediments and kaolin will be referenced as “all samples” in the following sections.

2.2. Testing Methods

2.2.1. Natural Dewatering Test Procedure

The experimental procedure involves dewatering of the sediments or clay in the open air, which consists of eliminating water contained in samples through evaporation and drainage. It decreases the sample water content. The dewatering process is accompanied by volume variation which was quantified based on the evolution of void ratio. These variations depend on the physiochemical and mineralogical characteristics of the soils or sediments tested.
Different samples were prepared and tested to study their behavior during the dewatering process at a small scale. Saturated samples were put into sieves of sizes as indicated in Table 1, allowing water drainage and evaporation; see the rationale in Figure 1a. The investigated sediments and clay were first oven-dried and then weighed (Figure 1b) to provide the quantity to be hydrated at twice the liquid limit of the sediment or clay.
As illustrated in Figure 1c, the sediment or clay for a water content of ω0 = 2 LL is placed in a sieve (2) with a non-woven polypropylene filtration geotextile sheet of 160 g/m2 at its bottom (1) to ensure sediment drainage without any particle loss and to prevent any particles from blocking the 10 mm sieve mesh. The sieve mesh and geotextile guarantee fluid water drainage from the dewatered samples.
The drained water is to be recovered into the plastic support (3). The lubricating oil (5) is applied to facilitate the sample extraction from the sieve when being completely dried. All the equipment used are weighed before starting the dewatering; once all settled as shown in Figure 1d, they are put all together on the balance weight (4) and have their weight reset to 0 kg for finding out the weight of the necessary sample to fill the sieve with. The sieve filled with the sample will be kept permanently in the plastic support at an ambient room temperature of 20 °C ± 2 °C. It is removed once a day to be weighed which allows for measuring the water remaining in the material, E1. The support is also weighed with the drained water E2 to determine and deduce the evaporated water E3.
The consistency of samples initially saturated with water content superior to the liquid limit evolves from a liquid state to a dry state when they are completely dewatered [24]. During the dewatering process, the sample goes through three steps: (a), (b) and (c). When the sediment is at water content equal to its liquid limit, during the first step (a), the water for the experiment is completely contained in the sediment (E1a, mass of water contained in the sediment during the first stage of dewatering (a)); meanwhile, the masses of the drained and evaporated water E2a and E3a are null (E2a, E3a: mass of water drained and mass of water evaporated from the sediment during the first stage of dewatering (a)). During the following steps (b) and (c), the sample has a plastic consistency. The second step (b) corresponds to the drained water quantity E2b (mass of water drained from the sediment during the second stage of dewatering (b)) when it predominates until reaching a maximum value over the evaporated water E3b (mass of water evaporated from the sediment during the second stage of dewatering (b)) that is negligible. Then, in the third step (c), the quantities of evaporated water E3c (mass of water evaporated from the sediment during the third stage of dewatering (c)) increase remarkably, while the water likely to be drained E2c (mass of water drained from the sediment during the third stage of dewatering (c)) becomes very insignificant. Finally, the samples reach the shrinkage limit, and crack openings are observed in the sample.
During the dewatering process, as the sample dimensions vary, the sample settlement and diameter are measured. A vernier caliper that provides an accuracy of 0.01 mm is used to make these measurements. The diameter is measured within three equidistant positions on the sieve perimeter. As the used sieves were completely filled, it has allowed us to consider the sieve’s upper surface as a reference for the settlement measurement. The void ratio and state parameters are then determined. The unit weight of solid particles ϒs is considered equal to 26.5 kN/m3 for data analysis.

2.2.2. Undrained Shear Strength Monitoring

All samples’ shear strength Su was measured using the laboratory vane shear test. It is well known that undrained shear strength governs the short-term stability mechanisms and failure of landfills, foundations and dams. Its measurement on site could be useful at different steps of the sediment dewatering to manage their storage time, their handling, their removal, etc. During the sample dewatering test, Su was quantified using the vane shear test (VST) as the sediment dried. Considering the evolution of sample resistance measured with the vane shear test while dewatering, different blades and springs were used. The undrained shear strength was determined according to the ASTM standard [28] as given in Equation (1).
Su = (2 Mmax)/(πD2 (H + D/3))
where Su is the undrained shear strength; H is the height of the vane blade, D is the vane diameter, and Mmax is the maximum recorded torque at failure.

3. Results and Discussion

3.1. Sediment Characterization

Using the laser apparatus (Beckman LS320 type, Beckman Coulter, Brea, CA, USA), the grain size distribution is shown in Figure 2. The uniformity coefficient cu and gradation coefficient cc were determined with a grain size analysis. For all tested samples, it was found that Cu > 5 and 1 < Cc < 3—see Table 2—and they were well graded. According to the Soil Survey Manual and soil classification system of the United States Department of Agriculture [29] (Figure 3), it is confirmed that the RH, IS and RA sediments have a silt loam structure; the sandy loam structure is attributed to the SA sediment, whereas the kaolin has a silt clay loam structure.
Organic matter content was determined using the ignition temperature of 550 °C for dredged sediments or sludge, according to [30]. The CaCO3 content was obtained from a calcimetry test. Atterberg limits were determined using Casagrande apparatus, and all results are summarized in Table 2.

3.2. Dewatering Characterization

3.2.1. Characterization of Changes in Water Content

Changes in water content were characterized by monitoring the remaining water content percentage ω1, drained water percentage ω2 and evaporated water percentage ω3. The remaining water percentage ω1 is the percentage of the initial weight of water added initially to all the samples. The drained water percentage ω2 is the percentage of the water released from all the samples and gathered into the support, from the beginning of the dewatering process until the time of measurement. Likewise, the evaporated water percentage ω3 is the water evaporated from all samples in the same conditions. So, the different water percentages give Equation (2).
ω1 + ω2 + ω3 = 1
The evolution of ω1 is directly dependent on water content as one can deduce from Equation (3). The sediment water content ω at any given day during the dewatering process is then characterized through a normalized expression.
ω/LL = (ww ω1/ws)/LL
where ω/LL is the water content to liquidity limit; ww is the initial weight of water added to all samples and w
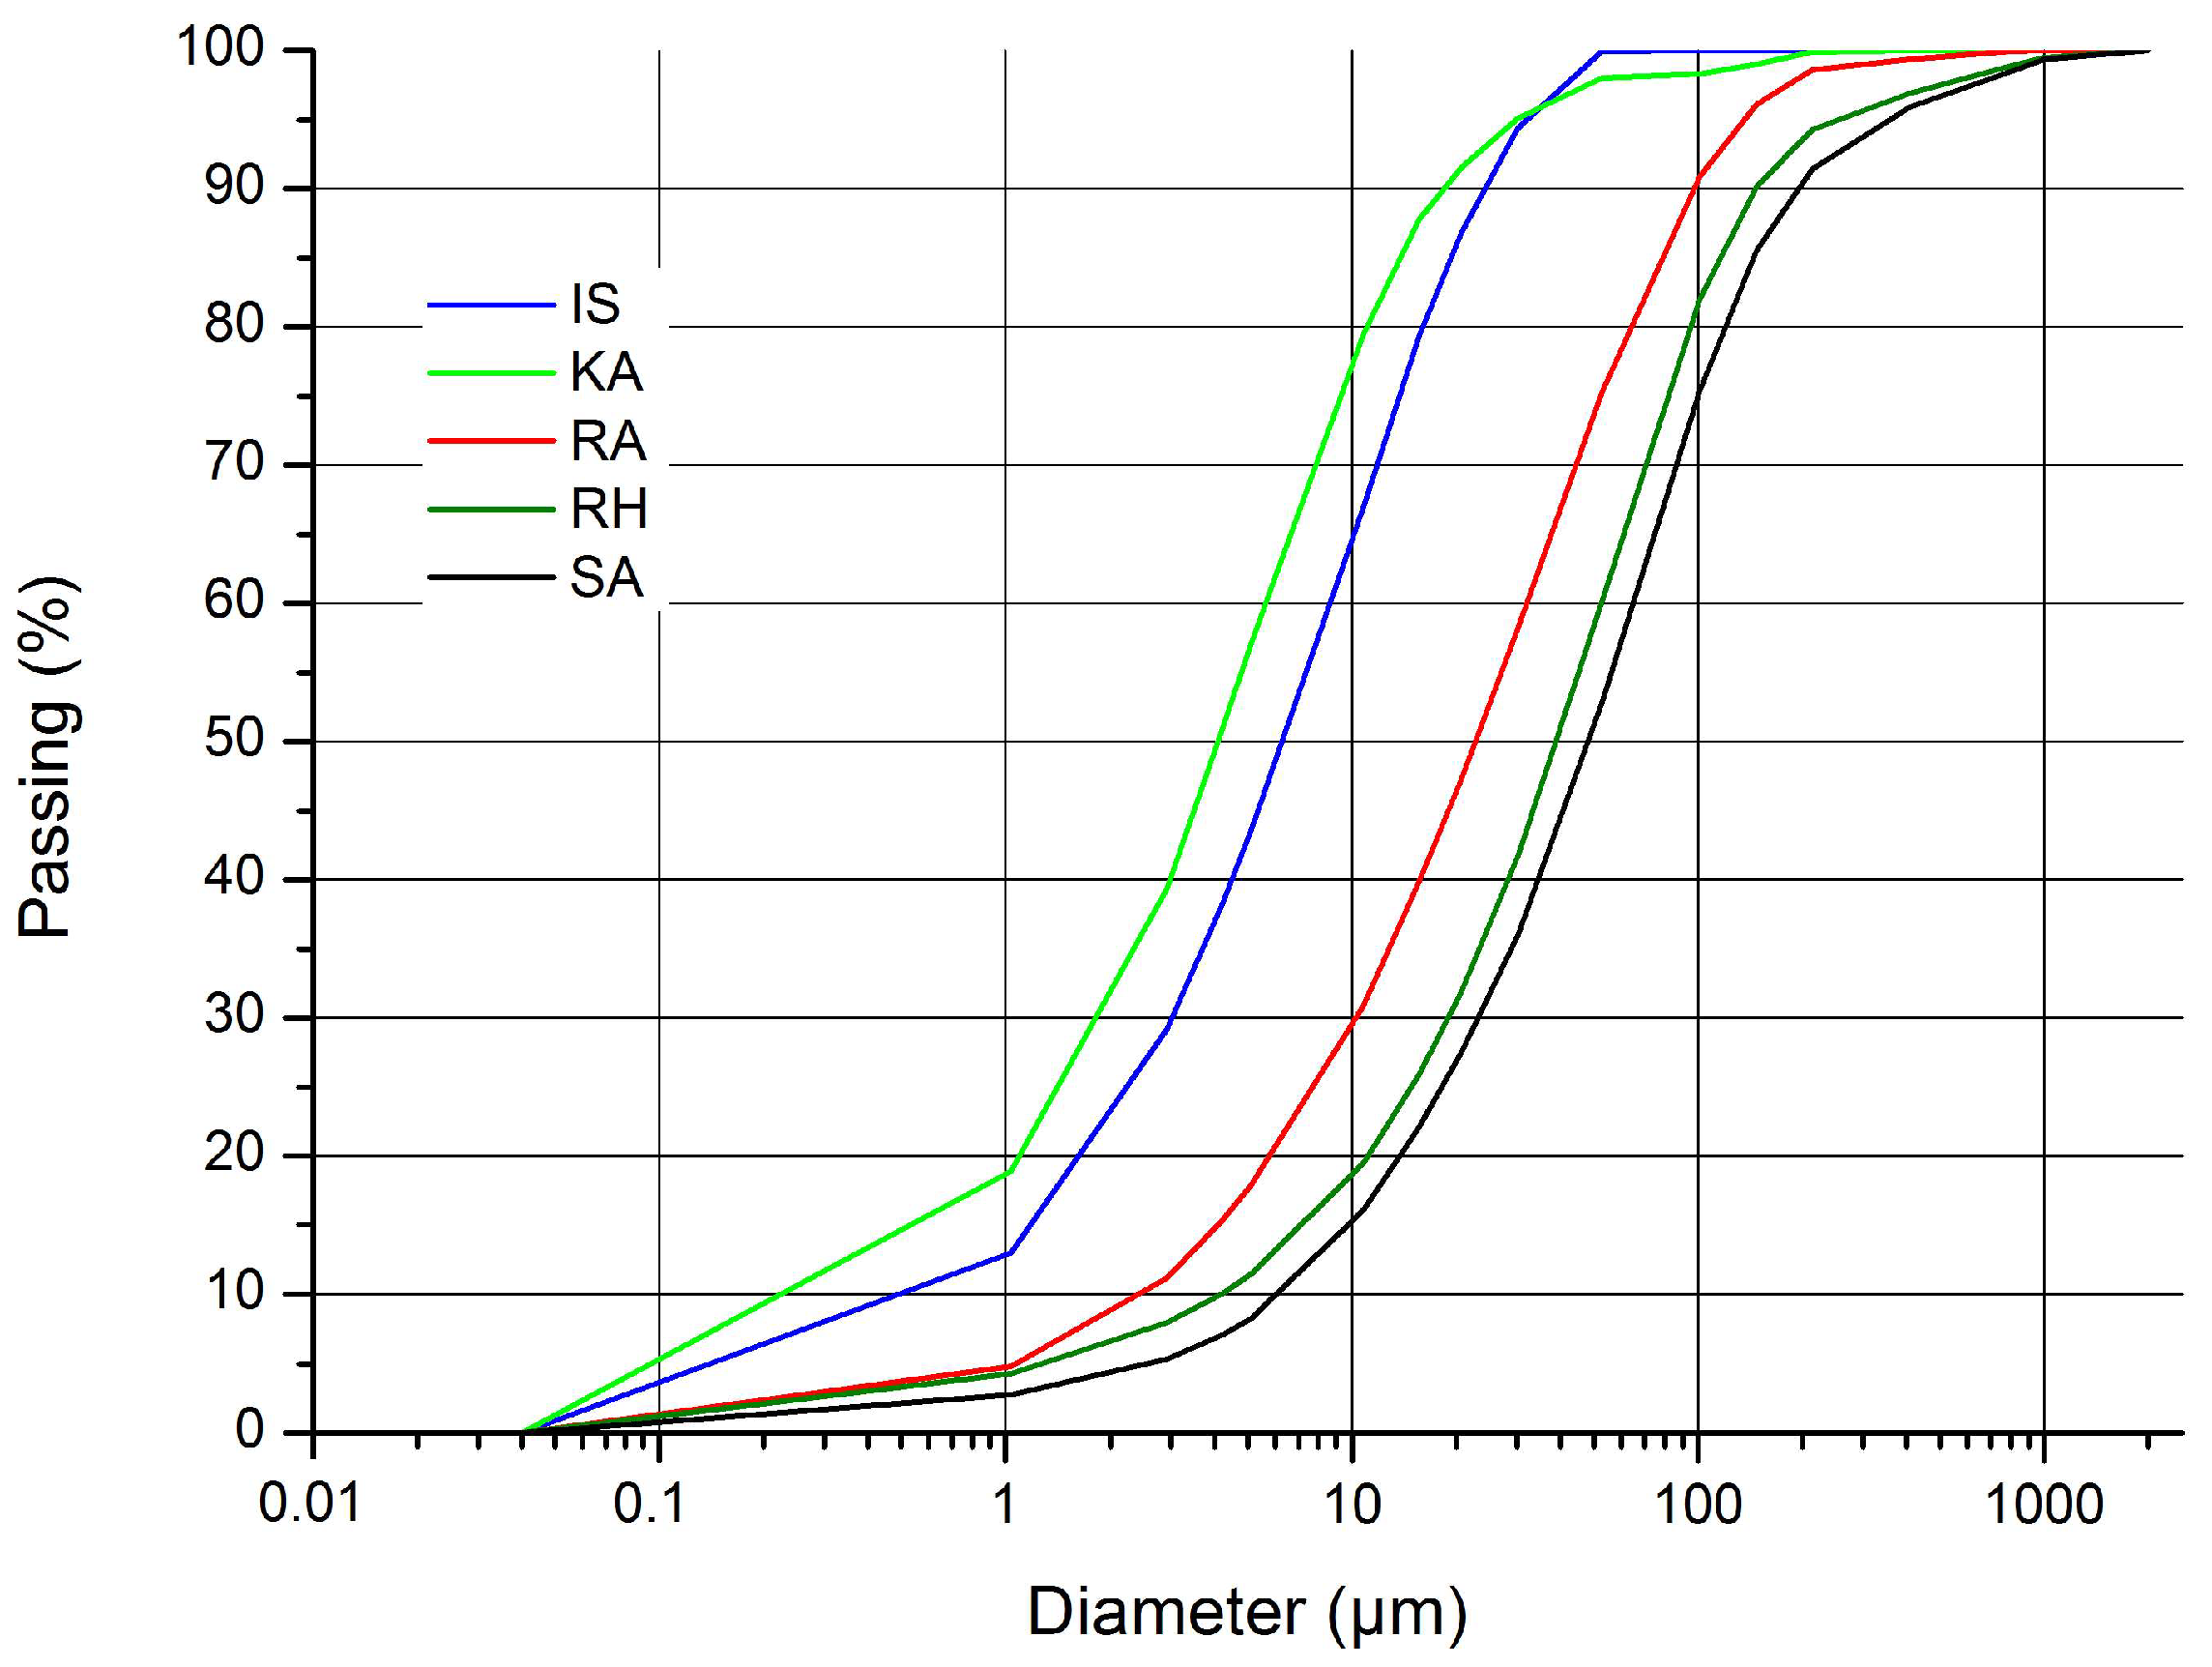
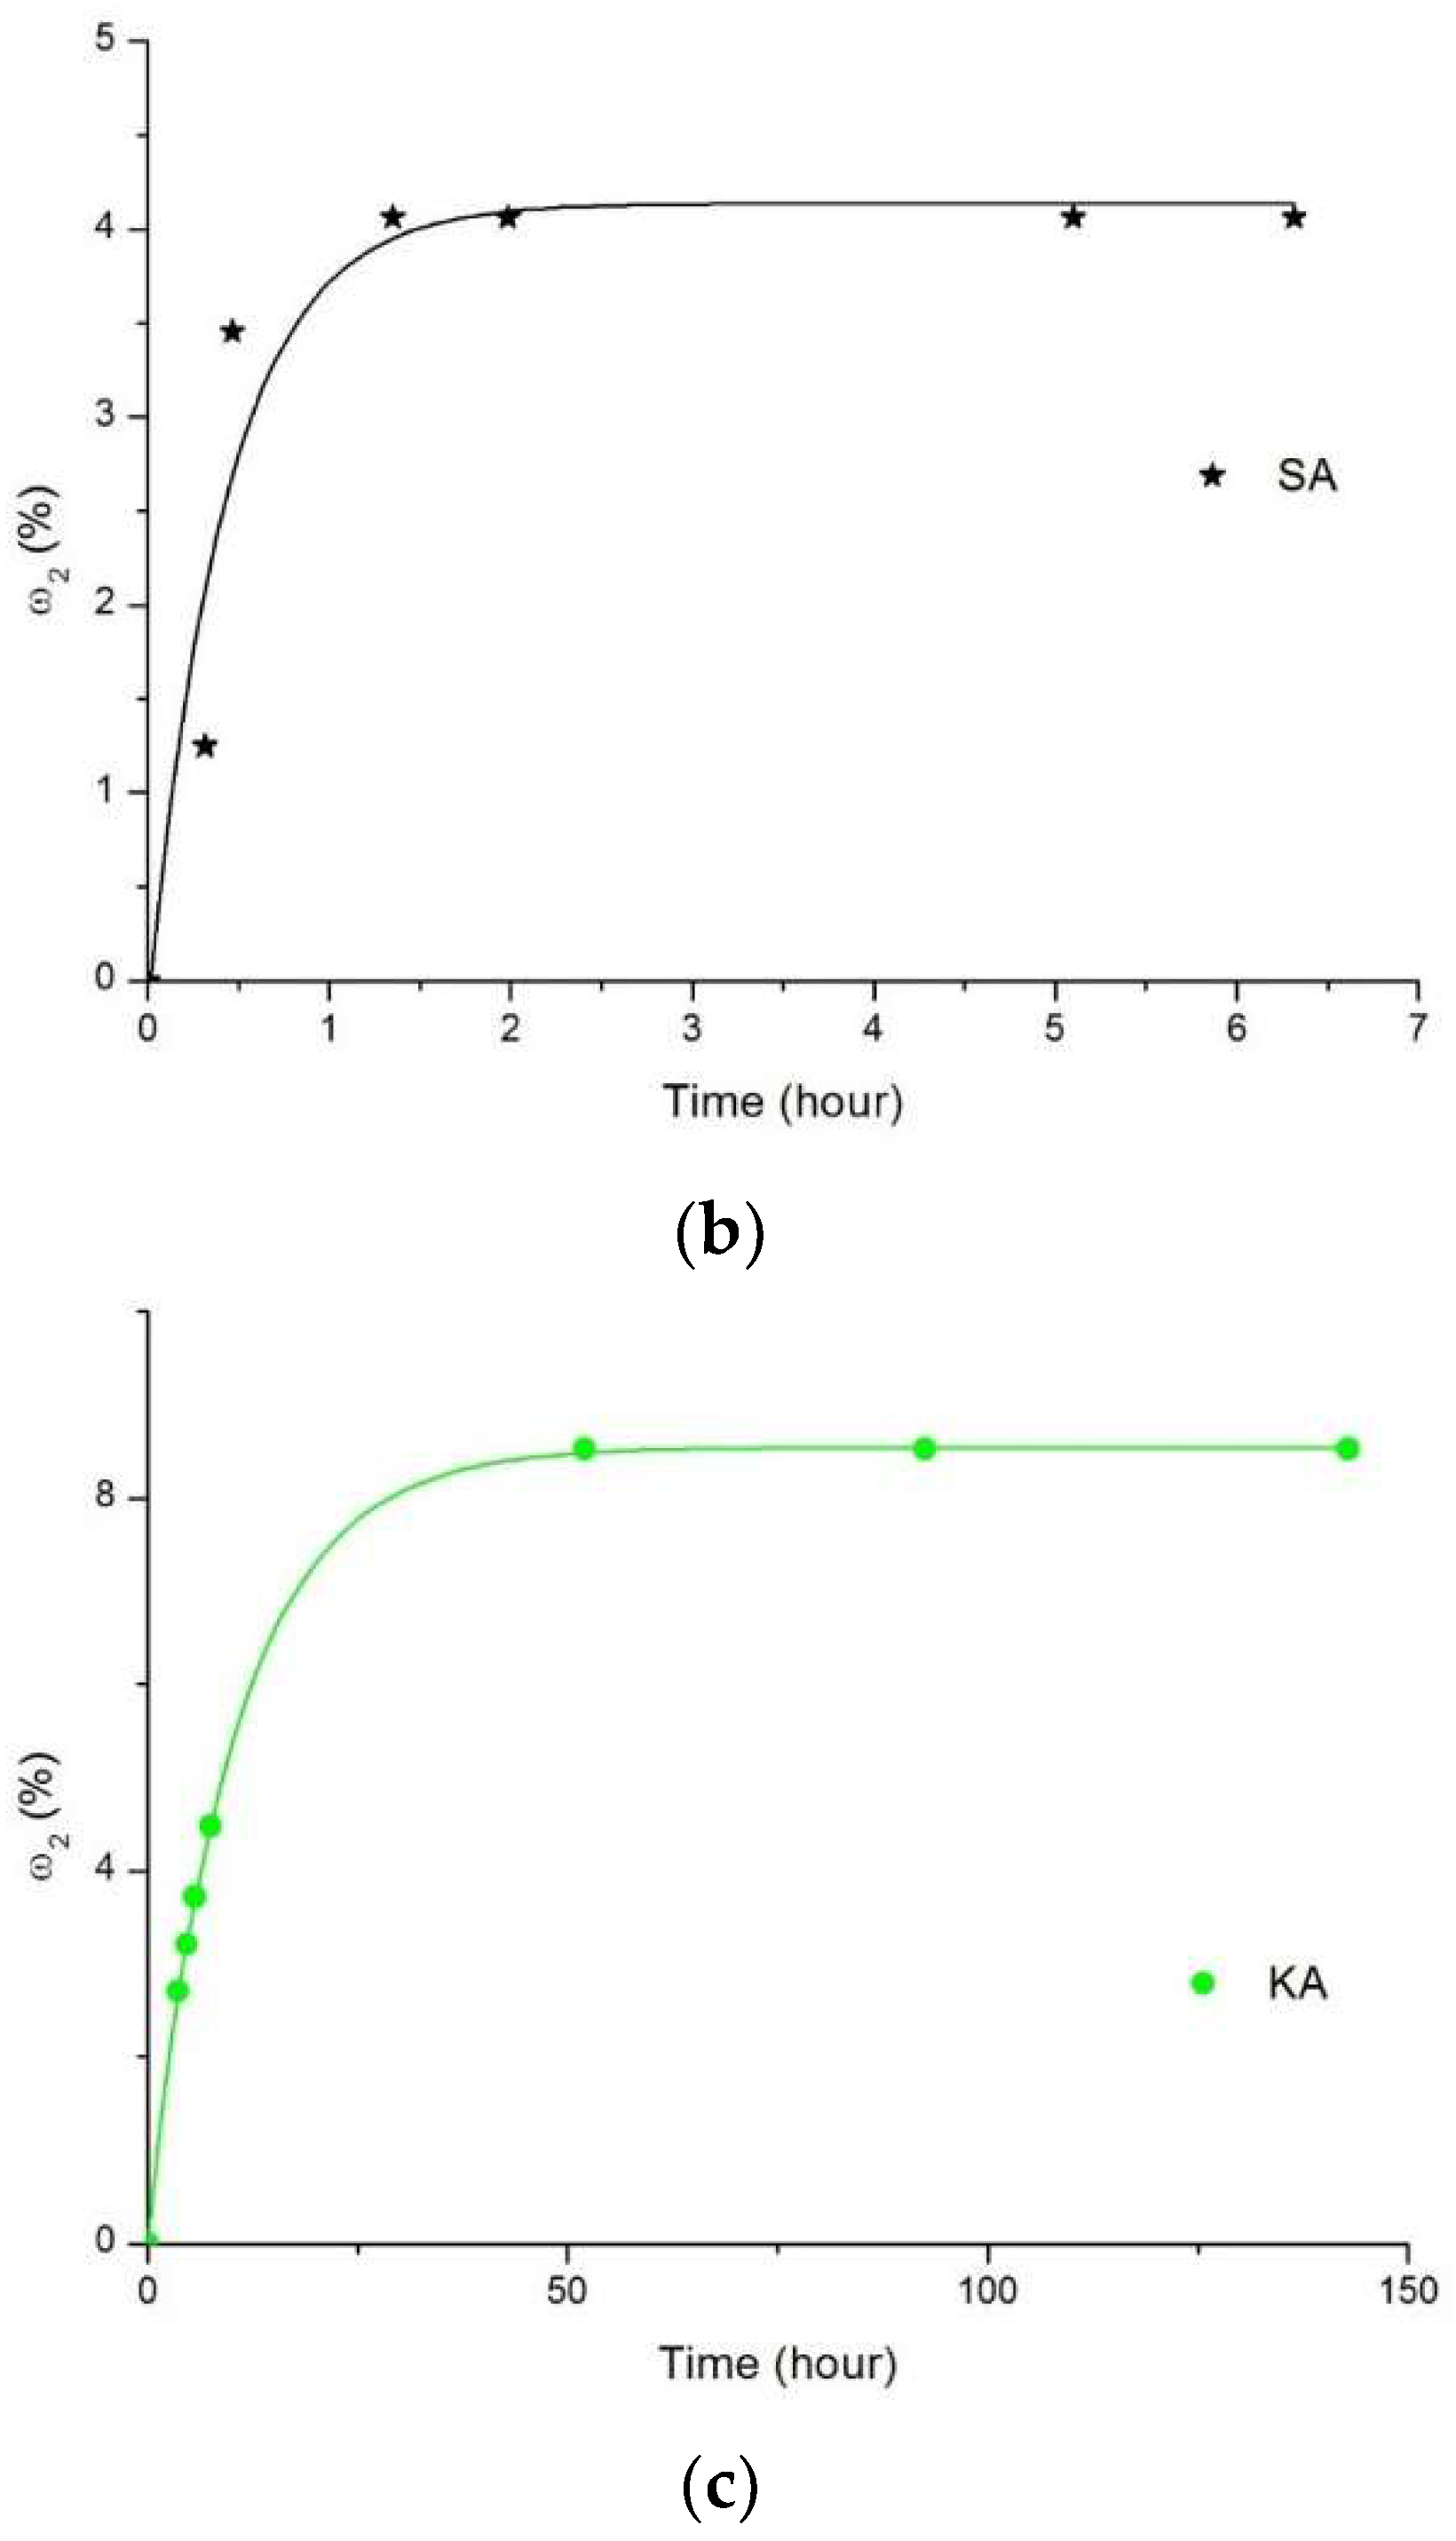
s is the corresponding dry weight. The change in drained water is plotted in Figure 4. Quick drainage of the IS, RA and RH sediments is observed compared to the others; see Figure 4a. In particular, these sediments have high drainage capacity where ω2 has reached 32%, 28% and 46%, respectively, compared to 4% and 8.5% for the SA sediment and the kaolin (KA), respectively; see Figure 4b,c.
A maximum amount of drained water is reached (
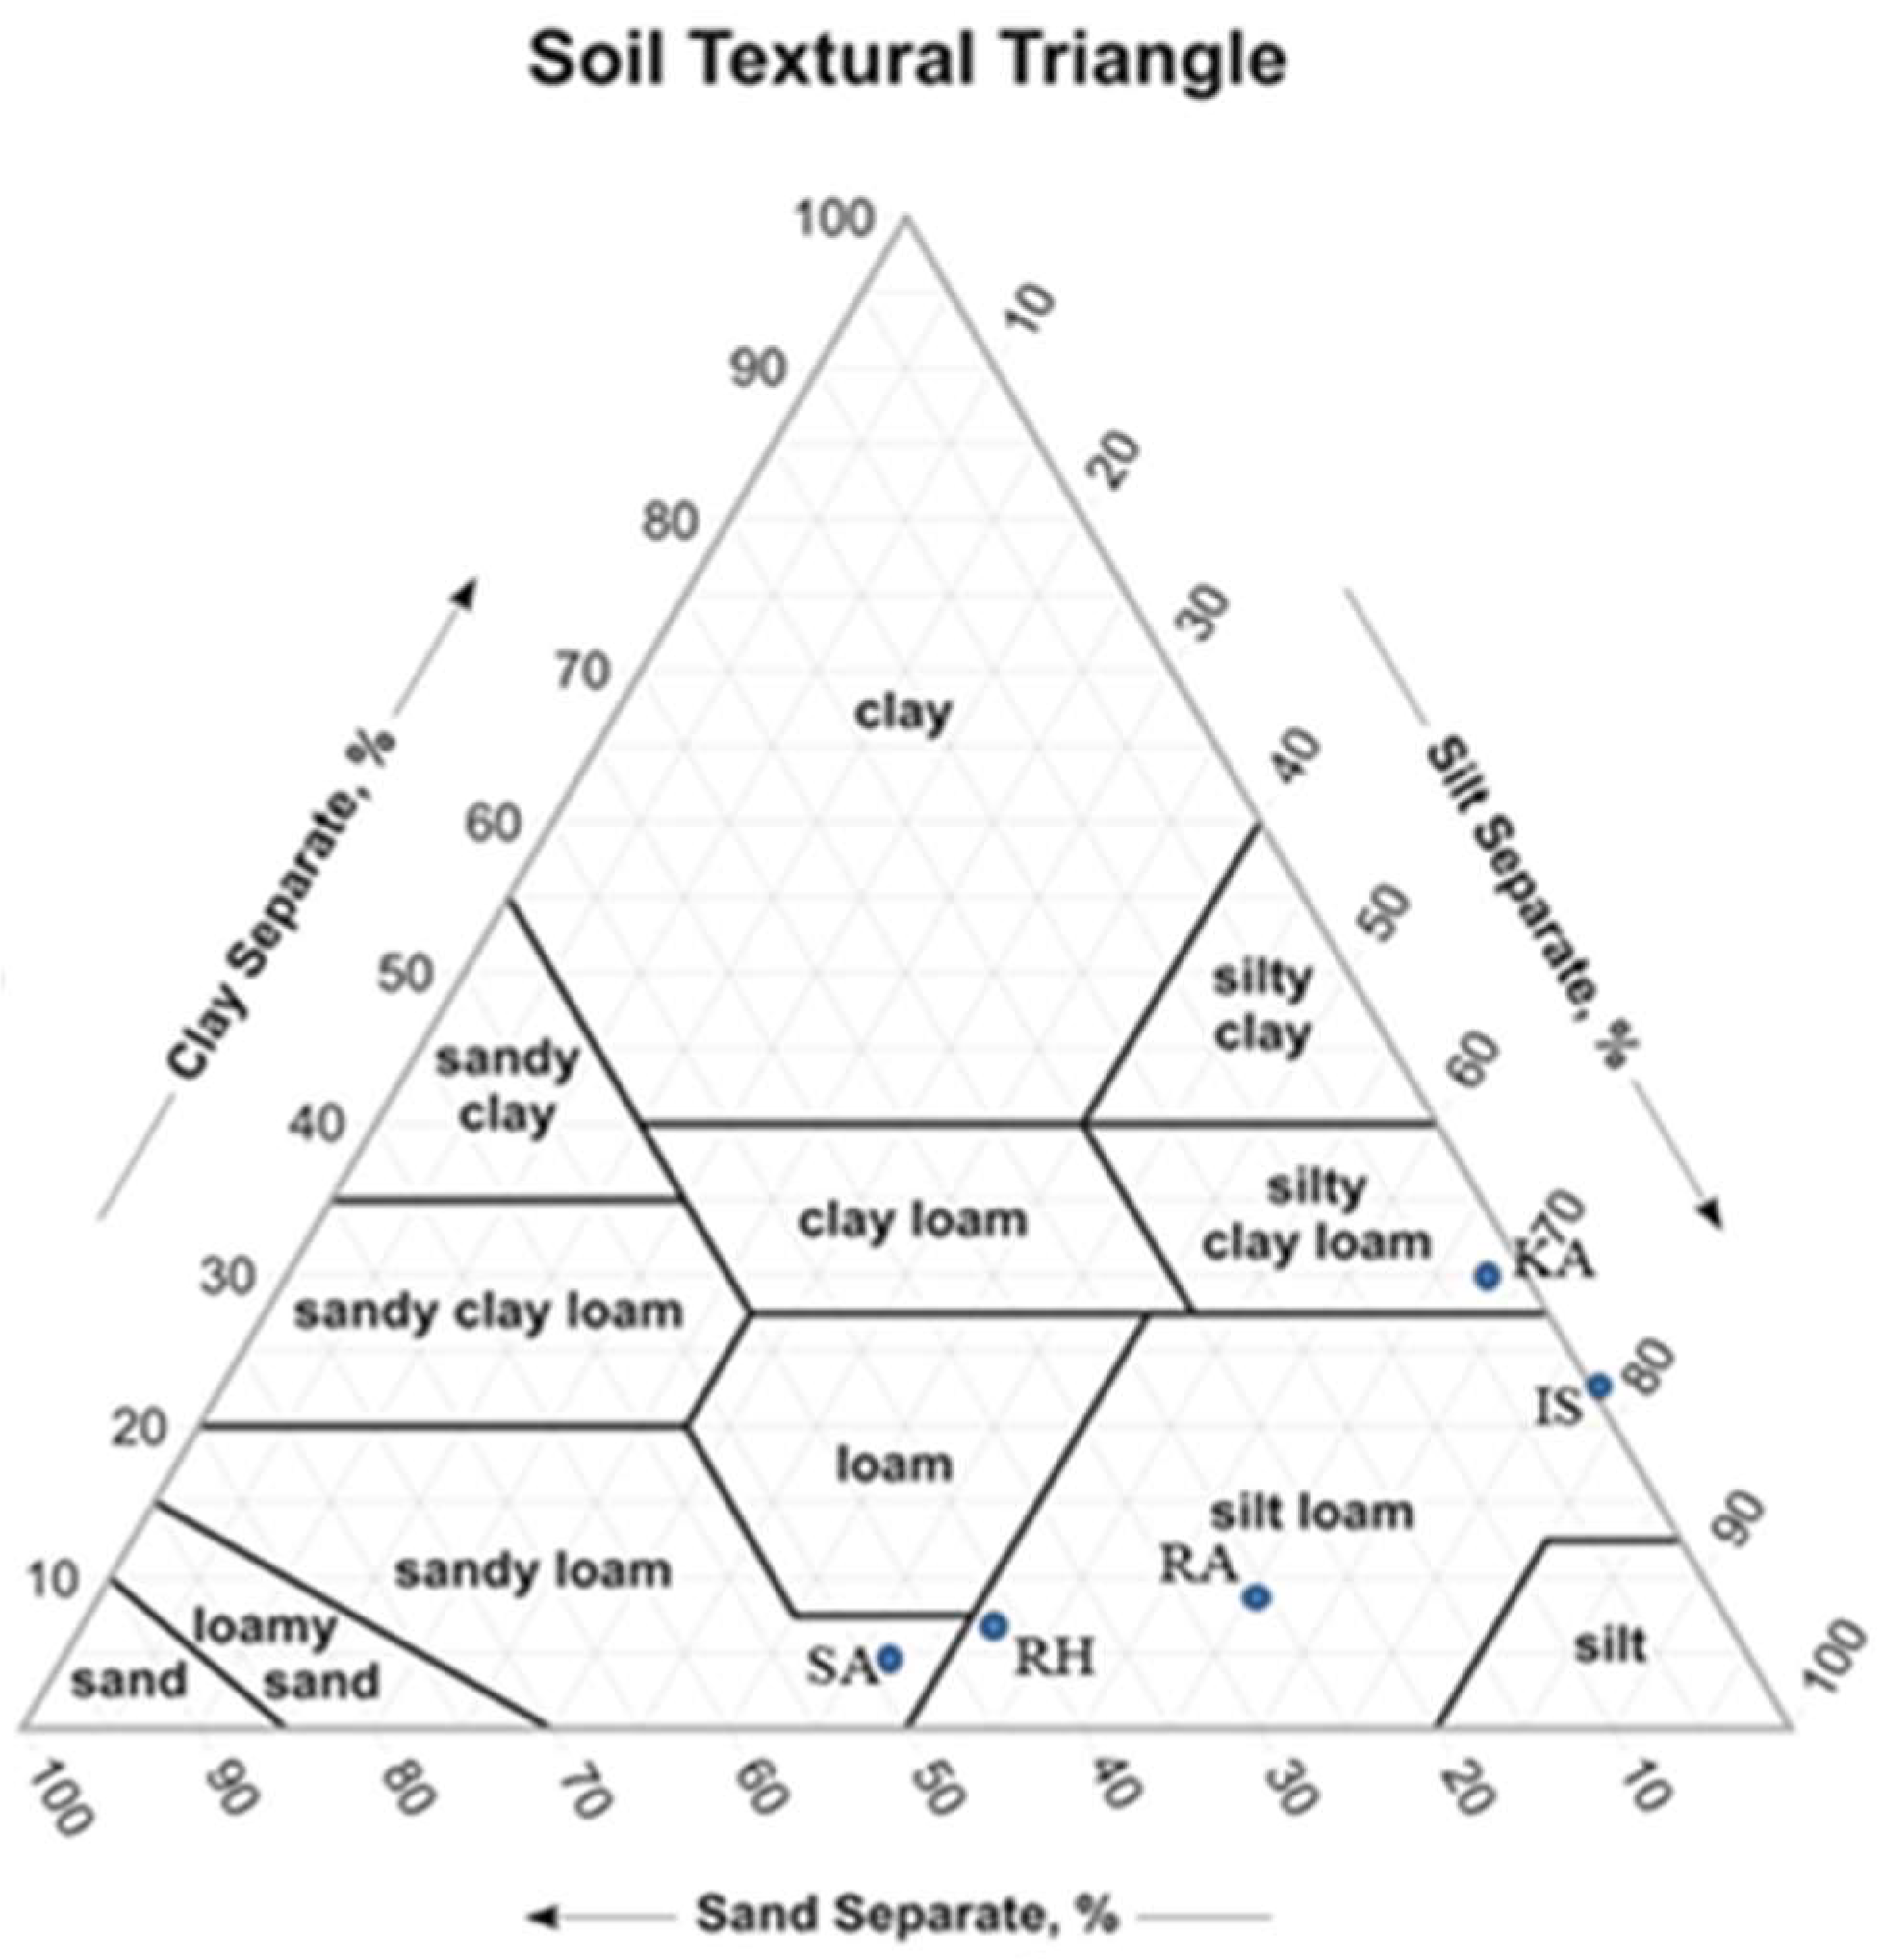
Figure 4a) for sediments with coarser soil texture, which is the case for the RA and RH sediments when compared to the IS sediment. Having the highest liquid limit—and therefore having the highest initial water content and consequently the highest void ratio—also explains the important quantity of drained water for the RH sediment. On the same figure, we observe, for the IS sediment, a finer soil texture than that of the RA sediment; the water drained was lesser for the RA sediment because of greater organic matter content; see Table 2. Sediment SA, with a significant amount of organic matter content (6.61%), contributed also to shortening the drainage time, and a low quantity of water (4%) was drained despite its coarse soil texture and minimum CaCO3 content (Table 2). Once the plateau is observed on the graphs, the drainage phenomenon tends to stop. We also note that the drainage lasts from a few hours for sediments to several days for kaolin clay (between 2 and 3 days; see Figure 4c) for a low water volume of around 8% of the initial water content. This is due to the fine colloidal texture of the kaolin that contributes to water retention, even with low percentages of CaCO3 and organic matter content. Drained water graphs fit well with an exponential function over time that corresponds to Equations (4)–(6); see Table 3.
Table 3. Possible relationships of drained water vs. time for all samples.
From Figure 4a ω2 [%] = f(t)[hour], for RA and RH sediments
Equation (4): ω2 = a(1 − bt), type: Exponential, BoxLucas 1 Mod
Sedimentabr2
RA27.610.110.99
RH45.640.230.99
From Figure 4a,c, for IS sediment and for kaolin clay (KA)
Equation (5): ω2 = a(1 − e−bt)c, type: Exponential, Chapman
Sedimentabcr2
IS33.810.100.640.99
Kaolin clay8.550.090.940.99
From Figure 4b, ω2[%] = f(t)[hour], for SA sediment
Equation (6): ω2 = a − bct, type: Exponential, Asymptotic
Sediment abcr2
SA4.144.280.100.92
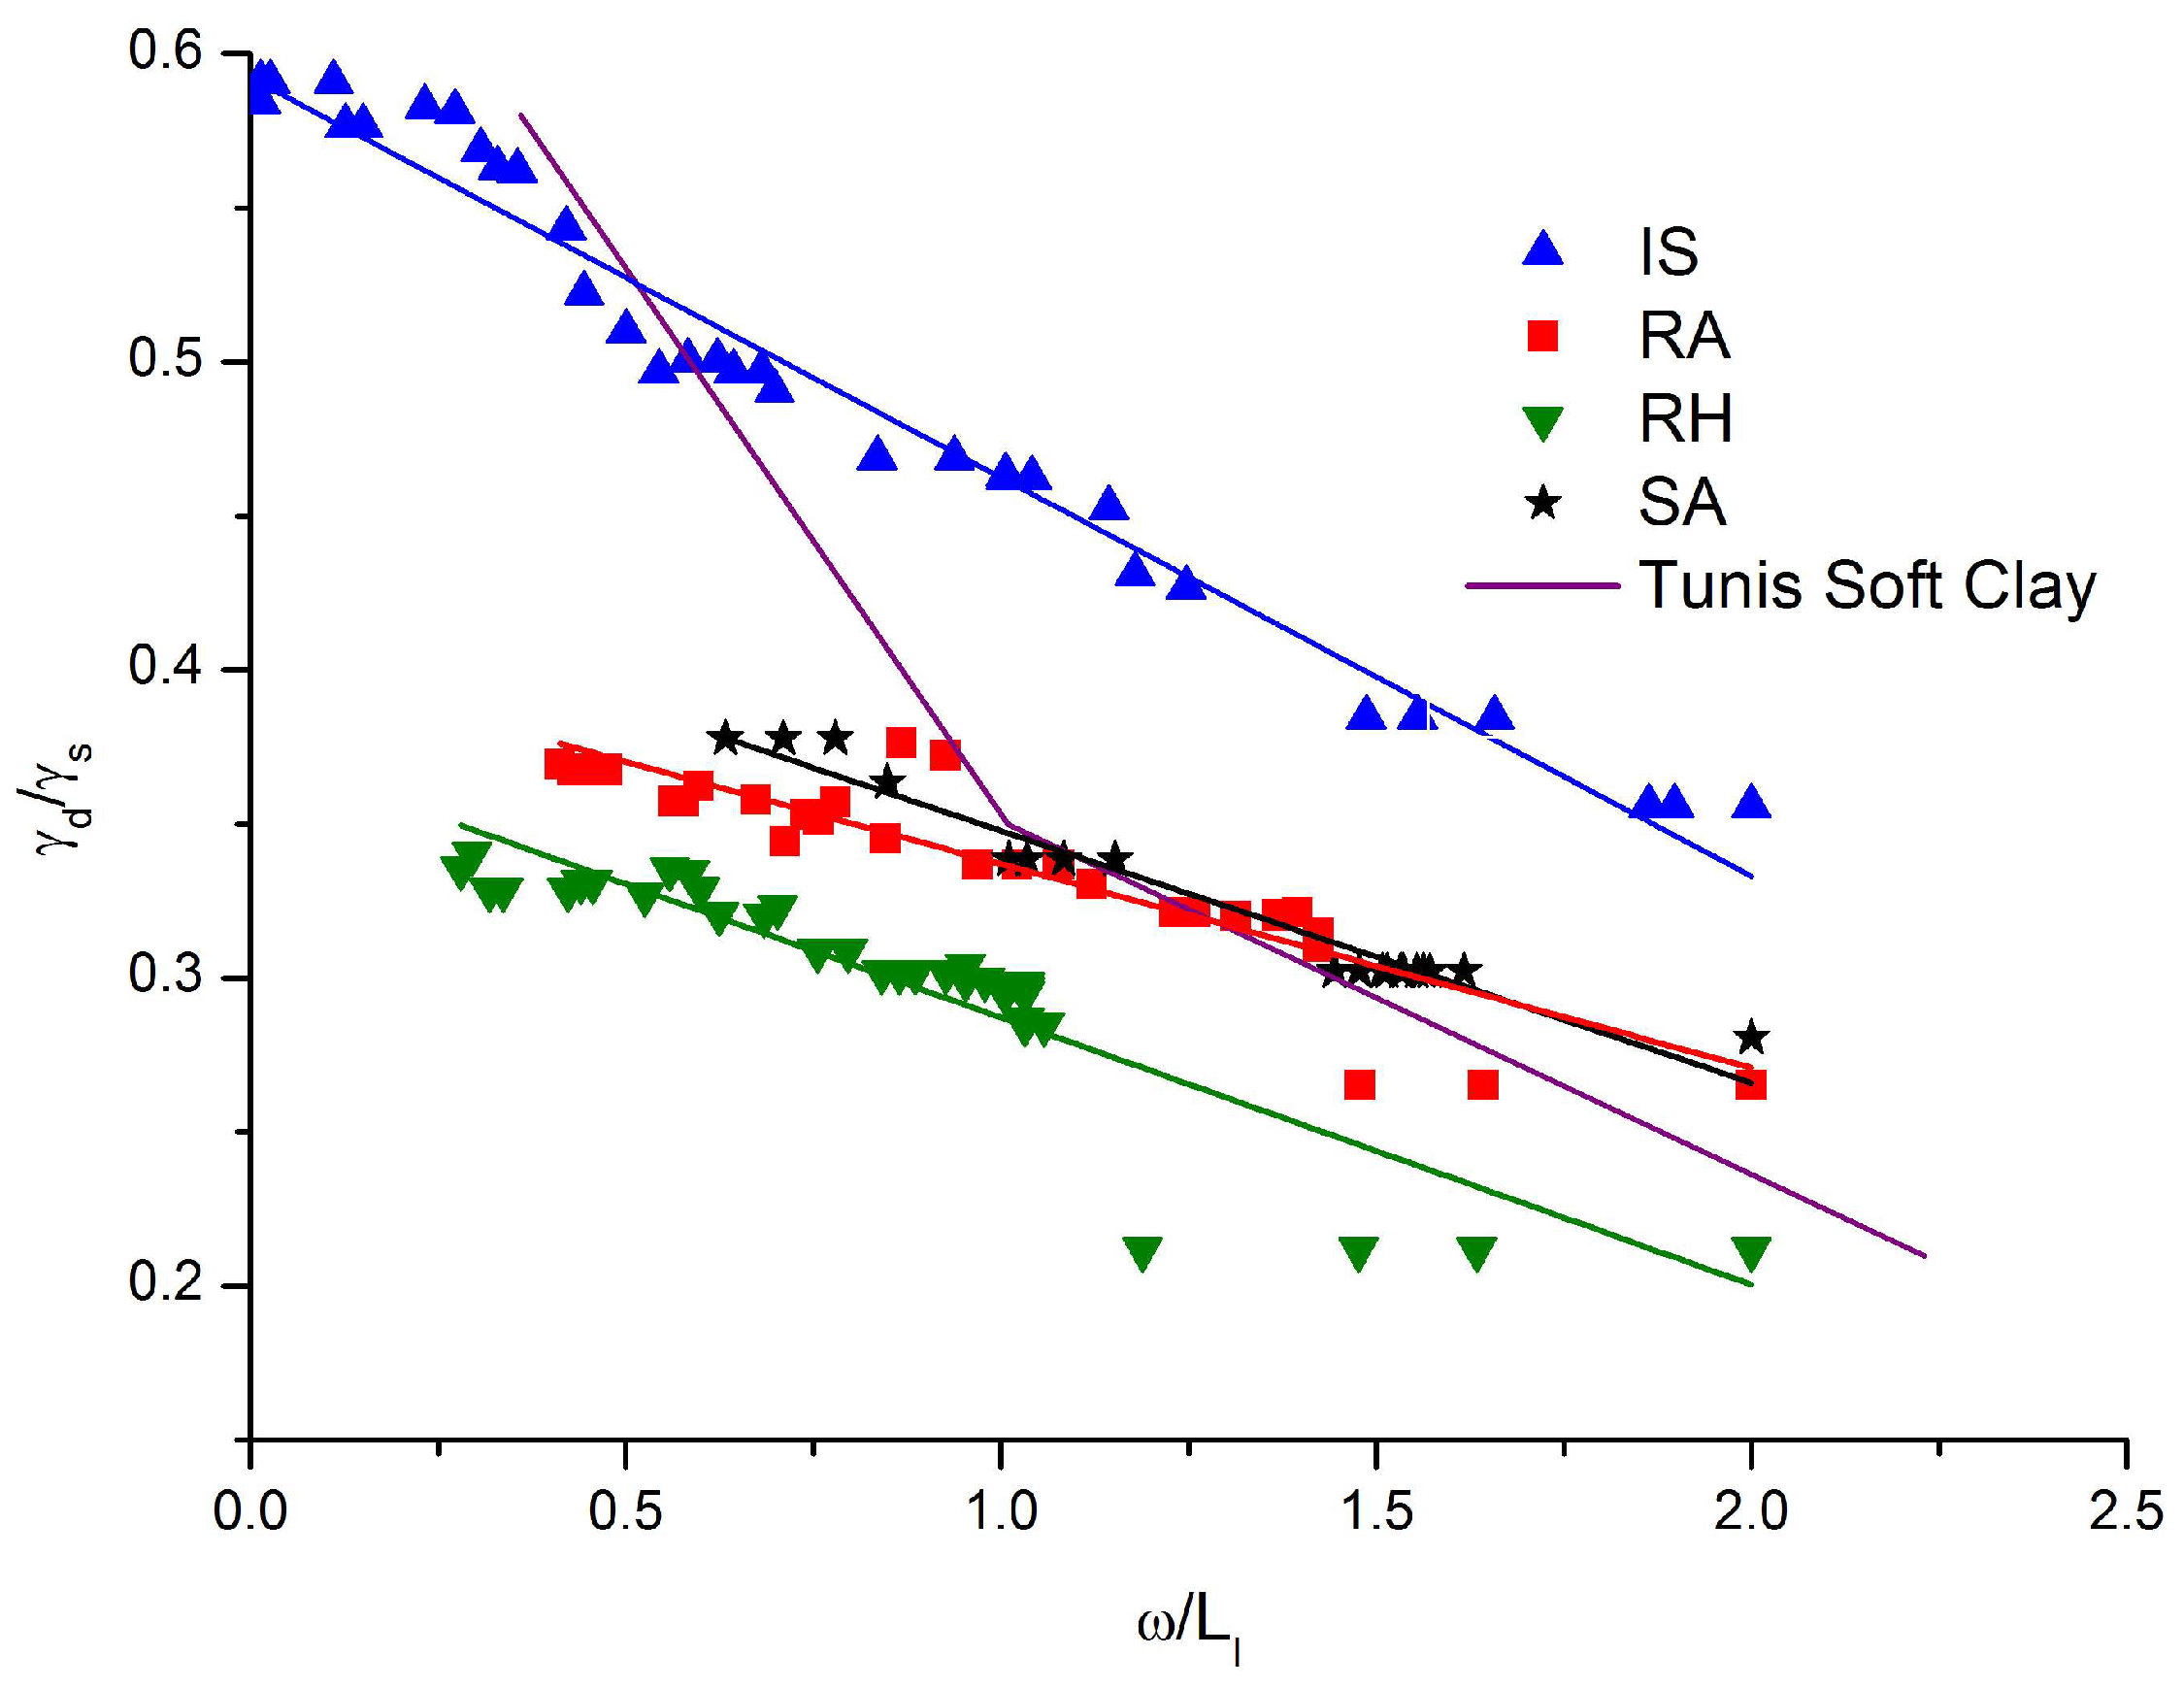
Figure 5 shows how the drained water ω2 evolves versus the normalized water content ω/LL. Drainage ends when the curve becomes constant. A similar trend is observed from the beginning of drainage till the end when the plateau appears. It is confirmed by all samples with normalized water content ω/LL = 2. The level of the plateau depends on the factors previously mentioned and govern the drainage behavior. Since the dewatering of SA sediment began from normalized water content lesser than the other tested samples (ω/LL = 1.56), it seems that the initial slope is not so different from the other samples as illustrated in Figure 5. It is evident that the drainage depends on the initial water content of the sample as well as its consistency. The evolution of ω2 versus normalized water content ω/(LL) is well characterized by a sigmoidal-type function; see Equation (7) in Table 4.
Table 4. Possible relationships of drained water vs. normalized water content for all samples.
From Figure 5, ω2 = [%] = f(ω/LL)
Equation (7): ω2 = A2 + (A1 − A2)/(1 + ((ω/LL)/((ω/LL0.5) p))) type: Sigmoidal, Logistic
SedimentA1A2ω/LL0.5pr2
IS32.65−8.321.759.360.99
KA8.55−1.251.9243.640.99
RA27.52−0.101.6630.470.99
RH46.17−4.981.589.000.99
SA 4.080.007731.26108.070.99
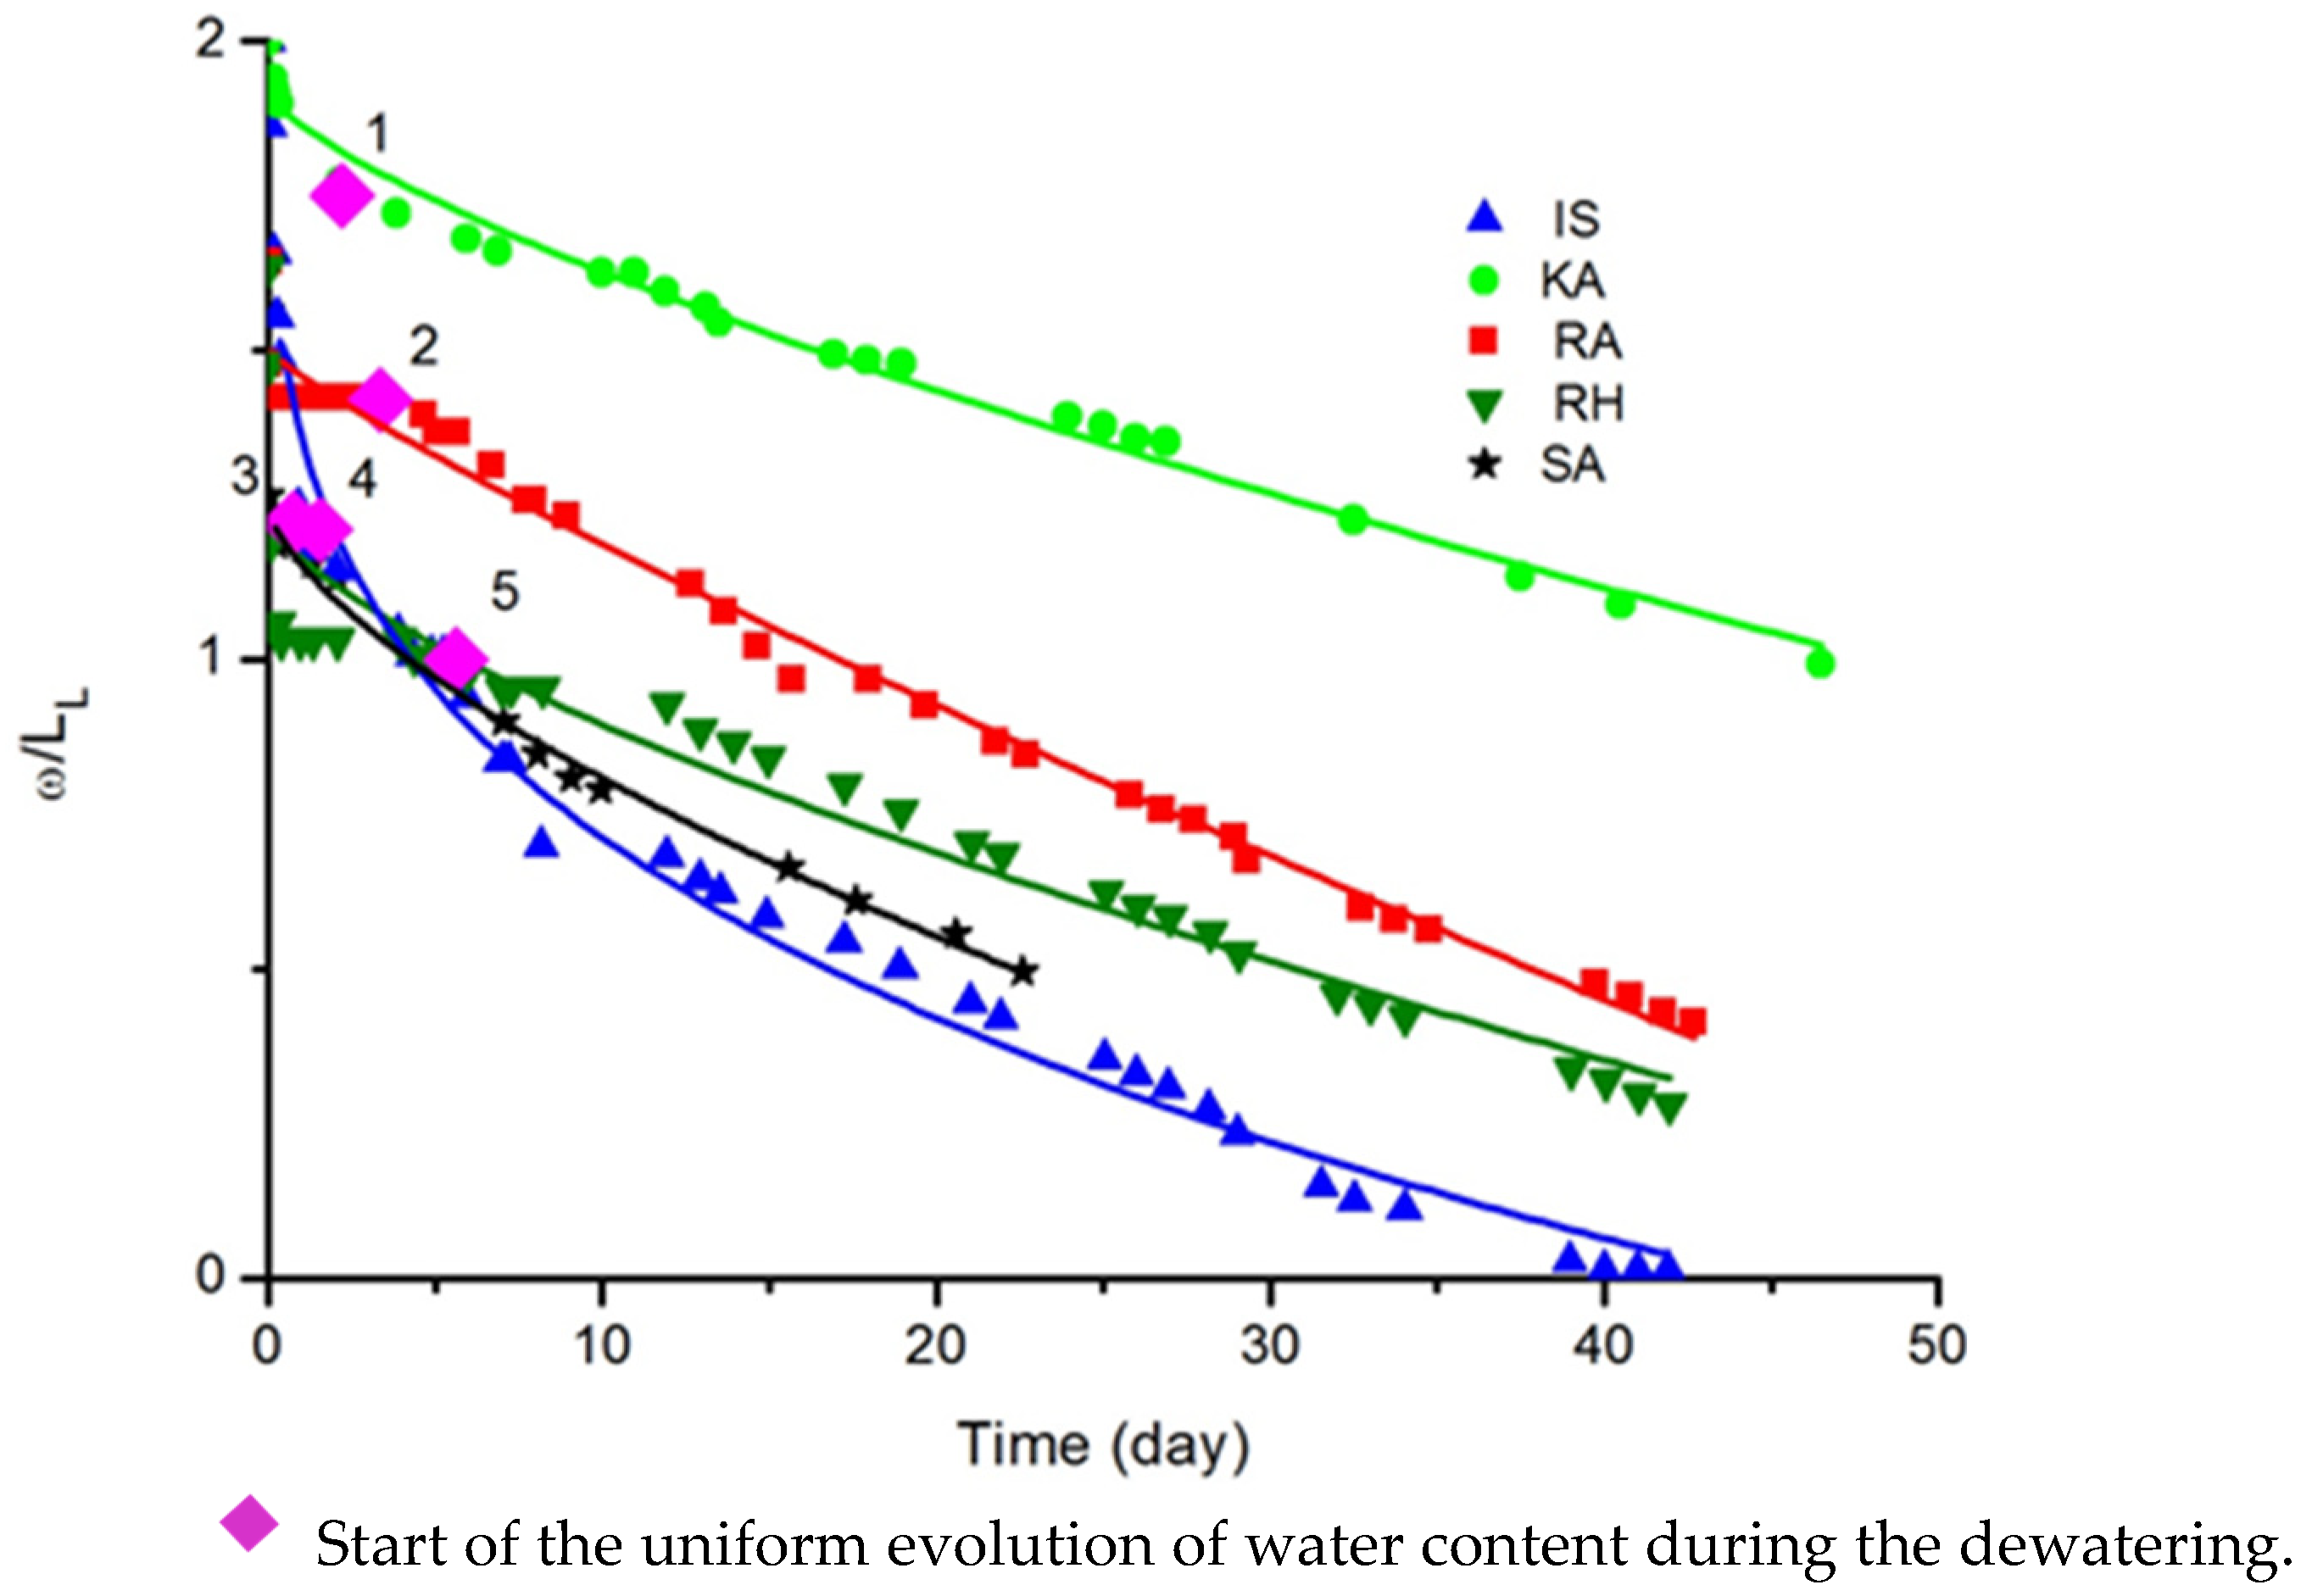
Figure 6 illustrates how the normalized water content evolves for all samples over time. When reaching a specific value in less than a week, indicated by pink diamonds, the normalized water content shows an approximately uniform rate of evolution. These specific values correspond to the end of drainage, which is observed in Figure 4. Hence, in addition to the remaining water—see Equation (3)—the normalized-water-content-to-liquid-limit ratio ω/LL depends also on the ω2 percentage rather than the samples’ physical states.
The normalized-water-content-to-liquid-limit ratio ω/LL seems to fit with a power type evolution with time for all the samples, as detailed in Equation (8); see Table 5.
Table 5. Possible relationships of water content to liquid limit vs. time for all samples.
From Figure 6, ω/LL = [%] = f(t)
Equation (8): ω/LL = a + btc, type: Power, Allometric
Sedimentabcr2
IS2.00−0.700.280.99
RH1.23−0.070.690.90
KA1.92−0.050.730.99
RA1.50−0.040.870.99
SA1.25−0.090.660.99
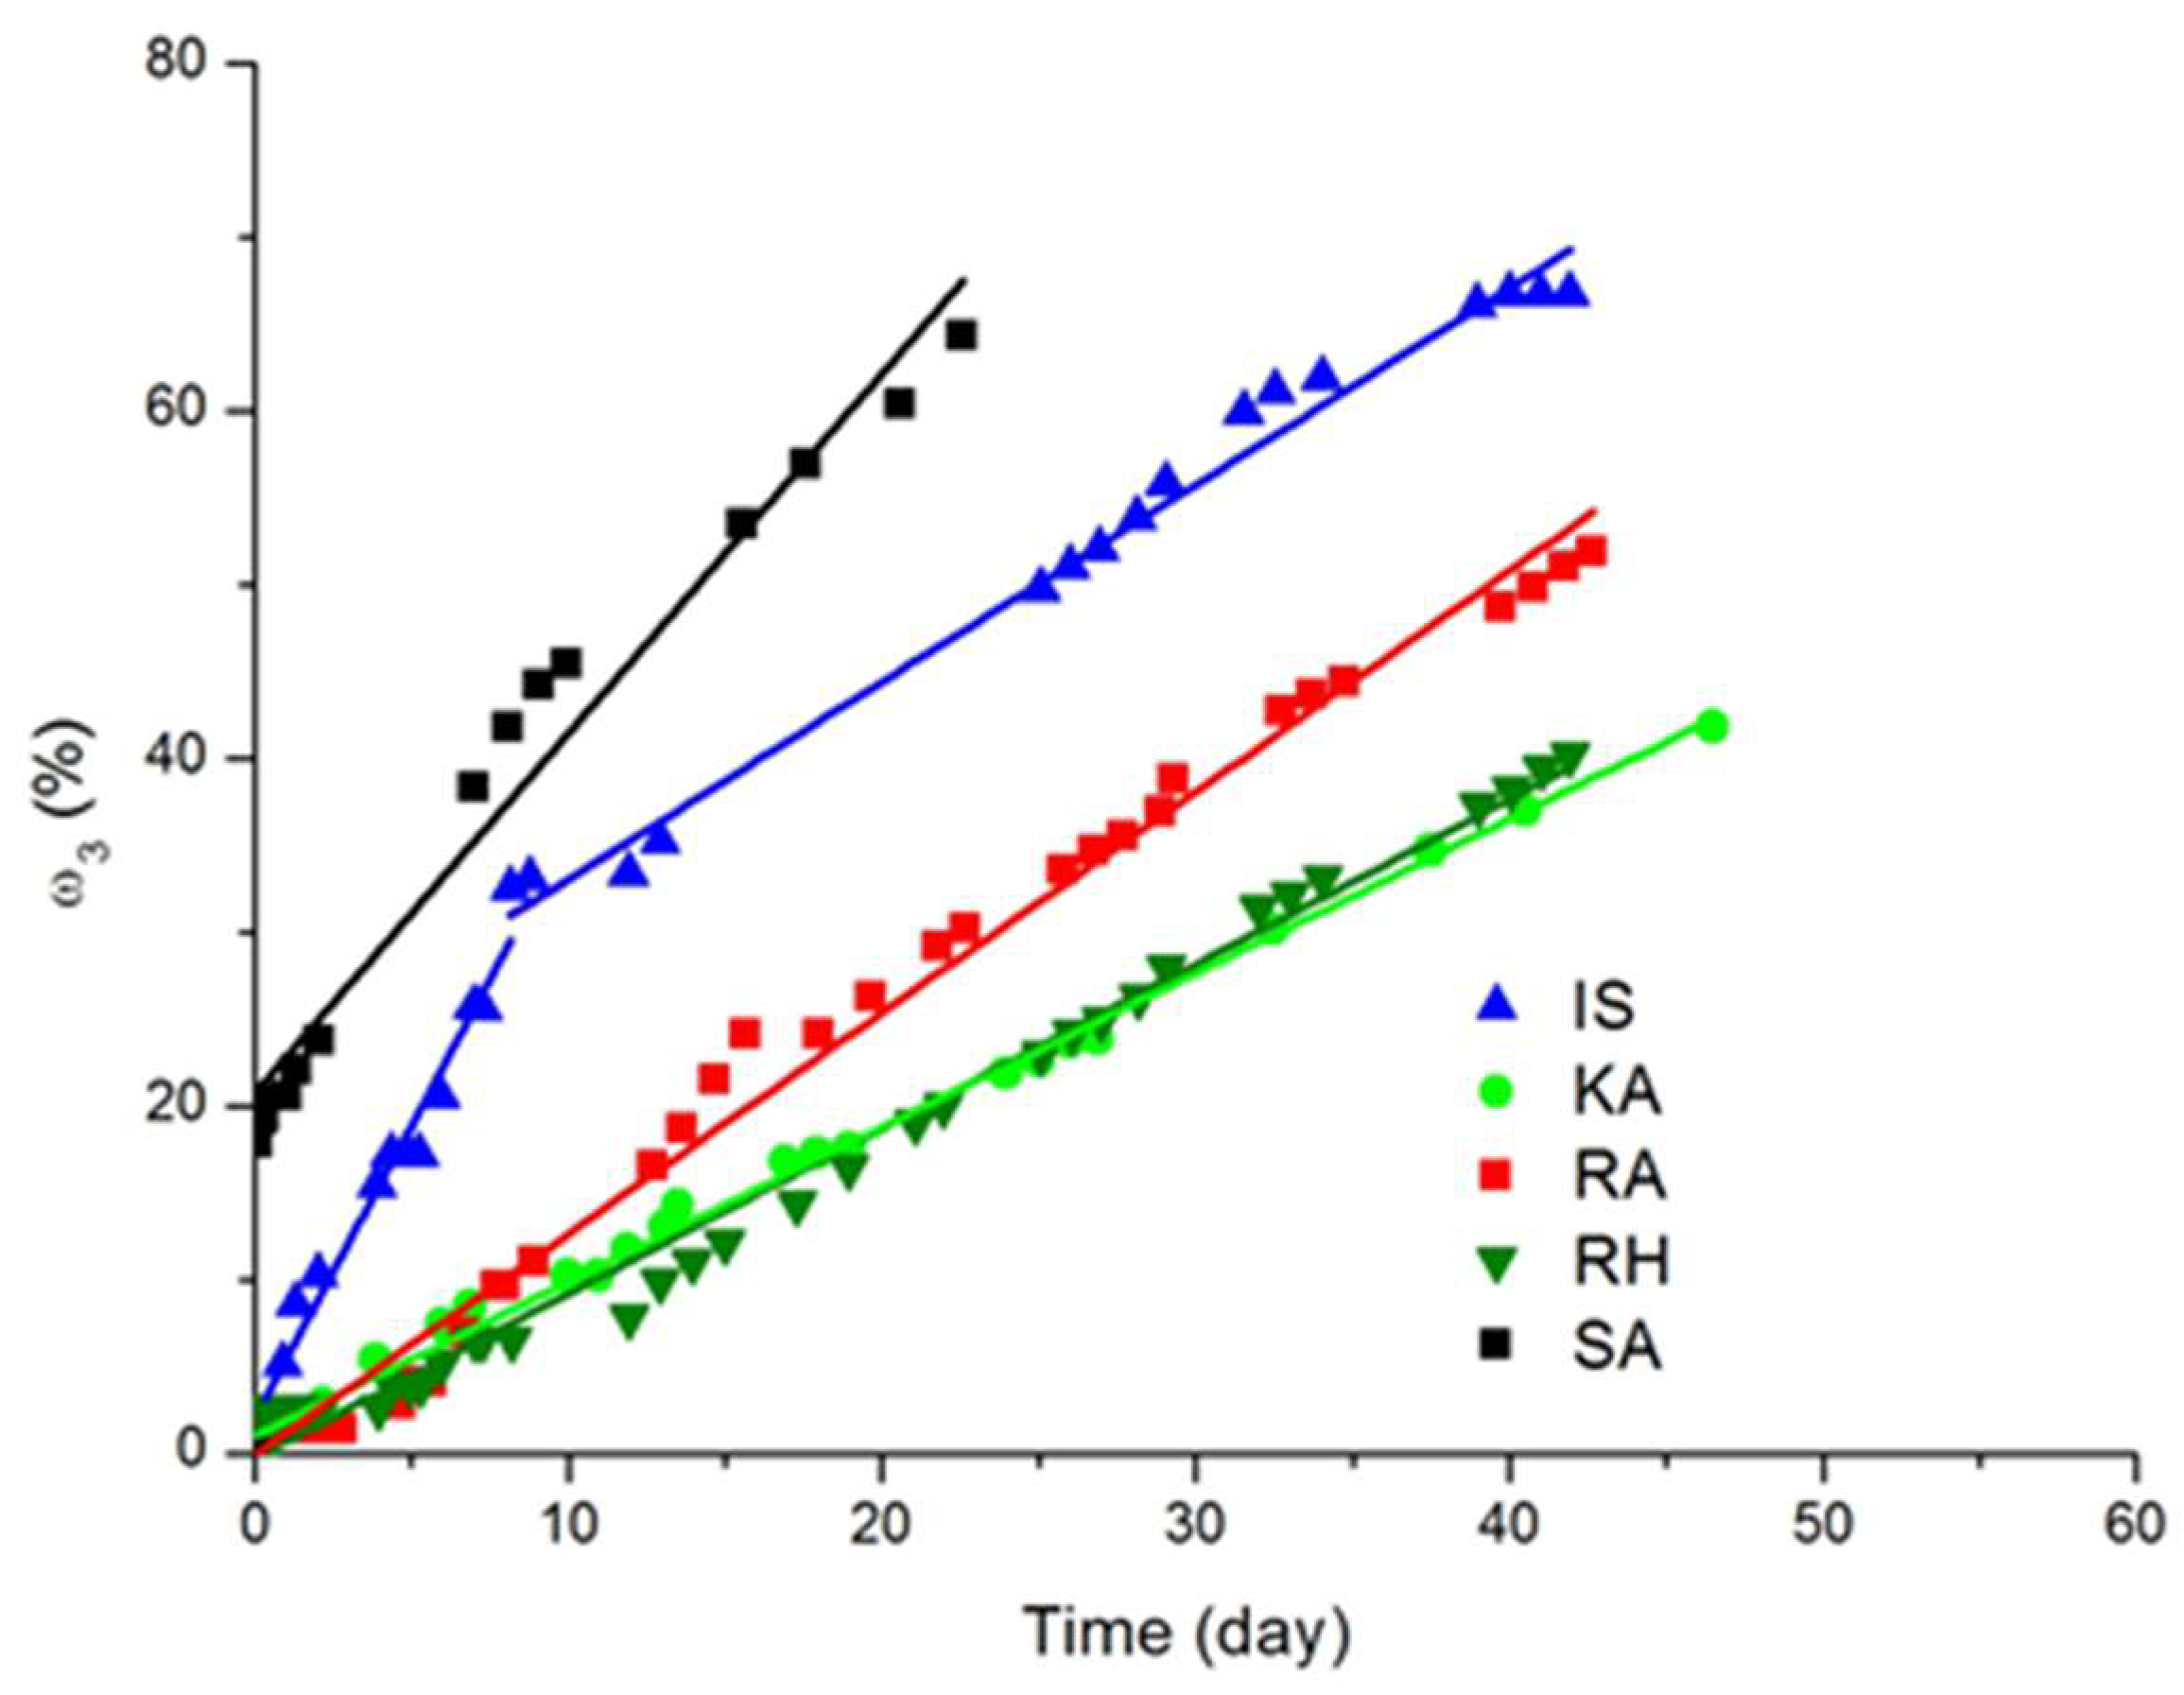
Considering the evaporated water in Figure 7, a linear increase of ω3 over time is observed fitted with Equation (9) in Table 6.
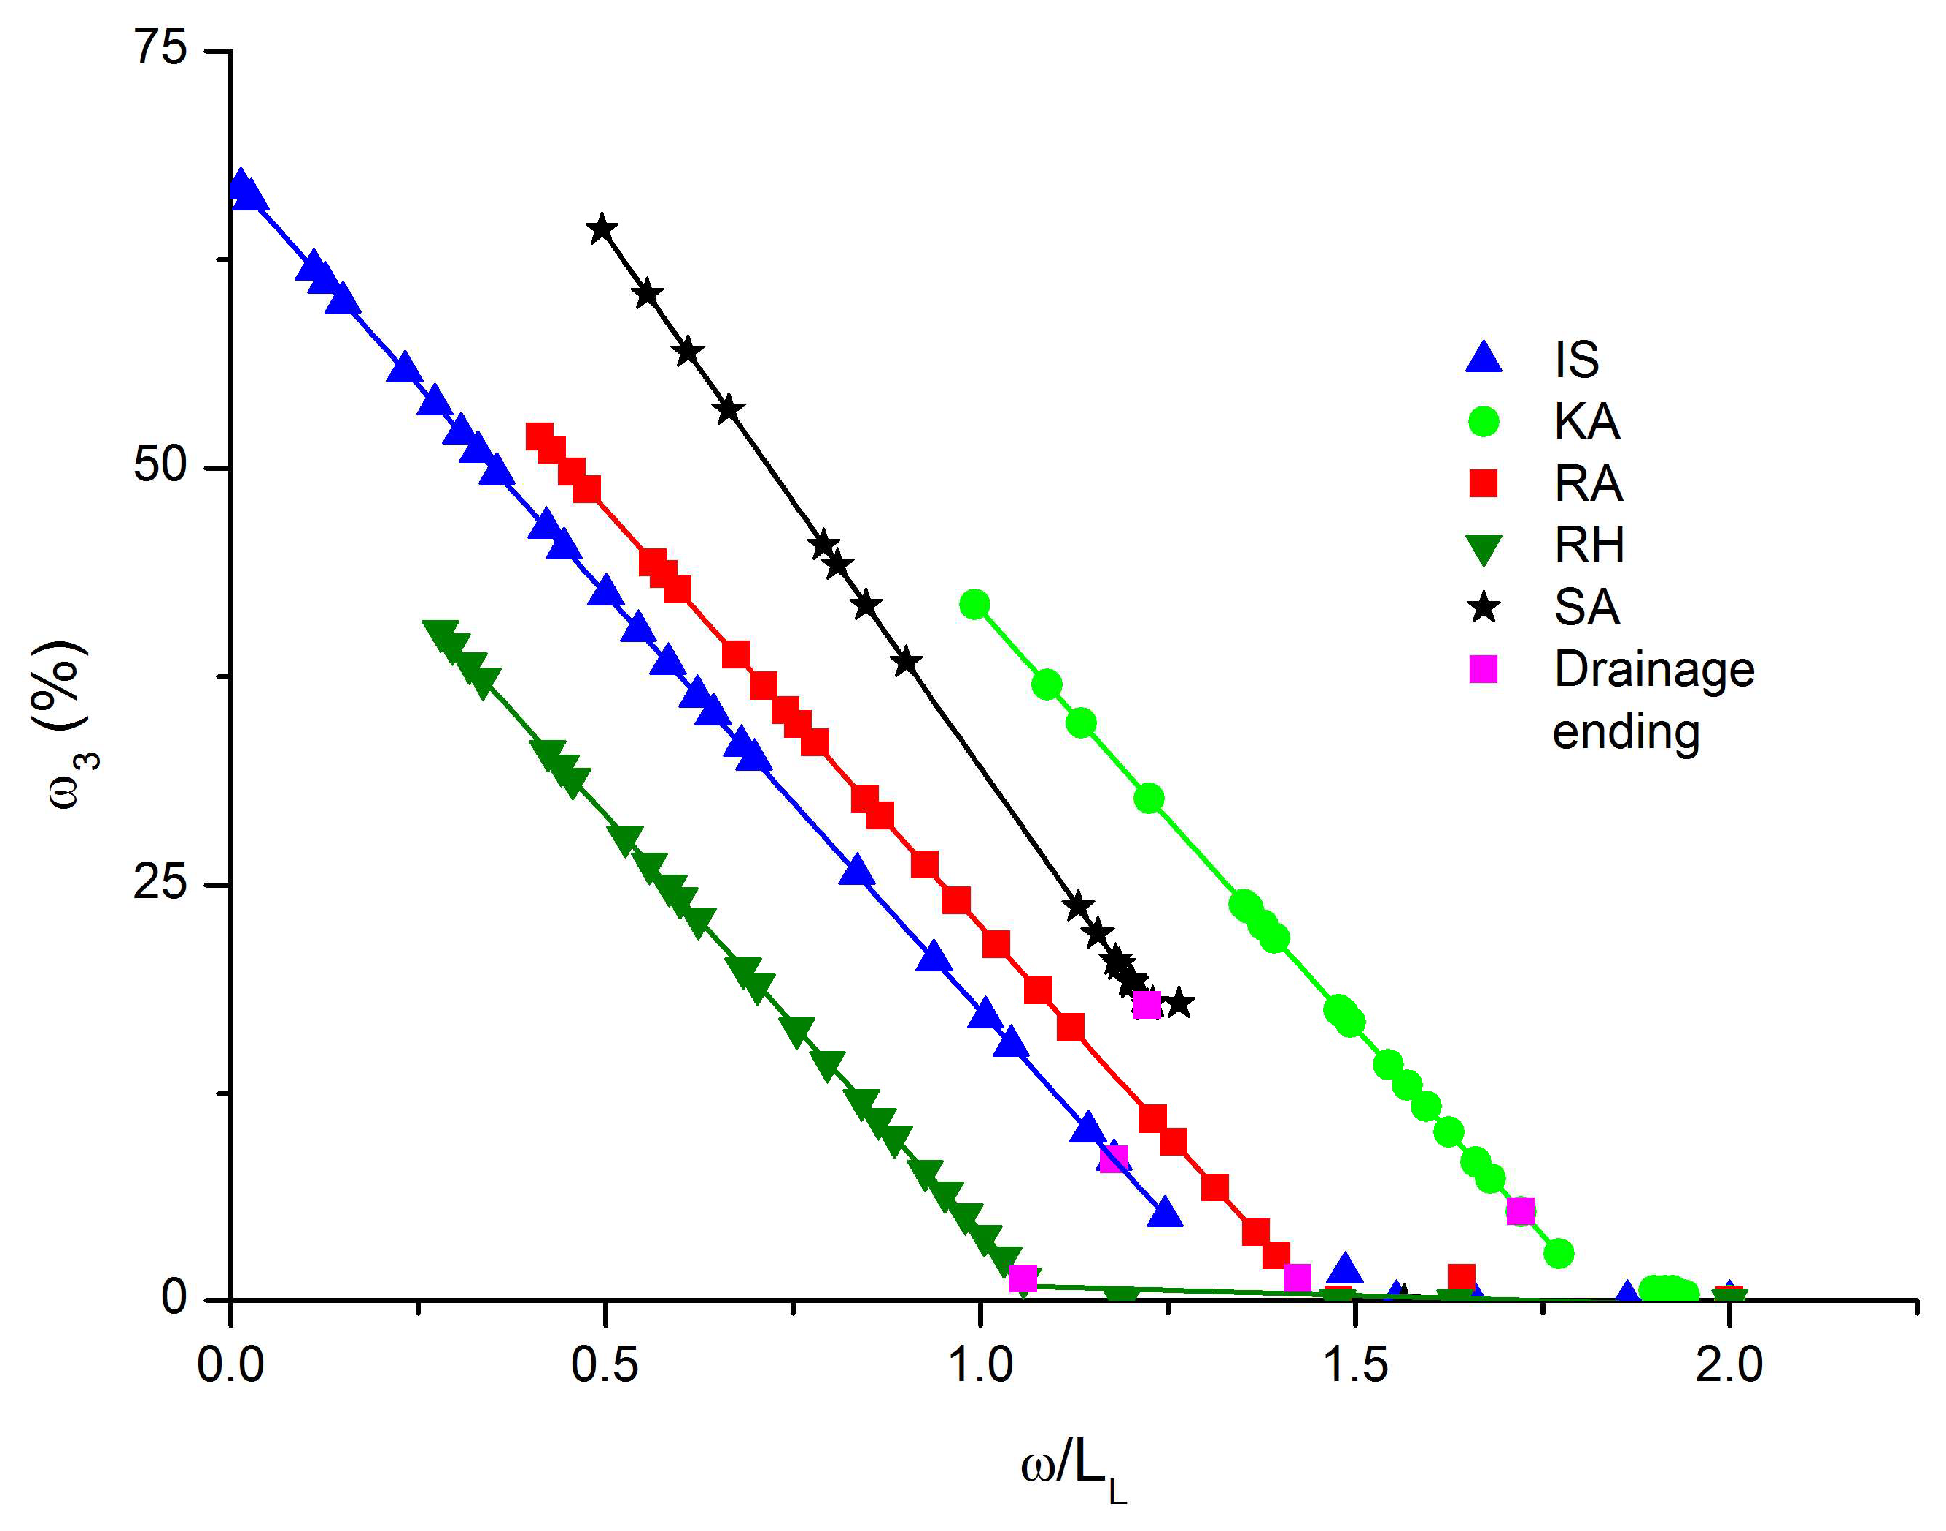
Beyond the end of drainage, if ω3 is plotted as a function of ω/LL, we also observe a linear variation. For the RH sediment, the linear increase starts when the sediment reaches the liquid limit; see Figure 8.
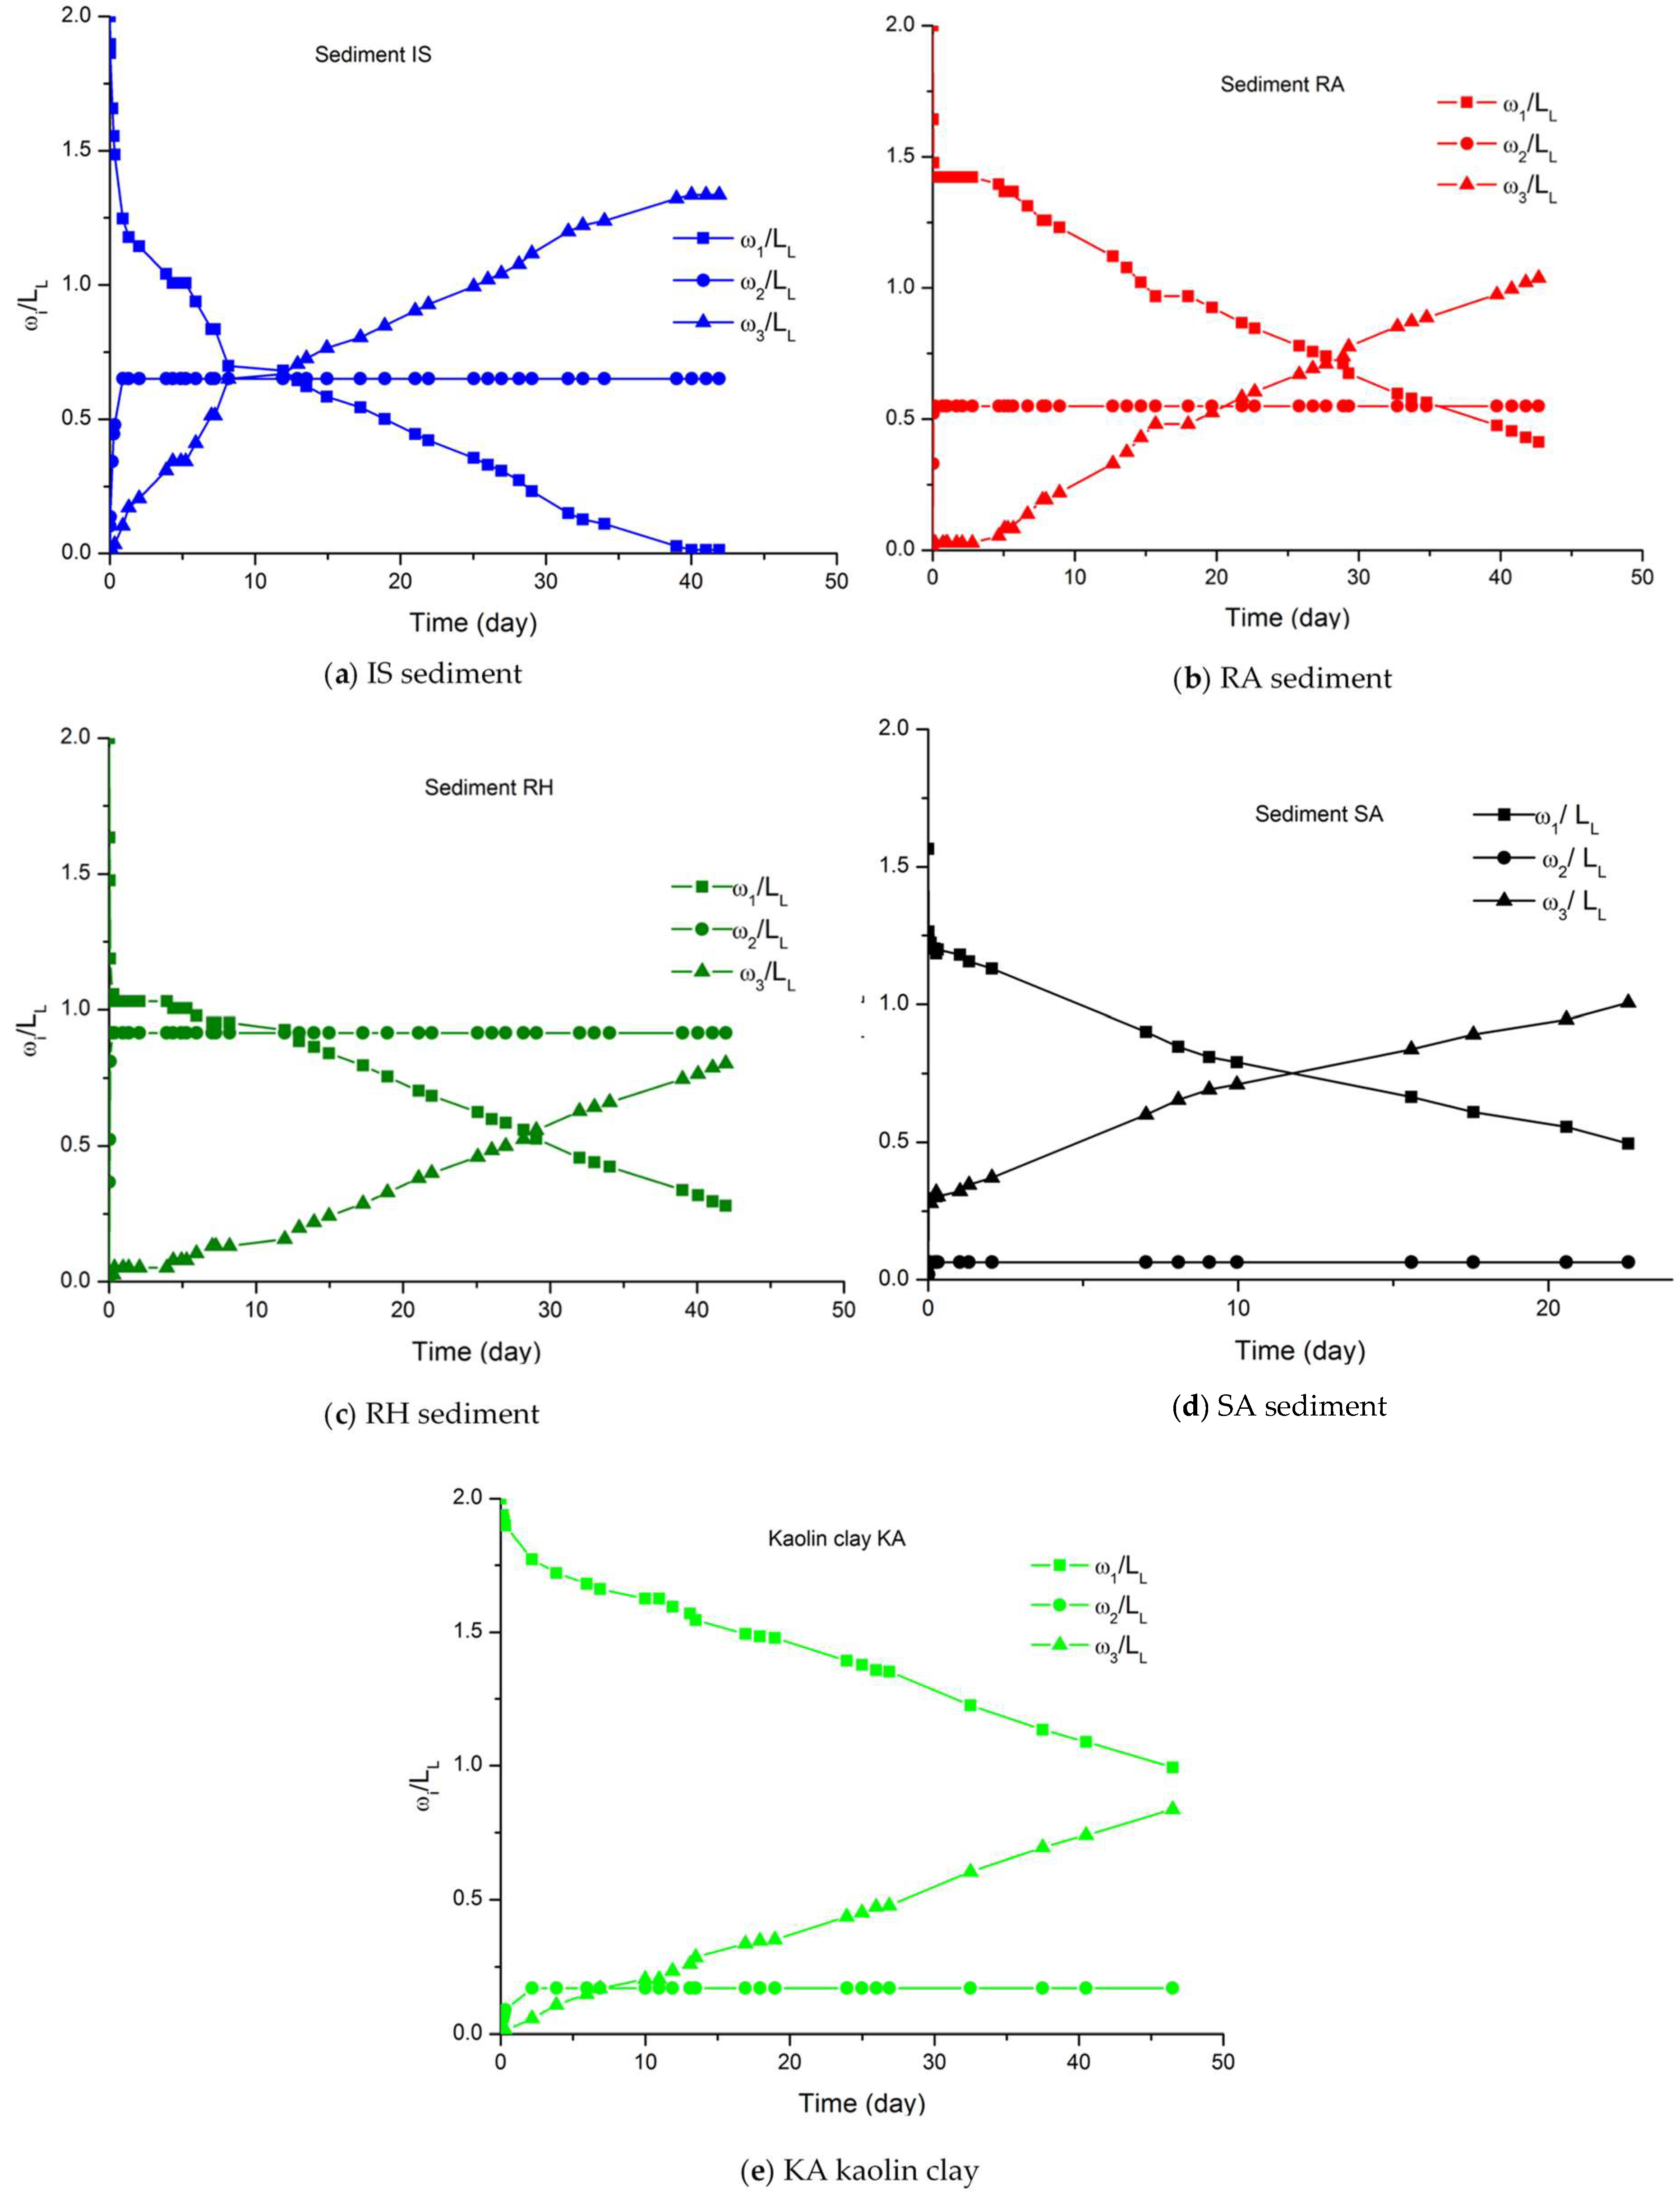
If we observe all the quantities of water, ω1, ω2 and ω3, during the dewatering process in Figure 9, it is confirmed that (1) the evaporated water increases linearly when drainage stops, and (2) the approximate slope change in water content in sediments is roughly noted. This is more perceptible for the sediments in Figure 9a–d than it is for kaolin, as illustrated in Figure 9e.

3.2.2. Void Ratio Evolution

The void ratio e is usually calculated from Equation (10):
e = ɤsd − 1 = ɤs/(gMs/VT) − 1
where ɤs = 26.5 kN/m3; g = 9.81 m/s2; ɤd is the dry unit weight; Ms is the mass of dry solid particles; and VT is the total volume. The dewatering phenomenon resulted in sediment shrinkage. Shrinkage characterization requires the determination of the void ratio by finding out the initial weight of the sample and its initial volume as given in Table 1. The variation in the diameter and height of the sample versus time is assessed as explained in Section 2.2.1; it allows one to determine the void ratio. Considering Figure 10, the RH sediment underwent significant shrinkage over 5 hours; its void ratio decreased from 3.7 to 2.5. This is explained by the high sand fraction of about 41.7% which enhances water drainage and then subsequent grain rearrangement. The same shrinkage behavior is also observed for the RA sediment, which contain 26.3% of sand fraction. The decrease in void ratio was from 2.7 to 2.1 over two days, as illustrated in Figure 10. Such an observation could be explained by the initial water content ω0, considering that the higher the water content, the higher the void ratio is. For the RH sediment, initial water content equals to 142%, which makes it 1.3 times that of the RA sediment’s ω0. The IS sample, with the lowest organic matter, shows a slow decrease in void ratio versus time. Note its drainage needed more time than the other sediments as seen in Figure 4a. Sediment SA, with its ω0 = 101.8% and ω0 = 1.57 LL, sustained little volume change within an hour; its void ratio varied from 2.5 to 2.3 before stabilizing.
Figure 10 shows the instantaneous rearrangement of particles of sandy soil highlighted with a rapid decrease in void ratios for sediments RA and RH. In turn, the colloidal behavior of the clayey materials in the IS sediment and kaolin clay (KA) resulted in a slow decrease. The variation in void ratio versus time illustrated in Figure 10 is correlated by a power-type evolution given by Equation (11) given in Table 7.
Based on the variation in void ratio for all samples with comparable initial water content, it is concluded that soil texture mostly governs soil particle rearrangement during drainage.

3.3. Geotechnical Characterization

3.3.1. Variation in Dry Unit Weight

Unit weight has an important role in sediment transportation as a parameter interfering with the bulk factor of soil and hence its volume. It also affects soil consolidation and, consequently, its undrained shear strength [31]. Touiti et al. [32] proposed for Tunis soft clay characterization a linear correlation (slope variation). All samples of Tunis soft clays were tested at liquid limit LL with varying clay content ranging from 20% to over 70%. As shown in Figure 11, a linear variation is more or less observed for a range of water content beyond the liquidity limit. Their evolution is perfectly characterized by a linear function; see Equation (12) given in Table 8. Fitting is based on data corresponding to Figure 11 with a minimal regression coefficient r2 = 0.83. The clay content in the sediments could explain the difference of the coefficients (a) relative to the slope; see Table 8. The slope is more pronounced with Tunis soft clays [32]. It is observed that the RA, RH and SA sediments have a similar slope due to their comparable soil texture. The IS sediment, whose texture is much finer compared to other tested sediments, has a different evolution; see Figure 11 and Table 8.

3.3.2. Shear Strength Relationships

Figure 12 illustrates undrained shear strength evolution with water content leading to the conclusion that shear strength is developed after drainage ending. Maximum values of undrained shear strength for the IS, RA and SA sediments were in the same ranges as shown in Figure 13 and Figure 14. For the SA sediment, the undrained shear strength Su reached 75 kPa in 18 days, followed by the RA sediment, whose shear strength developed faster but not sharper than the IS sediment during the first 22 days, reaching 70 kPa. The IS sediment reached higher values, reaching 130 kPa, whereas the RA sediment only reached 112 kPa at the end of the dewatering; see Figure 14.
From Figure 12, it can be deduced that the RA sediment, with the highest organic matter content as given in Table 2, could develop high ranges of undrained shear strength for high water content when compared to all the other samples. Considering the initial water content of other sediments, the RA sediment dewatering began from a lower water content, ω = 108%. This fact also contributed to it developing high undrained shear strength in a shorter time. The RH and SA sediments have comparable organic matter content; however, the SA sediment developed higher undrained shear strength than RH sediment. Considering all the sediments, the IS sediment, which has a low organic matter content, was able to develop undrained shear strength at a low water content. This was also the case for the kaolin which had negligible organic matter content and was the least to develop undrained shear strength since it kept a significant amount of water content during the dewatering process.
Observing the shape of the curves of the IS and RA sediments in Figure 13, one can note that shear strength is developed at the same rate after the tenth day of dewatering. This observation is also valid for the rate of evolution of the normalized water content to liquid limit when considering Figure 14.
An exponential-type correlation can describe the undrained shear strength evolution with water content for all the samples tested with a minimal regression coefficient of r2 = 0.87; see Equation (13) in Table 9.
Undrained shear strength evolution versus time was also fitted with an exponential. Equation (14) in Table 10 correctly describes the undrained shear strength evolution with a minimal regression coefficient of r2 = 0.94.
Undrained shear strength increased faster during the dewatering when attaining the liquid limit for the IS, RA and SA sediments at days 3, 14 and 7, respectively; see Figure 13. Comparing Figure 14 and Figure 15, it is demonstrated that attaining the liquidity limit allows the undrained shear strength to develop. However, maximum values of undrained shear strength are observed when water content nears the plastic limit value, as was the case for the RH sediment. For the latter, the undrained shear strength rose when attaining the plastic limit; see Figure 15.
Figure 14 and Figure 15 lead to the conclusion that for sediments having a comparable plasticity index, the undrained shear strength develops a similar trend. This leads to the conclusion that particle bonds begin to develop at a water content equal to the liquidity limit, resulting in undrained shear strength. The undrained shear strength reaches its maximum at the plastic limit.

4. Conclusions

4.1. On the Dewatering Process of Sediments and a Kaolin Clay

In practice, sediment characterization helps to optimize the sediment’s recovery process, transport, storage and end use. Sediment characterization plays an important role in sediment management. In practice, it helps to optimize the sediment’s recovery process, transport, storage and end use. Sediment management requires a range of data, such as water content, dry unit weight, volume factor and volumetric deformation, which requires shear strength to be quantified. The study of the evolution of the percentage of water drained, ω2, highlights the correlation of the function of the peak, which varies as a function of time or normalized water content. It was concluded that coarse soil texture and high initial water content contribute to the highest drainage peak, that high organic matter content shortens drainage time and that CaCO3 inhibits the evaporation of already-drained water. The percentage of water evaporated showed a linear trend for all samples tested. While the percentage of water drained followed a sigmoidal trend, based on the normalized water content for all the samples tested Equation (7) in Table 4, a unique and linear correlation was found relating dry unit weight to solid particle weight as a function of water content, as the sediments tested have low clay content. This observation led to the fact that intergranular forces in clays are more dominant when the water content is below the liquid limit, and that below a certain clay content, intergranular forces have no effect on the structure of the material.

4.2. Influence of Sediment Texture

The variation in water content over time for the IS sediment is similar to that for the kaolin clay (KA). It is evident that soil texture and initial water content govern the response of the sediment to dewatering. Similarly, for the RA, RH and SA sediments of the same texture, the evolution of water content was comparable. However, it is worth mentioning that the electrostatic forces in the kaolin clay (KA) compared to the IS sediments helped to prevent the water evaporating and draining. This is demonstrated by the observation of faster evaporation of water in the IS sediment than in the kaolin clay (KA). This could be explained by the large quantities of water continuously reaching the surface of the IS sediment sample due to the phenomenon of suction (finest soil texture) and likely to evaporate. Reaching the liquid limit during dewatering led to the appearance of an inflection point in the evolution of remaining, drained and evaporated waters for all the sediments tested. The result was a decrease in evaporation and drainage rates. In fact, the higher the plasticity index of the sediment, the more perceptible the inflection point, as the variation in the rates of evolution of the different quantities of water began to reach the liquidity limit and continue up to the plasticity limit. Consequently, the inflection point was very distinct in the case of the RH sediment. In contrast to the Tunis soft clays, the evolution of the dry unit weight in relation to the solid particle weight was linear with no variation in slope. One explanation is the low clay content and hence the inability of the sediments to adsorb water. Indeed, before saturation, clay tends to gain water due to electrostatic forces, which is not the case for sediments due to their low clay content. Sediments of comparable texture have solid particles that behave in the same way with water content; consequently, correlations between dry unit weight and water content have been established. The texture of the IS sediment— being similar to that of kaolin clay—its high CaCO3 content and low organic matter content enabled the development of the lowest void ratio and therefore the highest dry unit weight and the achievement of the highest shear strength values [33]. As confirmed by Chen et al. [34], CaCO3 content greater than 5% makes it possible to develop shear strength for particles smaller than 100 μm.

4.3. Development of Undrained Shear Strength during Dewatering

The undrained shear strength values reached 70–130 kPa at the end of dewatering. Correlations between the exponential curves of Su and the normalized water content ω/LL were found. Undrained shear strength depends on the consistency of the material rather than its water content. Sediments with the lowest water content and highest organic matter content exhibit faster shear strength. Clay texture contributes to undrained shear strength. Materials with a comparable plasticity index develop shear strength according to a similar trend.
Noting the undrained shear strength graphs obtained, it is evident that both the liquid limit and the plastic limit influenced the development and/or evolution of shear strength, which is indeed directly related to soil consistency. More importantly, the fact that the RH sediment only developed shear strength when it reached the plastic limit and, given its high liquid limit, leads to the conclusion that water content also governs the development of shear strength, in addition to soil consistency. This is because the more water the sediment retains, the more voids there are, increasing the distance between particles. This prevents the development of cohesion in the sediment.
This study makes it possible to predict the mechanical properties of sediments during dewatering and their physical characteristics. Consequently, in practice on site, similar conditions need to be provided during sediment dewatering.

Author Contributions

Conceptualization, D.A. and B.B.A.; methodology, D.A. and B.B.A.; software, D.A.; validation, D.A. and D.L.; formal analysis, D.A.; investigation, D.L., D.A. and B.B.A.; writing—original draft preparation, D.A.; writing—review and editing, D.L., D.A. and B.B.A.; visualization, D.A. and B.B.A.; supervision, D.L.; project administration, D.L.; funding acquisition, no funding. All authors have read and agreed to the published version of the manuscript.

Funding

This research received no external funding.

Data Availability Statement

All data results and relative information to this study are available, please contact the corresponding author.

Conflicts of Interest

The authors declare no conflict of interest.

References

  1. GEODE—Groupe D’études et D’observation sur les Dragages et L’environnement. Dragages et Immersions en mer et en Estuaire, Revue des Bonne Pratiques Environnementales, 2018, Report, 183p, Annexes 90p. Available online: https://www.cerema.fr/system/files/documents/2018/04/GEODE_BPE_revue_0702018_VF.pdf (accessed on 2 August 2024).
  2. Dorleon, G.; Rigaud, S.; Techer, I. Management of dredged marine sediments in Southern France: Main keys to large-scale beneficial re-use. Environ. Sci. Pollut. Res. 2024. [Google Scholar] [CrossRef] [PubMed]
  3. Harrington, J.R.; Murphy, J.; Coleman, M.; Jordan, D.; Debuigne, T.; Szacsuri, G. Economic modelling of the management of dredged marine sediments. Geol. Geophys. Environ. 2017, 42, 311. [Google Scholar] [CrossRef]
  4. Mymrin, V.; Stella, J.C.; Scremim, C.B.; Pan, R.C.Y.; Sanches, F.G.; Alekseev, K.; Pedroso, D.E.; Molinetti, A.; Fortini, O.M. Utilization of sediments dredged from marine ports as a principal component of composite material. J. Clean. Prod. 2017, 142 Pt 4, 4041–4049. [Google Scholar] [CrossRef]
  5. Feki, N.; Mbarka, M. Caractérisation physique et environnementale des sédiments du port de pêche de Sfax. In Proceedings of the 3rd Coastal and Maritime Mediterranean Conference, Ferrare, Italy, 25–27 November 2015. [Google Scholar] [CrossRef]
  6. London Convention. Convention on the Prevention of Marine Pollution by Dumping of Wastes and Other Matter, International Maritime Organization (IMO). 1972. Available online: https://www.epa.gov/sites/default/files/2015-10/documents/lc1972.pdf (accessed on 2 August 2024).
  7. El Fadili, M.; Messager, M. Enquête Dragage 2011: Synthèse des Données; Cerema—Cetmef: Compiègne, France, 2015; 39p. [Google Scholar]
  8. Duan, Z.; Lafhaj, Z.; Bel Hadj Ali, I.; Ducellier, S. Valorisation des sédiments fluviaux traités en vue d’une utilisation en génie civil. Rev. Paralia 2013, 6, 5.1–5.12. [Google Scholar] [CrossRef]
  9. Goure-Doubi, H.; Lecomte-Nana, G.; Thery, F.; Peyratout, C.; Anger, B.; Levacher, D. Characterization and valorization of dam sediment as ceramic materials. Int. J. Eng. Innov. Technol. 2015, 4, 84–91. [Google Scholar]
  10. Said, I.; Missaoui, A.; Lafhaj, Z. Reuse of Tunisian marine sediments in paving blocks: Factory scale experiment. J. Clean. Prod. 2015, 102, 66–77. [Google Scholar] [CrossRef]
  11. Anger, B.; Thery, F.; Levacher, D. Implementation of minimum basic characterization of fine sediments in construction material for practical purposes. In Proceedings of the 11th Geo-Environmental Engineering, Caen, France, 30–31 May 2012. [Google Scholar]
  12. Levacher, D.; Liang, Y. Sediment solidification/stabilization: Similarities differences, difficulties, cost and new developments. In Proceedings of the Geo-Environmental Engineering, Caen, France, 30–31 May 2012. [Google Scholar]
  13. Bel Hadj Ali, I.; Lafhaj, Z.; Bouassida, M.; Said, I. Characterization of Tunisian marine sediments in Rades and Gabes harbors. Int. J. Sediment Res. 2014, 29, 391–401. [Google Scholar] [CrossRef]
  14. Ben Slama, A.; Feki, N.; Kamoun, A. Etude physique et environnementale des sédiments du port de commerce de Sfax. In Proceedings of the Coastal and Maritime Mediterranean Conference, Split, Croatia, 29 November–1 December 2017; pp. 91–98. [Google Scholar] [CrossRef]
  15. Boutouil, M.; Levacher, D. Traitement et valorisation des vases de dragages par solidification/stabilisation: État de l’art. In Proceedings of the VIth Journées Nationales Génies Civil—Génies Cotier, Caen, France, 17–19 May 2000; pp. 367–375. [Google Scholar] [CrossRef]
  16. Levacher, D.; Sanchez, M. Caractérisation de sédiments marins pour une mise en dépôt à terre et en remblai. Eur. J. Environ. Civ. Eng. 2011, 15, 167–178. [Google Scholar] [CrossRef]
  17. Samara, M.; Lafhaj, Z.; Chapiseau, C. Valorization of stabilized river sediments in fired clay bricks: Factory scale experiment. J. Hazard. Mater. 2009, 163, 701–710. [Google Scholar] [CrossRef] [PubMed]
  18. Scordia, P.-Y.; Lafhaj, Z.; Skoczylas, F.; Mongeois, F. Caractérisation et valorisation en technique routière de sédiments fluviaux pollués et traités. Rev. Eur. Génie Civ. 2008, 12, 1087–1104. [Google Scholar] [CrossRef]
  19. Lafhaj, Z.; Duan, Z.; Bel Hadj Ali, I.; Depelsenaire, G. Valorization of treated river sediments in self-compacting materials. Waste Biomass Valorization 2012, 3, 239–247. [Google Scholar] [CrossRef]
  20. Zelleg, M.; Said, I.; Hamdi, E.; Lafhaj, Z. Experimental testing for Zarzis port sediments (Tunisia) in road materials. Geotech. Res. 2018, 5, 13–21. [Google Scholar] [CrossRef]
  21. Dhervilly, P.; Bertrand, M.; Thanneberger, L.; Levacher, D.; Houise, C.; Zoubeir, L. Gestion durable des sédiments: Le projet COVASED. In Proceedings of the XIIIth Journées Nationales Génie Côtier—Génie Civil, Dunkerque, France, 2–4 July 2014; pp. 977–985. [Google Scholar] [CrossRef]
  22. Boullosa Allariz, B. Déshydratation Naturelle et Mécanisée de Sédiments: Étude des Processus mis en jeu et Applications. Ph.D. Thesis, Université de Caen Normandie, Caen, France, 12 December 2018. [Google Scholar]
  23. Boullosa Allariz, B.; Levacher, D. Mechanical dewatering solutions for sediments. In Proceedings of the 15th Geo-Environmental Engineering, Nantes, France, 2–3 June 2016; p. hal-01929615. [Google Scholar]
  24. Boullosa Allariz, B.; Levacher, D.; Thery, F. State parameters during natural dehydration of dam dredged sediments. In Proceedings of the 10th International SedNet Conference, Genoa, Italy, 14–17 June 2017. [Google Scholar]
  25. Gupta, R.; Levacher, D.; Razakamanantsoa, A. Analogy between T-Bar and vane shear test. In Proceedings of the 15th Geo-Environmental Engineering, Nantes, France, 2–3 June 2016; pp. 33–40. [Google Scholar]
  26. Levacher, D.; Boullosa Allariz, B.; Müller, M. Some aspects of sediments dewatering, laboratory testing and useful relationships for dewatering. In Proceedings of the 17th Geo Environmental Engineering, Fukuoka, Japan, 25–26 May 2018; pp. 220–228. [Google Scholar]
  27. Anger, B. Caractérisation de Sédiments Fins de Retenues Hydroélectriques en vue D’une Orientation vers des Filières de Valorisation Matière. Ph.D. Thesis, Université de Caen Basse Normandie, Caen, France, 17 December 2014. Available online: https://normandie-univ.hal.science/tel-01938082 (accessed on 2 August 2024).
  28. D 4648/D4648M-13; Standard Test Method for Laboratory Miniature Vane Shear Test for Saturated Fine-Grained Clayey Soil. Annual Book of ASTM Standard. ASTM International: West Conshohocken, PA, USA, 2010.
  29. USDA, United States Department of Agriculture. Soil Survey Manual, Handbook N°18, Soil Science Division Staff, Issued March 2017, USA, 603p. Available online: https://www.nrcs.usda.gov/sites/default/files/2022-09/The-Soil-Survey-Manual.pdf (accessed on 2 August 2024).
  30. EN 12879: 2000; Characterization of Sludges—Determination of the Loss of Ignition of Dry Mass. British Standards Institution: London, UK, 2000.
  31. Bjerrum, L. Fundamental considerations on the shear strength of soil. Géotechnique 1951, 2, 209–218. [Google Scholar] [CrossRef]
  32. Touiti, L.; Bouassida, M.; Van Impe, W. Etude de la sensibilité de la vase superficielle de la ville de Tunis. In Proceedings of the Innovative Geotechnical Engineering. International Conference on Geotechnical Engineering, Hammamet, Tunisia, 24–26 March 2008; pp. 379–388. [Google Scholar]
  33. Moore, D.G. Shear strength and related properties of sediments from experimental mohole (Guadalupe site). J. Geophys. Res. 1964, 69, 4271–4291. [Google Scholar] [CrossRef]
  34. Chen, L.; Chen, X.; Yang, X.; Bi, P.; Ding, X.; Huang, X.; Wang, H. Effect of calcium carbonate on the mechanical properties and microstructure of red clay. Adv. Mater. Sci. Eng. 2020, 2020, 5298186. [Google Scholar] [CrossRef]
Figure 1. Natural dewatering process: principle, procedure and monitoring.
Jmse 12 01354 g001
Figure 2. Grain size distribution of sediments.
Jmse 12 01354 g002
Figure 3. Sediments classification based on their texture, adapted from USDA [29].
Jmse 12 01354 g003
Figure 4. Cumulative percentage of drained water ω 2 measured in the support for all samples: (a) IS, RA and RH sediments, (b) SA sediment and (c) kaolin clay (KA).
Jmse 12 01354 g004aJmse 12 01354 g004b
Figure 5. Cumulative percentage of drained water ω 2 versus normalized water content to liquid limit for all samples.
Jmse 12 01354 g005
Figure 6. Water-content-to-liquid-limit ratio versus time for all samples.
Jmse 12 01354 g006
Figure 7. Percentage of evaporated water ω 3 versus time for all samples.
Jmse 12 01354 g007
Figure 8. Percentage of evaporated water ω 3 versus normalized water content for all samples.
Jmse 12 01354 g008
Figure 9. Ratio of the content of water to liquid limit versus time.
Jmse 12 01354 g009
Figure 10. Void ratio versus time during the first three days for all samples.
Jmse 12 01354 g010
Figure 11. Dry unit weight versus normalized water content for all sediment samples.
Jmse 12 01354 g011
Figure 12. Shear strength evolution versus water content for all samples.
Jmse 12 01354 g012
Figure 13. Shear strength evolution versus time for all samples.
Jmse 12 01354 g013
Figure 14. Shear strength evolution versus normalized water content for all samples.
Jmse 12 01354 g014
Figure 15. Shear strength evolution versus water content to plastic limit ratio for all samples.
Jmse 12 01354 g015
Table 1. All samples’ tested sizes.
Samples ReferencesISRARHSAKA
Sample diameter (mm)210185185165420
Sample height (mm)7070707075
Table 2. Sediment physiochemical characteristics.
SamplesGradation
Coefficients
OM
(%)
CaCO3
(%)
ω0
(%)
Atterberg Limits
CuCcLL (%)PL (%)PI (%)
IS19.072.363.7118.1992.0463016
RA13.481.389.1817.91108.054504
RH12.381.566.7620.26142.0714625
SA10.631.336.610.70101.8 *655411
KA26.652.970.120.45110.0553020
Note: Cu: uniformity coefficient; Cc: curvature coefficient; OM: organic matter; ω0: initial water content; LL: liquidity limit; PL: plasticity limit; PI: plasticity index; * case study where ω0 = 1.57 LL.
Table 6. Possible relationships of evaporated water vs. time for all samples.
From Figure 7, ω3 [%] = f(t)[day]
Equation (9): ω3 = at + b type: Linear, Linear
Sedimentabr2
IS (inf part)2.053.360.97
IS (sup part)1.1521.340.99
KA0.890.100.99
RH0.95−0.270.99
RA1.27−0.090.99
SA2.0720.720.97
Table 7. Possible relationships of void ration vs. time for all samples.
From Figure 10, e = f(t)[day], for all sediments and kaolin clay
Equation (11): e = (a + btc)−1 type power, Harris
Sedimentabcr2
IS0.390.020.880.97
KA0.360.0150.710.99
SA0.460.030.950.97
RA0.350.090.240.84
RH0.240.130.190.79
Table 8. Possible relationships of dry unit weight vs. normalized water content for sediments.
From Figure 11, ϒds = f(ω/LL)
Equation (12): ϒds = a(ω/LL) + b type: Linear, Linear
Sedimentabr2
IS−0.130.590.97
SA−0.080.430.96
RA−0.070.400.83
RH−0.090.370.83
Table 9. Possible relationships of Su vs. water content for all samples.
From Figure 12, Su [kPa] = f(ω)[%]
Equation (13): Su = abω, type: Exponential, Exp2p
SedimentISKARARHSA
a 492.038034.451886.194485.1212,051.21
b 0.890.890.930.880.88
r20.870.990.940.980.92
Table 10. Possible relationships of Su vs. time for all samples.
From Figure 14, Su [kPa] = f(t)[day]
Equation (14): Su = atb, type: Power, Allometric1
Sedimentabr2
IS0.002163.295370.94
RH1.53 × 10−75.71 0.99
KA1.77 × 10−64.140.99
RA 0.0972.0690.99
SA 0.0192.890.94
Disclaimer/Publisher’s Note: The statements, opinions and data contained in all publications are solely those of the individual author(s) and contributor(s) and not of MDPI and/or the editor(s). MDPI and/or the editor(s) disclaim responsibility for any injury to people or property resulting from any ideas, methods, instructions or products referred to in the content.

