
Study of Physical and Mechanical Relationships during the Natural Dewatering of River Sediments and a Kaolin


Abstract
1. Introduction
2. Materials and Methods
2.1. Samples
2.2. Testing Methods
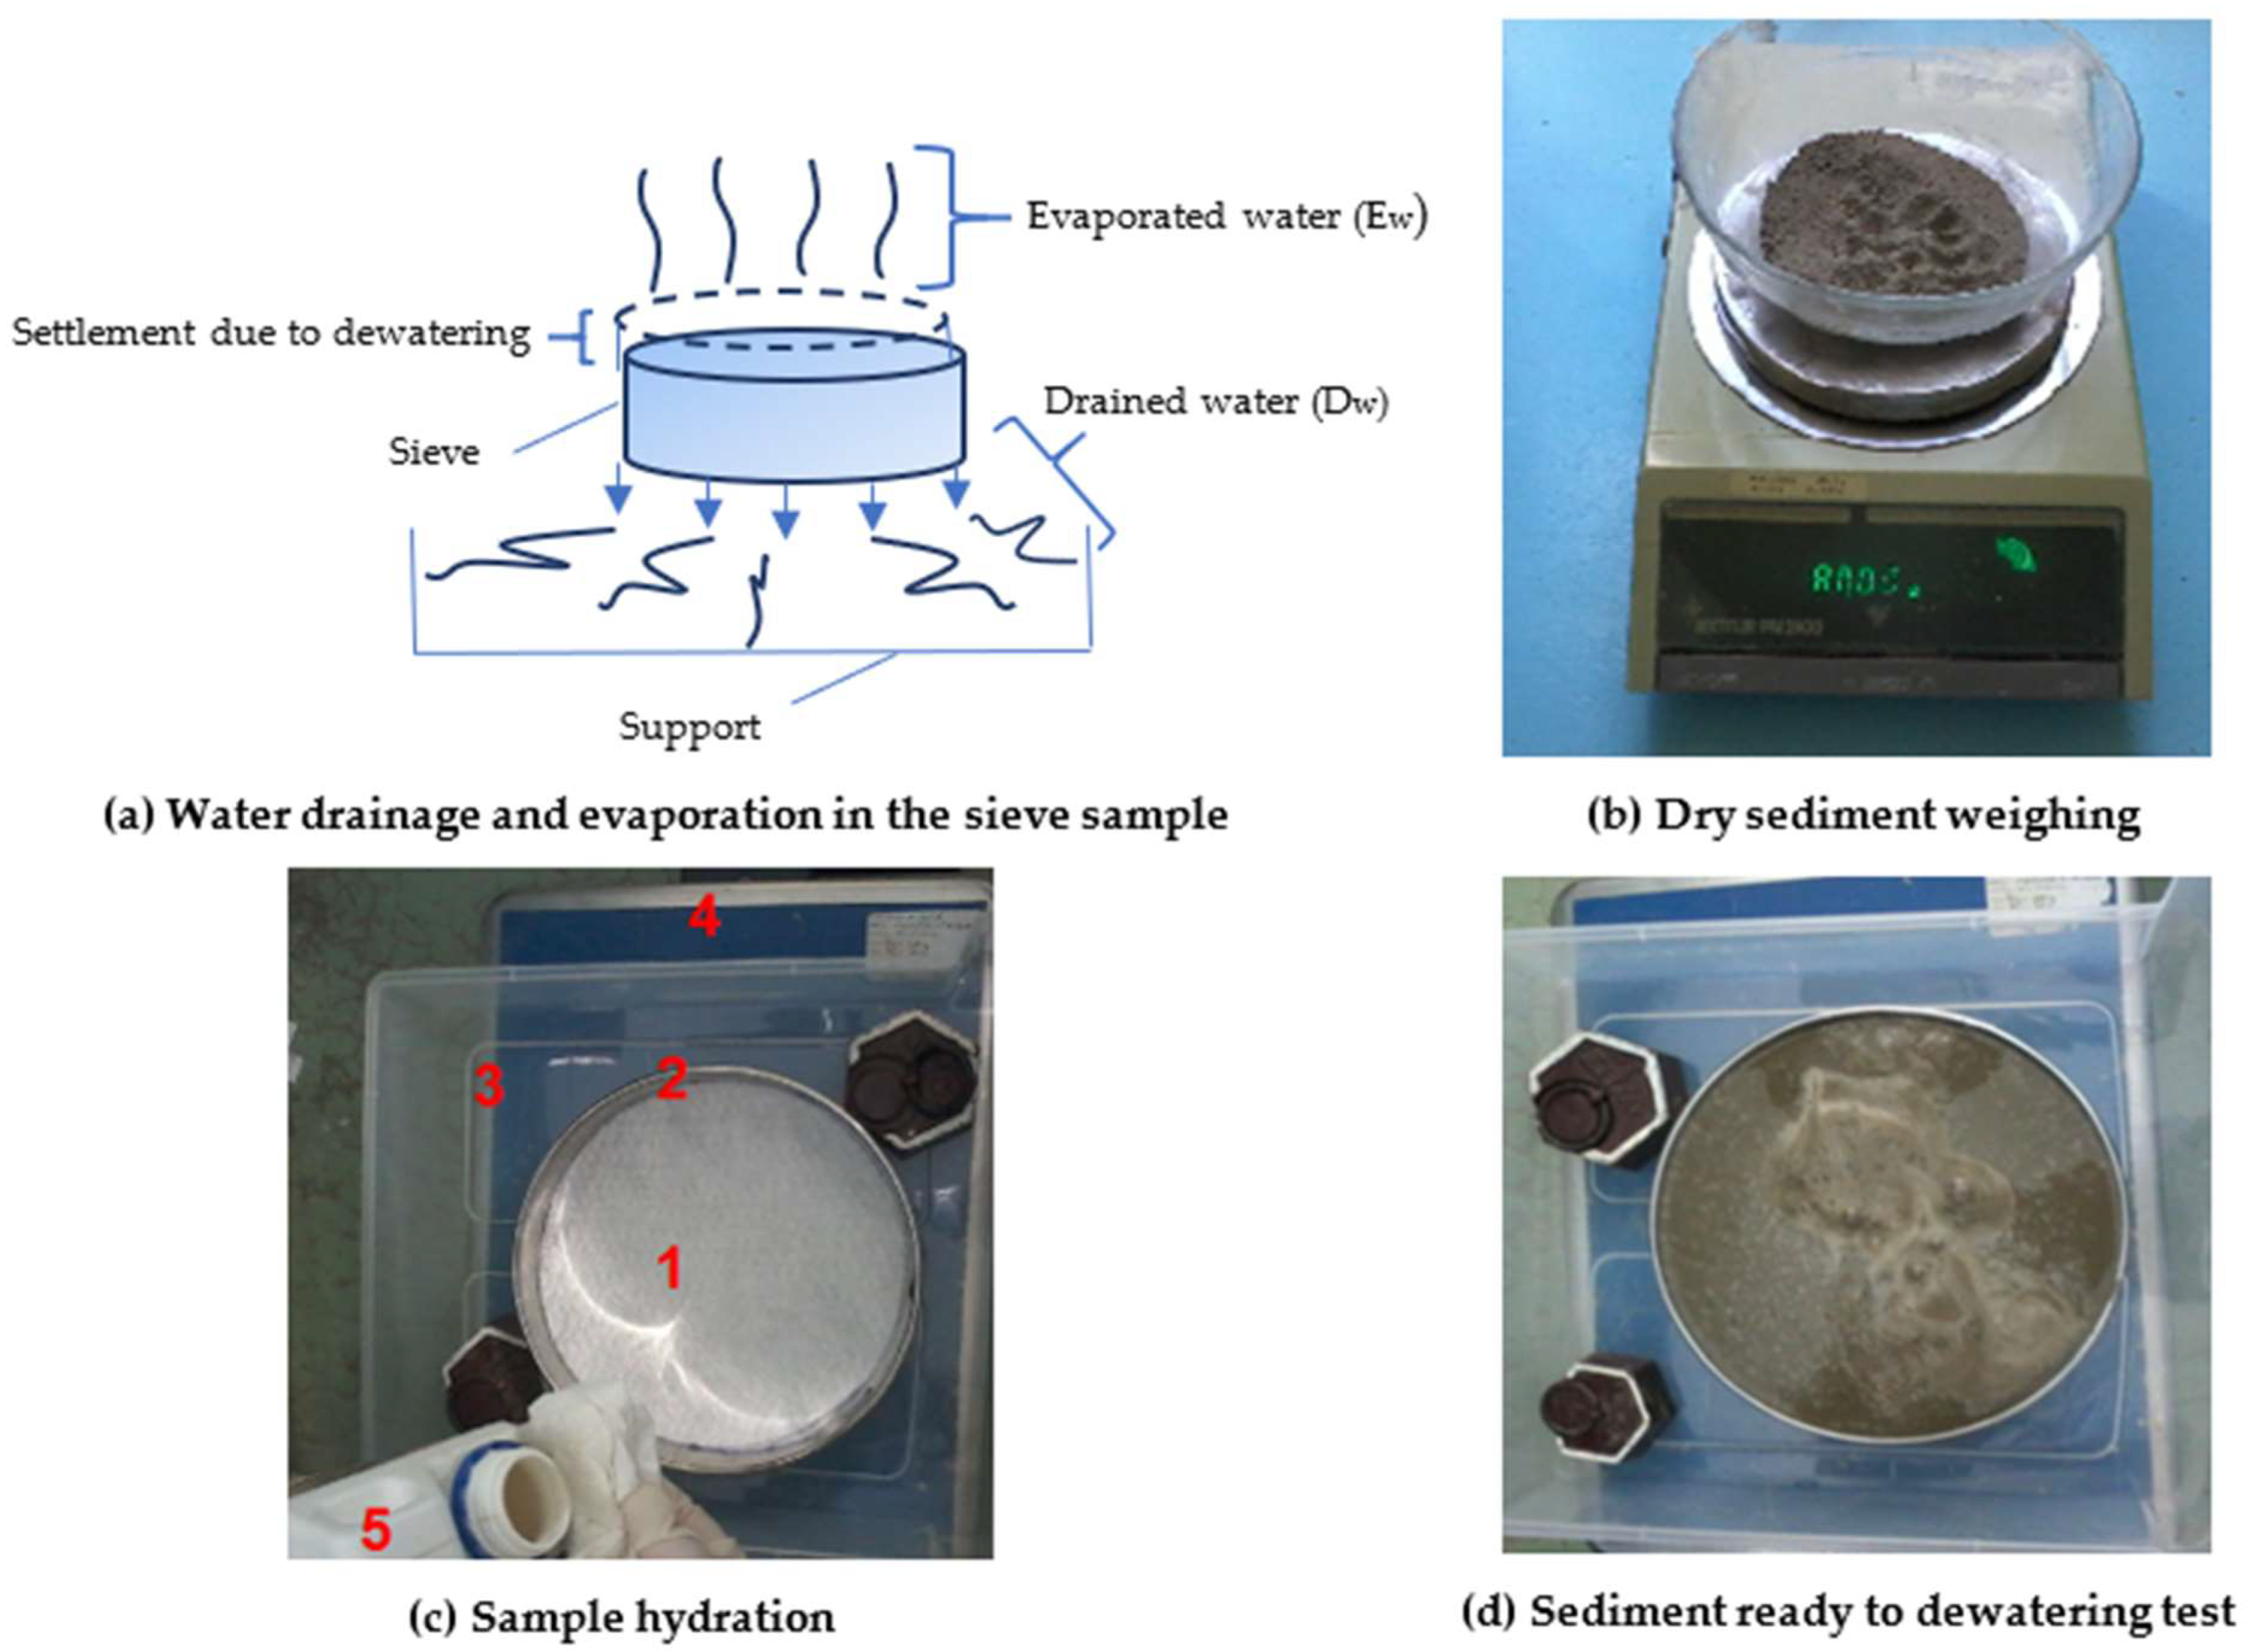
2.2.1. Natural Dewatering Test Procedure
2.2.2. Undrained Shear Strength Monitoring
3. Results and Discussion
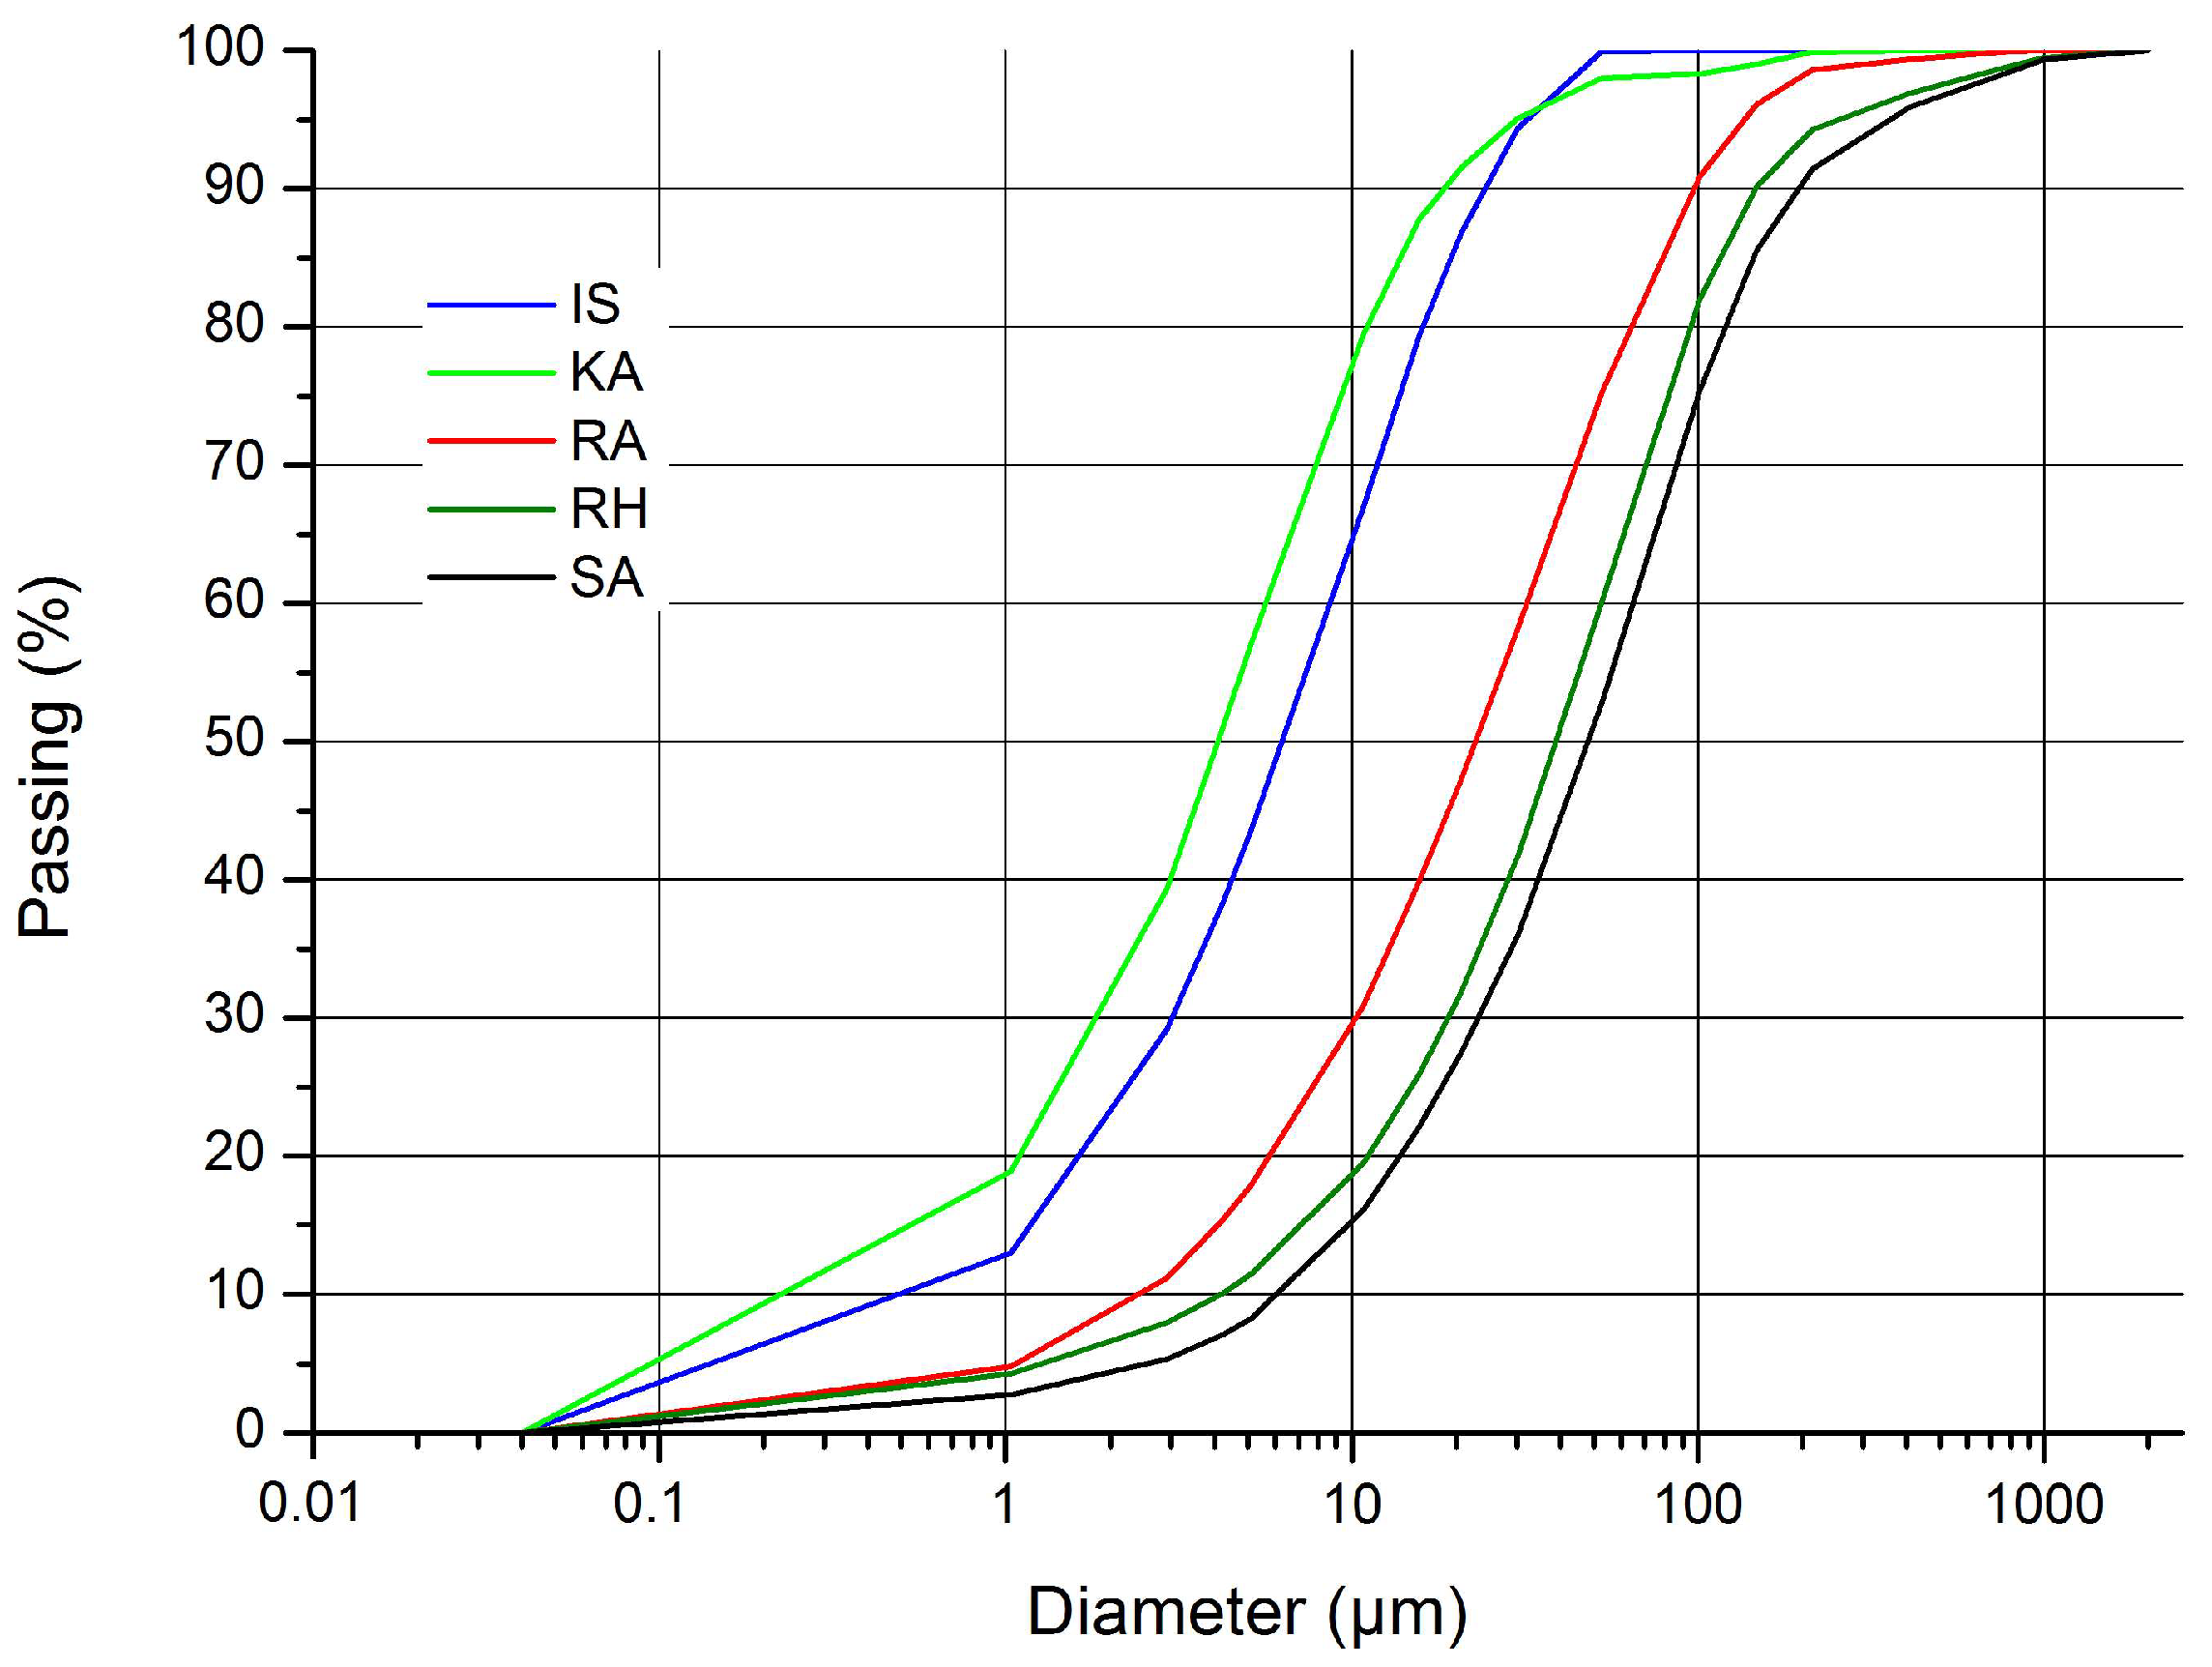
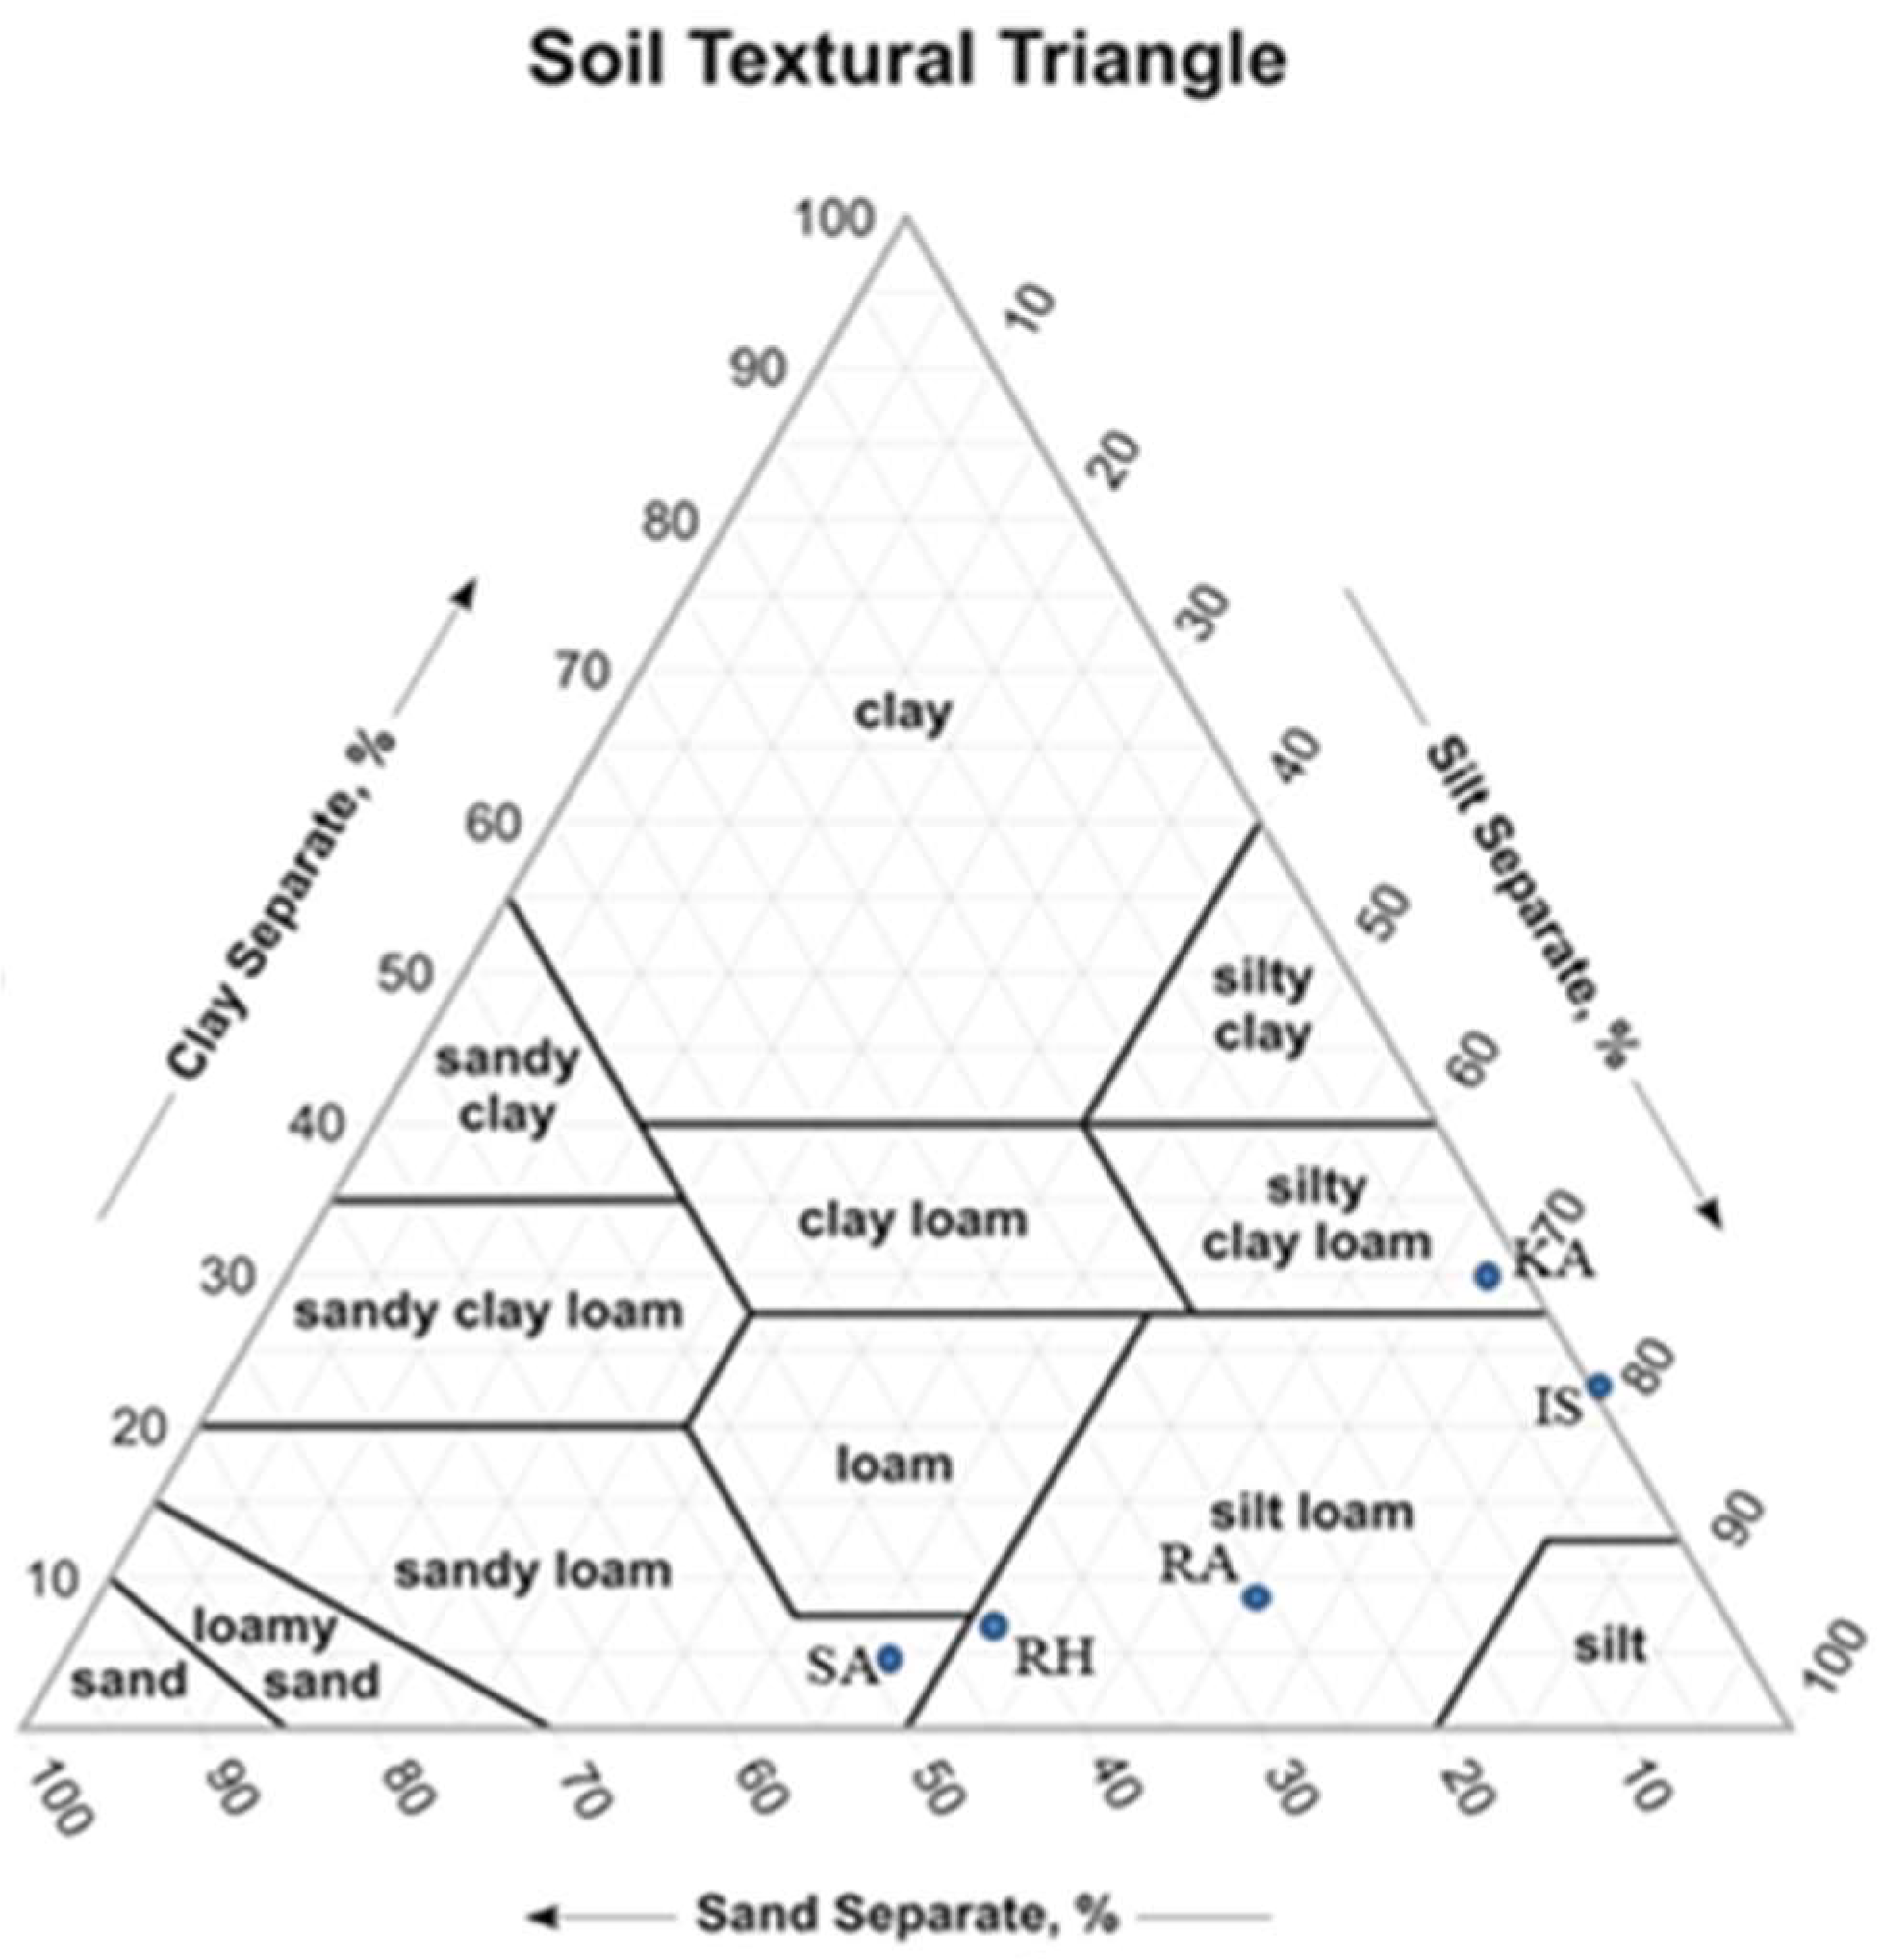
3.1. Sediment Characterization
3.2. Dewatering Characterization
3.2.1. Characterization of Changes in Water Content

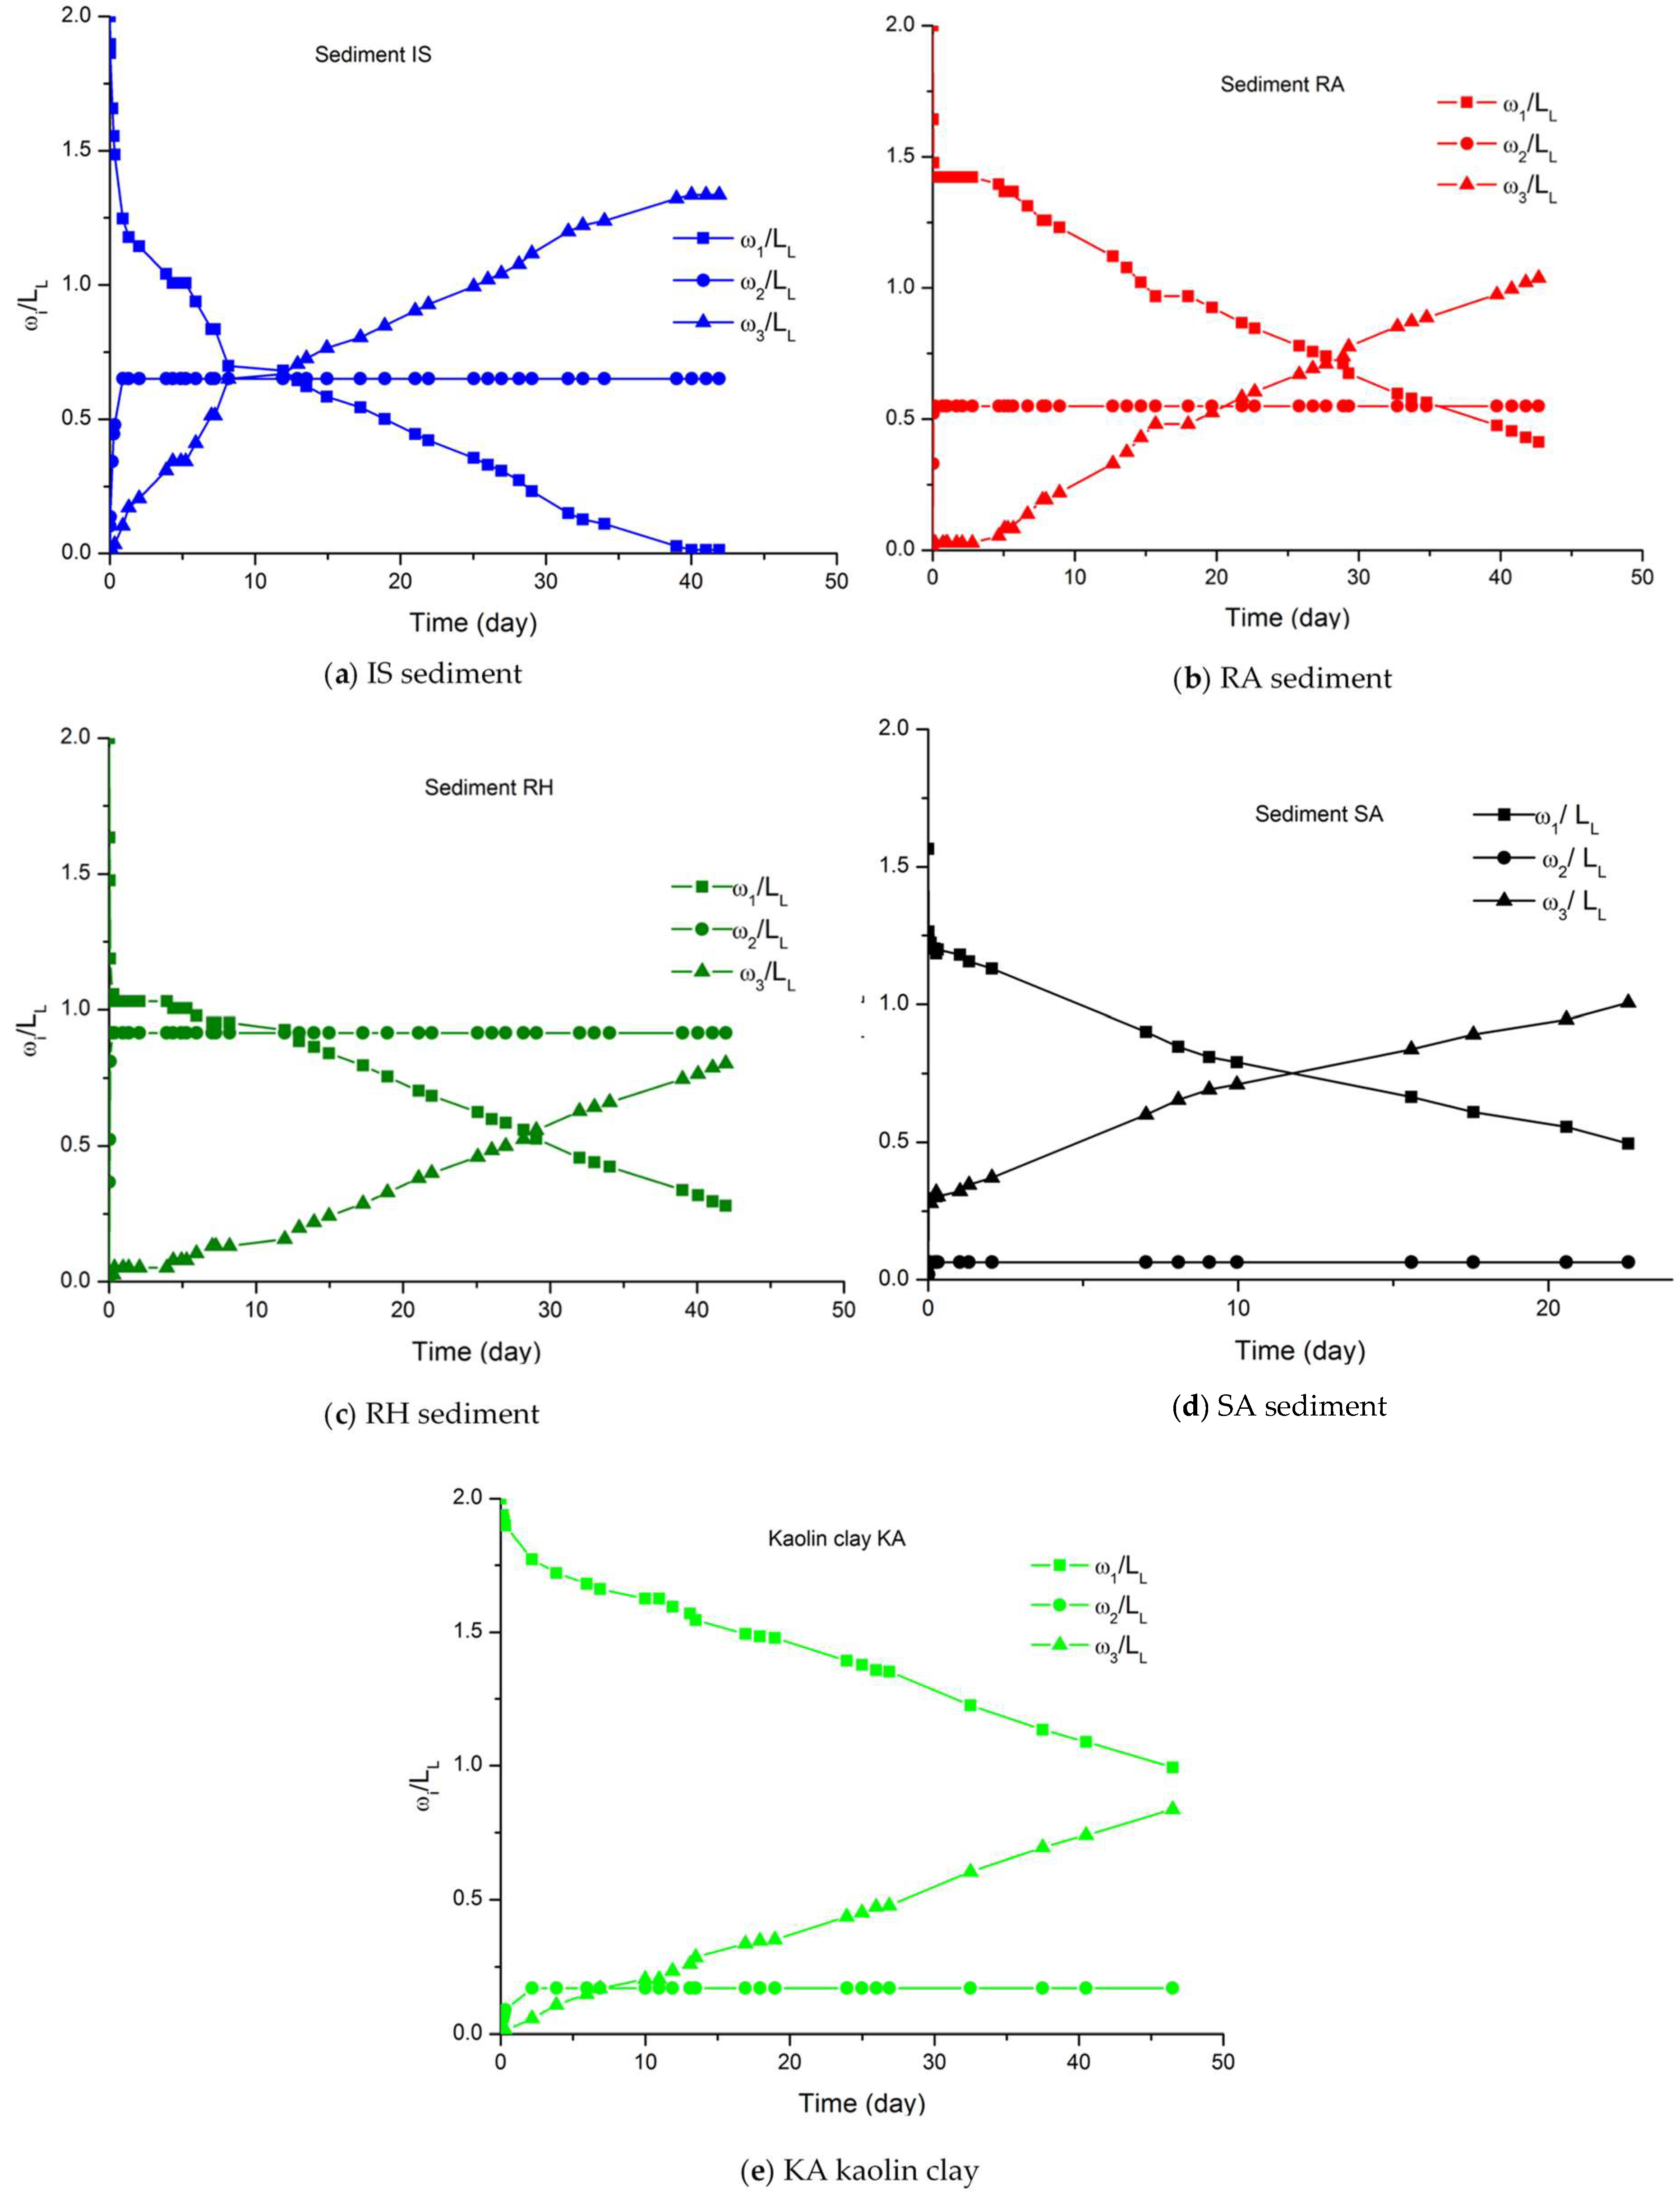
| From Figure 4a ω2 [%] = f(t)[hour], for RA and RH sediments | ||||||
| Equation (4): ω2 = a(1 − bt), type: Exponential, BoxLucas 1 Mod | ||||||
| Sediment | a | b | r2 | |||
| RA | 27.61 | 0.11 | 0.99 | |||
| RH | 45.64 | 0.23 | 0.99 | |||
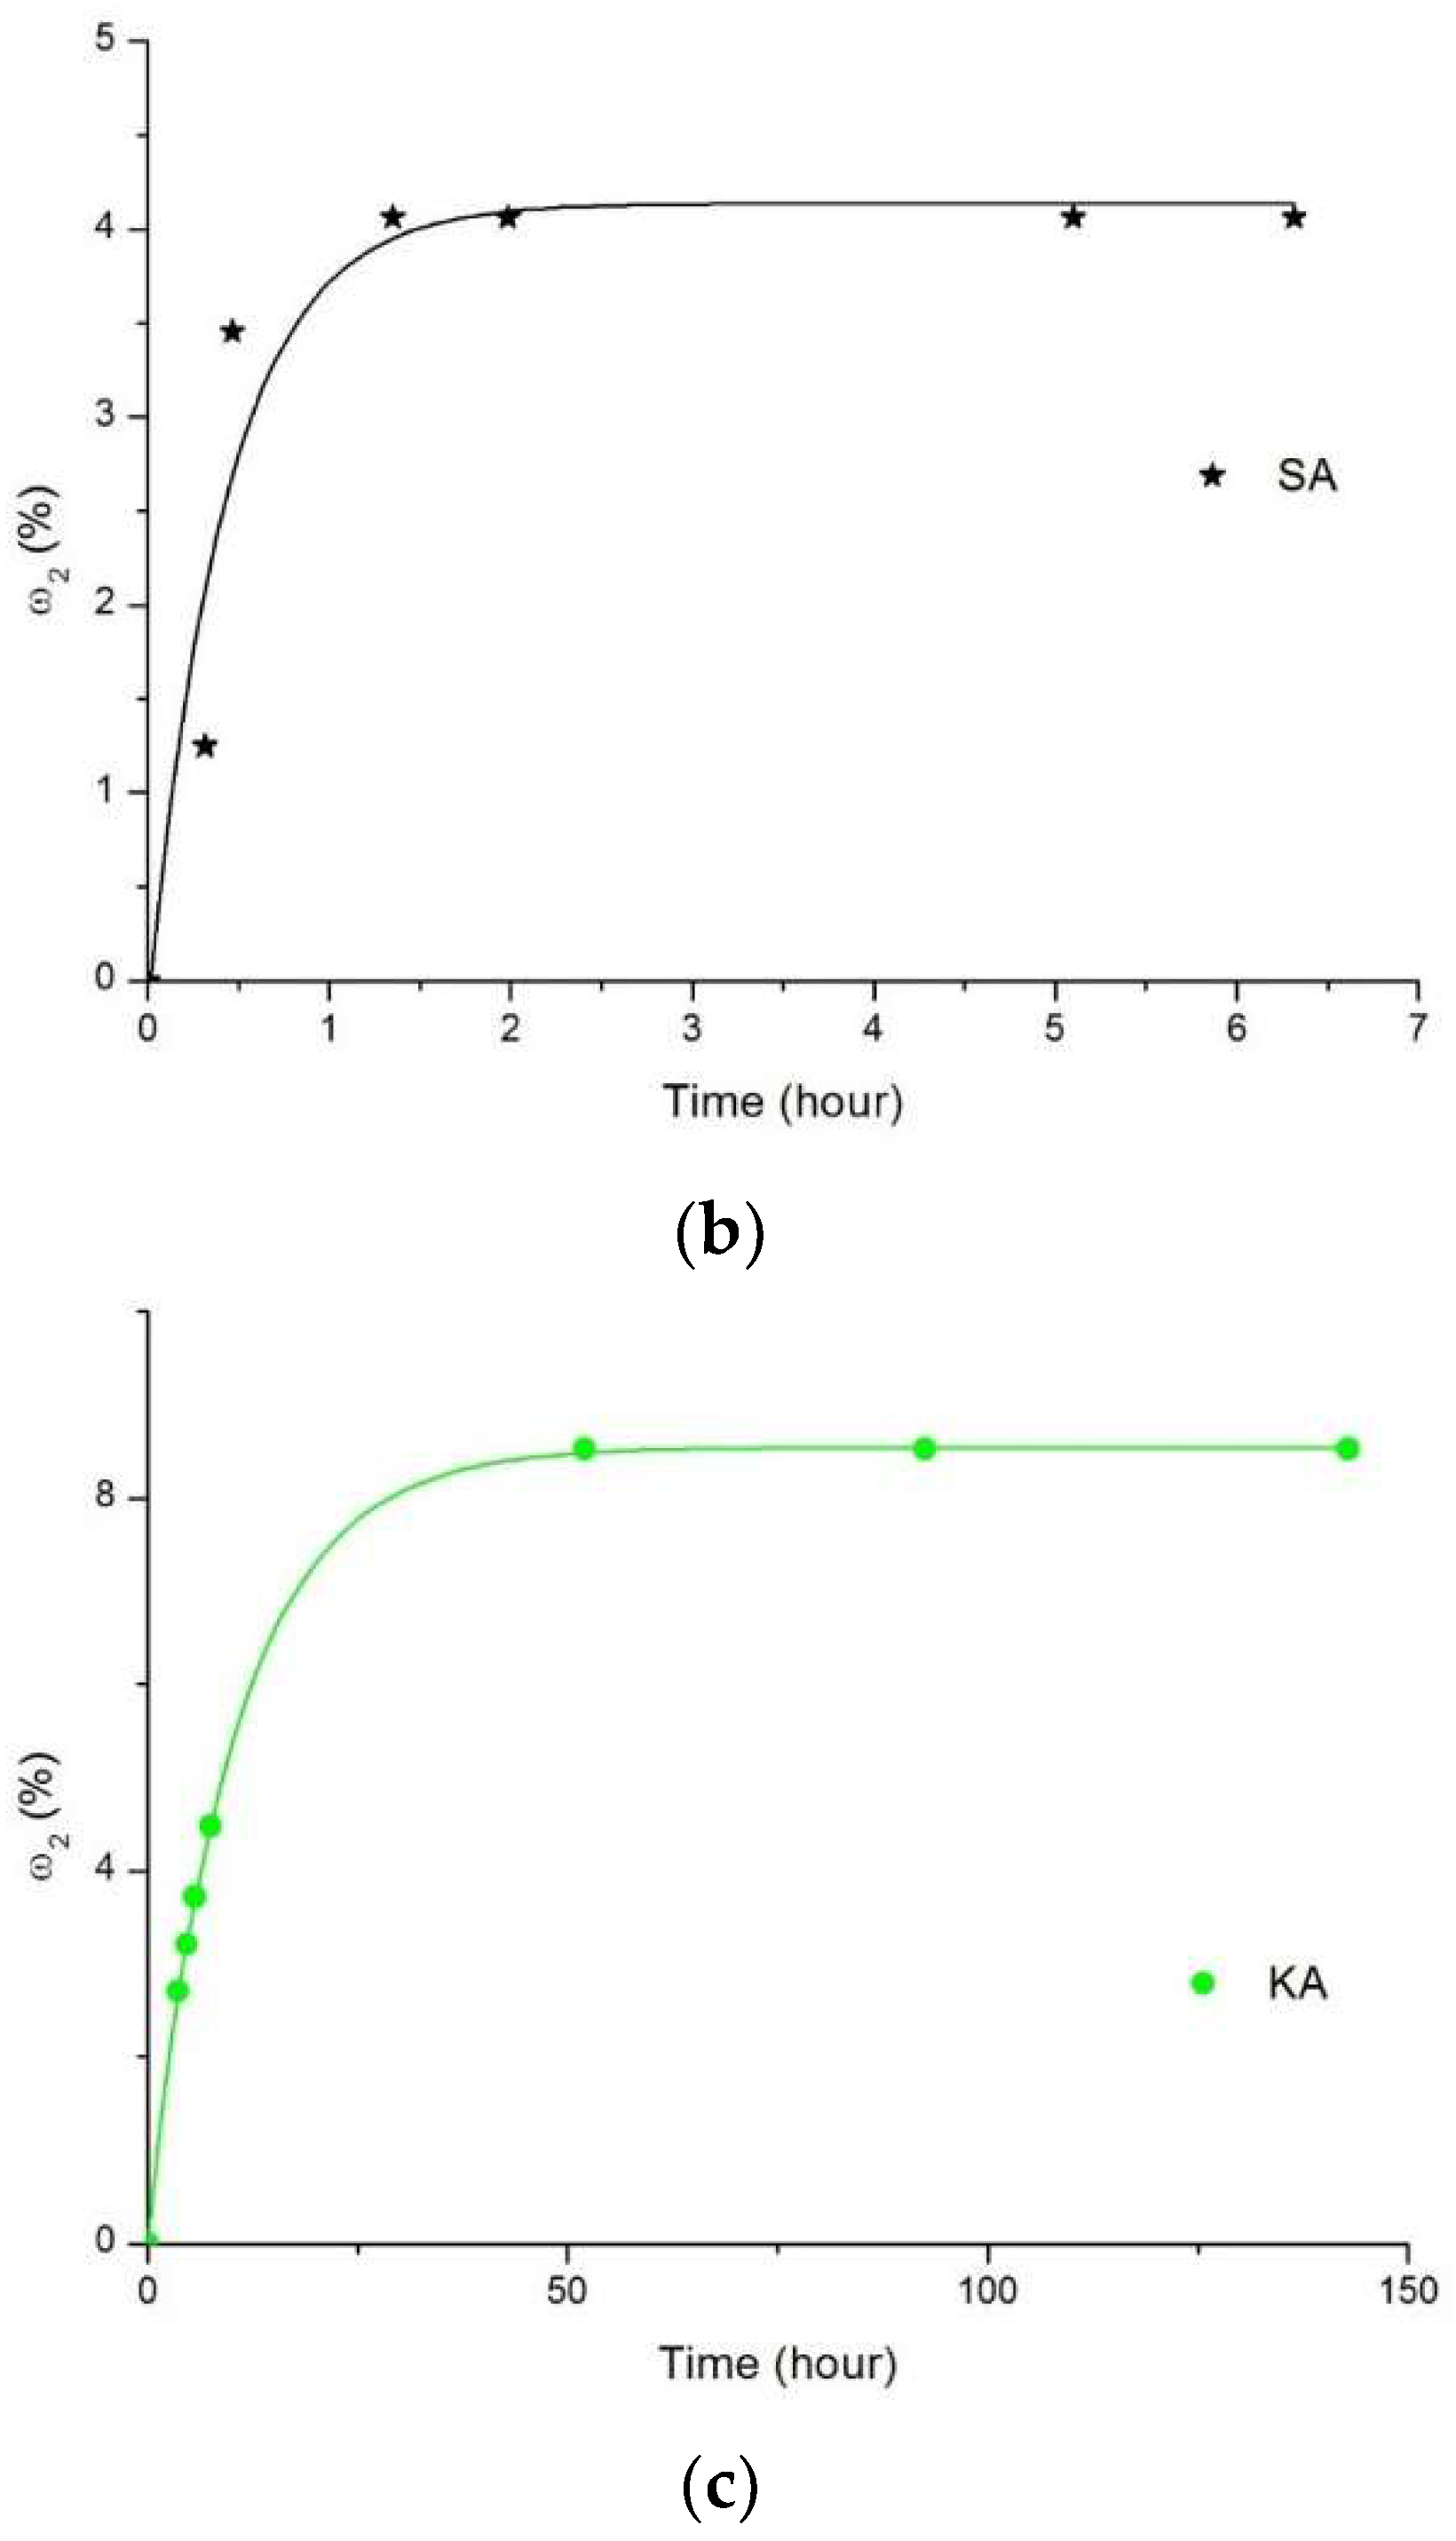
| From Figure 4a,c, for IS sediment and for kaolin clay (KA) | ||||||
| Equation (5): ω2 = a(1 − e−bt)c, type: Exponential, Chapman | ||||||
| Sediment | a | b | c | r2 | ||
| IS | 33.81 | 0.10 | 0.64 | 0.99 | ||
| Kaolin clay | 8.55 | 0.09 | 0.94 | 0.99 | ||
| From Figure 4b, ω2[%] = f(t)[hour], for SA sediment | ||||||
| Equation (6): ω2 = a − bct, type: Exponential, Asymptotic | ||||||
| Sediment | a | b | c | r2 | ||
| SA | 4.14 | 4.28 | 0.10 | 0.92 | ||
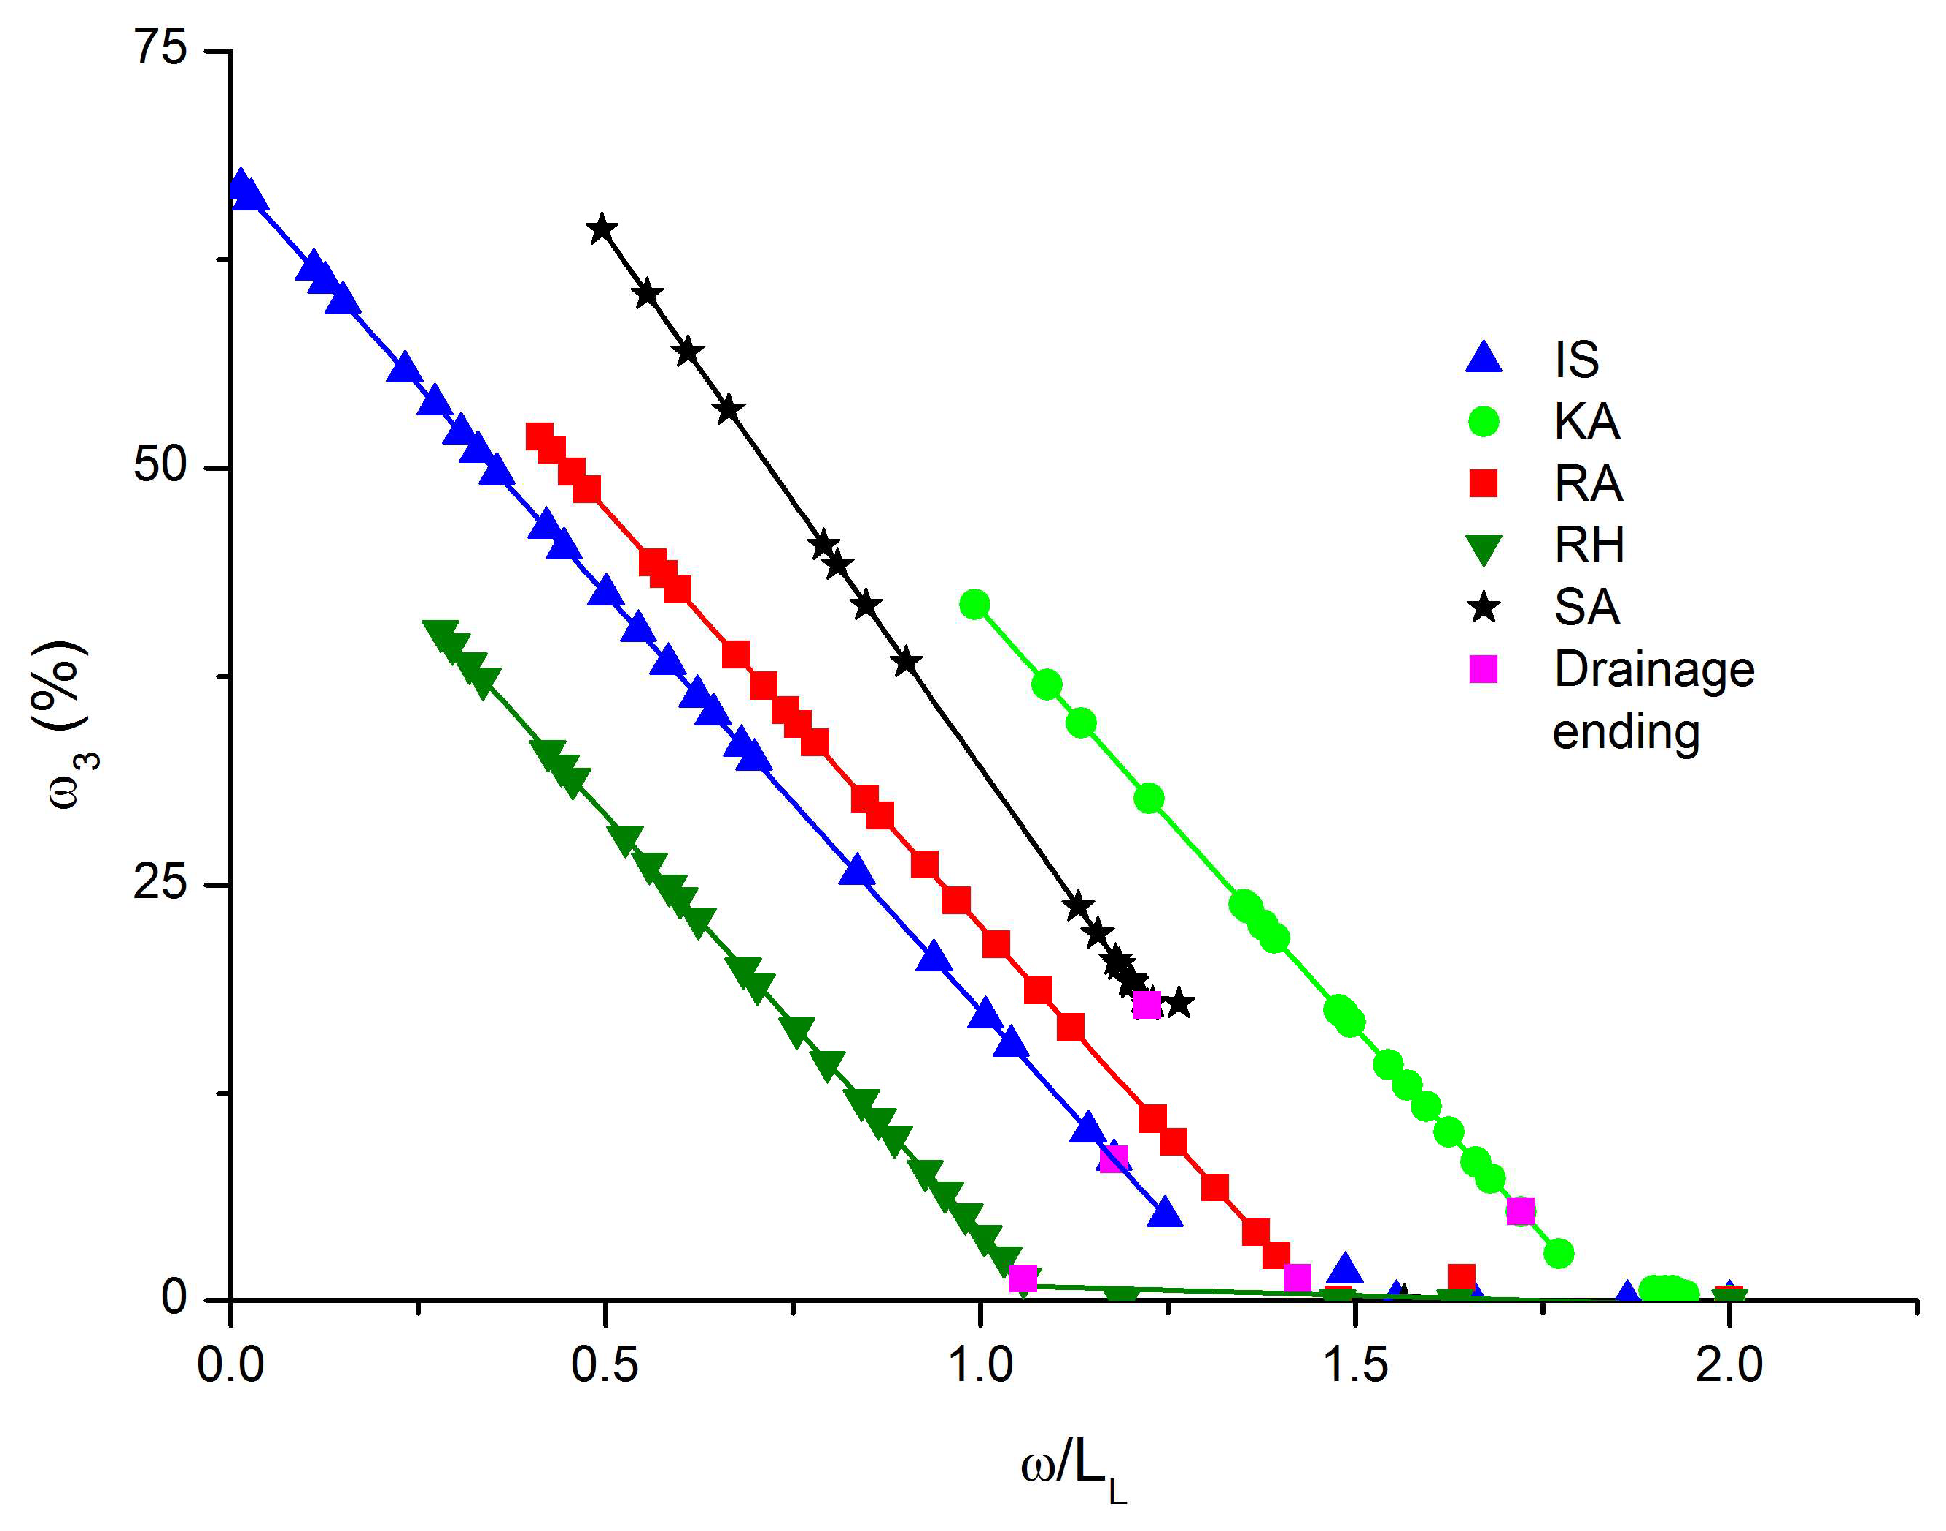
| From Figure 5, ω2 = [%] = f(ω/LL) | |||||
| Equation (7): ω2 = A2 + (A1 − A2)/(1 + ((ω/LL)/((ω/LL0.5) p))) type: Sigmoidal, Logistic | |||||
| Sediment | A1 | A2 | ω/LL0.5 | p | r2 |
| IS | 32.65 | −8.32 | 1.75 | 9.36 | 0.99 |
| KA | 8.55 | −1.25 | 1.92 | 43.64 | 0.99 |
| RA | 27.52 | −0.10 | 1.66 | 30.47 | 0.99 |
| RH | 46.17 | −4.98 | 1.58 | 9.00 | 0.99 |
| SA | 4.08 | 0.00773 | 1.26 | 108.07 | 0.99 |
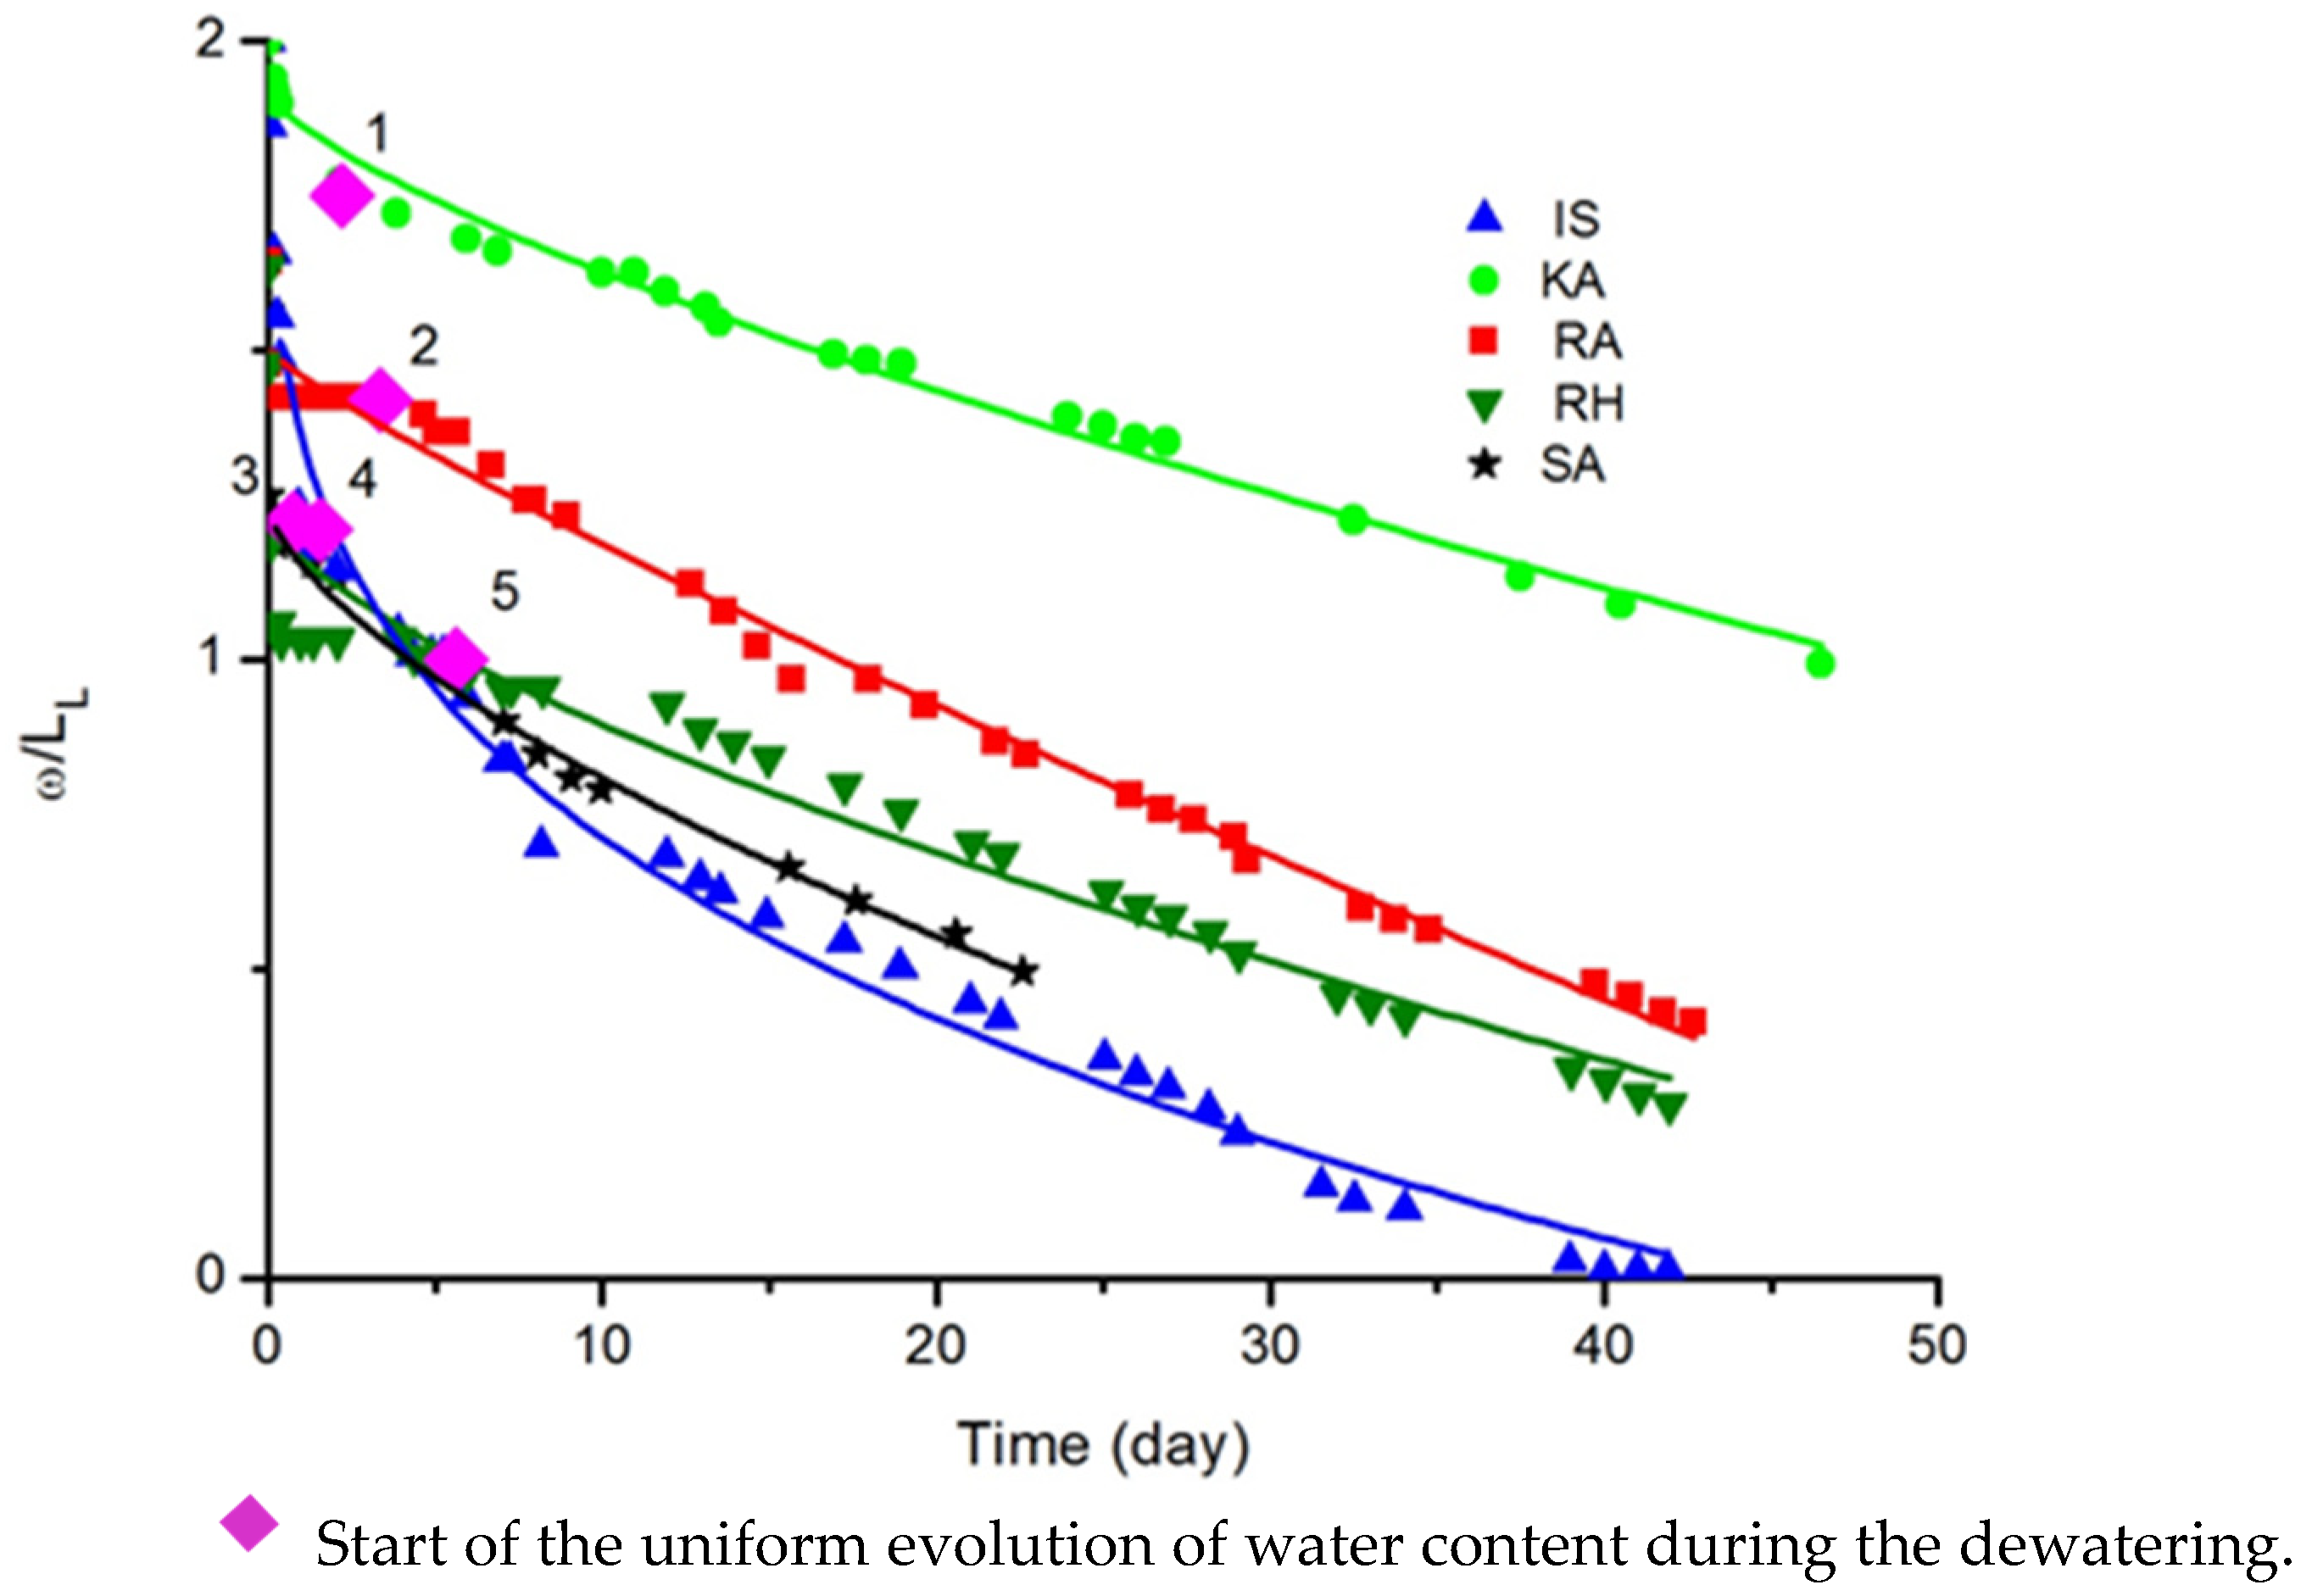
| From Figure 6, ω/LL = [%] = f(t) | ||||
| Equation (8): ω/LL = a + btc, type: Power, Allometric | ||||
| Sediment | a | b | c | r2 |
| IS | 2.00 | −0.70 | 0.28 | 0.99 |
| RH | 1.23 | −0.07 | 0.69 | 0.90 |
| KA | 1.92 | −0.05 | 0.73 | 0.99 |
| RA | 1.50 | −0.04 | 0.87 | 0.99 |
| SA | 1.25 | −0.09 | 0.66 | 0.99 |
3.2.2. Void Ratio Evolution
3.3. Geotechnical Characterization
3.3.1. Variation in Dry Unit Weight
3.3.2. Shear Strength Relationships
4. Conclusions
4.1. On the Dewatering Process of Sediments and a Kaolin Clay
4.2. Influence of Sediment Texture
4.3. Development of Undrained Shear Strength during Dewatering
Author Contributions
Funding
Data Availability Statement
Conflicts of Interest
References
- GEODE—Groupe D’études et D’observation sur les Dragages et L’environnement. Dragages et Immersions en mer et en Estuaire, Revue des Bonne Pratiques Environnementales, 2018, Report, 183p, Annexes 90p. Available online: https://www.cerema.fr/system/files/documents/2018/04/GEODE_BPE_revue_0702018_VF.pdf (accessed on 2 August 2024).
- Dorleon, G.; Rigaud, S.; Techer, I. Management of dredged marine sediments in Southern France: Main keys to large-scale beneficial re-use. Environ. Sci. Pollut. Res. 2024. [Google Scholar] [CrossRef] [PubMed]
- Harrington, J.R.; Murphy, J.; Coleman, M.; Jordan, D.; Debuigne, T.; Szacsuri, G. Economic modelling of the management of dredged marine sediments. Geol. Geophys. Environ. 2017, 42, 311. [Google Scholar] [CrossRef]
- Mymrin, V.; Stella, J.C.; Scremim, C.B.; Pan, R.C.Y.; Sanches, F.G.; Alekseev, K.; Pedroso, D.E.; Molinetti, A.; Fortini, O.M. Utilization of sediments dredged from marine ports as a principal component of composite material. J. Clean. Prod. 2017, 142 Pt 4, 4041–4049. [Google Scholar] [CrossRef]
- Feki, N.; Mbarka, M. Caractérisation physique et environnementale des sédiments du port de pêche de Sfax. In Proceedings of the 3rd Coastal and Maritime Mediterranean Conference, Ferrare, Italy, 25–27 November 2015. [Google Scholar] [CrossRef]
- London Convention. Convention on the Prevention of Marine Pollution by Dumping of Wastes and Other Matter, International Maritime Organization (IMO). 1972. Available online: https://www.epa.gov/sites/default/files/2015-10/documents/lc1972.pdf (accessed on 2 August 2024).
- El Fadili, M.; Messager, M. Enquête Dragage 2011: Synthèse des Données; Cerema—Cetmef: Compiègne, France, 2015; 39p. [Google Scholar]
- Duan, Z.; Lafhaj, Z.; Bel Hadj Ali, I.; Ducellier, S. Valorisation des sédiments fluviaux traités en vue d’une utilisation en génie civil. Rev. Paralia 2013, 6, 5.1–5.12. [Google Scholar] [CrossRef]
- Goure-Doubi, H.; Lecomte-Nana, G.; Thery, F.; Peyratout, C.; Anger, B.; Levacher, D. Characterization and valorization of dam sediment as ceramic materials. Int. J. Eng. Innov. Technol. 2015, 4, 84–91. [Google Scholar]
- Said, I.; Missaoui, A.; Lafhaj, Z. Reuse of Tunisian marine sediments in paving blocks: Factory scale experiment. J. Clean. Prod. 2015, 102, 66–77. [Google Scholar] [CrossRef]
- Anger, B.; Thery, F.; Levacher, D. Implementation of minimum basic characterization of fine sediments in construction material for practical purposes. In Proceedings of the 11th Geo-Environmental Engineering, Caen, France, 30–31 May 2012. [Google Scholar]
- Levacher, D.; Liang, Y. Sediment solidification/stabilization: Similarities differences, difficulties, cost and new developments. In Proceedings of the Geo-Environmental Engineering, Caen, France, 30–31 May 2012. [Google Scholar]
- Bel Hadj Ali, I.; Lafhaj, Z.; Bouassida, M.; Said, I. Characterization of Tunisian marine sediments in Rades and Gabes harbors. Int. J. Sediment Res. 2014, 29, 391–401. [Google Scholar] [CrossRef]
- Ben Slama, A.; Feki, N.; Kamoun, A. Etude physique et environnementale des sédiments du port de commerce de Sfax. In Proceedings of the Coastal and Maritime Mediterranean Conference, Split, Croatia, 29 November–1 December 2017; pp. 91–98. [Google Scholar] [CrossRef]
- Boutouil, M.; Levacher, D. Traitement et valorisation des vases de dragages par solidification/stabilisation: État de l’art. In Proceedings of the VIth Journées Nationales Génies Civil—Génies Cotier, Caen, France, 17–19 May 2000; pp. 367–375. [Google Scholar] [CrossRef]
- Levacher, D.; Sanchez, M. Caractérisation de sédiments marins pour une mise en dépôt à terre et en remblai. Eur. J. Environ. Civ. Eng. 2011, 15, 167–178. [Google Scholar] [CrossRef]
- Samara, M.; Lafhaj, Z.; Chapiseau, C. Valorization of stabilized river sediments in fired clay bricks: Factory scale experiment. J. Hazard. Mater. 2009, 163, 701–710. [Google Scholar] [CrossRef] [PubMed]
- Scordia, P.-Y.; Lafhaj, Z.; Skoczylas, F.; Mongeois, F. Caractérisation et valorisation en technique routière de sédiments fluviaux pollués et traités. Rev. Eur. Génie Civ. 2008, 12, 1087–1104. [Google Scholar] [CrossRef]
- Lafhaj, Z.; Duan, Z.; Bel Hadj Ali, I.; Depelsenaire, G. Valorization of treated river sediments in self-compacting materials. Waste Biomass Valorization 2012, 3, 239–247. [Google Scholar] [CrossRef]
- Zelleg, M.; Said, I.; Hamdi, E.; Lafhaj, Z. Experimental testing for Zarzis port sediments (Tunisia) in road materials. Geotech. Res. 2018, 5, 13–21. [Google Scholar] [CrossRef]
- Dhervilly, P.; Bertrand, M.; Thanneberger, L.; Levacher, D.; Houise, C.; Zoubeir, L. Gestion durable des sédiments: Le projet COVASED. In Proceedings of the XIIIth Journées Nationales Génie Côtier—Génie Civil, Dunkerque, France, 2–4 July 2014; pp. 977–985. [Google Scholar] [CrossRef]
- Boullosa Allariz, B. Déshydratation Naturelle et Mécanisée de Sédiments: Étude des Processus mis en jeu et Applications. Ph.D. Thesis, Université de Caen Normandie, Caen, France, 12 December 2018. [Google Scholar]
- Boullosa Allariz, B.; Levacher, D. Mechanical dewatering solutions for sediments. In Proceedings of the 15th Geo-Environmental Engineering, Nantes, France, 2–3 June 2016; p. hal-01929615. [Google Scholar]
- Boullosa Allariz, B.; Levacher, D.; Thery, F. State parameters during natural dehydration of dam dredged sediments. In Proceedings of the 10th International SedNet Conference, Genoa, Italy, 14–17 June 2017. [Google Scholar]
- Gupta, R.; Levacher, D.; Razakamanantsoa, A. Analogy between T-Bar and vane shear test. In Proceedings of the 15th Geo-Environmental Engineering, Nantes, France, 2–3 June 2016; pp. 33–40. [Google Scholar]
- Levacher, D.; Boullosa Allariz, B.; Müller, M. Some aspects of sediments dewatering, laboratory testing and useful relationships for dewatering. In Proceedings of the 17th Geo Environmental Engineering, Fukuoka, Japan, 25–26 May 2018; pp. 220–228. [Google Scholar]
- Anger, B. Caractérisation de Sédiments Fins de Retenues Hydroélectriques en vue D’une Orientation vers des Filières de Valorisation Matière. Ph.D. Thesis, Université de Caen Basse Normandie, Caen, France, 17 December 2014. Available online: https://normandie-univ.hal.science/tel-01938082 (accessed on 2 August 2024).
- D 4648/D4648M-13; Standard Test Method for Laboratory Miniature Vane Shear Test for Saturated Fine-Grained Clayey Soil. Annual Book of ASTM Standard. ASTM International: West Conshohocken, PA, USA, 2010.
- USDA, United States Department of Agriculture. Soil Survey Manual, Handbook N°18, Soil Science Division Staff, Issued March 2017, USA, 603p. Available online: https://www.nrcs.usda.gov/sites/default/files/2022-09/The-Soil-Survey-Manual.pdf (accessed on 2 August 2024).
- EN 12879: 2000; Characterization of Sludges—Determination of the Loss of Ignition of Dry Mass. British Standards Institution: London, UK, 2000.
- Bjerrum, L. Fundamental considerations on the shear strength of soil. Géotechnique 1951, 2, 209–218. [Google Scholar] [CrossRef]
- Touiti, L.; Bouassida, M.; Van Impe, W. Etude de la sensibilité de la vase superficielle de la ville de Tunis. In Proceedings of the Innovative Geotechnical Engineering. International Conference on Geotechnical Engineering, Hammamet, Tunisia, 24–26 March 2008; pp. 379–388. [Google Scholar]
- Moore, D.G. Shear strength and related properties of sediments from experimental mohole (Guadalupe site). J. Geophys. Res. 1964, 69, 4271–4291. [Google Scholar] [CrossRef]
- Chen, L.; Chen, X.; Yang, X.; Bi, P.; Ding, X.; Huang, X.; Wang, H. Effect of calcium carbonate on the mechanical properties and microstructure of red clay. Adv. Mater. Sci. Eng. 2020, 2020, 5298186. [Google Scholar] [CrossRef]


| Samples References | IS | RA | RH | SA | KA |
|---|---|---|---|---|---|
| Sample diameter (mm) | 210 | 185 | 185 | 165 | 420 |
| Sample height (mm) | 70 | 70 | 70 | 70 | 75 |
| Samples | Gradation Coefficients | OM (%) | CaCO3 (%) | ω0 (%) | Atterberg Limits | |||
|---|---|---|---|---|---|---|---|---|
| Cu | Cc | LL (%) | PL (%) | PI (%) | ||||
| IS | 19.07 | 2.36 | 3.71 | 18.19 | 92.0 | 46 | 30 | 16 |
| RA | 13.48 | 1.38 | 9.18 | 17.91 | 108.0 | 54 | 50 | 4 |
| RH | 12.38 | 1.56 | 6.76 | 20.26 | 142.0 | 71 | 46 | 25 |
| SA | 10.63 | 1.33 | 6.61 | 0.70 | 101.8 * | 65 | 54 | 11 |
| KA | 26.65 | 2.97 | 0.12 | 0.45 | 110.0 | 55 | 30 | 20 |
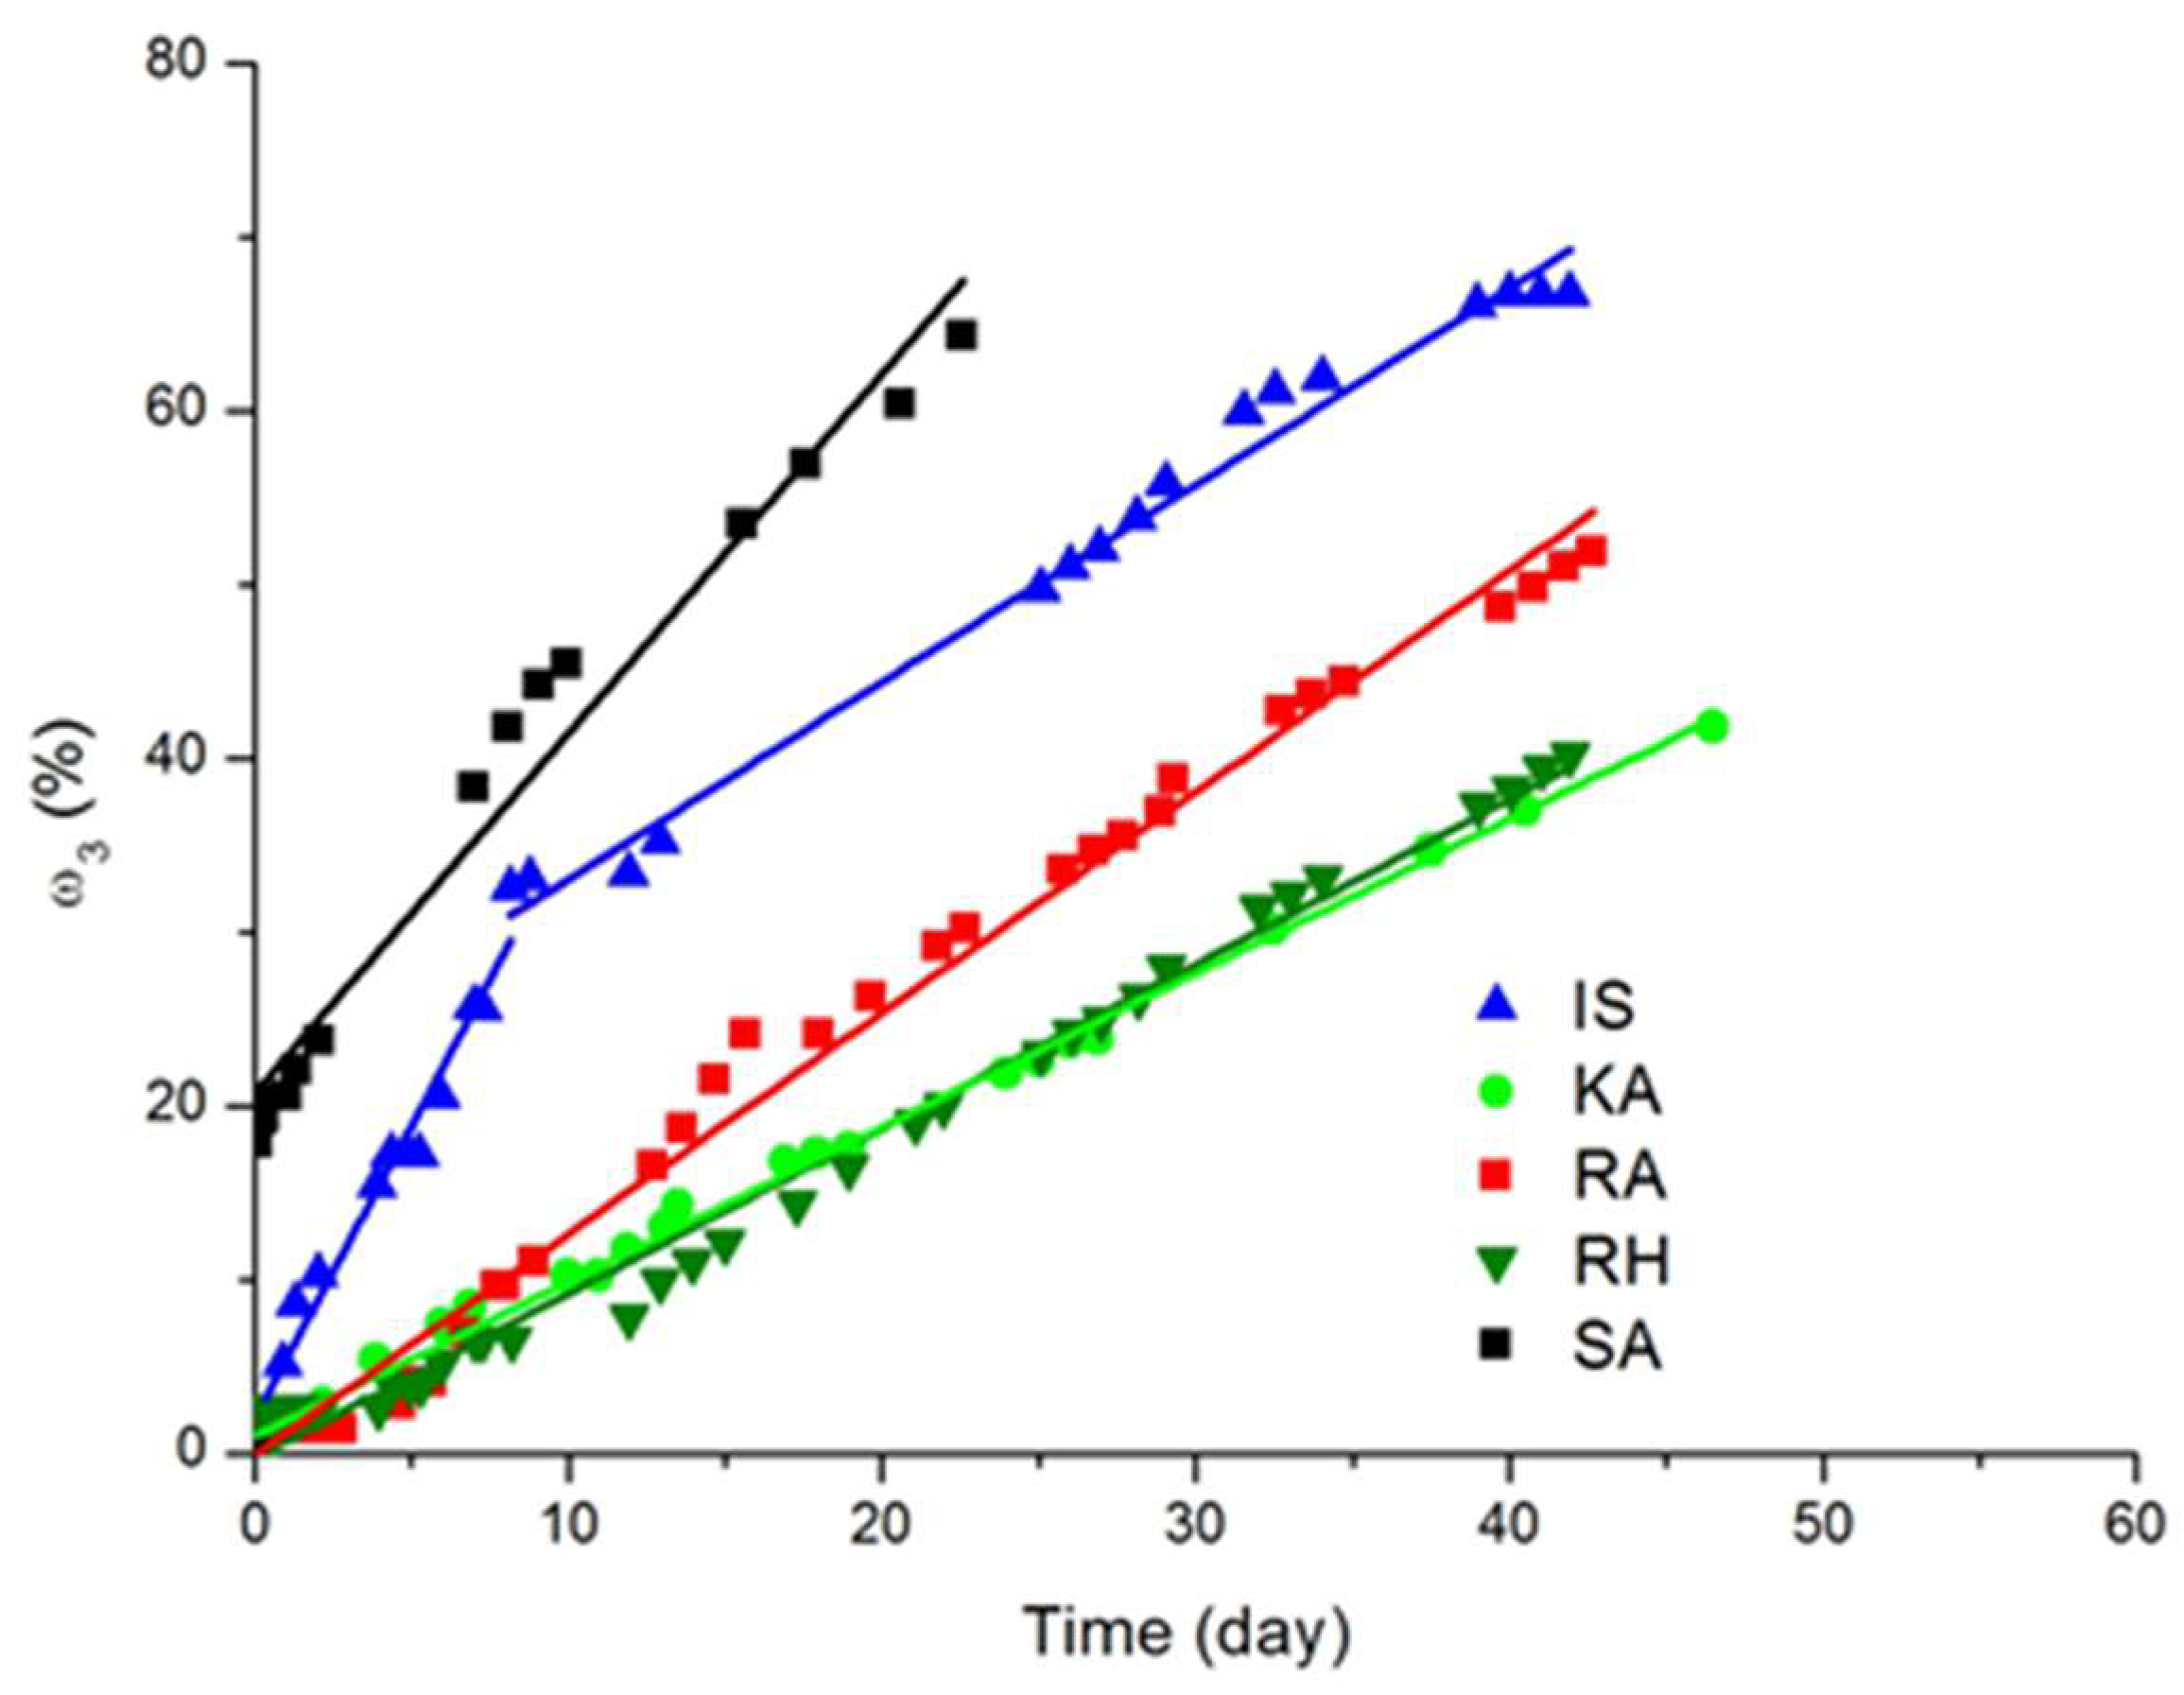
| From Figure 7, ω3 [%] = f(t)[day] | |||
| Equation (9): ω3 = at + b type: Linear, Linear | |||
| Sediment | a | b | r2 |
| IS (inf part) | 2.05 | 3.36 | 0.97 |
| IS (sup part) | 1.15 | 21.34 | 0.99 |
| KA | 0.89 | 0.10 | 0.99 |
| RH | 0.95 | −0.27 | 0.99 |
| RA | 1.27 | −0.09 | 0.99 |
| SA | 2.07 | 20.72 | 0.97 |
| From Figure 10, e = f(t)[day], for all sediments and kaolin clay | ||||
| Equation (11): e = (a + btc)−1 type power, Harris | ||||
| Sediment | a | b | c | r2 |
| IS | 0.39 | 0.02 | 0.88 | 0.97 |
| KA | 0.36 | 0.015 | 0.71 | 0.99 |
| SA | 0.46 | 0.03 | 0.95 | 0.97 |
| RA | 0.35 | 0.09 | 0.24 | 0.84 |
| RH | 0.24 | 0.13 | 0.19 | 0.79 |
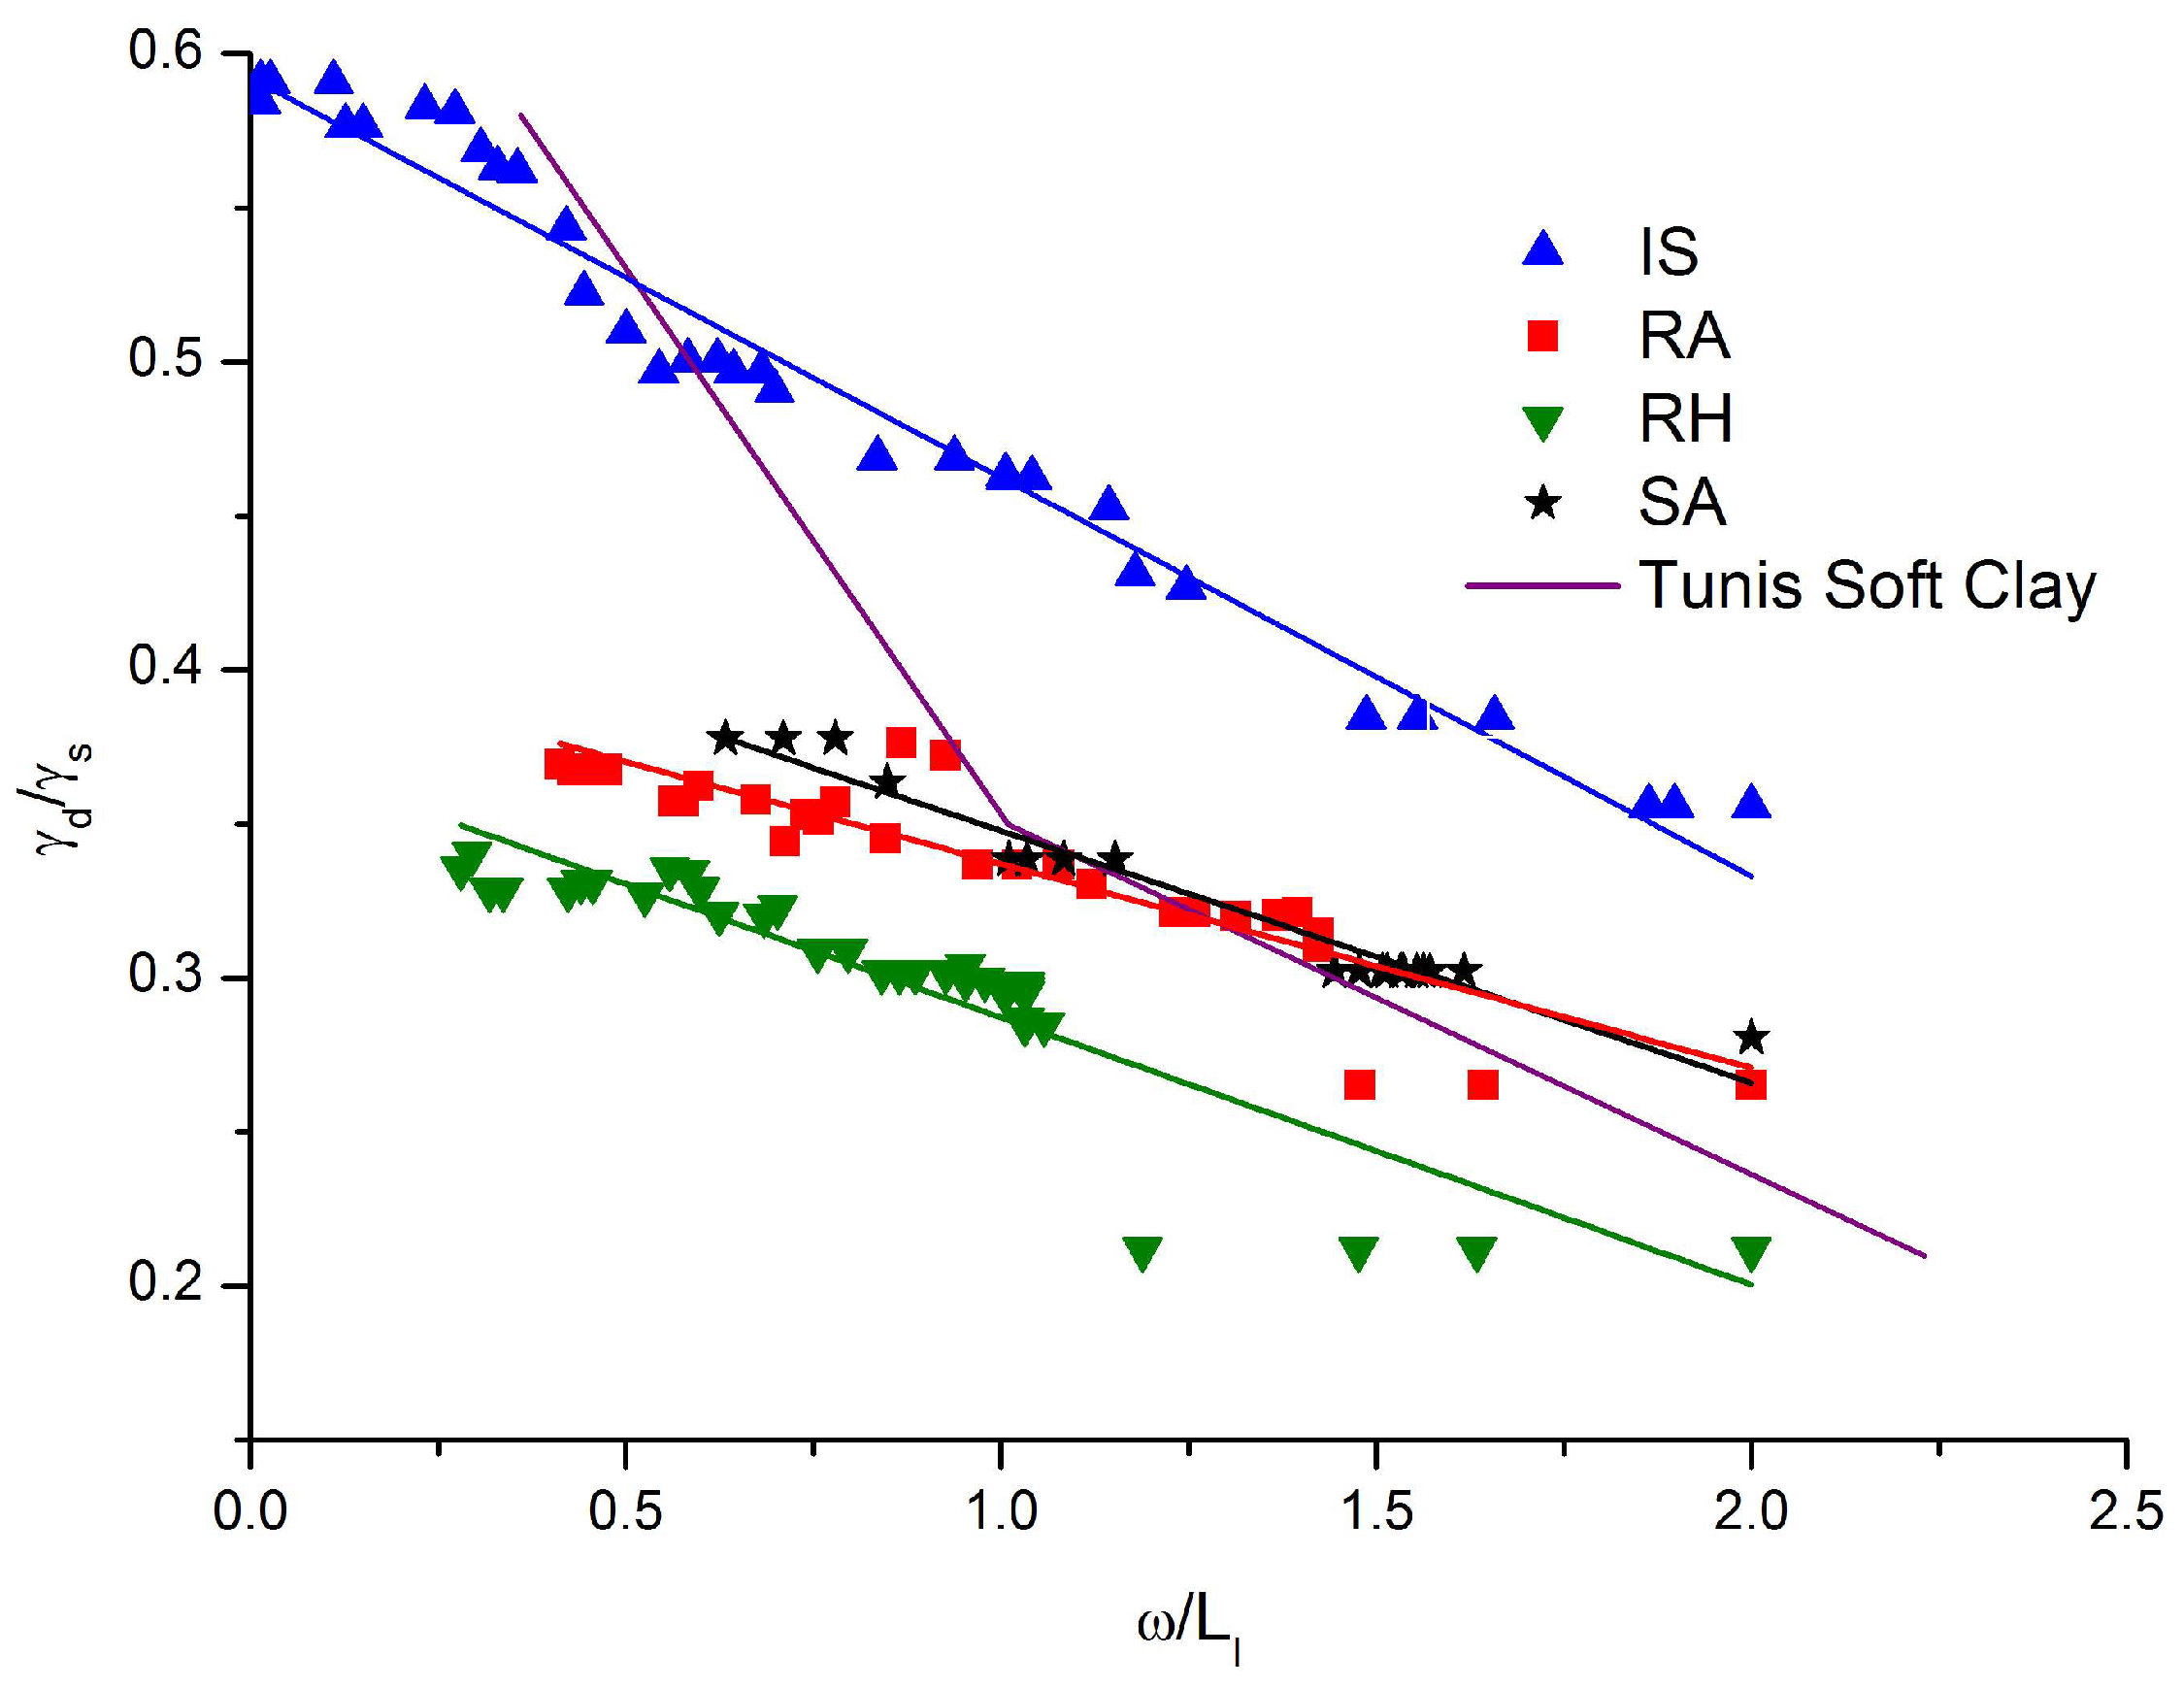
| From Figure 11, ϒd/ϒs = f(ω/LL) | |||
| Equation (12): ϒd/ϒs = a(ω/LL) + b type: Linear, Linear | |||
| Sediment | a | b | r2 |
| IS | −0.13 | 0.59 | 0.97 |
| SA | −0.08 | 0.43 | 0.96 |
| RA | −0.07 | 0.40 | 0.83 |
| RH | −0.09 | 0.37 | 0.83 |
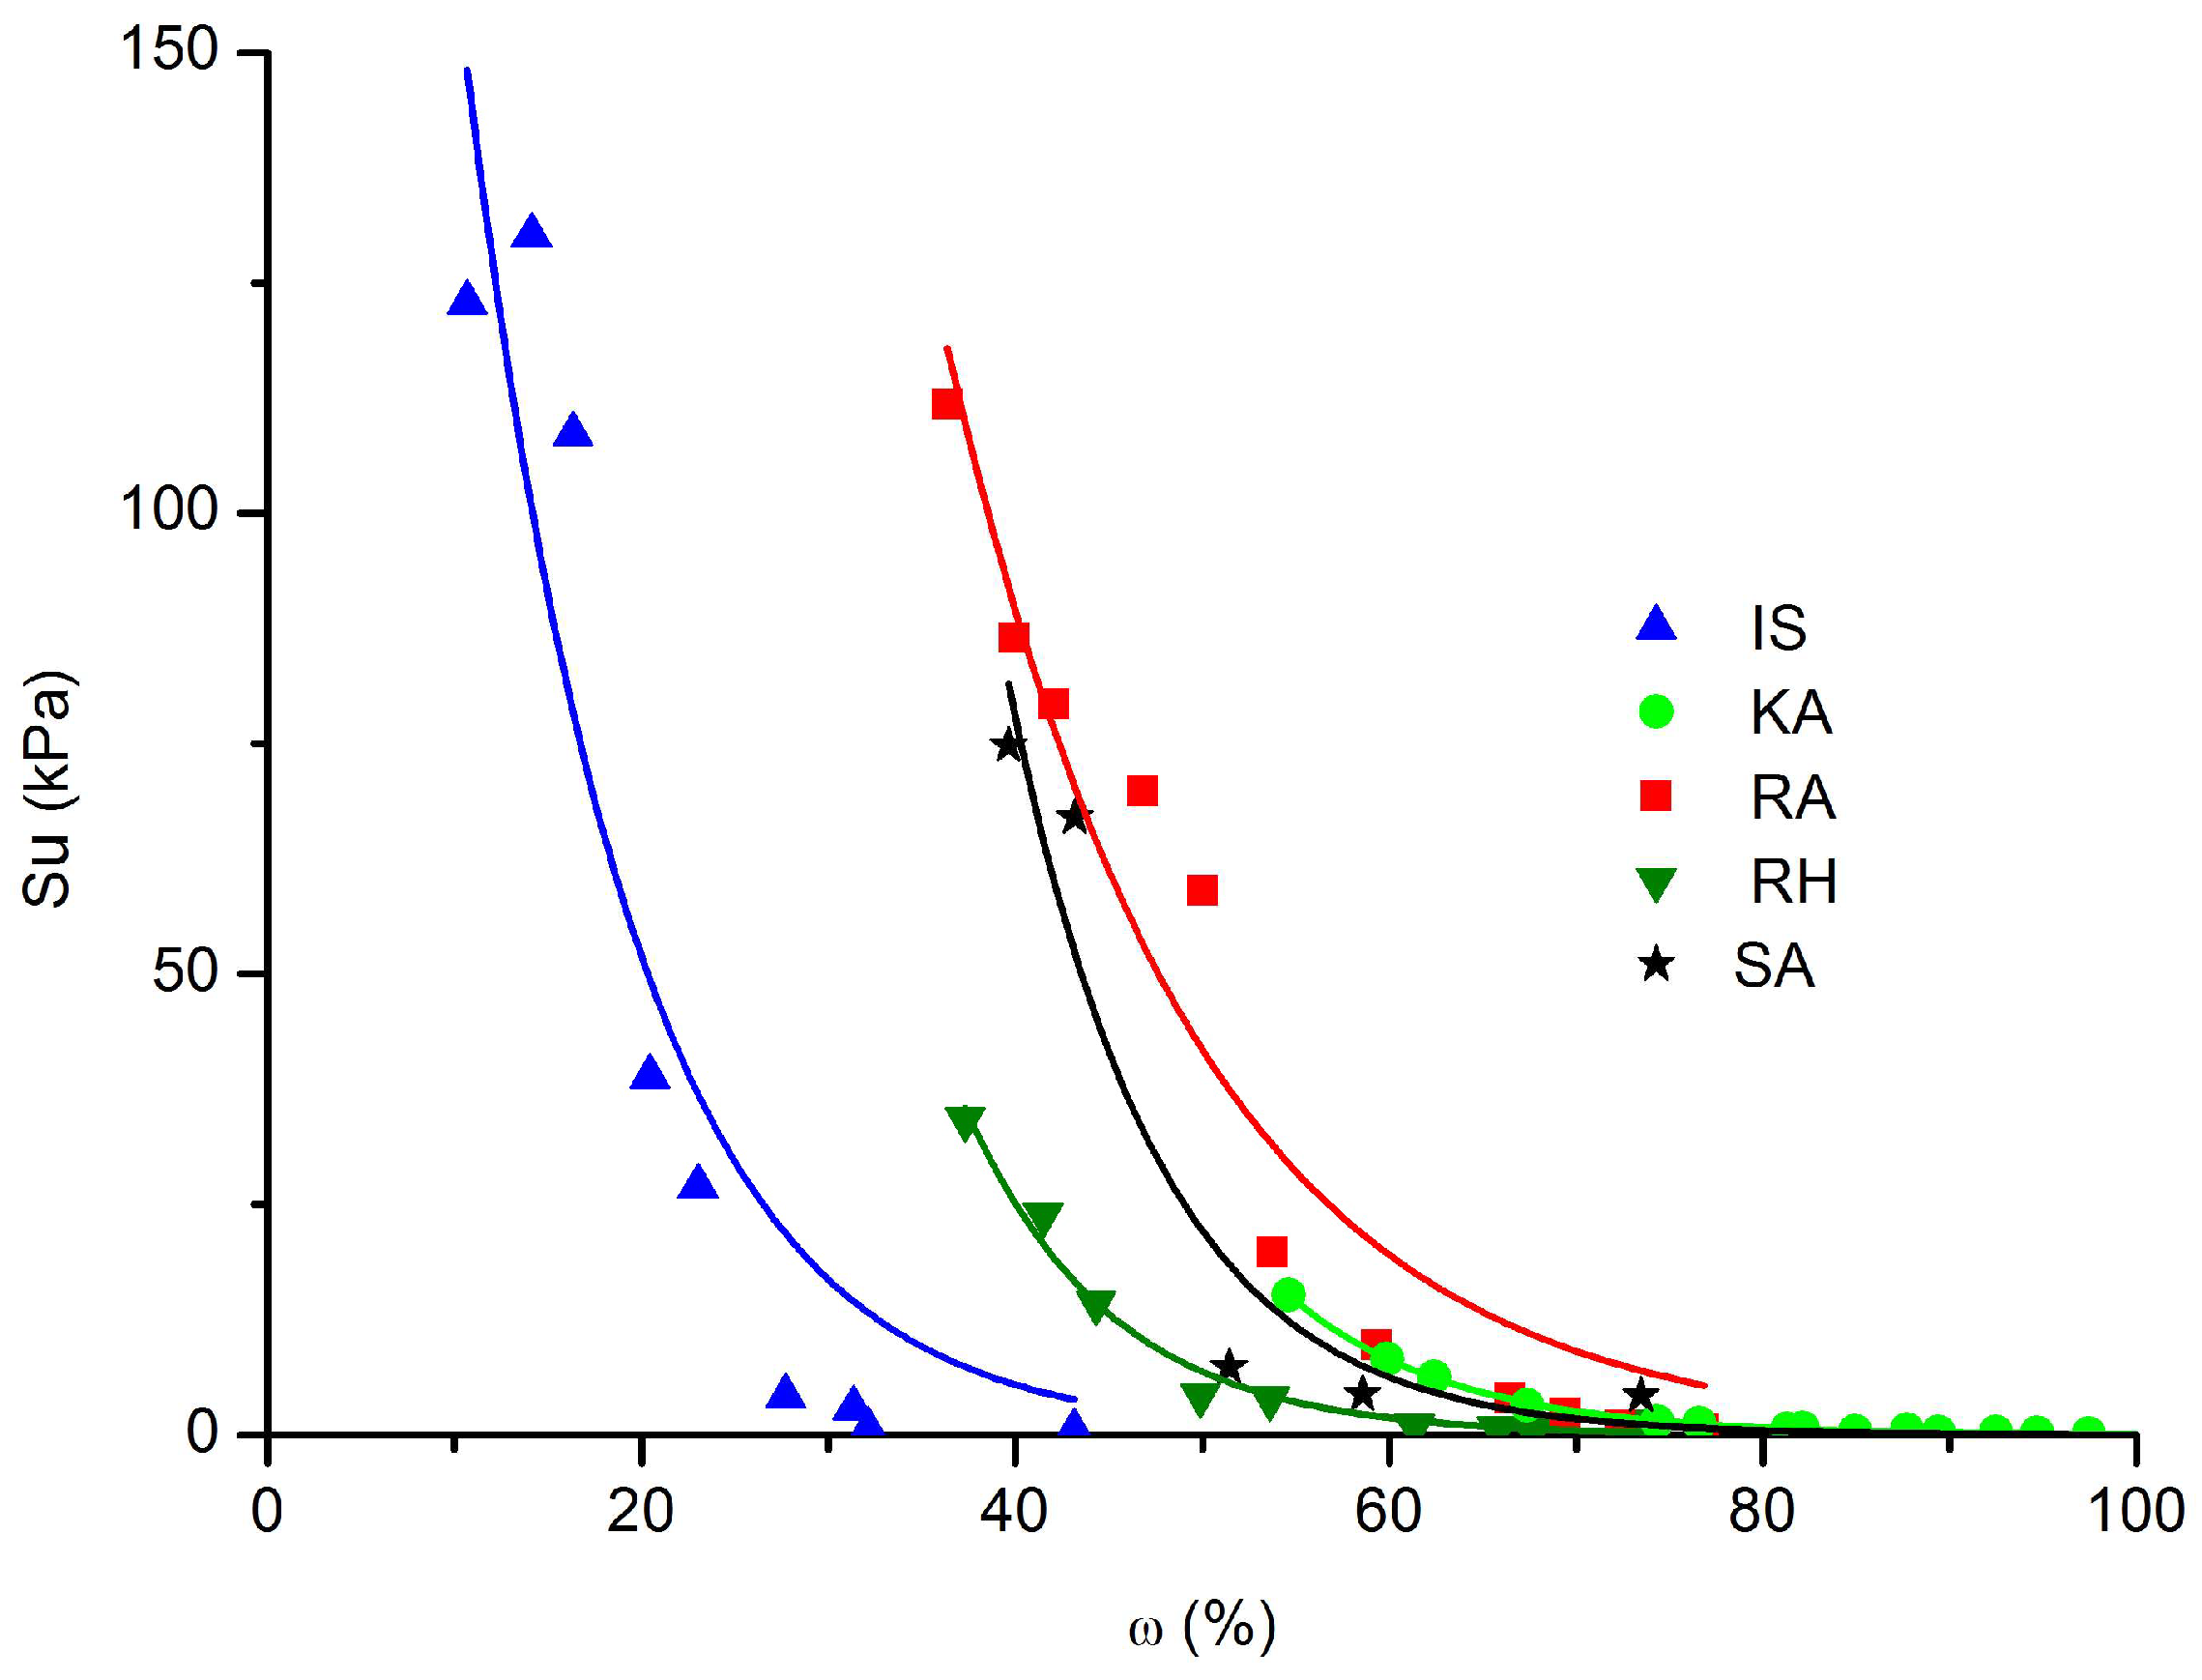
| From Figure 12, Su [kPa] = f(ω)[%] | |||||
| Equation (13): Su = abω, type: Exponential, Exp2p | |||||
| Sediment | IS | KA | RA | RH | SA |
| 492.03 | 8034.45 | 1886.19 | 4485.12 | 12,051.21 | |
| 0.89 | 0.89 | 0.93 | 0.88 | 0.88 | |
| r2 | 0.87 | 0.99 | 0.94 | 0.98 | 0.92 |
| From Figure 14, Su [kPa] = f(t)[day] | |||
| Equation (14): Su = atb, type: Power, Allometric1 | |||
| Sediment | a | b | r2 |
| IS | 0.00216 | 3.29537 | 0.94 |
| RH | 1.53 × 10⁻⁷ | 5.71 | |
| KA | 1.77 × 10⁻⁶ | 4.14 | 0.99 |
| RA | 0.097 | 2.069 | 0.99 |
| SA | 0.019 | 2.89 | 0.94 |
Disclaimer/Publisher’s Note: The statements, opinions and data contained in all publications are solely those of the individual author(s) and contributor(s) and not of MDPI and/or the editor(s). MDPI and/or the editor(s) disclaim responsibility for any injury to people or property resulting from any ideas, methods, instructions or products referred to in the content. |
© 2024 by the authors. Licensee MDPI, Basel, Switzerland. This article is an open access article distributed under the terms and conditions of the Creative Commons Attribution (CC BY) license (https://creativecommons.org/licenses/by/4.0/).
Share and Cite
Azaiez, D.; Boullosa Allariz, B.; Levacher, D. Study of Physical and Mechanical Relationships during the Natural Dewatering of River Sediments and a Kaolin. J. Mar. Sci. Eng. 2024, 12, 1354. https://doi.org/10.3390/jmse12081354
Azaiez D, Boullosa Allariz B, Levacher D. Study of Physical and Mechanical Relationships during the Natural Dewatering of River Sediments and a Kaolin. Journal of Marine Science and Engineering. 2024; 12(8):1354. https://doi.org/10.3390/jmse12081354
Chicago/Turabian StyleAzaiez, Dalel, Beatriz Boullosa Allariz, and Daniel Levacher. 2024. "Study of Physical and Mechanical Relationships during the Natural Dewatering of River Sediments and a Kaolin" Journal of Marine Science and Engineering 12, no. 8: 1354. https://doi.org/10.3390/jmse12081354
APA StyleAzaiez, D., Boullosa Allariz, B., & Levacher, D. (2024). Study of Physical and Mechanical Relationships during the Natural Dewatering of River Sediments and a Kaolin. Journal of Marine Science and Engineering, 12(8), 1354. https://doi.org/10.3390/jmse12081354