Article

Influence of Intrinsic Oceanic Variability Induced by a Steady Flow on the Mediterranean Sea Level Variability

1
Department of Environmental Sciences, Informatics and Statistics, University Ca’Foscari of Venice, Via Torino 155, 30172 Mestre, Italy
2
Department of Science and Technology, Parthenope University of Naples, 80143 Naples, Italy
3
Alfred Wegener Institute, Helmholtz Centre for Polar and Marine Research, 25992 List/Sylt, Germany
4
Institute of Atmospheric Sciences and Climate—National Research Council of Italy (ISAC—CNR), 00133 Rome, Italy
*
Author to whom correspondence should be addressed.
J. Mar. Sci. Eng. 2024, 12(8), 1356; https://doi.org/10.3390/jmse12081356
Submission received: 30 June 2024 / Revised: 2 August 2024 / Accepted: 7 August 2024 / Published: 9 August 2024
(This article belongs to the Special Issue Numerical Modelling of Atmospheres and Oceans II)

Abstract

:
Among the most debated environmental effects of global warming is sea level rise, whose consequences are believed to exert a large influence on vast coastal areas in the next decades and hence contribute to determining near-future societal developments. The observed variability of the sea level is complex, as it is composed of large inhomogeneous, mostly nonlinear temporal and spatial fluctuations. In the Mediterranean Sea, multiannual as well as multidecadal sea level variability is observed, which has been ascribed to different steric and non-steric phenomena. Possible tipping points, uncertain climate feedback, and future human policies contribute to rendering sea level rise predictability intricate. Here, for the first time, correlations between observed and simulated data demonstrates that, in the Mediterranean Sea, oceanic intrinsic variability merely induced by the steady motion of the water masses inflowing and outflowing the basin is able to produce multiannual, sub-basin SSH variability consistent with altimetrically observed SSH. This study contributes to the recognition of the role played by steadily induced oceanic intrinsic variability in the observed long-term Mediterranean dynamics and paves the way to establish a better constraint to the uncertainties inherent in sea level rise predictability.

1. Introduction

A deep comprehension concerning the variability of global as well regional sea levels is fundamental for understanding our climate. Indeed, the position of the sea surface integrates many climate-relevant contributions, like, e.g., oceanic heat content, continental ice melt, and mean sea wind patterns [1]. Such comprehension is also needed for reliably informing possible societal development plans [2,3]. The advent of satellite observations paved the way to the composition of a global view of sea surface height (SSH) variability and trends. The figure emerging after three decades of altimetric observations depicts a complex puzzle of increasing and decreasing trends, superimposed on a mean positive trend deriving from global warming [4], a view substantially confirming the early conclusions drawn by Wunsch et al. [5].
The Mediterranean Sea has been considered a miniature global ocean, as many dynamical characteristics of the global circulation can be found there on a reduced temporal and spatial scale [6,7,8,9,10,11,12,13]. There, the variability emerging from altimetry fundamentally mirrors the global one: multiannual fluctuations, generally superimposed on an increasing trend, can be clearly discerned. Their origin is particularly multifaceted. Net lateral volume transport, net surface volume variations, steric effects, wind and pressure contributions, density advection [14], glacial isostatic, gravitational, rotational, and deformation effects [3,15,16], local internal oceanic phenomena [17], and teleconnections with the subpolar and eastern North Atlantic [3,18,19,20,21,22] are known contributors. In the Mediterranean Sea, an almost permanent meridional gradient in the sea level height is observed, whose fundamental nature has been recently attributed to the mere effect of oceanic intrinsic dynamics induced by a steady inflow of surface Atlantic Water (AW) and by a steady outflow of denser Levantine Intermediate Water (LIW) through the Strait of Gibraltar [23]. AW and LIW variability, together with the water masses they contribute to generate, are known to exert a fundamental influence on the local mesoscale and sub-mesoscale dynamics. Consequently, it affects the local sea level [13,17,24,25]. However, the influence of the steady flow of AW and LIW on the long-term variability observed in altimetric measurements over large areas of the basin, without invoking any atmospheric contribution or remote inflow/outflow variability, has never been conjectured so far. This fact seems somehow surprising, as it has been long known, maybe forgotten and rediscovered that, in complex systems like geophysical stratified fluids acting on a complex bathymetry, low frequency variability can emerge even in the presence of steady forcing conditions [26]. Here, for the first time, we show that a noticeable part of the multiannual, sub-basin SSH variability observed in altimetric data of the Mediterranean Sea may derive from oceanic intrinsic variability merely induced by the steady motion of the water masses inflowing and outflowing the basin. The results of a multicentennial simulation of the dynamics of the Mediterranean Sea performed using a nonlinear multilayer model in which surface momentum, heat, and radiative fluxes are neglected, and forcing merely consists of steady transports imposed through meridional lateral boundaries, show large patterns of statistically significant correlation between simulated and observed SSH time series in different large areas of the western Mediterranean.
Our results contribute to the recognition of the role played by steadily induced oceanic intrinsic variability in the observed long-term, sub-basin Mediterranean dynamics, including that contributing to the local low frequency sea level variability, and paves the way to establish a better constraint to the uncertainties inherent in sea level rise predictability.

2. Materials and Methods

The study is based on the same numerical model recently used by Rubino et al. [23] to investigate aspects of the oceanic intrinsic variability in the Mediterranean Sea. Here, the motion of Modified Atlantic Water or MAW (the near-surface water mass originally composed of AW and undergoing modifications in temperature and salinity along its pattern toward east) and that of Levantine Intermediate Water or LIW (the water mass located under the MAW which is formed in the Levantine basin and transports Mediterranean waters westward) fundamentally characterizes the Mediterranean dynamics, as the movements of the water masses beneath possess, in general, a more confined character. Hence, in our investigation five layers are chosen to represent the Mediterranean dynamics, only two of which, representing MAW and LIW, are forced along the meridional boundaries located within the Strait of Gibraltar and within the Levantine basin (see Figure 1). The remaining, deeper layers are then initially quiescent, and their motion is merely induced by the motion of the two initially active layers.

2.1. Numerical Model

Similarly to the model used in [13,23,27,28] this model solves the nonstationary, nonlinear hydrostatic shallow-water equations on a β plane for a five-layer ocean, where a near-surface layer of MAW, an intermediate layer of LIW, a deep layer, and two abyssal layers represent the basin stratification. Interfacial friction, bottom friction, and eddy viscosity are also considered. The western open boundary is a meridional section through the Strait of Gibraltar. There, a constant eastward AW transport of 1.04 Sv and a constant westward LIW transport of 1.0 Sv are imposed. The eastern open boundary is a meridional section located in the Levantine basin, where a constant eastward LIW transport of 1.0 Sv and a constant eastward AW transport of 1.04 Sv are imposed (Figure 1). The difference between Atlantic inflow and Mediterranean outflow has been set to 0.04 Sv in accordance with previous estimations of transports through the Strait of Gibraltar [29,30], and the exchange flow is consistent with observed subinertial observations [31]. Short-term runs suggest that the model results are quite robust, provided that stationary boundary conditions are implemented. An extension of the study to more complex boundary conditions (e.g., inflow variability reflecting multidecadal fluctuations observed in the Atlantic Water density) will be considered in a future investigation. In principle, oceanic intrinsic variability could affect the inflow/outflow values and, consequently, the interconnection of the Mediterranean Sea with the dynamics of the Atlantic Ocean. However, this aspect is beyond the scope of our paper and would require a different modeling approach to be correctly investigated.
A multi-centennial simulation is carried out [23] for investigating the very low frequency oceanic intrinsic variability of the basin and comparing the emerging fluctuations with those found in altimetric data. In the numerical run, a long period was needed for the model to attain completely adjusted dynamics, as the initial conditions of our process-oriented simulation were characterized by horizontal, motionless layers. Once a statistically stationary state was obtained, i.e., a state in which no permanent monotonic secular trends appeared, we let the model run for a further 300 years. For each model grid point representing an oceanic location (4904 points in this case), we compared all the available continuous 30-year simulated time series with the corresponding altimetrically observed 30-year time series. This process yielded 270 correlation surfaces, each comprising 4904 points, illustrating the spatial distribution of correlations between the simulated and observed time series (see also Supplementary Materials).
Let us define the transport in the i-th layer (i = 1, …, 5) as Ui = ζ i ζ i + 1 u dz, where u represents the horizontal water velocity and ζ i + 1   a n d   ζ i the upper and lower interfaces delimiting the i-th layer, respectively. In such notation, ζ 1  and ζ 6 represent thus the position of the ocean floor and that of the free surface, respectively. The average horizontal velocity in the i-th layer is ui = Ui/hi, where hi = ζ i ζ i + 1 d z  is the layer thickness.
For the upper layer, the momentum and the continuity equations read:
U 1 t + u 1 × U 1 + F U 1 = g h 1 η 1 k 1 ρ 1 u 1 u 2 u 1 u 2 + A h h 1 h 2 u 1
  h 1 t + U 1 = 0
for the second layer, they read:
U 2 t + u 2 × U 2 + F U 2 = g ρ 1 ρ 2 h 2 η 1 g ρ 2 ρ 1 ρ 2 h 2 η 2 + k 1 ρ 2 u 1 u 2 u 1 u 2 k 2 ρ 2 u 2 u 3 u 2 u 3 + A h h 2 h 2 u 2 ,
h 2 t + U 2 = 0
for the third layer, they read:
U 3 t + u 3 × U 3 + F U 3 = g ρ 1 ρ 3 h 3 η 1 g ρ 2 ρ 1 ρ 3 h 3 η 2 g ρ 3 ρ 2 ρ 3 h 3 η 3 k 2 ρ 3 u 2 u 3 u 2 u 3 k 3 ρ 3 u 3 u 4 u 3 u 4 + A h h 3 h 2 u 3 ,
  h 3 t + U 3 = 0
for the fourth layer, they read:
                    U 4 t + u 4 × U 4 + F U 4 = g ρ 1 ρ 4 h 4 η 1 g ρ 2 ρ 1 ρ 4 h 4 η 2   g ρ 3 ρ 2 ρ 4 h 4 η 3     g ρ 4 ρ 3 ρ 4 h 4 η 4 k 3 ρ 4 u 3 u 4 u 3 u 4 k 4 ρ 4 u 4 u 5 u 4 u 5 + A h h 4 h 2 u 4 ,
  h 4 t + U 4 = 0
and for the bottom layer, they read:
U 5 t + u 5 × U 5 + F U 5 = g ρ 1 ρ 5 h 5 η 1 g ρ 2 ρ 1 ρ 5 h 5 η 2 g ρ 3 ρ 2 ρ 5 h 5 η 3 g ρ 4 ρ 3 ρ 5 h 5 η 4 g ρ 5 ρ 4 ρ 5 h 5 η 5 k 4 ρ 5 u 4 u 5 u 4 u 5 k 5 ρ 5 u 5 u 5 + A h h 5 h 2 u 5 ,
  h 5 t + U 5 = 0
F = 0 f f 0
where f = f0 + βy represents the Coriolis parameter (f0 is the Coriolis parameter in the central latitude of the model domain, while βy is its meridional variation); ρi, (i = 1, … 5) are the water densities of the layers, g is the acceleration of gravity; κi (i = 1, … 5) are friction coefficients, and Ah is the horizontal eddy viscosity coefficient, considered to be the same in each layer.
The equations are discretized on a staggered Arakawa C grid and solved with an explicit numerical scheme starting from a quiescent system. Δx = Δy = 20 km, Δt = 30 s, Ah = 200 m2 s−1, κ1 = κ2 =κ3 =κ4 = 0.1 kg m−3, and κ5 = 3 kg m−3. The densities of the layers are ρ1 = 1027.80 kg m−3, ρ2 = 1029.10 kg m−3, ρ3 = 1029.15 kg m−3, ρ4 = 1029.18 kg m−3, and ρ5 = 1029.20 kg m−3. The undisturbed interfaces are set at η1 = 0 m, η2 = −150 m, η3 = −800 m, η4 = −3000 m, and η5 = −3500 m. The bathymetry is adapted from the National Geophysical Data Center 2006 2’ Gridded Global Relief Data (ETOPO2v2) [32]. In particular, the deep layer and the two abyssal layers schematizing the Mediterranean stratification below the two active layers composed of AW and LIW were initialized as quiescent layers, and they were not forced laterally. This corresponds to the more confined nature of the abyssal layers in the basin and reflects the fact that, in our process-oriented investigation, the phenomena fueling the local abyssal circulation are not considered. The fact that we focus our study on the dynamics merely generated by the steady flow imposed at the western and eastern boundaries in the upper two layers unavoidably leads to an attenuation of many meridional motions, particularly those generated by atmospheric phenomena influencing the paths of the inflowing AW, and to an almost complete suppression of near-inertial motions (see, e.g., Chen et al., 2021 [33] for a deeper discussion about interactions between nonlinear Ekman pumping, near-inertial oscillations, and geostrophic turbulence in an idealized layer model). Vertical motions, in layered models, correspond to displacements of the interfaces between the layers, while mass transport between the layers can be considered using an entrainment-detrainment parameterization. This last aspect was not considered in our model, as it refers to constant density layers.

2.2. Observational and Simulated Data Analysis

In this study we use annual mean sea level anomaly (ADT) data for the period spanning from 1993 to 2022 provided by the Copernicus Marine Service. ADT represents the sea surface height above the geoid as the sum of the mean dynamic topography (MDT) and the sea level anomaly (SLA): ADT = SLA + MDT [34].
In particular, gridded daily mean SLA data at 1/8° × 1/8° spatial resolution over the Mediterranean Sea between 1993 and 2022 were obtained from The Copernicus Marine Service (or Copernicus Marine Environment Monitoring Service) (https://doi.org/10.48670/moi-00141, accessed 25 March 2024), which is the marine component of the Copernicus Programme of the European Union. The dataset was delivered by the DUACS altimeter production system, which includes data from different altimetry missions. Here we used data from Topex/Poseidon between 1 January 1993 and 23 April 2002, Jason-1 between 24 April 2002 and 18 October 2008, OSTM/Jason-2 between 19 October 2008 and 25 June 2016 and Jason-3 from 25 June 2016. To avoid biases, a stable number of altimeters (two) was used [35].
The data went through all the DUACS processing steps. This goes from homogenization, such as orbit, references, instrumental and geophysical corrections to cross-calibration and noise filtering, such as removal of multi-mission biases [36]. The correction for glacial isostatic adjustment (GIA) [37] was applied to the satellite data, and seasonality was removed from the data. Additionally, the Topex Poseidon correction was implemented between 1993 and 1998 to address instrument drifting issues.
The analyses refer to the period from January 1993 to December 2022. Daily time series were converted into monthly and annual series. The seasonality was removed before converting the data into annual values. A least-square linear regression model was used to assess the observed trends and trends simulated in four selected points in the Mediterranean Sea at the 95% confidence interval.
A correlation analysis was conducted between satellite data and simulated data. For each point, the observed, detrended 30-year series was compared with a 30-year time series from the model output. The comparison starts at time one and slides by one year through the entire length of the model output. Specifically, for each time between 1 and 270, a 30-year correlation was performed between the satellite observation data and the model results.
For comparing observed and simulated data, all the “wet” points within the model domain were compared with the closest point of the Copernicus grid.
For computing the correlations, the model output’s starting point of the simulated time series (note that the total simulation length is 300 years) was shifted from the beginning of the first year to the beginning of year 270. In this way, 270 correlation maps were produced. Significance testing was performed at a 10% level, and only statistically significant correlations were included in the analysis. Many of the obtained maps show large areas of statistically significant correlation (see also the Supplementary Materials). The selection of figures was based on the magnitudes of the correlation coefficients and on the spatial distribution of significant patterns.

3. Trend Analysis in Observed and Simulated Data

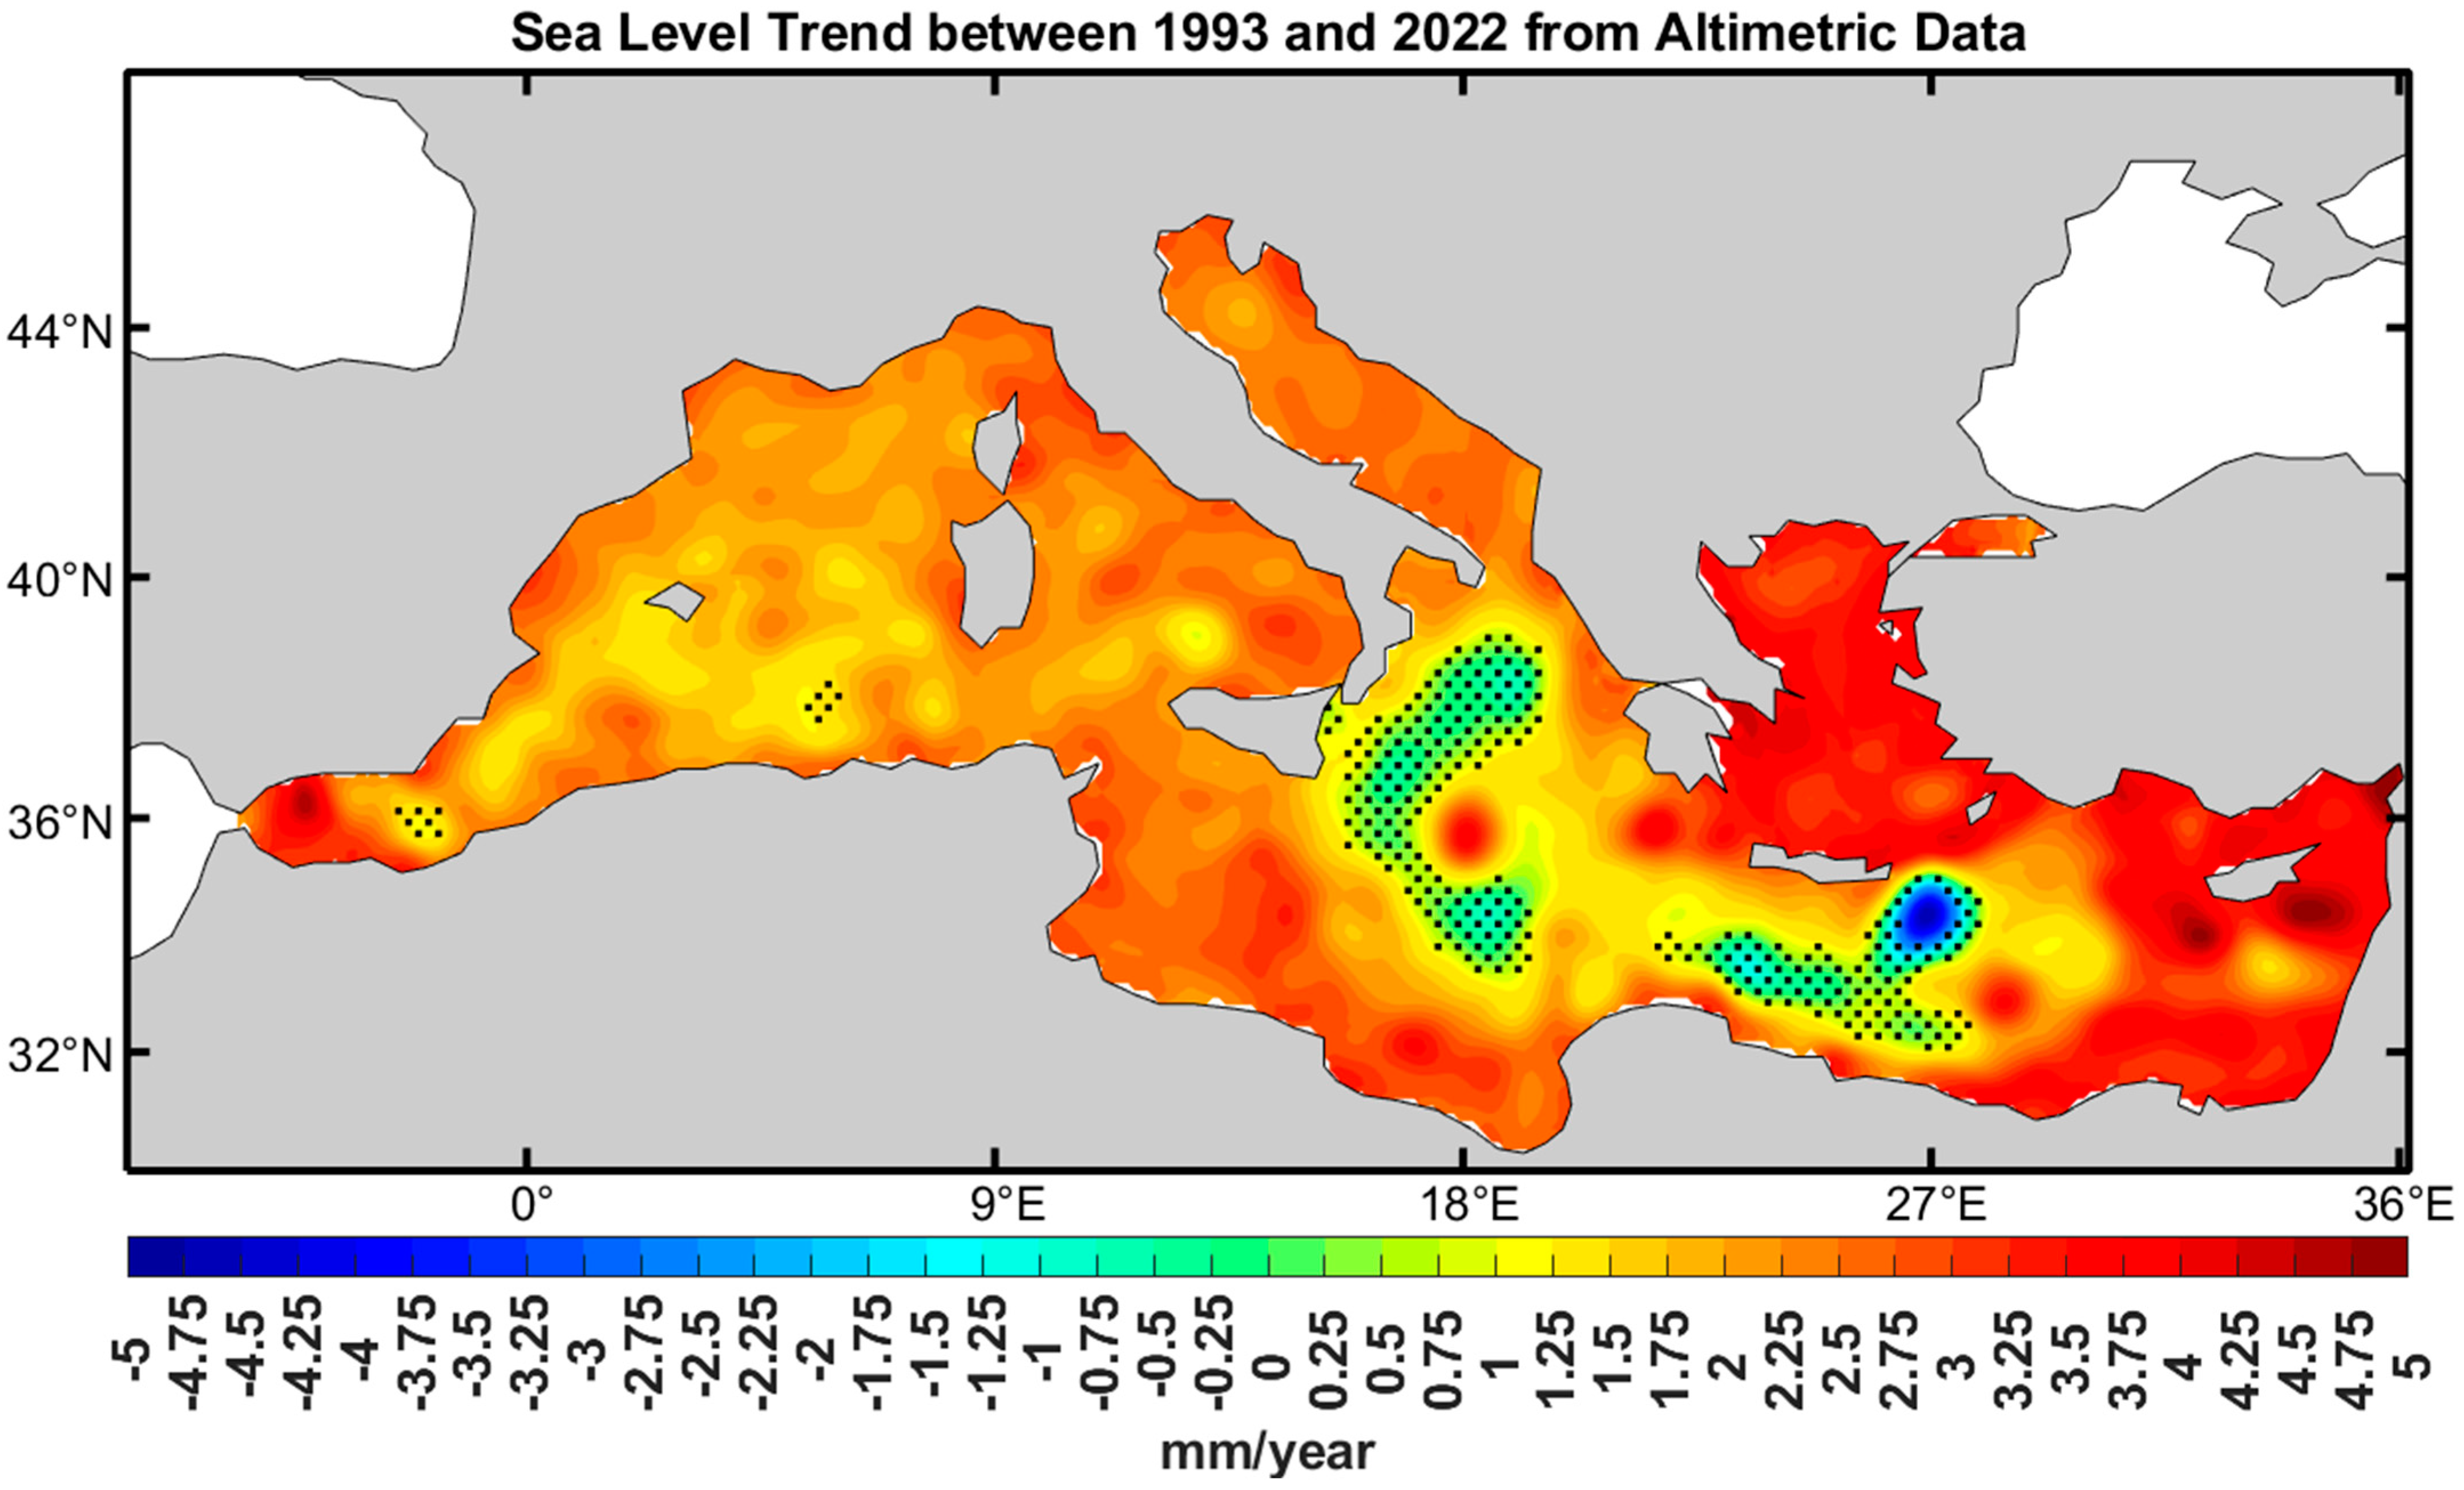
Figure 2 shows SSH trends in the Mediterranean Sea as calculated using the available altimetric data for the period 1993–2022. A similar map, referring to the period 1993–2019, was presented by Meli et al. 2023 [24].
Superimposed on a general tendency toward increasing sea level, we note different areas of small SSH increase and even large areas characterized by a decreasing trend. Part of the differences between the trends observed in different areas has been explained as the result of variability in net lateral volume transport, in net surface volume, in steric effects, in density advection [14], as well as the result of spatial variability in non-steric phenomena like, e.g., glacial isostatic, gravitational, rotational, and deformation effects [3,15,16]. Local internal oceanic phenomena [17] and the effect arising from wind and pressure contributions, partly resulting from teleconnections with the subpolar and eastern North Atlantic, have also been shown to explain part of the spatial variability visible in observed Mediterranean sea level trends [3,18,19,20,21,22,38]. Notably, a large area characterized by vanishing, or even negative, trends can be observed along an almost meridional line crossing the north Ionian basin and the Libyan Sea. Such anomaly is probably related to the near-surface variability induced by the Bimodal Oscillating System (BiOS) in the area [13,25,39,40,41]. Compared to the map presented by Meli et al. 2023 [24], we observe a substantial increase in the trend’s statistical significance in both the western and eastern basins. Specifically, in approximately 7% of the Mediterranean basin, the period between 2020 and 2022 brought a linear trend increase greater than 0.5 cm per decade, while in circa 7% of the basin, it resulted in a decrease greater than 0.5 cm per decade. Areas even emerged, for which the increase or decrease brought by our three-year addition exceeded 1.0 cm per decade.
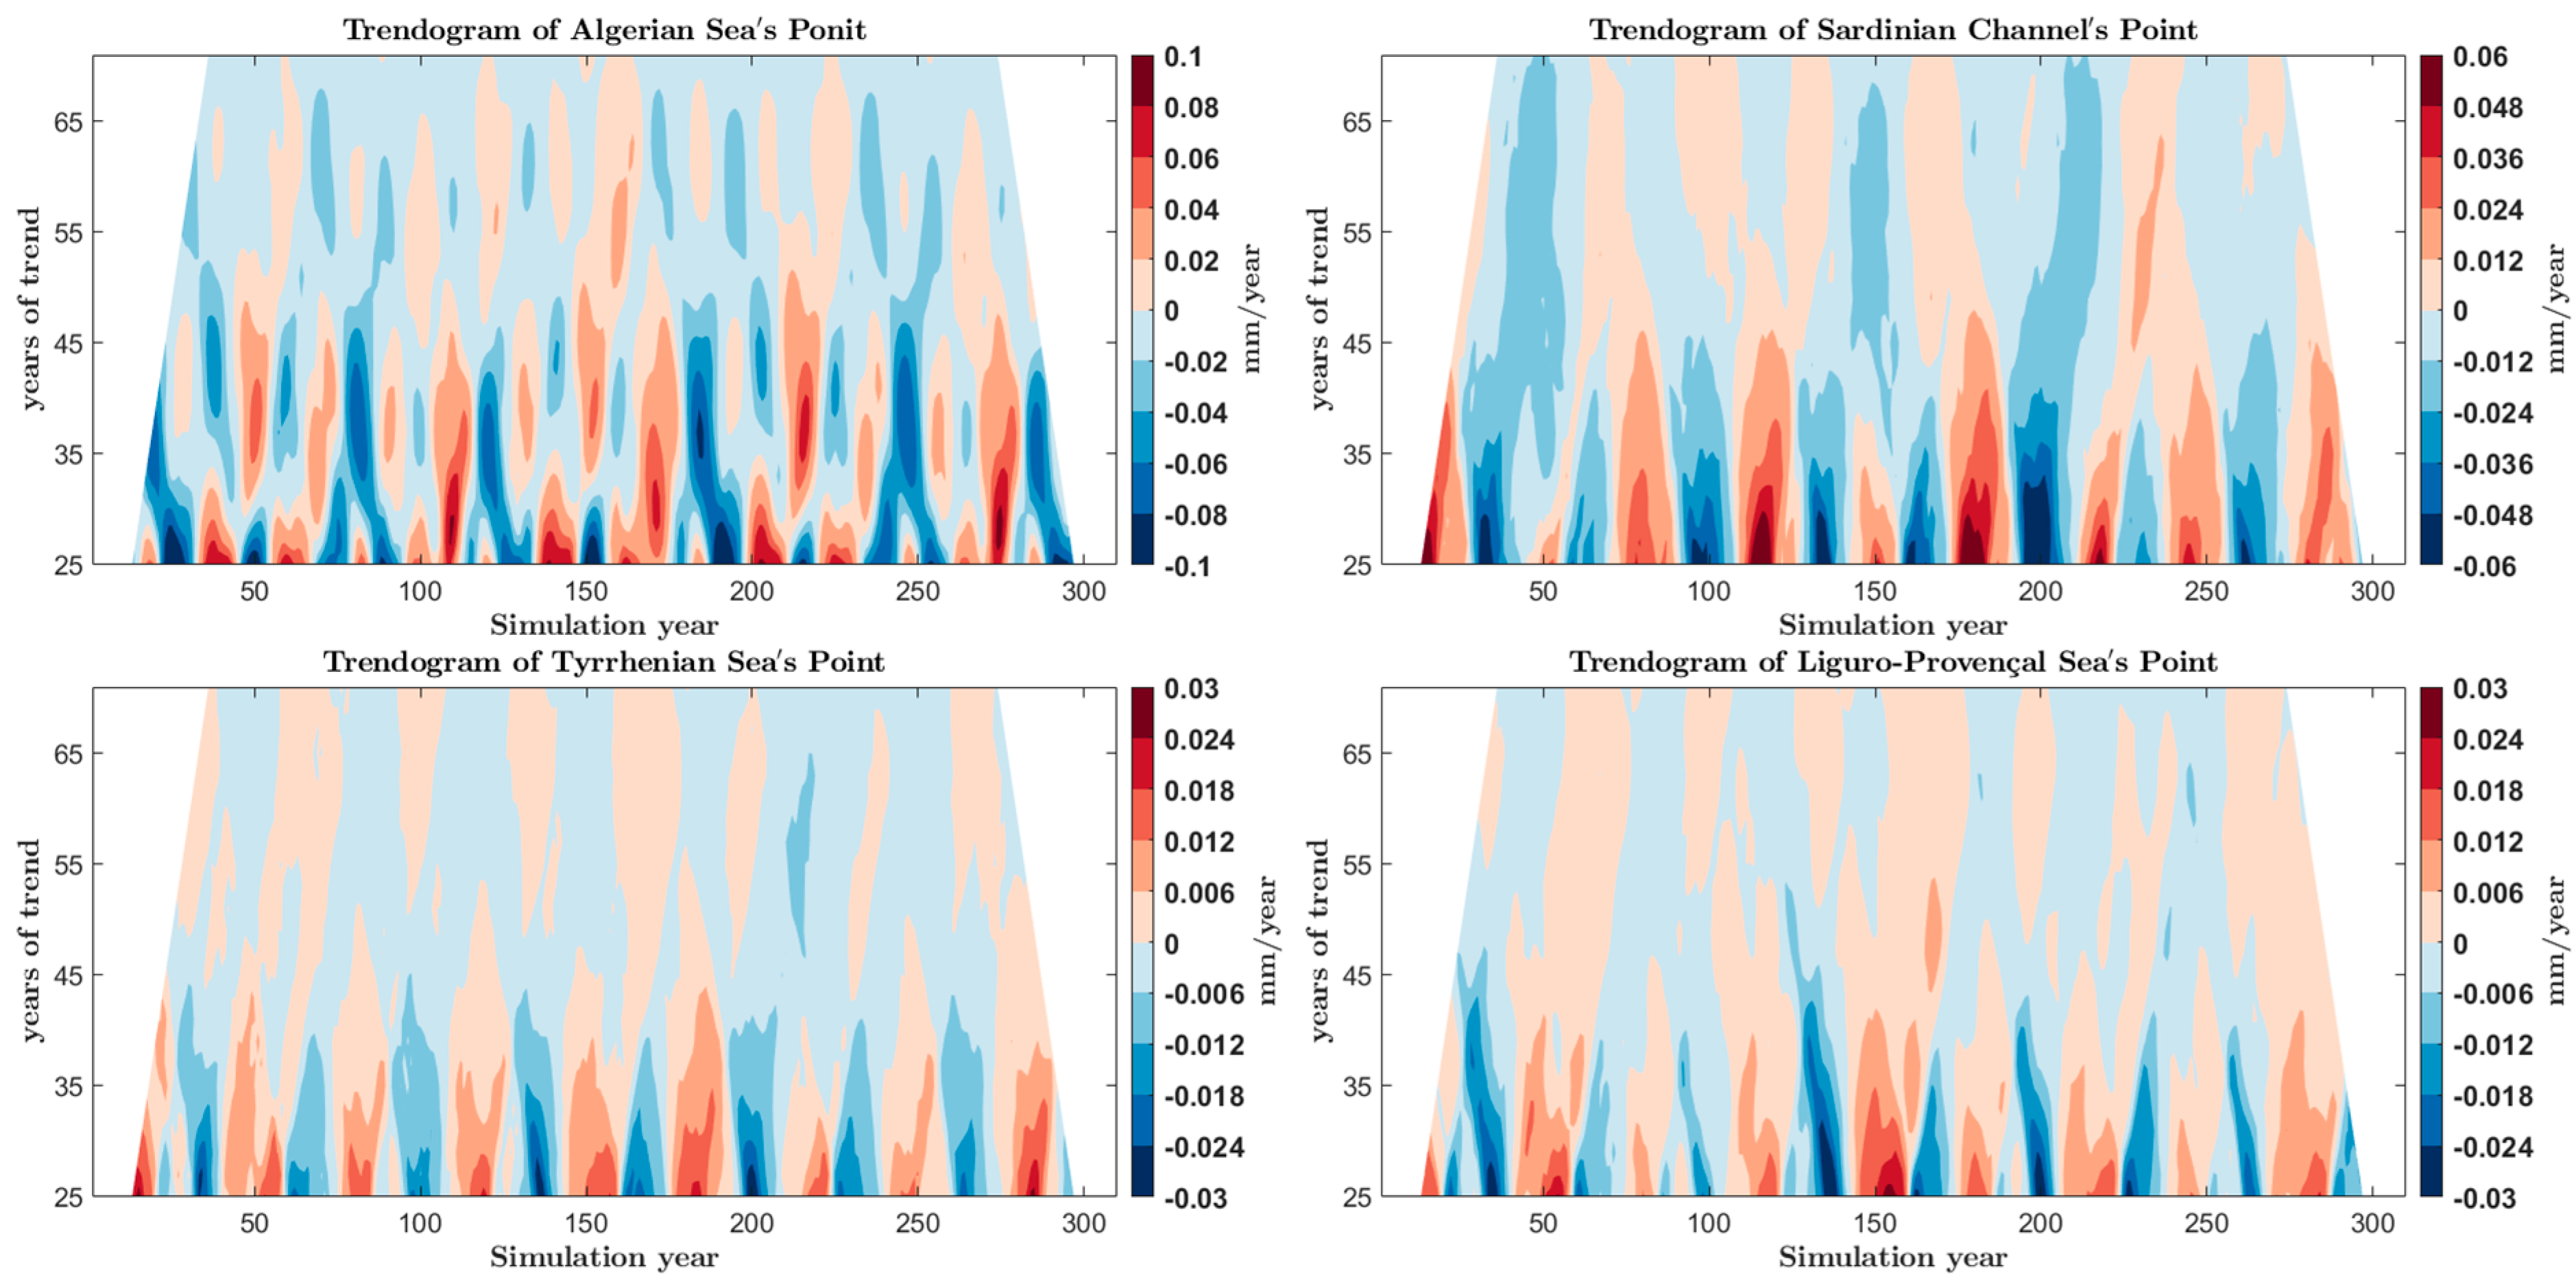
Trendograms for sea level height in four selected points of the western basin (see Figure 1 for the location of these points) as simulated by the numerical model are depicted in Figure 3. The points were selected simply to illustrate the variability obtained in the simulated trends in regions strongly influenced by the flow of the water masses deriving from the Atlantic inflow and the Levantine outflow on time scales largely exceeding the duration of available altimetric observations (30 years). They are representative of areas of the western basin where strong interactions between MAW and LIW take place (see also Supplementary Materials). Clear trends in the multi-decadal time scales emerge that reflect the propagation of very low-frequency oscillations throughout the basin produced as a part of the oceanic intrinsic variability due to the steady inflow/outflow of AW/LIW throughout the strait of Gibraltar [23]. Hence, steadily induced oceanic intrinsic variability is able to generate long-lasting trends of periods comparable with the periods of available altimetric observations and even much longer (see also our Supplementary Materials), exhibiting, on shorter temporal scales, magnitudes comparable with the observed ones. Their spatial variability is large: it is the result of the variability induced by the underlying bathymetric features and by the different thickness of the local water layers in the very slow fluctuations remotely triggered by the boundary flows [23]. We note that the signal amplitude, visible as trend intensities and as trend durations, decreases from the region of the Algerian Current toward the Tyrrhenian Sea and the Balearic Island. This fact reflects the particular attenuation of the propagation of a very low-frequency signal following a cyclonic route consistent with the path of the MAW in the eastern part of the western Mediterranean subbasin [27] in a very simplified, process-oriented simulation as the one performed here. The assumption of steady boundary conditions helps us elucidate the complex periodicities that spontaneously emerge. Adding periodic forcing to the steady boundary conditions would likely introduce additional fluctuations, reflecting the imposed harmonics, which would then appear in trendograms like the one depicted in Figure 3.
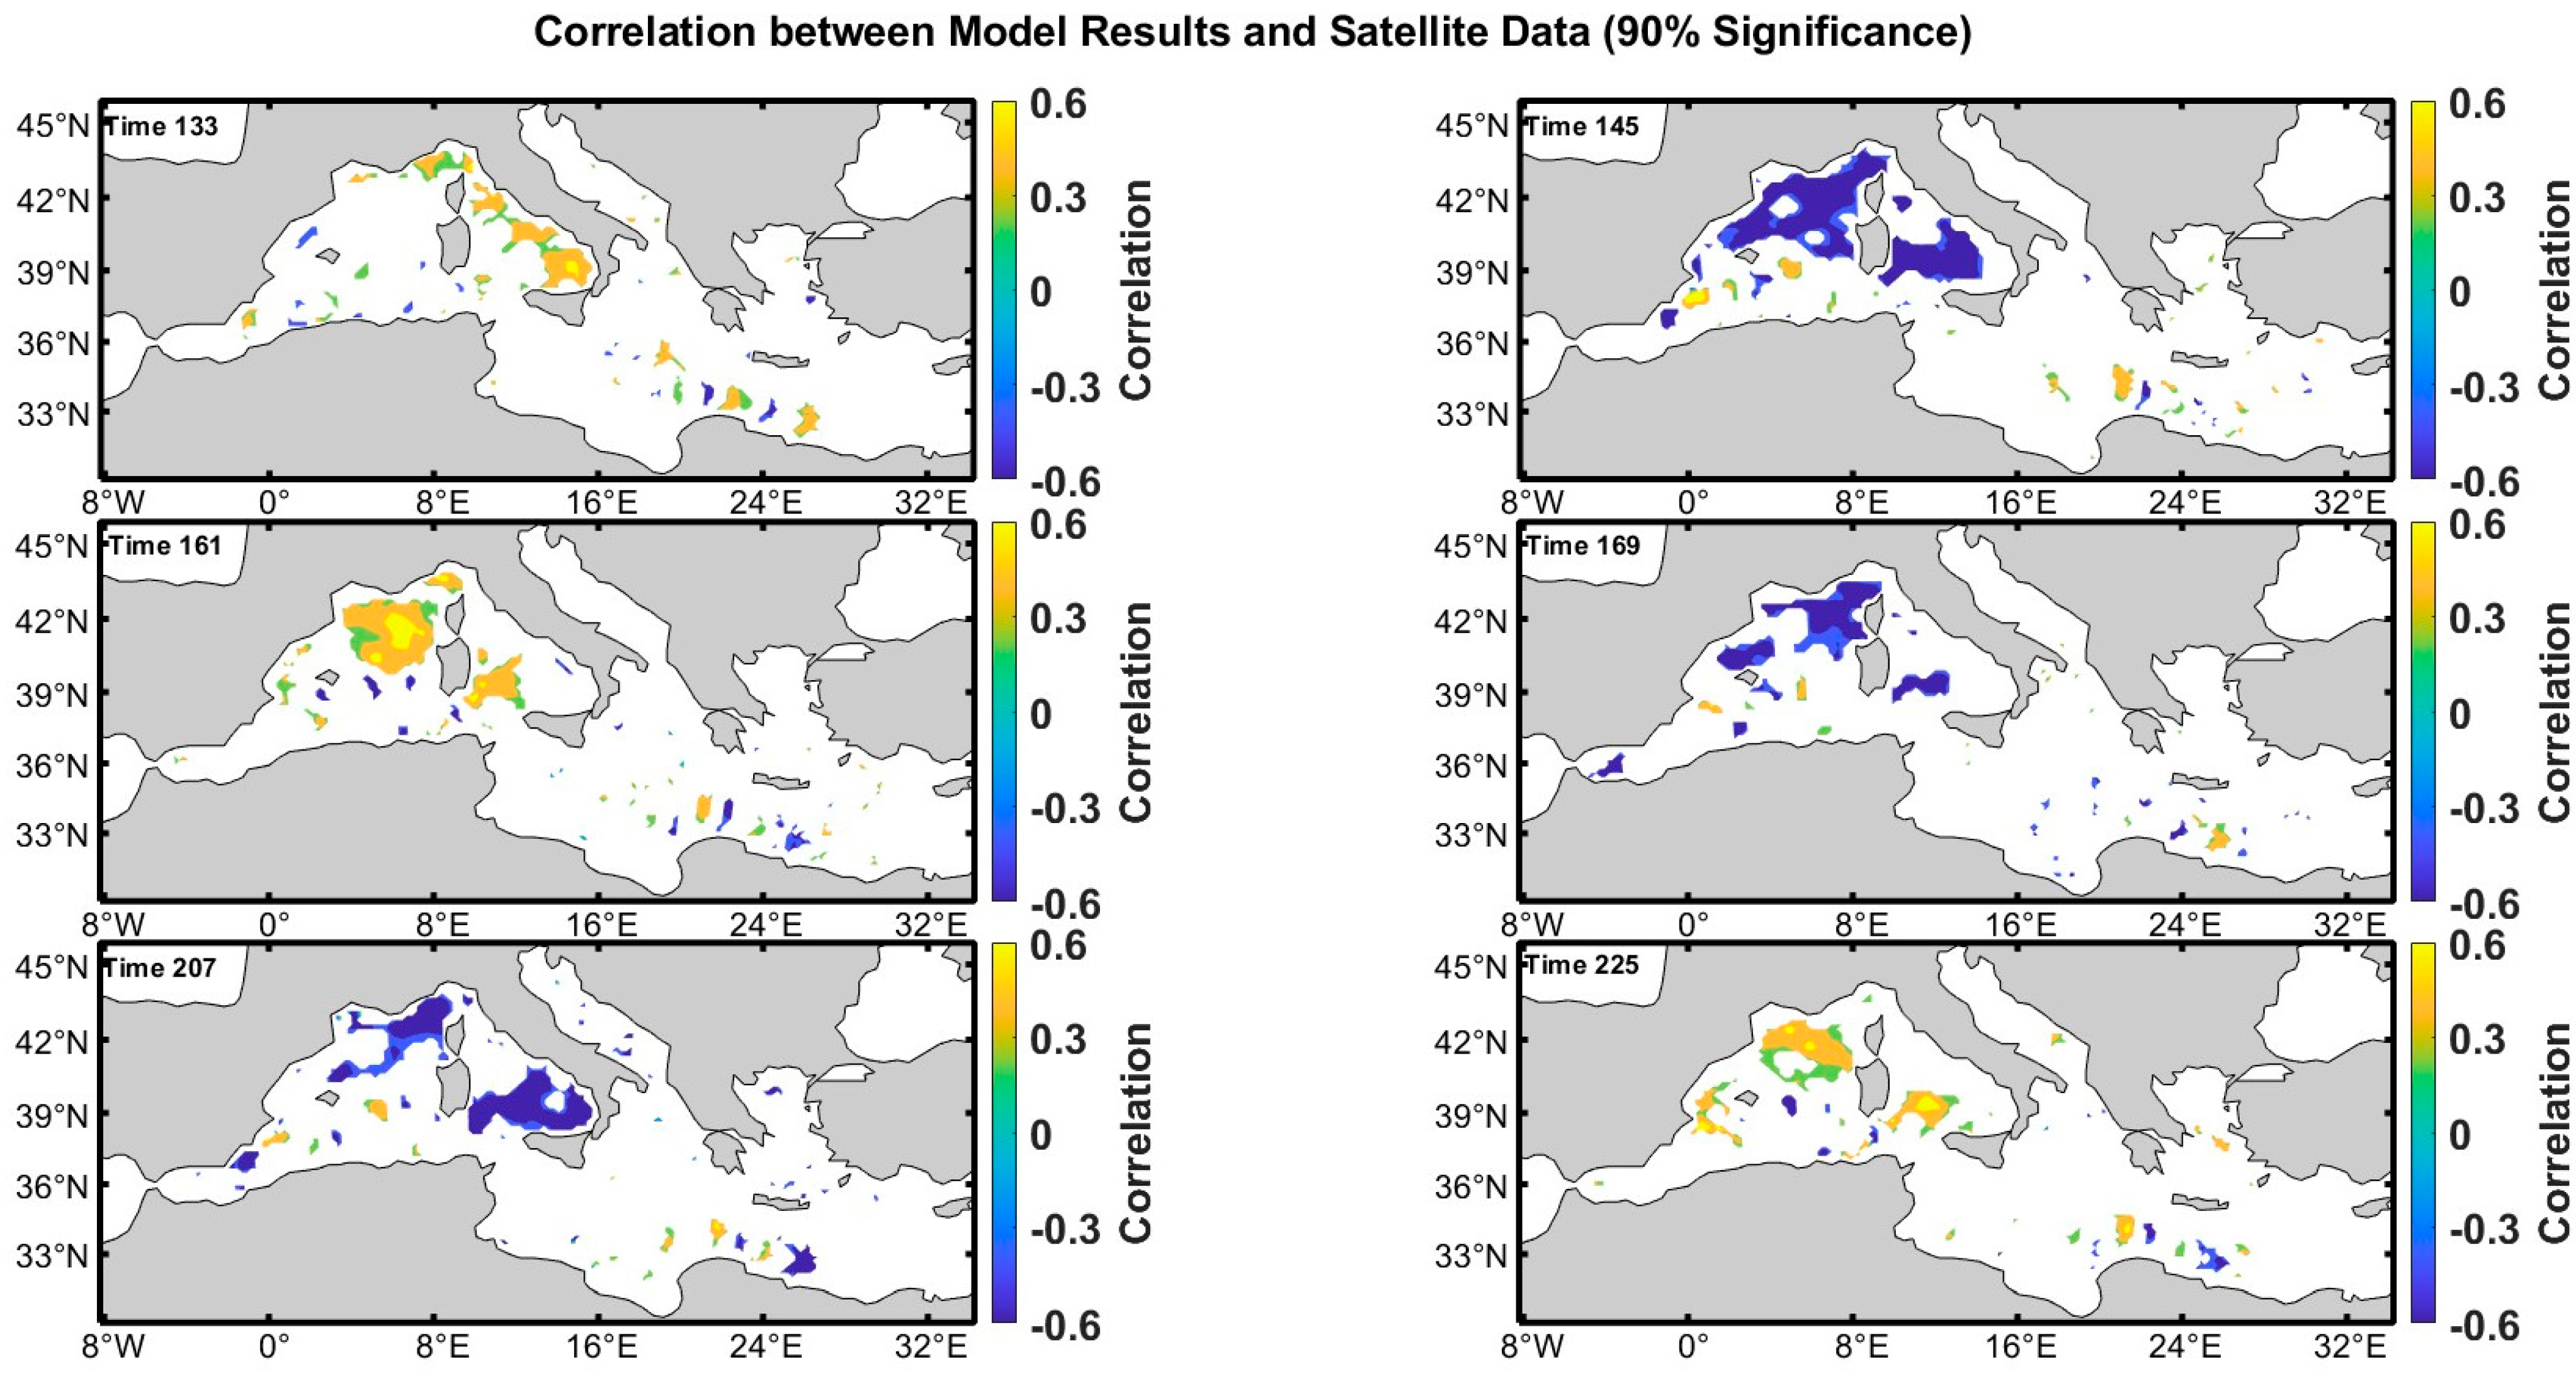
Figure 4 shows two examples of the obtained statistically significant correlations between observed and simulated data. Observed data have been detrended by subtracting the mean basin’s trend. To compare the simulated time series with the observed ones, the closest point in the satellite data for each grid point representing an oceanic location in our model was identified using the Haversine formula [42]. This formula measures the shortest distance between two points on the Earth’s surface, given their longitude and latitude, which represents the shortest arc connecting them.
In the six examples selected here (the whole series of 270 correlation surfaces can be found in the Supplementary Materials), large areas of significant correlations emerge, the anticorrelation areas being in general broader than the positive correlation ones. As the model is forced by steady boundary conditions, a common signal between observed and simulated SSH can be in co-phase or anti-phase, depending on the selected 30-year simulated interval chosen to pair the altimetric time series, in the presence of an asymmetric simulated undular signal. All areas are substantially larger than the typical diameter characterizing mesoscale features encountered in the Mediterranean Sea [23], which indicates the spatial persistence of similarities between simulations and observations to largely exceed the typical extent of regions possibly characterized by large autocorrelation properties.
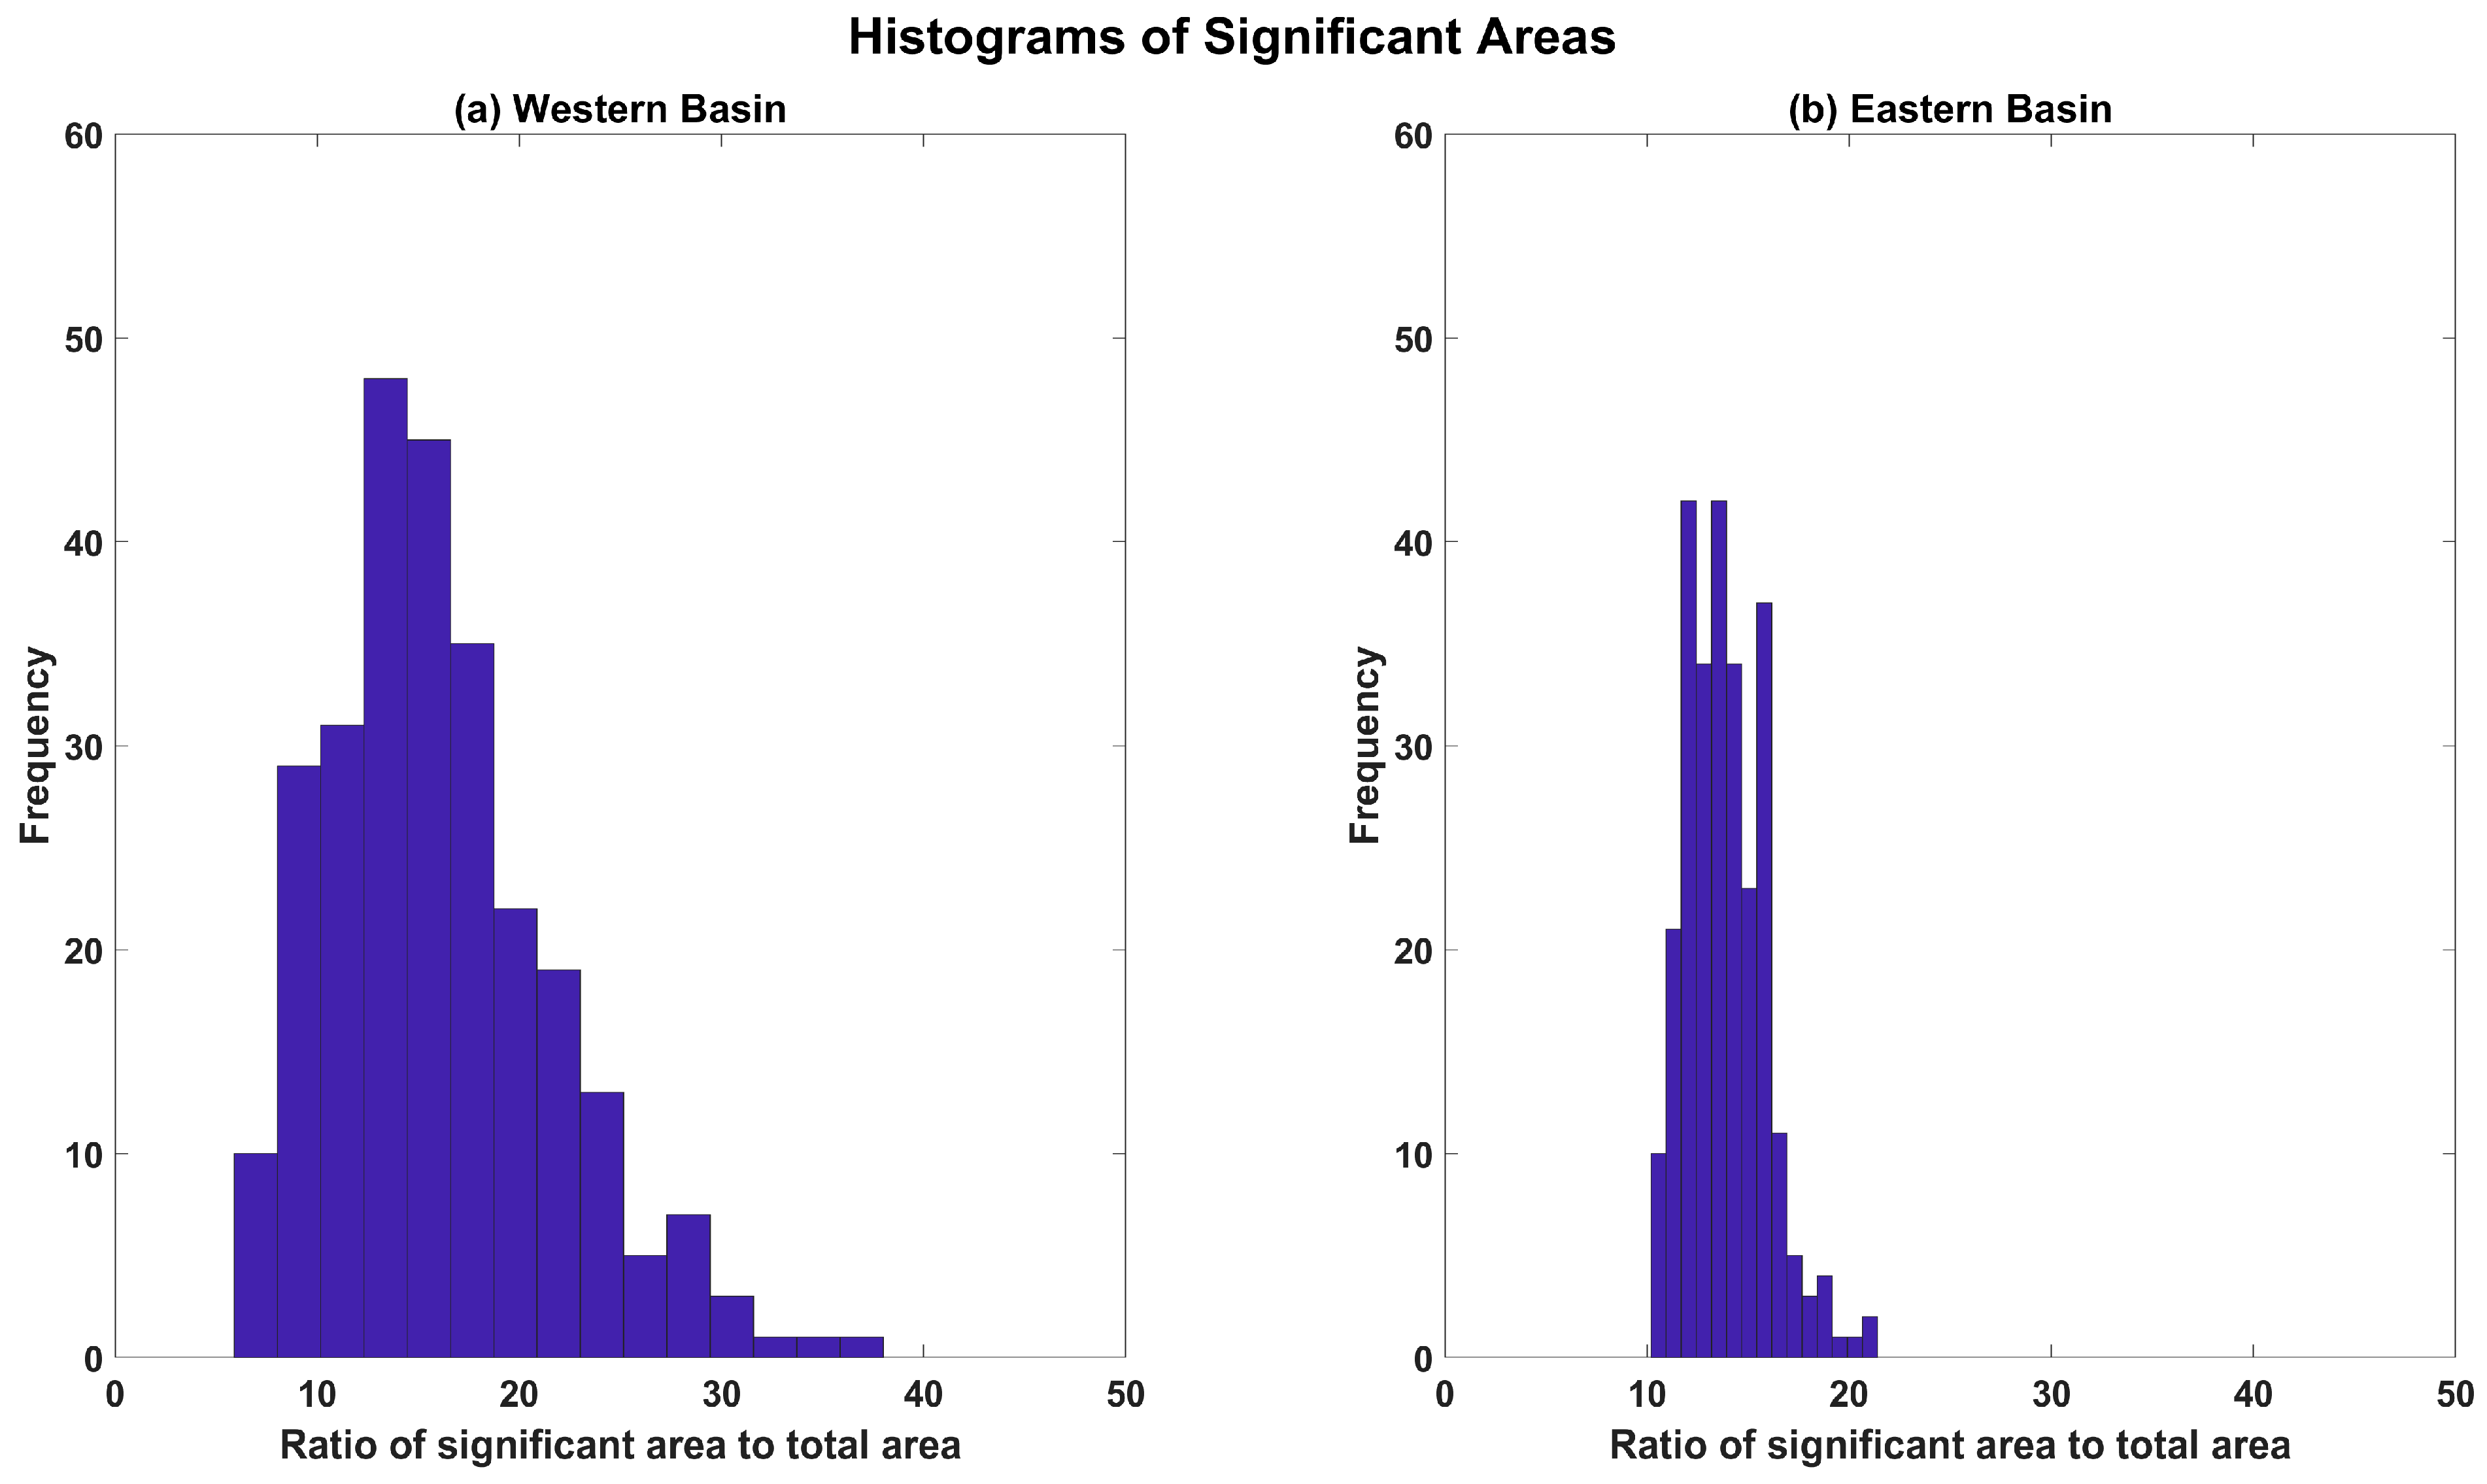
Figure 5 illustrates the fractional areas in the western (Figure 5a) and eastern (Figure 5b) sub-basins where statistically significant correlations between simulated and observed 30-year time series were obtained in the 270 possible realizations produced within the 300-year simulation period considered here. In the western Basin (Figure 5a) we note the existence of cases for which more than 30% of the area correlates significantly with observations, i.e., in more than 30% of the oceanic points belonging to the western sub-basin, the simulated 30-year time series significantly correlates with the observed 30-year time series in several realizations of the possible 270. This amount, which is however reduced in the eastern sub-basin, indicates that the obtained correlation areas seem to have very robust features. They seem consistent with the presence of very slowly propagating topographically induced nonlinear internal Rossby waves travelling in the presence of opposite flows in the two upper layers. The characteristics of such perturbations within a nonlinear theory, in the longwave approximation, show that the presence of a zonal stream can lead to the exact compensation of the Doppler shift, as recently demonstrated theoretically and found experimentally in the ocean [43].

4. Discussion and Conclusions

It has been known for a long time that the coupled ocean–atmosphere system is highly variable on decadal and multi-decadal timescales [44,45,46,47,48]. On the other hand, it has also been known for a long time, maybe forgotten and rediscovered [27,49] that complex ocean systems can sustain large variability even without any variable forcing.
Unambiguously, attribution of such variability necessarily implies a profound understanding of the free modes of variability in both atmospheric and ocean systems. Based on that, increasing skills in ocean predictability may emerge [50].
As far as the Mediterranean Sea is concerned, it has been recently demonstrated that one of its most visible and permanently observed oceanic regional features—the large SSH gradient extending from the African coasts northwards—is the result of intrinsic ocean variability induced by a steady inflow of AW and by a steady outflow of LIW through the Strait of Gibraltar [23]. The question is whether such origin may also be ascribed to part of the low-frequency SSH variability observed in the basin. In order to evaluate this possibility, we performed a point-by-point correlation analysis between the detrended altimetrically observed SSH fields and the corresponding fields obtained through a multicentennial simulation carried out using a multilayer ocean model. As a result, we obtained large areas of statistically significant positive correlations and even larger areas of statistically significant negative correlations in the western Mediterranean basin. Long-lasting trends emerging in our simulations are stronger in the southwestern portion of the western Mediterranean basin and decrease following the trajectory of the MAW in that sub-basin [27]. In different areas, although attenuated with time, they survive beyond the period characterizing the actual altimetric observations, which could imply a possible role of steadily induced intrinsic ocean variability in shaping future SSH in the Mediterranean Sea.
Hence, predictions concerning future coastal sea levels in the Mediterranean Sea should also account for intrinsic ocean variability. The one possibly induced by the water exchange variability through the Strait of Gibraltar deserves a particular attention [51], and it could be successfully addressed using an approach similar to the one presented here, considering realistic AW inflow low-frequency fluctuations.
Beyond ocean dynamics, the redistribution of water masses by intrinsic ocean variability has the potential to significantly impact surrounding regional climates through the modulation of surface energy and freshwater fluxes, and of the associated atmospheric variability [52,53]. Ocean–atmosphere interactions may even enhance the potential effects of intrinsic Mediterranean variability on Euro-Mediterranean regional climates: because of the preferred time scales of intrinsic ocean variability, this might be relevant for the attribution of observed interdecadal trends as well as for near-term predictions and mid-century projections.
More realistic investigations, which could extend the obtained results also to the eastern basin, can be envisaged and will constitute part of a future work: a variable density field, sustained by mixing between MAW and LIW, together with a higher resolution in the approaches to the Strait of Sicily would account, at least partly, for the water mass properties variability encountered in the basin and possibly contribute to propagate more realistically the signal simulated in one Mediterranean sub-basin to the other one. Intrinsic oceanic variability may thus contribute to determining sea surface levels in the coming decades. This awareness should inform analyses based on decadal SSH forecasts in the Mediterranean Sea and stimulate further investigations on the possible role of IOV in shaping future SSH in the area.

Supplementary Materials

The following supporting information can be downloaded at: https://www.mdpi.com/article/10.3390/jmse12081356/s1, Video S1: Correlations.

Author Contributions

A.R. conceived the paper; A.R., S.P., D.Z., M.G., and S.R. contributed to the methodology; M.G., D.Z., and S.R. adapted software for data interpretation.; A.R., D.Z., S.P., and M.G. contributed to formal analysis; A.R., D.Z., M.G., S.R., and S.P. wrote the paper; M.G., D.Z., and S.R. contributed to the visualization. All authors have read and agreed to the published version of the manuscript.

Funding

This research received no external funding.

Informed Consent Statement

Not applicable.

Data Availability Statement

Annual mean absolute dynamic topography data for the period 1993–2019 are provided by the Copernicus Climate Data Store [40]. Original data have daily resolution.

Acknowledgments

We would like to thank four anonymous reviewers for their helpful suggestions and constructive criticism.

Conflicts of Interest

The authors declare no conflict of interest.

References

  1. Dangendorf, S.; Hay, C.; Calafat, F.M.; Marcos, M.; Piecuch, C.G.; Berk, K.; Jensen, J. Persistent acceleration in global sea-level rise since the 1960s. Nat. Clim. Change 2019, 9, 705–710. [Google Scholar] [CrossRef]
  2. Chaumillon, E.; Bertin, X.; Fortunato, A.B.; Bajo, M.; Schneider, J.-L.; Dezileau, L.; Walsh, J.P.; Michelot, A.; Chauveau, E.; Créach, A.; et al. Storm-induced marine flooding: Lessons from a multidisciplinary approach. Earth-Sci. Rev. 2017, 165, 151–184. [Google Scholar] [CrossRef]
  3. Zanchettin, D.; Bruni, S.; Raicich, F.; Lionello, P.; Adloff, F.; Androsov, A.; Antonioli, F.; Artale, V.; Carminati, E.; Ferrarin, C.; et al. Sea-level rise in Venice: Historic and future trends (review article). Nat. Hazards Earth Syst. Sci. 2021, 21, 2643–2678. [Google Scholar] [CrossRef]
  4. Fox-Kemper, B.; Hewitt, H.T.; Xiao, C.; Aðalgeirsdóttir, G.; Drijfhout, S.S.; Edwards, T.L.; Golledge, N.R.; Hemer, M.; Kopp, R.E.; Krinner, G.; et al. 2021: Ocean, Cryosphere and Sea Level Change. In Climate Change 2021: The Physical Science Basis. Contribution of Working Group I to the Sixth Assessment Report of the Intergovernmental Panel on Climate Change; Masson-Delmotte, V., Zhai, P., Pirani, A., Connors, S.L., Péan, C., Berger, S., Caud, N., Chen, Y., Goldfarb, L., Gomis, M.I., et al., Eds.; Cambridge University Press: Cambridge, UK; New York, NY, USA, 2021; pp. 1211–1362. [Google Scholar] [CrossRef]
  5. Wunsch, C.; Ponte, R.M.; Heimbach, P. Decadal trends in sea level patterns: 1993–2004. J. Clim. 2007, 20, 5889–5911. [Google Scholar] [CrossRef]
  6. Johnson, R.G. Climate control required a dam at the Strait of Gibraltar. Eos Trans. Am. Geophys. Union 1997, 78, 277–281. [Google Scholar] [CrossRef]
  7. Chan, W.-L.; Motoi, T. Effects of stopping the Mediterranean Outflow on the southern polar region. Polar Meteorol. Glaciol. 2003, 17, 25–35. [Google Scholar]
  8. Lozier, M.S.; Stewart, N.M. On the Temporally Varying Northward Penetration of Mediterranean Overflow Water and Eastward Penetration of Labrador Sea Water. J. Phys. Oceanogr. 2008, 38, 2097–2103. [Google Scholar] [CrossRef]
  9. Ivanovic, R.F.; Valdes, P.J.; Gregoire, L.; Flecker, R.; Gutjahr, M. Sensitivity of modern climate to the presence, strength and salinity of Mediterranean-Atlantic exchange in a global general circulation model. Clim. Dyn. 2014, 42, 859–877. [Google Scholar] [CrossRef]
  10. Ayache, M.; Swingedouw, D.; Colin, C.; Dutay, J.-C. Evaluating the impact of Mediterranean overflow on the large-scale Atlantic Ocean circulation using neodymium isotopic composition. Palaeogeogr. Palaeoclimatol. Palaeoecol. 2021, 570, 110359. [Google Scholar] [CrossRef]
  11. Bethoux, J.; Gentili, B.; Morin, P.; Nicolas, E.; Pierre, C.; Ruiz-Pino, D. The Mediterranean Sea: A miniature ocean for climatic and environmental studies and a key for the climatic functioning of the North Atlantic. Prog. Oceanogr. 1999, 44, 131–146. [Google Scholar] [CrossRef]
  12. Malanotte-Rizzoli, P.; Artale, V.; Borzelli-Eusebi, G.L.; Brenner, S.; Crise, A.; Gacic, M.; Kress, N.; Marullo, S.; Ribera d’Alcala, M.; Sofianos, S.; et al. Physical forcing and physical/biochemical variability of the Mediterranean Sea: A review of unresolved issues and directions for future research. Ocean Sci. 2014, 10, 281–322. [Google Scholar] [CrossRef]
  13. Rubino, A.; Gačić, M.; Bensi, M.; Kovačević, V.; Malačič, V.; Menna, M.; Negretti, M.E.; Sommeria, J.; Zanchettin, D.; Barreto, R.V.; et al. Experimental evidence of long-term oceanic circulation reversals without wind influence in the North Ionian Sea. Sci. Rep. 2020, 10, 1905. [Google Scholar] [CrossRef] [PubMed]
  14. Pinardi, N.; Bonaduce, A.; Navarra, A.; Dobricic, S.; Oddo, P. The mean sea level equation and its application to the mediterranean sea. J. Clim. 2014, 27, 442–447. [Google Scholar] [CrossRef]
  15. Spada, G.; Melini, D. On some properties of the glacial isostatic adjustment fingerprints. Water 2019, 11, 1844. [Google Scholar] [CrossRef]
  16. Calafat, F.M.; Frederikse, T.; Horsburgh, K. The Sources of Sea-Level Changes in the Mediterranean Sea Since 1960. J. Geophys. Res. Oceans 2022, 127, e2022JC019061. [Google Scholar] [CrossRef]
  17. Vera JD, R.; Criado-Aldeanueva, F.; García-Lafuente, J.; Soto-Navarro, F.J. A new insight on the decreasing sea level trend over the Ionian basin in the last decades. Glob. Planet. Change 2009, 68, 232–235. [Google Scholar] [CrossRef]
  18. Vigo, M.I.; Sánchez-Reales, J.M.; Trottini, M.; Chao, B.F. Mediterranean Sea level variations: Analysis of the satellite altimetric data, 1992–2008. J. Geodyn. 2011, 52, 271–278. [Google Scholar] [CrossRef]
  19. Calafat, F.M.; Chambers, D.P.; Tsimplis, M.N. Mechanisms of decadal sea level variability in the eastern North Atlantic and the Mediterranean Sea. J. Geophys. Res. Oceans 2012, 117, C09022. [Google Scholar] [CrossRef]
  20. Landerer, F.W.; Volkov, D.L. The anatomy of recent large sea level fluctuations in the Mediterranean Sea. Geophys. Res. Lett. 2013, 40, 553–557. [Google Scholar] [CrossRef]
  21. Tsimplis, M.N.; Calafat, F.M.; Marcos, M.; Jordà, G.; Gomis, D.; Fenoglio-Marc, L.; Struglia, M.V.; Josey, S.A.; Chambers, D. The effect of the NAO on sea level and on mass changes in the Mediterranean Sea. J. Geophys. Res. Oceans 2013, 118, 944–952. [Google Scholar] [CrossRef]
  22. Menna, M.; Gačić, M.; Martellucci, R.; Notarstefano, G.; Fedele, G.; Mauri, E.; Gerin, R.; Poulain, P.-M. Climatic, Decadal, and Interannual Variability in the Upper Layer of the Mediterranean Sea Using Remotely Sensed and In-Situ Data. Remote Sens. 2022, 14, 1322. [Google Scholar] [CrossRef]
  23. Rubino, A.; Pierini, S.; Rubinetti, S.; Gnesotto, M.; Zanchettin, D. The Skeleton of the Mediterranean Sea. J. Mar. Sci. Eng. 2023, 11, 2098. [Google Scholar] [CrossRef]
  24. Meli, M.; Camargo CM, L.; Olivieri, M.; Slangen AB, A.; Romagnoli, C. Sea-level trend variability in the Mediterranean during the 1993–2019 period. Front. Mar. Sci. 2023, 10, 1150488. [Google Scholar] [CrossRef]
  25. Gačić, M.; Ursella, L.; Kovačević, V.; Menna, M.; Malačič, V.; Bensi, M.; Negretti, M.-E.; Cardin, V.; Orlić, M.; Sommeria, J.; et al. Impact of dense-water flow over a sloping bottom on open-sea circulation: Laboratory experiments and an Ionian Sea (Mediterranean) example. Ocean Sci. 2021, 17, 975–996. [Google Scholar] [CrossRef]
  26. Greatbatch, R.J. A note on the representation of steric sea level in models that conserve volume rather than mass. J. Geophys. Res. Oceans 1994, 99, 12767–12771. [Google Scholar] [CrossRef]
  27. Pierini, S.; Rubino, A. Modeling the Oceanic Circulation in the Area of the Strait of Sicily: The Remotely Forced Dynamics. J. Phys. Oceanogr. 2001, 31, 1397–1412. [Google Scholar] [CrossRef]
  28. Rubino, A.; Romanenkov, D.; Zanchettin, D.; Cardin, V.; Hainbucher, D.; Bensi, M.; Boldrin, A.; Langone, L.; Miserocchi, S.; Turchetto, M. On the descent of dense water on a complex canyon system in the southern Adriatic basin. Cont. Shelf Res. 2012, 44, 20–29. [Google Scholar] [CrossRef]
  29. Soto-Navarro, J.; Criado-Aldeanueva, F.; García-Lafuente, J.; Sánchez-Román, A. Estimation of the Atlantic inflow through the Strait of Gibraltar from climatological and in situ data. J. Geophys. Res. Oceans 2010, 115, C10023. [Google Scholar] [CrossRef]
  30. García-García, D.; Vigo, M.I.; Trottini, M.; Vargas-Alemañy, J.A.; Sayol, J.-M. Hydrological cycle of the Mediterranean-Black Sea system. Clim. Dyn. 2022, 59, 1919–1938. [Google Scholar] [CrossRef]
  31. Sánchez-Román, A.; García-Lafuente, J.; Delgado, J.; Sánchez-Garrido, J.C.; Naranjo, C. Spatial and temporal variability of tidal flow in the Strait of Gibraltar. J. Mar. Syst. 2012, 98–99, 9–17. [Google Scholar] [CrossRef]
  32. NOAA National Centers for Environmental Information. 2022: ETOPO 2022 15 Arc-Second Global Relief Model; NOAA National Centers for Environmental Information: Asheville, NC, USA, 2022. [Google Scholar] [CrossRef]
  33. Chen, Y.; Straub, D.; Nadeau, L.-P. Interaction of Nonlinear Ekman Pumping, Near-Inertial Oscillations, and Geostrophic Turbulence in an Idealized Coupled Model. J. Phys. Oceanogr. 2021, 51, 975–987. [Google Scholar] [CrossRef]
  34. Marine Data Store. European Seas Gridded L 4 Sea Surface Heights and Derived Variables Reprocessed 1993 Ongoing. Available online: https://data.marine.copernicus.eu/product/SEALEVEL_EUR_PHY_L4_MY_008_068/description (accessed on 25 March 2024).
  35. Legeais, J.-F.; Meyssignac, B.; Faugère, Y.; Guerou, A.; Ablain, M.; Pujol, M.-I.; Dufau, C.; Dibarboure, G. Copernicus Sea Level Space Observations: A Basis for Assessing Mitigation and Developing Adaptation Strategies to Sea Level Rise. Front. Mar. Sci. 2021, 8, 704721. [Google Scholar] [CrossRef]
  36. Taburet, G.; Sanchez-Roman, A.; Ballarotta, M.; Pujol, M.-I.; Legeais, J.-F.; Fournier, F.; Faugere, Y.; Dibarboure, G. DUACS DT2018: 25 years of reprocessed sea level altimetry products. Ocean Sci. 2019, 15, 1207–1224. [Google Scholar] [CrossRef]
  37. Peltier, W.R.; Argus, D.F.; Drummond, R. Space geodesy constrains ice age terminal deglaciation: The global ICE-6G_C (VM5a) model. J. Geophys. Res. Solid Earth 2015, 120, 450–487. [Google Scholar] [CrossRef]
  38. Tsimplis, M.N.; Álvarez-Fanjul, E.; Gomis, D.; Fenoglio-Marc, L.; Pérez, B. Mediterranean Sea level trends: Atmospheric pressure and wind contribution. Geophys. Res. Lett. 2005, 32, L20602. [Google Scholar] [CrossRef]
  39. Gačić, M.; Borzelli GL, E.; Civitarese, G.; Cardin, V.; Yari, S. Can internal processes sustain reversals of the ocean upper circulation? The Ionian Sea example. Geophys. Res. Lett. 2010, 37, L09608. [Google Scholar] [CrossRef]
  40. Brandt, P.; Rubino, A.; Quadfasel, D.; Alpers, W.; Sellschop, J.; Fiekas, H.-V. Evidence for the Influence of Atlantic–Ionian Stream Fluctuations on the Tidally Induced Internal Dynamics in the Strait of Messina. J. Phys. Oceanogr. 1999, 29, 1071–1080. [Google Scholar] [CrossRef]
  41. Rubino, A.; Zanchettin, D.; Androsov, A.; Voltzinger, N.E. Tidal Records as Liquid Climate Archives for Large-Scale Interior Mediterranean Variability. Sci. Rep. 2018, 8, 12586. [Google Scholar] [CrossRef]
  42. Van Brummelen, G. Heavenly Mathematics: The Forgotten Art of Spherical Trigonometry; Princeton University Press: Princeton, NJ, USA, 2012. [Google Scholar]
  43. Gnevyshev, V.G.; Frolova, A.V.; Kubryakov, A.A.; Sobko Yu, V.; Belonenko, T.V. Interaction between Rossby Waves and a Jet Flow: Basic Equations and Verification for the Antarctic Circumpolar Current. Izv. Atmos. Ocean. Phys. 2019, 55, 412–422. [Google Scholar] [CrossRef]
  44. Deser, C.; Blackmon, M.L. Surface Climate Variations over the North Atlantic Ocean during Winter: 1900–1989. J. Clim. 1993, 6, 1743–1753. [Google Scholar] [CrossRef]
  45. Kushnir, Y. Interdecadal Variations in North Atlantic Sea Surface Temperature and Associated Atmospheric Conditions. J. Clim. 1994, 7, 141–157. [Google Scholar] [CrossRef]
  46. Hansen, D.V.; Bezdek, H.F. On the nature of decadal anomalies in North Atlantic sea surface temperature. J. Geophys. Res. Oceans 1996, 101, 8749–8758. [Google Scholar] [CrossRef]
  47. Reverdin, G.; Cayan, D.; Kushnir, Y. Decadal variability of hydrography in the upper northern North Atlantic in 1948–1990. J. Geophys. Res. Oceans 1997, 102, 8505–8531. [Google Scholar] [CrossRef]
  48. Zanchettin, D.; Rubino, A.; Jungclaus, J.H. Intermittent multidecadal-to-centennial fluctuations dominate global temperature evolution over the last millennium. Geophys. Res. Lett. 2010, 37, L14702. [Google Scholar] [CrossRef]
  49. Greatbatch, R.J.; Zhang, S. An Interdecadal Oscillation in an Idealized Ocean Basin Forced by Constant Heat Flux. J. Clim. 1995, 8, 81–91. [Google Scholar] [CrossRef]
  50. Sane, A.; Fox-Kemper, B.; Ullman, D.S.; Kincaid, C.; Rothstein, L. Consistent Predictability of the Ocean State Ocean Model Using Information Theory and Flushing Timescales. J. Geophys. Res. Oceans 2021, 126, e2020JC016875. [Google Scholar] [CrossRef]
  51. Brandt, P.; Rubino, A.; Sein, D.V.; Baschek, B.; Izquierdo, A.; Backhaus, J.O. Sea Level Variations in the Western Mediterranean Studied by a Numerical Tidal Model of the Strait of Gibraltar. J. Phys. Oceanogr. 2004, 34, 433–443. [Google Scholar] [CrossRef]
  52. Josey, S.A.; Somot, S.; Tsimplis, M. Impacts of atmospheric modes of variability on Mediterranean Sea surface heat exchange. J. Geophys. Res. Oceans 2011, 116, C02032. [Google Scholar] [CrossRef]
  53. Skliris, N.; Sofianos, S.; Gkanasos, A.; Mantziafou, A.; Vervatis, V.; Axaopoulos, P.; Lascaratos, A. Decadal scale variability of sea surface temperature in the Mediterranean Sea in relation to atmospheric variability. Ocean Dyn. 2011, 62, 13–30. [Google Scholar] [CrossRef]
Figure 1. Schematic representation of the model domain with its bathymetry and typical routes of Atlantic Modified Water (MAW) and Levantine Intermediate Water (LIW). The four colored dots indicate the locations where multidecadal trends simulated by the nonlinear multilayer model have been calculated.
Jmse 12 01356 g001
Figure 2. SSH trends in the Mediterranean Sea as calculated using the available altimetric data for the period 1993–2022. Dotted areas mark regions where the obtained trends are found to be statistically insignificant at the 95% confidence interval. Note that a similar map, referring to the period 1993–2019, was presented by Meli et al. (2023) [24].
Jmse 12 01356 g002
Figure 3. Trendograms calculated using the results of the numerical simulations for four selected points of the western Mediterranean Sea showing the SSH trend evolution at multidecadal temporal scales largely exceeding the altimetric dataset length. Each of the four plots presents trends along the y-axis, with varying periods. The colors give the different trend amplitudes. The x-axis represents the midpoint of the period over which each trend is evaluated. Moving along the y-axis reveals how trends change. Moving along the x-axis, while holding a specific trend period (fixed y-value) constant, shows how trends at that particular time scale evolve over the simulation years. The exact location of the points is shown in Figure 1.
Jmse 12 01356 g003
Figure 4. Examples of areas displaying statistically significant (90% confidence interval) correlations between observed (from 1993 to 2022) and 30-year long simulated SSH time series. Note that the same area can exhibit both positive and negative correlation values. This can occur when the observed 30-year series is paired with different simulated 30-year series.
Jmse 12 01356 g004
Figure 5. Fractional areas in the western (a) and eastern (b) sub-basins where statistically significant correlations between simulated and observed 30-year time series were obtained.
Jmse 12 01356 g005
Disclaimer/Publisher’s Note: The statements, opinions and data contained in all publications are solely those of the individual author(s) and contributor(s) and not of MDPI and/or the editor(s). MDPI and/or the editor(s) disclaim responsibility for any injury to people or property resulting from any ideas, methods, instructions or products referred to in the content.