Article

Study on the Turning Characteristics and Influencing Factors of the Unmanned Sailboat

1
School of Mechanical Engineering, Tianjin University, Tianjin 300200, China
2
Key Laboratory of Mechanism Theory and Equipment Design of Ministry of Education, Tianjin University, Tianjin 300200, China
*
Author to whom correspondence should be addressed.
J. Mar. Sci. Eng. 2024, 12(8), 1374; https://doi.org/10.3390/jmse12081374
Submission received: 19 July 2024 / Revised: 7 August 2024 / Accepted: 9 August 2024 / Published: 12 August 2024
(This article belongs to the Section Ocean Engineering)

Abstract

:
Unmanned sailboats can convert wind energy with sails to provide power for navigation, which can independently plan routes and collect data without human intervention. They have received increasing attention in recent years due to their low power consumption and strong self-sustainability. Due to the greater difficulty of manipulation, the unmanned sailboats have a weaker maneuverability than the propeller-driven vessels in the complex and variable marine environment. Typically, the turning motion is evaluated to characterize the maneuverability of a vessel, which has rarely been investigated in the existing research on unmanned sailboats. Therefore, this study builds a motion simulation platform for unmanned sailboats based on the 3 m class Petrel Sail to investigate the turning characteristics. The index of the approximate turning circle is introduced based on the turning motion trajectory, which is used to obtain the effect of rudder angle, wind angle, wind speed, and current speed on the turning performance of the sailboat in ideal hydrostatic conditions and under flow disturbance, respectively. Finally, a harbor pool test is conducted with an unmanned sailboat to verify the analysis results, and the errors in maximum transverse distance and maximum advance distance are in the reasonable range, proving the correctness of the theoretical results. The current study also provides theoretical guidance for subsequent research on sailboat manipulation and maneuverability.

1. Introduction

The ocean covers 71 percent of the Earth’s surface, and it plays an important role in the production and living practices of human beings. Various ocean observations have been made to understand and develop the ocean [1]. Traditional ocean observation methods include satellites, research vessels, and (subsurface) buoys. With the development of automatic control, navigation, communication, and other technologies, marine unmanned equipment has been widely used in ocean observation to make up for the shortcomings of traditional ocean observation. Autonomous underwater robots, underwater gliders, wave gliders, unmanned sailboats, and other marine unmanned equipment have their own advantages in terms of speed, working depth, endurance, and load [2]. Driven by the wind, unmanned sailboats can perform long-duration and long-distance navigation tasks without the limitation of fuel shortage. Therefore, unmanned sailboats can autonomously perform the observation of remote sea areas and conduct long-term monitoring of specific sea areas [3].
In recent years, a number of unmanned sailboats have been developed and put into practical applications. Autonomous Marine Systems Inc. (Somerville, MA, USA) developed an unmanned catamaran called Datamaran in 2013, which has a self-righting function [4]. Spain launched the A-Tirma G2 in 2015, which features a biplane sail layout and shows advantage in track keeping [5]. Offshore Sensing AS from Norway developed the Sailbuoy unmanned sailboat in 2018, which can carry equipment of up to 15 kg in weight for the measurement of marine resources and was the first unmanned surface vehicle to complete a transatlantic crossing [6]. Recently, Saildrone Inc. developed the 10 m Voyager in 2022, with a studdingsail and self-balancing sail turning function, which can sail continuously at sea for up to 180 days with low power consumption [7].
Maneuverability is an important index for the use of unmanned sailboats during sailing, as it ensures the stable operation of sailboats in the complex marine environment. In fact, the maneuverability of unmanned sailboats depends largely on the manipulation of sails and rudders, and great efforts have been made to optimize the manipulation methods. Meng et al. [8] proposes a novel method to achieve self-balancing sail rotation based on elastic rope for unmanned sailboats and introduces the sum of the angular thrust of spherical surface SL as a performance evaluation index. The sailboat’s performance is increased by 24% after optimization. Yin et al. [9] carries out orthogonal analysis and CFD simulations to analyze the influence of coupling parameters on the aerodynamic performance of an arc sail and identifies an arc sail suitable for the existing Petrel unmanned sailboats. Kuang et al. [10] proposes to optimize the chord length ratio of a two-element wing sail to enhance the aerodynamic performance of a wind-powered unmanned sailboat. Liu et al. [11] dealt with the two scenarios of unmanned sailing virtual and fixed-speed cruising and proposed a corresponding optimal manipulation strategy for sail rotation by taking the minimum slewing diameter and the maximum speed as the evaluation indexes. Saoud et al. [12] proposed a sail control method to maximize the longitudinal speed by restricting the transverse rocking angle and reported that the method can improve the performance of the sailboat. Augenstein et al. [13] proposed to replace the water rudder with a tail blade rudder, which produces a stable windward angle and promotes the stability of the boat, greatly improving its sailing maneuverability. For a 12 m class unmanned sailboat, Zhang et al. [14] calculated the wind speed boundaries for the sailboat at different rudder angles to find the controllable zone under different angles of attack and analyzed the factors affecting the controllable zone to make suggestions for rudder maneuvering.
The turning performance of a vessel is one of the important indicators of its maneuverability, which is closely related to its safety and operational efficiency. Many previous studies have investigated the turning motion of various vessels. Jiang et al. [15] studied the turning characteristics of unmanned boats, determined the relevant parameters by building a model and performing real-boat tests, and verified the accuracy of the model with the least recursive squares method. Jiang et al. [16] determined maneuverability parameters of the trimaran and reported the influences of the lateral and longitudinal positions of the side hulls on the maneuverability of the trimaran. Wang et al. [17] simulated and analyzed the turning process of a hydrofoil catamaran under different sea conditions by establishing a slewing motion control system. Wang et al. [18] constructed a mathematical model of glide boat maneuvering motion under different wind and current conditions and simulated the turning characteristics under different rudder angles and water flow rates, providing a valuable reference for predicting glide boat maneuvering performance. Tavakoli et al. [19] proposed a mathematical model for the slewing maneuvering motion of a glide boat by coupling the motions of six degrees of freedom, experimentally predicted the radius and trajectory of the glide boat, and analyzed the effect of the rudder angle on the glide boat’s turning motion. Wu et al. [20] designed a berthing maneuvering algorithm for a catamaran unmanned surface vehicle and optimized speed control and the turning radius through simulation experiments during the berthing process, improving the berthing efficiency and safety in complex port environments.
Although these studies investigated the turning performances of different vessels under the interference of wind, waves, currents, and other complex environmental factors, few have dealt with the turning characteristics of unmanned sailboats, which are vital for their working performances. In this case, this study conducts theoretical and simulation analysis on the turning characteristics of unmanned sailboats, and the main contributions are summarized as follows:
  • A motion simulation platform is built for the unmanned sailboat, which is used to investigate the turning characteristics under the two conditions of ideal static water and flow interference and obtain the turning law of the sailboat;
  • The index of the approximate turning circle is proposed based on the turning trajectory, which provides a new quantitative tool for analyzing the turning performances of unmanned sailboats;
  • A harbor pool test is carried out based on the 3 m class Petrel Sail unmanned sailboat to verify the correctness of the simulation results.
The rest of this paper is structured as follows. Section 2 introduces the structure, the control architecture, and the path-following strategy of the Petrel Sail. Section 3 describes the turning motion of the sailboat and its main evaluation indexes. Section 4 integrates the simulation model and studies the turning characteristics under the ideal hydrostatic and flow disturbance conditions. Section 5 introduces the harbor pool test for the turning characteristics. Finally, Section 6 summarizes the conclusions and gives an outlook for future works.

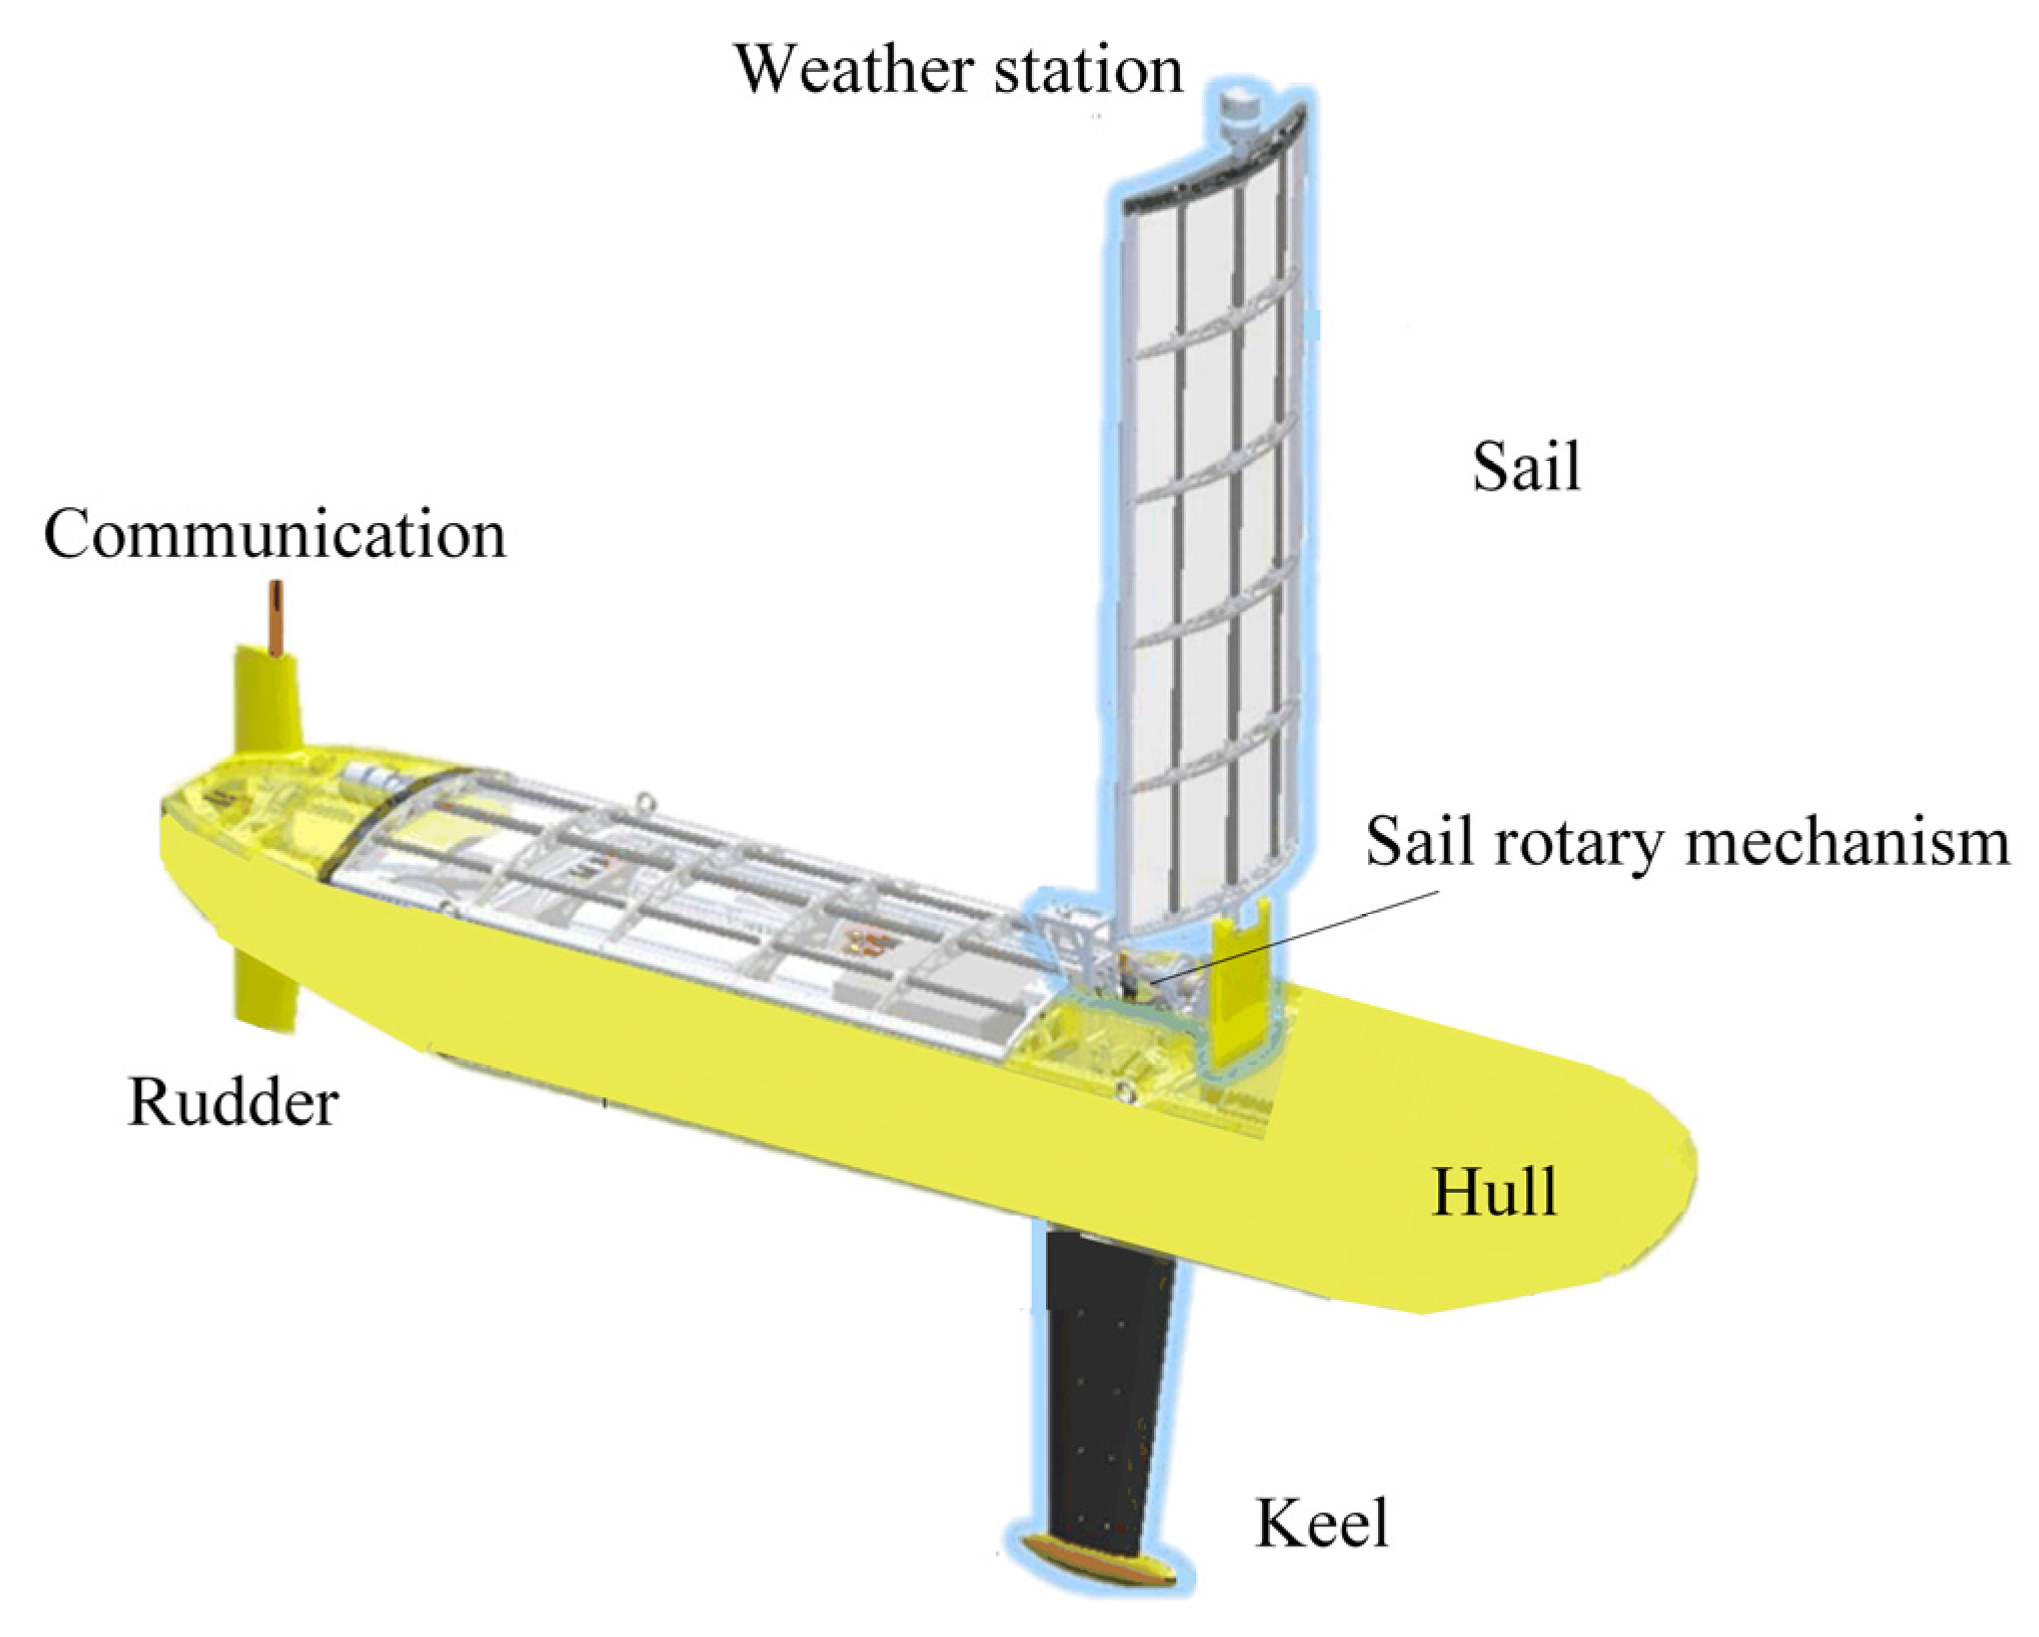
2. Petrel Sail Unmanned Sailboat

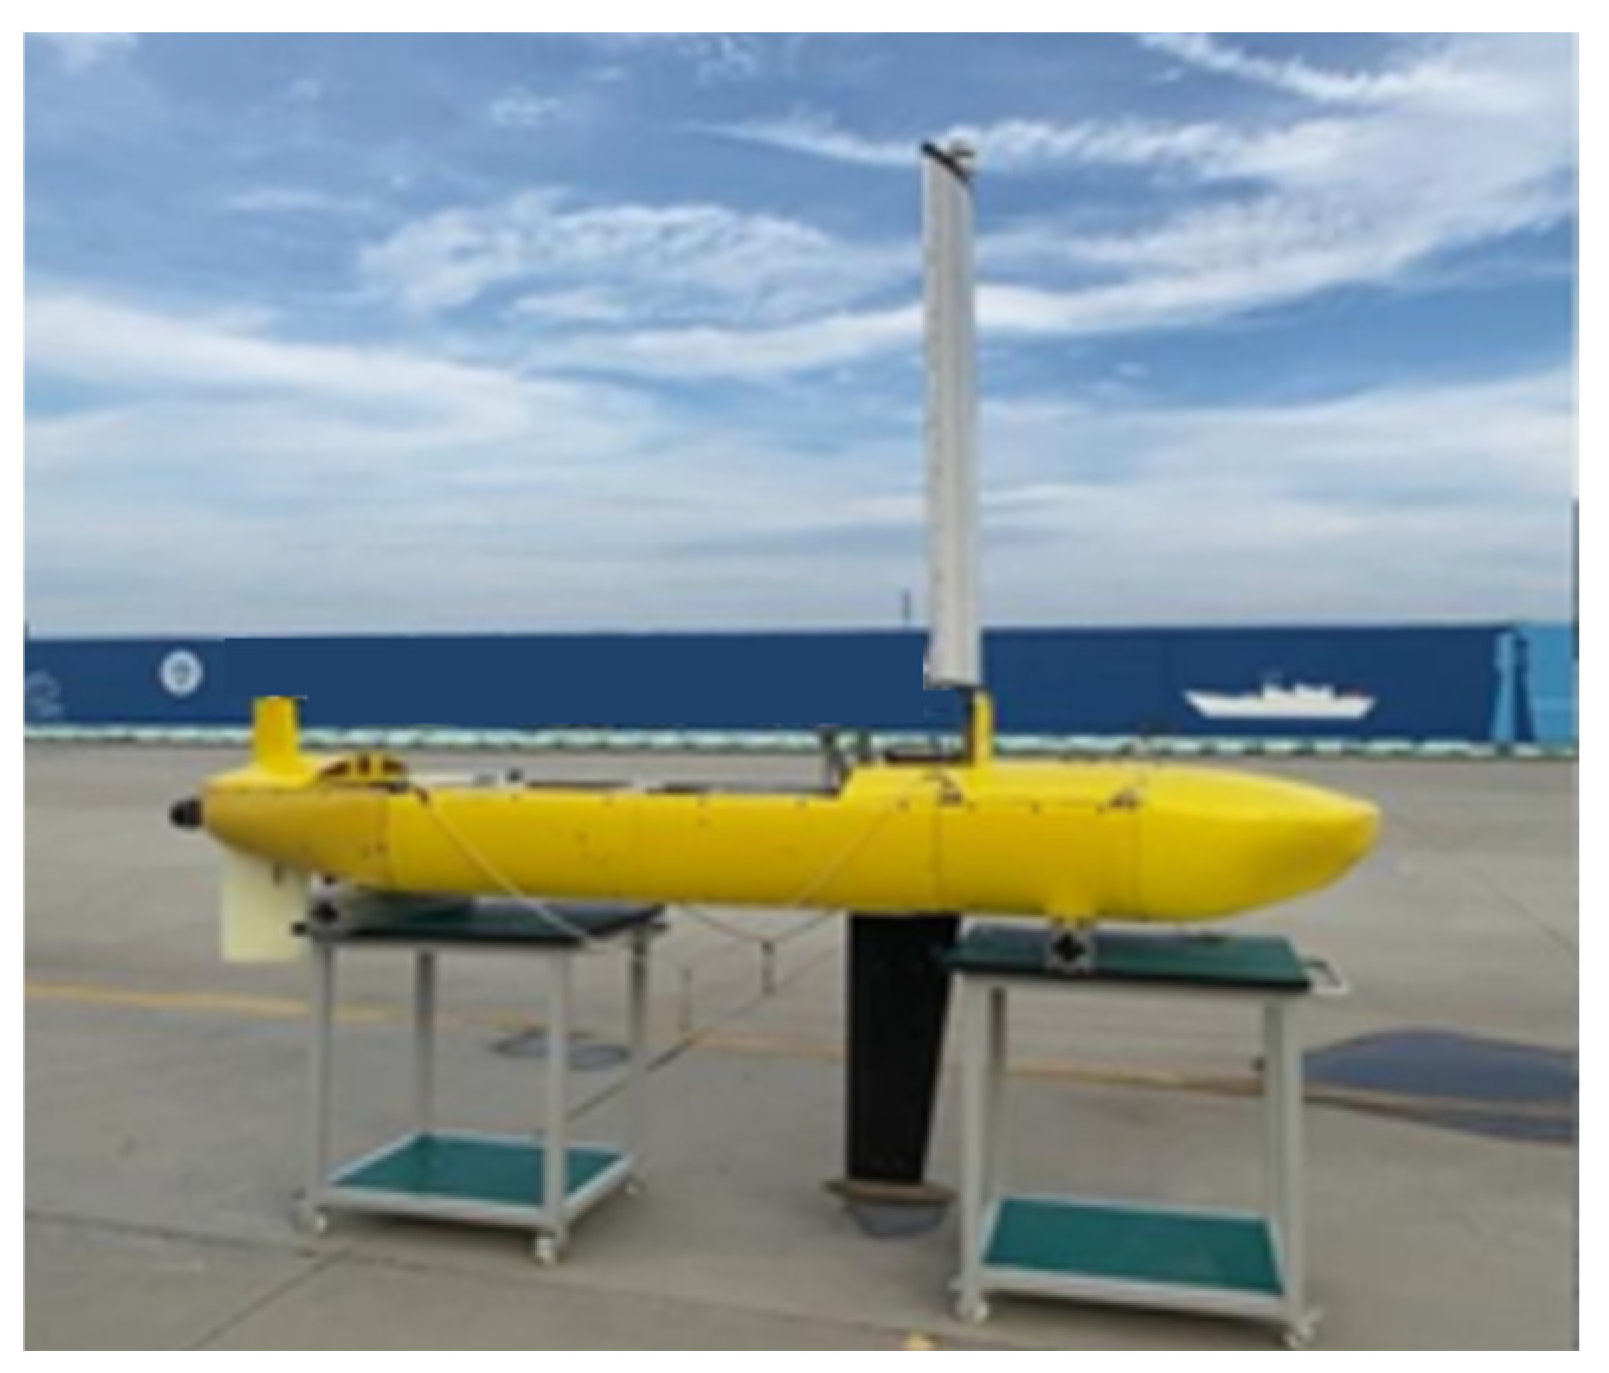
2.1. Configuration of Petrel Sail
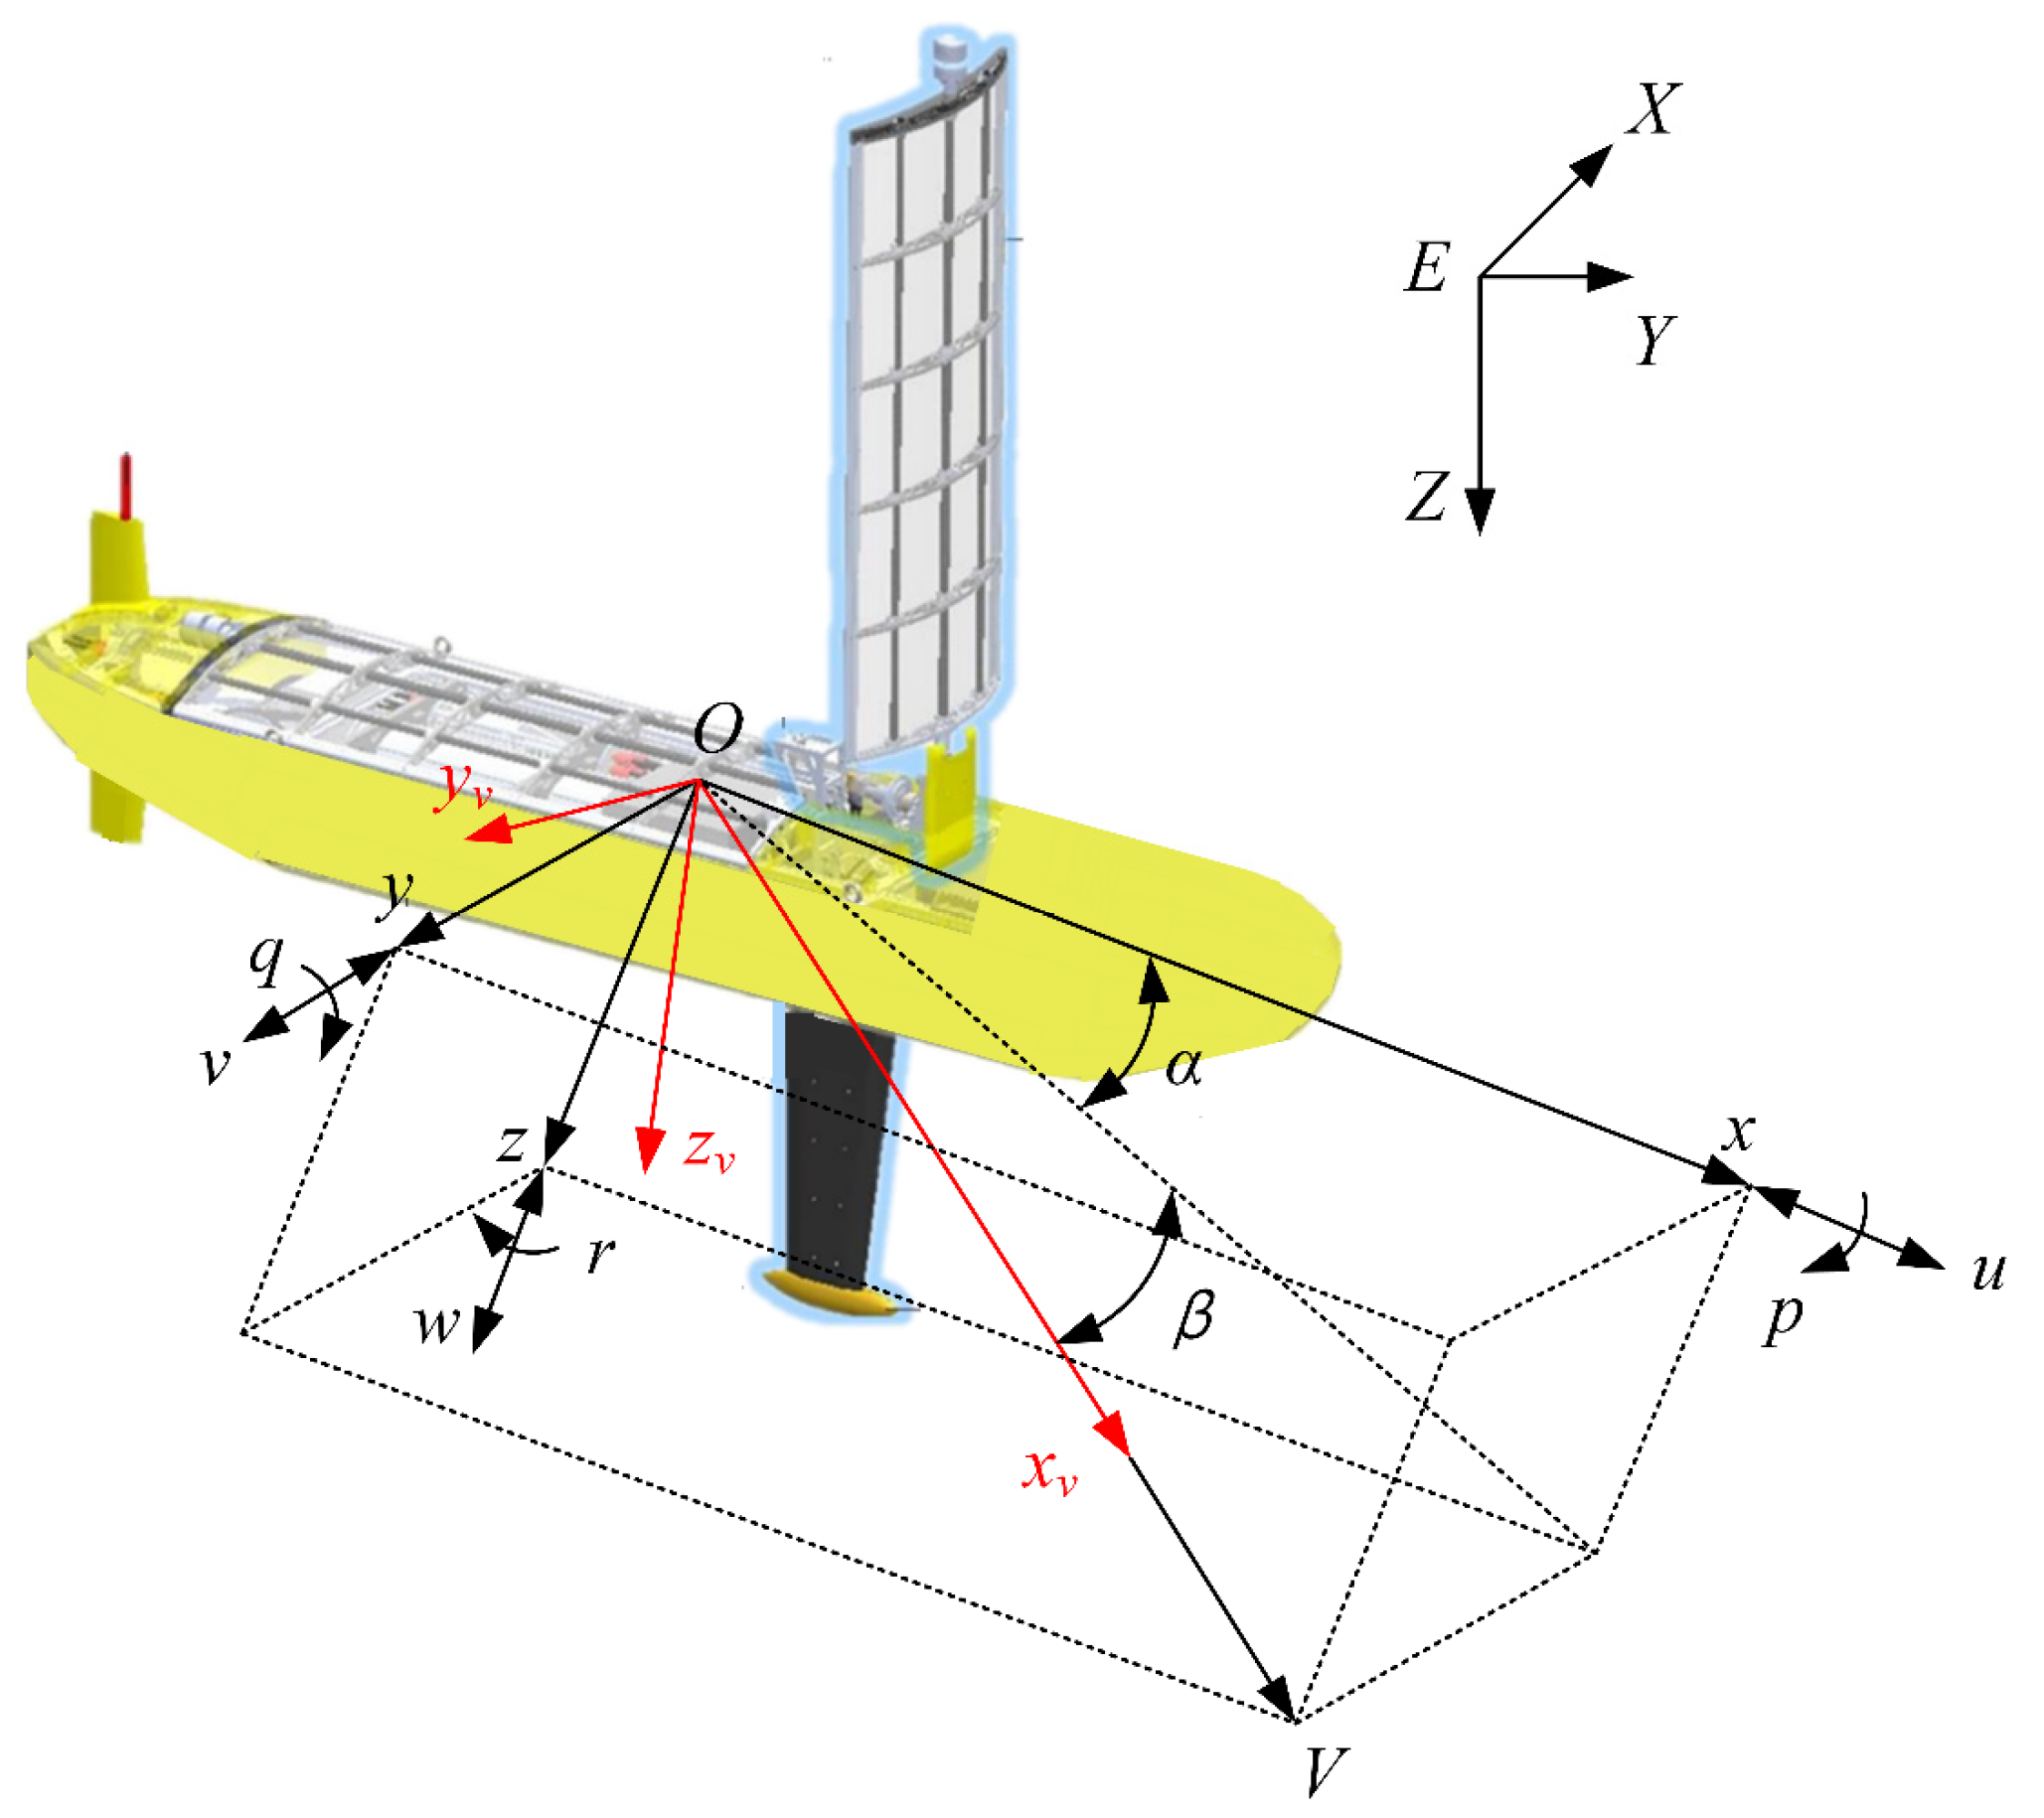
The Petrel Sail unmanned sailboat is mainly composed of a hull, a sail, a rudder, and a keel, as shown in Figure 1. The hull is streamlined. The sail stands on the middle of the hull and helps the sailboat to obtain thrust, and its skeleton is composed of three parts: the mast, transverse rib, and frame. The rotary sail mechanism is installed at the bottom of the sail, involving a base, a main axis of revolution, a turntable, a sail motor, a pressure cabin, and various couplings. The turntable is fixed on the base and adopts a liquid-filled worm gear structure. The sail motor is installed in the pressure cabin. The upper end of the main rotary shaft is tightly connected to the bottom of the sail, and the lower end is connected to the output shaft of the turntable with an elastic coupling to transmit the sail torque. The weather station and anemometer are installed on top of the sail to obtain necessary field parameters during the voyage.
The keel is installed at the bottom the sailboat, opposite to the sail, which uses the lateral force of the water to balance the lateral force of the sail and prevent shifting and toppling, thus ensuring the stability of the unmanned sailboat. The rudder is installed under the stern of the hull to control the course of the ship with hydrodynamic force. The communication unit of the sailboat is located at the stern of the hull, including GPS and BDS modules for positioning, as well as the iridium module and wireless module for communication and data exchange. Table 1 shows the main parameters of the Petrel Sail unmanned sailboat.

2.2. Dynamic Model

A dynamic model is established for analyzing the motion of the unmanned sailboat, which considers the surge, sway, heave, roll, pitch, and yaw. A six-degree-of-freedom model [21] is adopted, involving the geocentric coordinate system E-XYZ, the body coordinate system O-xyz, and the velocity coordinate system O-xvyvzv, as shown in Figure 2.
The translational motion and rotational motion of the unmanned sailboat can be expressed as
  m [ u v r + w q x G ( q 2 + r 2 ) + y G ( p q r ˙ ) + z G ( p r + q ˙ ) ] = F x m [ v ˙ w p + u r y G ( p 2 + r 2 ) + z G ( q r p ˙ ) + x G ( p q + r ˙ ) ] = F y m [ w ˙ u p + v p z G ( p 2 + q 2 ) + x G ( r p q ˙ ) + y G ( r q + p ˙ ) ] = F z
I B x p ˙ + ( I B z I B y ) q r ( r ˙ + p q ) I B z z + ( r 2 q 2 ) I B y z + ( p r q ˙ ) I B x y + m [ y G ( w ˙ u q + v p ) z G ( ν ˙ w p + u r ) = M x I B y q ˙ + ( I B x I B z ) r p ( p ˙ + q r ) I B x y + ( p 2 r 2 ) I B z x + ( q p r ˙ ) I B y z + m [ z G ( u ˙ ν r + w q ) x G ( w ˙ q u + ν p ) ] = M y I B z r ˙ + ( I B y I B x ) p q ( p ˙ q r ) I B x z + ( q 2 p 2 ) I B x y + ( r q p ˙ ) I B z x + m [ x G ( ν ˙ w p + u r ) y G ( ν ˙ v r + w q ) ] = M z
where (X, Y, Z) denotes the origin of the body coordinate system in the geodetic coordinate system, (u, v, w) indicates the moving speed, (p, q, r) denotes the angular velocity, (Fx, Fy, Fz) indicates the force on the unmanned sailboat in all directions, (Mx, My, Mz) shows the torque in all directions, and IBxy, IByz, and IBzx are the moments of inertia of the mass of the unmanned sailboat to the xOy, yOz, and xOz planes in the body coordinate system, respectively.

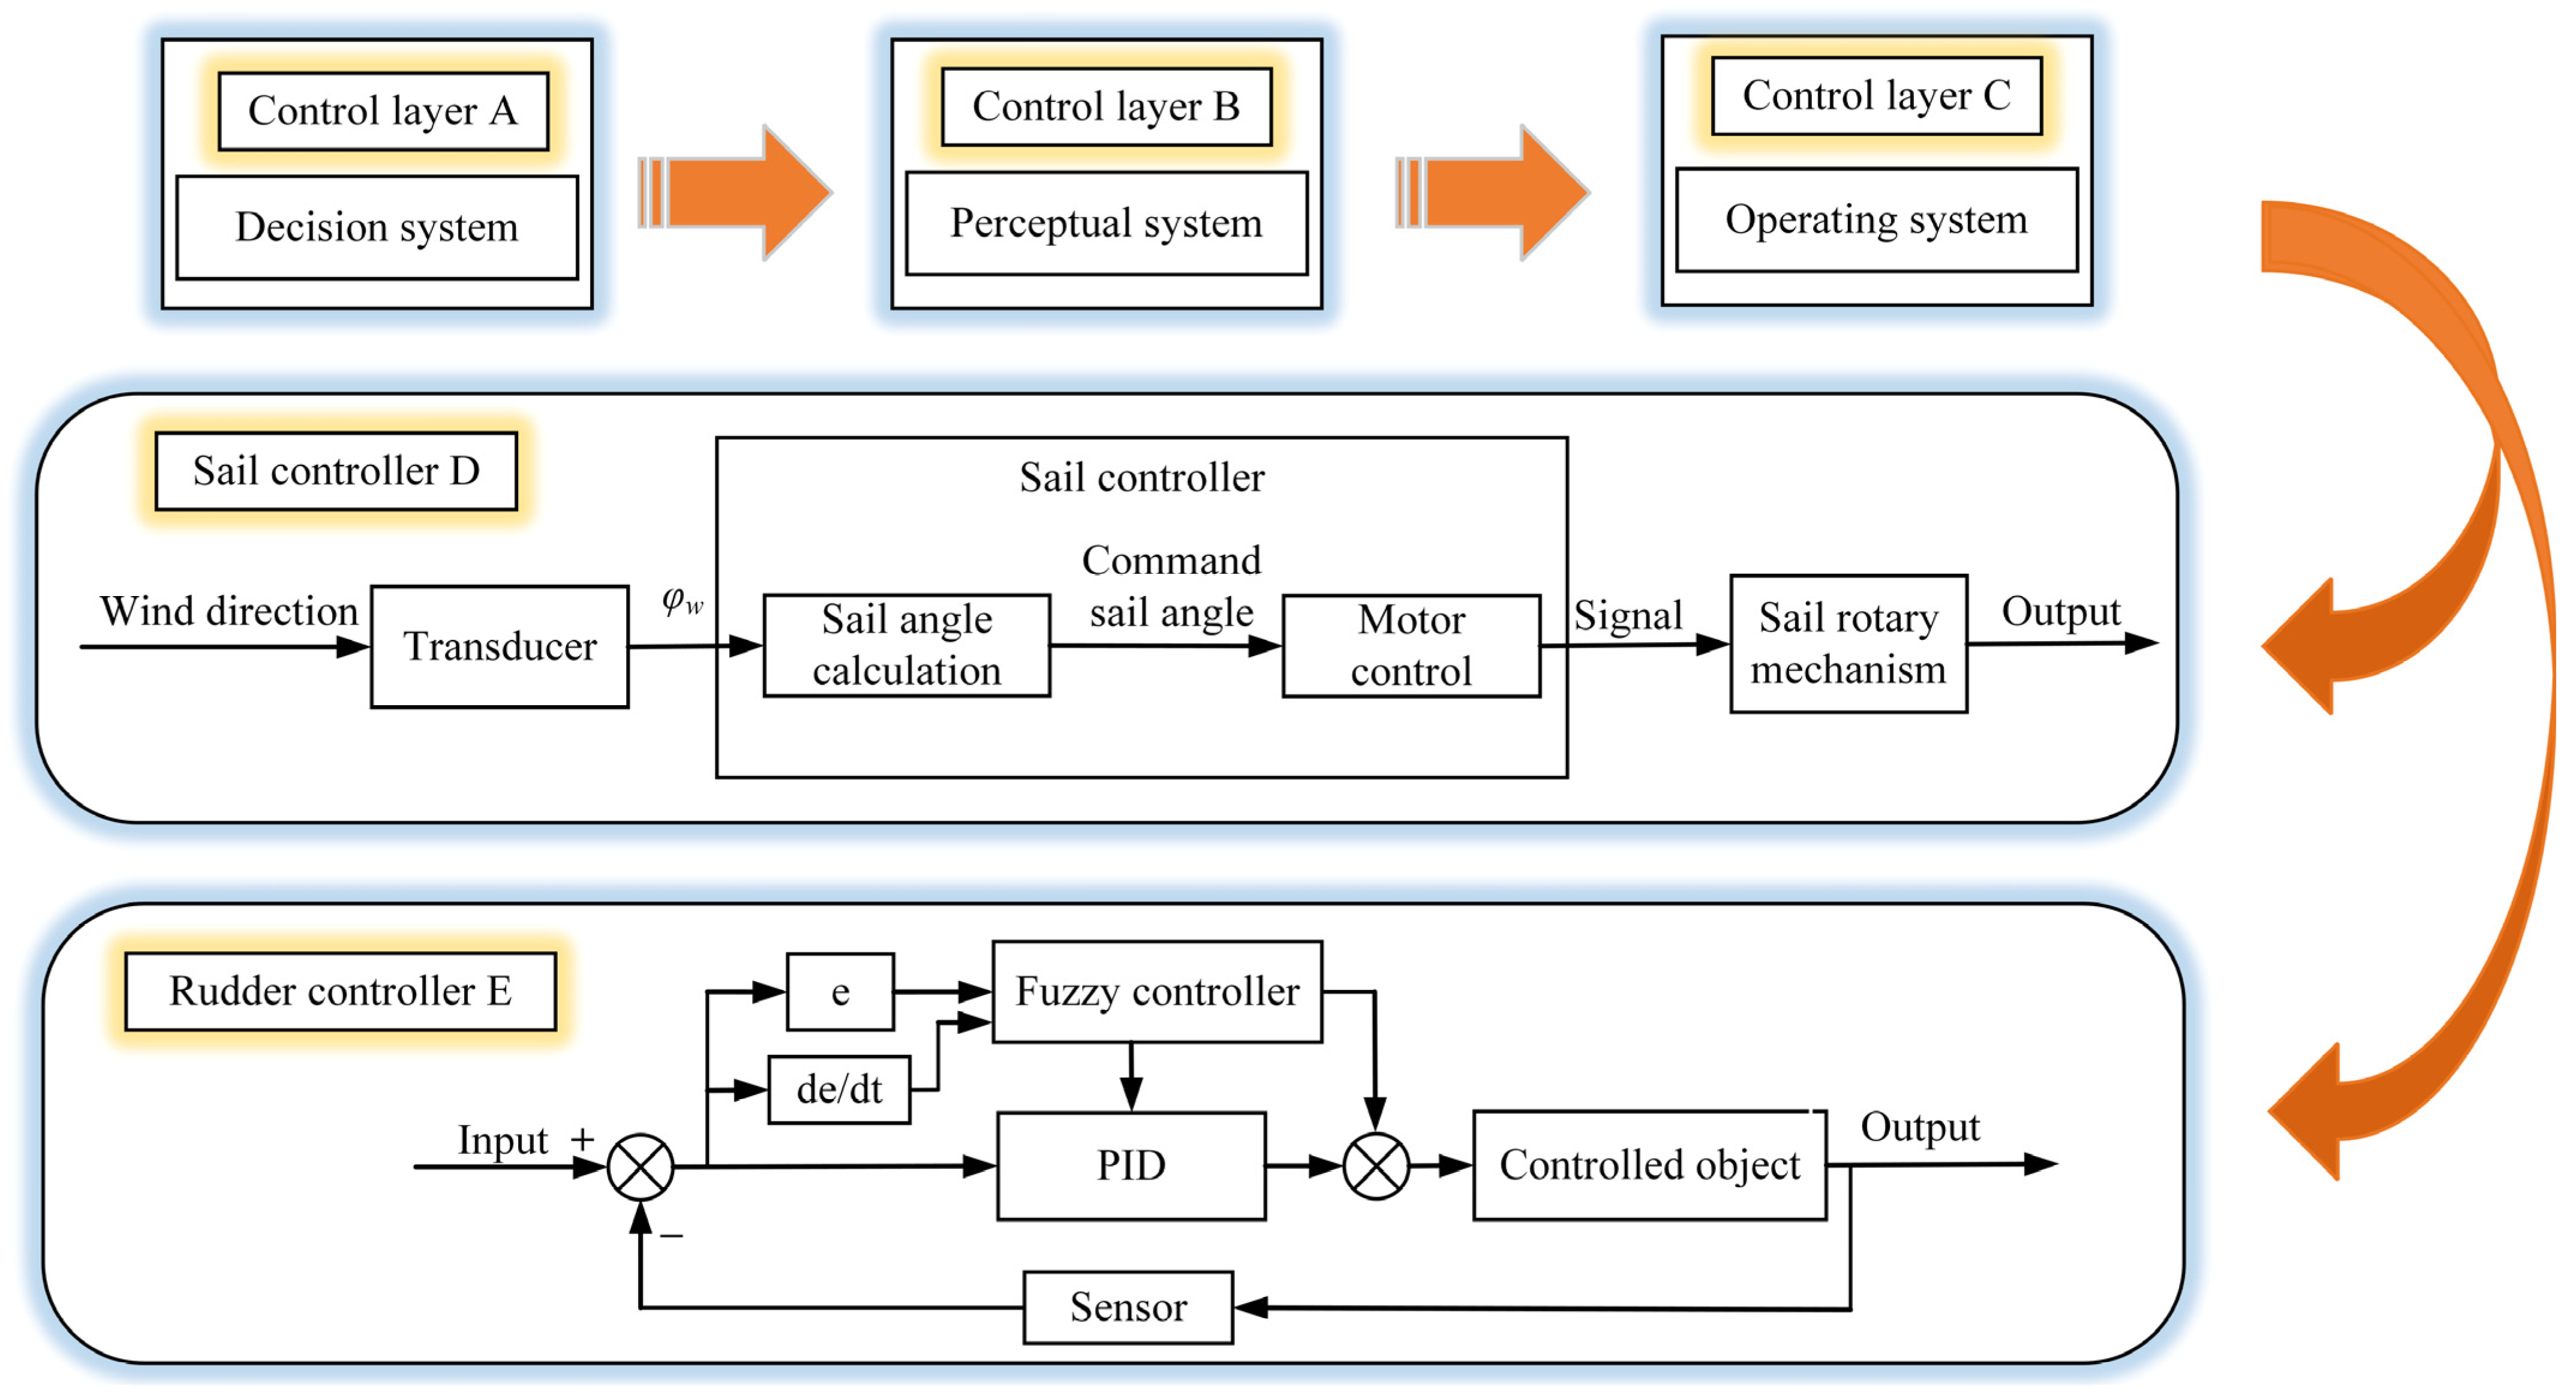
2.3. Control Architecture

The navigation control system of the unmanned sailboat needs to consider the current environment and the motion parameters and formulate reasonable strategies to control the actuators including the sail and rudder. Here, we adopt a three-layer control architecture, which is divided into the upper control layer (A), middle control layer (B), and lower control layer (C), as shown in Figure 3.
Control layer A makes the work decision of the sailboat. For the specific working scenario, multiple navigation points are set to divide the path into multiple segments. The next segment is started automatically after the completion of the current segment is detected until reaching the target position.
Control layer B is used for data collection during navigation. The navigation information, such as the surrounding environment, hull attitude, and navigation speed, are collected with the sensors onboard.
Control layer C controls the operation of the sail and rudder, including the sail controller D and the rudder controller E.
Based on the aerodynamic characteristics of the sail, the sail controller D adjusts the sail angle according to the relative wind direction angle of the target, thus allowing us to achieve optimal thrust and lateral force transfer performance, as well as speed maximization and auxiliary path-following. In practice, the relative wind direction angle changes with time and cannot be predicted due to the instability of the wind direction and the change in course. Therefore, the input (relative wind direction angle) is divided into multiple control intervals. The functions of the optimal sail angle and the relative wind direction angle can be obtained according to the aerodynamic characteristics of the sail, and the sail angle can be generated by taking the median value of each interval group as a reference. This control method is easy to implement in practice and has high stability, which avoids the disorder of the actuators caused by the disturbance of the input signals. Here, the sail rotary mechanism is regarded as a first-order inertia link, expressed as
θ θ e = 1 T S s + 1
where θe is the target sail angle, and TS is the working time of the sail rotary mechanism, which is a constant.
The steering controller E is a major component used for adjusting the course of the sailboat. The control of the rudder angle is realized based on the practical sailing experience. The traditional incremental PID algorithm is adopted, and the recursive principle is expressed as
δ R t δ R t 1 = K p β t β t 1 + K i β t + K d β t 2 β t 1 + β t 2
where Kp is the proportional coefficient, Ki is the integral coefficient, Kd is the differential coefficient, and β(t) is the heading deviation value collected at time t.
On this basis, the fuzzy PID control is established to realize the real-time adjustment of the parameters. The actual heading deviation angle β and its change rate βC are taken as the input of the controller, and, thus, the three parameters of Kp, Ki, and Kd can be adjusted in real time. The output accurate value is transmitted to the steering gear to complete the heading control. Similar to the sail controller, the fuzzy PID control is considered to be a first-order inertial link.

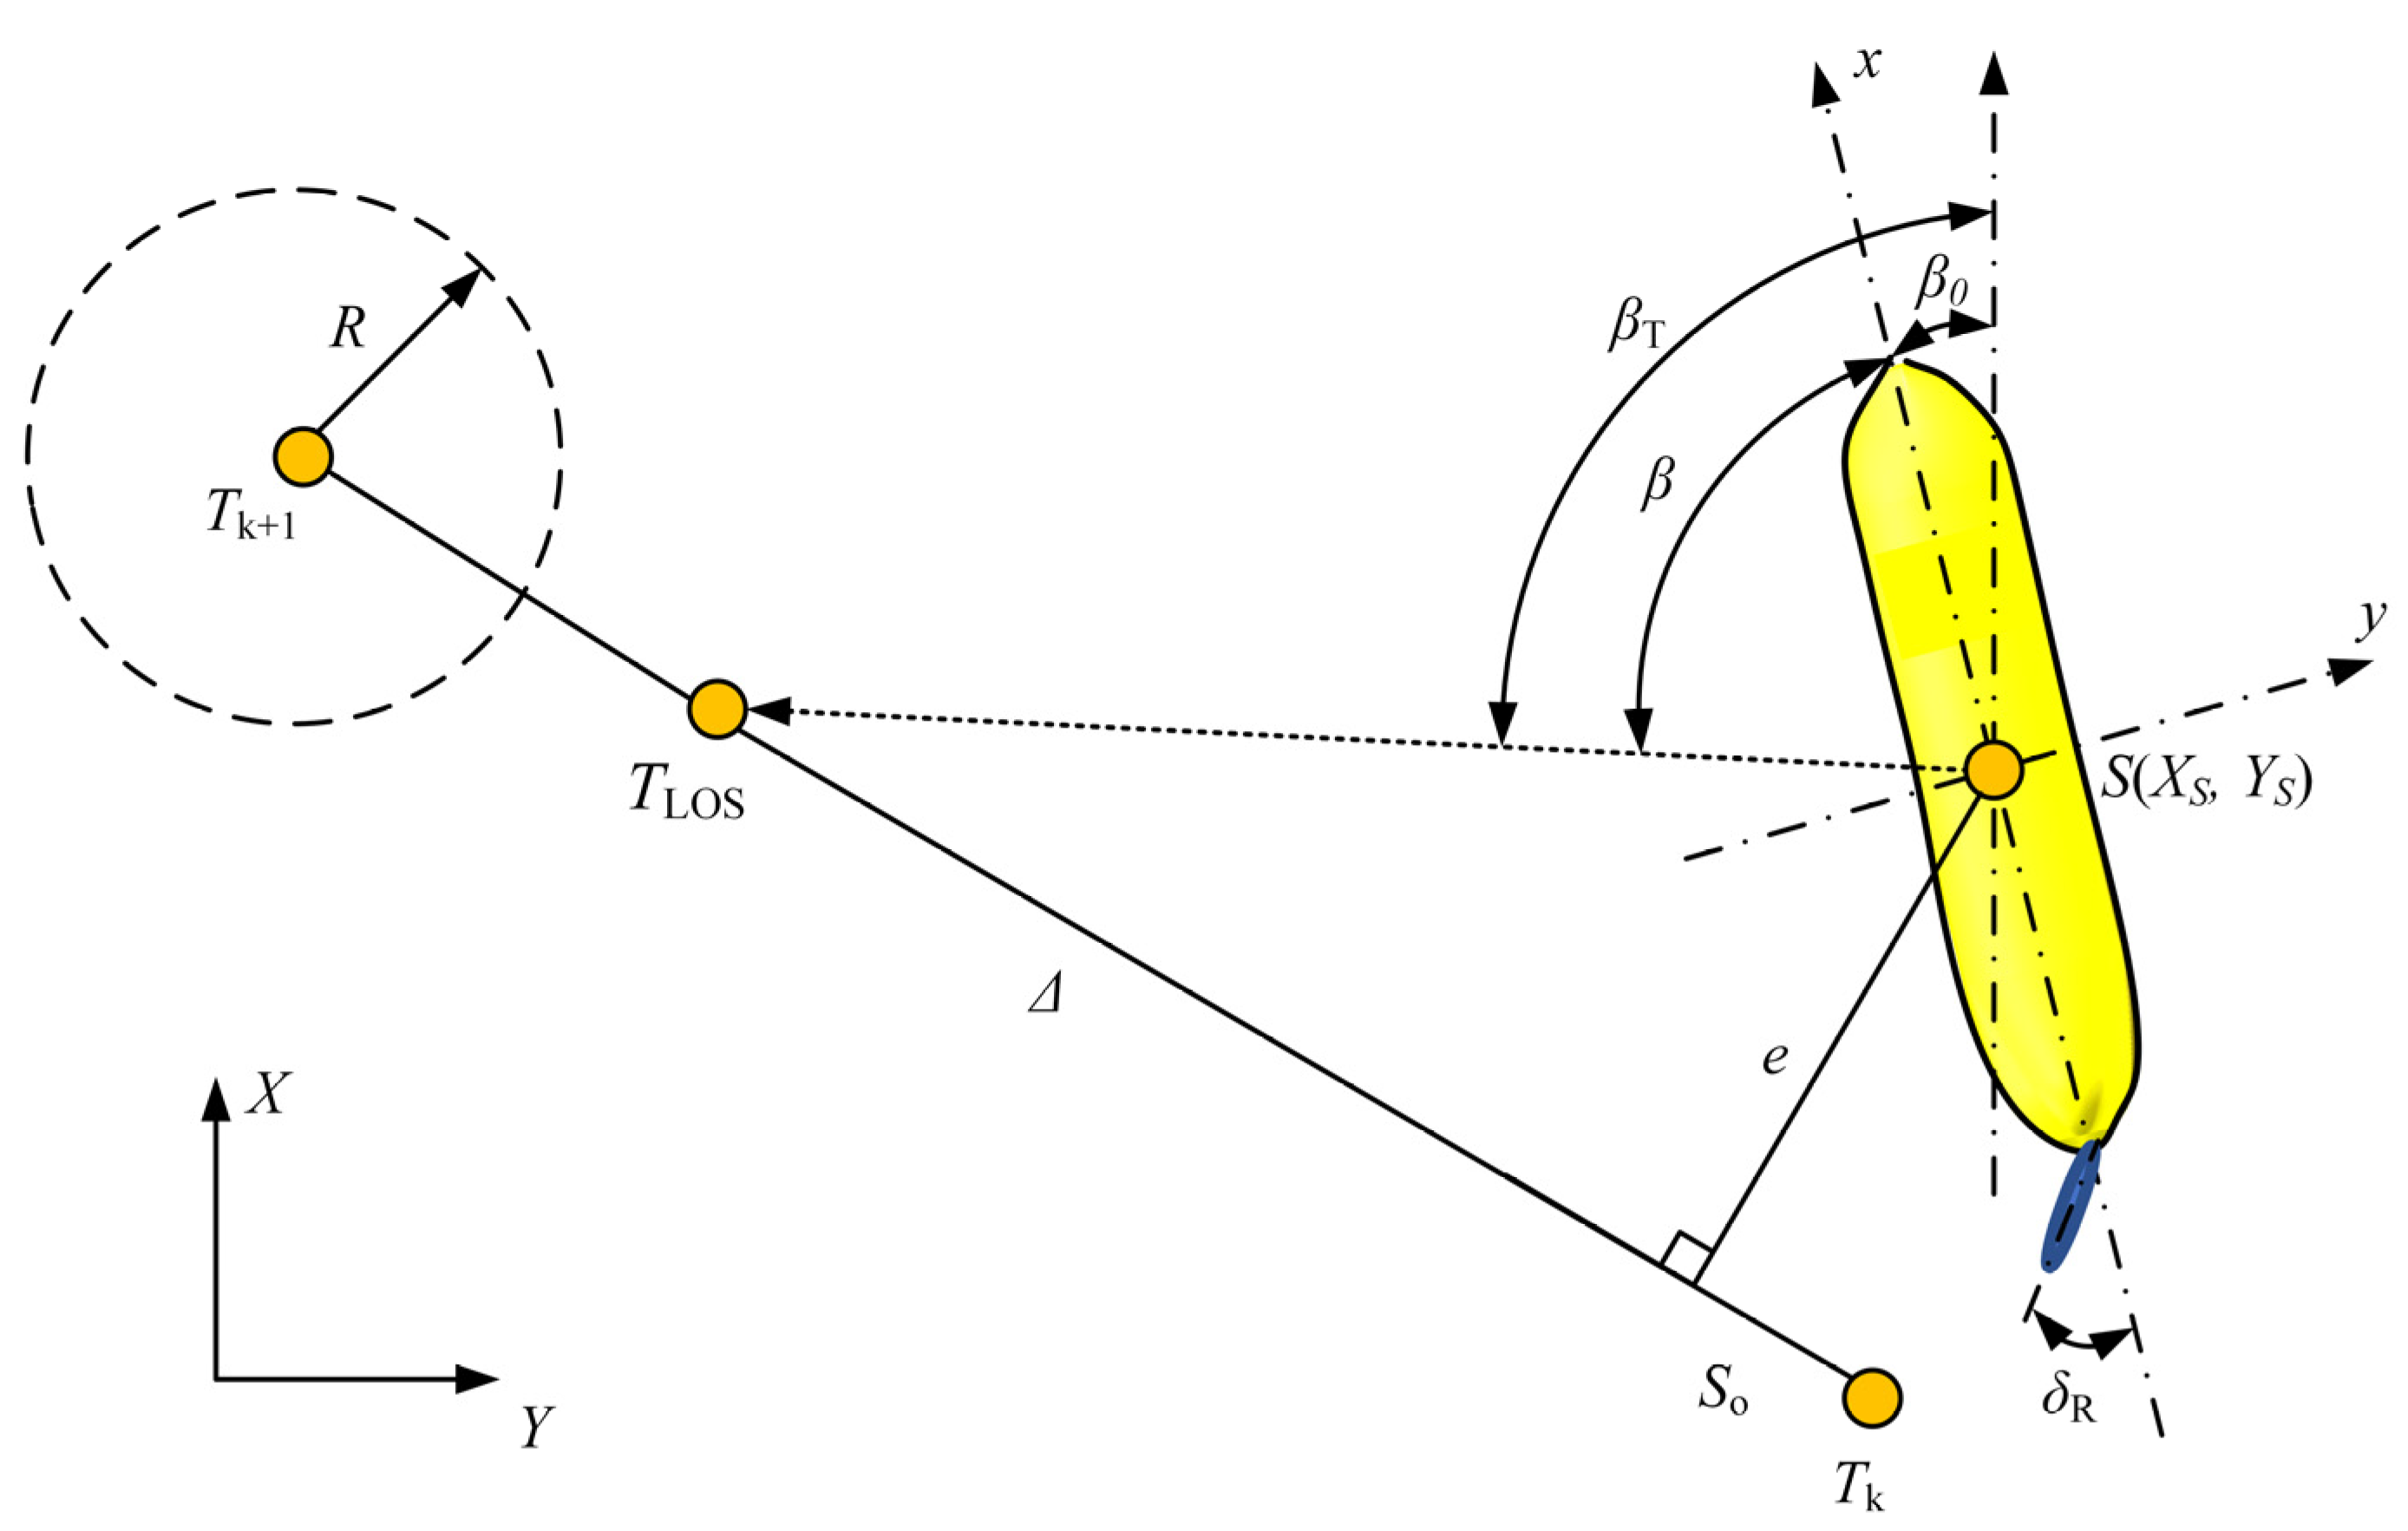
2.4. Path-Following Strategy
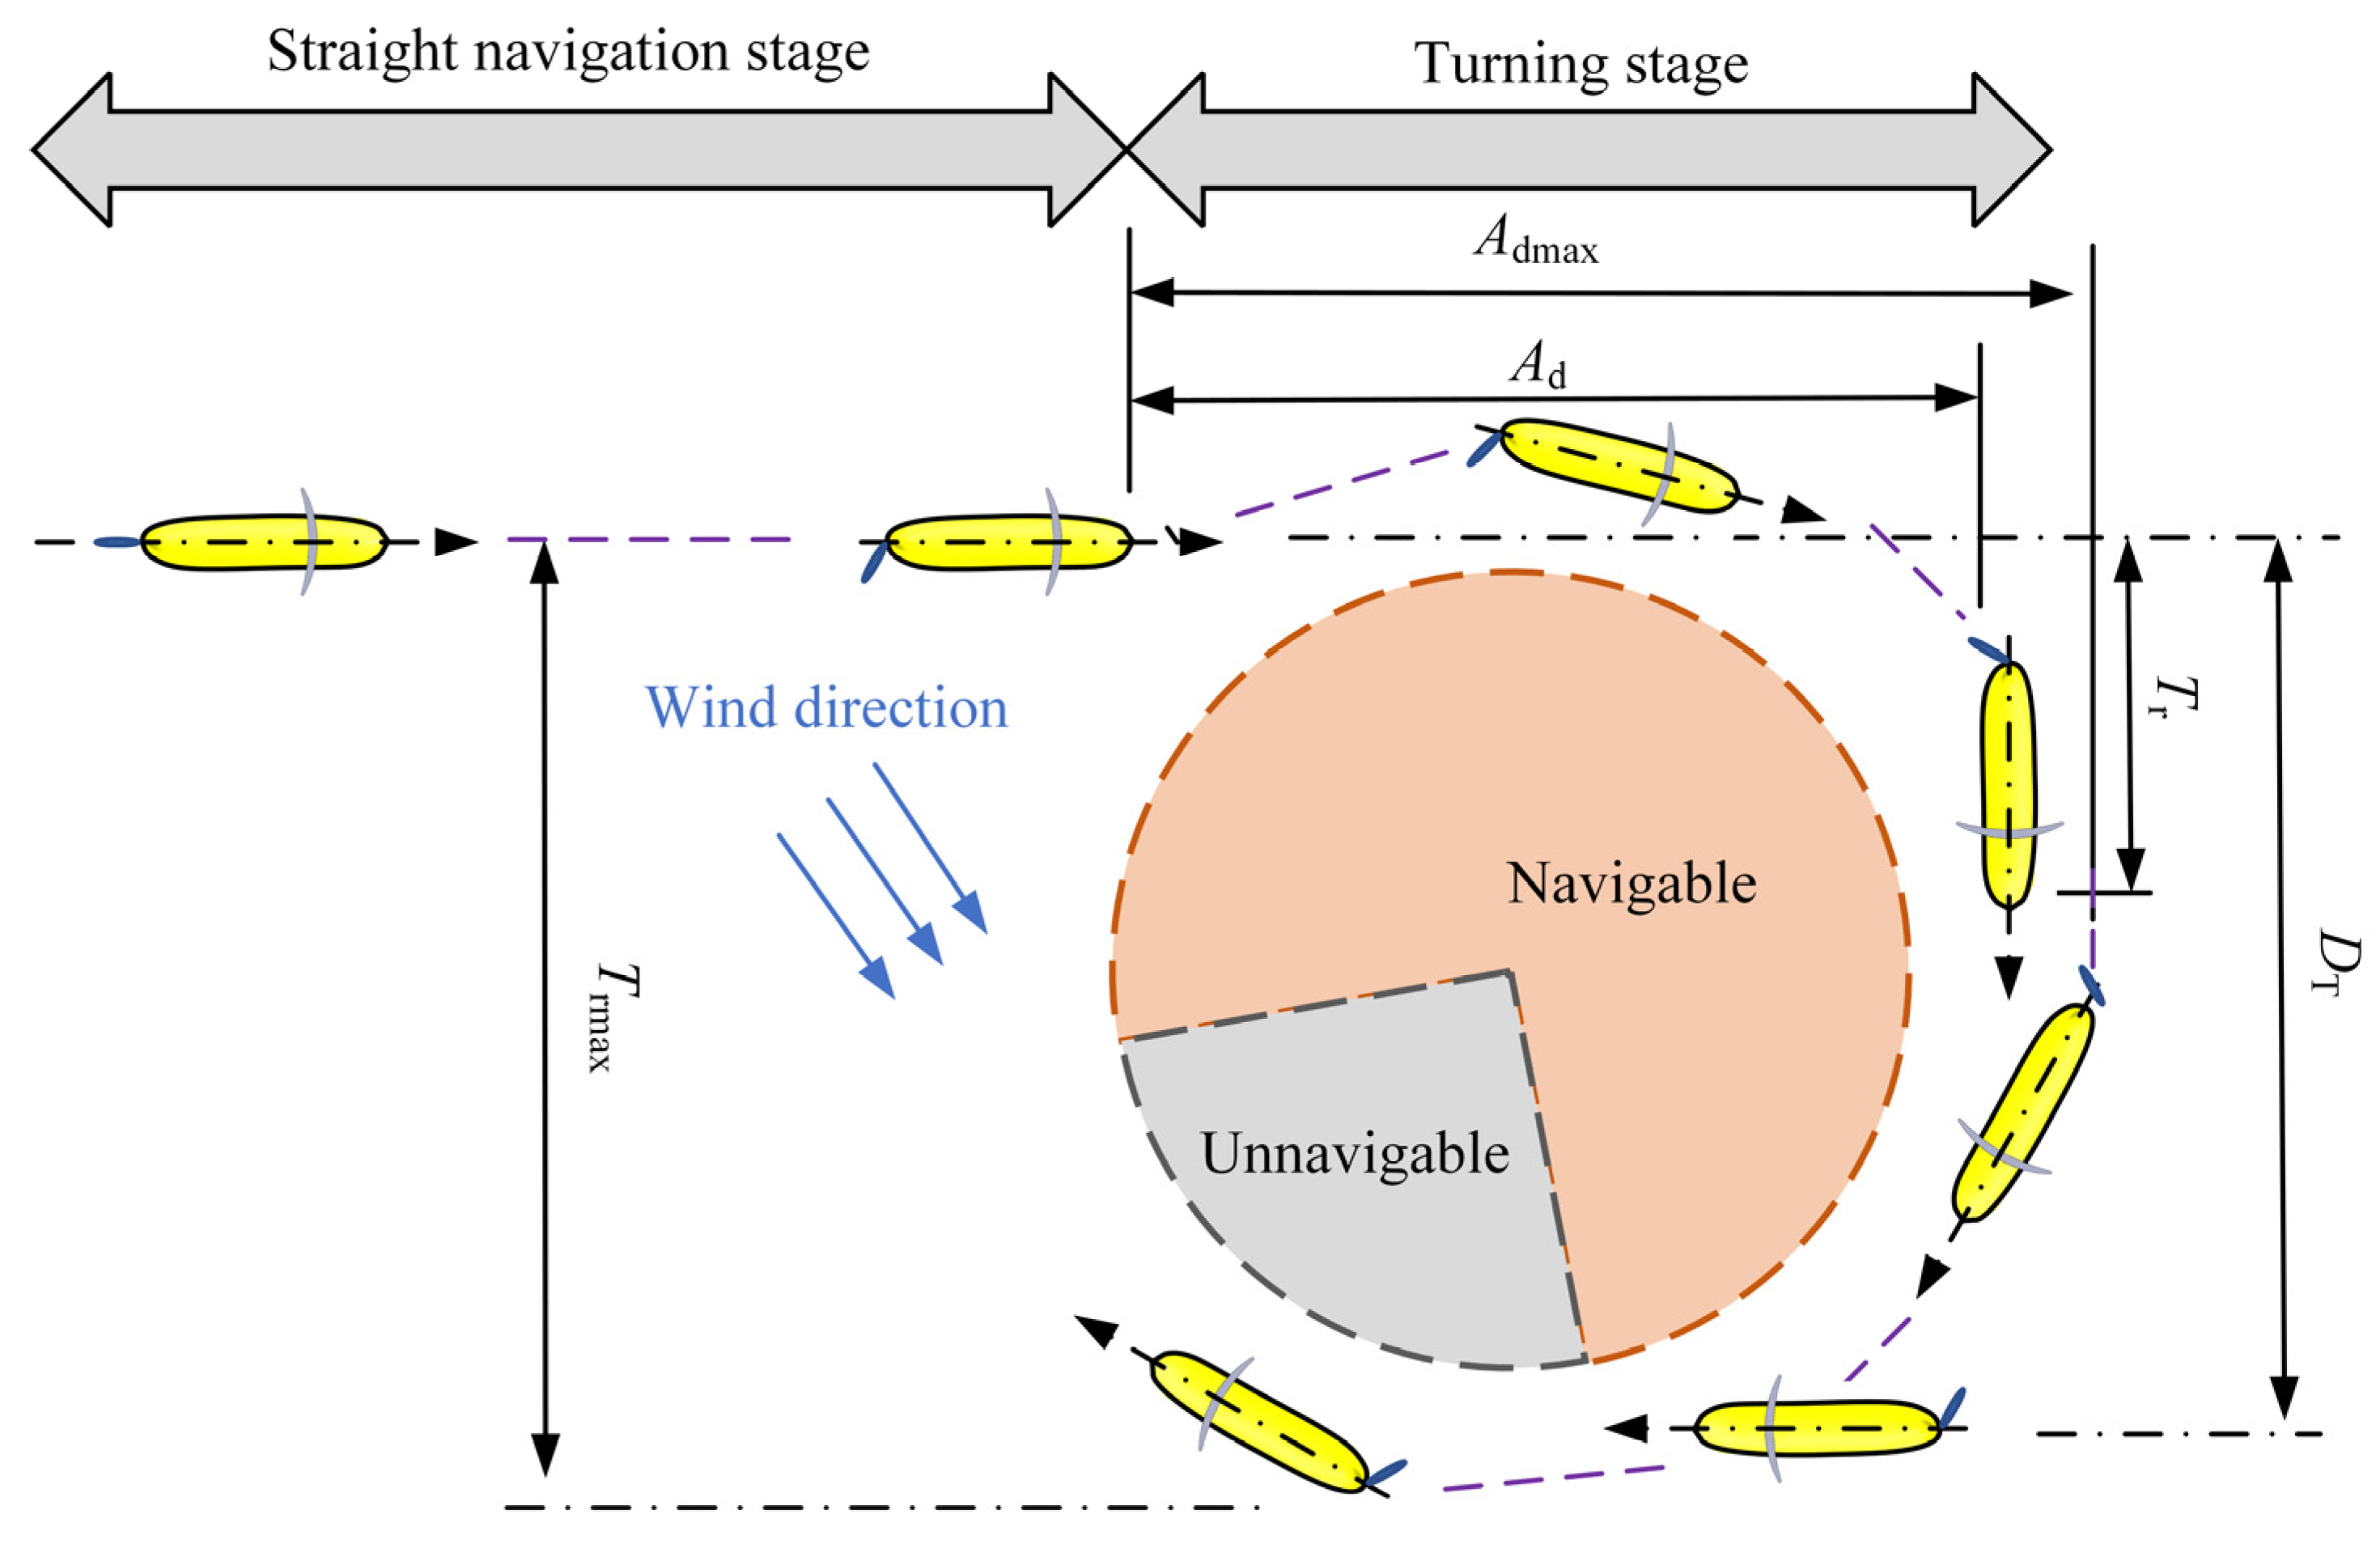
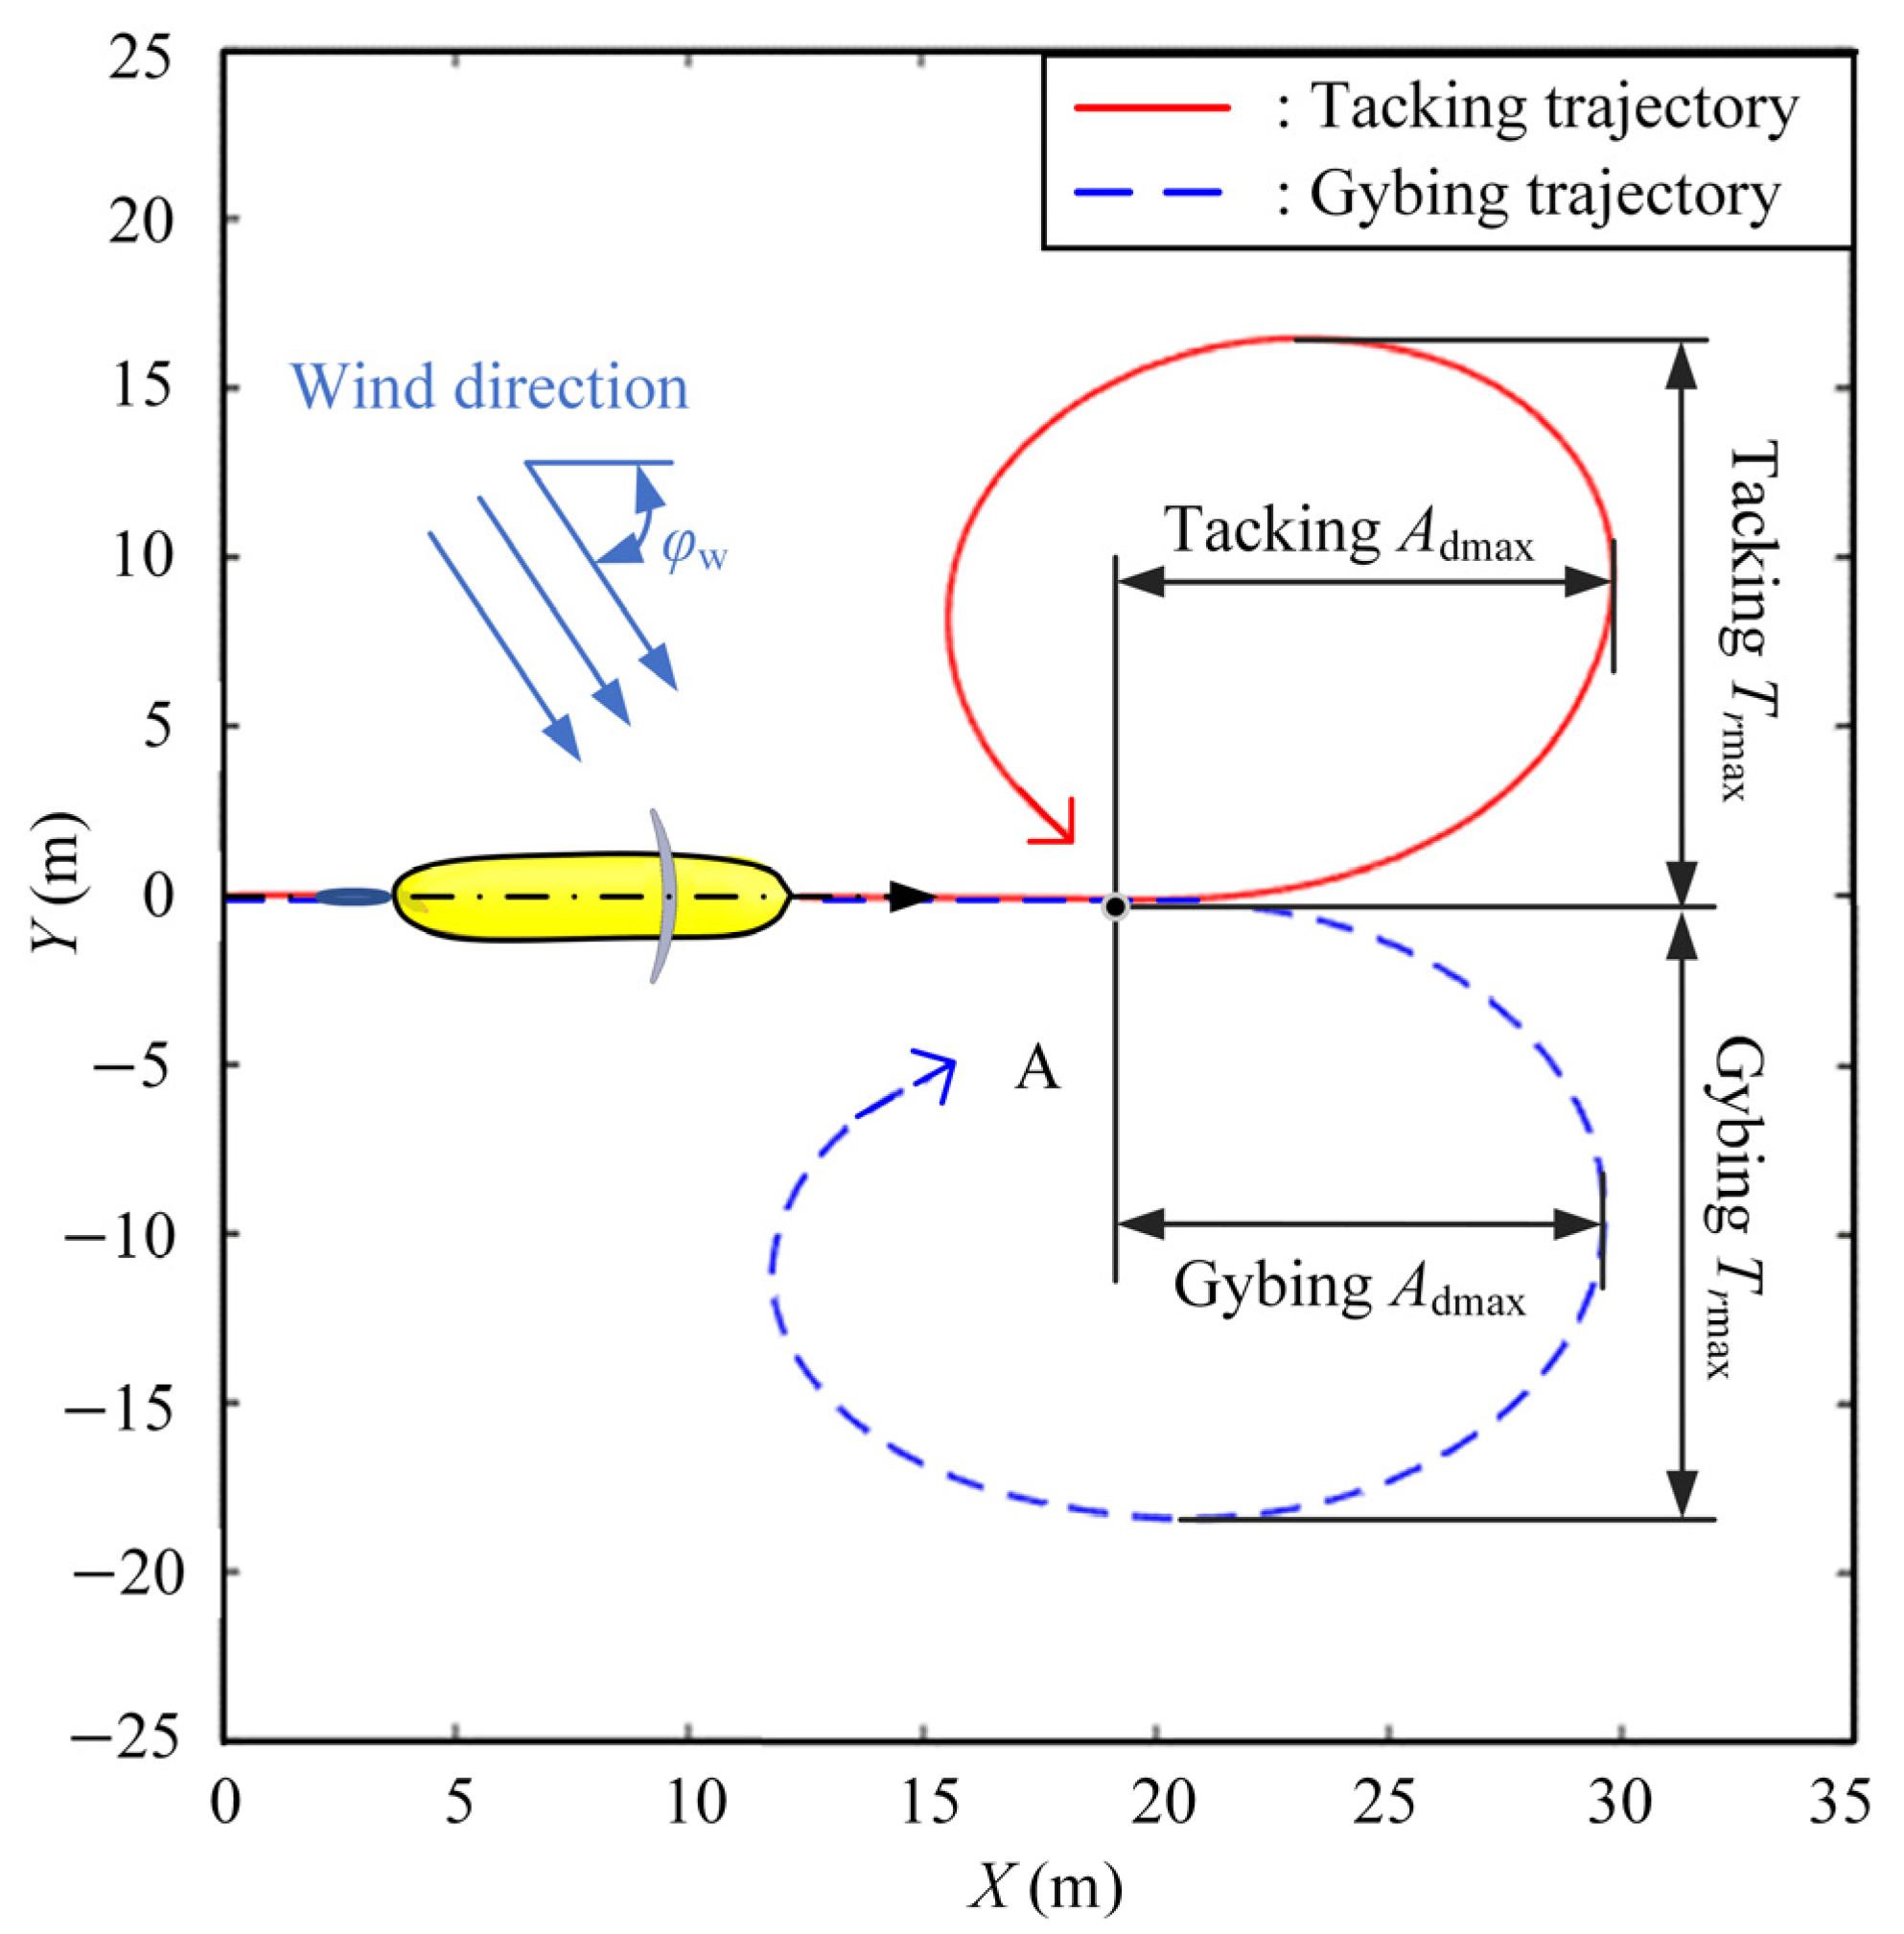
The path of the unmanned sailboat can be roughly represented by a two-dimensional path composed of multiple straight lines and arcs. Therefore, the widely used line-of-sight [22] (LOS) method is adopted to update the heading deviation angle in real time and correct the yaw of the unmanned sailboat during the sailing in a timely manner.
A navigation diagram generated with the LOS method is illustrated in Figure 4. For the segment TkTk+1 that takes Tk+1 as the target, a vertical line is made from the current position S of the unmanned sailboat. The forward distance parameter Δ is introduced for navigation control, and the point TLOS is obtained at Δ with Tk as the starting point and TkTk+1 as the direction. The LOS angle of the sailboat is the angle between the direction vector of point S to point TLOS and the north direction, which is recorded as βT. The heading deviation angle β is obtained with the difference between βT and the heading angle βO. Relative wind direction is the wind speed and wind direction measured by the anemometer on the sailing boat, which is related to the true wind direction and the sailing course angle. As the unmanned sailboat approaches the target Tk+1, β gradually tends toward 0° under the control of the layer C. In addition, when the unmanned sailboat enters the circular area of Tk+1 with R as the radius, control layer A will end the current navigation task and start navigation for the next target point, and control layer B will calculate the new βT and β values and constantly perform navigation control.

3. Turning Motion

The turning motion of a surface vehicle is composed of the straight navigation stage with a constant speed and the turning stage, as does the turning motion of the unmanned sailboat, as shown in Figure 5. In the direct navigation stage, the unmanned sailboat relies on the small swing of the rudder angle δR to maintain the route. In the turning stage, the unmanned sailboat begins to turn due to the adjustment of δR. The trajectory of this stage, namely the shape of the turning circle, is affected by both δR and the environmental conditions, such as wind speed and flow velocity.
Based on the relationship between the turning direction and the wind direction, the turning motion of the unmanned sailboat can be divided into tacking and gybing motions. When the turning direction of the unmanned sailboat has a component in the direction of the wind, it is defined as tacking motion. On the other hand, when the turning direction has a component in the same direction as the wind direction, it is defined as a gybing motion.
The main characteristic parameters for describing the turning motion are listed in Table 2.
Because the unmanned sailboat is only driven by the sail, the wind direction angle φw changes constantly when the sailboat travels in a stable wind field, and there will be a powered area and a powerless area.
When the sail can provide thrust, the unmanned sailboat is in the powered area. In this area, the wind direction angle φw is in the ranges of −180° to −45° and 45° to 180°. The maximum sail thrust strategy is adopted to obtain the best rotary angle of the sail and generate the maximum longitudinal thrust along the bow direction, so as to reach the maximum sailing speed.
When the unmanned sailboat cannot obtain forward thrust from the sail, it is in the powerless area. In this area, the wind direction angle φw is in the range of −45° to 45°. Under the aerodynamic and hydrodynamic resistance, the navigation speed of the unmanned sailboat gradually decreases, and the rudder efficiency also decreases, which, in turn, affects the turning characteristics. By utilizing the cambered shape of the arc sail, the sail is maintained at an aerodynamic attack angle of 0° during both tacking and gybing maneuvers in this area. At the same time, the sailboat generates a moment of turning to execute the turning movement.

4. Simulation Analysis

In this section, the three-layer control structure of the unmanned sailboat is integrated based on the motion mathematical model and corresponding control strategy design, and MATLAB R2022a software is adopted to build the motion simulation model for the unmanned sailboat, as shown in Figure 6. The simulation model mainly includes the control architecture, path-following strategy, motion model, sail controller, and rudder controller.
When performing turning motion on the water surface, the unmanned sailboat is affected by external factors, such as wind, waves, and currents. Among these factors, the wind is the only driving source that cannot be ignored in the whole simulation process. The turning motion is a typical motion of surface vessels, and there is currently limited research on the turning characteristics of unmanned sailboats. First, the turning motion of unmanned sailboat under the ideal condition is investigated to clarify the law of turning motion under a fixed wind direction. Further, the interference of waves and currents is considered to predict the turning motion trajectory of the unmanned sailboat.

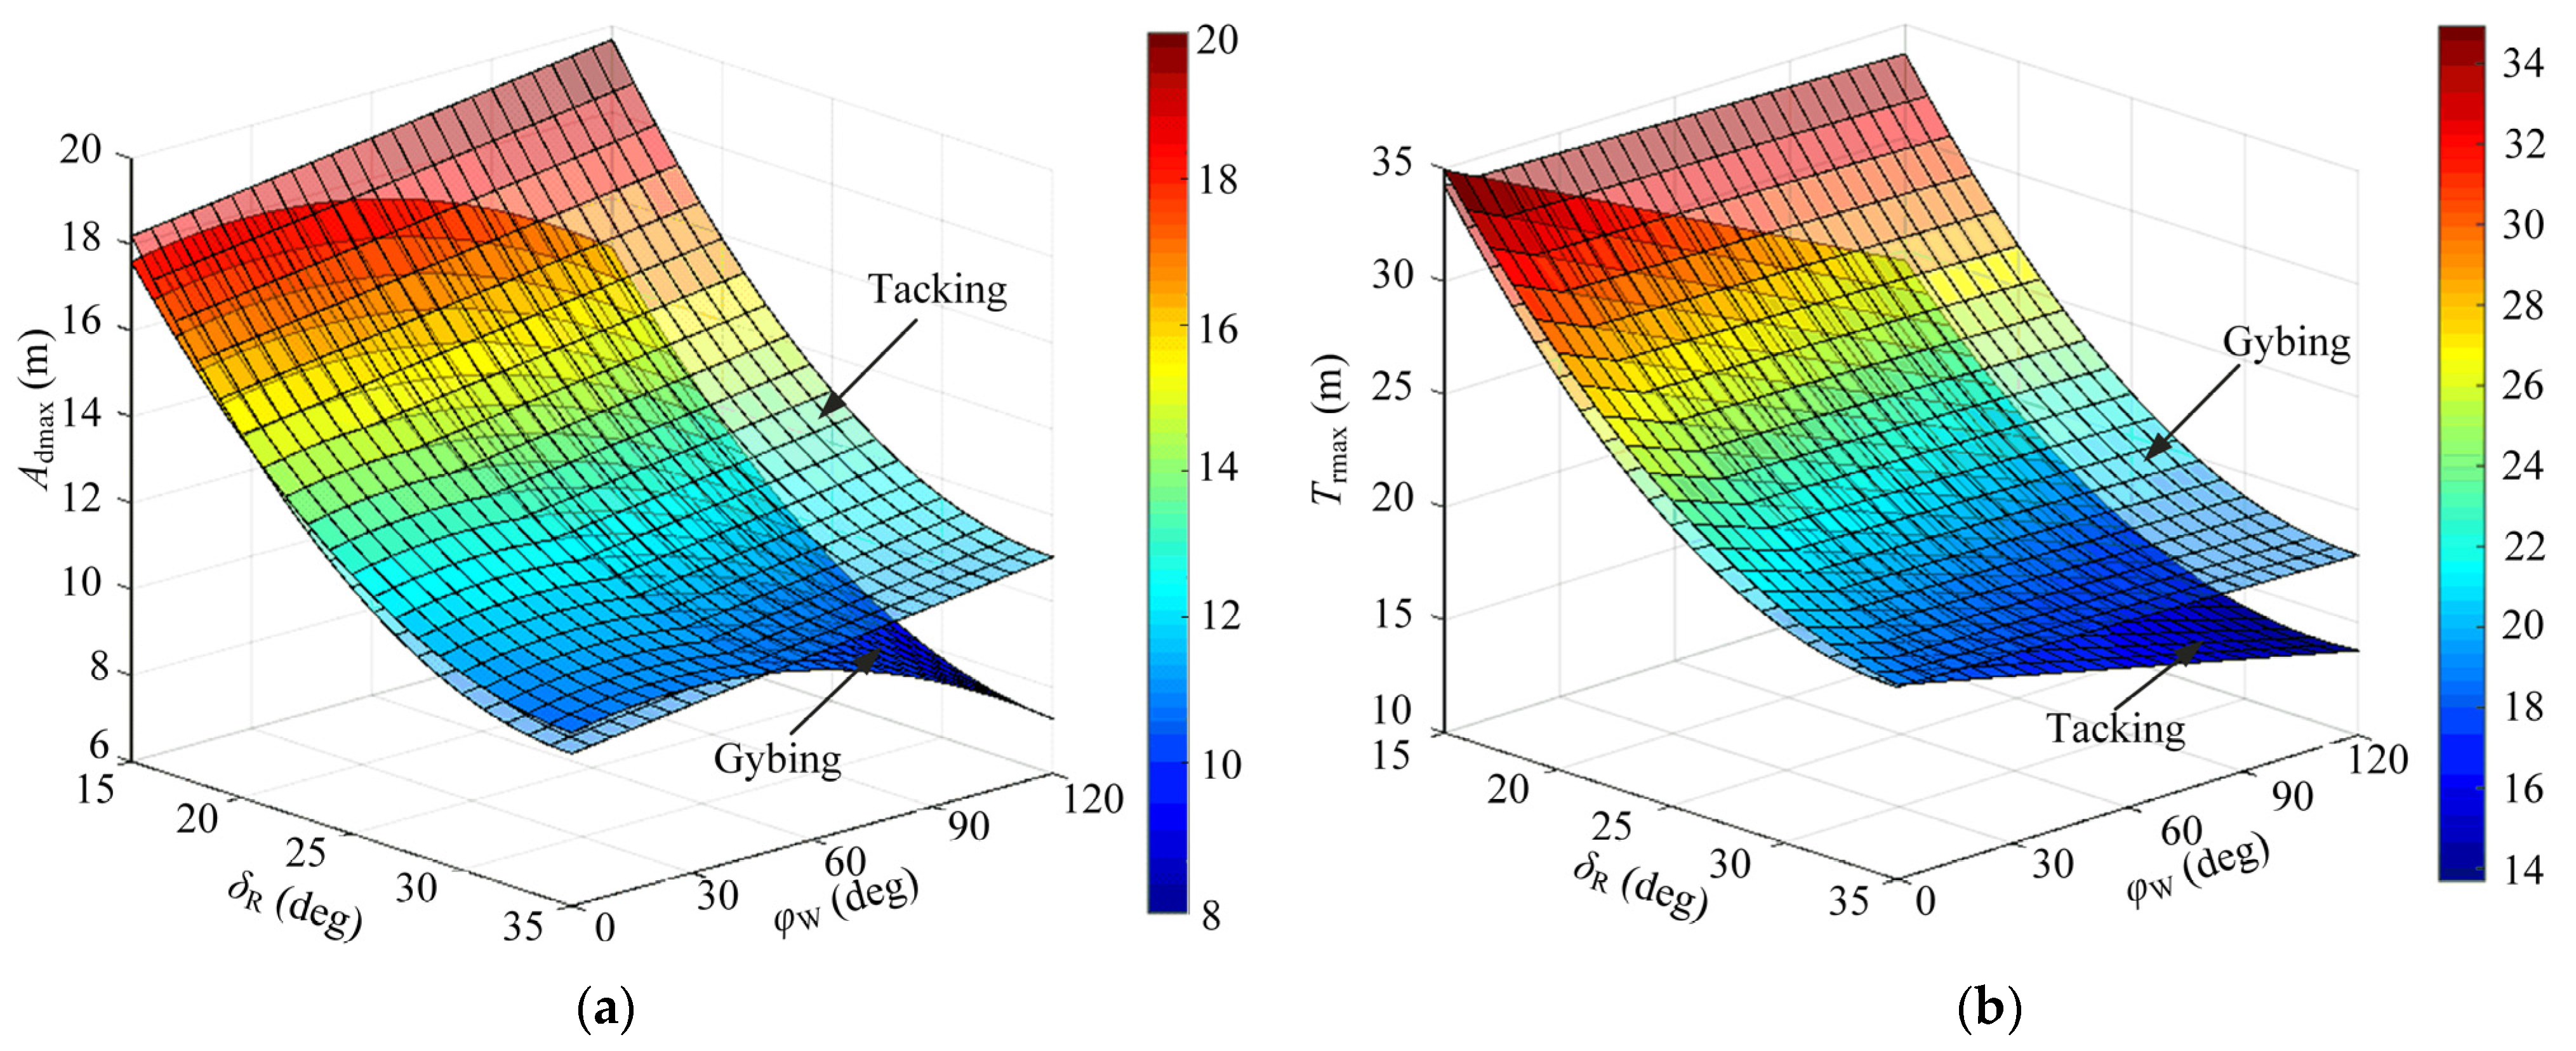
4.1. Turning Characteristics under Ideal Hydrostatic Conditions

Based on the motion simulation model established, we simulated the turning motion scenario of the unmanned sailboat under a constant and uniform wind field in the hydrostatic condition. The Petrel Sail unmanned sailboat is small in size, and the designed prototype is suitable for coastal waters with calm wind and waves. Therefore, the Petrel Sail unmanned sailboat has strong stability. The influence of wind on the tilt of the sailboat was not considered for simplifying the complexity of the model. For the calculation, the rudder angle δR, the wind speed vw, and the wind direction angle φw were taken as the inputs of the simulation model, while the maximum advance distance Admax and the maximum transfer distance Trmax were taken as the evaluation indexes.
Given that the motion of the unmanned sailboat is nonlinear in nature, the ternary quadratic regression orthogonal experimental was adopted to investigate the turning motion, allowing for the simultaneous examination of three main factors and revealing the nonlinear effect. The regression equation was established with the inputs δR, vw, and φw according to the principle of least squares [23], expressed as
y = a + b 1 δ R + b 2 v w + b 3 φ w + b 12 δ R v w + b 13 δ R φ w + b 23 v w φ w + b 11 δ R 2 + b 22 v w 2 + b 33 φ w 2
where a is a constant; b1, b2, and b3 are the linear regression coefficients; b12, b13, and b23 are the interaction term partial regression coefficients; b11, b22, and b33 are the quadratic term partial regression coefficients; and Admax and Trmax are used as the evaluation indexes of the test, respectively.
The range of the input parameters was set as follows:
  • The maximum rudder value that could be realized by the unmanned sailboat in practical work was set to 35°, and the minimum value was set to 5°, since a smaller rudder angle cannot produce enough torque to complete the turning motion. Therefore, the ranges of the rudder angle were set to −15° to −35° and 15° to 35°.
  • The unmanned sailboat works on the sea surface in all weather conditions. The wind situation in the South China Sea region was taken as the reference for the current study, and it is affected by monsoon all year round. The wind is distributed in the range from level 3 to level 5 more than 90% of the time. In this case, the range of wind speed vw was set from 4 m/s to 8 m/s.
  • The wind angle was set to be less than 120°, thus ensuring the utilization of wind power in both tacking and gybing. If the wind angle was greater than 120° during tacking, the unmanned sailboat would enter the non-navigable area, which makes it difficult to effectively utilize the wind power. Therefore, the wind angle φw was set from −120° to 120°.
Each level of δR, vw, and φw was coded, and the range of each input, as well as its coding, can be found in the Appendix A.
Let the quadratic term in the regression equation be zj2 and the centering of the corresponding coding can be expressed as
z j = z j 2 1 n i = 1 n z j i 2
where zj′ is the coding after centering, and n is the number of trials.
In the three-factor quadratic regression orthogonal test, altogether, 15 test combinations were generated, and the detailed schemes can be found in Appendix B. With the simulation model established, the 15 combinations were simulated for analyzing the turning motion of the unmanned sailboat in tacking and gybing, respectively. Finally, the corresponding Admax and Trmax values were obtained. The test results are shown in Table 3.
The simulation results for the second set of data are illustrated in Figure 7 as an example. The unmanned sailboat departed from point (0, 0) to carry out a steady speed sailing along the X-direction to point A, and then entered the tacking and gybing motion by applying the rudder angle δR in two different directions.
Further, the regression relationship between the input and the evaluation indicators was obtained through data analysis. The goodness of fit and analysis of variance for each regression equation are shown in Table 4.
Tacking:
A d U p = 13.513 3.57 z 1 + 0.615 z 3 + 1.456 z 1 T r U p = 21.379 5.554 z 1 3.133 z 3 + 2.17 z 1 + 0.937 z 1 z 3
Gybing:
A d D o w n = 12.193 3.109 z 1 1.147 z 3 + 1.214 z 1 0.885 z 3 T r D o w n = 24.633 6.48 z 1 0.216 z 3 + 2.667 z 1
Analysis of the regression results shows that the regression equations established for the test evaluation indicators reached a significant level and fit well with the simulation data.
The actual regression equations of the evaluation indexes can be obtained as
Tacking:
A d U p = 35.978 1.508 δ R + 0.0124 φ w + 0.0215 δ R 2 T r U p = 63.947 2.415 δ R 0.121 φ w + 0.032 δ R 2 + 0.0023 δ R φ w
Gybing:
A d D o w n = 32.682 1.274 δ R + 0.0203 φ w + 0.0179 δ R 2 0.00036 φ w 2 T r D o w n = 66.709 2.756 δ R 0.00437 φ w + 0.0394 δ R 2
The relationship between the inputs δR and φw and the evaluation indexes Admax and Trmax is visualized with three-dimensional response plots.
Figure 8a shows the three-dimensional response surfaces of the rudder angle δR and wind angle φw with respect to the maximum advance distance Admax values for tacking and gybing. For tacking, Admax decreased significantly with the increase in δR and showed an increasing trend with the increase in φw. For gybing, Admax also decreased significantly with the increase in δR but showed a decreasing trend with the increase in φw. When φw was in the range of 0° to 60°, the values of Admax generated by tacking and gybing under the same rudder angle were basically the same. When φw was in the range of 60° to 120°, the value of Admax corresponding to the gybing was lower than that of tacking, and, thus, the selection of gybing would generate shorter advance distances and better operation effect.
Figure 8b shows the three-dimensional response surfaces of the rudder angle δR and wind angle φw with respect to the maximum transverse distance Trmax for tacking and gybing. For both tacking and gybing, Trmax decreased significantly with the increase in δR. Moreover, it also showed a decreasing trend with the increase in φw, albeit only if the decrease for tacking was greater than that for gybing. Therefore, the selection of tacking would produce a shorter transfer distance and, thus, improve the operating effect.
In the hydrostatic condition, the maximum advance distance Admax and the maximum transfer distance Trmax were mainly affected by the rudder angle δR and the wind angle φw, while the wind speed vw did not have a significant effect. For Admax, the effect of tacking and gybing was comparable when φw was in the range from 0° to 60°, while gybing had a stronger effect when it was in the range from 60° to 120°. In addition, the value of Trmax decreased with the increase in φw, and the decreasing trend was more obvious in tacking. In brief, choosing tacking will produce better turning performance of the unmanned sailboat.

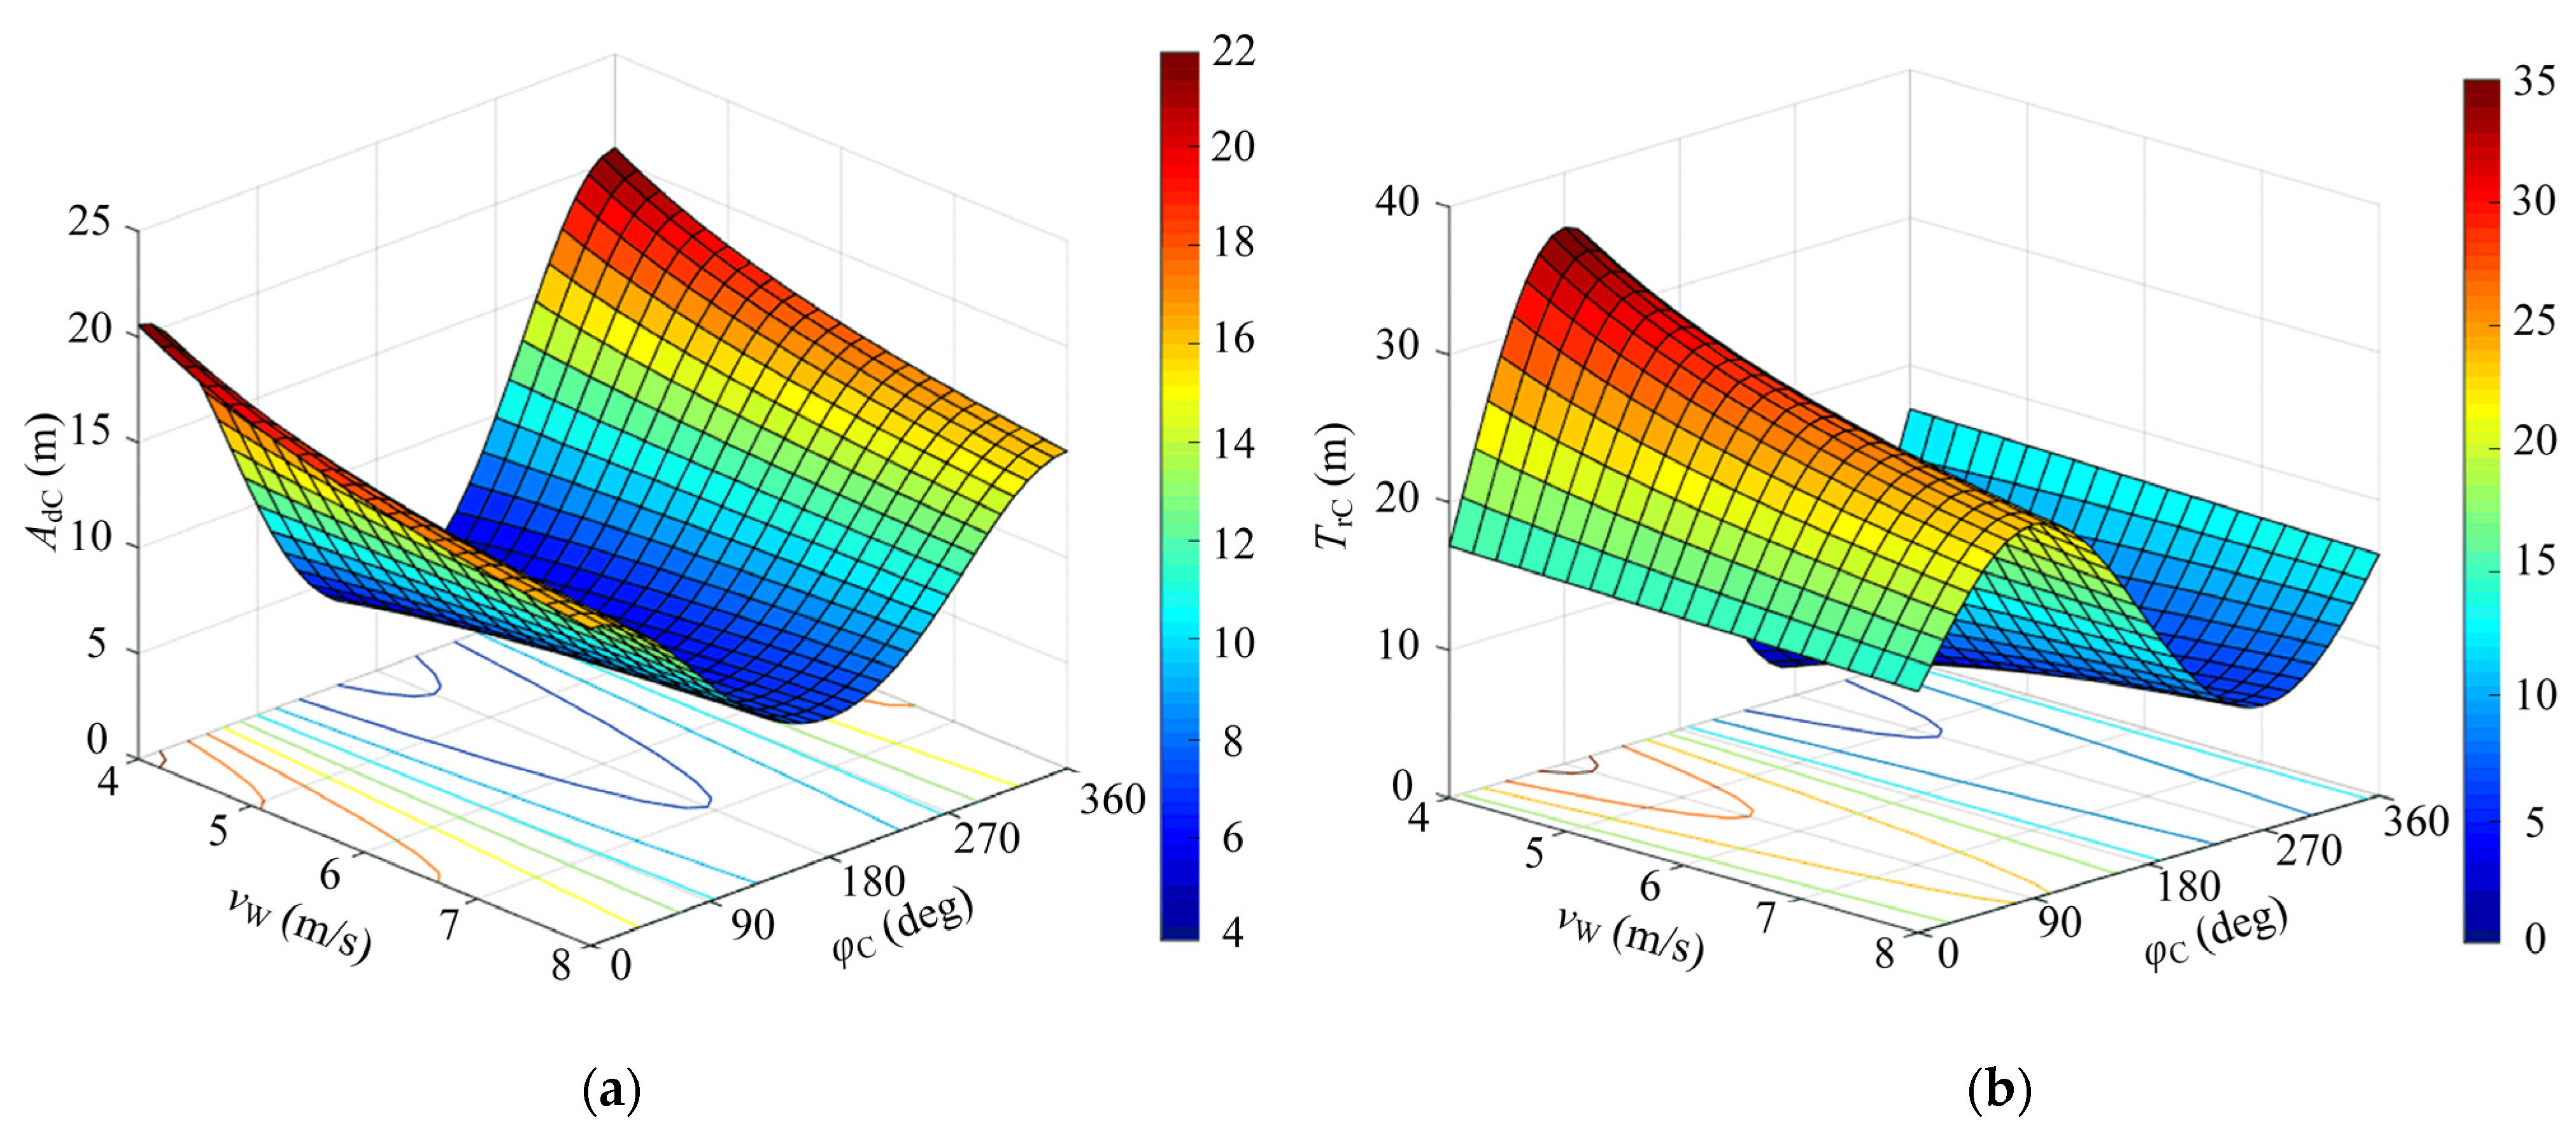
4.2. Turning Characteristics under Flow Disturbance Conditions

Based on the constant wind field condition established, the wave and current interferences were further introduced to study the turning characteristics of unmanned sailboats. The ambient flow field was defined as a steady uniform flow field where the flow velocity and its direction do not change with time or spatial location. The ternary quadratic regression orthogonal experimental scheme in the hydrostatic condition was adopted, also taking rudder angle δR, wind speed vw, and wind direction angle φw as the inputs.
During the turning motion in a constant uniform flow field, the size of the turning circle of the unmanned sailboat under flow disturbance was the same as that in the hydrostatic condition. The simulated trajectory of the unmanned sailboat obtained from the regression orthogonal test could not directly derive the maximum advance distance Admax and maximum transfer distance Trmax because the turning circle was deformed along the flow direction according to the offset of the flow velocity in the geodetic coordinate system.
Therefore, we proposed an approximate turning circle index to describe the virtual circular path of a sailboat in its turning motion. We utilized the centroid coordinates of the approximated turning circle (xS, yS), the radius rS, and the centroid angle coefficient KC as the output quantities of the regression test and then compared them with the maximum advance distance Admax and maximum transfer distance Trmax. Finally, it generated the variation in the turning characteristics for the flow velocity and wind speed under flow disturbance.
Through the orthogonal regression test, the centroid coordinates, radius, and angle coefficient of the approximate turning circle in the tacking and gybing states were obtained, and detailed information can be found in Appendix C.
Here, the simulation trajectory of the fourth set of data is analyzed as an example. The unmanned sailboat passes through five marker points A-E in one turning circle in the hydrostatic state, as shown in Figure 9. Point A denotes the beginning point of the turning, and the circle taking points B, C and D as the base points is considered to be the approximate turning circle of the unmanned sailboat, with the centroid denoted as O (xS, yS) and the radius as rS. The parameters of the turning circle can be expressed as:
x = x S + r S sin γ y = y S + r S cos γ γ [ 0 , 2 π )
where (xS, yS) are the coordinates of the center of the circle, rS is the radius of the circle, γ is the turning angle, and (x, y) are the coordinates of an arbitrary point on the trajectory.
The coordinate system for the centroid of the turning circle is shown in Figure 9. The unmanned sailboat is set to rotate around the center of the circle O, with the approximate turning circle apex A′ being the starting point. The center angle γS is approximated to be equivalent to the heading change angle ΨS.
The regression relationship between the input variables and the evaluation indexes is obtained as follows:
Tacking is defined as follows:
x S = 30.474 0.598 δ R + 0.274 v w + 0.0157 φ w + 0.00918 δ R 2 0.000131 φ w 2 y S = 39.641 1.511 δ R 0.0893 φ w + 0.00303 δ R φ w + 0.0192 δ R 2 0.000499 φ w 2 r S = 25.537 0.941 δ R 0.18 v w 0.00698 φ w 0.000704 δ R φ w + 0.0135 δ R 2 + 0.000287 φ w 2 K S = 1.36 + 0.191 δ R + 0.248 v w + 0.00188 φ w + 0.00841 δ R v w 0.00298 δ R 2 0.0000267 φ w 2
Gybing is defined as follows:
x S = 23.516 0.0525 φ w y S = 26.414 + 0.469 δ R + 0.0322 φ w r S = 31.476 1.474 δ R + 0.0279 φ w + 0.0232 δ R 2 K S = 0.298 + 0.144 δ R + 0.235 v w + 0.000197 φ w + 0.00886 δ R v w + 0.000615 v 2 φ w 0.00297 δ R 2
The goodness of fit and analysis of variance of the regression equations can be found in Appendix D. The analysis of the regression results reveals the significant regression effects of each parameter for the approximate turning circle, as well as good fitting with the simulation data.
According to the turning process under the hydrostatic state, a wind speed of 6 m/s and wind angle of 60° were selected for gybing, and heading change angle with time for different rudder angles could be obtained. As shown in Figure 10, ΨS and the turning time have an approximately linear relationship.
Further, the center angle of the approximate turning circle can be considered a function of time t, expressed as:
γ s = K C t
where KC is the centroid angle coefficient.
The maximum advance distance AdC and the maximum transfer distance TrC under flow disturbance can be calculated by:
A d C = M a x ( x S + r S sin ( K C t ) + v C cos φ C t ) x A
y s > 0 T r C = M a x ( y S r S cos ( K C t ) + v C sin φ C t )
y s < 0 T r C = M i n ( y S + r S cos ( K C t ) + v C sin φ C t )
where vC is the absolute velocity of the flow, φC is the absolute direction, and the parameters xS, yS, rS, and KC can be calculated by substituting the rudder angle δR, the wind speed vw, and the true wind angle φw into the approximate turning regression equations, respectively.

4.3. Effect of Flow Velocity under Flow Disturbance

Figure 11 shows the 3D surface response plots and contours for the maximum advance distance AdC and maximum transfer distance TrC with variations in flow velocity vC and flow angle φC under flow disturbance. In this specific case, the unmanned sailboat was set to be subjected to a wind speed vw of 6 m/s, a wind angle φW of 60°, and a rudder angle δR of 35° in tacking. The variables vC and φC were set in the ranges from 0 m/s to 0.25 m/s and from 0° to 360°, respectively.
As shown in Figure 11a, a concave arc was observed in the surface diagram of the AdC with respect to the maximum advance distance of the flow Angle φC, where the value of AdC varied within the range 5 m to 18 m. The value of AdC showed a decreasing trend, with an increase in vC when the sailboat sailed against the flow and φC lay in the range of 90° to 270°. Notably, the smallest AdC occurred when the sailing direction was opposite to the flow direction. In contrast, AdC was positively proportional to vC for the sailboat sails along the flow.
As shown in Figure 11b, a wave-like phenomenon was observed in the surface diagram of the TrC with respect to the maximum transverse distance of the flow angle φC, where the value of TrC varied within the range 5 m to 31 m. TrC was susceptible to the flow interference than AdC, and the impact was the greatest when the sailboat was subjected to crossflow and φC lay in the range of 90° and 270°. When the turning direction was consistent with the direction of the crossflow and φC was 90°, TrC took the maximum value. On the contrary, TrC took the minimum value when φC was 270°. In addition, TrC was positively proportional to flow velocity vC when φC is within the range of 0° to 180°, and inversely proportional to vC when φC is within the range of 180° to 360°.
In the above analysis, AdC varied significantly when the unmanned sailboat was subjected to different flow situations, which showed a decreasing trend when the unmanned sailboat sailed along the flow but presented an increasing trend when the sailboat sailed against the flow. In addition, TrC varied significantly when the sailboat was subjected to crossflow, and the variation trend depended on the relationship between the turning direction and the flow direction. Notably, the increase in vC enhanced the effect of flow interference on the turning motion of the unmanned sailboat.

4.4. Effect of Wind Speed under Flow Interference

Wind speed vw is also a major element affecting AdC and TrC, since the parameter of time is also involved in the turning performance of the unmanned sailboat under flow disturbance. Figure 12 shows the variation in AdC and TrC with wind speed vw and flow angle φC. Here, the unmanned sailboat was set to be subjected to a flow velocity vC of 0.2 m/s, a wind angle φw of 60°, and a rudder angle δR of 35° in tacking. The variables vw and φC were set in the ranges 4 m/s to 8 m/s and within 0° to 360°, respectively.
As shown in Figure 12a, the cross flow and longitudinal flow were distinguished with flow angles of 90° and 270°. When the sailboat sailed in the crossflow, namely when φC was located in the range of 90° to 270°, the maximum advance distance AdC increased with the wind speed vw. When the sailboat sailed in downstream, AdC was inversely proportional to vw.
As shown in Figure 12b, upstream sailing and downstream sailing were distinguished with a flow angle φC of 180°. During upstream sailing, when φC lay in the range of 0° to 180°, the maximum transfer distance TrC decreased with the increase in the wind speed vw. During downstream sailing, TrC had a positively proportional relationship with vw.
In the above analysis, an increase in wind speed vw attenuated the effect of flow disturbance on the turning motion of the unmanned sailboat.

5. Harbor Pool Test

5.1. Test Conditions

In October 2023, a harbor pool test for the unmanned sailboat was conducted, and the 3 m class Petrel Sail unmanned sailboat was deployed to evaluate its turning characteristics. The prototype of Petrel Sail is shown in Figure 13, and the specific parameters follow those listed in Table 1.
The harbor pool test for the turning motion of Petrel Sail was carried out in the harbor pool (about 450 m long and 650 m wide) of Qingdao National Deep-Sea Base in Qingdao, China, as shown in Figure 14. In this harbor pool, the wind direction and wind speed are relatively stable, the ocean current is gentle, and the water depth is moderate, making it suitable for the test.
The main purpose of the harbor pool test was to test the turning characteristics of Petrel Sail in a real marine environment, thus verifying the previous analysis results.
The communication module in the stern of the hull could always measure the wind speed and direction of the sailboat and then receive the current environment through the wireless module of the shore station. By setting a different initial course, the unmanned sailboat could sail steadily for a period. When the heading angle entered the control range, the rudder turns to the fixed rudder angle and maintains it, and the actual turning motion route of the unmanned sailing prototype was collected. Four trials were designed for the tacking of the unmanned sailboat with different initial headings. For each trial, a fixed rudder angle was reached after a period of steady sailing and then maintained. During the harbor pool test, the true wind angle φw varied from −150° to −180° and the average wind speed was about 4 m/s in the natural wind field. The sailing trajectories for the four trials are shown in Figure 15. See also Table 5.

5.2. Test Results

The results of the maximum advance distance Admax and transverse distance Trmax for the four trials obtained during the harbor pool test are shown in Table 6.
Trials 1 and 2 share the same rudder angle and a close average wind speed, with similar settings for trials 3 and 4. For all trials, the maximum advance distance Admax and transverse distance Trmax decrease with the increase in φw, while trials 1 and 3 have larger advance distances and transverse distances than trials 2 and 4. In addition, the comparison between trials 1–2 and trials 3–4 reveals that the maximum advance distance Admax and transverse distance Trmax decrease significantly with the increase in the rudder angle δR.
The sailing parameters for the four trials are substituted into the regression equation. The error between the test and simulation results for maximum advance distance Admax is within 2.7–14.8%, and that for the maximum transfer distance Trmax is within 6.2–13.8%. The maximum errors for the two are observed in trial 1, which are 14.8% and 13.5%, respectively. In summary, the test results for Admax and Trmax are in good agreement with the simulation results, and the errors of the harbor pool test are in a reasonable range, proving the correctness of the theoretical results.

6. Discussion

Our research has achieved certain results and provides research value for the design and operation of the unmanned sailboats. The prototype design of the Petrel Sail unmanned sailboat principle still has limitations. The prototype used is relatively small and used in relatively calm coastal waters with less wind and waves. Therefore, the lateral capsizing of the sailing vessel was not considered in this harbor pool test. In future studies, we plan to further explore the lateral stability of unmanned sailing vessels during long ocean voyages.

7. Conclusions

This study focuses on the turning characteristics of unmanned sailboats under complex environmental conditions. A simulation platform is built and the simulation experiment is designed with the regression orthogonal method. The turning characteristics of unmanned sailboat under hydrostatic condition and flow disturbance are obtained through the simulation analysis of the rudder angle, wind speed and direction, flow velocity, and other parameters. Finally, a harbor pool test for the unmanned sailboat is carried out.
The conclusions of this paper are as follows:
(1)
In the hydrostatic condition, the maximum advance distance Admax and transverse distance Trmax are mainly affected by the rudder angle and wind angle, but not significantly affected by the wind speed. Better maneuverability of the unmanned sailboat can be obtained by selecting tacking.
(2)
Under flow disturbance, the maximum advance distance changes significantly when the unmanned sailboat is subjected to different flow situations (countercurrent or concurrent current). The maximum transverse distance varies significantly when sailboats are subjected to transverse currents, and the changing trend depends on the relationship between the turning direction and the flow direction. The increase in flow velocity will enhance the influence of flow interference on the maximum advance distance Admax and transverse distance Trmax, while the opposite is true for wind speed.
(3)
The index of the approximate turning circle is a key metric that quantifies the maneuverability of a sailboat during its turning motion. This index is defined as the supposed circular path formed by the sailboat’s trajectory during turning maneuvers.
(4)
The error between the test results and simulation results for the maximum advance distance is within the range 2.7% to 14.8%, and that for the maximum transverse distance is within the range 6.2% to 13.8%. The errors are in a reasonable range, verifying the correctness of the simulation model established.
In future works, we will further investigate the boundaries for the turning performances of unmanned sailboats. A lateral comparison of different types of unmanned sailboats will be carried out to compare their turning performances. At the same time, the impacts of more practical factors such as attitude of the sailboat will be discussed to further improve the turning performances of unmanned sailboats, and long-voyage sea trials are expected for verification.

Author Contributions

H.L.: Writing—Original Draft, Investigation, Formal analysis, Visualization, Data curation. Y.Y.: Writing—Review and Editing, Funding acquisition, Supervision, Validation, Methodology, Project administration. S.Y.: Preliminary study, Investigation, Conceptualization. All authors have read and agreed to the published version of the manuscript.

Funding

This study is supported by a grant from the Science and Technology Innovation Program of LaoShan National Laboratory (No. LSKJ202400100).

Institutional Review Board Statement

Not applicable.

Informed Consent Statement

Not applicable.

Data Availability Statement

The data that has been used is confidential.

Acknowledgments

We would like to thank the members of the underwater robot research group of Tianjin University. The authors also would like to express their sincere thanks to L. Ma for helping us to revise the grammar.

Conflicts of Interest

The authors declare that they have no known competing financial interests or personal relationships that could have appeared to influence the work reported in this paper.

Nomenclature

aA constant term for regression orthogonal test
AdThe longitudinal distance traveled from the initiation of steering to the 90° change in course
AdCMaximum advance distance for turning motion under current disturbance
AdDowmMaximum advance distance travelled in gybing
AdmaxMaximum longitudinal distance reached by the unmanned sailboat after a 90° change in course.
AdupMaximum distance travelled in tacking
b1A linear regression coefficient of regression orthogonal test
b2A linear regression coefficient of regression orthogonal test
b3A linear regression coefficient of regression orthogonal test
b12An interaction term partial regression coefficient of regression orthogonal test
b13An interaction term partial regression coefficient of regression orthogonal test
b23An interaction term partial regression coefficient of regression orthogonal test
b11A quadratic term partial regression coefficient of regression orthogonal test
b22A quadratic term partial regression coefficient of regression orthogonal test
b33A quadratic term partial regression coefficient of regression orthogonal test
DTThe lateral distance traveled when the initial heading changes by 180°
FxForce on the unmanned sailboat in x-direction
FyForce on the unmanned sailboat in y-direction
FzForce on the unmanned sailboat in z-direction
IBxyThe moment of inertia of the unmanned sailboat’s mass in the xOy plane of the body coordinate system
IByzThe moment of inertia of the unmanned sailboat’s mass in the yOz plane of the body coordinate system
IBzxThe moment of inertia of the unmanned sailboat’s mass in the xOz plane of the body coordinate system
KCCentroid angle coefficient of the approximate turning circle
KpScaling factor
KiIntegral coefficient
KdDifferential coefficient
mMass of unmanned sailboat
MxMoment of the unmanned sailboat in x-direction
MyMoment of the unmanned sailboat in y-direction
MzMoment of the unmanned sailboat in z-direction
pAngular velocity of the unmanned sailboat in x-direction
qAngular velocity of the unmanned sailboat in y-direction
rAngular velocity of the unmanned sailboat in z-direction
rSRadius of the approximate turning circle
tTime
TrThe lateral distance traveled from the initiation of steering to the 90° change in course
TrCMaximum transfer distance under flow interference
TrDownMaximum transfer distance for gybing
TrupMaximum transfer distance for tacking
irmaxThe maximum lateral distance traveled during the turning motion
TSThe working time of the sail rotary mechanism
uVelocity of the unmanned sailboat in x-direction
vVelocity of the unmanned sailboat in y-direction
vwWind speed
wVelocity of the unmanned sailboat in z-direction
xx-direction in the coordinate system of the sailboat
xSx-coordinate of the center of the approximate turning circle
xvx-direction in the velocity coordinate system
Xx-direction in the geocentric coordinate system
yy-direction in the body coordinate system
ySy-coordinate of the center of the approximate turning circle
yvy-direction in the velocity coordinate system
Yy-direction in the geocentric coordinate system
zz-direction in the body coordinate system
zjCoding after centering of the regression orthogonal test
zvz-direction in the velocity coordinate system
Zz-direction in the geocentric coordinate system
βActual heading deviation angle
βCVariation rate of deviation angle
βTLOS angle of the unmanned sailboat
β(t)Heading deviation collected at time t
γTurning angle parameter
γSThe center angle
θSail rotation angle
θeTarget turning angle
δRRudder angle of the unmanned sailboat
φwWind angle of the unmanned sailboat
ΨSAngle of heading change

Appendix A. Three-Factor Level Encoding for δR, vw, and φw

Coded Value zjVariable Factor Level
δR(deg)vw(m/s)φw(deg)
Upper limit r = 1.215(x2j)358120
Upper-level 1 (x0j + Δj)33.2317.646109.383
Zero level 0 (x0j)25660
Lower-level −1 (x0j − Δj)16.7694.35410.617
Floor −r = −1.215 (x2j)1540
Variation interval Δj = (x2jx1j)/2r8.2311.64649.383

Appendix B. Combination Schemes Designed for the Orthogonal Test

NumberConstant
z0
Primary TermInteraction TermQuadratic Term
z1z2z3z1z2z1z3z2z3z1z2z3
111111110.270.270.27
2111−11−1−10.270.270.27
311−11−11−10.270.270.27
411−1−1−1−110.270.270.27
51−111−1−110.270.270.27
61−11−1−11−10.270.270.27
71−1−111−1−10.270.270.27
81−1−1−11110.270.270.27
91r000000.747−0.73−0.73
101−r000000.747−0.73−0.73
1110r0000−0.730.747−0.73
1210−r0000−0.730.747−0.73
13100r000−0.73−0.730.747
14100−r000−0.73−0.730.747
151000000−0.73−0.73−0.73

Appendix C. Results for Approximate Circle Parameters in the Orthogonal Test

NumberCenter of
Circle xs (m)
Center of
Circle ys (m)
Radius rs (m)Center Angle
Coefficient Ks
TackingGybingTackingGybingTackingGybingTackingGybing
123.2418.85.3−9.58.029.413.98−4.71
222.722.2911.17−11.057.618.084.13−4.17
322.2314.556.06−4.948.5614.782.33−2.76
422.2321.8910.7−10.877.938.332.4−2.45
525.3717.458.45−15.2613.715.852.98−3.6
625.3624.2319.77−19.3111.813.13.23−3.2
723.8718.159.69−15.4614.2515.951.83−2.16
824.2223.318.74−18.6412.8213.621.91−1.93
922.6520.619.27−9.417.258.993.21−3.47
1026.0520.8217.52−17.6213.1817.382.34−2.47
1123.6720.9511.28−11.558.6511.054.11−4.34
122320.7111−11.619.3211.092.12−2.27
1323.0418.196.06−11.2910.2811.312.92−3.56
1422.8922.8613.3−13.519.59.483.05−3.05
1523.3920.6611.2−11.368.9411.243.1−3.28

Appendix D. Analysis of the Regression Results

Evaluation IndexDifference SourceSum of SquaresDegree of FreedomMean SquareFSignificanceR2
Tacking center xsRegression18.72844.68259.493**0.944
Residual0.787100.079
Sum19.51514
Gybing center xsRegression73.779173.77955.732**0.811
Residual17.210131.324
Sum90.98914
Tacking center ysRegression271.781554.356117.531**0.977
Residual4.16290.462
Sum275.94314
Gybing center ysRegression190.852295.42655.49**0.902
Residual20.666121.722
Sum211.51914
Tacking radius rsRegression79.779613.297344.118**0.993
Residual0.30980.039
Sum80.08814
Gybing radius rsRegression103.774334.59118.196**0.832
Residual20.912111.901
Sum124.6714
Tacking coefficient KsRegression7.91151.598304.532**0.991
Residual0.04790.005
Sum8.03814
Gybing coefficient KsRegression9.71761.620628.489**0.996
Residual0.02180.003
Sum9.73814
**: This indicates that the statistical test results corresponding to the effect or factor are very reliable.

References

  1. Wu, L.; Chen, Z.; Lin, X.; Liu, Y. Building the integrated observational network of “Transparent Ocean”. Chin. Sci. Bull. 2020, 65, 2654–2661. [Google Scholar] [CrossRef]
  2. Shu, Y.; Xiu, P.; Xue, H.; Yao, J.; Yu, J. Glider-observed anticyclonic eddy in northern South China Sea. Aquat. Ecosyst. Health Manag. 2016, 19, 233–241. [Google Scholar] [CrossRef]
  3. Chai, F.; Johnson, K.S.; Claustre, H.; Xing, X.; Wang, Y.; Boss, E.; Riser, S.; Fennel, K.; Schofield, O.; Sutton, A. Monitoring Ocean biogeochemistry with autonomous platforms. Nat. Rev. Earth Environ. 2020, 1, 315–326. [Google Scholar] [CrossRef]
  4. AMS. Available online: https://www.automarinesys.com/ (accessed on 15 April 2022).
  5. Dominguez-Brito, A.; Valle-Fernandez, B.; Cabrera-Gamez, J.; Ramos-de-Miguel, A.; García, J.C. A-TIRMA G2: An oceanic autonomous sailboat. In Robotic Sailing 2015; Springer: Cham, Switzerland, 2016; pp. 3–13. [Google Scholar]
  6. Offshore Sensing AS. Transatlantic Crossing 2018. Available online: http://www.sailbuoy.no/news-2/64-transatlantic-crossing (accessed on 22 March 2022).
  7. Saildrone Inc. The New Gold Standard for Autonomous Systems: Saildrone Voyager Is First USV to Earn Formal Classification; Saildrone Inc.: Alameda, CA, USA, 2023. [Google Scholar]
  8. Meng, X.; Yang, Y.; Yin, S.; Wang, X. Unmanned sailboat with self-balancing rotating sail based on elastic rope: Modeling, optimization, and sea trials. Appl. Energy 2024, 363, 123045. [Google Scholar] [CrossRef]
  9. Yin, S.; Yang, Y.; Liu, B.; Meng, X. Experimental study on propulsion performance of unmanned sailboat with arc sail. Ocean Eng. 2023, 282, 115029. [Google Scholar] [CrossRef]
  10. Kuang, L.; Li, H.; Su, X.; Song, X.; Wang, Z.; Zhang, Y.; Ma, W. Effect of chord length ratio on aerodynamic performance of two-element wing sail. Ocean Eng. 2023, 287, 115946. [Google Scholar] [CrossRef]
  11. Liu, R.; Huang, C.; An, Y.; Liu, X.; Lin, Y. Research on sail Angle of Attack with Minimum Turning Diameter. Comput. Appl. Softw. 2022, 39, 76–81. [Google Scholar]
  12. Saoud, H.; Hua, M.D.; Plumet, F.; Amar, F.B. Optimal sail angle computation for an autonomous sailboat robot. In Proceedings of the 2015 54th IEEE Conference on Decision and Control (CDC), Osaka, Japan, 15–18 December 2015; pp. 807–813. [Google Scholar]
  13. Augenstein, T.; Singh, A.; Miller, J.; Pomerenk, A.; Dean, A.; Ruina, A. Using a controlled sail and tail to steer an autonomous sailboat. In Robotic Sailing 2016: Proceedings of the 9th International Robotic Sailing Conference; Springer International Publishing: Cham, Switzerland, 2017; pp. 91–103. [Google Scholar]
  14. Zhang, Y.; Shen, Z.H. Controlled area of sailing under uniform wind condition. J. Dalian Marit. Univ. 2019, 45, 19–25. [Google Scholar]
  15. Giger, L.; Wismer, S.; Boehl, S.; Büsser, G.A.; Erckens, H.; Weber, J.; Moser, P.; Schwizer, P.; Pradalier, C.; Siegwart, R. Design and construction of the autonomous sailing vessel Avalon. In Proceedings of the World Robotic Sailing Championship and International Robotic Sailing Conference; Eidgenössische Technische Hochschule Zürich: Zurich, Switzerland, 2009. [Google Scholar]
  16. Jiang, F.; Li, Y.; Gong, J. Study on the manoeuvre characteristics of a trimaran under different layouts by water-jet self-propulsion model test. Appl. Ocean Res. 2021, 108, 102550. [Google Scholar] [CrossRef]
  17. Wang, X.; Zou, Z.; Zhang, W.; Zhang, W.; Chang, H. Research on maneuverability prediction for SWATH ships. Ship Sci. Technol. 2012, 34, 83–87, 105. [Google Scholar]
  18. Wang, C.; Tong, S.; Jiang, P.; Tang, X. Numerical Simulation of ship maneuvering motion under wind flow effect. J. Dalian Marit. Univ. 2020, 46, 50–59. [Google Scholar]
  19. Tavakoli, S.; Dashtimanesh, A. A six-DOF theoretical model for steady turning maneuver of a planning hull. Ocean Eng. 2019, 189, 106328. [Google Scholar] [CrossRef]
  20. Wu, G.; Zhao, M.; Cong, Y.; Hu, Z.; Li, G. Algorithm of Berthing and Maneuvering for Catamaran Unmanned Surface Vehicle Based on Ship Maneuverability. J. Mar. Sci. Eng. 2021, 9, 289. [Google Scholar] [CrossRef]
  21. Jeon, M.; Lee, D.; Yoon, H. Development of 6-DOF Equations of Motion for a Planning Boat Based on the Results of Sea Trial Tests. J. Navig. Port Res. 2016, 40, 231–239. [Google Scholar] [CrossRef]
  22. Wang, D.; Sun, M.; Liu, J.; Sun, C. Fixed-Time Predictor-Based Path Following Control of Unmanned Surface Vehicles. Control Theory Appl. 2022, 39, 1845–1853. [Google Scholar]
  23. Rabitz, H.; Aliş, Ö.F. General foundations of high-dimensional model representations. J. Math. Chem. 1999, 25, 197–233. [Google Scholar] [CrossRef]
Figure 1. The configuration of the Petrel Sail unmanned sailboat.
Jmse 12 01374 g001
Figure 2. A dynamic model of the unmanned sailboat.
Jmse 12 01374 g002
Figure 3. The three-layer control structure for the unmanned sailboat.
Jmse 12 01374 g003
Figure 4. A navigation diagram generated with the line-of-sight method.
Jmse 12 01374 g004
Figure 5. The turning motion of the unmanned sailboat.
Jmse 12 01374 g005
Figure 6. A schematic of the simulation model for the unmanned sailboat.
Jmse 12 01374 g006
Figure 7. The simulation results for the turning motion in the hydrostatic condition with the second set of data (rudder angle 33.231°, wind speed 7.646 m/s, and wind angle 109.383°).
Jmse 12 01374 g007
Figure 8. The effects of the rudder angle and wind angle on turning performance in the hydrostatic condition. (a) The influence of rudder angle δR and wind angle φw on the maximum advance distance Admax; (b) The influence of rudder angle δR and wind angle φw on the maximum transverse distance Trmax.
Jmse 12 01374 g008
Figure 9. Simulation trajectory of gybing under flow interference (rudder angle 33.231°, wind speed 4.354 m/s, and wind angle 10.617°).
Jmse 12 01374 g009
Figure 10. Variation in heading angle with time for different rudder angles in gybing (Wind speed: 6 m/s, Wind angle: 60°).
Jmse 12 01374 g010
Figure 11. Effect of flow velocity on the turning characteristics under flow disturbance in tacking (wind speed 6 m/s, wind angle 60°, and rudder angle 35°). (a) The maximum advance distance AdC varies with flow velocity vC and flow angle φC; (b) The maximum transfer distance TrC varies with flow velocity vC and flow angle φC.
Jmse 12 01374 g011
Figure 12. The effect of wind speed on the turning characteristics under flow disturbance in tacking (flow velocity 0.2 m/s, wind angle 60°, and rudder angle 35°). (a) The variation in AdC with wind speed vw and flow angle φC; (b) The variation in TrC with wind speed vw and flow angle φC.
Jmse 12 01374 g012
Figure 13. Petrel Sail unmanned sailboat.
Jmse 12 01374 g013
Figure 14. The harbor pool of Qingdao National Deep-Sea Base, China.
Jmse 12 01374 g014
Figure 15. The sailing trajectories of the unmanned sailboat in the harbor pool test. (a) Trial 1; (b) Trial 2; (c) Trial 3; (d) Trial 4.
Jmse 12 01374 g015
Table 1. The main parameters of the Petrel Sail unmanned sailboat.
ConfigurationParameterValue
HullLength (mm)3100
Width (mm)650
Aspect ratio1.5
Draft (mm)250
Heel angle (deg)40
SailHeight (mm)1400
Width (mm)600
Area (m2)0.84
Weight (kg)8
KeelLength (mm)750
Width (mm)250
Area (m2)0.1875
Weight (kg)15
Table 2. The main characteristic parameters of the turning motion.
ParameterDefinition
Advance AdThe longitudinal distance traveled from the initiation of steering to the 90° change in course
Max. advance AdmaxThe maximum longitudinal distance traveled during the turning motion
Tactical diameter DTThe lateral distance traveled when the initial heading changes by 180°
Transfer TrThe lateral distance traveled from the initiation of steering to the 90° change in course
Max. transfer TrmaxThe maximum lateral distance traveled during the turning motion
Table 3. The orthogonal test results for the turning motion of the unmanned sailboat in tacking and gybing.
No.Admax (m)Trmax (m)No.Admax (m)Trmax (m)
TackingGybingTackingGybingTackingGybingTackingGybing
111.18.213.318.999.99.616.518.4
21010.218.719109.28.230.635
310.78.614.618.91112.31219.922.7
41010.118.619.11212.311.820.322.7
518.713.322.131.11313.29.516.322.6
616.416.731.432.11412.112.122.922.9
717.914.123.931.41512.311.920.122.6
816.616.631.532.1
Table 4. Regression results.
Evaluation IndexDifference SourceSum of SquaresDegree of FreedomMean SquareFSignificanceR2
Tacking
Admax
Regression152.983350.994414.118**0.991
Residual1.355110.123
Sum154.33714
Gybing
Admax
Regression130.098432.524158.539**0.984
Residual2.052100.205
Sum132.14914
Tacking
Trmax
Regression472.9884118.247246.529**0.990
Residual4.796100.480
Sum477.78414
Gybing
Trmax
Regression491.4113163.8042089.084**0.999
Residual0.863110.078
Sum492.27314
**: This indicates that the statistical test results corresponding to the effect or factor are very reliable.
Table 5. Different trial schemes.
NumberRelative Wind Angle (deg)Rudder Angle (deg)Wind Speed (m/s)
Trial 1180203.9
Trial 2120204.2
Trial 3150304.5
Trial 490304.1
Table 6. Results of turning motion test.
NumberBoat Speed (m/s)Admax (m)Deviation (%)Trmax (m)Deviation (%)
Trial 11.012.514.824.113.5
Trial 21.012.810.425.36.6
Trial 31.011.27.119.96.2
Trial 41.011.52.717.210.1
Disclaimer/Publisher’s Note: The statements, opinions and data contained in all publications are solely those of the individual author(s) and contributor(s) and not of MDPI and/or the editor(s). MDPI and/or the editor(s) disclaim responsibility for any injury to people or property resulting from any ideas, methods, instructions or products referred to in the content.

