Article

Spatio-Temporal Compressive Behaviors of River Pebble Concrete and Sea Pebble Concrete in Island Offshore Engineering

College of Ocean Science and Engineering, Shanghai Maritime University, Shanghai 201306, China
*
Author to whom correspondence should be addressed.
J. Mar. Sci. Eng. 2024, 12(8), 1395; https://doi.org/10.3390/jmse12081395
Submission received: 21 July 2024 / Revised: 9 August 2024 / Accepted: 12 August 2024 / Published: 14 August 2024
(This article belongs to the Special Issue Advance in Marine Geotechnical Engineering)

Abstract

:
Obtaining river or sea pebbles from local resources for concrete production is considered an economical and eco-friendly alternative, particularly in marine and island-offshore engineering. However, the resulting changes in the mechanical properties of these concrete have attracted attention. This study investigates the compressive behavior of concretes where river or sea pebbles partially (i.e., 33% and 67%) or fully (i.e., 100%) replace traditional gravel as coarse aggregate, using a noncontact full-field deformation measurement system based on digital image correlation (DIC). Compared to the traditional gravel concrete (GC), compressive strengths of the river pebble concrete (RPC) at constitution rates of 33%, 67%, and 100% decreased by 6.5%, 29.8%, and 38.9% while those values of the sea pebble concrete (SPC) decreased by 13.1%, 32.7%, and 44.3%, respectively. Meanwhile, SPC exhibited slightly lower compressive strength than RPC. The peak strains of both SPC and RPC decreased at lower substitution rates, although their stress-strain curves resembled those of GC. In contrast, RPC and SPC at higher substitution rates exhibited a noticeable stage of load hardening. Full-field deformation data and interfacial characteristics indicated that the compressive failure modes of both RPC and SPC showed significant interfacial slipping between pebbles and mortar with increasing coarse aggregate substitution rates. In comparison, fractures in coarse aggregate and mortar were observed in damaged GC. The study demonstrated that the spatio-temporal compressive deformation response and failure modes of SPC and RPC were distinct due to the introduction of pebbles, providing insights for engineering applications of river/sea pebble concrete in practical offshore or island construction projects.

1. Introduction

In island reef construction, the transportation of river sand, gravel, and freshwater from the mainland significantly increases project costs and fails to guarantee adherence to construction schedules [1,2]. Additionally, the extensive extraction of gravel as a raw material for coarse aggregate in concrete not only degrades natural ecological environments but also imposes significant financial burdens on engineering projects due to rising costs [3,4,5]. Emerging maritime and island reef constructions have increasingly explored marine resources like seawater, sea sand, sea pebbles, and coral aggregates for concrete engineering purposes [6,7]. Specifically, sea pebbles are used as a coarse aggregate (referred to hereafter as sea pebble concrete, SPC) due to their accessibility and abundant reserves. Over the years, the use of pebbles as a coarse aggregate in island reef construction engineering has proven feasible [8,9]. Because of its superior performance in fluidity, self-compaction, and pumpability, hydraulic structure codes recommend using pebbles as a coarse aggregate in large-scale concrete structures like infilled piles and foundations [10,11,12]. In fact, due to the influence of the shape and surface texture of aggregate on the interlocking between mortar and aggregates, the mechanical properties of these concretes with pebbles as the coarse aggregate (hereinafter referred to as pebble concrete, PC) cannot be readily inferred based on knowledge of those traditional concretes using gravel as the coarse aggregate (hereinafter referred to as gravel concrete, GC), which limits their further applications [13,14].
Current investigations into PC are mainly on river pebbles (hereinafter referred to as river pebble concrete, RPC). The shape, roughness, surface chemical composition, and mineral composition of pebbles differ significantly, resulting in notable changes in the interfacial transition zone (ITZ) and consequently distinct compressive responses [15]. Particularly, RPC demonstrates lower compressive strength but greater resistance to crack expansion under compressive loads in comparison with GC, underscoring the significant influence of local deformation characteristics and the weaker ITZ between smoother pebbles and mortar on its compressive performance [16]. On the other hand, inorganic salt ions such as chloride and sulfate concentrate diffuse into sea pebbles, potentially affecting pore content, internal stresses, and compressive strength, thereby altering the bonding properties at the ITZ in SPC [7,17,18]. Under compressive loads, the ITZ between coarse aggregates and mortar matrix is typically the weakest point, where local deformation predominantly leads to concrete failure. In practice, in order to enhance the compressive strength of PC, researchers are exploring partial or complete substitution of traditional gravel with pebbles as the coarse aggregate in concrete, which complicates their compressive deformation behaviors [9,19].
Despite growing recognition of the mechanical behaviors of PC relating to local deformation and crack development, accurately pinpointing local damage and quantifying deformation in these regions remains challenging. Traditionally, concrete compressive strength is evaluated through compressive strength tests and stress-strain curves under load conditions, providing an overall estimation of deformation in tested concrete samples [16,20,21]. Furthermore, qualitative analysis of damaged images of concrete cubes helps in assessing crack propagation paths [22,23,24]. However, these traditional methods offer only general estimations and are unable to locate those randomly occurring damaged areas or provide detailed insights into local deformation and crack propagation. In recent decades, a noncontact optical methodology named the digital image correlation (DIC) technique has been introduced to track the complicated and unpredictable deformation in the concrete [25,26,27]. By capturing the digital speckle image sequences on the concrete surface, the full-field displacement and strain data could be calculated by comparing the speckle patterns decorated on the concrete based on some image registration algorithms [26,27,28]. In this way, the local deformation data of any point on the tested concrete can be determined, especially in those regions near the ITZ [29,30]. Based on the DIC technique, the shear cracking and crack slipping could be quantitatively tracked based on the calculated displacement and strain fields during the whole loading process, with which the damage behavior and failure mechanism of the concretes were further analyzed [31].
In this paper, a full-field compressive deformation measurement system for RPC/SPC was established. The full-field displacement and strain of these concrete were evaluated, which were produced by partially or completely replacing traditional gravel coarse aggregates with river/sea pebbles at series substitution rates. On this basis, a quantitative analysis is conducted to examine the local characteristics and spatial distribution of deformation and cracks occurring in RPC/SPC under compressive load conditions. Furthermore, peak strain and stress on the concrete cubes as well as the interfacial characteristics of RPC/SPC at series substitution rates are evaluated and compared. This allows us to investigate the failure modes and potential failure mechanisms of different kinds of RPC/SPC employed in practical island reef constructions.

2. Materials and Methods

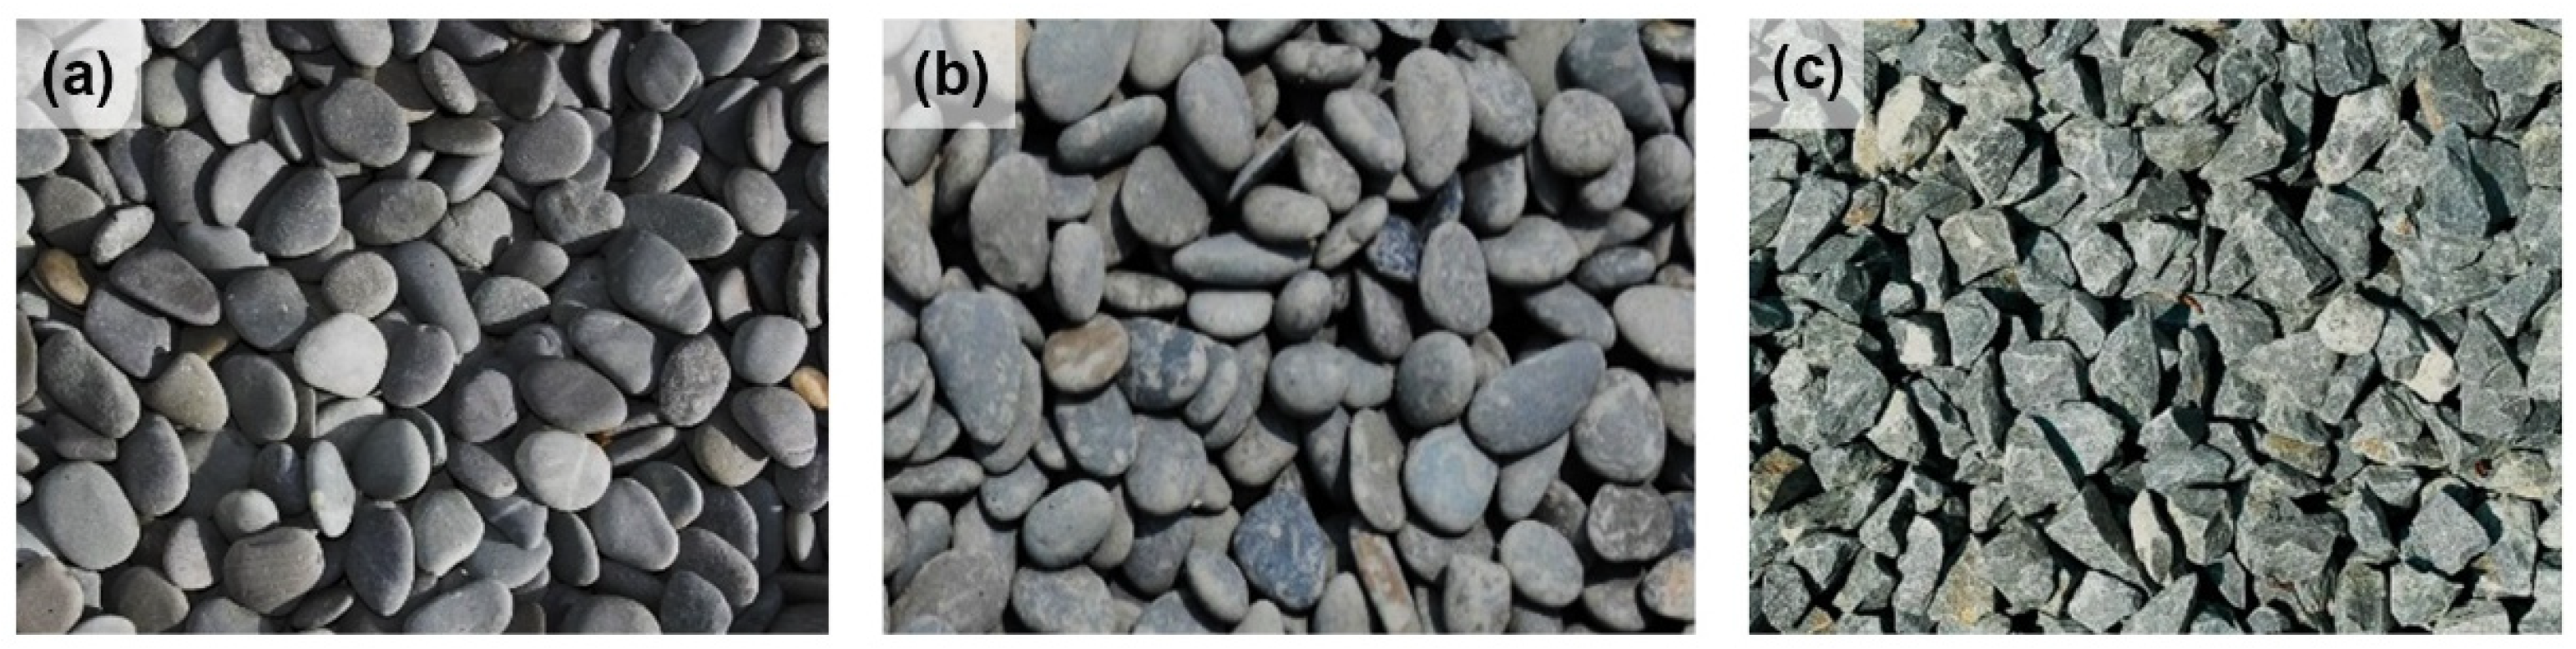
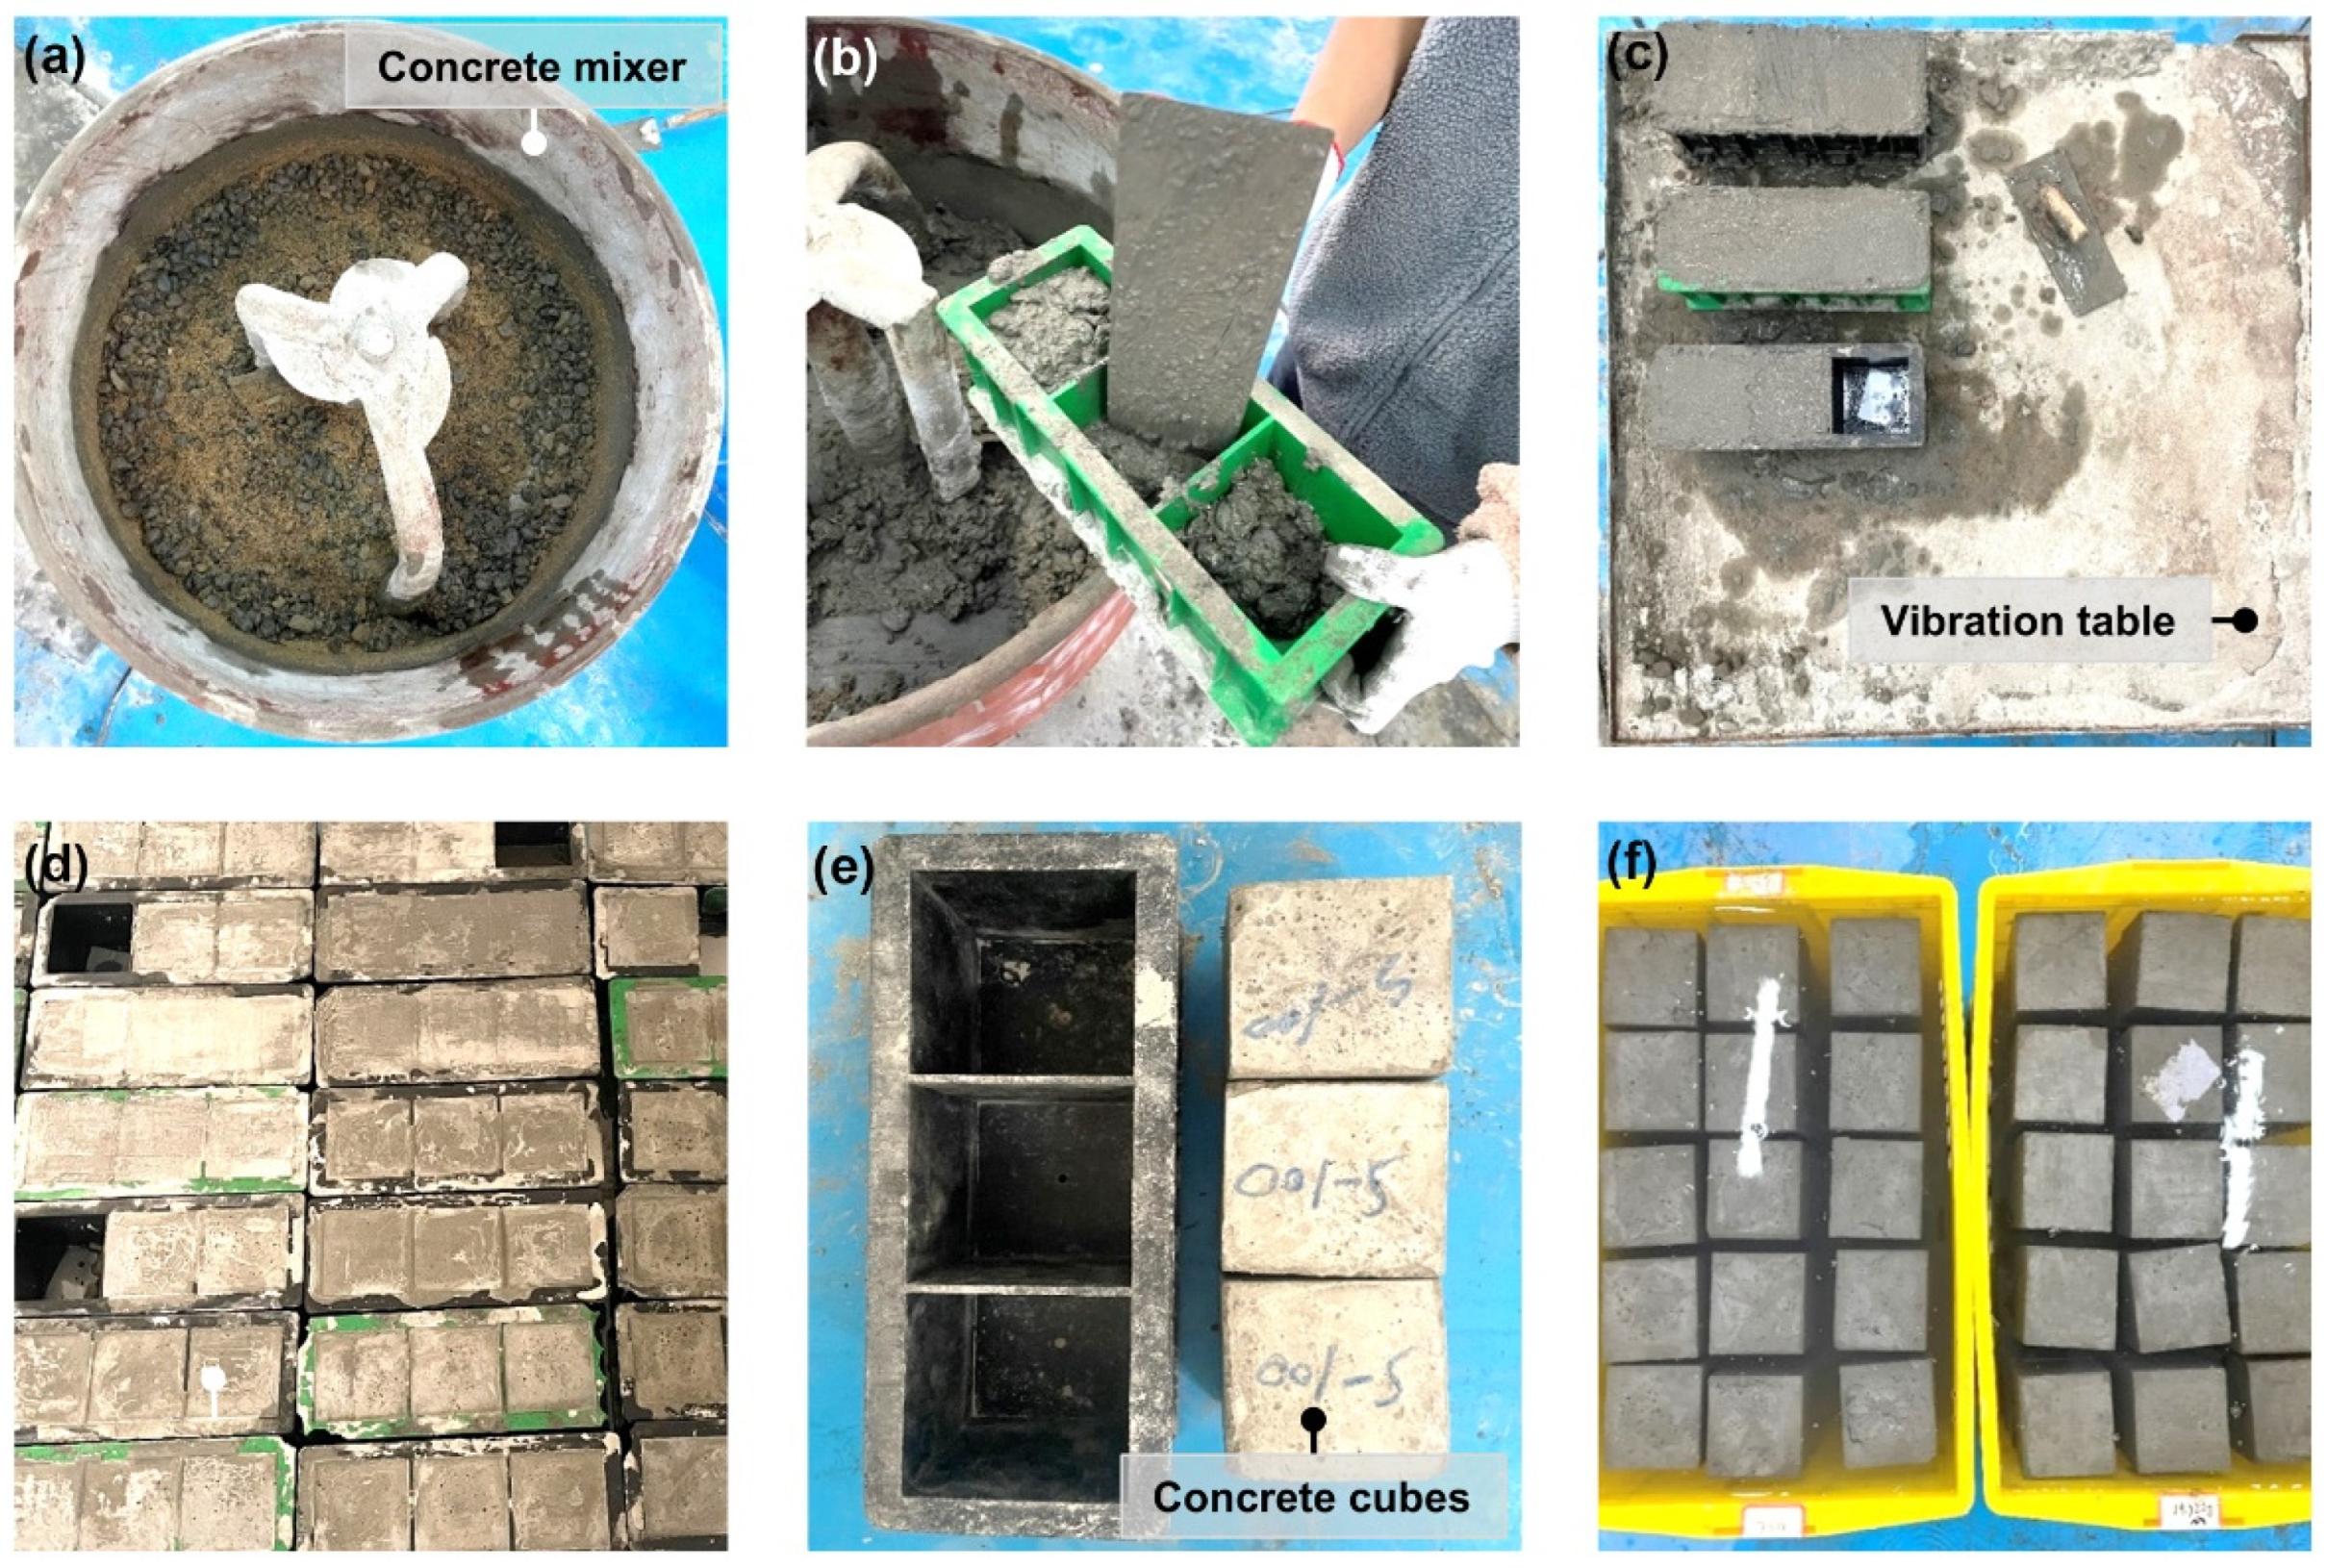
2.1. Raw Materials and Concrete Specimen Preparation

As illustrated in Figure 1, river pebble, sea pebble, and gravel are used as the raw materials of coarse aggregates to make concrete, and their physical parameters were characterized and listed in Table 1 [32,33]. Gravel is irregular and has a rough surface while both river pebble and sea pebble are approximately rounded and have smooth surfaces. In this study, six sets of tested RPC/SPC specimens were prepared with a certain weight proportion of river pebbles or sea pebbles replacing gravel as the coarse aggregate, respectively. Meanwhile, GC specimens with only gravels as the coarse aggregate were prepared as the control group.
In order to study the compressive properties of RPC and SPC, seven groups of pebble concrete specimens with weight substitution rates (SR) of 33%, 67%, and 100% are, respectively, prepared and compared with the GC. It should be noted that the substitution rates were determined by some preliminary experiments. According to a series of pre-conducted experiments, the proportion of compressive strength reduction was smaller if the substitution rates of pebbles were smaller than 1/3, and the compressive strength reduction significantly increased if the pebble substitution rate exceeded 2/3. Therefore, as shown in Table 2, the mix proportion of these samples is designed according to the specification for mix proportion design of ordinary concrete in the Chinese industry standard (JGJ55-2011) [28,34]. Seven groups of concrete specimens are denoted as S(R)-0, R-33, R-67, R-100, S-33, S-67, and S-100, representing the control group and tested RPC and SPC specimen with weight substitution rates of 33%, 67%, and 100%, respectively. Here, the strength grade of these concretes is set as C40 and the water-cement ratios of GC and PC are 0.49 and 0.48. Then, the cement, river sand, gravel, pebbles, mixing water, and water-reducing agent are mixed, where the cement is PO 42.5 ordinary Portland cement (Zhejiang Portan Building Materials Technology Co., Ltd., Zhejiang China) and the river sand (fineness modulus of 2.60, density of 2.70 g/cm3) is taken the as opup fine aggregate. The gradation of the gravel is 5~25 mm while the mass ratio of pebbles with diameters of 5~10, mm:10~15 mm:15~20, and mm:20~25 mm is set as 10%:20%:65%:5%. In addition, the polycarboxylate type superplasticizer is employed as the water-reducing agent to improve the fluidity of the concrete and reduce the amount of mixing water. The same slump was designed and verified to ensure the comparability between seven groups of concrete samples.
As seen in Figure 2, the concretes were prepared by fully stirring and pounding materials in a mold sized of 100 mm × 100 mm × 100 mm. Then, the mixture is vibrated thoroughly by a vibrating table. After standing in a room maintained at 20 °C and about 95% relative humidity for 24 h, the cube specimens are demolded and then cured in fresh water at a room temperature of 20 °C for 28 days. In this experiment, ten specimens are prepared for each tested case, and the front surface is decorated with speckle patterns for the DIC experiment. The upper, lower, and front sides of the cube concrete are polished with sandpaper to guarantee the smoothness of the tested surface. After cleaning the dust on the surface, matte black paint is first sprayed on the front surface of the cube specimen and the white matte paint is then carefully sprayed as randomly distributed speckles on the black background.

2.2. Experiment and Methods

The compressive deformation measurement experiment of the concrete specimens is performed on the established noncontact DIC platform based on computer vision and mathematical computation, which is shown in Figure 3. As seen in Figure 3a, the compressive load is uniformly applied on the upper surface of the tested concrete cube. A CCD camera is positioned in front of the tested specimen with the direction of the optical axis perpendicular to the specimen surface. Digital speckle image sequences are continuously recorded during the loading process, which can be used to find the most similar region in the deformed speckle image (also called target image) for those selected subsets in the undeformed image (also called reference image) based on the DIC registration algorithm, which is shown in Figure 3b. In Figure 3c, the experimental setup of the compressive test is established. The compressive tests are developed according to the standard for test methods of mechanical properties on ordinary concrete in the Chinese industry standard (GB/T 50081-2002) [29,35]. The compression testing machine (SF-YAW-3000D, Shanghai Hualong Test Instrument Co., LTD, Shanghai, China)is adopted to apply the uniformly distributed compressive load on the cube concrete with a loading rate of 0.8 MPa/s. The imaging apparatus is equipped by placing the industrial CCD camera (Pointgrey®, GS3-PGE-91S6) with a resolution of 3376 × 2704 pixels coupled with a lens (Tokina® KCM-1216UMP5, 12 mm, F1.6–22, both from Shanghai Wuling photoelectric Technology Co., LTD, Shanghai, China) in front of the tested specimen surface. The distance from the camera to the center of the specimen is ~300 mm while the pixel number of the specimen in the digital image is ~1300. The digital speckle images are continuously recorded with an image capturing rate of 9 frames/s. The peak loads of the concrete specimens are simultaneously recorded.
Subsequently, the well-developed DIC correlation registration algorithms are employed to quantitatively obtain the deformations of concrete specimens under compressive load conditions. The sampling spacing for each point is set as 20 pixels and the typical size of the subset is 31 × 31 pixels. Based on the ZNSSD (zero normalized sum of squared differences) correlation criterion and the Newton-Raphson iterative algorithm, the full-field deformation data can be calculated by searching “the best-matched subsets” for all the sampling points chosen on the specimen surface. Then, the strain fields are constructed by the strain window method based on the measured displacement data [19]. Correlation calculations for the time-series digital speckle images are conducted to obtain the spatial-temporal deformation information of seven groups of concrete specimens (i.e., GC, RPC, and SPC) during the compressive loading process.

3. Results and Discussion

3.1. Compressive Strength

Based on the measurement data of concrete cubes included in each test case, compressive strengths and stress-strain curves of seven groups of concretes (i.e., S(R)-0, R-33, R-67, R-100, S-33, S-67, and S-100) are illustrated in Figure 4. As seen in Figure 4a, the compressive strength values of both RPC and SPC decreased with the increase in substitution rates, which is consistent with the results of a previous study [9]. Compared with S(R)-0, the peak loads of R-33, R-67, and R-100 decreased by 6.5%, 29.8%, and 38.9% while those values of S-33, S-67, and S-100 decreased by 13.1%, 32.7%, and 44.3%. On one hand, it was obvious that the compressive strengths of both the RPC and SPC presented a smaller reduction at smaller substitution rate cases (i.e., R-33 and S-33) but remarkably decreased at higher substitution rates (i.e., R-67, R-100, S-67, and S-100). On the other hand, the compressive strengths of SPCs were relatively lower than those of RPCs under the same condition of pebble substitution rate, indicating a slightly lower overall compressive strength than RPCs. If the gravels were totally replaced by pebbles, the overall compressive strengths of PC were reduced by ~40%. In fact, the compressive strength of the S(R)-0, R-33, and S-33 was larger than the expected compressive strength of 40 MPa, whereas those data of R-67, R-100, S-67, and S-100 were smaller, which was different from the results in [9]. It was because the water absorption of the employed recycled aggregates in [9] was much higher than the control group; however, the parameters in this paper are almost indistinguishable (Table 1).
Correspondingly, the compressive stress-–strain curves were presented in Figure 4b. It was found that the curves of R-33 and S-33 were similar to S(R)-0 whereas those of R-67, R-100, S-67, and S-100 were significantly different. Particularly, in the linear elastic deformation stage, the curves of PCs with lower substitution rates were relatively close to GC (e.g., Oa1 or OA). With the increase of loads, these curves (i.e., S(R)-0, R-33, and S-33) reached the peak stress very quickly (e.g., AB or a1b1) before the peak stress point (e.g., A or a1). In comparison, the linear elastic deformation periods of R-67, R-100, S-67, and S-100 were relatively shorter and then maintained a long period of slower growth (i.e., load hardening stage, a2b2) before peak stress (i.e., b2). Then, in the failure stage, the descent slope of S(R)-0 (i.e., BC) in the failure stage was smaller than that of PC, implying a better ductility of GC compared with PC at all substitution rate conditions. From the viewpoint of compressive characteristics, the compressive strength of PC was closely related to the substitution rates of pebbles, and the failure stage was significantly determined by the type of coarse aggregate. It was possible that the compressive strength was associated with the crack propagation within the concrete but the concrete failure was caused by the weak bond between the aggregate and mortar. That is to say, investigations on the local deformation, crack initiation, and extension are quite necessary to clarify the distinct compressive behaviors of these newly developed PCs.

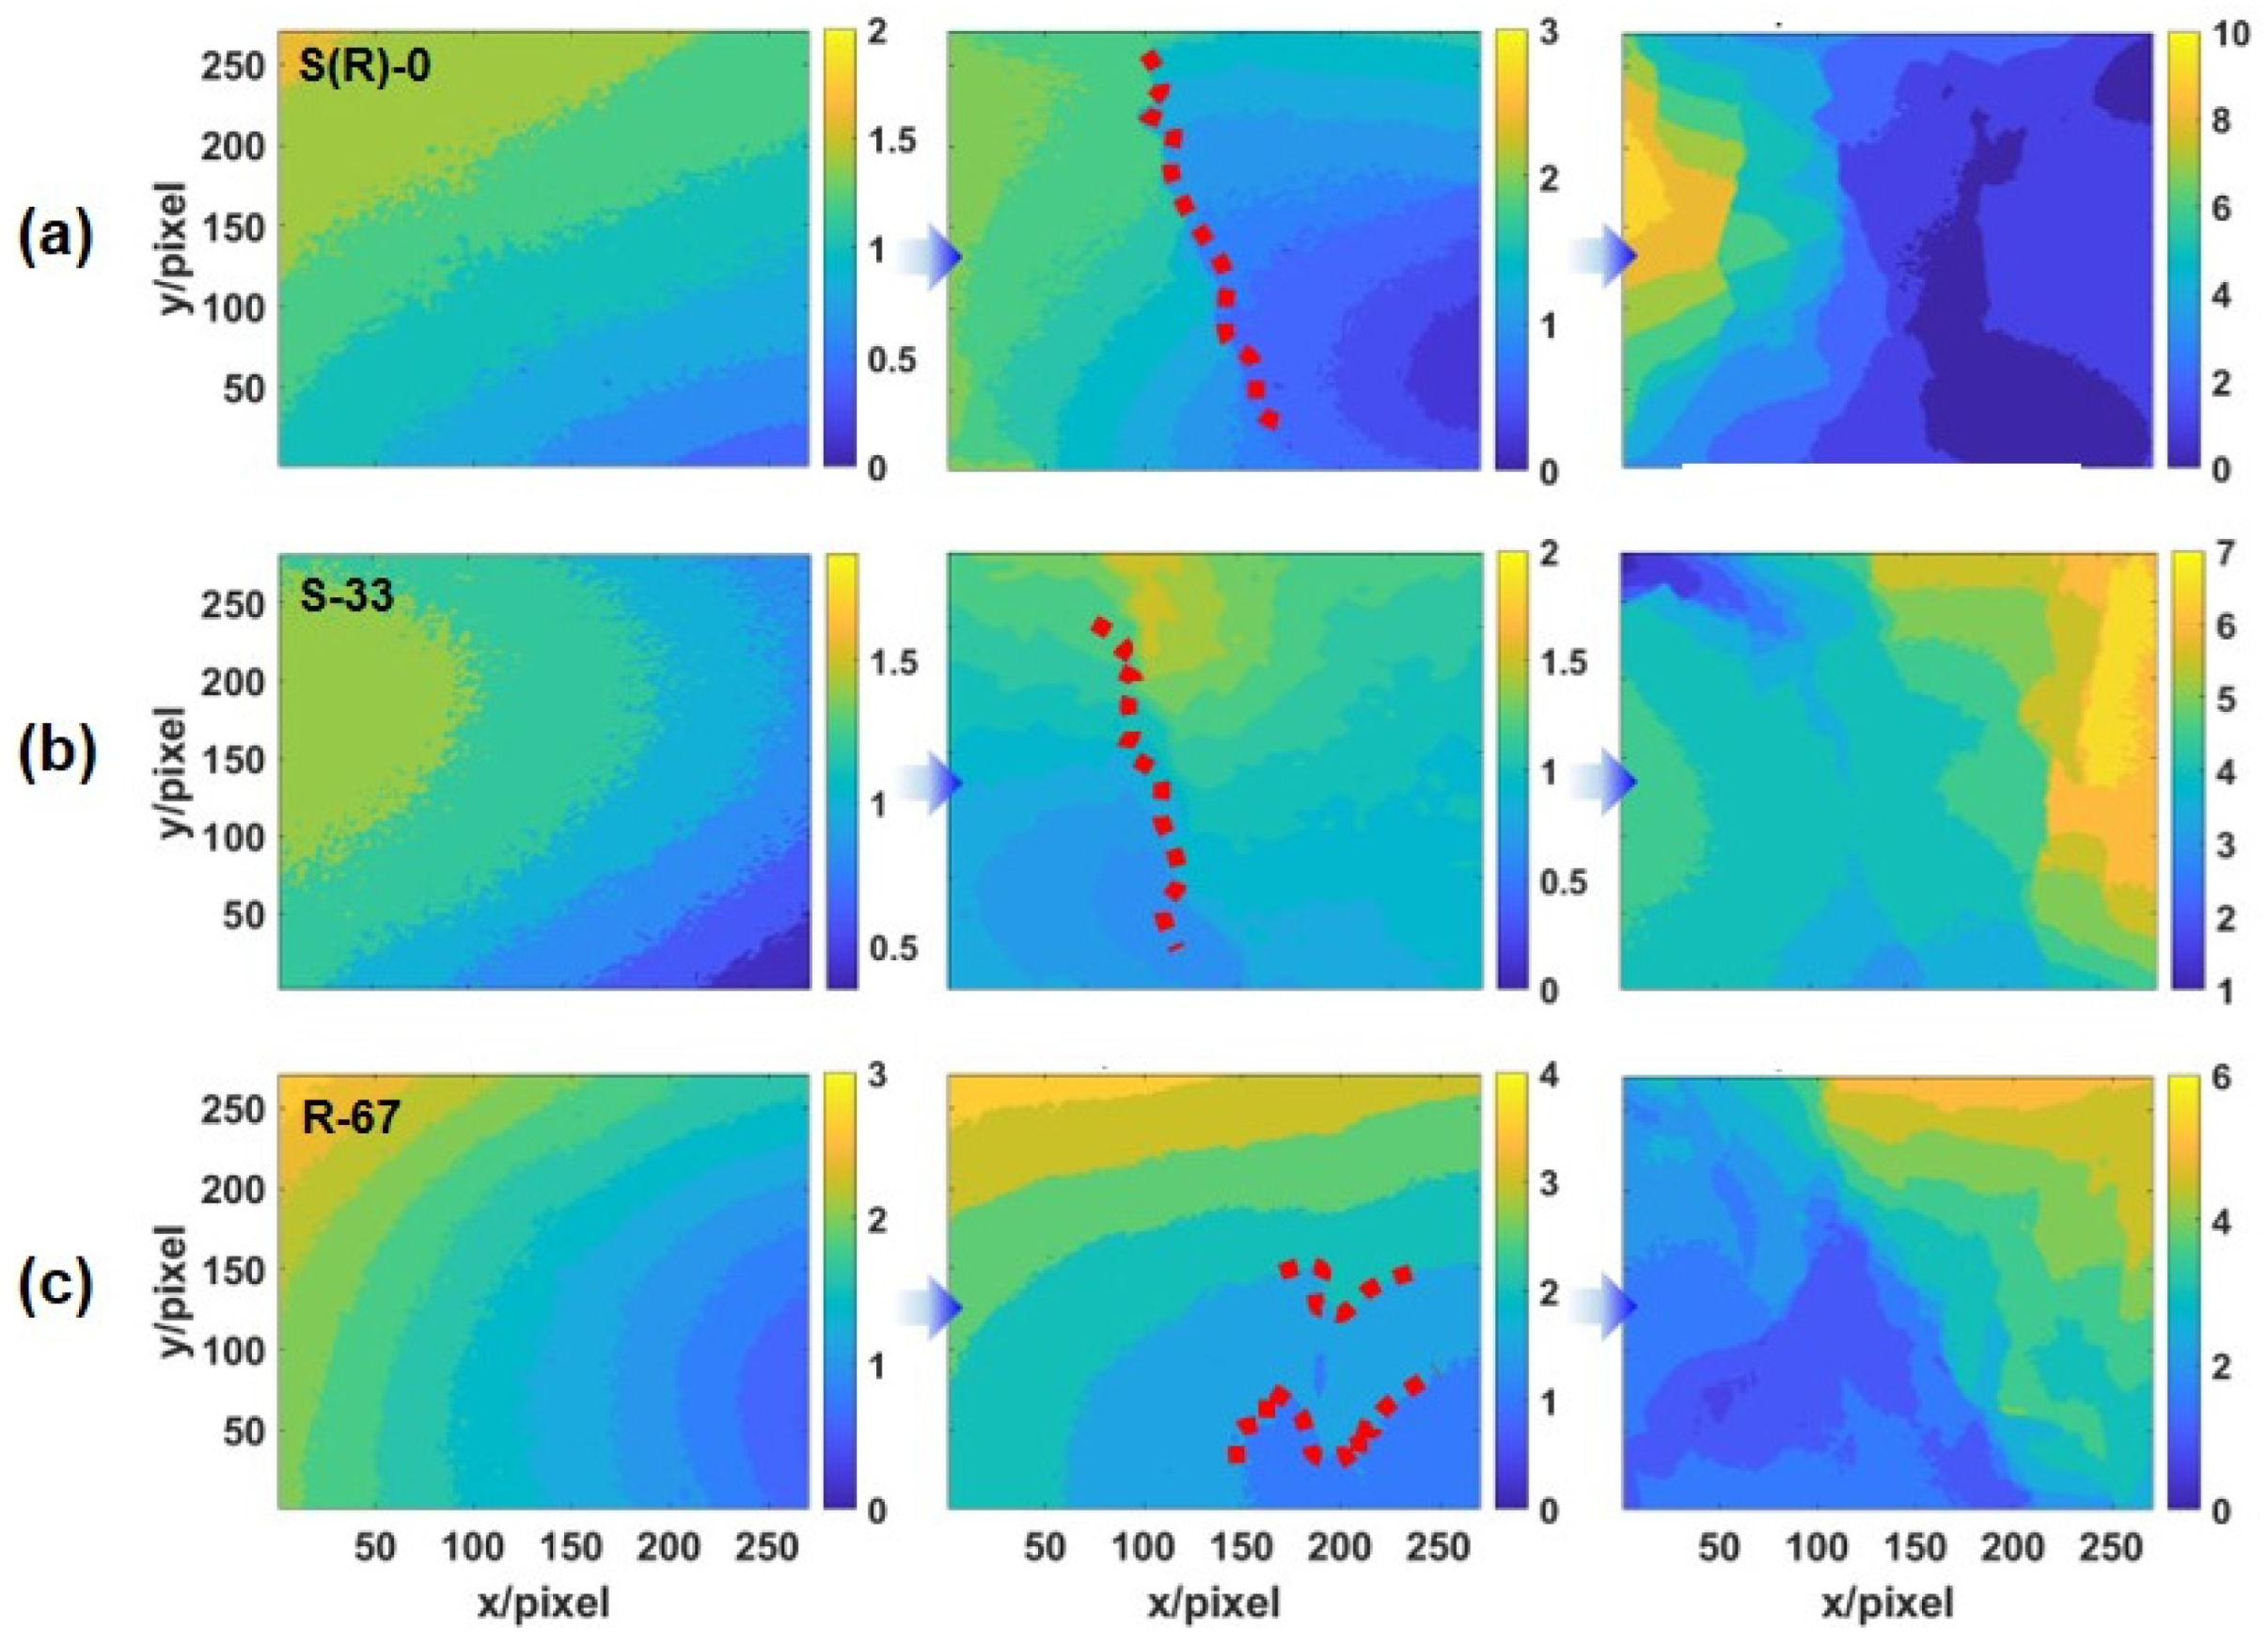
3.2. Full-Field Deformation Measurement and Crack Analysis

Displacement and strain fields of RPC and SPC at different substitution rates as well as GC were calculated to explore the mechanism of the distinct compressive failure behaviors of the concretes. According to the similar trend of the stress-strain curves between RPC and SPC at the same substitution rate as shown in Figure 4b, S(R)-0, S-33, and R-67 were selected as representatives to compare the full-field compressive deformation of RPC and SPC at different substitution rates with traditional GC. In Figure 5 and Figure 6, the spatial-temporal displacement and strain fields of S(R)-0, S-33, and R-67 are presented.

3.2.1. Displacement Fields during the Compressive Loading Process

In Figure 5, three typical loading stages were selected to present the displacement fields of S(R)-0, S-33, and R-67. Here, three stages were determined by choosing the corresponding data at ~35% of the peak loads (denoting the linear elastic deformation state), the peak load (i.e., B, b1, b2 in Figure 4b), and failure (i.e., C, c1, c2 in Figure 4b) stage. In the linear elastic deformation stage, as shown in the first column of Figure 5, the displacement fields of the three sets of concretes are distributed with uniform gradients from the top to the bottom of the cubes. With the increase of loads, the displacement fields trended to be heterogeneous, and discontinuous regions appeared (marked by the red dotted lines in Figure 5). Obviously, a sharp division throughout the cube from the top to bottom appeared in the displacement fields of S(R)-0 and S-33 while dispersive and local inhomogeneous displacement distribution were found in R-67. The local damage continuously developed until the complete failure of concrete cubes, which was illustrated in the third column of Figure 5. The full-field deformations of S(R)-0 and S-33 were similar but were significantly different from R-67, which were consistent with the stress-strain curves illustrated in Figure 4b. The displacement distribution indicated that the local displacement gradient led to distinct local deformation development in the concrete, resulting in various forms of failure modes.

3.2.2. Strain Field Analysis at Failure Stage

In order to explore the inherent cause of concrete failure, the strain fields of S(R)-0, S-33, and R-67 at the failure stage are illustrated in Figure 6, including the normal strain εx, εy in x, y directions, shear strain γxy, and volumetric strain εV at point C, c1, and c2, as illustrated in Figure 4b. Comparing the normal strains in two directions for each individual concrete specimen, it was obvious that εx dominantly contributed to the failure of the concrete. In contrast, values of εy were relatively smaller than the corresponding εx. That is to say, the larger deformation in the concrete cubes under compressive conditions is perpendicular to the loading direction for both the GC and PC.
However, it should be noted that the spatial distributions of εx for S(R)-0 and S-33 were distinct, which exactly corresponded to the remarkably different descent slopes of two kinds of concretes detected by stress-strain curves in Figure 4b. In addition, the spatial distribution of shear deformations of S-33 and R-67 were more obvious than S(R)-0. For the volumetric strain εV, the values of S(R)-0 were basically positive whereas those of S-33 and R-67 were obviously positive and negative, indicating that S(R)-0 tended to expand but compression and expansion simultaneously occurred in S-33 and R-67. Moreover, the spatial distribution of volumetric strain of both the RPC and SPC were dispersion, implying that the introduced pebbles changed the local damage in the PC even if the compressive strength was not changed a lot. This also proved that the damage in the pebble concretes was closely related to the type of the coarse aggregates.
It could be found that the strain fields could be used to track the spatial-temporal distribution of cracks in the concrete. The larger the strains, the larger the difference between neighboring regions in the concrete, which suggested the potential location of the cracks. For example, as shown in Figure 6, a single penetrated crack was observed in the gravel concrete cube according to the volumetric strain εV. In contrast, more vertical and horizontal cracks were found in S-33 and R-67. The significant difference between S-33 and R-67 lay in that the vertical cracks in S-33 still tended to be penetrated whereas no obvious penetrated cracks could be found in R-67. Particularly, the spatial distribution of cracks in R-67 was local and statistically dispersed on the concrete. Combining the compressive properties of the concretes in Section 3.1, it was determined that the generation of cracks in the concrete cube was closely related to the development of the stress–strain curves as shown in Figure 4b. Under compression load conditions, the concrete first experienced elastic deformation, and then the penetrated cracks occurred to S(R)-0 due to the strong bonding between gravel and mortar, which finally led to a typical brittle fracture in the concrete. In contrast, the relatively weaker bonding between the smooth surface of pebbles and mortar easily resulted in a local expansion of interstice in the pebbled concrete (e.g., S-67), and thus typical load hardening stages were observed in the stress-strain curves. It was possible that the failure of the PC was dominated by the relative slip between the pebbles and the mortar due to the weaker ITZ.

3.3. Influence of Pebble Substitution Rates on Compressive Deformation Behaviors

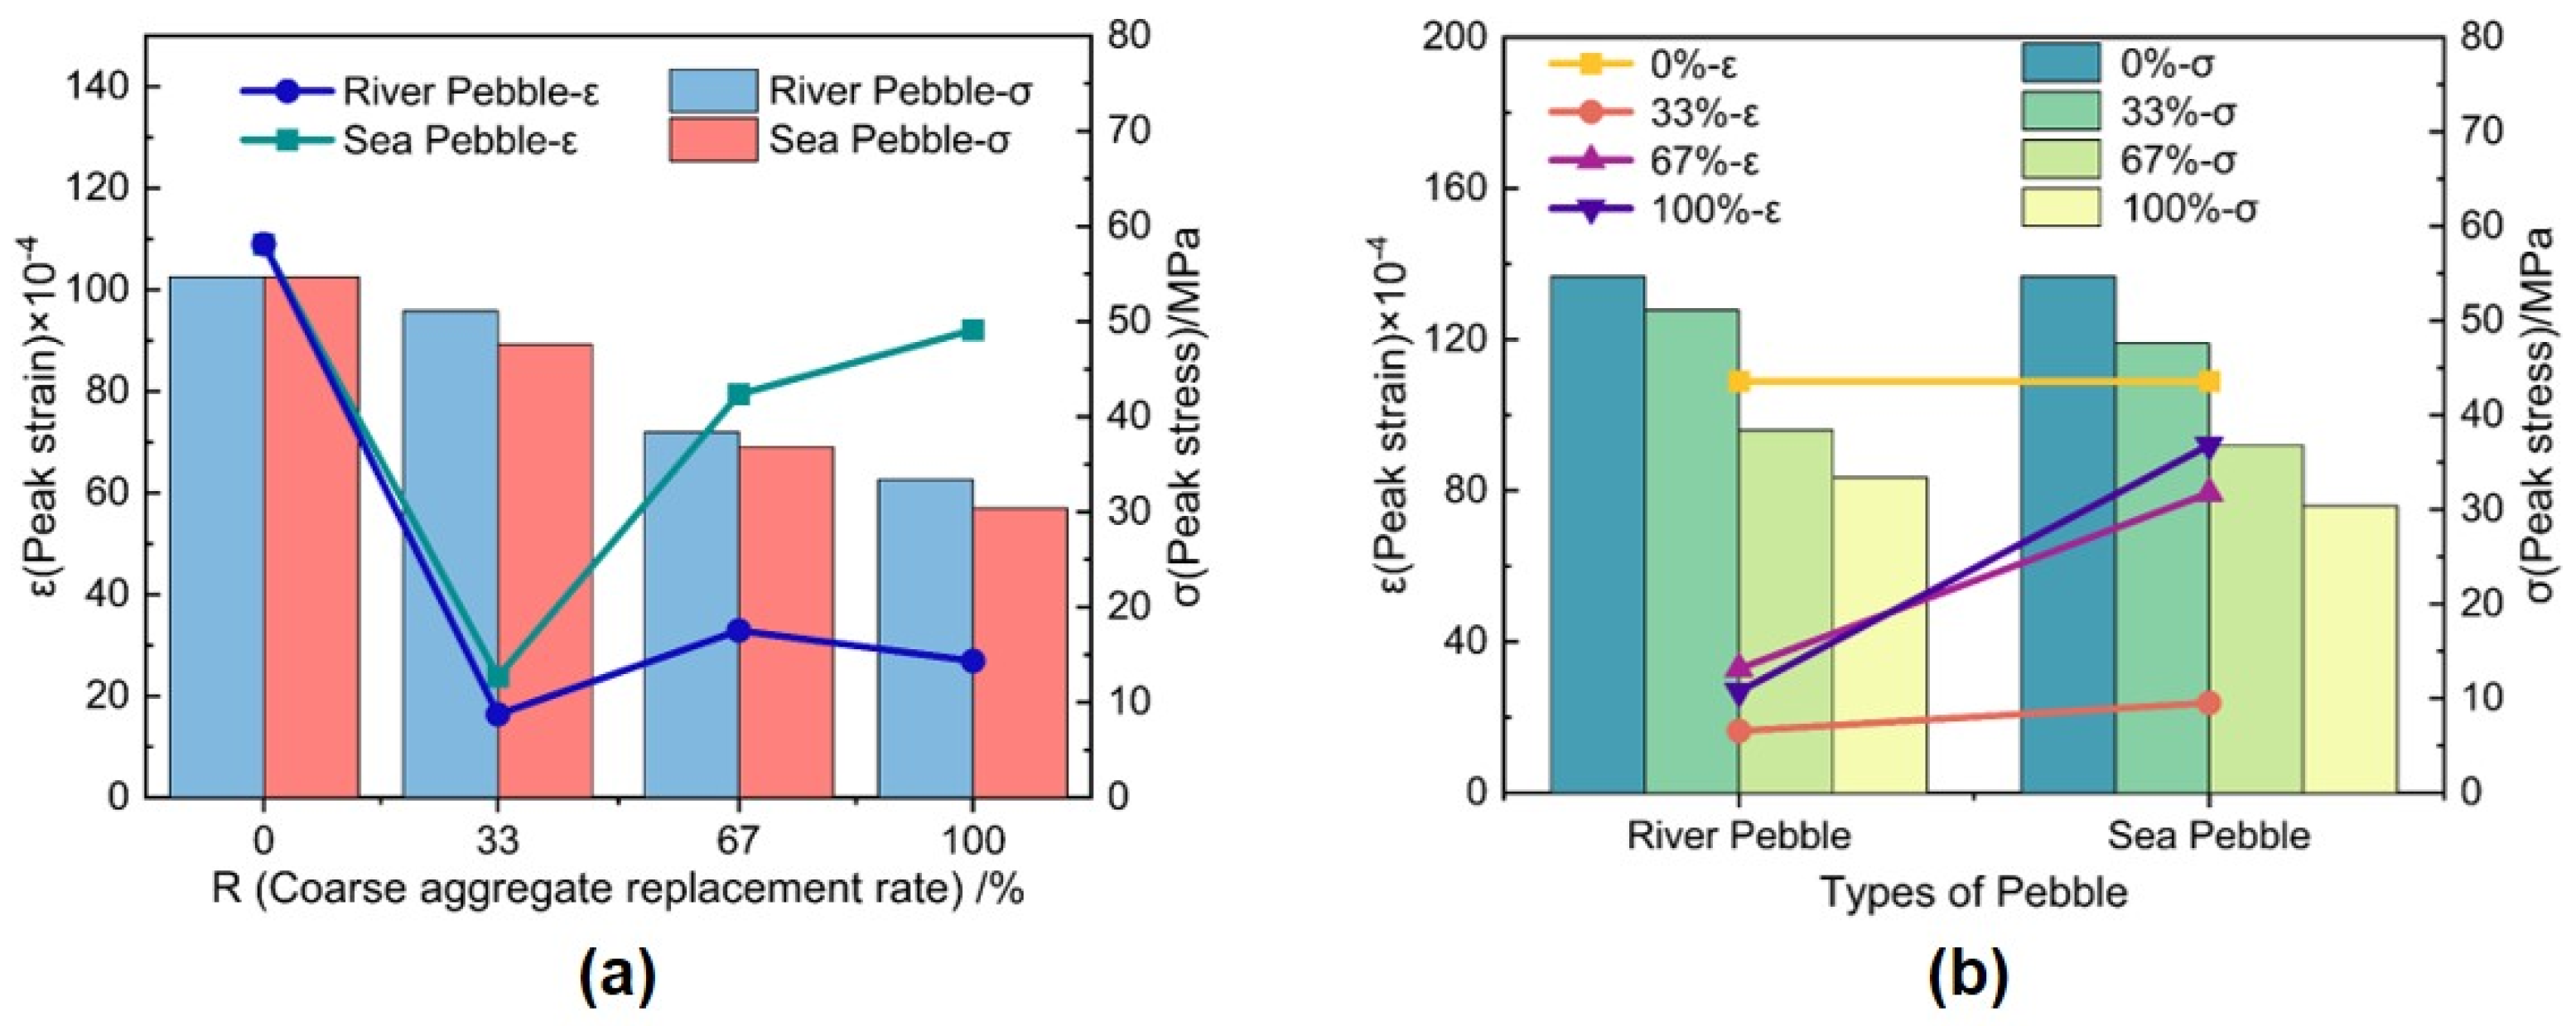
3.3.1. Peak Strain and Peak Stress

Peak values of compressive strain and stress for traditional GC and PC at various pebble substitution rates are illustrated in Figure 7. The influence of substitution rates on the peak strain and stress is shown in Figure 7a. Interestingly, the peak strain curves of both SPC and RPC initially decreased and then increased with increasing substitution rates, with the smallest peak strains observed at the 33% substitution rate. Particularly, the peak strains of RPC at pebble substitution rates of 67% and 100% were strikingly smaller than that of GC (decreasing by approximately 69.8% and 75.3%), whereas for SPC, the decrease was only ~27.2% and ~15.5%. On the other hand, the peak stress of RPC/SPC decreased with increasing substitution rates, with the values of SPC slightly lower than RPC at equivalent substitution rates. Although PCs at lower pebble substitution rates exhibited comparable compressive strength to conventional GC, there was a significant reduction in peak strain, suggesting an enhanced plastic deformation capacity of PCs. Furthermore, comparing RPC and SPC in Figure 7b, it was noted that peak strains of SPC at higher substitution rates (e.g., 67% and 100%) were larger than those of RPC, despite their peak stresses being similar at the same substitution rates. Salt ions on the surface of sea pebbles may potentially participate in the hydration process, thereby weakening the bonding between coarse aggregates and cementing materials. Combing the strain field distribution in Figure 6, it is deduced that the generation of microcracks, as well as initiation and propagation of local cracks in PC, are primarily influenced by the shape of coarse aggregates at lower substitution rates, but become more closely related to the bonding strength in the ITZ of PC as substitution rates increase.

3.3.2. Crack Distribution and Interfacial Characteristics

The strain fields of seven groups of tested cubes (i.e., S(R)-0, R-33, R-67, R-100, S-33, S-67, and S-100) at the failure stage are depicted in Figure 8 to demonstrate how river/sea pebble substitution rates influenced the spatial distribution of cracks in the PC. In Figure 8a, a penetrated crack was clearly observed running through the center of GC along the loading direction. In comparison, the crack numbers of the two kinds of PC were significantly higher than GC, where several shorter and dispersed cracks were randomly distributed in both RPC and SPC. As pebble substitution rates increased, cracks appeared to transition from vertical penetrative to local and dispersed patterns. The crack numbers increased but the length shortened, implying obvious local deformation and crack propagation characteristics in PCs. Particularly, both a dominant penetrated crack and dispersed local cracks were observed in both S-33 and R-33, potentially explaining their comparable compressive strength but significantly smaller peak stress compared to S(R)-0. Subsequently, noticeable penetrated cracks gradually diminished with increasing pebble substitution rates, significantly reducing the compressive strength of RPC/SPC. Considering Figure 6 and Figure 7, it is noteworthy that strains in SPC were relatively larger than those in RPC at equivalent substitution rates, particularly at 67% and 100%. In the strain fields depicted in Figure 8c,d,f,g, RPC exhibited generally more cracks compared to SPC at equivalent pebble substitution rates, ranging from 33% to 100%. The interaction of cementing materials with seawater during the curing process of SPC is inferred to have reduced its ductility under compressive loading conditions [1].
Figure 9 displays images of damaged concrete cubes showing interfacial views of S(R)-0, S-33, R-67, and S-100 to illustrate failure details in the concretes. Two types of damage were defined and labeled as aggregate damage and interfacial damage, respectively. Aggregate damage primarily resulted from the fracture of coarse aggregate (labeled as green dashed regions), while interfacial damage occurred due to slip movements between the pebble aggregate and cementing material (labeled as cyan-dotted ovals). Additionally, cracks generated in the concrete cubes were labeled with dotted yellow lines.
Accordingly, one might observe that damages in GC (i.e., S(R)-0) were mainly caused by gravel fracture, with cracks randomly distributed throughout the concrete cube, as shown in Figure 9a. In comparison, the interfacial damage began to appear around the pebble surface of S-33, which could be seen by some yellow dotted lines in Figure 9b. As the pebble substitution rate increased, it appeared that failure in the pebble concrete cubes tended to transition to interfacial damage, depicted in Figure 9c,d. In Figure 9d, damage primarily occurred at the pebble interfaces, with yellow dotted lines indicating gaps between pebbles and mortar, while cyan-dotted ovals showed traces of detached pebbles.
Combining the crack distribution in Figure 8 with Figure 9a, it is evident that the crack penetration observed in GC was closely associated with aggregate and mortar damage. In Figure 9b–d, randomly distributed cracks in RPC/SPC resulted from pebble detachment due to relative motion between pebbles and cementing materials. Essentially, the weaker bonding strength between the smoother surface of pebbles and neighboring cementing materials, compared to irregular gravel, makes the regions between pebbles and cementing materials the weakest in the concrete, eventually leading to interfacial damage in pebble concretes. As the pebble substitution rate increased, weaker bonding between pebbles and cementing materials increasingly controlled crack propagation and eventually influenced concrete failure modes.

3.3.3. Compressive Failure Mode

Based on the analysis of crack distribution and interfacial characteristics, diagrams illustrating three possible failure modes in the concrete are summarized in Figure 10. In this study, the failure modes of the concretes were defined as coarse aggregate fracture, pebble interfacial slipping, and mortar fracture. As shown in Figure 10a, coarse aggregate fracture was frequently observed when there was stronger bonding between the rough surface of coarse aggregate and the mortar matrix. In contrast, the weaker bonding strength between the smoother pebble and the mortar matrix facilitated the development of microcracks into macrocracks at the ITZ, illustrated as pebble interfacial slipping in Figure 10b. In fact, mortar fracture between aggregates could be observed simultaneously with either coarse aggregate damage or pebble slip fracture, as illustrated in Figure 10c.
In this sense, the failure modes of the tested concrete are summarized in Figure 10d. For GC, the bonding strength between the irregular and tough surface and the mortar matrix was stronger, resulting in failure typically as coarse aggregate and mortar fracture. If a smaller portion of gravel was replaced by river/sea pebbles (e.g., R-33 and S-33), pebble interfacial slipping would gradually occur. However, with a higher percentage of gravel, the gravel and mortar fracture remained the dominant failure mode in the concrete. Therefore, the compressive strength was only slightly reduced, but this inherently affected the strain distribution and significantly reduced the peak strain. As pebble substitution rates increased in RPC/SPC, their failure mode shifted to pebble interfacial slipping, where pebbles detached from the mortar at the ITZ. Consequently, local cracks were generated at the ITZ and distributed randomly in the concrete, consistent with the shorter and dispersed cracks observed in Figure 6 and Figure 9. Consequently, it can be concluded that introducing pebbles into the concrete led to a transition in failure mode from coarse aggregate and mortar fracture to pebble interfacial slipping with increasing pebble substitution rates in both RPC and SPC. By comparison, the distinct bonding strengths between different types of pebbles and their neighboring mortar matrix led to different scales of pebble slipping, thereby influencing the distribution and development of local deformation and cracks in the concrete.
Therefore, if the compressive strength is the main consideration, both RPC and SPC at lower substitution rates can be employed to replace GC to some extent. However, it is important to note that the local deformation and failure modes of PC at higher pebble substitution rates are distinct, which will indeed influence the stability and safety of construction in practical engineering applications. It is recommended to apply these PCs to some non-bearing structures. Specifically, it was demonstrated that the compressive strength of SPC was similar to RPC, but the peak strain and deformation characteristics differed slightly. These investigations into RPC/SPC pave the way for their use as alternative solutions in offshore or island engineering projects.

4. Conclusions

The compressive behaviors of two types of pebble concrete, where river/sea pebbles partially or fully replaced traditional gravels as the coarse aggregate, were quantitatively evaluated using a noncontact full-field deformation measurement system. The compressive strength, displacement, and strain fields, as well as cracks in the tested concrete cubes (i.e., S(R)-0, R-33, R-67, R-100, S-33, S-67, and S-100), were thoroughly investigated. From this analysis, the following conclusions can be drawn:
(1)
The compressive strength and peak stress of the RPC/SPC generally decreased with increasing pebble substitution rates compared to traditional GC. Particularly, peak strains in both RPC and SPC initially decreased and then increased with higher pebble substitution rates.
(2)
The elastic deformation stage in the stress-strain curves of both RPC and SPC at lower pebble substitution rates (i.e., R-33 and S-33) was similar to that of GC, but the failure stages were steeper. However, obvious load-hardening stages were observed in the stress-strain curves of RPC and SPC at higher substitution rates (i.e., R-67, R-100, S-67, and S-100).
(3)
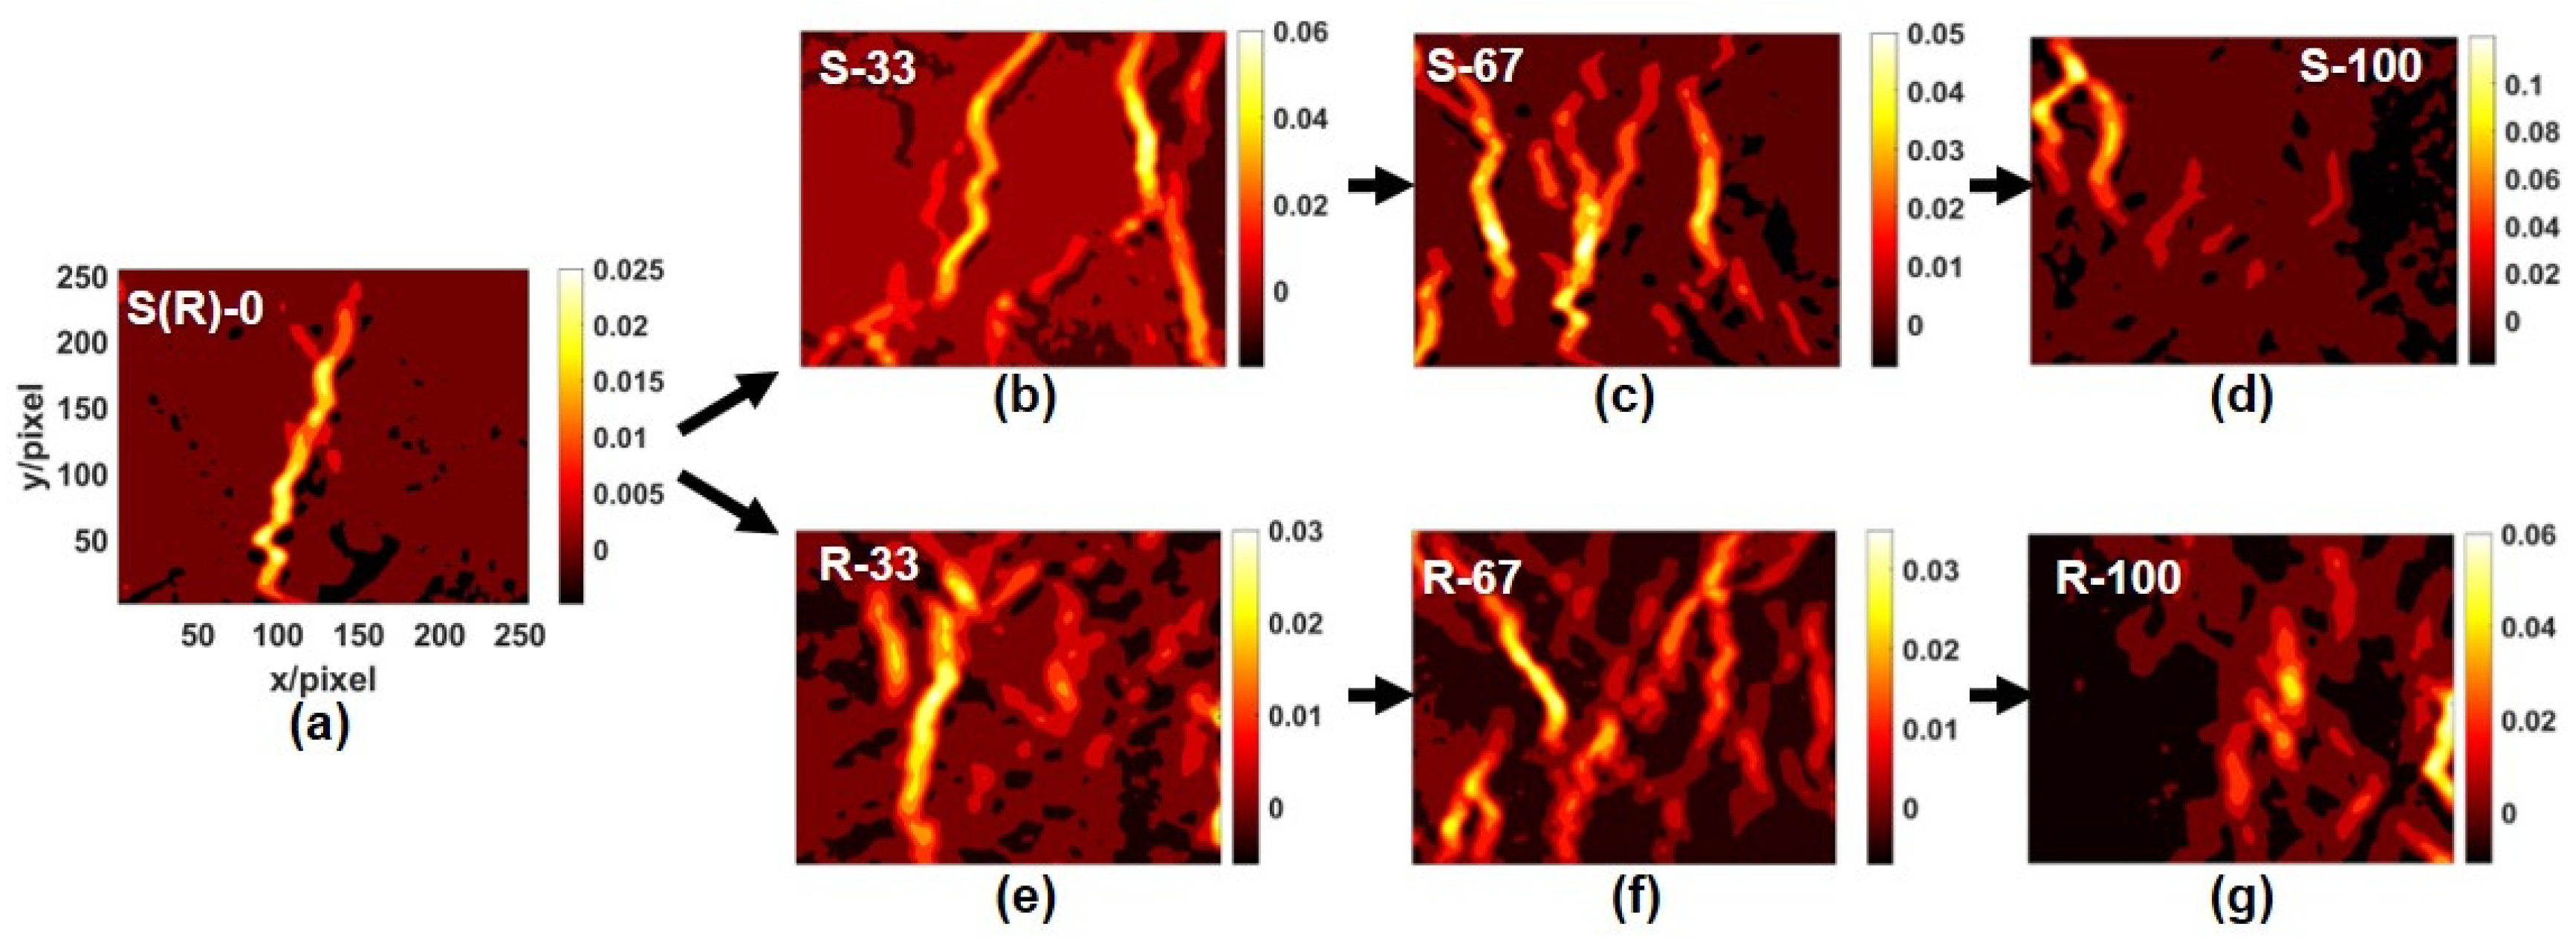
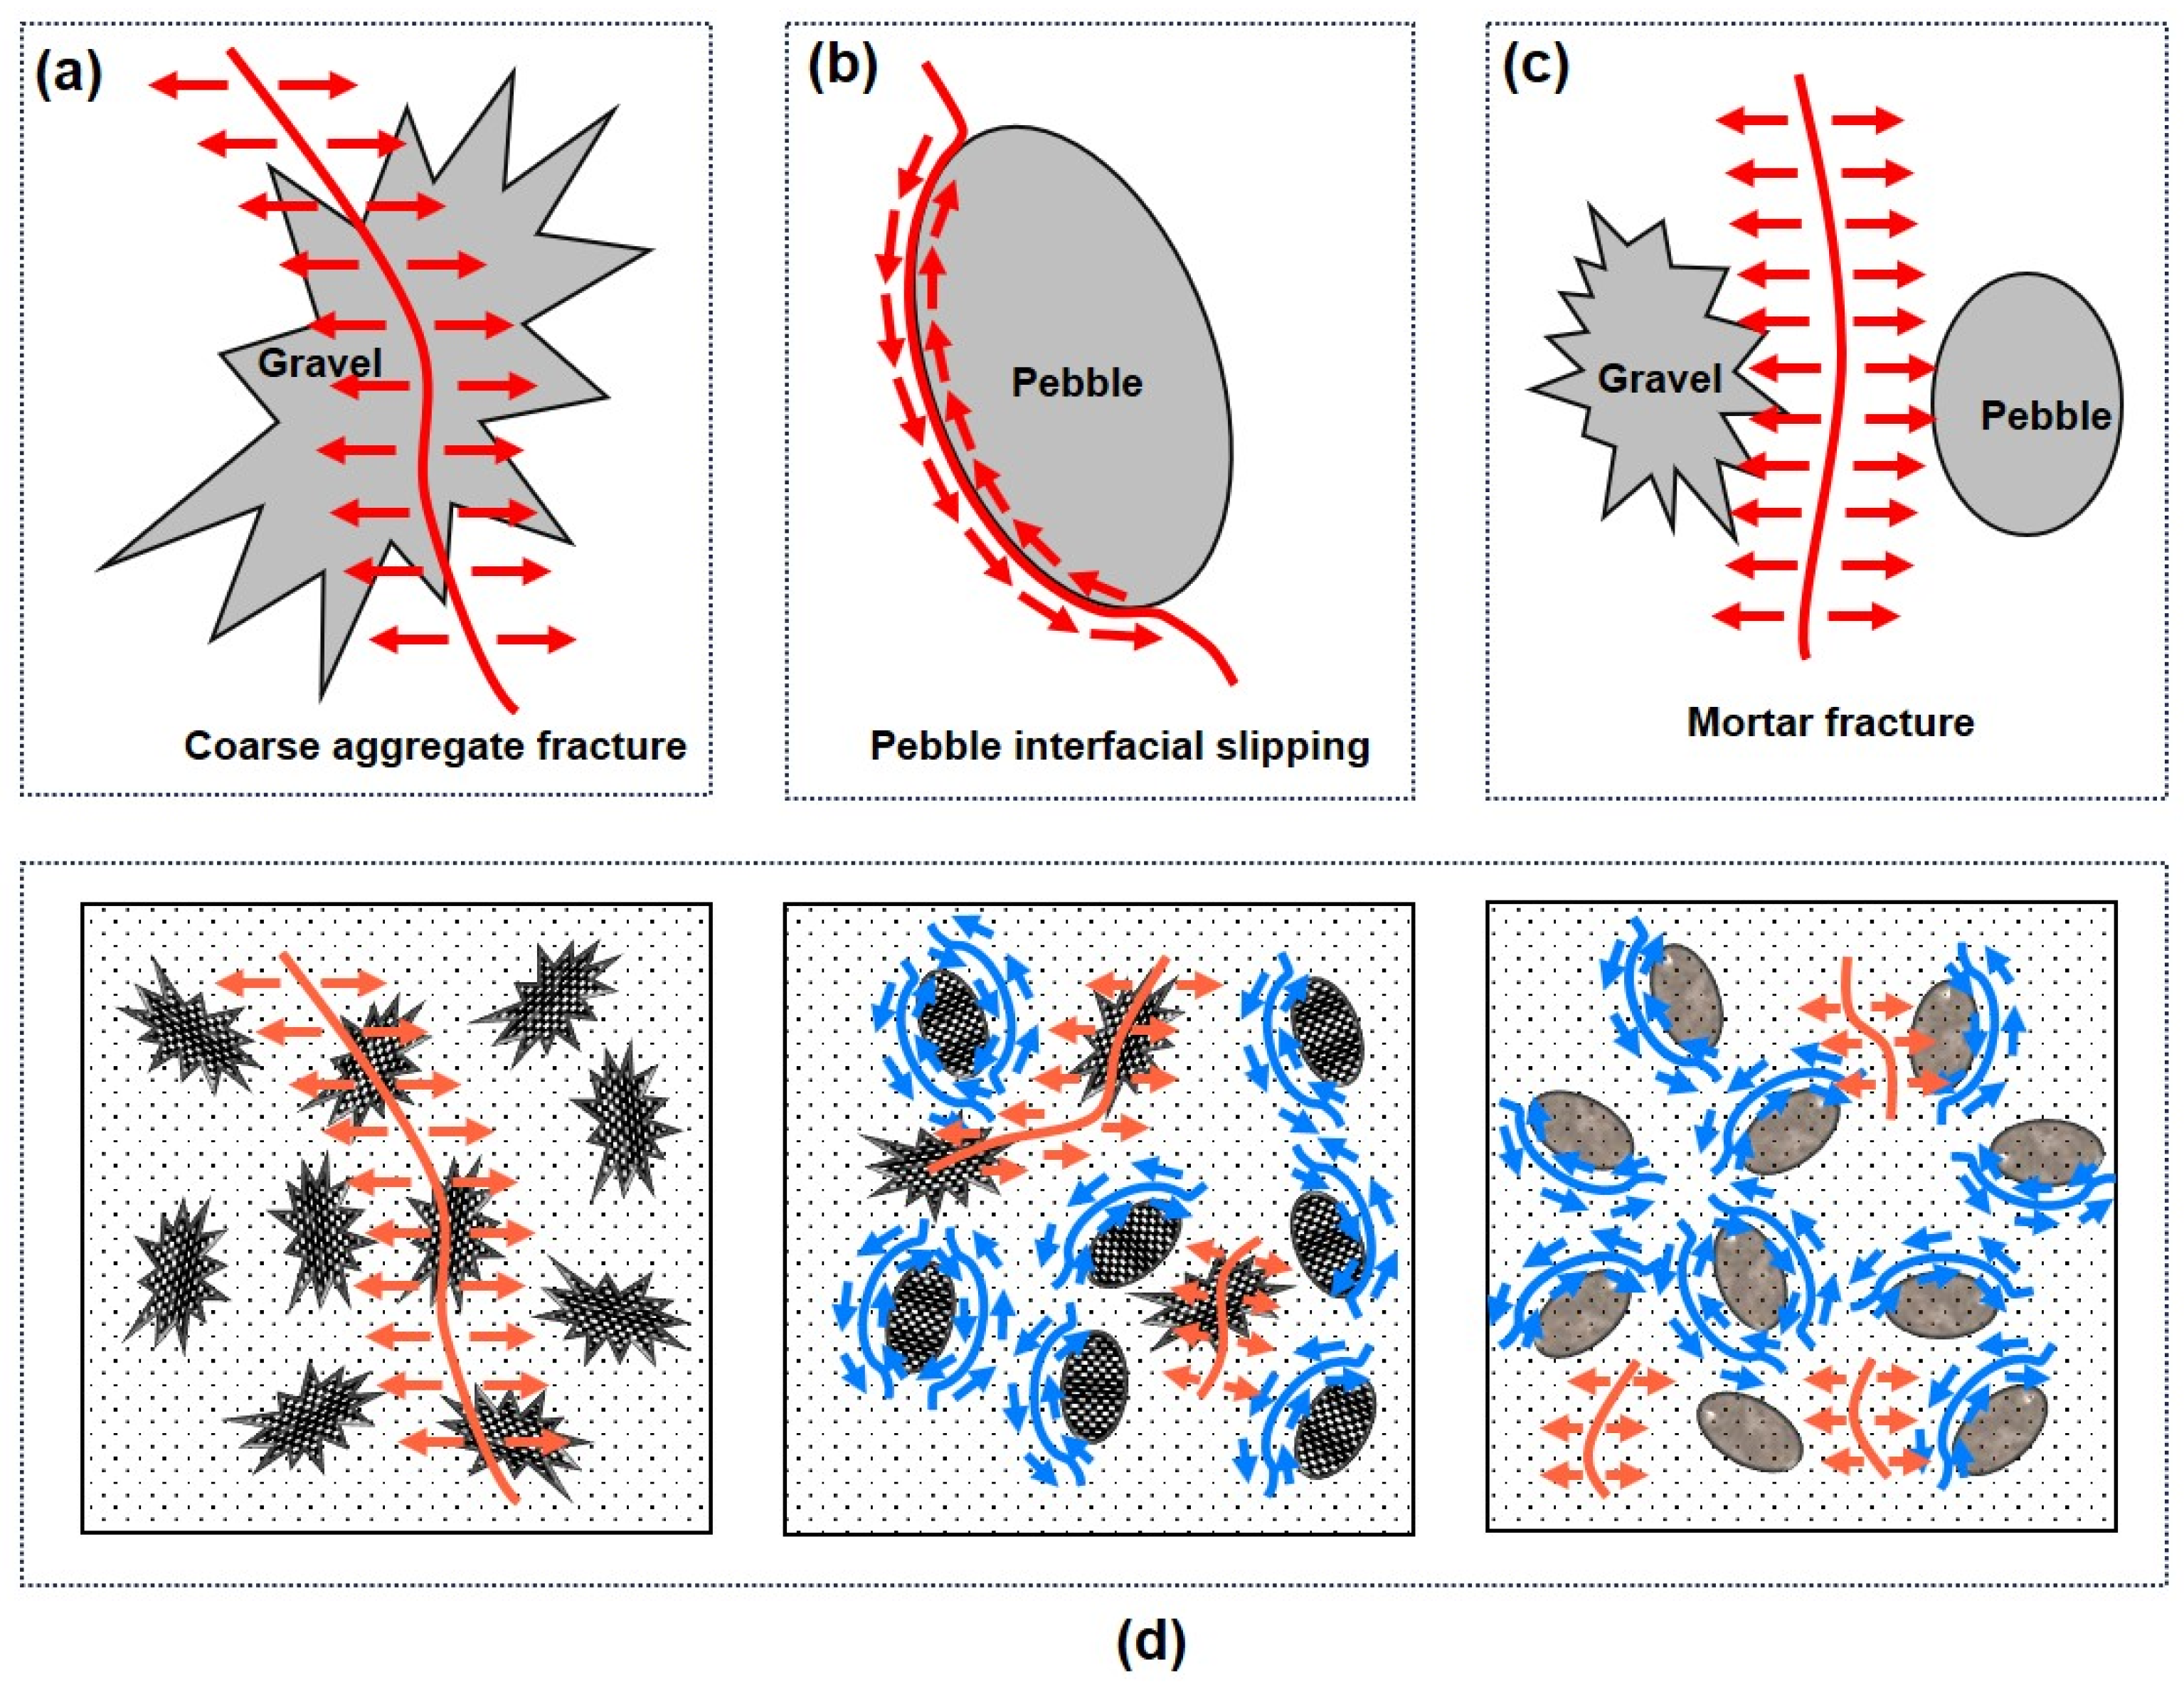
Based on the measured full-field displacement and corresponding strain fields, the spatial-–temporal distribution of cracks was tracked in the concretes. It revealed a single penetrated crack in GC, whereas RPC/SPC exhibited several dispersed local shorter cracks. Correspondingly, the failure mode in GC was coarse aggregate and mortar matrix fracture, while PC showed obvious pebble interfacial slipping.
(4)
Comparing RPC and SPC, their compressive deformation and failure behavior characteristics were similar, although the compressive strengths of RPC were relatively higher. Specifically, peak strains of SPC at higher substitution rates (e.g., 67% and 100%) were larger than RPC, consistent with the spatial distribution and local characteristics of strain fields and cracks. However, SPC showed increased numbers and width of generated cracks compared to RPC.
(5)
In practical applications, if the feasibility of RPC has been verified, SPC could be employed in offshore or island engineering projects instead of RPC to some extent. Otherwise, strengthening solutions should be considered for RPC/SPC according to the compressive mechanical property requirements of some concrete design codes.

Author Contributions

Conceptualization, Y.Y. and Y.L.; Data curation, Y.Y., Y.Z., and X.F.; Funding acquisition, Y.Y. and W.Z.; Investigation, X.F. and Y.Z.; Methodology, Y.Y. and W.Z.; Software, Y.Z. and Y.L.; Supervision, Y.Y. and W.Z.; Validation, Y.Z. and X.F.; Visualization, X.F. and Y.Y.; Writing—original draft, Y.Y.; Writing—review and editing, Y.Y. and Y.Z. All authors have read and agreed to the published version of the manuscript.

Funding

This research was funded by the National Natural Science Foundation of China (Grant no. 12372183) and the Shanghai Sailing Program (Grant no. 23YF1416100).

Institutional Review Board Statement

Not applicable.

Informed Consent Statement

Not applicable.

Data Availability Statement

The original contributions presented in the study are included in the article, further inquiries can be directed to the corresponding author.

Conflicts of Interest

The authors declare no conflicts of interest.

References

  1. Lao, J.-C.; Huang, B.-T.; Xu, L.-Y.; Khan, M.; Fang, Y.; Dai, J.-G. Seawater Sea-Sand Engineered Geopolymer Composites (EGC) with High Strength and High Ductility. Cem. Concr. Compos. 2023, 138, 104998. [Google Scholar] [CrossRef]
  2. Bader, M.A. Performance of Concrete in a Coastal Environment. Cem. Concr. Compos. 2003, 25, 539–548. [Google Scholar] [CrossRef]
  3. Nedeljković, M.; Visser, J.; Šavija, B.; Valcke, S.; Schlangen, E. Use of Fine Recycled Concrete Aggregates in Concrete: A Critical Review. J. Build. Eng. 2021, 38, 102196. [Google Scholar] [CrossRef]
  4. Feng, W.; Tang, Y.; Yang, Y.; Cheng, Y.; Qiu, J.; Zhang, H.; Isleem, H.F.; Tayeh, B.A.; Namdar, A. Mechanical Behavior and Constitutive Model of Sustainable Concrete: Seawater and Sea-Sand Recycled Aggregate Concrete. Constr. Build. Mater. 2023, 364, 130010. [Google Scholar] [CrossRef]
  5. Feng, N.Q.; Yan, J.H.; Peng, G.F. Ecological Environment and Concrete Technology in China. KEM 2006, 302–303, 12–18. [Google Scholar] [CrossRef]
  6. Huang, Y.; Li, X.; Lu, Y.; Wang, H.; Wang, Q.; Sun, H.; Li, D. Effect of Mix Component on the Mechanical Properties of Coral Concrete under Axial Compression. Constr. Build. Mater. 2019, 223, 736–754. [Google Scholar] [CrossRef]
  7. Huang, Y.; He, X.; Wang, Q.; Sun, Y. Mechanical Properties of Sea Sand Recycled Aggregate Concrete under Axial Compression. Constr. Build. Mater. 2018, 175, 55–63. [Google Scholar] [CrossRef]
  8. Ribeiro, S.; Ribeiro, D.D.C.; Dias, M.B.D.S.; Garcia, G.C.R.; Santos, É.M.B.D. Study of the Fracture Behavior of Mortar and Concretes with Crushed Rock or Pebble Aggregates. Mater. Res. 2011, 14, 46–52. [Google Scholar] [CrossRef]
  9. Zhou, C.; Chen, Z. Mechanical Properties of Recycled Concrete Made with Different Types of Coarse Aggregate. Constr. Build. Mater. 2017, 134, 497–506. [Google Scholar] [CrossRef]
  10. SL 677–2014; Specifications for Hydraulic Concrete Construction. Ministry of Water Resources of the People’s Republic of China, China Water & Power Press: Beijing, China, 2014.
  11. JTS 202–2011; Specifications for Concrete Construction of Port and Waterway Engineering. Ministry of Transport of the People’s Republic of China, People’s Communications Press Co., Ltd.: Beijing, China, 2011.
  12. Bayle, P.M.; Blenkinsopp, C.E.; Conley, D.; Masselink, G.; Beuzen, T.; Almar, R. Performance of a Dynamic Cobble Berm Revetment for Coastal Protection, under Increasing Water Level. Coast. Eng. 2020, 159, 103712. [Google Scholar] [CrossRef]
  13. Lu, Z.; Liu, G.; Wu, Y.; Dai, M.; Jiang, M.; Xie, J. Recycled Aggregate Seawater–Sea Sand Concrete and Its Durability after Immersion in Seawater. J. Build. Eng. 2023, 65, 105780. [Google Scholar] [CrossRef]
  14. Meddah, M.S.; Zitouni, S.; Belâabes, S. Effect of Content and Particle Size Distribution of Coarse Aggregate on the Compressive Strength of Concrete. Constr. Build. Mater. 2010, 24, 505–512. [Google Scholar] [CrossRef]
  15. Sun, X.; Zhang, B.; Dai, Q.; Yu, X. Investigation of Internal Curing Effects on Microstructure and Permeability of Interface Transition Zones in Cement Mortar with SEM Imaging, Transport Simulation and Hydration Modeling Techniques. Constr. Build. Mater. 2015, 76, 366–379. [Google Scholar] [CrossRef]
  16. Chen, Z.; Zhou, C.; Ye, P. The Compressive Strength and Flexural Strength Test of Recycled Pebble Aggregate Concrete. Appl. Mech. Mater. 2013, 357–360, 1433–1436. [Google Scholar] [CrossRef]
  17. Jun, Y.; Kim, J.H.; Han, S.H.; Kim, T. Influence of Seawater on Alkali-Activated Slag Concrete. Mater Struct 2021, 54, 121. [Google Scholar] [CrossRef]
  18. Mohammed, T.U.; Hamada, H.; Yamaji, T. Performance of Seawater-Mixed Concrete in the Tidal Environment. Cem. Concr. Res. 2004, 34, 593–601. [Google Scholar] [CrossRef]
  19. Da Silva, M.A.; Pepe, M.; De Andrade, R.G.M.; Pfeil, M.S.; Toledo Filho, R.D. Rheological and Mechanical Behavior of High Strength Steel Fiber-River Gravel Self Compacting Concrete. Constr. Build. Mater. 2017, 150, 606–618. [Google Scholar] [CrossRef]
  20. Chen, Z.; Mo, L.; Song, C.; Zhang, Y. Investigation on Compression Properties of Seawater-Sea Sand Concrete. Adv. Concr. Constr. 2021, 12, 93–103. [Google Scholar] [CrossRef]
  21. Liu, H.B.; Zhou, S.; Wei, H.B.; Li, W.J.; Xiu, R.; Zhu, B. Mechanical Properties, Permeability and Freeze-Thaw Durability of Low Sand Rate Pervious Concrete. J. Phys. Conf. Ser. 2021, 1765, 012022. [Google Scholar] [CrossRef]
  22. Ohtsu, M.; Watanabe, H. Quantitative Damage Estimation of Concrete by Acoustic Emission. Constr. Build. Mater. 2001, 15, 217–224. [Google Scholar] [CrossRef]
  23. Ng, C.; Alengaram, U.J.; Wong, L.S.; Mo, K.H.; Jumaat, M.Z.; Ramesh, S. A Review on Microstructural Study and Compressive Strength of Geopolymer Mortar, Paste and Concrete. Constr. Build. Mater. 2018, 186, 550–576. [Google Scholar] [CrossRef]
  24. Yang, S.; Zhang, X.; Yu, M.; Yao, J. An Analytical Approach to Predict Fracture Parameters of Coral Aggregate Concrete Immersed in Seawater. Ocean Eng. 2019, 191, 106508. [Google Scholar] [CrossRef]
  25. Li, D.; Huang, P.; Chen, Z.; Yao, G.; Guo, X.; Zheng, X.; Yang, Y. Experimental Study on Fracture and Fatigue Crack Propagation Processes in Concrete Based on DIC Technology. Eng. Fract. Mech. 2020, 235, 107166. [Google Scholar] [CrossRef]
  26. Le, D.B.; Tran, S.D.; Torero, J.L.; Dao, V.T.N. Application of Digital Image Correlation System for Reliable Deformation Measurement of Concrete Structures at High Temperatures. Eng. Struct. 2019, 192, 181–189. [Google Scholar] [CrossRef]
  27. Huang, Y.; He, X.; Wang, Q.; Xiao, J. Deformation Field and Crack Analyses of Concrete Using Digital Image Correlation Method. Front. Struct. Civ. Eng. 2019, 13, 1183–1199. [Google Scholar] [CrossRef]
  28. Hu, Y.; Guo, W.; Zhu, W.; Xu, Y. Local Damage Detection of Membranes Based on Bayesian Operational Modal Analysis and Three-Dimensional Digital Image Correlation. Mech. Syst. Signal Process. 2019, 131, 633–648. [Google Scholar] [CrossRef]
  29. Aliabadian, Z.; Zhao, G.-F.; Russell, A.R. Crack Development in Transversely Isotropic Sandstone Discs Subjected to Brazilian Tests Observed Using Digital Image Correlation. Int. J. Rock Mech. Min. Sci. 2019, 119, 211–221. [Google Scholar] [CrossRef]
  30. Bolivar, J.; Frégonèse, M.; Réthoré, J.; Duret-Thual, C.; Combrade, P. Evaluation of Multiple Stress Corrosion Crack Interactions by In-Situ Digital Image Correlation. Corros. Sci. 2017, 128, 120–129. [Google Scholar] [CrossRef]
  31. Lakavath, C.; Joshi, S.S.; Prakash, S.S. Investigation of the Effect of Steel Fibers on the Shear Crack-Opening and Crack-Slip Behavior of Prestressed Concrete Beams Using Digital Image Correlation. Eng. Struct. 2019, 193, 28–42. [Google Scholar] [CrossRef]
  32. GB/T 14685–2011; Standardization Administration of China, Pebble and Crushed Stone for Construction. General Administration of Quality Supervision, Inspection and Quarantine of the People’s Republic of China: Beijing, China, 2011.
  33. JGJ52–2006; Standard for Technical Requirements and Test Method of Sand and Crushed Stone (or Gravel) for Ordinary Concrete. Ministry of Construction of the People’s Republic of China, China Architecture & Building Press: Beijing, China, 2006.
  34. JGJ55-2011; Specification for mix proportion design of ordinary concrete. China Academy of Building Science, China Architecture & Building Press: Beijing, China, 2011.
  35. GB/T 50081-2002; Standard for test method of mechanical properties on ordinary concrete. Ministry of Construction of the People’s Republic of China, China Architecture & Building Press: Beijing, China, 2002.
Figure 1. The prepared coarse aggregates. (a) River pebbles, (b) sea pebbles, and (c) gravels.
Jmse 12 01395 g001
Figure 2. Preparation of the concrete specimen. (a) Stirring, (b) pounding, (c) vibration, (d) standing, (e) demolding, and (f) curing.
Jmse 12 01395 g002
Figure 3. (a) Schematic diagram of the concrete compressive test based on the DIC technique. (b) The DIC registration algorithm. (c) The experimental setup of the compressive test.
Jmse 12 01395 g003
Figure 4. (a) Compressive strengths and (b) stress-strain curves of the tested concretes.
Jmse 12 01395 g004
Figure 5. Displacement fields of the (a) S(R)-0, (b) S-33, and (c) R-67 at three typical stages with the increase of compressive loads.
Jmse 12 01395 g005
Figure 6. Strain fields of the GC (S(R) −0), SPC (S−33), and RPC (R−67).
Jmse 12 01395 g006
Figure 7. Peak strain and peak stress of the river/sea pebble concretes (a) with the increase of pebble substitution rates (i.e., 0, 33%, 67%, and 100%) (b).
Jmse 12 01395 g007
Figure 8. Development of strain fields of the RPC/SPC cubes with the increase of substitution rates at failure stage (ag).
Jmse 12 01395 g008
Figure 9. Interfacial views of the damaged GC and SPC cubes under compressive loads, where (ad) were S(R)-0, S-33, R-67, and S-100, respectively.
Jmse 12 01395 g009
Figure 10. Failure mode diagram of the gravel and river/sea pebble concretes, where (a) was aggregate fracture, (b) was slip fracture of pebble concrete, and (c) was cementing material fracture. (d) Possible failure mode diagram of experimental concretes.
Jmse 12 01395 g010
Table 1. Physical parameters of coarse aggregates.
Coarse AggregateRiver PebbleSea PebbleGravel
Gradation (mm)5~255~255~25
Apparent density (kg/m3)284527802603
Bulk density (kg/m3)173616941549
Water absorption (%)1.31.11.05
Moisture content (%)0.010.040.01
Crushing index (%)12.111.79.6
Table 2. Mix proportion of the concrete specimen (kg/m3).
SpecimenSR (%)CementWaterSandGravelPebble
S(R)-0038819056911560
R-3333370177.5569774.5381.5
R-6767370177.5569381.5774.5
R-100100370177.556901156.0
S-3333370177.5569774.5381.5
S-6767370177.5569381.5774.5
S-100100370177.556901156.0
Disclaimer/Publisher’s Note: The statements, opinions and data contained in all publications are solely those of the individual author(s) and contributor(s) and not of MDPI and/or the editor(s). MDPI and/or the editor(s) disclaim responsibility for any injury to people or property resulting from any ideas, methods, instructions or products referred to in the content.

