Article

Research on the Optimization of Ship Trajectory Clustering Based on the OD–Hausdorff Distance

1
School of Navigation, Wuhan University of Technology, Wuhan 430063, China
2
CCCC Water Transportation Consultants Co., Ltd., Beijing 100007, China
3
Fiberhome Communication Technology Co., Ltd., Wuhan 430074, China
4
Wuhan Second Ship Design and Research Institute, Wuhan 430063, China
5
Tianjin Research Institute for Water Transport Engineering, Ministry of Transport, Tianjin 300456, China
*
Author to whom correspondence should be addressed.
These authors contributed equally to this work and should be considered co-first authors.
J. Mar. Sci. Eng. 2024, 12(8), 1398; https://doi.org/10.3390/jmse12081398
Submission received: 20 July 2024 / Revised: 3 August 2024 / Accepted: 8 August 2024 / Published: 15 August 2024
(This article belongs to the Section Ocean Engineering)

Abstract

:
With the growth of global trade, port shipping is becoming more and more important. In this paper, an analysis of a ship’s inbound and outbound track characteristics is conducted using the OD–Hausdorff distance. The accuracy and efficiency of trajectory data analysis have been enhanced through clustering analysis. Trajectories are arranged in a time sequence, and representative port segments are selected. An improved OD–Hausdorff distance method is employed to capture the dynamic characteristics of a ship’s movements, such as speed and heading. Additionally, the DBSCAN algorithm is utilized for clustering, allowing for the processing of multidimensional AIS data. Data cleaning and preprocessing have ensured the reliability of the AIS data, and the Douglas–Peucker algorithm is used for trajectory simplification. Significant improvements in the accuracy and efficiency of trajectory clustering have been observed. Therefore, the main channel of the Guan River and the right side of Yanwei Port are usually followed by ships greater than 60 m in length, with a lateral Relative Mean Deviation (RMD) of 7.06%. Vessels shorter than 60 m have been shown to have greater path variability, with a lateral RMD of 7.94%. Additionally, a crossing pattern at Xiangshui Port is exhibited by ships shorter than 60 m due to the extension of berths and their positions at turns. Enhanced clustering accuracy has provided more precise trajectory patterns, which aids in better channel management.

1. Introduction

With the growth of global trade and rising international trade volumes, inland navigation is becoming increasingly crucial. Inland waterways are vital transportation hubs and the primary routes for bulk cargo. Regional economic activities are significantly supported by inland waterways, which serve as key arteries. Therefore, effective waterway management and ship scheduling are crucial for enhancing transportation efficiency and ensuring navigation safety. Technological advancements have increased the use of Automatic Identification System (AIS) data to optimize waterway management and ship scheduling. The dynamic and static information AIS provides allows for the real-time tracking of ship positions, analysis of navigation behaviors, and optimization of route design. The efficiency and safety of waterway usage are significantly improved by this. Moreover, AIS-based trajectory analysis has become a focal point in modern maritime research. This technology is used not only in the daily management of waterways and ports but also in addressing complex maritime traffic situations and enhancing emergency response capabilities. Advanced trajectory analysis techniques, such as the Origin–Destination (OD)–Hausdorff distance and the Density-Based Spatial Clustering of Applications with Noise (DBSCAN) algorithm, are focused on in this study for processing and analyzing AIS data. These methods improve the accuracy and efficiency of trajectory data analysis, particularly in complex waterways and high-traffic port environments. This study aims to provide more precise results for trajectory clustering through these technologies, offering scientific support for the management of waterways and the safety of navigation.
AIS data have extensive marine research and management applications, enabling real-time monitoring and detailed analysis of maritime activities. Mazzarella et al. [1] used AIS data to map maritime fishing activities, significantly enhancing insights into economic activities at sea. Shelmerdine [2] explored how to leverage AIS data to better support marine industry development and planning, highlighting its potential to promote advancements in the marine sector. Simsir and Ertugrul [3] demonstrated a method using artificial neural networks to accurately predict ship positions and headings in narrow waterways, providing new perspectives for improving navigation safety. Raja et al. [4] systematically reviewed AIS-based maritime anomaly traffic detection technologies, offering a comprehensive analytical framework. Vespe et al. [5] investigated the application of unsupervised learning methods in identifying maritime traffic patterns, showcasing advanced data processing techniques. Bakdi et al. [6] developed a model for identifying multiple ship collision and grounding risks based on AIS data, significantly enhancing maritime safety capabilities. Zhang et al. [7] proposed an AIS data repair technique based on generative adversarial networks, innovatively addressing issues regarding missing data and ensuring data integrity and reliability. Knorr et al. [8] improved the efficiency and accuracy of data clustering by studying distance-based outlier detection algorithms. This work advanced the application of AIS data. Lin et al. [9] and Yang et al. [10] analyzed ship berthing risks and traffic patterns using AIS data. Their analyses effectively improved the safety and operational efficiency of waterways. Laxhammar et al. [11] enhanced maritime traffic anomaly detection accuracy. They compared Gaussian mixture models and kernel density estimation methods, providing new safety measures for maritime traffic.
The DBSCAN is widely used in data mining and machine learning. This algorithm can identify clusters of arbitrary shapes and handle noise points effectively. Due to its superior handling of irregular data shapes and strong noise resistance, the DBSCAN clustering algorithm and its variants have become preferred techniques in maritime data analysis. The number and shape of clusters can be determined automatically based on data density. DBSCAN is thus particularly suitable for analyzing dynamically changing maritime traffic data. Raja et al. [4] confirmed the effectiveness of DBSCAN in maritime data clustering. Qian et al. [12] proposed a multi-density DBSCAN algorithm. This approach effectively addresses multi-scale data processing issues by introducing the concept of relative density. Newaliya and Singh [13] developed a multivariate hierarchical DBSCAN model. Their model further optimizes extracting delicate structures from complex maritime data. Ouyang and Shen [14] explored online structural clustering techniques based on DBSCAN extension and granular descriptors. These techniques are suitable for real-time processing of large-scale maritime data. Ros et al. [15] presented a self-tuning version of DBSCAN. The parameters are dynamically adjusted by this version to adapt to dataset characteristics, thereby improving the accuracy and stability of clustering results. Zhu et al. [16] applied the harmony search optimization algorithm to DBSCAN clustering. This optimization enhances the real-time processing capability of dynamic data in maritime monitoring systems. The BIRCHSCAN sampling method proposed by de Moura Ventorim et al. [17] made applying DBSCAN to large datasets feasible. Computational complexity is significantly reduced by this method. Chen et al. [18] and subsequent researchers [19,20,21,22,23,24,25,26,27,28,29,30] conducted in-depth optimization studies on the DBSCAN algorithm. They made application improvements in cloud computing environments and developed enhanced DBSCAN algorithms for anomaly detection. Additionally, they applied DBSCAN to boundary detection in 3D point clouds. These studies demonstrate the broad applicability and efficiency of DBSCAN and its variants in processing maritime data.
In summary, several challenges are still faced by the existing research on ship trajectory analysis, despite the rich information resource provided by AIS data for maritime activities. Firstly, data accuracy can be affected by missing or erroneous records during collection. Secondly, the generalizability of the models is limited by the varying performance of existing analytical models in different maritime environments and ship types. Thirdly, the efficient application of some advanced trajectory analysis methods to large-scale datasets is made challenging by their high computational complexity. To address these issues, an improved OD–Hausdorff distance method is introduced in this study. The continuity and temporal correlation of the trajectories are ensured by sequentially arranging the trajectories and selecting representative port segments, thereby enhancing analytical accuracy. The accuracy of the trajectory similarity calculation is significantly improved by the comprehensive consideration and separate analysis of the characteristics of the overall trajectory, port, and other segments. The accuracy and efficiency of trajectory clustering are enhanced by the combination of the OD–Hausdorff distance with the DBSCAN clustering algorithm to process complex multidimensional trajectory data.
The rest of this paper is organized as follows. The methods used in this research, including the data and proposed model, are introduced in Section 2. Then, the research results are presented in Section 3, followed by a discussion in Section 4. Finally, the conclusion is drawn in Section 5.

2. Methods

A trajectory clustering method suitable for scenarios involving inland ships entering and leaving ports is introduced in this section. The OD–Hausdorff distance method is proposed, which arranges trajectories in a time sequence and selects representative port segments. An improved Hausdorff distance for analysis is employed by the method by comprehensively considering the characteristics of the overall trajectory, port segments, and other parts. AIS data is preprocessed, and MATLAB and the DBSCAN algorithm are utilized to perform a clustering analysis of the ship trajectories. The technology roadmap is shown in Figure 1. The accuracy and efficiency of the clustering process are aimed to be enhanced by this method.

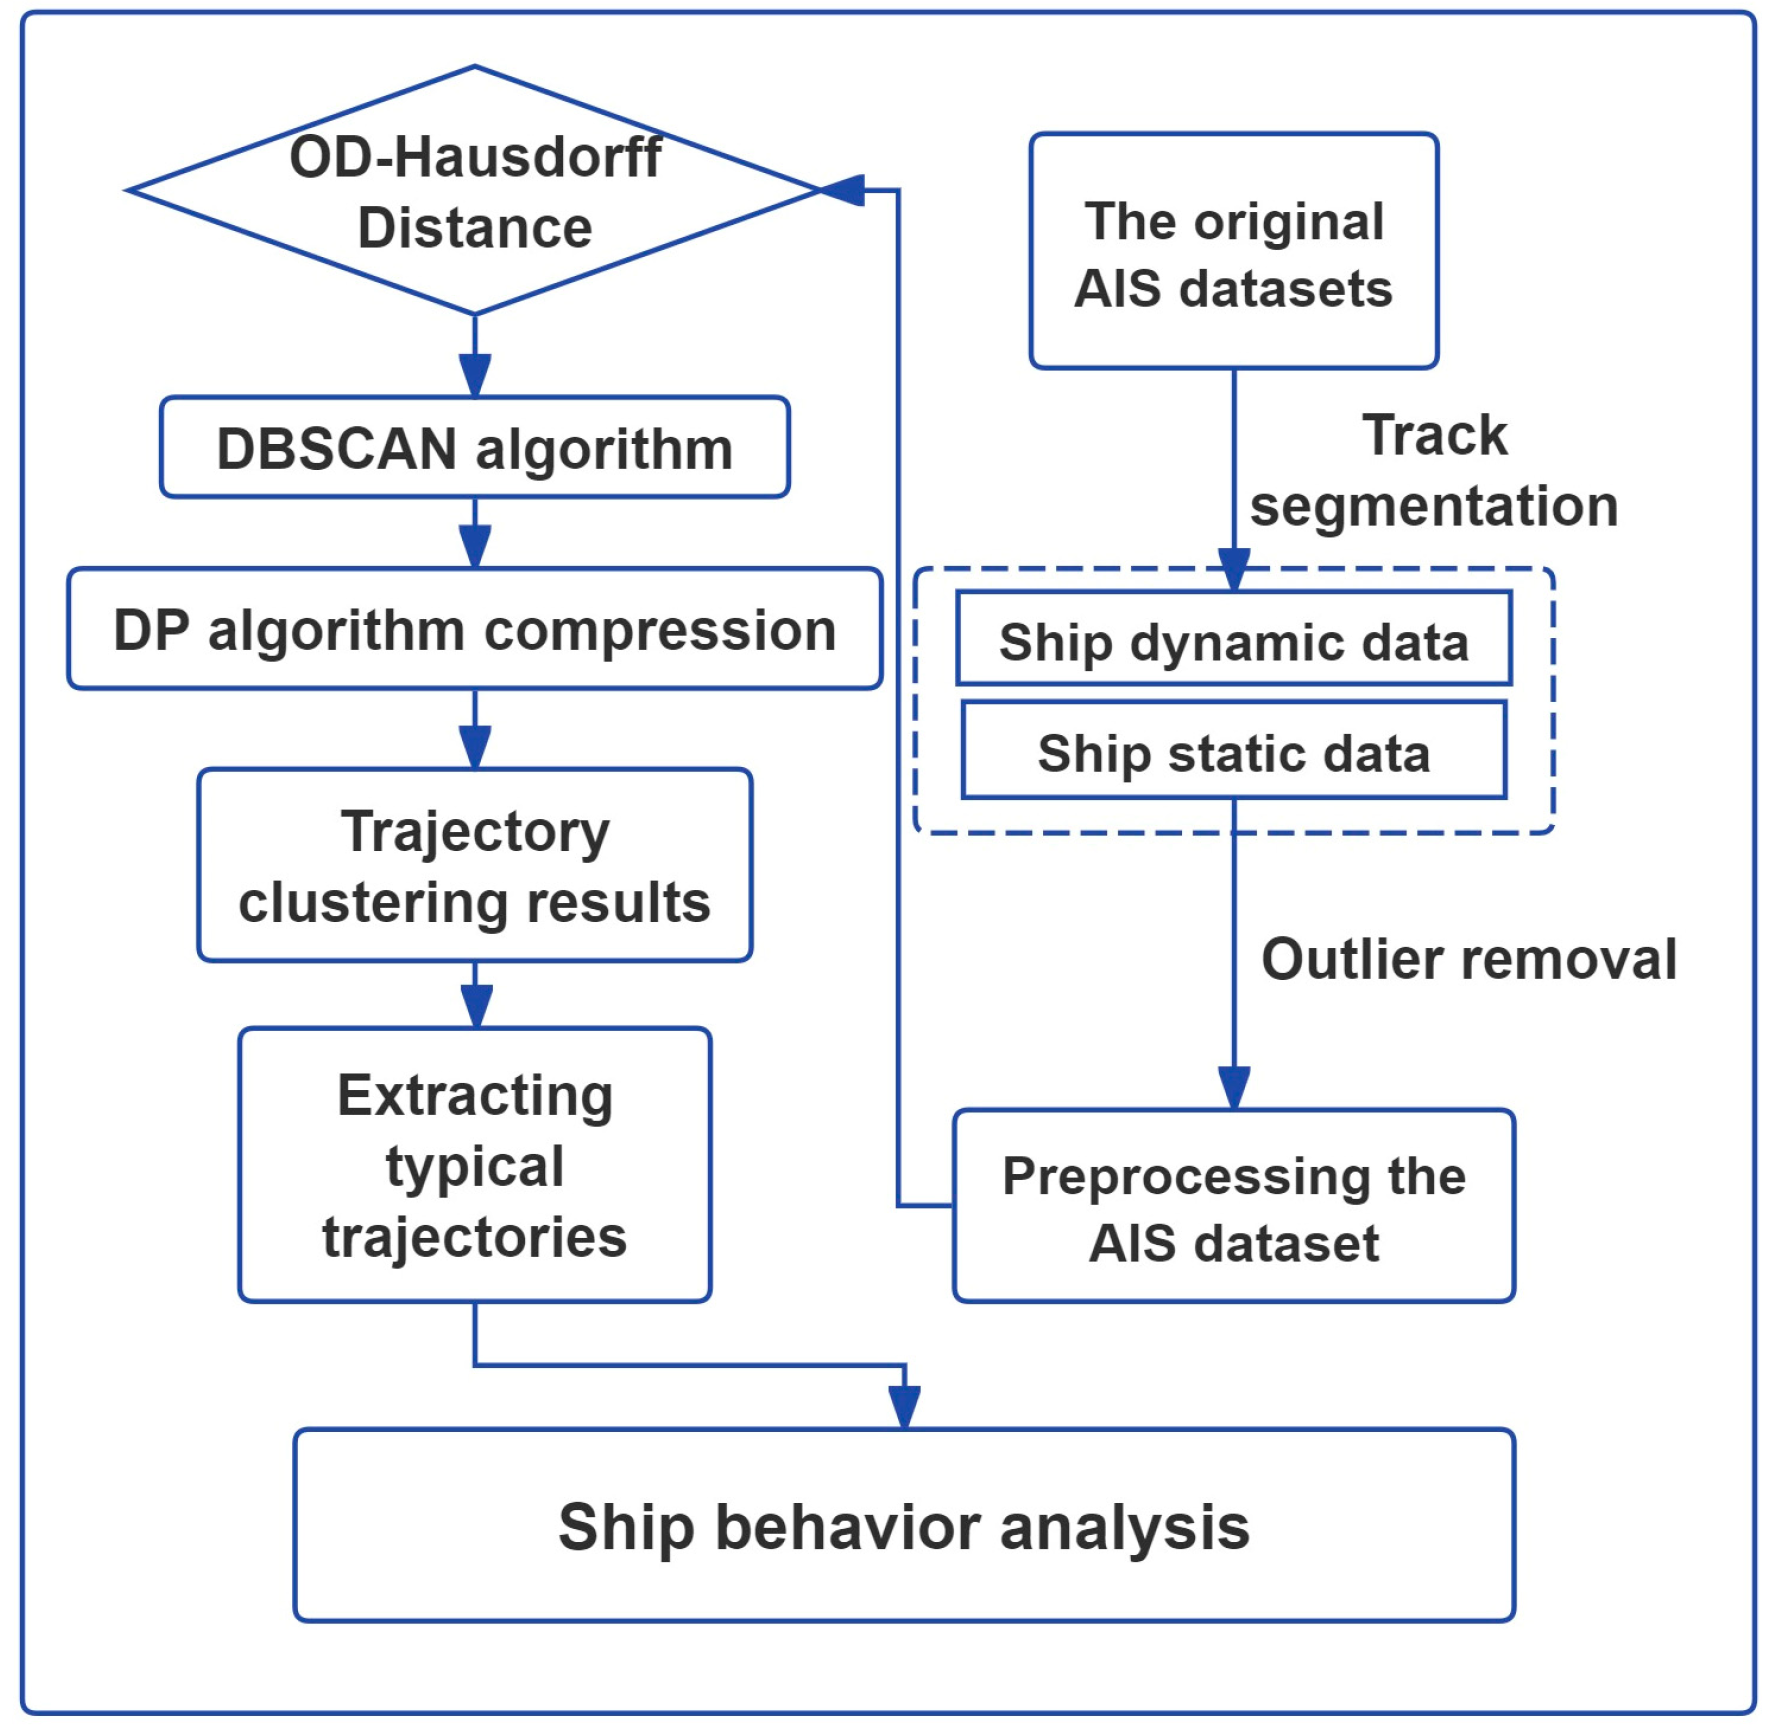
2.1. AIS Data Preprocessing

The collection of AIS data is primarily reliant on equipment installed on ships, base stations, and data centers. After the AIS data are collected, preprocessing becomes critical, including data cleaning, completion, and compression. Erroneous, inconsistent, or missing data are eliminated to ensure accuracy through data cleaning and completion. Information relevant to specific research or applications is extracted through data compression. Trajectory segment clustering heavily relies on trajectory compression. In areas with good signal reception, redundant data can result from the short upload intervals of AIS data due to the ship being in a stable navigation state with close position information. After cleaning the AIS data, removing outliers can inadvertently break continuous trajectories, especially when eliminating drift points. This removal may cause abnormal time and distance gaps between the remaining points, leading to their misidentification as fly points, thus wrongly splitting a continuous trajectory. To prevent this unintended trajectory fragmentation, it is crucial to restore these removed points to maintain trajectory continuity and integrity.
Specifically, cubic spline interpolation is used to fill in the missing latitude and longitude information caused by the outlier removal, ensuring spatial continuity of the trajectory. For speed and course corrections, linear interpolation is employed due to its simplicity and effectiveness in handling time series data, allowing for a better restoration of the vessel’s speed and course trends. This interpolation strategy effectively prevents trajectory fragmentation during outlier processing, ensuring accurate and reliable trajectory analysis. Cubic spline interpolation is a mathematical method used to construct a smooth curve through a set of discrete points. In AIS data processing, it is commonly used to repair abnormal or missing trajectory points because it provides a highly smooth curve while preserving the local characteristics of the data points.
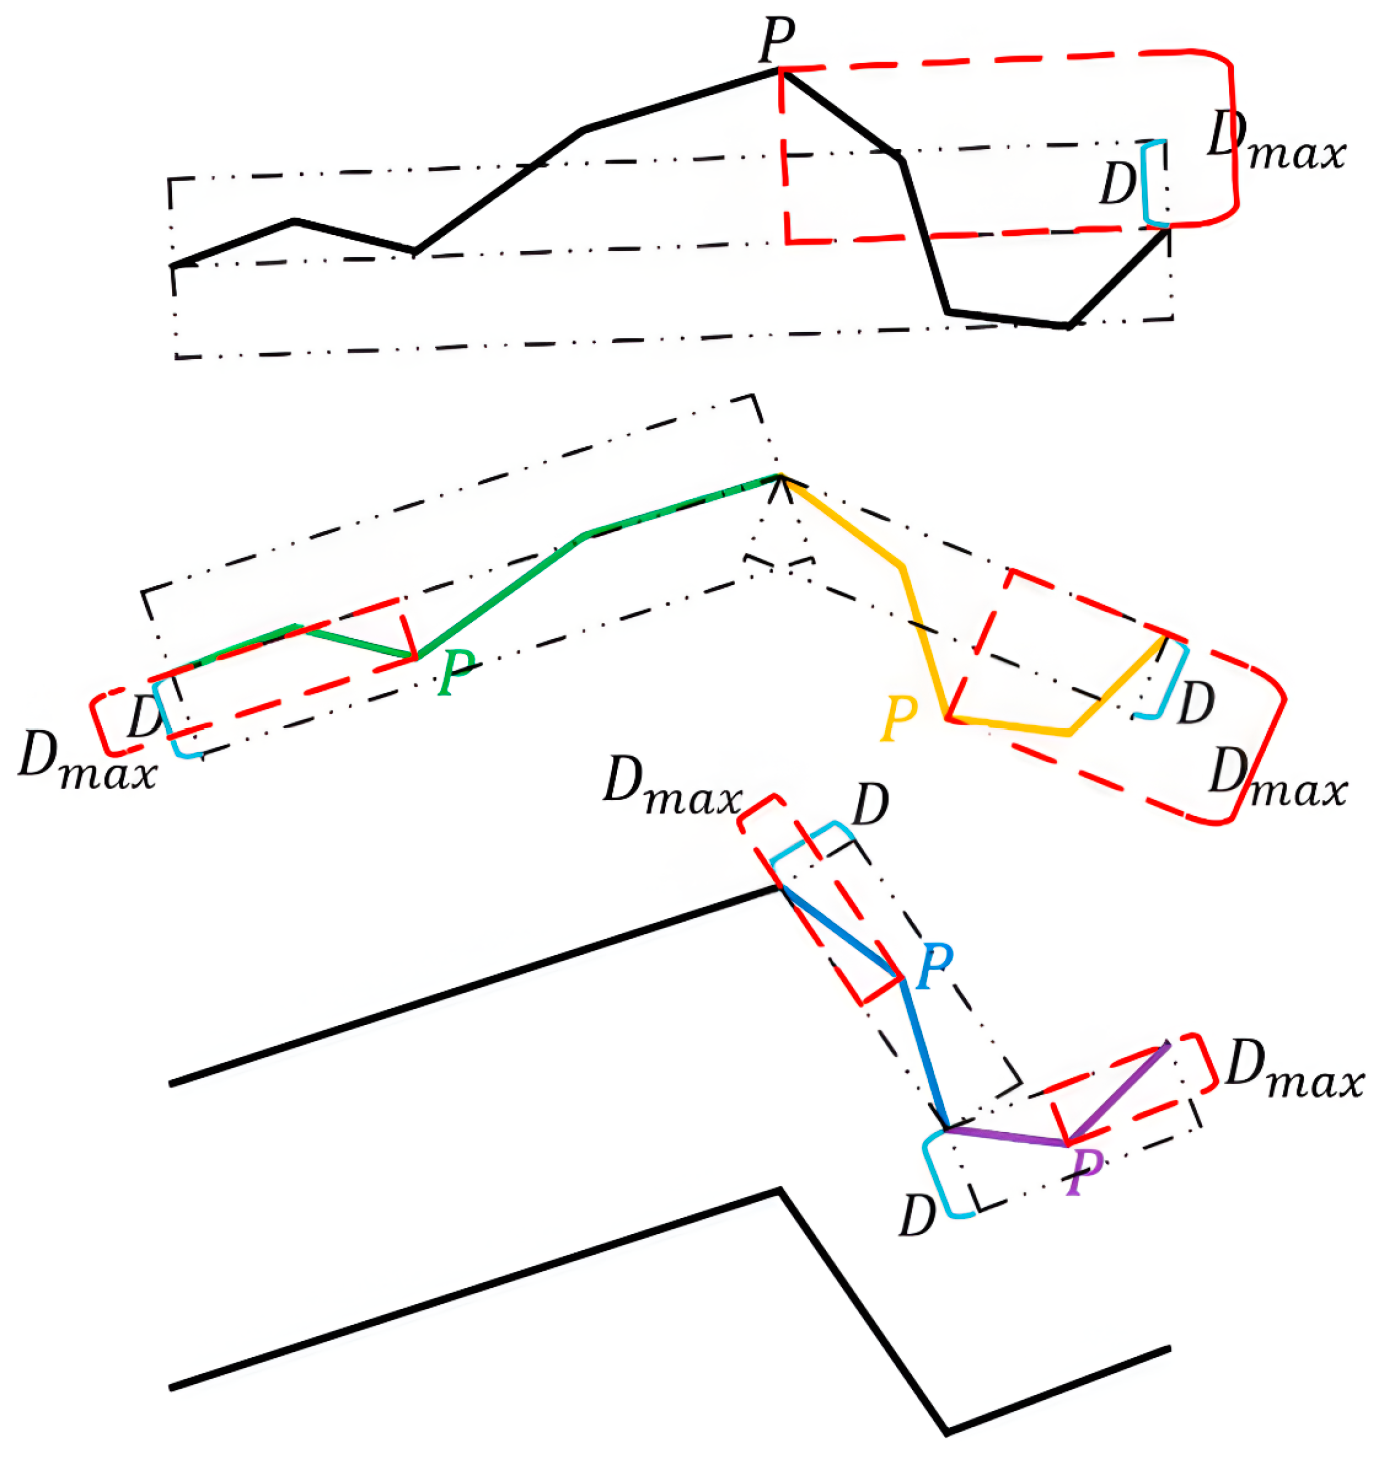
The number of points in the data is reduced while maintaining the shape characteristics of the trajectory using the Douglas–Peucker (DP) algorithm [31]. Firstly, a distance threshold D is set for the trajectory composed of points. Secondly, the first and last points are connected by drawing a straight-line segment between them. Thirdly, the Euclidean distance from each point on the trajectory to the constructed line segment is calculated, and the maximum distance Dmax is identified, with the point having the maximum distance marked as P. Fourthly, if Dmax > D, the trajectory is divided into two parts at point P. Fifthly, if Dmax < D, all points except the first and last points of the segment are deleted. These steps are repeated until the trajectory can no longer be divided. The resulting simplified trajectory is the compressed outcome. The effectiveness of the DP (Douglas–Peucker) compression algorithm is illustrated in Figure 2. Clustering efficiency is significantly enhanced by this trajectory simplification, as essential features are preserved with fewer data points.

2.2. OD–Hausdorff Distance

The traditional Hausdorff distance is used to measure the similarity between two sets of points by determining the greatest distance from a point in one set to the closest point in the other set. It is focused primarily on spatial distribution without considering dynamic characteristics like speed and heading, making it sensitive to outliers and small, local shape changes. In contrast, the OD–Hausdorff distance is designed as an improved version tailored for ship trajectories, particularly useful for analyzing the behavior of ships entering and leaving ports. This method involves the trajectory being divided into three segments: the overall trajectory, the port segment, and other segments. The average Hausdorff distance is measured for these segments, with more importance being given to the port segments where significant behavioral changes occur. By incorporating dynamic characteristics such as speed and heading, the OD–Hausdorff distance provides a more comprehensive and accurate similarity measure for trajectories, making it more robust to outliers and small shape changes.
The spatial distribution of trajectory points is primarily what is focused on by the traditional Hausdorff distance, while the core dynamic characteristics of ship behavior, such as heading and speed, are neglected. For example, ships traveling in opposite directions may be spatially close, but the similarity may be misjudged if the Hausdorff distance is calculated solely from positions. Significant measurement bias can be introduced due to missing points in the trajectory data caused by signal interference or equipment failure, to which the traditional Hausdorff distance is sensitive. Therefore, the Hausdorff distance needs to be improved from the perspective of dynamic information to reflect the actual movement patterns of ships more accurately.
The OD (Origin–Destination)–Hausdorff distance method was developed in this study to enhance the accuracy of clustering analysis, particularly for the specific behaviors of ships entering and leaving ports. Clustering performance is significantly improved by this method, as it accurately captures these behaviors. The trajectory is segmented into overall, port, and other parts, and each part is independently evaluated using an improved Hausdorff distance. A global view of the trajectory is provided by the overall part. The ship’s actions, such as accelerating, decelerating, and preparing to depart or dock, are focused on by the port part, capturing the key characteristics of ships entering and leaving ports. The similarity of ship trajectories is more comprehensively evaluated by setting different weighting factors to adjust the influence of these parts through the OD–Hausdorff distance.
The principle of OD–Hausdorff distance measurement is shown in Figure 3. Each inbound and outbound trajectory can be divided into three parts. The entire trajectory corresponds to   T R 1 a l l , T R 2 a l l , the other parts corresponds to T R 1 0 , T R 2 0 , and the port part corresponds to T R 1 d , T R 2 d .
The normalization formula is
D ( p 1 i p 1 i 0 ) = T d · Norm ( sqrt ( ( Lat 1 Lat 2 ) 2 + ( Log 1 Log 2 ) 2 ) ) + T s · Norm a b s S o g 1 S o g 2 + T c · Norm ( abs ( Cog 1 Cog 2 ) )
where N o r m denotes normalization, p 1 i 0 is the perpendicular intersection point of trajectory point p 1 i in trajectory T R 1 to trajectory T R 2 , with L a t 2 , L o g 2 , S o g 2 , C o g 2 corresponding to the latitude, longitude, speed, and course of p 1 i 0 , respectively, and T d , T s , and T c are the distance weight, speed weight, and course weight, respectively.
It is important to note that the OD–Hausdorff distance measures similarity using the Average Improved Hausdorff Distance (AIHD). The formula for the OD–Hausdorff similarity measurement is defined as
H o d T R 1 , T R 2 = w 1 · D a v g T R 1 a l l , T R 2 a l l + w 2 · D a v g T R 1 0 , T R 2 0 + w 3 · D a v g T R 1 d , T R 2 d
where D a v g T R 1 a l l , T R 2 a l l , D a v g T R 1 o , T R 2 o , and D a v g T R 1 d , T R 2 d represent the overall part, port part, and other parts, respectively, and the distances calculated using the above average distance measurement are defined as follows: w 1 , w 2 , w 3 are the weight coefficients for the three parts. Substituting Formulas (1) into (3)–(5) yields the OD–Hausdorff similarity measurement.
D a v g T R 1 a l l , T R 2 a l l = 1 T R 1 a l l p 1 i T R 1 a l l m i n p 2 i T R 2 a l l D p 1 i p 1 i 0 + 1 T R 2 a l l p 2 i T R 2 a l l m i n p 1 i T R 1 a l l D p 2 i p 2 i 0
D a v g T R 1 o , T R 2 o = 1 T R 1 o p 1 i T R 1 o m i n p 2 i T R 2 o D p 1 i p 1 i 0 + 1 T R 2 o p 2 i T R 2 o m i n p 1 i T R 1 o D p 2 i p 2 i 0
D a v g T R 1 d , T R 2 d = 1 T R 1 d p 1 i T R 1 d m i n p 2 i T R 2 d D p 1 i p 1 i 0 + 1 T R 2 d p 2 i T R 2 d m i n p 1 i T R 1 d D p 2 i p 2 i 0
In practical implementations, the OD–Hausdorff distance first conducts a temporal analysis of the trajectories, identifying and isolating the port segments. The improved Hausdorff distance is then calculated for the overall trajectory, port segments, and other parts. The final similarity is obtained as the weighted average of these three distances, with the weighting factors adjustable according to actual needs to suit different analytical scenarios.
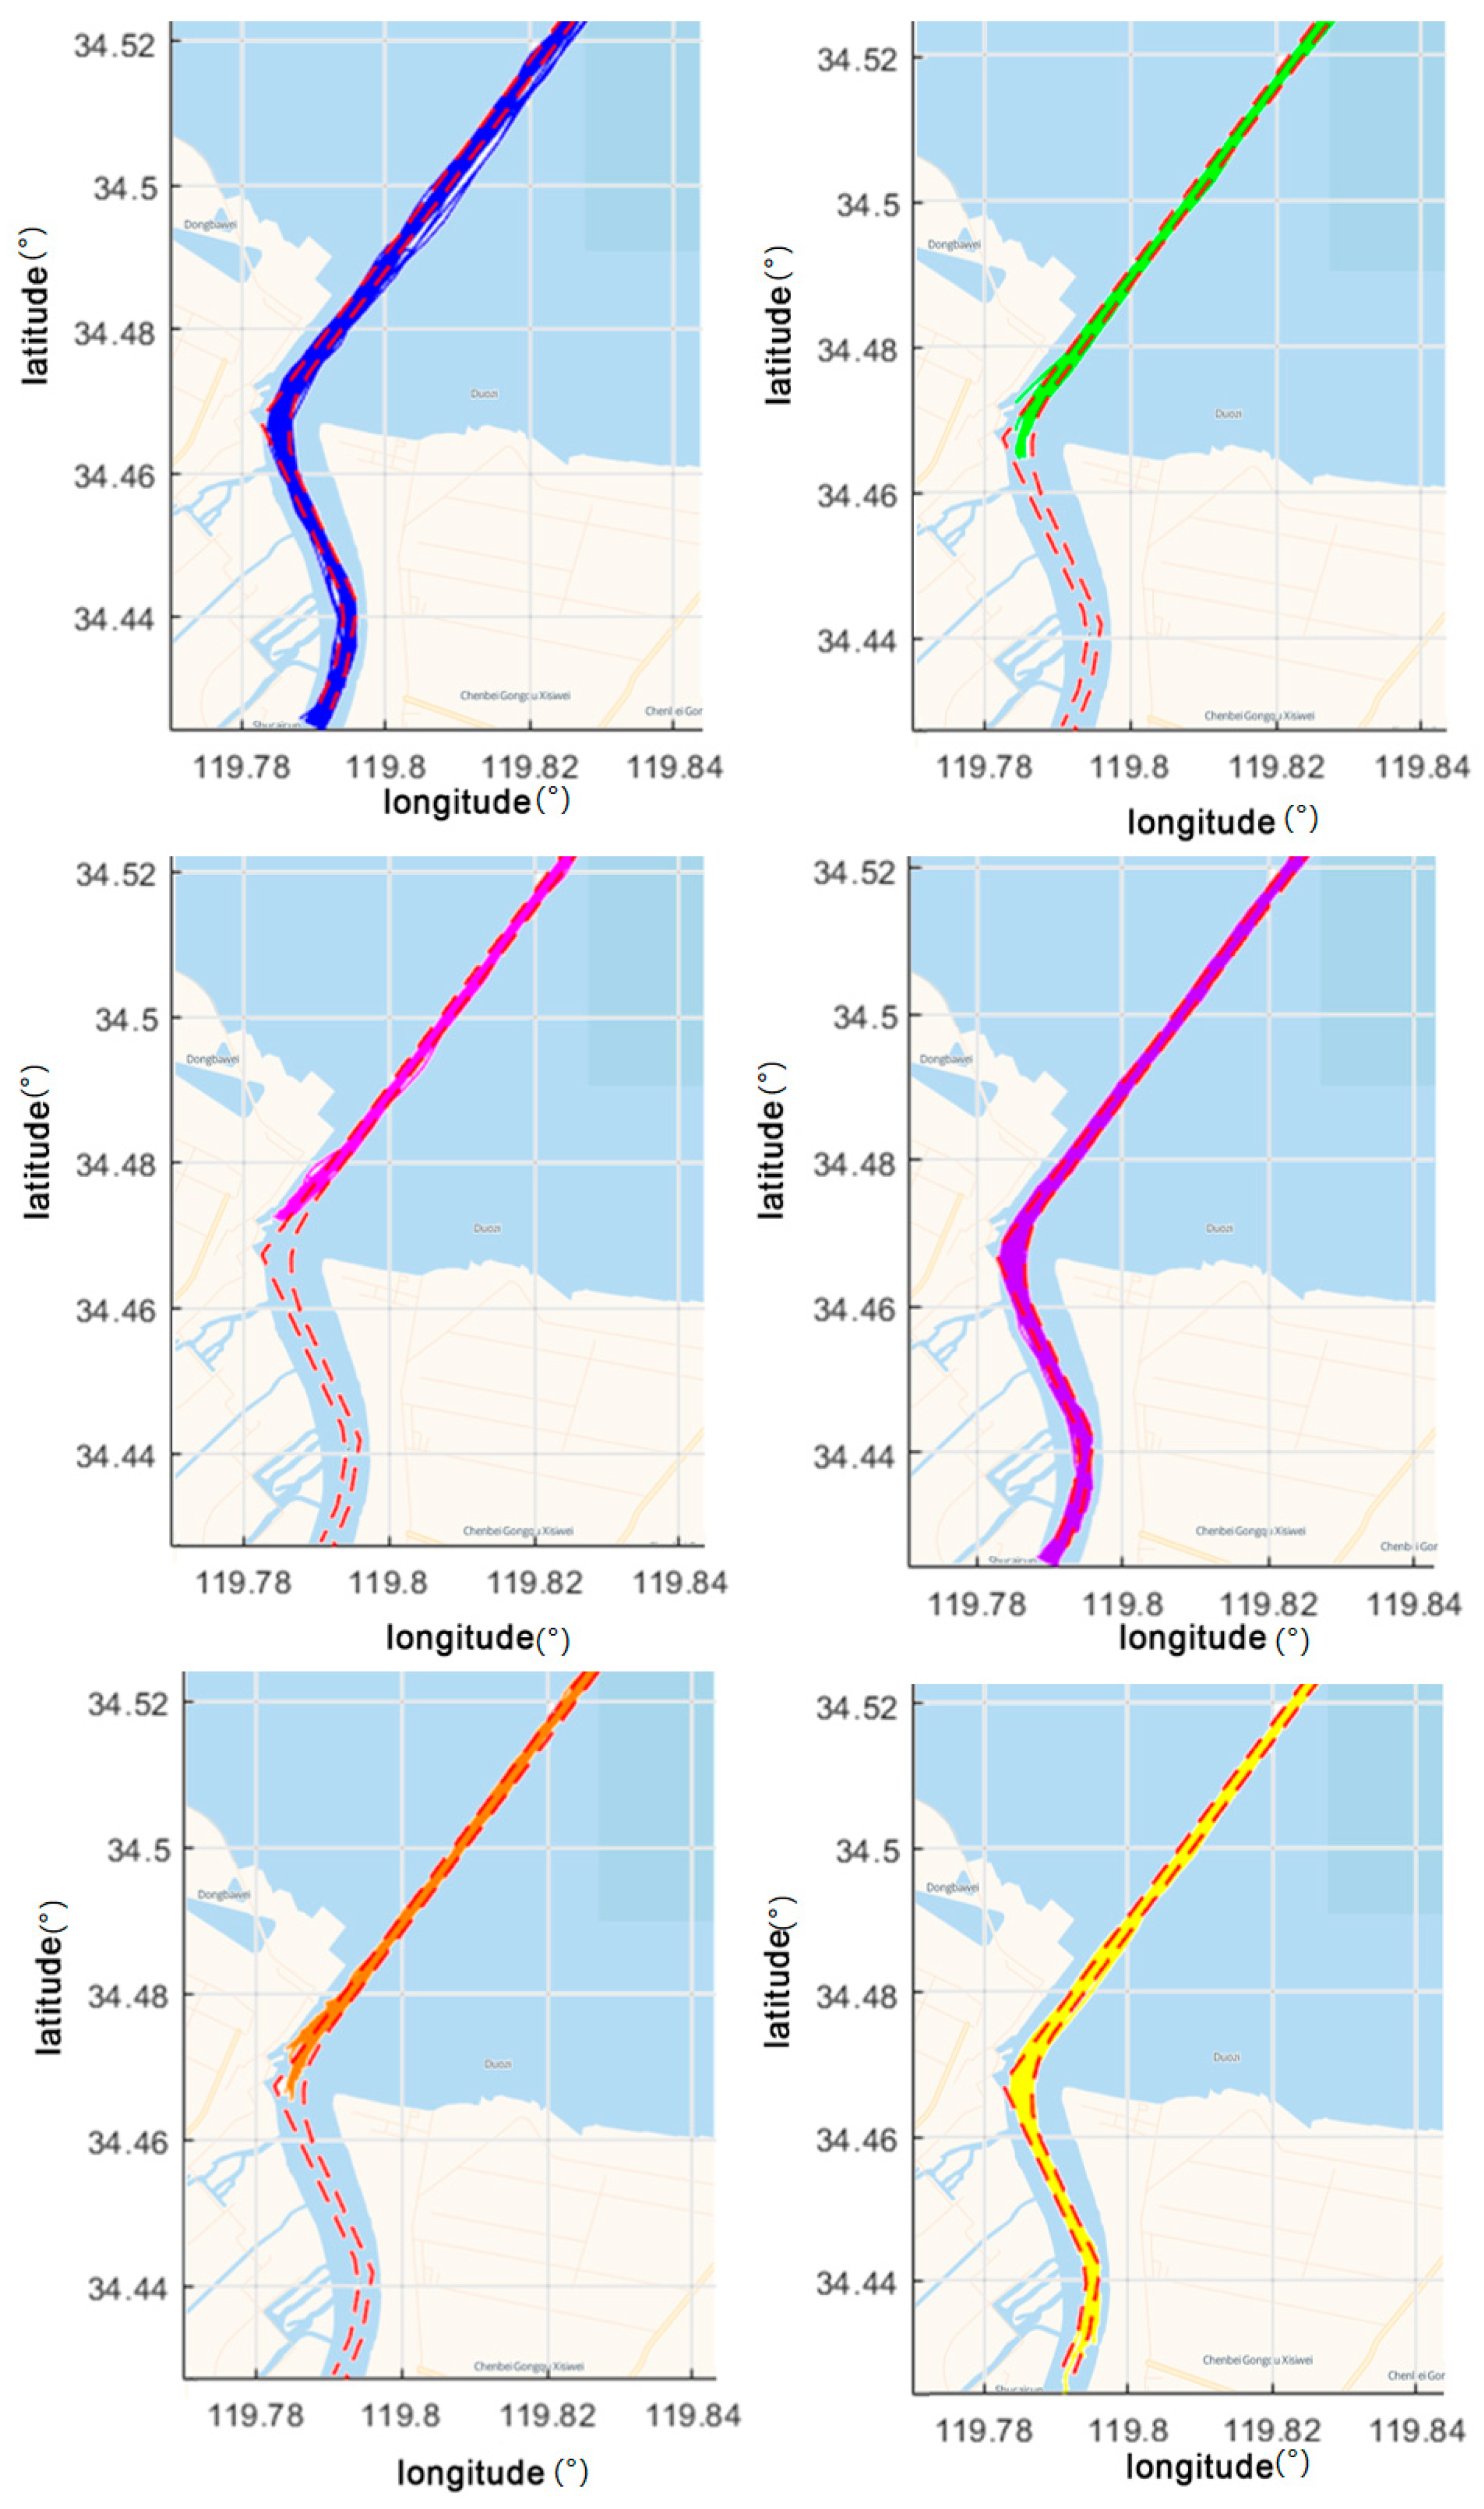
A method of clustering based on density is employed in this study for segments of ship trajectories. Among the density clustering methods, the algorithm DBSCAN is widely used for data from point sets. In this study, the application of DBSCAN is extended to the multidimensional data of ship trajectories. When the DBSCAN algorithm is applied, it is necessary first to standardize the data of ship trajectories into a uniform format, with each segment of trajectories consisting of points from several trajectories.
Given a trajectory L i , its neighborhood is formally defined as
N ε L i = L j D D d i s t L i , L j ε
where ε represents the neighborhood radius of the trajectory segment. D is the set of trajectories. D d i s t L i , L j is the similarity distance between trajectory segments L i and L j .
The criterion for judging a L i trajectory segment is given by Formula (7).
N ε L i minNum
where m i n N u m represents the minimum number of trajectories in the neighborhood. If Formula (7) is satisfied, the trajectory segment is considered a core trajectory segment. If Formula (6) is satisfied but Formula (7) is not, the trajectory segment is regarded as a border trajectory segment.
In the data space, if
L i N ε L j
N ε L j minNum
where L i is directly density-reachable from L j . Clusters representing characteristics of different navigational behaviors are formed by connecting segments of core trajectories and linking them with segments of border trajectories.

Extraction of Typical Ship Trajectories

The method shown in Figure 4 is adopted to determine the typical trajectories of ships. The figure displays three trajectories of ships belonging to the same category, marked as T R 1 , T R 2 , and T R 3 . Among them, trajectory T R 2 is identified as the cluster center. The arrows indicate the general direction of the ships’ navigation, and vertical dashed lines represent the scanning lines. Evaluation bias is reduced by using dynamically adjusted scanning lines to identify the central trajectory within a specific category. The scanning line starts from the initial point of the central trajectory. It moves along the navigation direction. The intersection points with the trajectories are recorded. These points encompass longitude, latitude, heading, and speed data. The average of these intersection points is calculated to determine the representative typical trajectory points. These points are then connected to form a virtual typical trajectory, reflecting the general behavior of the ships in the cluster, as indicated by the blue dashed line in the figure. The accuracy and interpretability of navigation behavior analysis are enhanced by this method.
This section details the steps in collecting and preprocessing AIS data. The traditional Hausdorff distance and its application in ship trajectory clustering are reviewed. Improved versions of the Hausdorff distance are discussed in depth. A ship clustering algorithm based on the OD–Hausdorff distance is proposed. A typical trajectory extraction technique based on cluster centerlines is introduced. Representative trajectories are extracted from numerous ship trajectory data, strengthening decision support for ship navigation safety and efficiency. This process ensures that critical patterns and trends are accurately captured, providing valuable insights for safer and more efficient maritime operations.

3. Results

In this section, the methods described in the previous section are applied to preprocessed AIS data and we perform a clustering analysis of the ship trajectories. MATLAB R2023b software was used to conduct the experiments, demonstrating case verification of the ship trajectory clustering. The following are the specific results and analysis.

3.1. Environment and Data Setup

The focus of this study is on the Guan River Estuary’s inland waterway and the Lanmen-sha area to the Guan River Estuary. The study area ranges from 119°44′54.8628″ E to 119°55′35.0904″ E and 34°29.819′ N to 34°37′23.1636″ N, as shown in Figure 5. Data were sourced from a shore-based AIS database, collected from 1 January 2023 to 31 March 2023 (during the dry season of the Guan River).
Two types of raw experimental data were included: dynamic and static. The dynamic data include ship heading, speed, and position with 12,300,366 records. The static data include ship MMSI numbers, length, width, draft, and other information with 191,634 records. In the data preprocessing stage, data cleaning was performed to remove incomplete and erroneous records, ensuring data quality. The Douglas–Peucker (DP) algorithm was used for trajectory compression to reduce redundant points in the trajectory data, while maintaining the shape characteristics, thereby improving clustering efficiency.
After AIS data processing and DP trajectory compression, 463 high-quality ship trajectories were selected from ships over 60 m, achieving a compression rate of approximately 53.21%. The main research subjects were cargo ships with lengths over 60 m. Due to their large size and significant navigational characteristics, these ships impact waterway management and transportation efficiency. Selecting these ships for clustering validation helps reveal traffic flow, potential bottleneck areas, and conflict points, thereby improving overall shipping safety and efficiency.
The experimental methods include calculating the improved OD–Hausdorff distance and applying the DBSCAN clustering algorithm. The traditional Hausdorff distance is enhanced by the OD–Hausdorff distance calculation through the incorporation of dynamic characteristics of ships, such as heading and speed. Furthermore, it allows for the independent evaluation of different ship trajectory segments, including overall, port, and other segments. This approach provides a more comprehensive and accurate analysis of ship movements. This enhances the accuracy of the trajectory similarity measurements. The DBSCAN clustering algorithm, a density-based spatial clustering method, was extended for the clustering analysis of multidimensional ship trajectory data.

3.2. Clustering Parameter Settings Comparison

The OD–Hausdorff–DBSCAN clustering algorithm involves eight adjustable parameters, including five parameters shared with the Improved Hausdorff–DBSCAN clustering algorithm, neighborhood radius (eps), minimum number (MinNum), similarity weight ( T d ) , speed weight ( T s ), and course weight ( T c ) . Additionally, OD–Hausdorff–DBSCAN introduces three unique parameters, overall trajectory weight ( w 1 ), port vicinity trajectory weight ( w 2 ), and other trajectory weight ( w 3 ).
Normalization is first performed, with data normalized according to the scene requirements of each port, ensuring that the sum of all T values equals 1 and all w values also sum to 1. The dimensional influence between different features is eliminated by this step, making the importance of each feature consistent in the model and avoiding domination by features with larger values. Next, the parameters are adjusted. The neighborhood radius is gradually increased to observe its impact on the number of clusters and the proportion of noise points. The optimal value is determined when the DB index, which measures clustering performance (lower values indicate better performance), is minimized. The minimum number of points (MinNum) required to form a dense region is set and adjusted to ensure meaningful clusters are formed without too many noise points. The weight parameters T d , T s , T c are adjusted to balance the influence of distance, speed, and course in the clustering process. These weights are normalized so that their sum equals 1. The segment weights w 1 , w 2 , w 3 are set for the overall trajectory, port vicinity trajectory, and other trajectory segments, respectively. These weights are crucial for accurately capturing ship behaviors in different segments of the trajectory. Among them, the normalization of the above six kinds of data is done according to the scene requirements of each port. The addition of all T data to 1 and all w data to 1 is ensured, the dimensional influence between different features is eliminated, the importance of each feature to the model is made consistent, and the domination of some features in the model training process due to their large values is avoided.
Optimal clustering performance is achieved with specific parameter settings, as shown in Table 1 of the document. The best balance between clustering accuracy and noise reduction is provided by these settings. For example, the parameter is found to be optimal at 0.0014, resulting in six distinct clusters and a low DB index value.
These unique parameters enhance the algorithm’s flexibility and accuracy in handling inbound and outbound trajectory data. The parameters for the clustering study are shown in Table 1.
From the data analysis in Table 2 of the OD–Hausdorff–DBSCAN clustering study results, it is noted that as the eps parameter gradually increases, the number of clusters formed and the proportion of noise points consistently decreases. However, when the eps value is set to 0.0010, an unexpected reduction in the number of clusters is observed, along with a significantly higher proportion of noise points compared to other cases. The underlying reason for this phenomenon is that the eps value is too small, causing some trajectories to be unable to form clusters with a sufficient number of neighboring trajectories, thereby failing to meet the minimum cluster member requirement, resulting in fewer clusters being formed.
It is concluded that the clustering performance reaches its optimum when the eps value is adjusted to 0.0014, with the trajectory data divided into six distinct clusters, according to the DB index principle which indicates that a lower index value denotes better clustering performance. The clustering results are visualized in Figure 6.
The significant advantages in processing ship trajectory data have been demonstrated by the OD–Hausdorff–DBSCAN algorithm, particularly in the analysis of inbound and outbound trajectories. Port scheduling and waterway management strategies have been optimized by this algorithm, allowing for the effective identification of typical trajectories for entering and leaving ports. As a result, ships are guided to plan routes rationally, and port congestion is reduced. Additionally, the safe monitoring of waterways is aided by precise trajectory analysis, enabling the early identification of potential collision and grounding risks.

Cluster Quality Evaluation

The quality of clustering results is more accurately assessed by independently evaluating each cluster in this study. Specifically, a comprehensive evaluation is conducted using three metrics: the Coefficient of contour, the Density Index, and the Calinski–Harabasz Index (CH Index).
The difference between the cohesion within clusters and the separation between clusters is measured by the Silhouette Coefficient. A value ranging from −1 to 1 is assigned, where higher values indicate that elements within a cluster are tightly connected and distinctly separated from other clusters, signifying a good clustering structure. The tightness of elements within a cluster and the degree of separation between clusters is described by the Density Index. Ideally, high internal density and clear boundary separation from other clusters should characterize a high-quality cluster. Clustering quality is evaluated by the CH Index by comparing the ratio of within-cluster dispersion to between-cluster dispersion. Better clustering quality is indicated by a higher value, implying that elements within clusters are more closely related and the clusters themselves are more distinct.
The scores of the OD–Hausdorff–DBSCAN clustering algorithm under the evaluation criteria of Silhouette Coefficient, Density Index, and CH Index are shown in Figure 7.
Three metrics for clustering performance evaluation were employed in this study, with higher scores indicating better clustering results. Trajectories numbered 1 to 4 were clustered excellently by the OD–Hausdorff–DBSCAN algorithm, with the highest score being achieved by trajectory number 3, which demonstrated the best performance. Considering the evaluation results across all datasets, while the algorithm’s performance may be influenced by the characteristics of specific datasets, higher scores were generally achieved in most cases by the OD–Hausdorff–DBSCAN algorithm.

3.3. Clustering Results of Ship Trajectories

3.3.1. Clustering and Trajectories of Ships under 60 m

The clustering results of cargo ship trajectories with lengths less than 60 m based on the OD–Hausdorff–DBSCAN algorithm are shown below. The specific process of selecting experimental parameters is described in the previous section. 536 trajectories were clustered for ships shorter than 60 m, achieving a compression rate of 53.6% and a DB index of 0.84. The parameters used are listed in Table 3.
The clustering successfully separated the trajectories of ships with lengths less than 60 m into inbound and outbound trajectories for the main channel of the Guan River, as well as for Yanwei Port and Xiangshui Port, as shown in Figure 8. Figure 8a,b illustrate the typical inbound and outbound trajectories for the main channel of the Guan River based on the typical trajectory extraction method for inland ship inbound and outbound scenarios as described in Section 2. Figure 8c,d depict the typical inbound and outbound trajectories for Yanwei Port, while Figure 8e,f show those for Xiangshui Port.
From Figure 9, a total of 100 observation points were selected at equal intervals in the main channel of the Guan River. The mean absolute error (MAE) of the transverse offset distance of the Guan River channel cross-section was calculated for each observation point, as shown in the Table 4. The results are all retained as integers.
It can be observed that ships with lengths less than 60 m typically adhere to the principle of keeping to the right when navigating the Guan River channel and at the entrance and exit of Yanwei Port. Given the known width of the Guan River channel, approximately 170 m, their inbound and outbound trajectories in the cross-sectional view of the channel exhibit lateral offsets of about 5 to 20 m. The Relative Mean Deviation (RMD) is introduced to quantify the extent of ships’ deviations from the center of the channel. By calculating the RMD for large and small ships, their stability and consistency in the channel can be understood. A higher RMD indicates that the ships deviate more significantly from the center of the channel. At this time, the RMD of the channel cross-section is 7.94%. This behavior complies with the basic unidirectional navigation system requirements stipulated by the “Rules for the Routing System of Ships in the Jiangsu Section of the Yangtze River” and the “Interim Regulations on Navigation Safety Management of the Guan River”.
However, the analysis of typical trajectories for ships less than 60 m in length revealed that these small ships and fishing boats tend to slightly deviate when encountering larger unidirectional ships. This explains the observed trajectory deviations and demonstrates the adaptability and flexibility of small ship operators in adhering to navigation rules while ensuring safe passage.

3.3.2. Clustering and Trajectories of Ships over 60 m

The clustering results of cargo ship trajectories with lengths over 60 m based on the OD–Hausdorff–DBSCAN algorithm are shown in Figure 8. The ship trajectories, totaling 463 with lengths over 60 m, were clustered, achieving a compression rate of 53.21% and a DB index of 0.88. The parameters set for the study are shown in Table 5.
The clustering successfully separated the trajectories of ships with lengths over 60 m, as shown in Figure 10. Inbound and outbound trajectories for the main channel of the Guan River were identified, and those for Yanwei Port and Xiangshui Port were also separated. Based on the typical trajectory extraction method for inland ship inbound and outbound scenarios, the typical inbound and outbound trajectories for Yanwei Port are shown in Figure 10a, those for Xiangshui Port are shown in Figure 10b, and those for the main channel of the Guan River are shown in Figure 10c.
From Figure 11, a total of 100 observation points were selected at equal intervals in the main channel of the Guan River. The transverse offset distance of the Guan River channel cross-section was calculated for each observation point to determine the mean absolute error (MAE), as shown in Table 6. All results are retained as integers.
It is observed that ships longer than 60 m typically follow the principle of keeping to the right when navigating the Guan River channel and at the entrance and exit of Yanwei Port, given the known width of the channel, approximately 170 m. Their inbound and outbound trajectories in the cross-sectional view of the Guan River channel exhibit lateral offsets of about 3 to 25 m. At this time, an RMD of 7.06% has been observed for the corresponding channel cross-section. This behavior generally complies with the unidirectional navigation system requirements stipulated by the “Inland Navigation Rules” and the “Interim Regulations on Navigation Safety Management of the Guan River”. The typical trajectories of these ships generally follow the centerline of the straight sections of the channel and navigate along the midline through bends. In the waters near Xiangshui Port, the typical inbound and outbound trajectories of ships less than 60 m in length intersect due to the berths of Xiangshui Port extending along the Guan River channel and being located at a bend. When comparing the typical trajectories of ships shorter than 60 m with those longer than 60 m, it can be seen that, due to their length, ships longer than 60 m follow more centered trajectories to avoid shallow areas. In contrast, fishing or transport ships shorter than 60 m may deviate slightly from the channel centerline to avoid larger ships navigating unidirectionally.

4. Discussion

The OD–Hausdorff distance is employed in this study to analyze ship trajectory data, demonstrating significant innovation and practicality. When entering and leaving ports, ship behaviors are accurately captured, enhancing port operations and surrounding waterway safety analysis. The maximum deviation between trajectories is measured by the OD–Hausdorff distance, explicitly considering the starting and ending points, enabling a detailed depiction of ship behavior patterns as they approach or depart from ports [9]. Additionally, the calculation of the OD–Hausdorff distance includes the overall trajectory and subdivides it into segments for approaching or leaving the port and other key trajectory sections. This allows for more detailed observation and analysis of ship behavior differences at various navigation stages [27]. The method is particularly suitable for analyzing data from complex waterways and busy port areas, where ship behavior may vary due to traffic density, port operations, and other factors. By focusing on these critical areas, more targeted data analysis and solutions are provided, significantly supporting port management and waterway planning optimization [32]. Moreover, the concepts of starting and ending points are introduced to optimize the ship trajectory clustering method. The clustering algorithm can more accurately identify and classify ships exhibiting similar behaviors in port areas but different behaviors in open waters, thereby enhancing clustering accuracy and practicality. The prevention and mitigation of traffic congestion and accident risks in ports and adjacent waterways are essential outcomes of the findings from this research, thereby supporting further research into waterway and port safety and management. Therefore, significant importance is attributed to the study in advancing the understanding and management of maritime traffic in challenging and high-density environments.
In this study, the OD–Hausdorff distance is introduced as an analytical tool that is more complex and detailed for accurately identifying and clustering ships’ behaviors, particularly those related to entering and leaving ports. The precision and reliability of the analysis of ship behavior are significantly enhanced by this approach compared to previous methods. The traditional Hausdorff distance was employed by Mazzarella et al. [1] to cluster trajectories of ships, focusing mainly on the activities of maritime fishing. In contrast, the Hausdorff distance is extended in this study by incorporating the points of origin and destination, allowing for a more nuanced analysis of the behaviors of ships. The general application of AIS data in the marine industry was highlighted by Shelmerdine [2], underscoring its importance in the development and planning of the industry. This study, however, goes further by integrating AIS data with the DBSCAN algorithm, thereby enhancing its utility, practicality, and applicability in real-time in the management of waterways and monitoring of safety. Models for identifying risks of collision and grounding using AIS data were developed by Bakdi et al. [6], concentrating on risk assessment. In comparison, risks are not only assessed by our approach but also a detailed analysis of patterns of behavior of ships is provided, offering a comprehensive tool for both assessment of risk and operational optimization. Analysis of more targeted and effective data is supported by this study by focusing on areas critical to the traffic of ships, ultimately contributing to improved port management and waterway planning. The integration of the OD–Hausdorff distance in this study’s method comprehensively considers the dynamic characteristics of ships (such as speed and heading), significantly improving the accuracy of risk prediction, particularly in analyzing ship behavior in port areas. The Gaussian Mixture Model (GMM) is widely used for clustering maritime traffic data. However, it is assumed that the data follow a Gaussian distribution, which may not accurately capture the complex behavior patterns of ship trajectories. Kernel Density Estimation (KDE) is another popular method for anomaly detection and clustering in maritime data. While effective in some cases, KDE can find handling high-dimensional data challenging and may not perform well in scenarios with varying ship behaviors. Multi-density DBSCAN (MDBSCAN) addresses some limitations of DBSCAN by introducing the concept of relative density. Although it improves the handling of multi-scale data, the dynamic characteristics of ships are still not fully incorporated. Vespe et al. [5] emphasized the application of unsupervised learning and anomaly detection techniques in trajectory analysis. This study optimizes trajectory clustering and enhances the ability to extract useful information from trajectory data, especially when handling data with complex behavior patterns, by introducing the OD–Hausdorff and DBSCAN algorithms. Raja et al. [4] and Qian et al. [12] demonstrated the effectiveness of the DBSCAN algorithm in maritime data clustering. Compared to these studies, this method further refines the application of DBSCAN by using the OD–Hausdorff distance, independently evaluating different trajectory sections, and adjusting weight coefficients, making clustering results more targeted and accurate.
The method presented in this study could be used to optimize port scheduling and channel management strategies by accurately clustering ship trajectories. By identifying typical inbound and outbound trajectories, managers could more effectively guide ships in planning routes and reduce port congestion. This method accurately clusters ship trajectories and enhances port scheduling and channel management strategies. Additionally, precise trajectory analysis aids in ensuring channel safety by identifying potential collision and grounding risks in advance [33]. The clustering analysis method provided in this study can be used to predict the traffic flow patterns of ships, thereby optimizing traffic flow management [34]. Navigation strategies can be adjusted more flexibly by analyzing the real-time clustered data of ship trajectories, such as adjusting speeds and lane assignments during peak periods to enhance overall shipping efficiency [32]. This study’s method not only improves the accuracy of trajectory clustering but also provides robust support for navigational behavior analysis through the extraction of typical trajectories from the clustering results [31,35,36,37]. This has significant applications in maritime management, channel planning, and traffic flow optimization. For instance, by identifying typical inbound and outbound trajectories, ships can be guided more effectively in route planning, reducing port congestion [38]. Precise trajectory analysis also helps identify potential collision and grounding risks in advance, thereby enhancing navigational safety [39,40,41].
Despite progress in ship trajectory analysis, limitations remain. The OD–Hausdorff distance method’s complexity reduces efficiency for large datasets, limiting real-time use. Parameter optimization lacks automation, affecting adaptability. Future research should optimize methods, automate parameter adjustment, and conduct empirical studies.

5. Conclusions

This study employed a method based on the OD–Hausdorff distance and the DBSCAN algorithm to conduct precise analysis and cluster ship trajectory data. The research first ensured the quality and reliability of AIS data through rigorous collection and preprocessing, thereby providing a solid foundation for subsequent trajectory analysis. This study enhanced the clustering accuracy and efficiency of ship trajectories and significantly improved clustering precision by meticulously calculating different parts of the trajectories (overall parts, port parts, and other parts) through the introduction of the improved OD–Hausdorff distance. Combined with the DBSCAN algorithm, the method further strengthened the ability to handle complex multidimensional trajectory data, effectively capturing and analyzing subtle changes in ship movements during port entry and exit. This approach provides decision support for maritime management, waterway planning, and traffic flow optimization and offers important theoretical and methodological guidance for related fields.
The main contribution of this study is the proposal of an OD–Hausdorff distance method that enhances ship behavior analysis and trajectory clustering, significantly improving port scheduling and channel management. However, several areas require improvement, such as the high computational complexity limiting its efficiency for large datasets and relying on empirical parameter settings. Future research should focus on algorithm optimization, automated parameter adjustment, and validating the method’s applicability in more complex maritime environments.

Author Contributions

Data curation, H.Y.; Investigation, L.G. and T.Y.; Methodology, Z.L., H.Y., C.X. and Y.S.; Resources, C.X.; Software, T.Y.; Writing—original draft, Z.L.; Writing—review & editing, F.X., L.G. and Y.S. All authors have read and agreed to the published version of the manuscript.

Funding

Not applicable.

Institutional Review Board Statement

Not applicable.

Informed Consent Statement

Not applicable.

Data Availability Statement

The raw contributions presented in the study are included in the article. Further inquiries can be directed to the corresponding author.

Conflicts of Interest

Author Haining Yang was employed by the CCCC Water Transportation Consultants Co., Ltd, Beijing, 100007, China. Author Chenghuai Xiong was employed by theFiberhome Communication Technology Co., Ltd., Wuhan 430074, China. The remaining authors declare that the research was conducted in the absence of any commercial or financial relationships that could be construed as a potential conflict of interest.

References

  1. Mazzarella, F.; Vespe, M.; Damalas, D.; Osio, G. Discovering vessel activities at sea using AIS data: Mapping of fishing footprints. In Proceedings of the 17th International Conference on Information Fusion (FUSION), Salamanca, Spain, 7–10 July 2014; pp. 1–7. [Google Scholar]
  2. Shelmerdine, R.L. Teasing out the detail: How our understanding of marine AIS data can better inform industries, developments, and planning. Mar. Policy 2015, 54, 17–25. [Google Scholar] [CrossRef]
  3. Simsir, U.; Ertugrul, S. Prediction of manually controlled vessels’ position and course navigating in narrow waterways using Artificial Neural Networks. Appl. Soft Comput. 2009, 9, 1217–1224. [Google Scholar] [CrossRef]
  4. Raja, M.; Hasan, P.; Mahmudunnobe, M.; Saifuddin, M.; Hasan, S.N. Membership determination in open clusters using the DBSCAN Clustering Algorithm. Astron. Comput. 2024, 47, 100826. [Google Scholar] [CrossRef]
  5. Vespe, M.; Visentini, I.; Bryan, K.; Braca, P. Unsupervised learning of maritime traffic patterns for anomaly detection. In Proceedings of the 9th IET Data Fusion & Target Tracking Conference (DF&TT 2012): Algorithms & Applications, London, UK, 16–17 May 2012; pp. 1–5. [Google Scholar]
  6. Bakdi, A.; Glad, I.K.; Vanem, E.; Engelhardtsen, Ø. AIS-Based Multiple Vessel Collision and Grounding Risk Identification based on Adaptive Safety Domain. J. Mar. Sci. Eng. 2019, 8, 5. [Google Scholar] [CrossRef]
  7. Zhang, W.; Jiang, W.; Liu, Q.; Wang, W. AIS data repair model based on generative adversarial network. Reliab. Eng. Syst. Saf. 2023, 240, 109572. [Google Scholar] [CrossRef]
  8. Knorr, E.M.; Ng, R.T.; Tucakov, V. Distance-based outliers: Algorithms and applications. VLDB J. Int. J. Very Large Data Bases 2000, 8, 237–253. [Google Scholar] [CrossRef]
  9. Lin, B.; Zheng, M.; Chu, X.; Zhang, M.; Mao, W.; Wu, D. A novel method for the evaluation of ship berthing risk using AIS data. Ocean Eng. 2024, 293, 116595. [Google Scholar] [CrossRef]
  10. Yang, J.; Bian, X.; Qi, Y.; Wang, X.; Yang, Z.; Liu, J. A spatial-temporal data mining method for the extraction of vessel traffic patterns using AIS data. Ocean Eng. 2024, 293, 116454. [Google Scholar] [CrossRef]
  11. Laxhammar, R.; Falkman, G.; Sviestins, E. Anomaly detection in sea traffic—A comparison of the Gaussian Mixture Model and the Kernel Density Estimator. In Proceedings of the 2009 12th International Conference on Information Fusion, Seattle, WA, USA, 6–9 July 2009; pp. 756–763. [Google Scholar]
  12. Qian, J.; Zhou, Y.; Han, X.; Wang, Y. MDBSCAN: A multi-density DBSCAN based on relative density. Neurocomputing 2024, 576, 127329. [Google Scholar] [CrossRef]
  13. Newaliya, N.; Singh, Y. Multivariate hierarchical DBSCAN model for enhanced maritime data analytics. Data Knowl. Eng. 2024, 150, 102282. [Google Scholar] [CrossRef]
  14. Ouyang, T.; Shen, X. Online structural clustering based on DBSCAN extension with granular descriptors. Inf. Sci. 2022, 607, 688–704. [Google Scholar] [CrossRef]
  15. Ros, F.; Guillaume, S.; Riad, R.; El Hajji, M. Detection of natural clusters via S-DBSCAN a Self-tuning version of DBSCAN. Knowl.-Based Syst. 2022, 241, 108288. [Google Scholar] [CrossRef]
  16. Zhu, Q.; Tang, X.; Elahi, A. Application of the novel harmony search optimization algorithm for DBSCAN clustering. Expert Syst. Appl. 2021, 178, 115054. [Google Scholar] [CrossRef]
  17. de Moura Ventorim, I.; Luchi, D.; Rodrigues, A.L.; Varejão, F.M. BIRCHSCAN: A sampling method for applying DBSCAN to large datasets. Expert Syst. Appl. 2021, 184, 115518. [Google Scholar] [CrossRef]
  18. Chen, Y.; Tang, S.; Bouguila, N.; Wang, C.; Du, J.; Li, H. A fast clustering algorithm based on pruning unnecessary distance computations in DBSCAN for high-dimensional data. Pattern Recognit. 2018, 83, 375–387. [Google Scholar] [CrossRef]
  19. Chen, H.; Liang, M.; Liu, W.; Wang, W.; Liu, P.X. An approach to boundary detection for 3D point clouds based on DBSCAN clustering. Pattern Recognit. 2022, 124, 108431. [Google Scholar] [CrossRef]
  20. Chen, Z.; Li, Y.F. Anomaly Detection Based on Enhanced DBScan Algorithm. Procedia Eng. 2011, 15, 178–182. [Google Scholar] [CrossRef]
  21. Gan, L.; Yan, Z.; Zhang, L.; Liu, K.; Zheng, Y.; Zhou, C.; Shu, Y. Ship path planning based on safety potential field in inland rivers. Ocean Eng. 2022, 260, 111928. [Google Scholar] [CrossRef]
  22. Shu, Y.; Xiong, C.; Zhu, Y.; Liu, K.; Liu, R.W.; Xu, F.; Gan, L.; Zhang, L. Reference path for ships in ports and waterways based on optimal control. Ocean Coast. Manag. 2024, 253, 107168. [Google Scholar] [CrossRef]
  23. Guo, Z.; Qiang, H.; Xie, S.; Peng, X. Unsupervised knowledge discovery framework: From AIS data processing to maritime traffic networks generating. Appl. Ocean Res. 2024, 146, 103924. [Google Scholar] [CrossRef]
  24. Liu, Z.; Zhou, W.; Yuan, Y. 3D DBSCAN detection and parameter sensitivity of the 2022 Yangtze river summertime heatwave and drought. Atmos. Ocean. Sci. Lett. 2023, 16, 100324. [Google Scholar] [CrossRef]
  25. Vikhrov, A. Denseness of metric spaces in general position in the Gromov–Hausdorff class. Topol. Its Appl. 2024, 342, 108771. [Google Scholar] [CrossRef]
  26. Jing, W.; Zhao, C.; Jiang, C. An improvement method of DBSCAN algorithm on cloud computing. Procedia Comput. Sci. 2019, 147, 596–604. [Google Scholar] [CrossRef]
  27. Gan, L.; Ye, B.; Huang, Z.; Xu, Y.; Chen, Q.; Shu, Y. Knowledge graph construction based on ship collision accident reports to improve maritime traffic safety. Ocean Coast. Manag. 2023, 240, 106660. [Google Scholar] [CrossRef]
  28. Wang, S.; Li, Y.; Xing, H. A novel method for ship trajectory prediction in complex scenarios based on spatio-temporal features extraction of AIS data. Ocean Eng. 2023, 281, 114846. [Google Scholar] [CrossRef]
  29. Zhang, C.; Liu, S.; Guo, M.; Liu, Y. A novel ship trajectory clustering analysis and anomaly detection method based on AIS data. Ocean Eng. 2023, 288, 116082. [Google Scholar] [CrossRef]
  30. Zhang, D.; Zhang, Y.; Zhang, C. Data mining approach for automatic ship-route design for coastal seas using AIS trajectory clustering analysis. Ocean Eng. 2021, 236, 109535. [Google Scholar] [CrossRef]
  31. Rong, H.; Teixeira, A.P.; Guedes Soares, C. A framework for ship abnormal behaviour detection and classification using AIS data. Reliab. Eng. Syst. Saf. 2024, 247, 110105. [Google Scholar] [CrossRef]
  32. Wang, L.; Chen, P.; Chen, L.; Mou, J. Ship AIS Trajectory Clustering: An HDBSCAN-Based Approach. J. Mar. Sci. Eng. 2021, 9, 566. [Google Scholar] [CrossRef]
  33. Wolsing, K.; Roepert, L.; Bauer, J.; Wehrle, K. Anomaly Detection in Maritime AIS Tracks: A Review of Recent Approaches. J. Mar. Sci. Eng. 2022, 10, 112. [Google Scholar] [CrossRef]
  34. Jon, M.H.; Kim, Y.P.; Choe, U. Determination of a safety criterion via risk assessment of marine accidents based on a Markov model with five states and MCMC simulation and on three risk factors. Ocean Eng. 2021, 236, 109000. [Google Scholar] [CrossRef]
  35. Liu, K.; Yuan, Z.; Xin, X.; Zhang, J.; Wang, W. Conflict detection method based on dynamic ship domain model for visualization of collision risk Hot-Spots. Ocean Eng. 2021, 242, 110143. [Google Scholar] [CrossRef]
  36. Shu, Y.; Han, B.; Song, L.; Yan, T.; Gan, L.; Zhu, Y.; Zheng, C. Analyzing the spatio-temporal correlation between tide and shipping behavior at estuarine port for energy-saving purposes. Appl. Energy 2024, 367, 123382. [Google Scholar] [CrossRef]
  37. Zhang, J.; Wang, H.; Cui, F.; Liu, Y.; Liu, Z.; Dong, J. Research into Ship Trajectory Prediction Based on An Improved LSTM Network. J. Mar. Sci. Eng. 2023, 11, 1268. [Google Scholar] [CrossRef]
  38. Xie, W.; Li, Y.; Yang, Y.; Wang, P.; Wang, Z.; Li, Z.; Mei, Q.; Sun, Y. Maritime greenhouse gas emission estimation and forecasting through AIS data analytics: A case study of Tianjin port in the context of sustainable development. Front. Mar. Sci. 2023, 10, 1308981. [Google Scholar] [CrossRef]
  39. Shu, Y.; Hu, A.; Zheng, Y.; Gan, L.; Xiao, G.; Zhou, C.; Song, L. Evaluation of ship emission intensity and the inaccuracy of exhaust emission estimation model. Ocean Eng. 2023, 287, 115723. [Google Scholar] [CrossRef]
  40. Ferrara, R.; Virdis, S.G.P.; Ventura, A.; Ghisu, T.; Duce, P.; Pellizzaro, G. An automated approach for wood-leaf separation from terrestrial LIDAR point clouds using the density based clustering algorithm DBSCAN. Agric. For. Meteorol. 2018, 262, 434–444. [Google Scholar] [CrossRef]
  41. Gao, M.; Shi, G.-Y. Ship-handling behavior pattern recognition using AIS sub-trajectory clustering analysis based on the T-SNE and spectral clustering algorithms. Ocean Eng. 2020, 205, 106919. [Google Scholar] [CrossRef]
Figure 1. Technology roadmap.
Jmse 12 01398 g001
Figure 2. Principle of DP compression algorithm.
Jmse 12 01398 g002
Figure 3. OD–Hausdorff similarity measurement.
Jmse 12 01398 g003
Figure 4. Acquisition of typical ship trajectories.
Jmse 12 01398 g004
Figure 5. Schematic diagram of the Guan River area.
Jmse 12 01398 g005
Figure 6. OD–Hausdorff–DBSCAN clustering results when the eps value is adjusted to 0.0014.
Jmse 12 01398 g006
Figure 7. OD–Hausdorff–DBSCAN clustering and Hausdorff–DBSCAN clustering score coefficient.
Jmse 12 01398 g007
Figure 8. Clustering results of ships with lengths below 60 meters.
Jmse 12 01398 g008
Figure 9. Typical trajectories for ships less than 60 m.
Jmse 12 01398 g009
Figure 10. Clustering results of ships with length above 60 meters.
Jmse 12 01398 g010
Figure 11. Typical trajectories for ships longer than 60 m.
Jmse 12 01398 g011
Table 1. OD–Hausdorff–DBSCAN clustering parameter settings.
ParametersMinNum T d T s T c w 1 w 2 w 3
Values420.60.10.30.50.40.1
Table 2. OD–Hausdorff–DBSCAN clustering experiment.
epsNumber of ClustersNoise RatioDB Index
0.0010528.12%1.67
0.0014615.35%0.88
0.0018612.21%0.97
0.0022510.63%1.26
0.002558.59%1.33
0.003046.87%1.46
Table 3. Clustering parameter values for ships with a length below 60 m.
ParametersepsMinNum T d T s T c w 1 w 2 w 3
Values0.0014500.6 0.1 0.30.50.40.1
Table 4. The table of mean absolute errors for each observation point.
POINT123456...333435...9899100
MAE (m)|−7||−8||−5||−6||−6||−5|...|−18||−20||−17|...|−9||−10||−11|
Table 5. Clustering parameter values for ships with length above 60 m.
ParametersepsMinNum T d T s T c w 1 w 2 w 3
Values0.0014420.6 0.1 0.30.50.40.1
Table 6. The table of mean absolute errors for each observation point.
POINT123456...394041...9899100
MAE (m)|−7||−6||−4||−3||−3||−4|...|−23||−25||−22|...|−16||−15||−14|
Disclaimer/Publisher’s Note: The statements, opinions and data contained in all publications are solely those of the individual author(s) and contributor(s) and not of MDPI and/or the editor(s). MDPI and/or the editor(s) disclaim responsibility for any injury to people or property resulting from any ideas, methods, instructions or products referred to in the content.

