Abstract
Microplastics (MPs), typically defined as plastic fragments smaller than 5 mm, are pervasive in terrestrial and marine ecosystems. There is a need for rapid, portable, low-cost detection systems to assess health and environmental risks. Fluorescent tagging with Nile Red (NR) has emerged as a popular detection method, but variations in fluorescent emissions based on NR solvent, plastic polymer, excitation wavelength, and additives complicate standardization. In this study, seven plastic samples stained with acetone-based NR were analyzed using a fluorescent spectrometer to identify optimal emission peaks across UV-Vis excitation wavelengths. These findings aid in selecting appropriate excitation wavelengths and optical filters for future detection systems. Additionally, a straightforward polymer identification scheme was validated against field-collected plastic samples, whose material composition was confirmed via Fourier Transform Infrared Spectroscopy. This work contributes towards developing accessible microplastic detection technologies by characterizing the fluorescent properties of NR-stained plastics and enhancing the capability for effective environmental monitoring. Future research will expand the dataset to include diverse plastics with varying additives and weathering, and incorporate computer-vision tools for automated data processing and polymer identification.
1. Introduction
Microplastic detection presents numerous challenges due to the diverse shapes, densities, physical degradation, additives, and chemical compositions of plastics in the natural environment. Generally, microplastics are defined as plastic pieces smaller than 5 mm. However, despite the growing number of microplastic studies, uniform size definitions and microplastic sampling procedures are not widely adopted, posing an obstacle for easy comparison between findings from various studies [1]. Given that there is no single standardized detection and analysis process for microplastics, multiple instruments are typically used for plastic identification [2]. Assessing microplastic presence in marine environments necessitates quantifying both concentration and polymer composition. However, consumer plastics often contain additives that influence their visual appearance and degradation rates, resulting in significant variability in size, shape, and other material characteristics that complicates the standardization of detection methods [1].
Common detection techniques include visual analysis, fluorescence microscopy, Fourier Transform Infrared Spectroscopy (FT-IR), Raman Spectroscopy, and pyrolysis gas chromatography mass spectrometry (Py-GC-MS) [1,2]. While visual analysis is straightforward, it lacks chemical composition data and is prone to errors with small particles. FT-IR provides detailed information about chemical bonds and functional groups, making it suitable for qualitative detection and compositional analysis, despite being limited to particles larger than 20 m [3]. However, FT-IR instrumentation is not field-portable. Raman Spectroscopy, which uses inelastic light scattering, can analyze microplastics below 20 m without sample drying, but it suffers from challenges posed by weak signals and spectral interference from fluorescence [4]. Py-GC-MS identifies microplastic composition based on thermal signatures but is destructive, making it unsuitable for evaluating physical properties like appearance and morphology, which are important in detection surveys [5].
Moreover, the high monetary cost of laboratory equipment for these spectroscopy and spectrometry techniques can be prohibitive for research communities with limited funding [4]. The methods described can also be incredibly time-consuming [2,4,6]. Fluorescent tagging with solvatochromatic dyes has emerged as a low-cost and accessible method for staining plastics. Notably, Nile Red (NR) gained popularity following a 2017 Nature publication by Maes et al. (2017), which demonstrated a high recovery rate of NR-dyed microplastics from spiked sediment samples. Subsequent studies have confirmed that Nile Red is the most effective dye for staining microplastics [7,8,9,10,11]. This hydrophobic dye exhibits minimal fluorescence in water and preferentially binds to plastics due to its lipophilic nature. The fluorescence emissions from NR-dyed plastics vary in color and intensity depending on the type of plastic, ranging from yellow to deep red. Maes et al. (2017) also highlighted that the solvatochromatic properties of Nile Red could be utilized for categorizing plastics based on polymer surface polarity [7]. Additionally, Nile Red is inexpensive, and its fluorescent emissions can be detected using low-cost photodiodes or cameras. Studies have also shown that Nile Red stains organic materials more slowly than plastics, which can help reduce false positives in environmental samples [7]. These features make Nile Red an ideal choice for low-cost, field-portable microplastic detection, combining ease of visual analysis with insights into chemical composition.
However, fluorescent staining methods with Nile Red are not standardized; a literature review reveals considerable variation in solvent choices, staining protocols, excitation wavelengths, and optical filters used in experimental setups [2,12,13,14,15,16]. Identifying the strongest fluorescence emission peaks for NR-stained plastics across various excitation wavelengths will refine experimental configurations and aid in developing standardized protocols. The consistent selection of excitation wavelengths and optical filters can maximize plastic fluorescence intensity, and measuring spectra at multiple wavelengths can uncover key spectral patterns for polymer identification.
This study aims to provide fluorescent emission data that will build a basis for standardizing Nile Red-based fluorescent tagging experiments. Seven plastics stained with acetone-based Nile Red were characterized for three excitation wavelengths using a fluorescence spectrometer. A preliminary polymer identification scheme based on the collected fluorescent peaks is discussed. Furthermore, there is a pressing need for a rapid, microplastic detection system that costs hundreds, not thousands, of dollars and that can be easily accessed and deployed by various coastal communities. This work aims to address this gap by providing a proof-of-concept low-cost microplastic imaging system. Images taken with the system are paired with the spectral data to highlight visual and spectral patterns that can be incorporated into machine learning/artificial intelligence-based tools.
2. Materials and Methods
This study used seven commercially available plastics: polypropylene (PP), polyethylene (PE), polystyrene (PS), polyester, polyurethane (PUR), polyvinyl chloride (PVC), and nylon. The plastic types selected contain a range of densities, form factors, and include the most common polymers used in current research studies using Nile Red for staining MPs [2,17,18]. Table 1 contains further details on the sample materials used in this study. The polymer composition types were verified using a Bruker Alpha II FT-IR spectrometer. All spectra were recorded in transmittance mode in the infrared spectral range 4000–400 cm−1 using a resolution of 4 cm−1 and 64 scans per sample. The recorded spectra were then compared with commercial spectra libraries for verification.

Table 1.
Overview of plastic materials tested.
Staining protocols were adapted from a variety of literature sources [2,7,17,19,20]. To prepare plastics for fluorescence spectroscopy characterization, materials were cut or shaped into approximately 30 mm × 30 mm sample sizes. They were then washed with ultrapure Milli-Q water and vacuum-filtered onto Whatman glass filters. After drying, 1 mL of a 10 g/mL acetone Nile Red solution was pipetted onto the plastic, which immersed the samples. At this concentration, a good balance between fluorescence intensity and background interference can be achieved [7,17,21]. Acetone was selected as the solvent based on its ease of access and popularity in the literature [2,10,18,22]. After 15 min, the samples were washed with Milli-Q water to remove residual dye. All solutions and suspensions were prepared using Milli-Q water.
Fluorescence Spectrometer Parameters
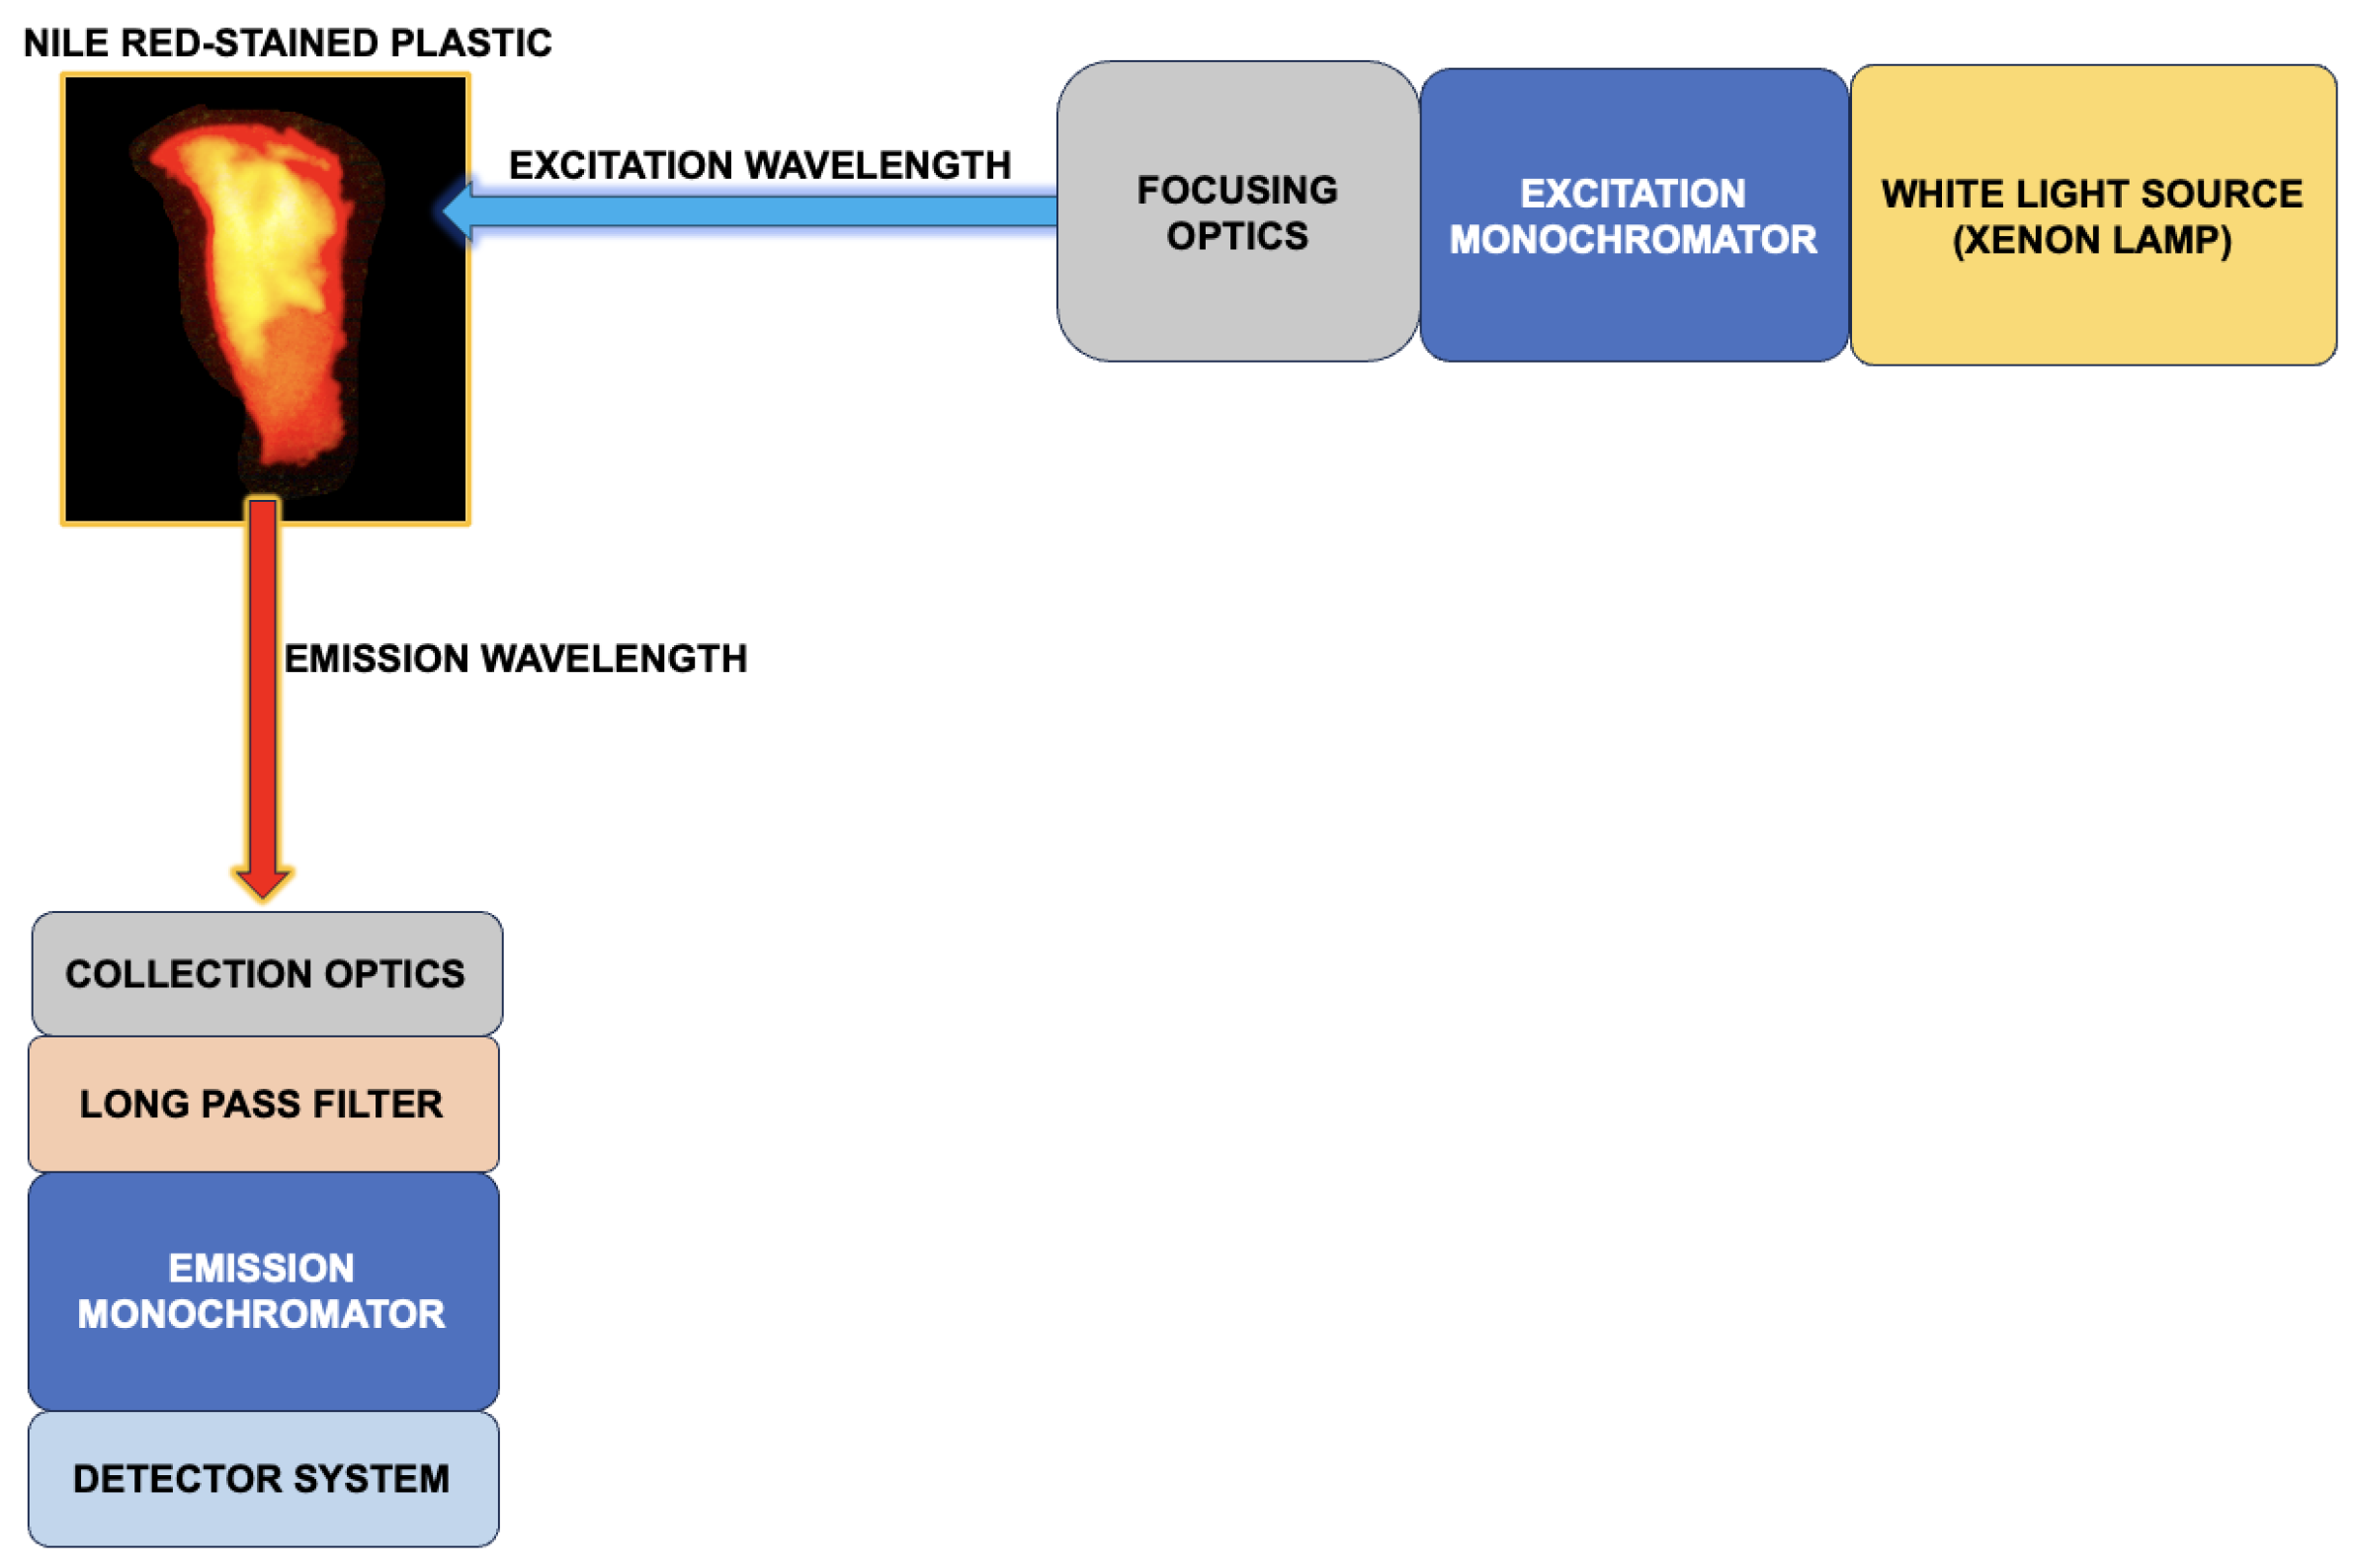
A fluorescence spectrometer fully characterizes the emission wavelength peaks of plastic samples stained with Nile Red (NR). In this experiment, the system used fixed excitation wavelengths to excite the dyed samples and scan the emission wavelengths to record the resulting spectral peaks.
Figure 1 displays a schematic that describes data collection for emission spectra in a fluorescence spectrometer.
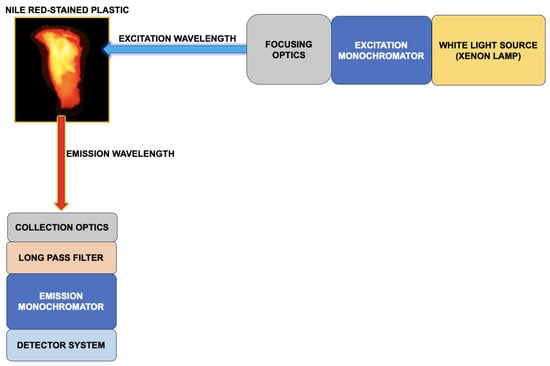
Figure 1.
Fluorescence spectroscopy experimental setup.
A Cary Eclipse fluorescence spectrometer (Agilent, Santa Clara, CA, USA) equipped with a Xenon flash lamp (Hamamatsu, Shizuoka, Japan) was employed for spectral data collection. Three samples for each type of plastic were excited at three distinct wavelengths, which are standard wavelengths used to excite Nile Red [2]: 405 nm, 465 nm, and 525 nm. Multiple studies have presented fluorescence emission spectra for unstained plastics or specific Nile Red-stained plastics at a single excitation wavelength, usually in the UV range [8,22,23,24,25]. However, compiling a comprehensive dataset of plastics using various excitation wavelengths has proven challenging. To address this, our study was designed to analyze each plastic sample using three different excitation wavelengths. These wavelengths can also be easily replicated using commercially available inexpensive light sources such as ultraviolet (UV), blue, and green LEDs, which are commonly used in low-cost Nile Red-based microplastic detection systems.
To filter out the excitation light from the fluorescence spectrometer, long-pass filters made from Schott glass were utilized. Given that the long-pass filters did not sharply eliminate the excitation light from the Xenon lamp, the scanned emission wavelength ranges were chosen to allow for a minimum of 5 nm gap between the scanning range and the long-pass filter cut-on wavelength. Table 2 provides further details on long-pass filter models and selected emission wavelength ranges.
Table 2.
Overview of optical filters and excitation/emission wavelength parameters.
The voltmeter sensitivity was adjusted for each sample to enhance the separation of excitation peaks. A scan rate of 600 nm/min, a data interval of 1 nm, and an averaging time of 0.1 s were used. Both the excitation and emission slits were set to 5 nm.
3. Results
3.1. Spectral Data from Nile Red-Stained Lab Plastic Materials
The following section presents the fluorescent spectrometer results. The fluorescent emission spectra of plastic samples stained with NR and excited at 405 nm, 465 nm, and 525 nm excitation wavelengths are shown in Figure 2 and the prominent peaks for each excitation wavelength are enumerated in Table 3. The raw results were first processed using the Savitzky–Golay smoothing method with a window size of 11 nm and a polynomial order of 3. The emission intensity was normalized to values ranging from 0 to 1. The data were then plotted in MATLAB, R2024a and a peak finder algorithm was used to label prominent peaks.
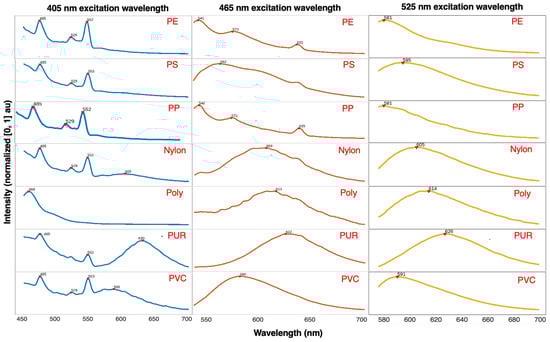
Figure 2.
Fluorescent emission spectra of Nile Red-stained lab plastics for different excitation wavelengths. Column (left) displays the spectra of plastics excited by 405 nm, plotted in blue on the left. Column (middle) displays the spectra of plastics excited by 465 nm, plotted in orange in the middle. Column (right) displays the spectra of plastics excited by 525 nm, plotted in yellow on the right [26].
Table 3.
Fluorescent emission peaks of Nile Red-stained plastics for different excitation wavelengths [26].
The left column of Figure 2 presents the fluorescent emission peaks of plastics excited at 405 nm. Some plastics, particularly polyester, exhibit autofluorescence at this wavelength. The spectra indicate that all plastics, except polyester (poly), display fluorescent peaks at 485 nm and 552 nm, with PE, PS, PP, nylon, and PVC sharing peaks at 485 nm, 529 nm, and 552 nm, respectively. Additionally, nylon, PUR, and PVC show fluorescence in the range of 580 nm to 650 nm. These additional spectral peaks can serve as distinguishing factors in a polymer identification model. Polyester, due to its high autofluorescence, lacks discernible peaks apart from one around 469 nm.
The middle column of Figure 2 illustrates the fluorescent emission peaks of plastics excited at 465 nm. PE and PP exhibit similar spectra with peaks around 541 nm, 572 nm, and 633 nm, with peak intensity decreasing as the wavelength increases. PS and PVC display peaks between 560 nm and 580 nm, while nylon, polyester, and PUR show more red-shifted peaks in the 600 nm to 620 nm range. The fluorescent emission peaks of plastic samples stained with Nile Red and excited at 465 nm indicate that PE and PP are less fluorescent compared to the other plastics, as evidenced by the area under their normalized intensity curves.
The right column of Figure 2 displays the fluorescent emission peaks of plastics excited at 525 nm. A broad and smooth emission curve can be observed across all plastics, with peak wavelengths clustered within approximately 40 nm of each other. PS, PUR, nylon, and polyester display more red-shifted peaks compared to PE, PP, and PVC.
3.2. Polymer Identification Scheme
An initial analysis of the data indicated distinguishable patterns among groups of plastics stained with Nile Red when excited at different wavelengths. Given that all tested plastics exhibited similar spectral peaks under 525 nm excitation, emission peaks under 405 nm and 465 nm excitation appear particularly critical for polymer identification.
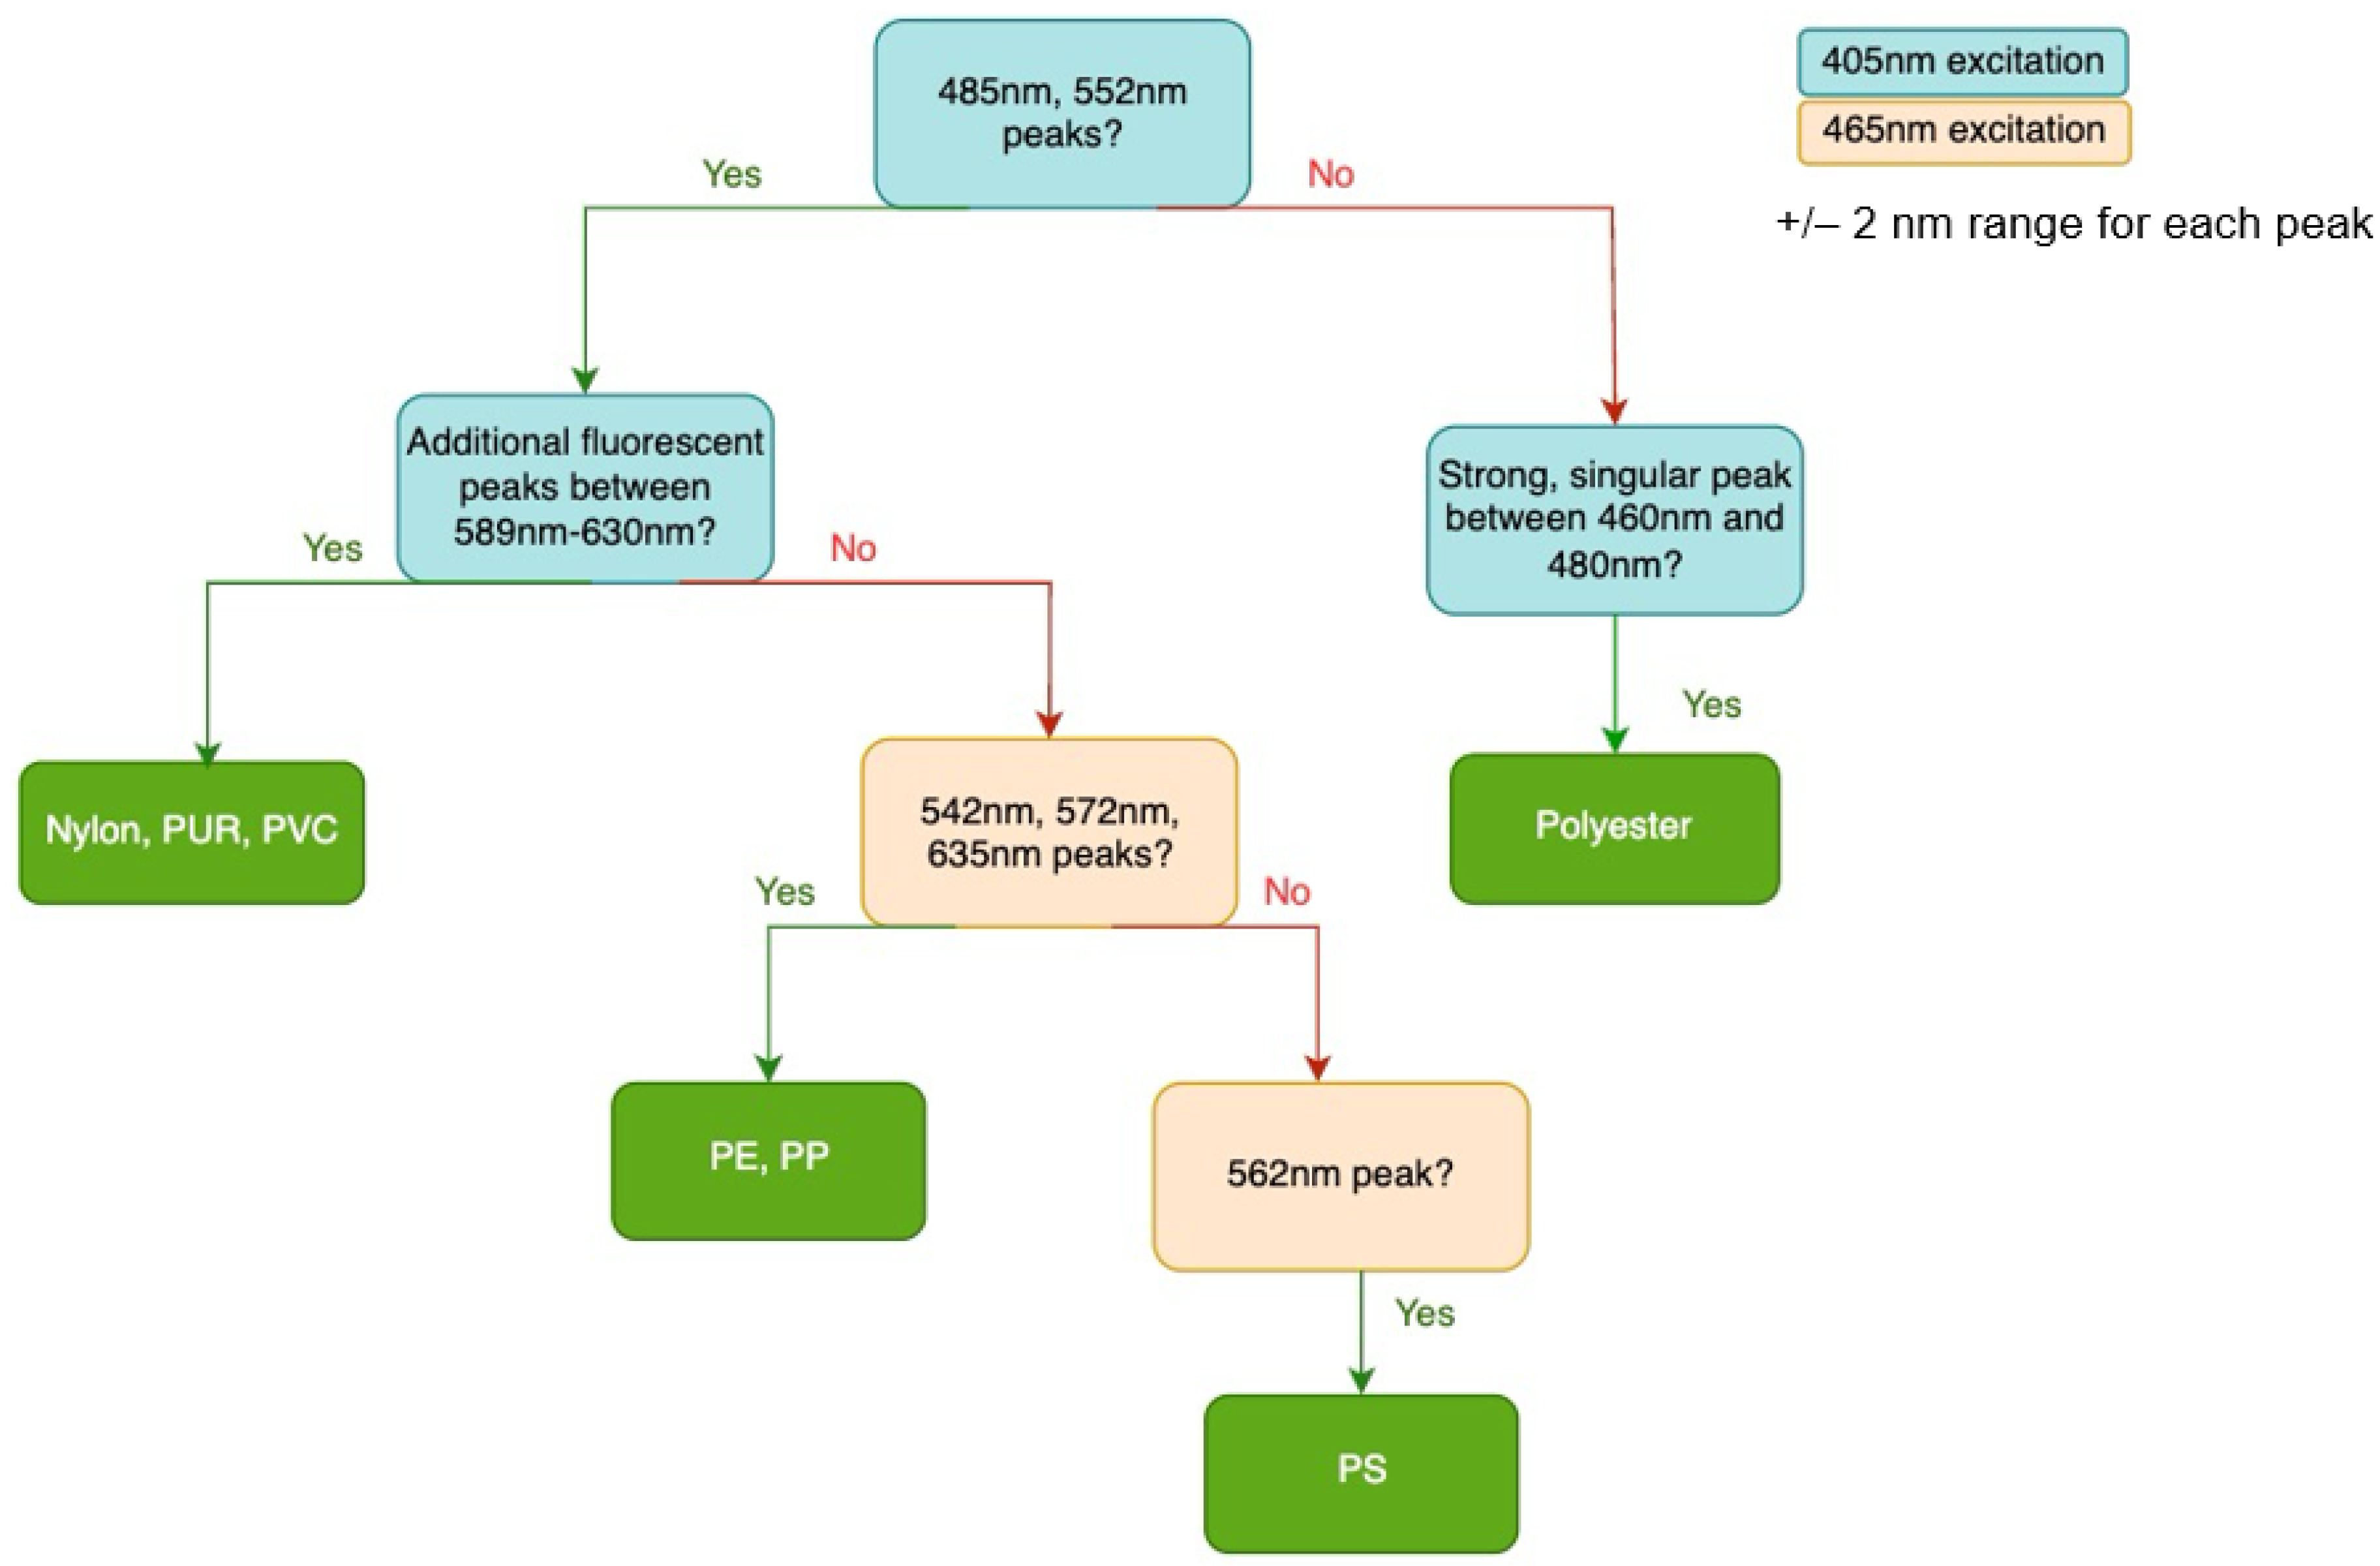
Figure 3 outlines a preliminary polymer categorization framework derived directly from the spectral data of Nile Red-stained plastics. This framework holds promise for identifying unknown plastic polymers or classifying them into specific groups. However, using Nile Red alone poses challenges in distinguishing between PP and PE, or among nylon, PUR, and PVC. Spectral peak positioning, such as the leftward shift of PVC peaks compared to nylon and PUR under 465 nm and 525 nm excitation, may assist in further categorization. The identification scheme presented in Figure 3 serves as a preliminary basis that can be expanded upon in future work.
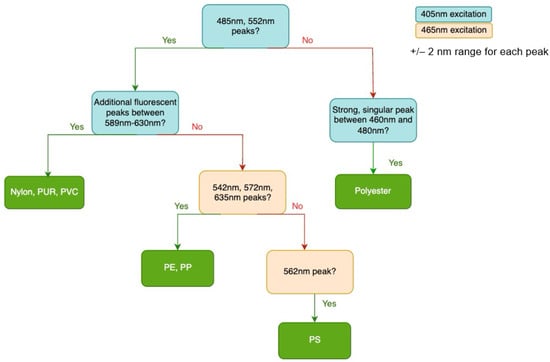
Figure 3.
Polymer identification scheme [26].
3.3. Spectral Data from Nile Red-Stained Field Plastic Samples
To verify if plastics found in the natural environment could be identified using the collected spectral dataset, field trials were conducted. Plastics were gathered from the shore at Magazine Beach in Cambridge, Massachusetts. Their sizes ranged from 50 mm × 50 mm to larger consumer plastic objects such as water bottles and straws. They were cut down to 30 mm × 30 mm fragments and their chemical composition was confirmed using a Bruker Alpha II FT-IR spectrometer (Bruker, Billerica, MA, USA).
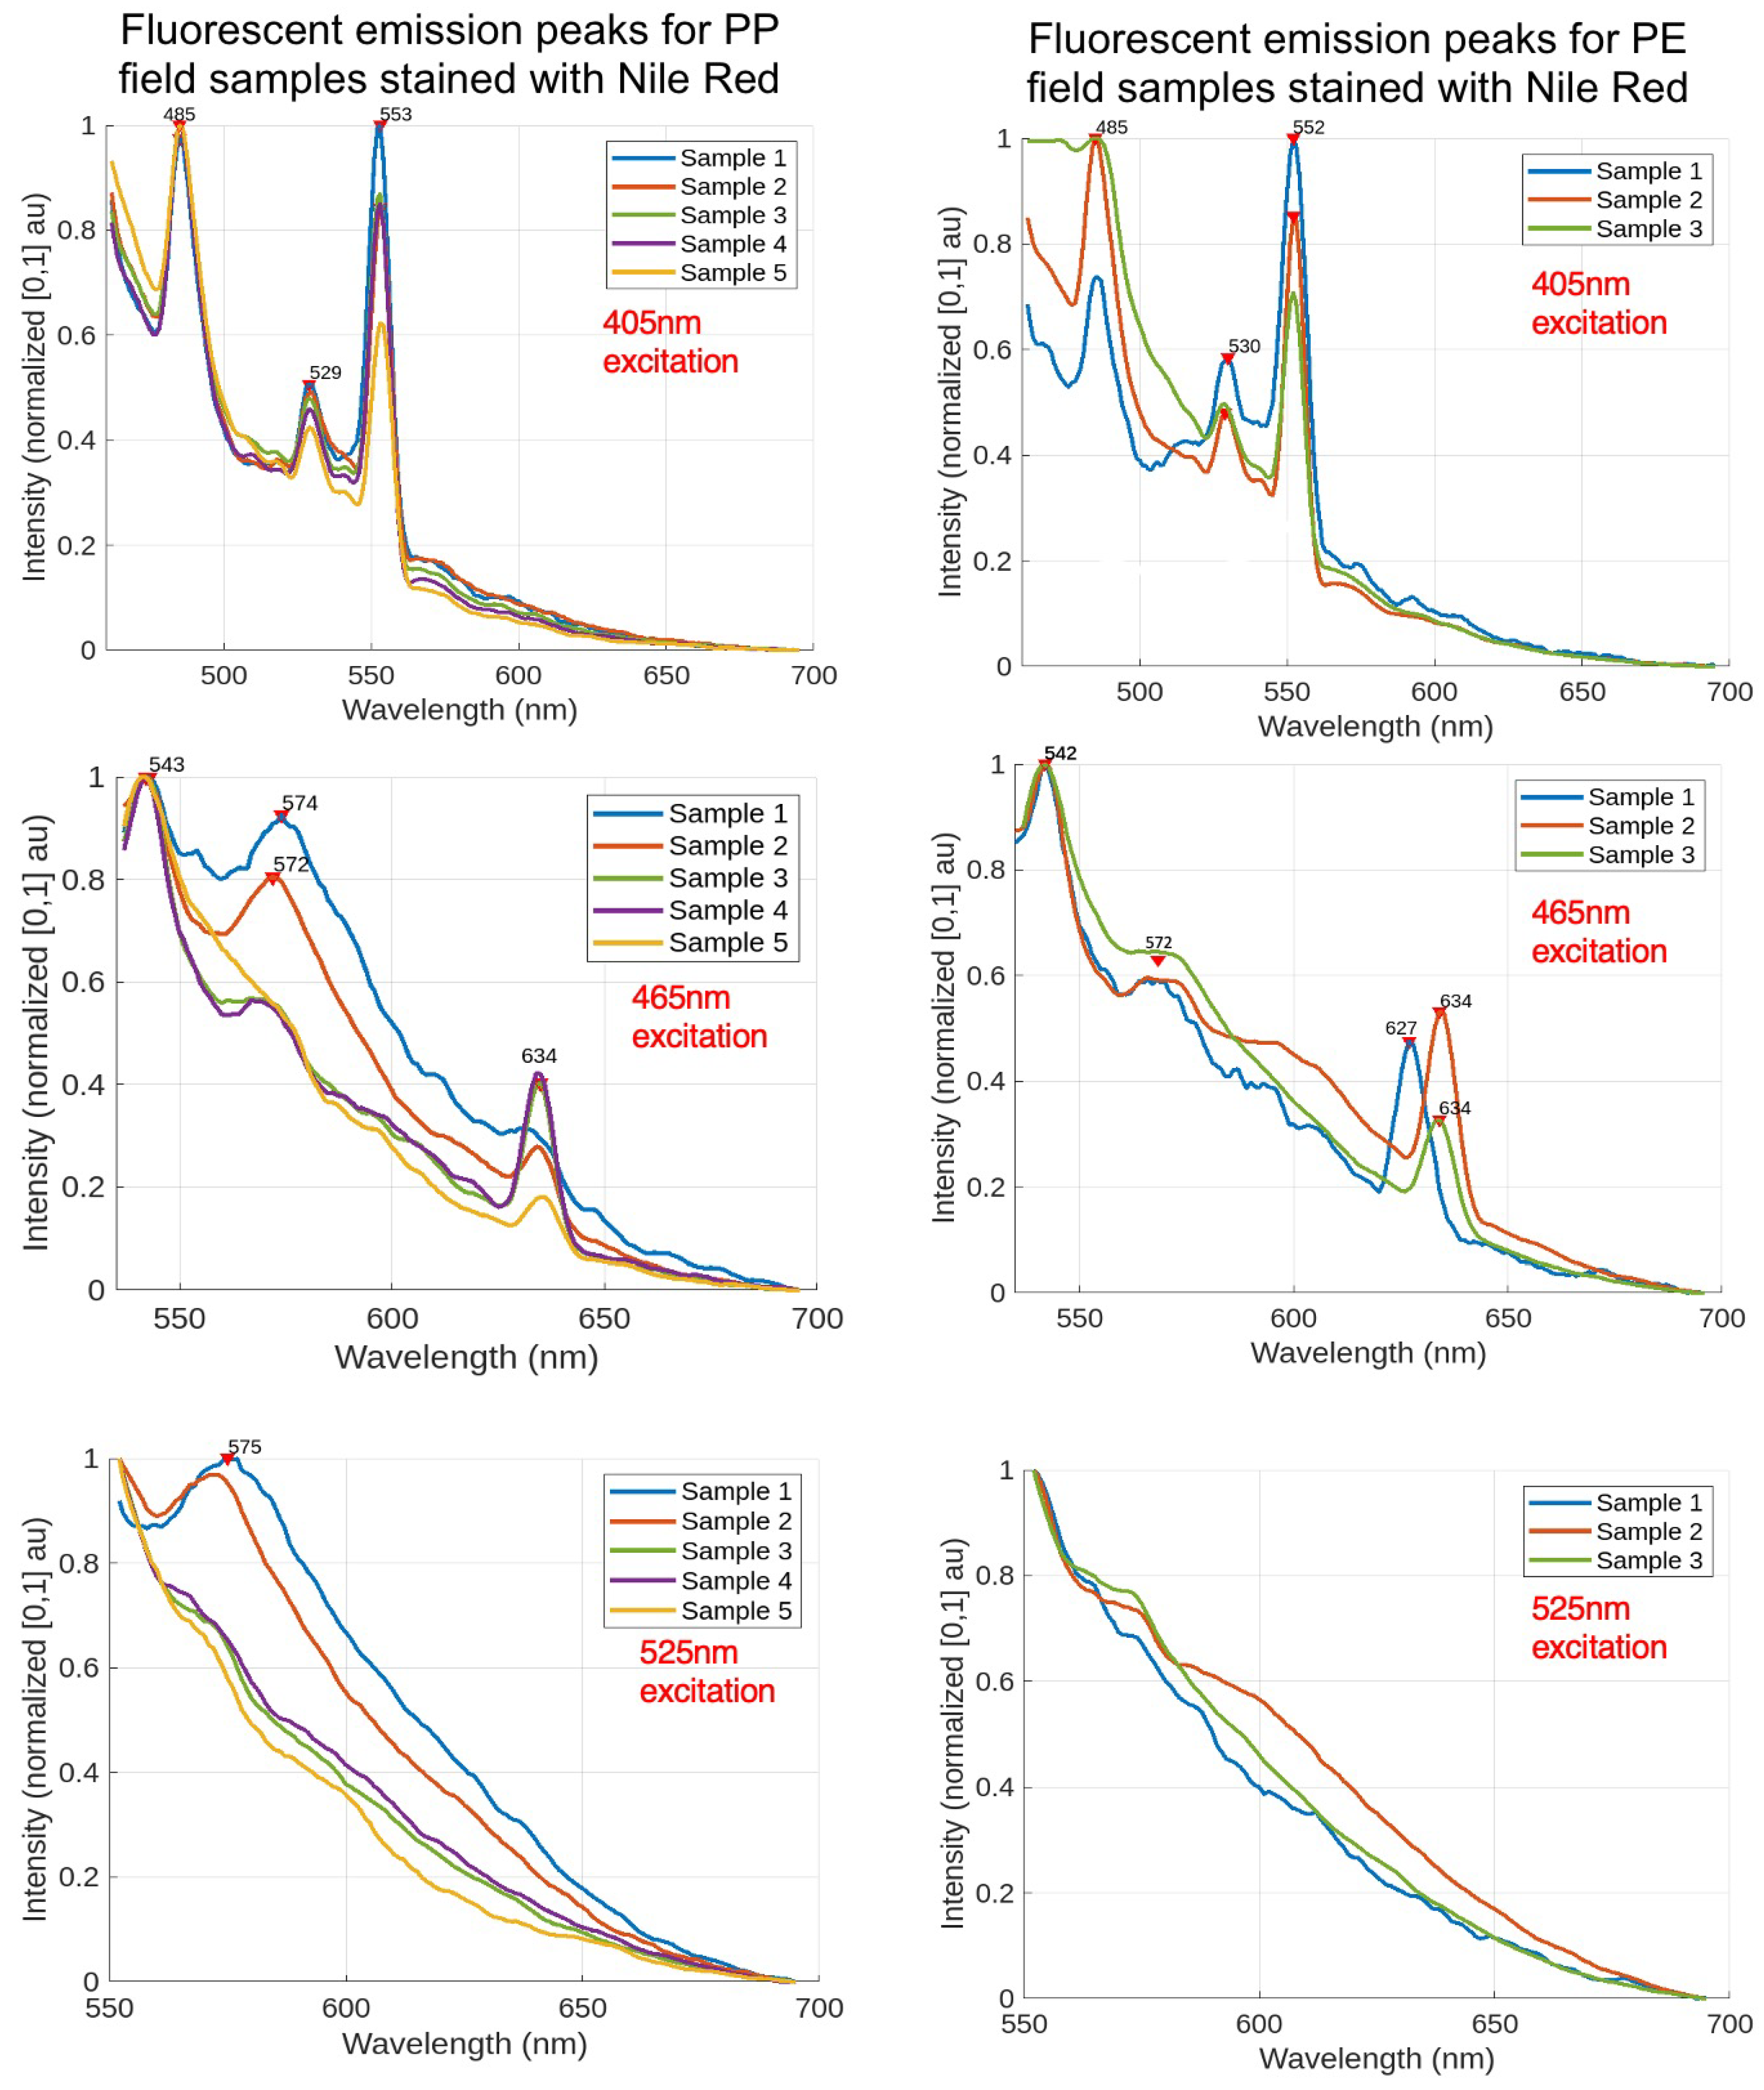
Only those plastics whose polymer composition was successfully verified by FT-IR were included, resulting in a dataset of five polypropylene (PP) samples and three polyethylene (PE) samples. These samples were then examined with a fluorescence spectrometer. Figure 4 illustrates the fluorescent emission spectra for five PP and three PE field samples for excitation wavelengths of 405 nm, 465 nm, and 525 nm.
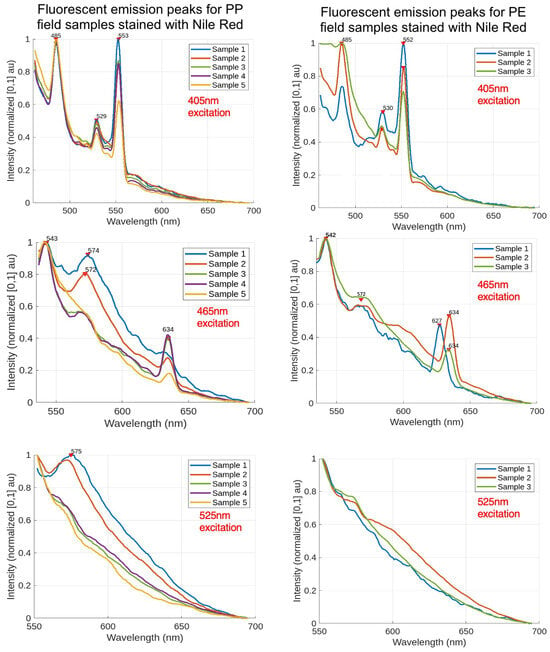
Figure 4.
Fluorescent emission spectra of Nile Red-stained field plastics for different excitation wavelengths. Column on the left displays the spectra of PP plastics and column on the right displays the spectra of PE plastics [26].
The data from the field trials demonstrate that the preliminary polymer identification scheme shown in Figure 3 successfully identified 80% of the PP samples and all PE samples based on their spectral peaks. One PP sample lacked a prominent peak at 572 nm but displayed the other requisite peaks. For 525 nm excitation shown in the left column of Figure 4, the PE samples exhibited no visible peaks, suggesting that the long-pass filter may have restricted the spectral window. It is currently challenging to distinguish between PE and PP based on spectral data alone. Since a plastic’s spectral data depend on the polymer, additives, pigments, and fluorescent dyes, a larger and more diverse dataset is needed to accurately capture the spectral footprint of each polymer. Future research should also explore alternative methods for differentiating plastic polymers with similar fluorescent spectra.
3.4. Pairing Spectral Data with Low-Cost Microplastic Imaging
Several studies on automated image analysis methods for microplastic detection using Nile Red exist in the academic literature. Meyers et al. (2022) described a semi-automated approach utilizing a machine learning model that classifies microplastics based on their RGB profiles [27]. While their model effectively differentiated plastics from organic materials and identified polymer types, it was trained and validated on high-quality images captured with fluorescence microscopy. Although their work shows promise for adaptation to a more affordable approach, it would require retraining on images obtained with a field-portable camera, as opposed to a fluorescence microscope. Similarly, Sturm et al. (2023) developed an automated imaging method for Nile Red-stained plastic particles intended for wastewater treatment facilities. Their methodology involved digestion to reduce false positives from organic materials, but the most significant costs were linked to the use of fluorescence microscopy [28]. If low-cost imaging techniques can be utilized to train a comparable model, this method could become viable for cost-effective applications alongside strategies to eliminate false positives.
To understand how the collected spectral data could correlate with visual appearance, the imaging system presented in Figure 5 was specifically designed and constructed to illuminate and capture images of stained plastic samples using similar excitation wavelengths and long-pass filters compared to the fluorescence spectrometer experiments at a low cost. This system primarily comprises a Raspberry Pi (RPi) Model 4B (Raspberry Pi, Cambridge, UK) and a 64-megapixel Arducam Hawkeye camera (Arducam, Nanjing, China) equipped with autofocus capabilities. Images were obtained using the libcamera library with the exposure value set to 10 and saved in .jpg format without alteration prior to presentation here. The long-pass filters employed to characterize the fluorescence emission spectra of the stained plastics were mounted below the camera to prevent excitation light from interfering with the images. The excitation sources included UV, blue, and green LEDs located just beneath the filter, emitting wavelengths of 405 nm, 465–470 nm, and 525–530 nm, respectively, according to manufacturer specifications. Two LED sets—UV and RGB—were connected to the RPi, allowing for seamless switching between them. The total cost of the system, including long-pass optical filters, was under USD 450; without the filters, it was below USD 200.
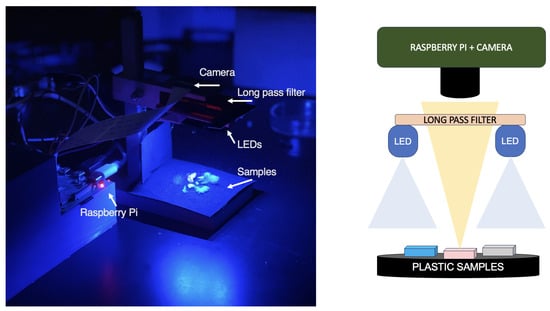
Figure 5.
Low-cost microplastic imaging setup [26].
Imaging was conducted in a dark room to enhance image quality and minimize optical interference. The images presented in Figure 6 are fragments close to a 5 mm cut from the samples analyzed in the fluorescence spectrometer, so their spectral data can be compared to their visual images.
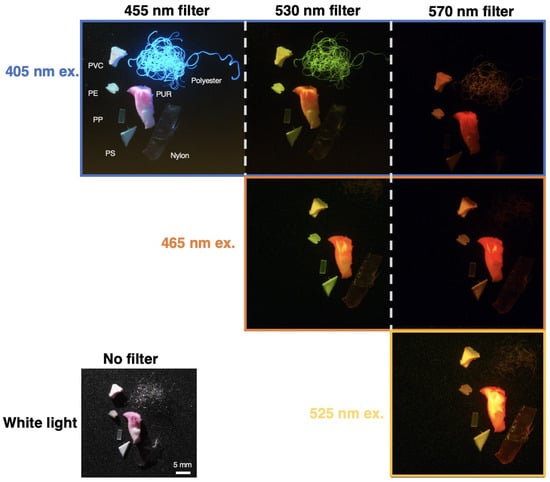
Figure 6.
Images of Nile Red-stained lab plastics for different excitation wavelengths [26]. Due to Nile Red’s solvatochromatic properties, the emission wavelength changes based on polarity of polymer surface.
Figure 7 pairs raw spectral data of each plastic with images of the plastic taken from Figure 6 for each excitation wavelength. Based on these images, this section will qualitatively note visual differences in fluorescent intensities and color emissions under various excitation wavelengths to highlight characteristics that may distinguish between polymers. At a plastic’s highest emission intensity peak for a specific wavelength and optical filter, it is anticipated that the microplastic will appear brightest for that combination. Conversely, the plastic is expected to exhibit the least brightness at the lowest emission intensity peak for the same parameters.
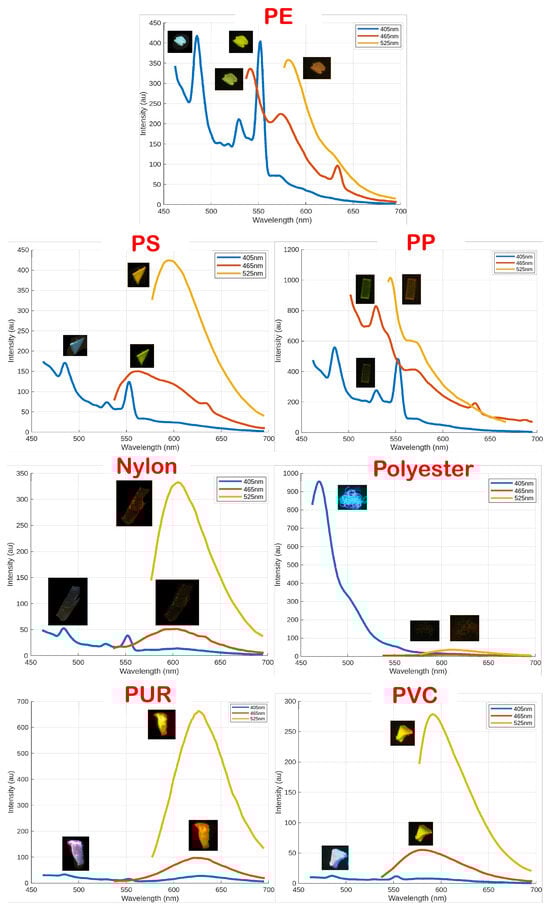
Figure 7.
Images of Nile Red-stained lab plastics paired with raw fluorescent emission data for different excitation wavelengths [26].
For each plastic, it can be observed that the brightest image corresponds to a peak with the highest intensity, such as with polyurethane, located in the bottom left corner of Figure 7. PUR is brightest at an excitation wavelength of 525 nm, which matches the fluorescent intensity graph. The visual color of the plastic also corresponds well to the peak of the 525 nm profile located near 630 nm. Other plastics can similarly exhibit reasonable colors that match the emission peak. While this system is a low-cost prototype, further refinement may help standardize images and provide the foundation for a computer vision tool to automatically classify the microplastic polymer based on visual appearance.
4. Discussion
This work presented preliminary fluorescent emission data of Nile Red-stained plastic polymers stained with Nile Red and highlighted distinguishable spectral patterns that can be applied towards a polymer identification model.
The recorded peaks were a result of the specific combination of excitation wavelengths, long-pass filters, and scanned emission wavelength ranges used in this study. Prominent peaks may exist in regions that were not recorded, such as between the excitation wavelength and long-pass filter cut-on wavelength or between the long-pass filter cut-on wavelength and the start of the scanned emission wavelength range.
The data also suggest that the long-pass filters used in this project need refinement. Specifically, the 570 nm cut-on filter often encroaches into the spectral window of PP and PE when excited at 525 nm. Future efforts should focus on optimizing long-pass filters to maximize spectral windows and employing a laser for excitation instead of a Xenon lamp to reduce noise from excitation fluorescence.
The results indicate that while the spectra of Nile Red-stained plastics can provide a basis for polymer classification, the overlap of spectral peaks at certain wavelengths may limit reliability. High-resolution spectral characterization and advanced spectral processing techniques such as deconvolution could potentially address these challenges. Given that the fluorescence spectra of stained plastics reflect a combination of polymer type, additives, pigmentation, and fluorescent dye, further comprehensive spectral testing across a wide range of polymer types and weathered conditions is necessary to capture common additives, pigments, and physical states of consumer plastics found in the natural environment. Expanding and encoding the dataset to develop an automated tool for extracting and matching spectral peaks might reveal additional distinguishing factors for polymer identification models.
The spectral data obtained in this study can be used to inform future microplastic experiments that use acetone-based Nile Red and excitation wavelengths of 405 nm, 465 nm, and 525 nm. Overall, this work contributed towards the development of a novel polymer identification method for Nile Red-stained plastics through the characterization of spectral peaks paired with visual images taken with a proof-of-concept low-cost system. The data provided can build the foundation for future standardized Nile Red-based fluorescent tagging experiment protocols and the design of low-cost microplastic imaging systems.
5. Conclusions
In summary, this study lays a foundational framework for polymer identification using Nile Red-stained plastics based on their fluorescent emission spectral peaks. The results enumerate a scheme that can distinguish a polymer as either (a) nylon, PUR, or PVC; (b) PE or PP; (c) (PS); or (d) polyester. A low-cost imaging system also matched the raw spectral data to images of the stained plastics using the same long-pass filters and excitation wavelengths for spectral data collection. The images revealed that the brightness and color of the plastics under different excitation wavelengths align well with the intensity and location of the emission peaks. Although preliminary data indicate promising spectral patterns, the observed spectral overlaps and limitations in filter performance suggest the need for further refinement in experimental setup. Given the current gap in the literature regarding variations in solvent choices, plastic form factor, staining protocols, and experimental design parameters such as excitation wavelength and optical filters, future work should include different Nile Red solvents and optimize the long-pass filters and excitation sources to improve spectral resolution and reduce noise. Additionally, expanding the dataset to include a wider array of polymer types and conditions, including used consumer plastics and weathered field plastics, will be crucial for developing a robust polymer classification model because it will capture larger variations in spectral footprints caused by additives, dyes, and other chemical characteristics. This work not only paves the way for enhanced polymer identification methods but also offers valuable insights for designing cost-effective imaging systems and standardized protocols for Nile Red-based fluorescent tagging.
Author Contributions
Conceptualization, S.P.; Data curation, S.P.; Formal analysis, S.P.; Funding acquisition, A.B. and M.T.; Investigation, S.P.; Methodology, S.P.; Project administration, A.B. and M.T.; Resources, A.B. and M.T.; Software, S.P.; Supervision, A.B. and M.T.; Validation, S.P.; Visualization, S.P.; Writing—original draft, S.P.; Writing—review and editing, S.P. All authors have read and agreed to the published version of the manuscript.
Funding
This project was funded by the MIT Sea Grant Program.
Institutional Review Board Statement
Not applicable.
Informed Consent Statement
Not applicable.
Data Availability Statement
The original contributions presented in the study are included in the article, further inquiries can be directed to the corresponding author.
Acknowledgments
The authors thank the MIT Sea Grant for supporting the project through material provision and funding. The spectroscopy work was also carried out in part through the use of MIT.nano’s facilities and the Department of Chemical Instrumentation Facility.
Conflicts of Interest
The authors declare no conflicts of interest.
Abbreviations
The following abbreviations are used in this manuscript:
| MP | Microplastic |
| NR | Nile Red |
| PE | Polyethylene |
| PP | Polypropylene |
| PS | Polystyrene |
| PVC | Polyvinyl Chloride |
| PUR | Polyurethane |
References
- Belioka, M.P.; Achilias, D.S. Microplastic Pollution and Monitoring in Seawater and Harbor Environments: A Meta-Analysis and Review. Sustainability 2023, 15, 9079. [Google Scholar] [CrossRef]
- Ho, D.; Liu, S.; Wei, H.; Karthikeyan, K.G. The glowing potential of Nile red for microplastics Identification: Science and mechanism of fluorescence staining. Microchem. J. 2024, 197, 109708. [Google Scholar] [CrossRef]
- Araujo, C.F.; Nolasco, M.M.; Ribeiro, A.M.; Ribeiro-Claro, P.J. Identification of microplastics using Raman spectroscopy: Latest developments and future prospects. Water Res. 2018, 142, 426–440. [Google Scholar] [CrossRef] [PubMed]
- Käppler, A.; Fischer, D.; Oberbeckmann, S.; Schernewski, G.; Labrenz, M.; Eichhorn, K.J.; Voit, B. Analysis of environmental microplastics by vibrational microspectroscopy: FTIR, Raman or both? Anal. Bioanal. Chem. 2016, 408, 8377–8391. [Google Scholar] [CrossRef] [PubMed]
- Huang, Z.; Hu, B.; Wang, H. Analytical methods for microplastics in the environment: A review. Environ. Chem. Lett. 2023, 21, 383–401. [Google Scholar] [CrossRef] [PubMed]
- Primpke, S.; Lorenz, C.; Rascher-Friesenhausen, R.; Gerdts, G. An automated approach for microplastics analysis using focal plane array (FPA) FTIR microscopy and image analysis. Anal. Methods 2017, 9, 1499–1511. [Google Scholar] [CrossRef]
- Maes, T.; Jessop, R.; Wellner, N.; Haupt, K.; Mayes, A.G. A rapid-screening approach to detect and quantify microplastics based on fluorescent tagging with Nile Red. Sci. Rep. 2017, 7, 44501. [Google Scholar] [CrossRef]
- Konde, S.; Brackmann, S.; Prume, J.; Gerhard, M.; Koch, M. Nile Red staining for the detection of microplastics: A comprehensive study on the emission spectra. Res. Square 2023. [Google Scholar] [CrossRef]
- Prata, J.C.; da Costa, J.P.; Lopes, I.; Duarte, A.C.; Rocha-Santos, T. Effects of microplastics on microalgae populations: A critical review. Sci. Total. Environ. 2019, 665, 400–405. [Google Scholar] [CrossRef]
- Sturm, M.T.; Horn, H.; Schuhen, K. The potential of fluorescent dyes—Comparative study of Nile red and three derivatives for the detection of microplastics. Anal. Bioanal. Chem. 2021, 413, 1059–1071. [Google Scholar] [CrossRef]
- Aoki, H. Material-Specific Determination Based on Microscopic Observation of Single Microplastic Particles Stained with Fluorescent Dyes. Sensors 2022, 22, 3390. [Google Scholar] [CrossRef] [PubMed]
- Shruti, V.C.; Pérez-Guevara, F.; Roy, P.D.; Kutralam-Muniasamy, G. Analyzing microplastics with Nile Red: Emerging trends, challenges, and prospects. J. Hazard. Mater. 2022, 423, 127171. [Google Scholar] [CrossRef] [PubMed]
- Capolungo, C.; Genovese, D.; Montalti, M.; Rampazzo, E.; Zaccheroni, N.; Prodi, L. Photoluminescence-Based Techniques for the Detection of Micro- and Nanoplastics. Chem.-A Eur. J. 2021, 27, 17529–17541. [Google Scholar] [CrossRef] [PubMed]
- Liu, S.; Shang, E.; Liu, J.; Wang, Y.; Bolan, N.; Kirkham, M.B.; Li, Y. What have we known so far for fluorescence staining and quantification of microplastics: A tutorial review. Front. Environ. Sci. Eng. 2022, 16, 8. [Google Scholar] [CrossRef]
- Labbe, A.B.; Bagshaw, C.R.; Uttal, L. Inexpensive Adaptations of Basic Microscopes for the Identification of Microplastic Contamination Using Polarization and Nile Red Fluorescence Detection. J. Chem. Educ. 2020, 97, 4026–4032. [Google Scholar] [CrossRef]
- Mason, S.A.; Welch, V.G.; Neratko, J. Synthetic Polymer Contamination in Bottled Water. Front. Chem. 2018, 6, 389699. [Google Scholar] [CrossRef] [PubMed]
- Shim, W.J.; Song, Y.K.; Hong, S.H.; Jang, M. Identification and quantification of microplastics using Nile Red staining. Mar. Pollut. Bull. 2016, 113, 469–476. [Google Scholar] [CrossRef]
- Erni-Cassola, G.; Gibson, M.I.; Thompson, R.C.; Christie-Oleza, J.A. Lost, but Found with Nile Red: A Novel Method for Detecting and Quantifying Small Microplastics (1 mm to 20 μm) in Environmental Samples. Environ. Sci. Technol. 2017, 51, 13641–13648. [Google Scholar] [CrossRef] [PubMed]
- Prata, J.C.; Reis, V.; Matos, J.T.V.; da Costa, J.P.; Duarte, A.C.; Rocha-Santos, T. A new approach for routine quantification of microplastics using Nile Red and automated software (MP-VAT). Sci. Total. Environ. 2019, 690, 1277–1283. [Google Scholar] [CrossRef]
- Ziajahromi, S.; Neale, P.A.; Rintoul, L.; Leusch, F.D.L. Wastewater treatment plants as a pathway for microplastics: Development of a new approach to sample wastewater-based microplastics. Water Res. 2017, 112, 93–99. [Google Scholar] [CrossRef]
- Stanton, T.; Johnson, M.; Nathanail, P.; Gomes, R.L.; Needham, T.; Burson, A. Exploring the Efficacy of Nile Red in Microplastic Quantification: A Costaining Approach. Environ. Sci. Technol. Lett. 2019, 6, 606–611. [Google Scholar] [CrossRef]
- Konde, S.; Ornik, J.; Prume, J.A.; Taiber, J.; Koch, M. Exploring the potential of photoluminescence spectroscopy in combination with Nile Red staining for microplastic detection. Mar. Pollut. Bull. 2020, 159, 111475. [Google Scholar] [CrossRef] [PubMed]
- Park, D.H.; Oh, S.B.; Hong, S.C. In Situ Fluorescent Illumination of Microplastics in Water Utilizing a Combination of Dye/Surfactant and Quenching Techniques. Polymers 2022, 14, 3084. [Google Scholar] [CrossRef] [PubMed]
- Gies, S.; Schömann, E.M.; Anna Prume, J.; Koch, M. Exploring the Potential of Time-Resolved Photoluminescence Spectroscopy for the Detection of Plastics. Appl. Spectrosc. 2020, 74, 1161–1166. [Google Scholar] [CrossRef] [PubMed]
- Lotter, B.; Konde, S.; Nguyen, J.; Grau, M.; Koch, M.; Lenz, P. Identifying plastics with photoluminescence spectroscopy and machine learning. Sci. Rep. 2022, 12, 18840. [Google Scholar] [CrossRef]
- Prasad, S. Investigating Optical Microplastic Detection Methods Using Fluorescent Staining through Nile Red. Graduate Thesis, Massachusetts Institute of Technology, Cambridge, MA, USA, 2024. Available online: https://dspace.mit.edu/handle/1721.1/155849 (accessed on 7 August 2024).
- Meyers, N.; Catarino, A.I.; Declercq, A.M.; Brenan, A.; Devriese, L.; Vandegehuchte, M.; De Witte, B.; Janssen, C.; Everaert, G. Microplastic detection and identification by Nile red staining: Towards a semi-automated, cost- and time-effective technique. Sci. Total. Environ. 2022, 823, 153441. [Google Scholar] [CrossRef]
- Sturm, M.T.; Myers, E.; Schober, D.; Korzin, A.; Schuhen, K. Development of an Inexpensive and Comparable Microplastic Detection Method Using Fluorescent Staining with Novel Nile Red Derivatives. Analytica 2023, 4, 27–44. [Google Scholar] [CrossRef]


Disclaimer/Publisher’s Note: The statements, opinions and data contained in all publications are solely those of the individual author(s) and contributor(s) and not of MDPI and/or the editor(s). MDPI and/or the editor(s) disclaim responsibility for any injury to people or property resulting from any ideas, methods, instructions or products referred to in the content. |
© 2024 by the authors. Licensee MDPI, Basel, Switzerland. This article is an open access article distributed under the terms and conditions of the Creative Commons Attribution (CC BY) license (https://creativecommons.org/licenses/by/4.0/).