Article

Seafloor Subsidence Evaluation Due to Hydrate Depressurization Recovery in the Shenhu Area, South China Sea

1
Maxwell Institute for Mathematical Sciences, Heriot-Watt University, Edinburgh EH14 4AS, UK
2
The Lyell Centre for Earth and Marine Science and Technology, Institute for Infrastructure and Environment, Heriot-Watt University, Edinburgh EH14 4AS, UK
*
Author to whom correspondence should be addressed.
J. Mar. Sci. Eng. 2024, 12(8), 1410; https://doi.org/10.3390/jmse12081410
Submission received: 2 July 2024 / Revised: 2 August 2024 / Accepted: 7 August 2024 / Published: 16 August 2024
(This article belongs to the Special Issue Advances in Marine Gas Hydrate Exploration and Discovery)

Abstract

:
Submarine hydrate mining can trigger geological disasters, including submarine landslides and seafloor subsidence due to excess pore pressure and weakened layers, which may potentially lead to the reactivation of faults and increased seismic activity. However, current research encounters challenges in assessing geotechnical issues associated with long-term and large-scale production from well grids located in sloped areas. Limited by the complexity of the hydrate sediment, a multifield coupled numerical model of hydrate slope in the Shenhu area was established. Utilizing the modified Mohr–Coulomb model as the constitutive model for hydrate-bearing sediments to track the dynamic reduction in strength and employing the shear strength method to assess submarine slope stability, a series of depressurization strategies are applied to evaluate the risks associated with submarine landslides and seafloor subsidence. Results show that the hydrate dissociation tends to stagnate after a period of mining. The strength of the hydrate decomposed area is severely reduced, and a volume deficit occurs in this area, causing formation displacement. The peripheral region of the decomposed area is compacted by high stress, resulting in a serious decrease in permeability and porosity, which limits the continued decomposition of hydrates. The large-scale submarine landslides with hydrates decomposition will not appear in this block. However, several meters’ seafloor subsidence over a wide range risks engineering safety significantly. The amount of seafloor subsidence in the first 50 days is approximately half of the final settlement. A higher production pressure drop can speed up the recovery rate while resulting in more significant seafloor subsidence and slippage. Therefore, the balance between mining speed and formation stability needs more research work.

1. Introduction

Natural gas hydrate (NGH) is a crystalline substance with an ice-like appearance, consisting of water and hydrocarbon gas, which forms under conditions of low temperature and high pressure [1]. Typically, it is found in the upper strata of permafrost regions and in the sedimentary layers of deep ocean floors. The energy stored in a hydrate reservoir is more than twice that in traditional fossil fuels [2,3]. Although constrained by temperature and pressure conditions, meaning natural gas hydrates are not as ubiquitously distributed as traditional oil and gas reserves, they are still considered a significant potential alternative energy source soon due to their extensive reserves, broad distribution, minimal environmental impact, and high energy density [4,5].
Presently, there are five primary techniques for extracting NGH: depressurization, thermal stimulation, chemical injection, carbon dioxide replacement, and solid fluidization [6,7]. In 2007 and 2008, Canada tried to exploit land hydrates twice using the depressurization method and produced 2000–4000 m3 hydrate after six days of continuous gas production [8]. In 2013, Japan conducted its inaugural offshore hydrate extraction trial using the depressurization method in the Nankai Trough. Over a period of six days, the operation successfully produced more than 12,000 m3 of gas, and eventually ended with severe sand production [9]. In 2017 and 2020, the China Geological Survey conducted on-site hydrate extractions in the Shenhu area using the depressurization method, initially with vertical wells and subsequently with horizontal wells. The productions from these methods were 300,000 m3 and 575,000 m3, respectively [10]. The outcomes of these field experiments suggest that depressurization is practical for ocean NGH extraction. In contrast, there is a lack of field tests and resources to use other methods for large-scale production of hydrates. For instance, thermal stimulation may serve as a supportive technique in this process for the depressurization method but not the leading method alone for hydrate production at present [6,10,11,12]. In 2017, the solid fluidization method was first implemented in the Shenhu area. However, the results were not as successful as anticipated [7].
Initial research on hydrates primarily concentrated on the efficiency of hydrate dissociation and multiphase flow dynamics [13,14,15,16]. More recently, there has been a growing focus on the geomechanical issues that arise from hydrate dissociation [17,18,19,20,21]. When the hydrate is stable in seafloor sediments, it cements the formation particles together to form an integrated structure. During the dissociation of hydrates, the cemented structure would dissolve, and the huge volume of gas generated from NGH dissociation would further damage the skeleton structure of the seabed sediment [22,23,24]. The mechanical strength of hydrate-bearing zones significantly diminishes, resulting in geomechanical challenges such as sand production, seabed subsidence, and wellbore instability [25,26,27,28].
Depressurization reduces sediment pore pressure, destabilizing the marine substrate and potentially triggering submarine landslides. This process, by weakening sediment cohesion and reducing effective stress, can lead to large-scale seabed movements, especially on sloped terrains. When discussing the mechanical properties of sedimentary layers in their natural state, and assessing potential subsidence and landslides, it is crucial to determine the composition and type of the sediments, their sources, and whether features indicative of earthquakes and submarine landslides occurred during the sedimentation process. Jmail conducted detailed research on these problems in the South China Sea, including the past subsidence and slides induced by seismic activity [29,30,31]. These factors are equally essential in characterizing the nature of submarine sedimentary layers. Considering that the first NGH exploration site in the Shenhu area is situated on the northern slope, it is essential to evaluate the impact of hydrate dissociation on the stability of the seabed slope. However, currently there is a lack of systematic analysis, and pilot demonstration about the likelihood of large-scale dissociation of hydrates caused by humans will lead to large-scale submarine landslides in this area and the dynamic effect of hydrate dissociation on slope stability [32,33,34].
Hydrate decomposition is a highly complex multiphase problem involving gas–liquid–solid coupling, phase transformation, heat conduction, and geomechanical processes. The change in structure strength during hydrate dissociation further complicates the problem. Numerical simulation is the most robust and economic method to capture the coupled multiphase dynamic processes such as yield, efficiency, mechanical, and thermal response during hydrate dissociation. Currently, numerical simulations of hydrates have progressed from initial fluid–solid coupling to more complex thermo–gas–liquid–solid–chemical–mechanical coupling models [23,33].
In the earliest studies, around the 1980s, hydrate simulation was primarily based on the TOUGH software, focusing on the transport processes of multiphase fluids in porous media. Around 2002, Reagan developed TOUGH + Hydrate, which modeled the thermodynamics and fluid dynamics of hydrates, though it did not include geomechanical behavior [11]. By around 2010, the incorporation of Biot’s theory of poroelasticity led to the development of TOUGH + Hydrate + Biot, which was among the first to evaluate the geological impacts of hydrate-related activities. This approach has been used to the present day, as exemplified by Jin et al.’s study of seabed subsidence behaviors resulting from NGH extraction via depressurization in horizontal wells, exploring various formation failure modes during hydrate dissociation [6].
Around 2015, the introduction of Flac3D into Hydrate + Tough allowed for a more detailed capture of the mechanical behavior during the decomposition of hydrate reservoirs, as demonstrated by Dong et al.’s simulation of hydrate sediment deformation behavior during hydrate recovery [35]. Additionally, Gupta et al. developed a C++ software package to simulate thermo–chemo–hydro–geomechanical coupling during hydrate dissociation, utilizing a linear elastic model, and analyzed the dynamic deformation response of hydrate sediment sample cores through indoor experiments [22].
With the advancement and refinement of large-scale commercial finite element software, such as ABAQUS and COMSOL, more sophisticated descriptions of multiphysical coupling problems in porous media have become possible. ABAQUS, in particular, has shown accuracy and reliability in geomechanical simulations and can be extended via subroutines [1,5,25]. Importantly, ABAQUS allows for the implementation of the strength reduction method through field variables, which is crucial for analyzing issues related to the stability of submarine slopes caused by hydrates [1,25].
It is generally acknowledged that NGH dissociation can lead to seabed subsidence, potentially destabilizing submarine slopes and triggering submarine landslides [36,37,38]. However, at present, there is a lack of systematic and comprehensive studies of submarine slope subsidence and submarine landslides under hydrate-dissociation conditions. Moreover, to the best of our knowledge, no studies have been conducted to examine the likelihood of landslides with a set of hydrate production wells. By taking this into consideration, this study aims to explore the effects of submarine slopes on NGH recovering in a series of vertical wells by simulating the whole stratum response of submarine slopes using the finite element software ABAQUS 2022 secondary development.

2. Methodology

2.1. Solution Strategy

There are three major challenges in the thermo–chemo–hydro–geomechanical coupled simulation of hydrate dissociation: (1) Kinetics of methane hydrate dissociation and chemical reaction, (2) Changes in formation strength due to hydrate dissociation, (3) Thermal–multiphase coupling in porous media. Based on existing studies, we have simplified these problems so that they can be coded into ABAQUS to perform coupling analysis. For the item (1), a relationship between formation temperature, pressure, permeability, time, and the rate of hydrate decomposition was established. This relationship was used to update the distribution of hydrate saturation within the formation. For the item (2), an enhanced hydrate constitutive model was developed based on the modified Mohr–Coulomb criterion, incorporating the effects of hydrate saturation, is constructed to describe the dynamic changes in structure strength during hydrate dissociation [36]. For the item (3), ABAQUS integrates an extensive well-established hypothesis, formula, and governing equations to analyze the thermal–multiphase–mechanical coupling behaviors in porous media and has been validated against benchmark tests [37].
The hydrate sediments consist of gaseous, liquid, and solid phases (sand and hydrate). We assume that the first three phases fully fill the void space, and the solid phase comprises the bearing structure of total sediment [22,38,39]. The non-dominant factors in practical sediment processes, such as dissolution, evaporation, and attach effect, are neglected. It is also assumed that the liquid phase does not contain any soluble gas and once the hydrate dissociates, no water and gas is attached to the surface of NGH. The saturation of gas, water, and NGH in a porous medium is described by the following equation:
s i = V i V p
where, s i represents the saturation of phase i , g for gas, w for water, and h for hydrate.

2.2. Hydrate Model

The methane hydrate phase equilibrium relationship curve is given by Moridis [15]:
C H 4 · n H 2 O + h e a t C H 4 ( g a s ) + n H 2 O ( w a t e r )
In this study, the value of n is 5.5~6, with a chosen value of n = 6 for the analysis according to Moridis [15] to simplify the model although it may be changed with P-T conditions.
The phase boundary of methane hydrate is described by the following expression [40].
P e q = e x p ( e 1 e 2 T )
where P e q represents the phase equilibrium pressure at temperature T , e 1 and e 2 are the regression parameters, e 1 = 39.08, and e 2 = 8533 for temperatures above 0 °C.
Sun pointed out that a complete description of the hydrate decomposition kinetics would involve complex physical and chemical theories, but it can be simplified to include the formation temperature and pressure conditions, the dynamic permeability of the porous medium, and the time function [41,42]. Hydrate-dissociation kinetics can be described as follows:
g h = M h k r e a c Γ r A s ( P e q f g ) g g = g h M g M h g w = n   g h M w M h A s = ϕ e 3 2 k Γ r = s g s w s h 2 3
where g i ( p h a s e   i = h , g , w ) is the hydrate, gas, and water generation rate, in k g / m 3 s . k r e a c is the hydrate decomposition kinetic constant, m o l / m 2 P a   s . f g is the methane gas fugacity, which can be derived from Peng–Robinson EOS, P a . When the temperature changes, P e q and f g will change accordingly, thus affecting the rate of hydrate decomposition [42]. A s quantifies the total surface area where the hydrate phase is in contact with both liquid and gas phases, Γ r measures the proportion of the surface area actively involved in hydrate decomposition relative to the total contact area. Sun and Mohanty modeled and calculated A s and Γ r [42].
The saturation of NGH markedly influences the permeability within bearing formations. When the NGH exists to stabilize the sediment, it does not contribute to multiphase flow processes in the pores or pore fraction. After the hydrate is decomposed, however, as effective porosity increases, so too does formation permeability. Therefore, the permeability of the NGH bearing sediment equation is given by [15,23]:
k = k 0 φ e φ 0 5 × 1 φ 0 1 φ e 2 ϕ e = ϕ 0 · ( s g + s w )
where k is the permeability of NGH bearing sediment, which is influenced by both start NGH saturation and the decomposed rate. k 0 is the initial permeability of the NGH bearing sediment. ϕ e is defined as the effective porosity. ϕ 0 refers to the start porosity.

2.3. Hydrate Constitutive Model

The constitutive model of hydrate-bearing sediments is fundamental to addressing geomechanical issues related to hydrate formations. When hydrates are present in the strata, they not only exhibit high intrinsic strength but also provide cementation and support to the formation. As hydrates dissociate, these reinforcing effects diminish, leading to a significant reduction in the overall strength of the formation [43]. Results from triaxial tests indicate that the constitutive models traditionally used for describing rocks or soils, such as the Duncan–Chang model, the Cam–Clay model, and the Mohr–Coulomb model, cannot be directly applied to hydrate-bearing formations. However, these models can be modified to develop a suitable constitutive model for hydrate-bearing sediments [39].
On the basis of the modified Mohr–Coulomb model, the hydrate formation strength equation with consideration of hydrate saturation is given by [39]:
c = c s + c h = c 1 1 e σ 3 σ t + c 2 s h c 3
s i n φ = s i n φ s + s i n φ h = sin δ 1 δ 2 ln σ 3 1 M P a + δ 3 s h ( 1 e γ δ 4 )
E = E s + E h = e 1 σ 3 1 M P a e 2 + e 3 s h
where the c s and c h are cohesiveness of sand and hydrate, respectively. φ , φ s , φ h denote the dilation angle of overall formation, sand and hydrate, respectively. Likelihood E , E s , E h represent the Young’s modulus of overall formation, sand and hydrate, respectively. All other parameters in Equations (6)–(8), are hydrate-bearing formation skeleton coefficient. Different hydrate sediment skeleton coefficients are used for different areas and block [9]. According to Pinkert et al. [39], we take a typical hydrate sediment sample from Nankai Trough as the study object [44]. And all of the variables and constants in Table 1 are obtained through the optimization process [36].
The relationship between the strength of hydrates and their saturation is delineated in Figure 1, according to the formula.

2.4. Analysis of Porous Media

Hydrate-bearing formation is modeled as porous medium in ABAQUS by using multifield fully coupling solution. ABAQUS integrates extensive hypotheses, formula, and governing equations to describe the porous media behaviors in soil and rock [5,26,45]. The equations involved can be integrated into ABAQUS by embedding them through the USDFLD subroutine. Adhering to the principle of effective stress, the model solution is derived in four sequential steps:
Step 1: Discretization of the porous medium, achieving a state of discrete equilibrium.
Step 2: Calculation of the constitutive behavior of the fluid and the skeletal structure of the discretized material.
Step 3: Fulfillment of the continuity equation.
Step 4: Coupling of the temperature and pressure fields with the diffusion and transport behavior of substances.
In the solution process, it is also necessary to solve the effective stress criterion, discrete equations, control equations, continuity equations, constitutive equations, and thermodynamic equilibrium equations.

3. Numerical Model Set Up

3.1. Site Location and Description
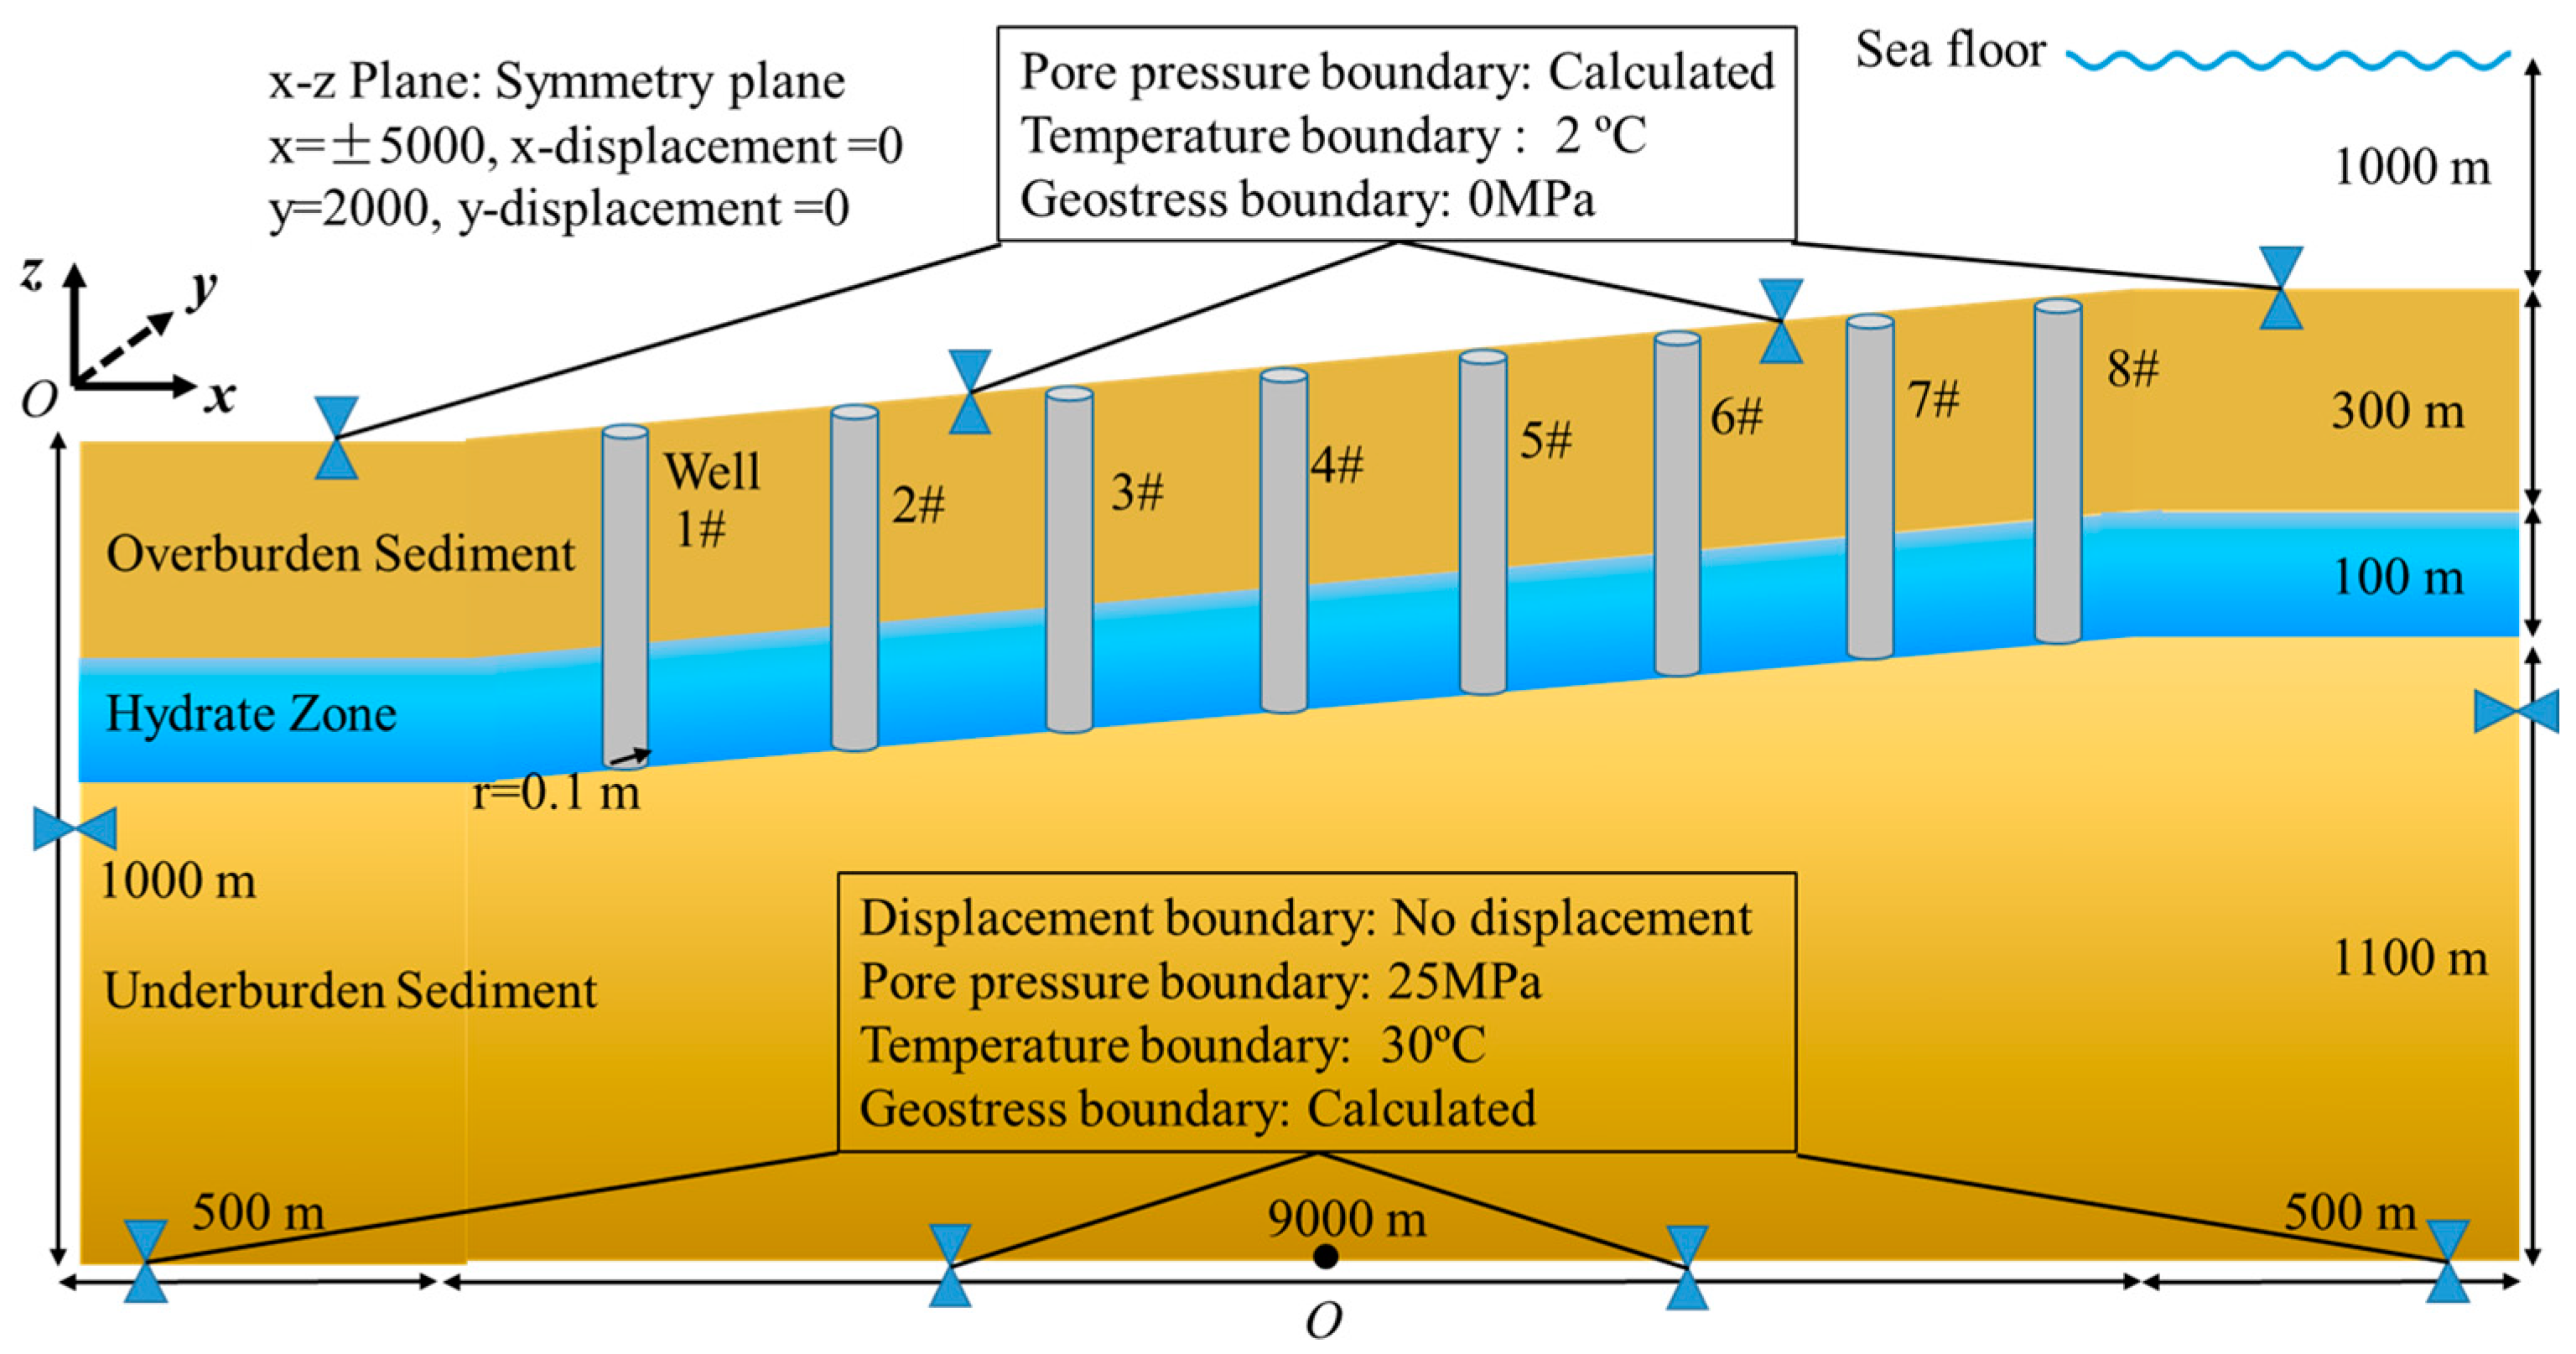
Located on the north slope of the South China Sea, the Shenhu area has slopes over 10 km long and 5 km wide, with successful hydrate recovery operations conducted by the China Geological Survey in 2017 and 2020. Seabed temperatures range from 2.3 to 3.7 °C, and water depths exceed 1000 m. The area features a stratum temperature gradient of 30–45 °C/km, hydrate sediment thickness of 10–120 m, and porosity of 33–48%. Hydrate saturation varies significantly, ranging from 0.2 to 0.9. Over 96% of the dissociation products are methane, with the rest being ethane and propane. The mechanical characteristics of the surrounding sediments are akin to those of fully saturated hydrates [6].

3.2. Model Domains

Based on exploration survey data from the Shenhu area and typical parameters of a hydrate reservoir, the numerical model of the stratum is structured into three layers: the top layer consists of overburden sediment with a thickness of 300 m, the middle layer comprises a hydrate zone of 100 m thickness, and the bottom layer includes underburden sediment ranging from 600 to 1100 m in thickness. As shown in Figure 2, this model is set up for a gentle slope of 3.18°. Two plateaus on both sides of the slope have the same length of 500 m in x direction. Meanwhile, the slope is 9000 m long in x direction. The top and toe of the slope left side is 1500 m and 1000 m above the zero-displacement boundary. The apex of the slope is situated 1000 m below sea level, and the top width extends 2000 m in the y direction [14,46]. It is assumed that each layer is made of homogeneous and isotropic material. There is a series of vertical wells with the 0.1 m radius on the x–z plane and the number of wells and the space between wells is determined by the recovery scenario [47,48].
It is expected that there will be many ways to produce hydrates commercially in the future. It is not practical to predict the method which will be used in the future and analyze the corresponding stratum stability. Therefore, the recovery scheme adopted in this paper is assumed to be the most likely used method for primary hydrate productions. The potential geological problems in the block and the extent and magnitude of its instability can then be predicted.

3.3. Initial State and Boundary Conditions

Referring to Figure 2, the top and bottom surface are the important boundaries in the numerical model. The top surface is the seafloor surface with a temperature equal to the seawater and a pore pressure equal to the hydrostatic pressure from overlying water. And the bottom surface is considered as the non-influenced boundary. Therefore, the displacements of these two surfaces are fixed in the vertical direction. The temperature, pore pressure, and geostatic pressure are considered as functions of depth. Assuming the wellbore will not be destroyed, the wellhole is fixed in the horizontal direction. Meanwhile, the wellhole is the boundary of depressurization pressure and production surface. Other parameters such as hydrate saturation, porosity, and permeability are set as initial conditions.
The overburden stress increases with depth and densities which are assumed to be constants in the overburden and underburden sediment layers and calculated in the hydrate zone. The top and bottom domain sides are temperature boundaries at 2 °C and 30 °C, respectively [6,14]. The model developed in this study simulates the thermal variations induced by hydrate dissociation and regeneration, resulting from changes in formation pore pressure, which consequently alters the temperature field of the formation. It also captures the dynamics of formation pore pressure and fluid migration during the depressurization of formation hydrates. Key seepage and thermodynamic parameters are detailed in Table 2.
For the initial states of model domain, the initial porosity is 0.4, while the permeability for non-hydrate-bearing formations is 0.6 mD. Specifically, the initial permeability of the hydrate formation is fixed at 0.2 mD, with post-dissociation permeability calculated using Equation (5). Additionally, thermal properties of the materials are dependent on temperature conditions. To simplify calculations, the heat transfer coefficient is maintained at a constant value.
When all these boundary conditions and the initial parameters are input and drive the Geostatic Step in ABAQUS, the geostatic balance state of the stratum will be output at the end of the step. This state can be considered as the origin state of the stratum with the preliminary distribution of multifield, including stress, strain, hydrostatic, and pore pressure, etc. This preprocessing analysis helps the model predictions to achieve desirable accuracy without changing the initial load.

3.4. Recovery Scenarios

The depressurization method is extensively employed in NGH recovery experiments and represents one of the most economical and practical approaches to extracting NGH [13]. Figure 3a shows the hydrate equilibrium curve and formation and hydrate reservoirs P-T conditions. The x axis is temperature. The x coordinate of the left and right edge of the green area is −3500 m and 3500 m. There are eight vertical wells and the distance between wells is 1000 m. Figure 3b shows the recovery scenario tested in the simulation. In the diagram, the x axis represents a constant temperature for each individual production well, while the y axis indicates the production pressure at the well bottom. Five scenarios of production pressure are considered, creating five cases per well, depicted as green rectangles representing the production conditions. When the P-T conditions exceed the equilibrium curve, NGH decomposes into gas and water. The black points in Figure 3b illustrate the P-T conditions at the well bottom. When the production pressure is 8 MPa or 9 MPa, there are two or three wells that would not have hydrate decomposition. Therefore, the comparison between the model results for the well with and without hydrate decomposition provided the evaluation of the effect of hydrate dissociation on seafloor subsidence.

4. Results and Discussion

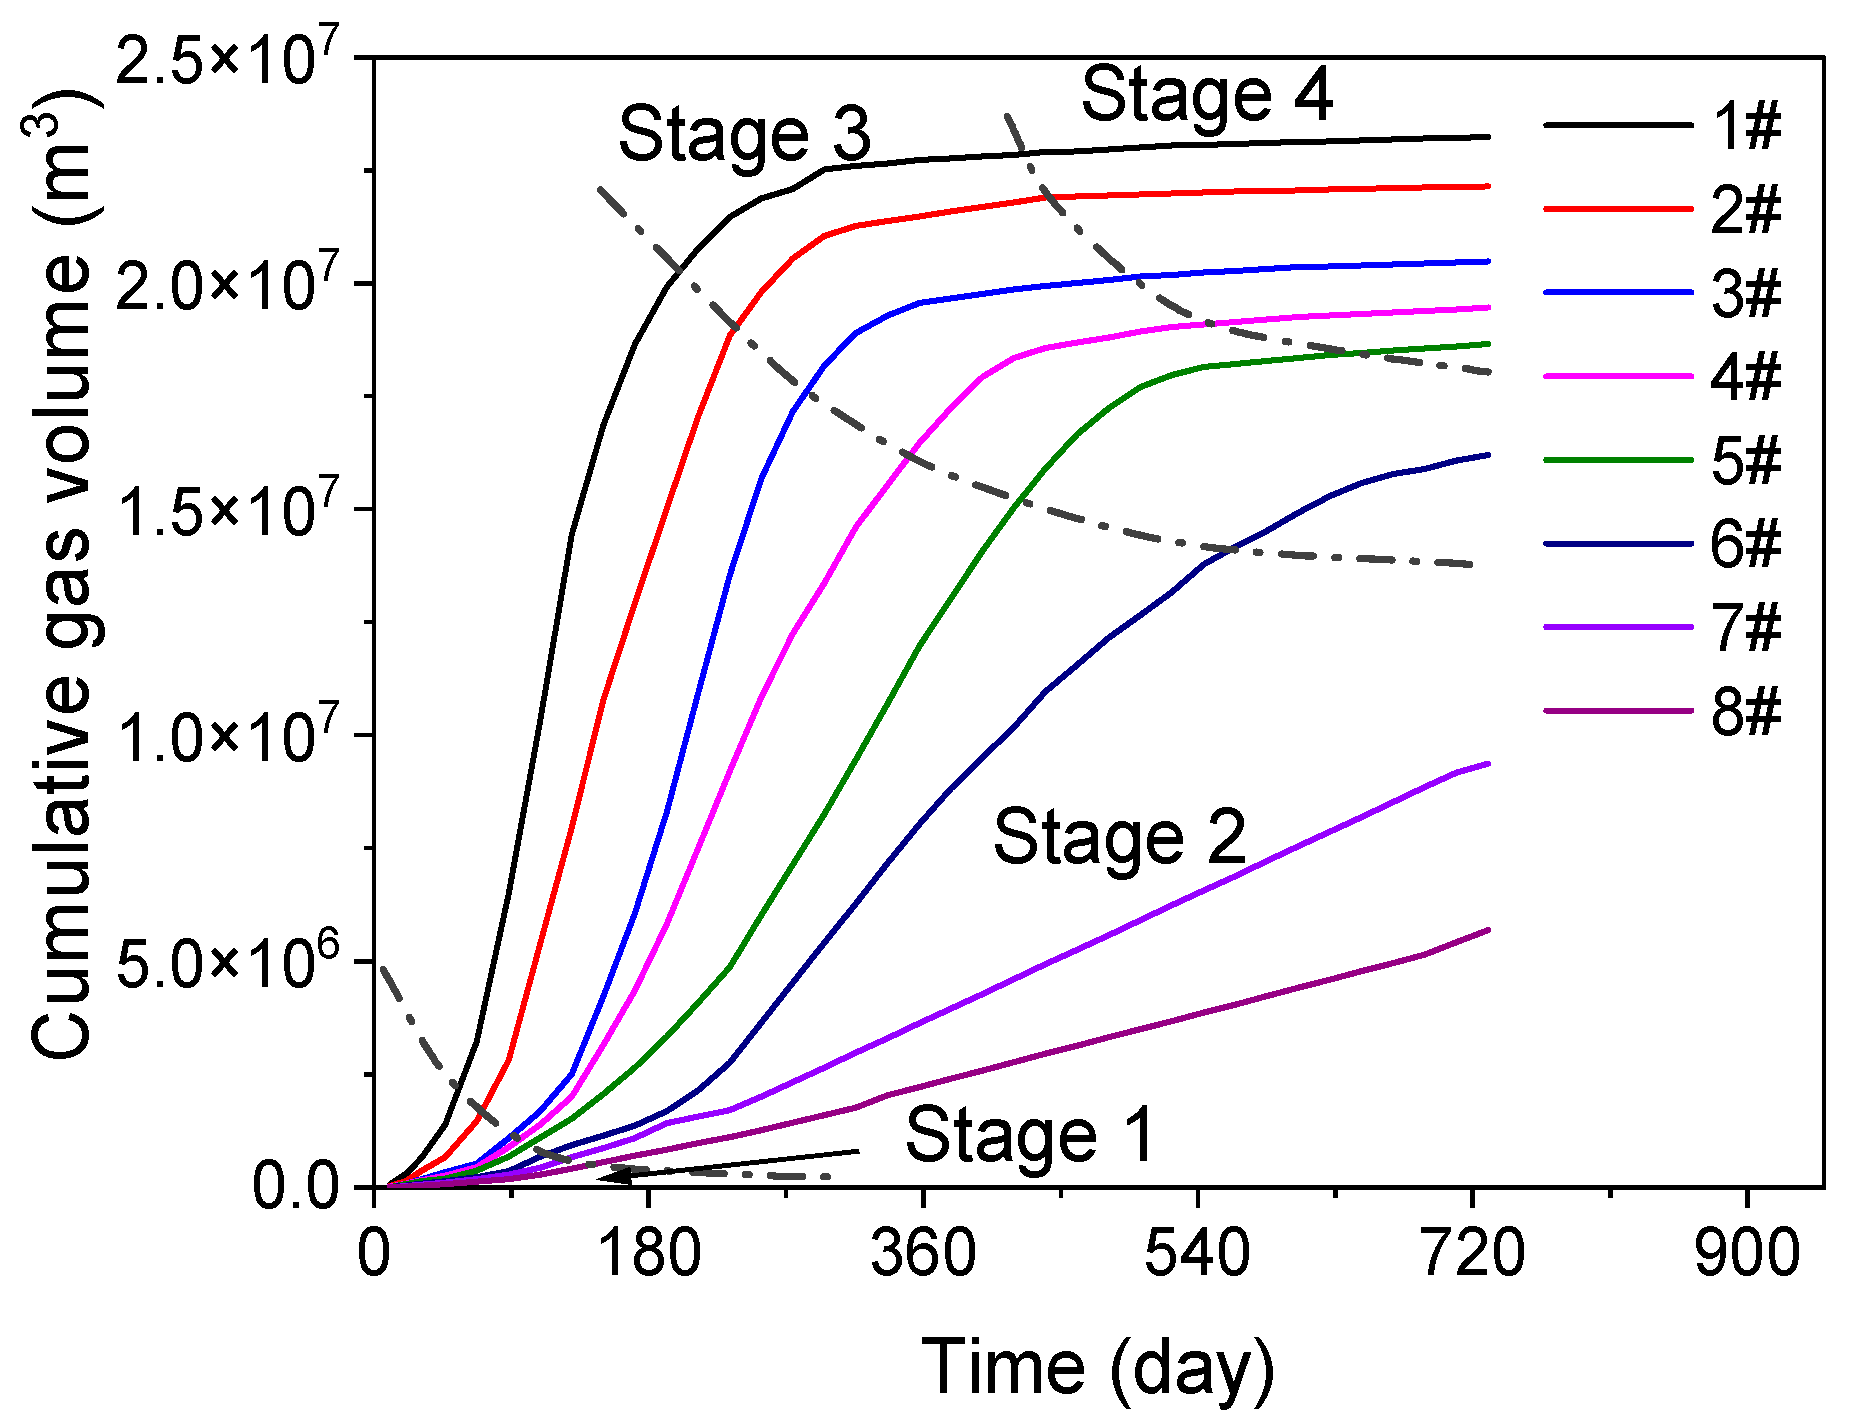
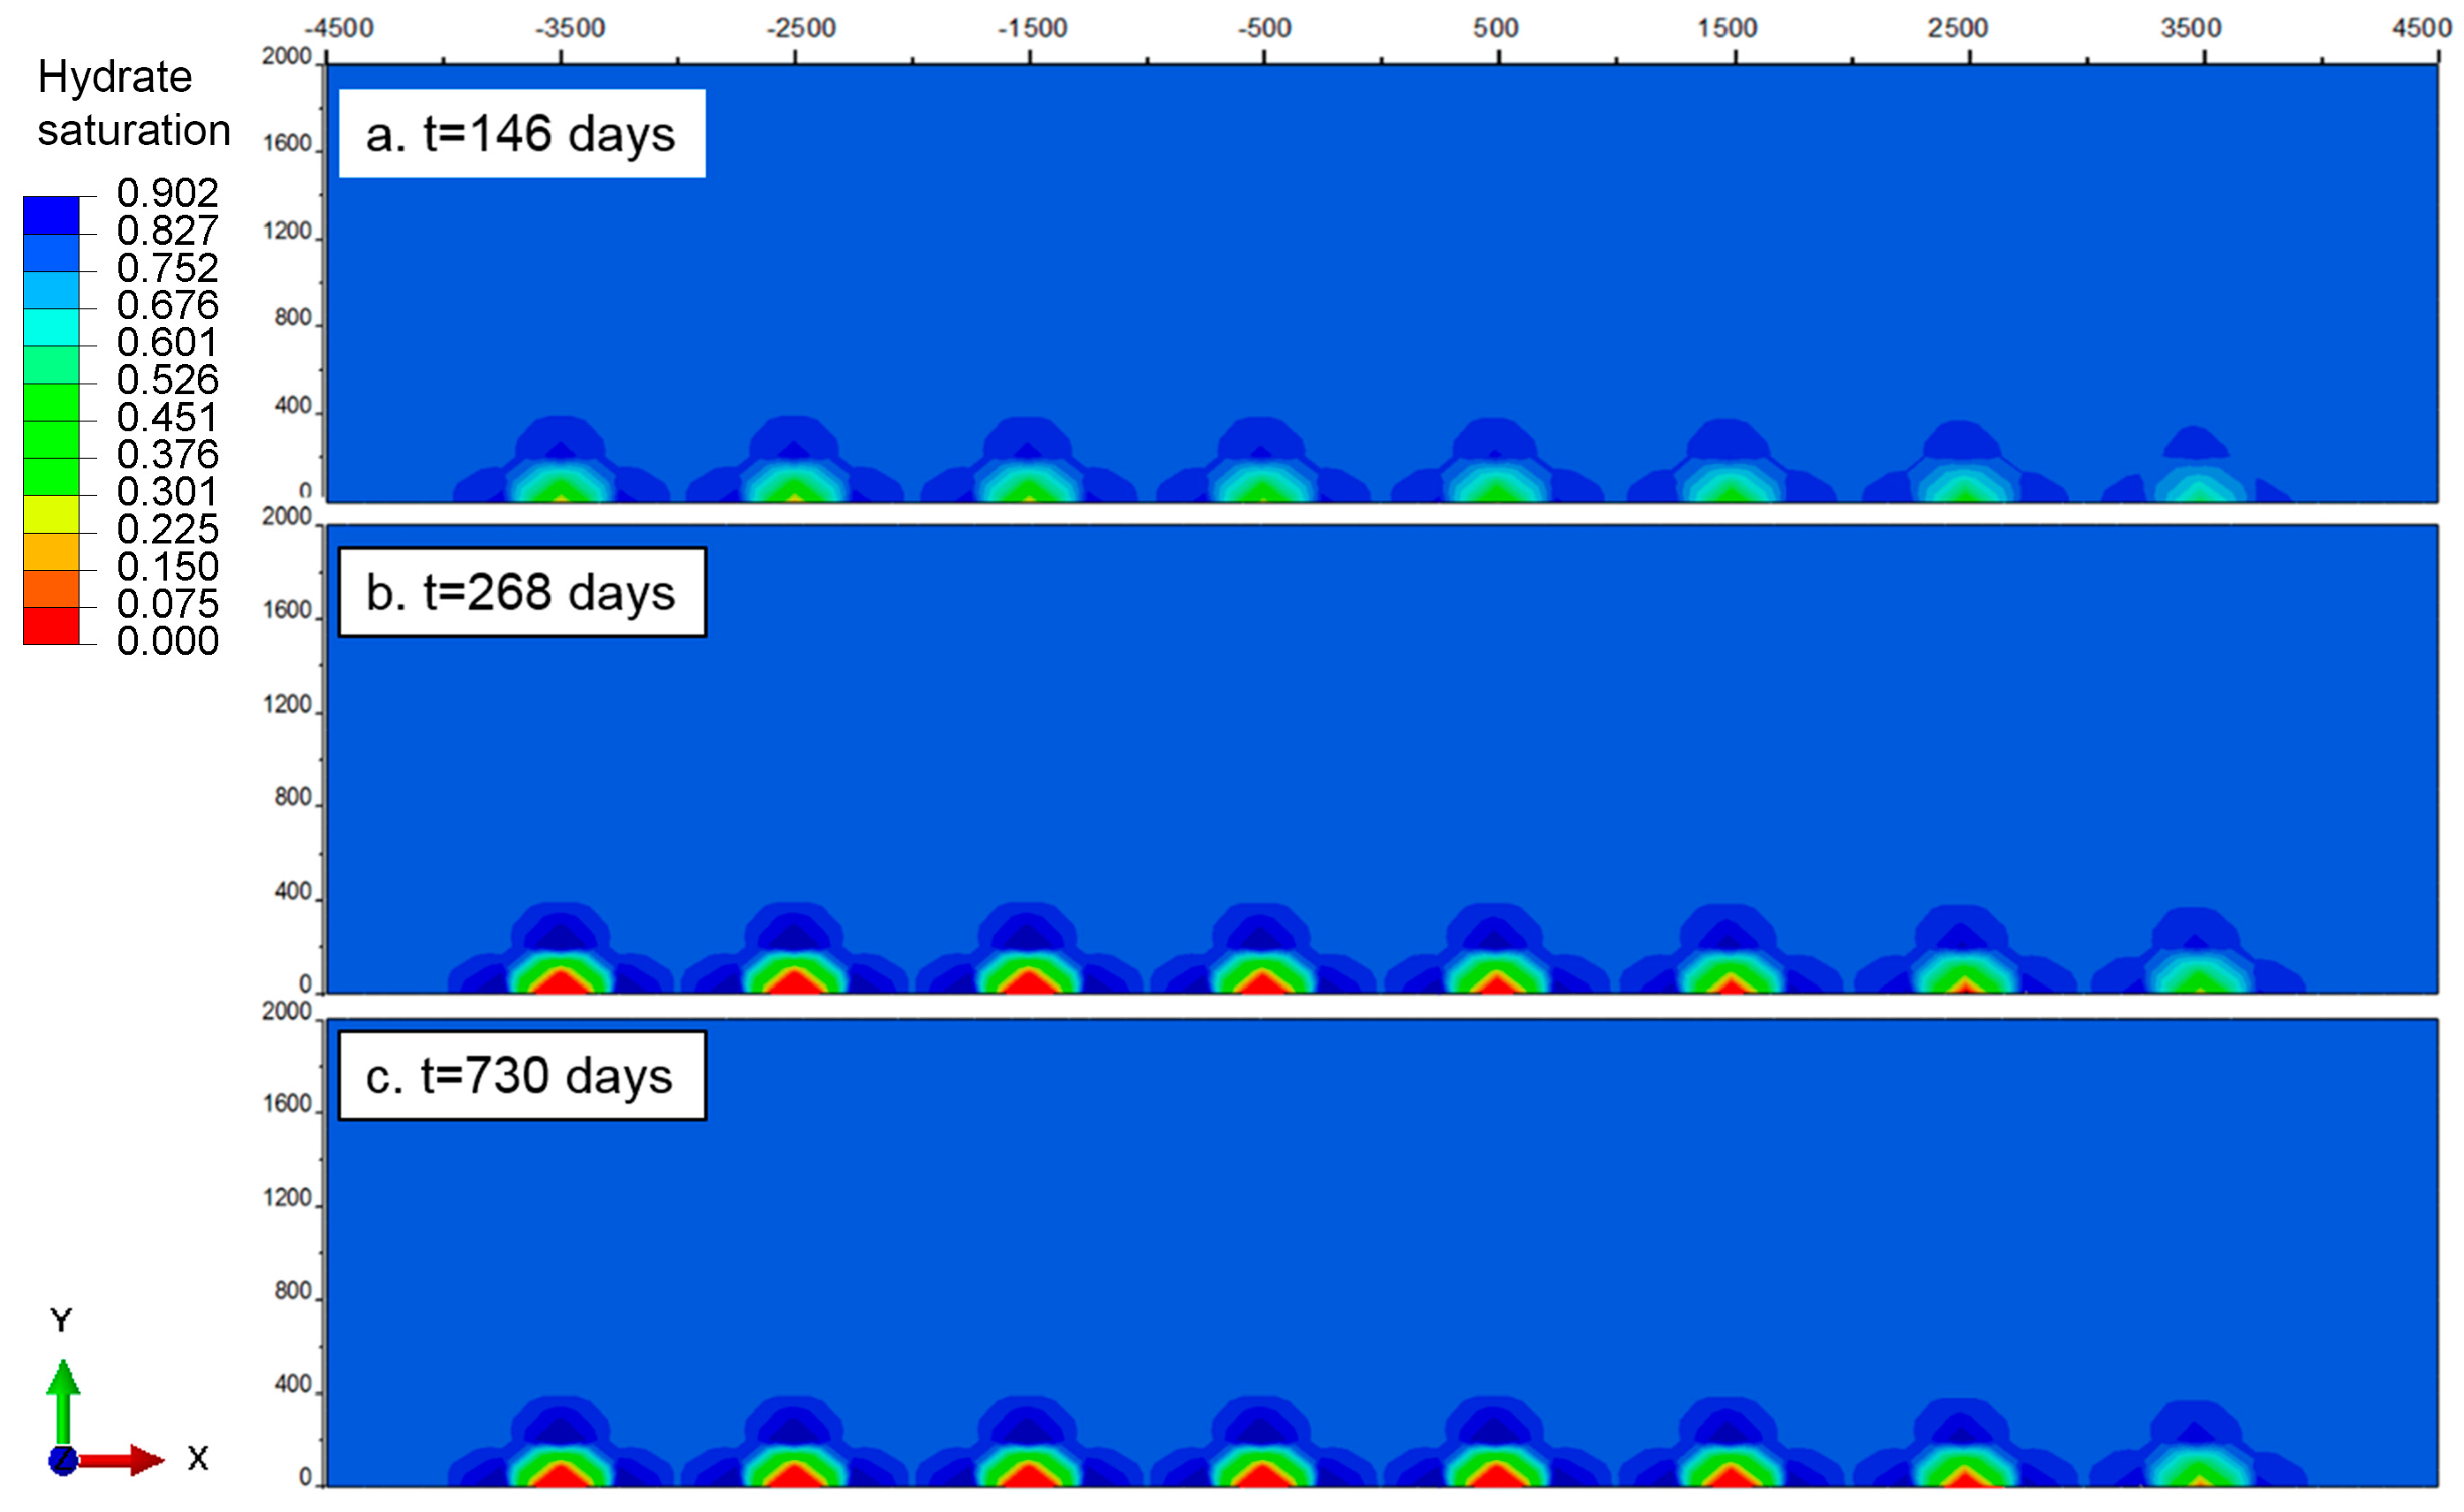
4.1. Procedure of Hydrate Dissociation

Figure 4 illustrates the cumulative gas volume across wells 1 to 8, highlighting the substantial influence of formation conditions on the degree of hydrate dissociation [22,23]. The gas production process is segmented into four distinct stages: initial decomposition, rapid production, production decline, and the stable stage. The duration from the onset to the conclusion of the third stage, along with the cumulative gas production, is significantly shaped by the recovery conditions. As depicted in Figure 3b, a greater deviation from the recovery condition to the phase equilibrium curve correlates with higher cumulative gas production and a shorter transition to the stable stage.
Hydrate decomposition results in dynamic alterations in the mechanical behaviors of the formation, as depicted in Figure 5, which displays the spatial distribution of hydrate saturation at various times under a production pressure of 7 MPa. The rate of hydrate decomposition is markedly higher in the deeper parts of the formation compared to the shallower regions, influenced by the formation temperature, pore pressure conditions, and production pressure. Notably, Figure 5 shows that the periphery of the decomposed area forms a continuous dark blue ring where the hydrate saturation exceeds the initial conditions. Furthermore, as hydrate decomposition progresses, the saturation in this region increases and eventually stabilizes.
The depressurization method enhances the effective stress within the formation, prompting hydrate breakdown. Concurrently, the strength of the decomposed zone deteriorates significantly, rendering it unable to withstand the overburden pressure. Therefore, the surrounding area must bear the part of the extra geostress which was previously born by the hydrate decomposition zone. Correspondingly, decomposed gas and water may reform into hydrate in this area due to higher stress, leading to a slight increasing of hydrate saturation. Subsequently, the increase in effective stress leads to compaction of the surrounding region, resulting in a decrease in both effective porosity and permeability. This would lead to a drastic reduction in seepage properties of the surrounding area and pore pressure trapping. Further hydrate dissociation would then be trapped in this area so that the hydrate dissociation would stagnate when the hydrate is exhausted.

4.2. Stratum Geomechanics Response

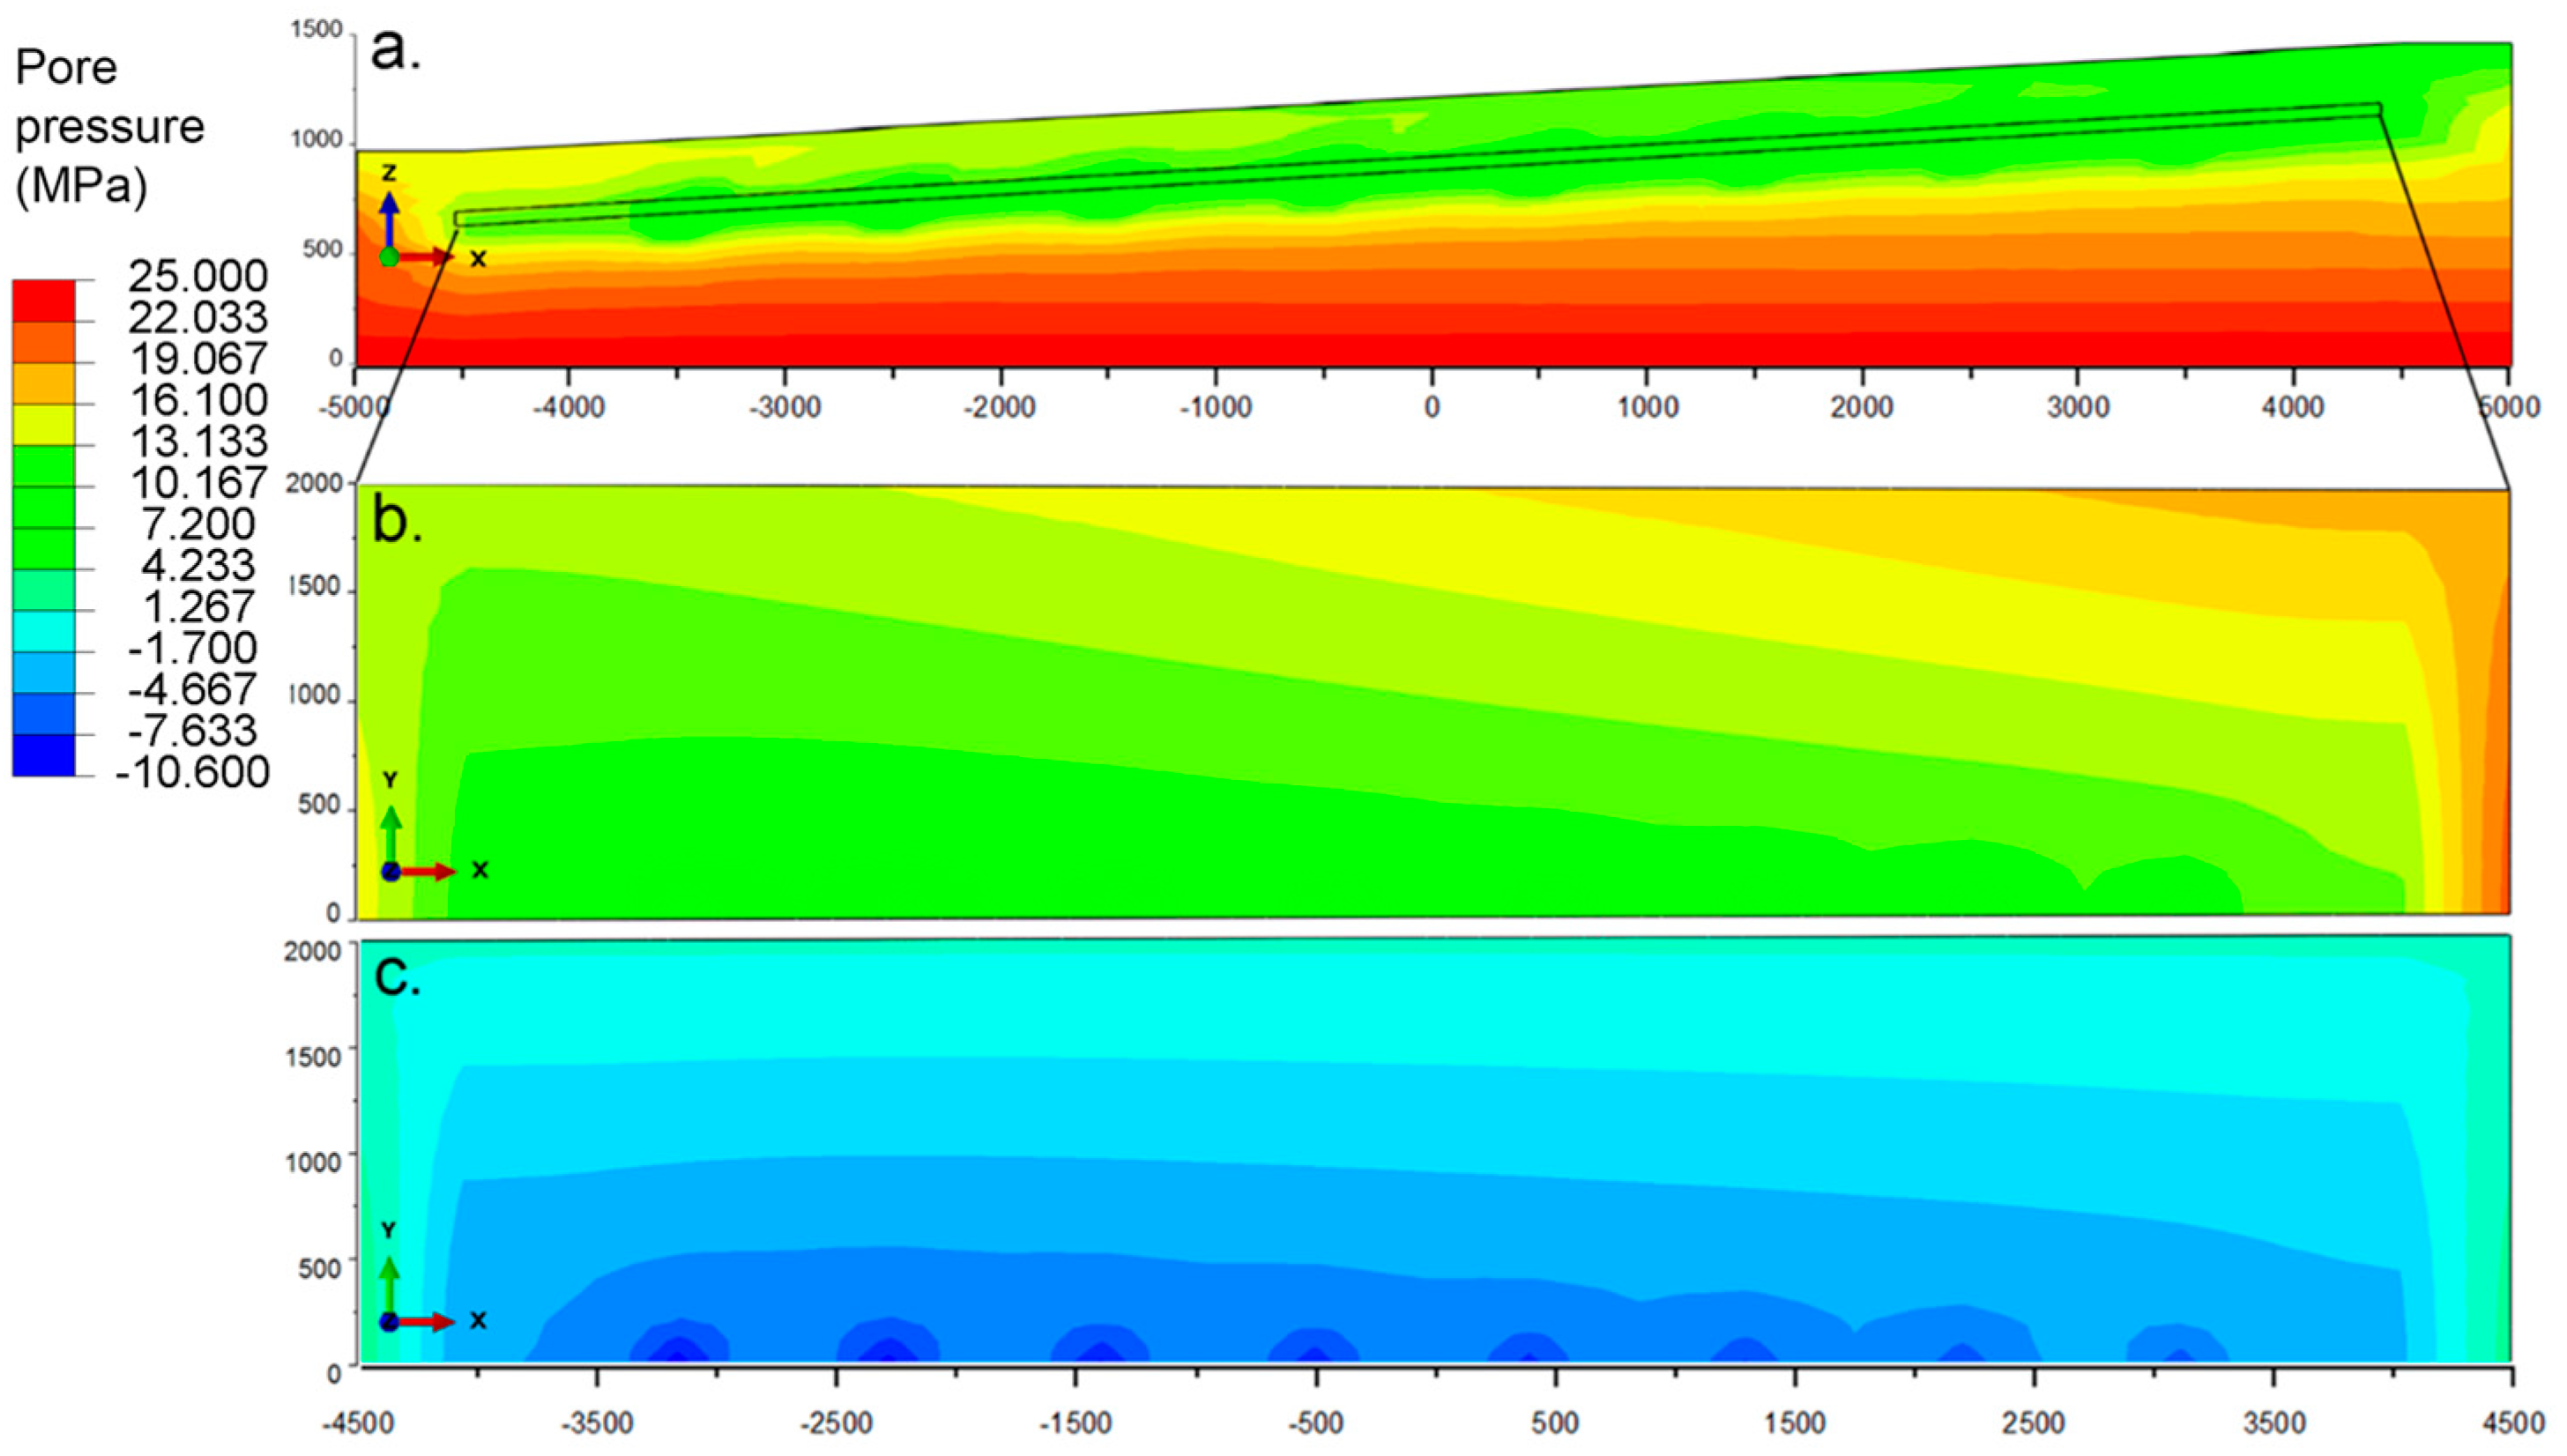
4.2.1. Pore Pressure Distribution

The reduced bottom hole flowing pressure leads to a redistribution of the formation’s pore pressure field. Given that variations in bottom hole temperature are not accounted for in this scenario, changes in pressure become the primary driving force for hydrate decomposition. Figure 6 illustrates the distribution of pore pressure and pressure drop across the slope, captured under a production pressure of 7 MPa at 730 days. It shows that the reduction in pore pressure is not evenly distributed in the formation. At this time, the left half stratum has reached the stable stage so that the hydrate saturation almost remains stable in this area while it slowly changes in the right half stratum. The closer to the wellbore, the larger the pressure drops at a certain distance. The high pressure drop (more than 7 MPa) only occurs in a narrow area next to the wellbore, which is the only region where the hydrate may decompose (Figure 6b,c). Due to the poor seepage capacity of the overlying and underlying rock formations, as depicted in Figure 6a, the low pressure within the hydrate formation exerts a minimal impact on adjacent formations. Ultimately, influenced by the pore pressure at the boundaries, the rate of pore pressure drop within the formation decelerates and generally stabilizes.

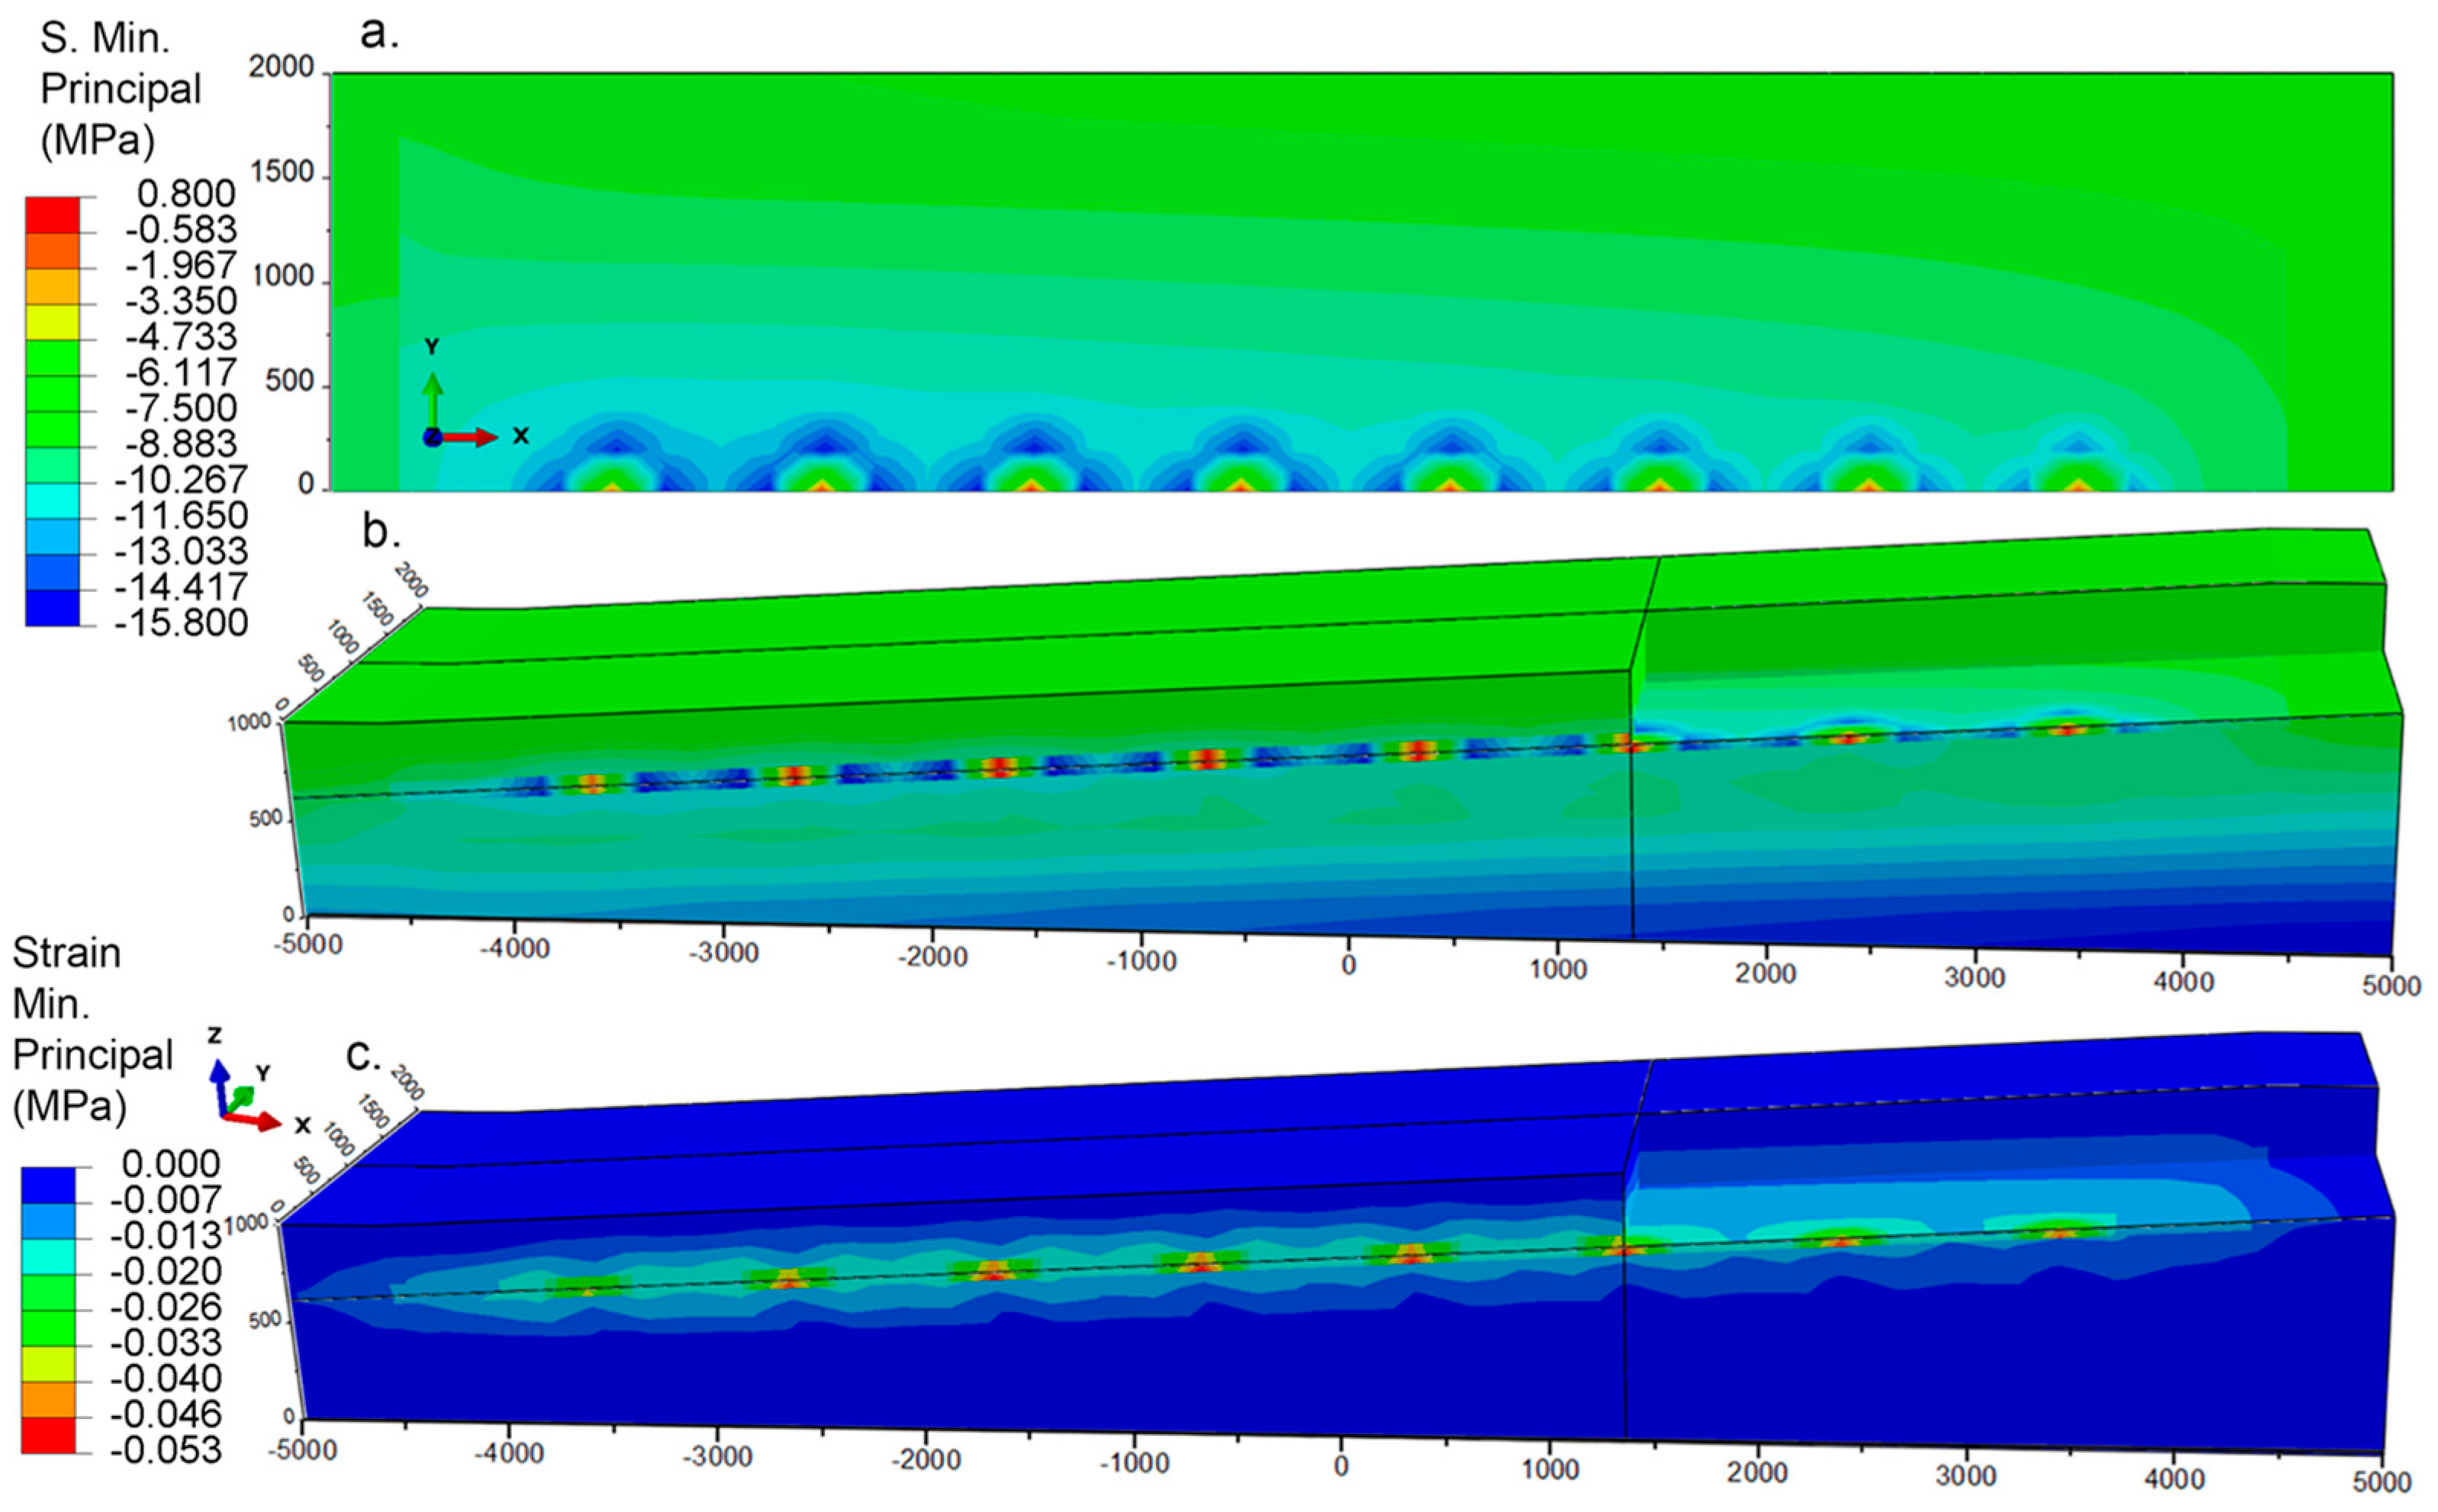
4.2.2. Stress Distribution

The stress that the formation skeleton withstands is the effective stress, and the formation would strain when the effective stress changes. Figure 7 shows the minimum principle stress and strain in hydrate formation after two years of production. Apparently, the minimum principal stress distribution is spatially consistent with the hydrate saturation distribution (Figure 5 and Figure 7b). If the skeleton strength remained constant, a reduction in pore pressure would correspondingly increase the effective stress. However, the decomposition of hydrates significantly weakens the formation’s strength, altering this dynamic. In the formation, high strength corresponds to high stress and vice versa. Therefore, in a hydrate decomposed or decomposing area, the shorter distance to the wellhole, the lower the effective stress. Meanwhile, the effective stress in the peripheral region of the hydrate decomposition area is considerably increased because the overburden sediments would not completely collapse into the hydrate decomposition and collapse region due to their mechanical strength. Thus, part of the overburden pressure initially borne by the hydrate decomposed zone is transferred to the undecomposed area. Therefore, the support for the overlying layer and the compaction for the underlying layer of the hydrate decomposition zone is reduced. Additionally, the decomposition of hydrates leads to weakened compaction in the underlying layer, causing the underlying formation to experience strain as pronounced as that in the overlying formation, as illustrated in Figure 7c. This phenomenon results from the interplay of pore pressure, effective stress, and the compacting effects exerted by both overlying and underlying formations; the hydrate saturation would eventually reach an equilibrium stable state. The formation area changes differently in response to different formation strength.

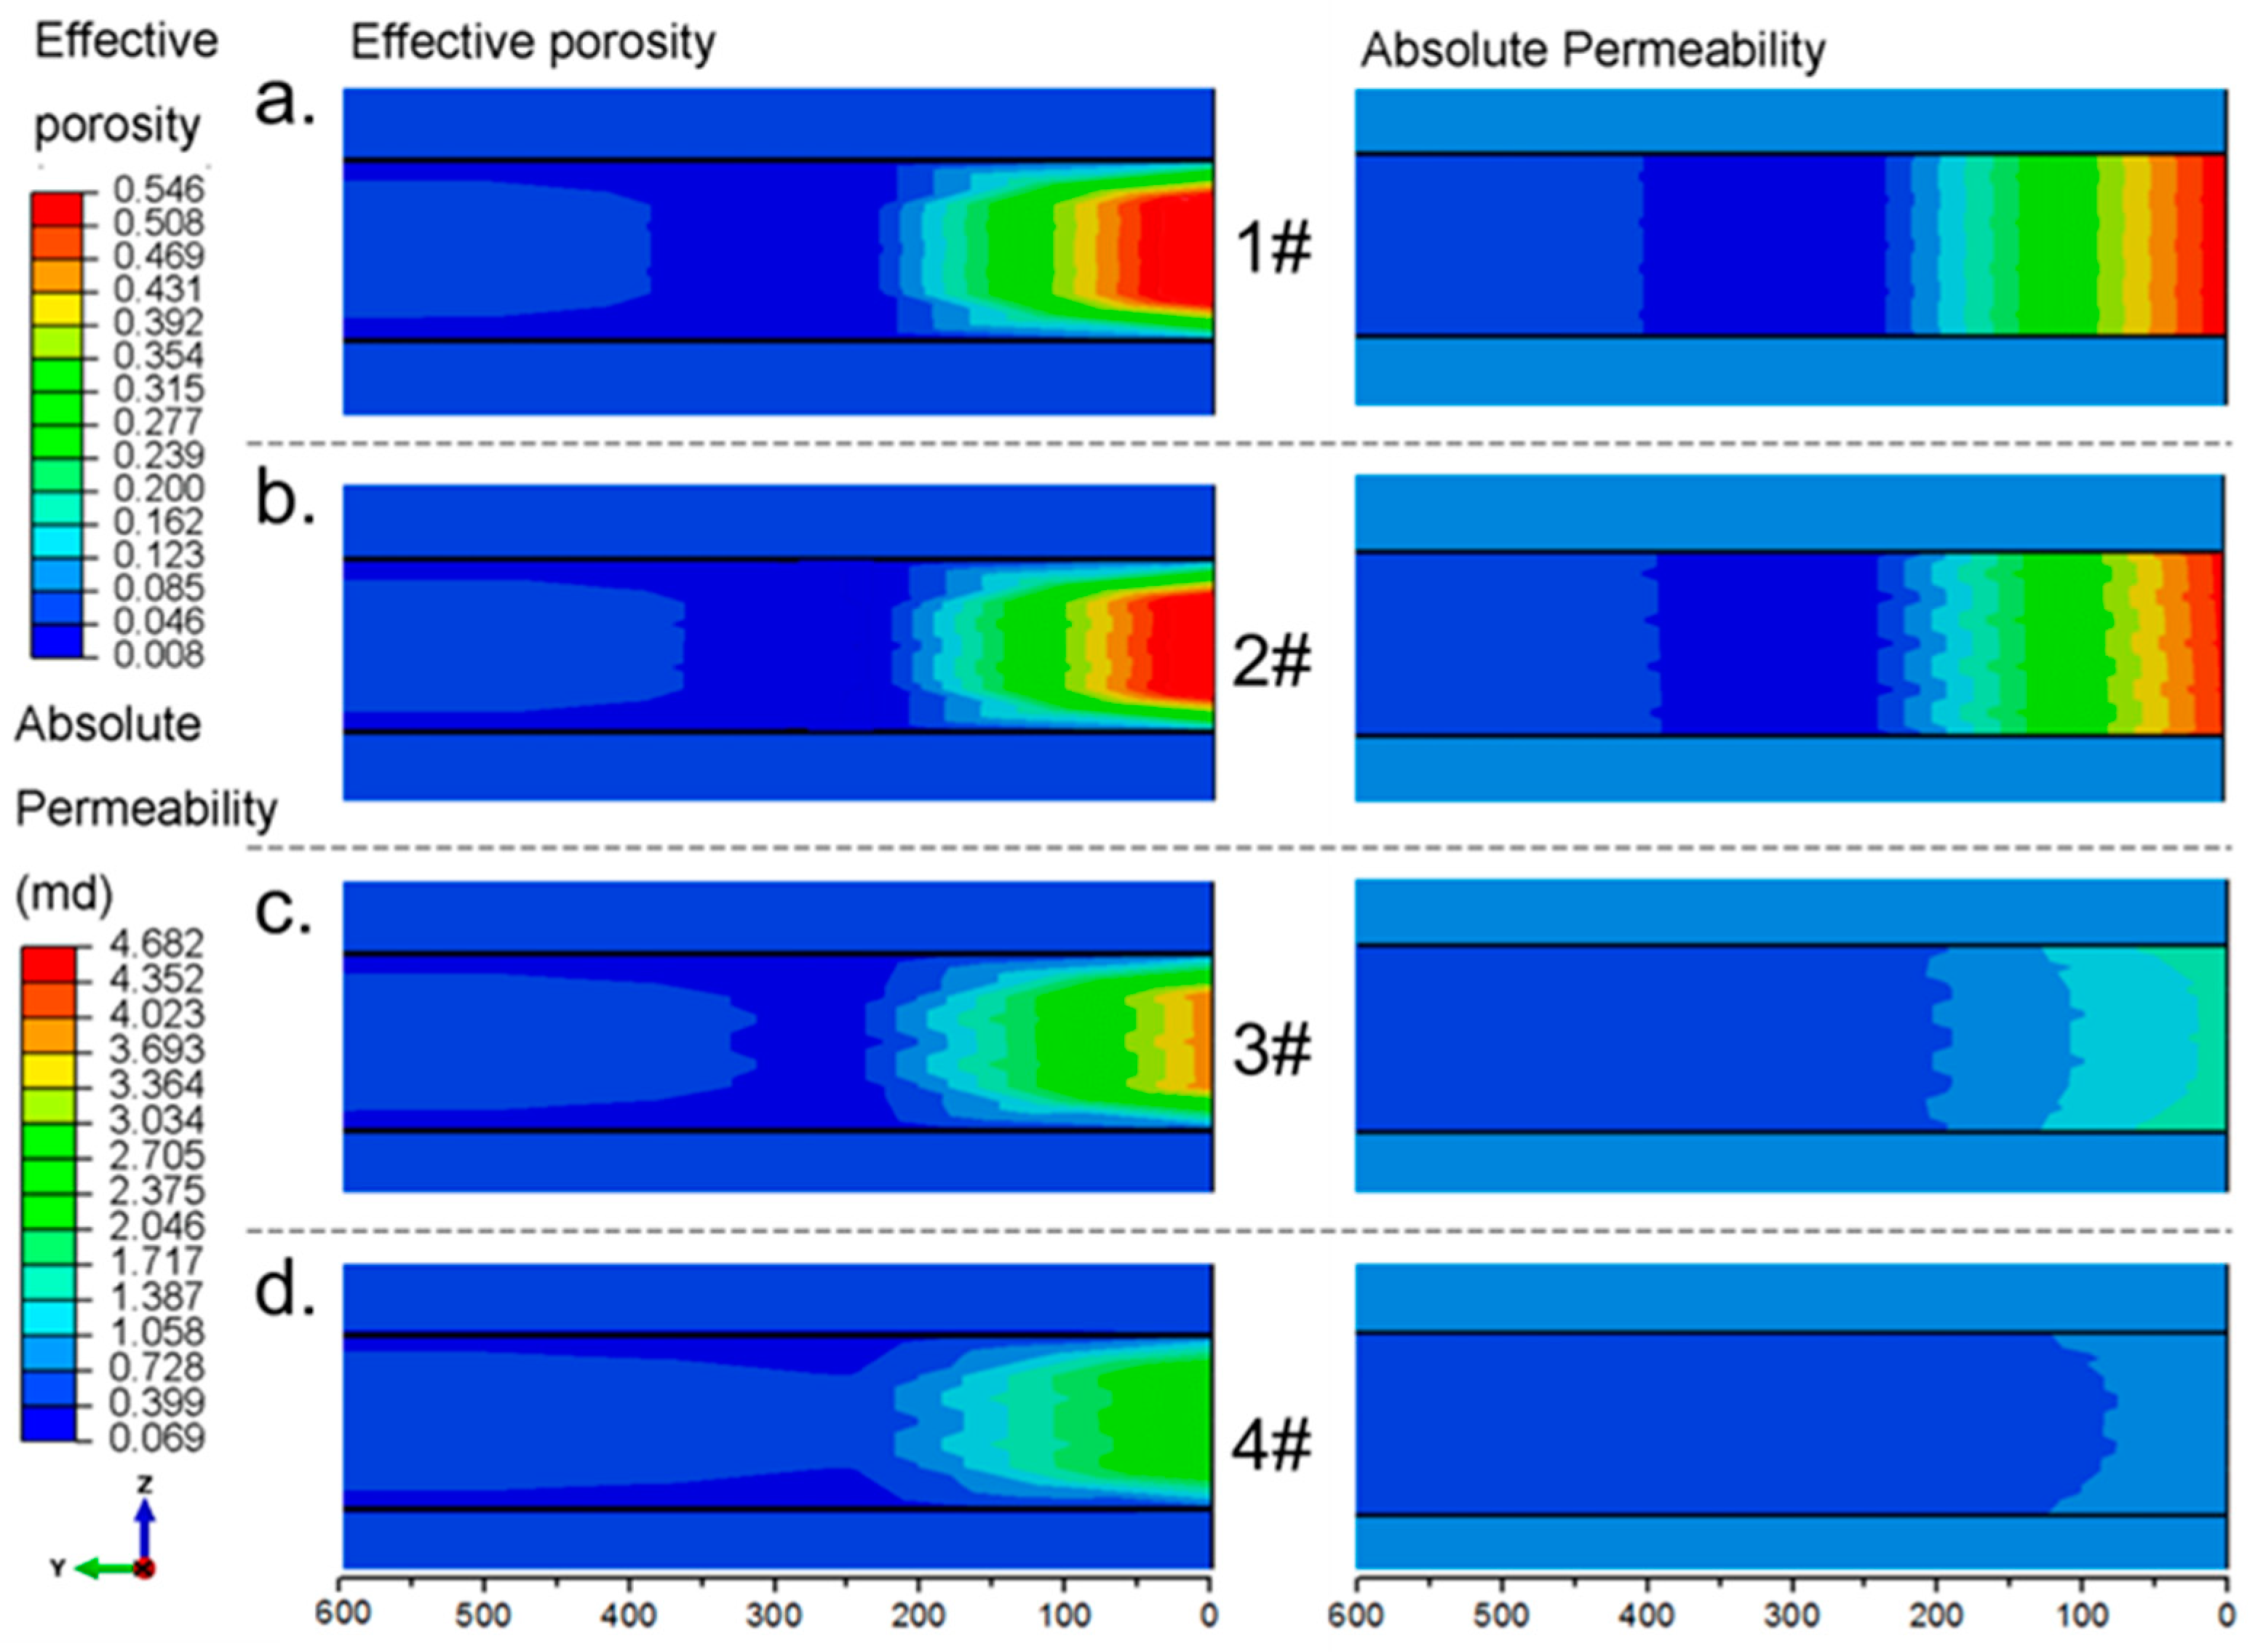
4.2.3. Seepage Response

Hydrate saturation, porosity, permeability, pore pressure, and minimum principal stress distribution have similar spatial patterns. Figure 8 shows the top view of the effective porosity and the absolute permeability of hydrate formations in eight wells after two years of production. The degree of hydrate decomposition decreases gradually from well 1# to well 8# spatially. Coinciding with hydrate decomposition degree, the maximum porosity and permeability increase accordingly. As shown in Figure 8a, the effective porosity in the hydrate decomposed area decreases with distance from the wellbore. In the surrounding region, the effective porosity is compacted to 0.008, which is under a large negative impact on seepage. The permeability in this area also reduced from 0.4 md to 0.069 md as the hydrate decomposed area and surrounding area is compacted due to low strength and the stress transfer. Therefore, the hydrate decomposed peripheral region becomes a hypotonic zone which prevents the lower pressure from wells from propagating far away. This zone traps more than half of the pressure drop in a small area so that the hydrates cannot decompose continuously. At the same time, permeability determines whether the products of hydrate dissociation can be rapidly transported, significantly affecting the relative concentrations of gas and liquid phases, as well as the hydrate phase, around the site of dissociation. This, in turn, influences the subsequent rate of hydrate dissociation. Therefore, seepage plays a crucial role in the hydrate-dissociation processes and significantly impacts the entire system.

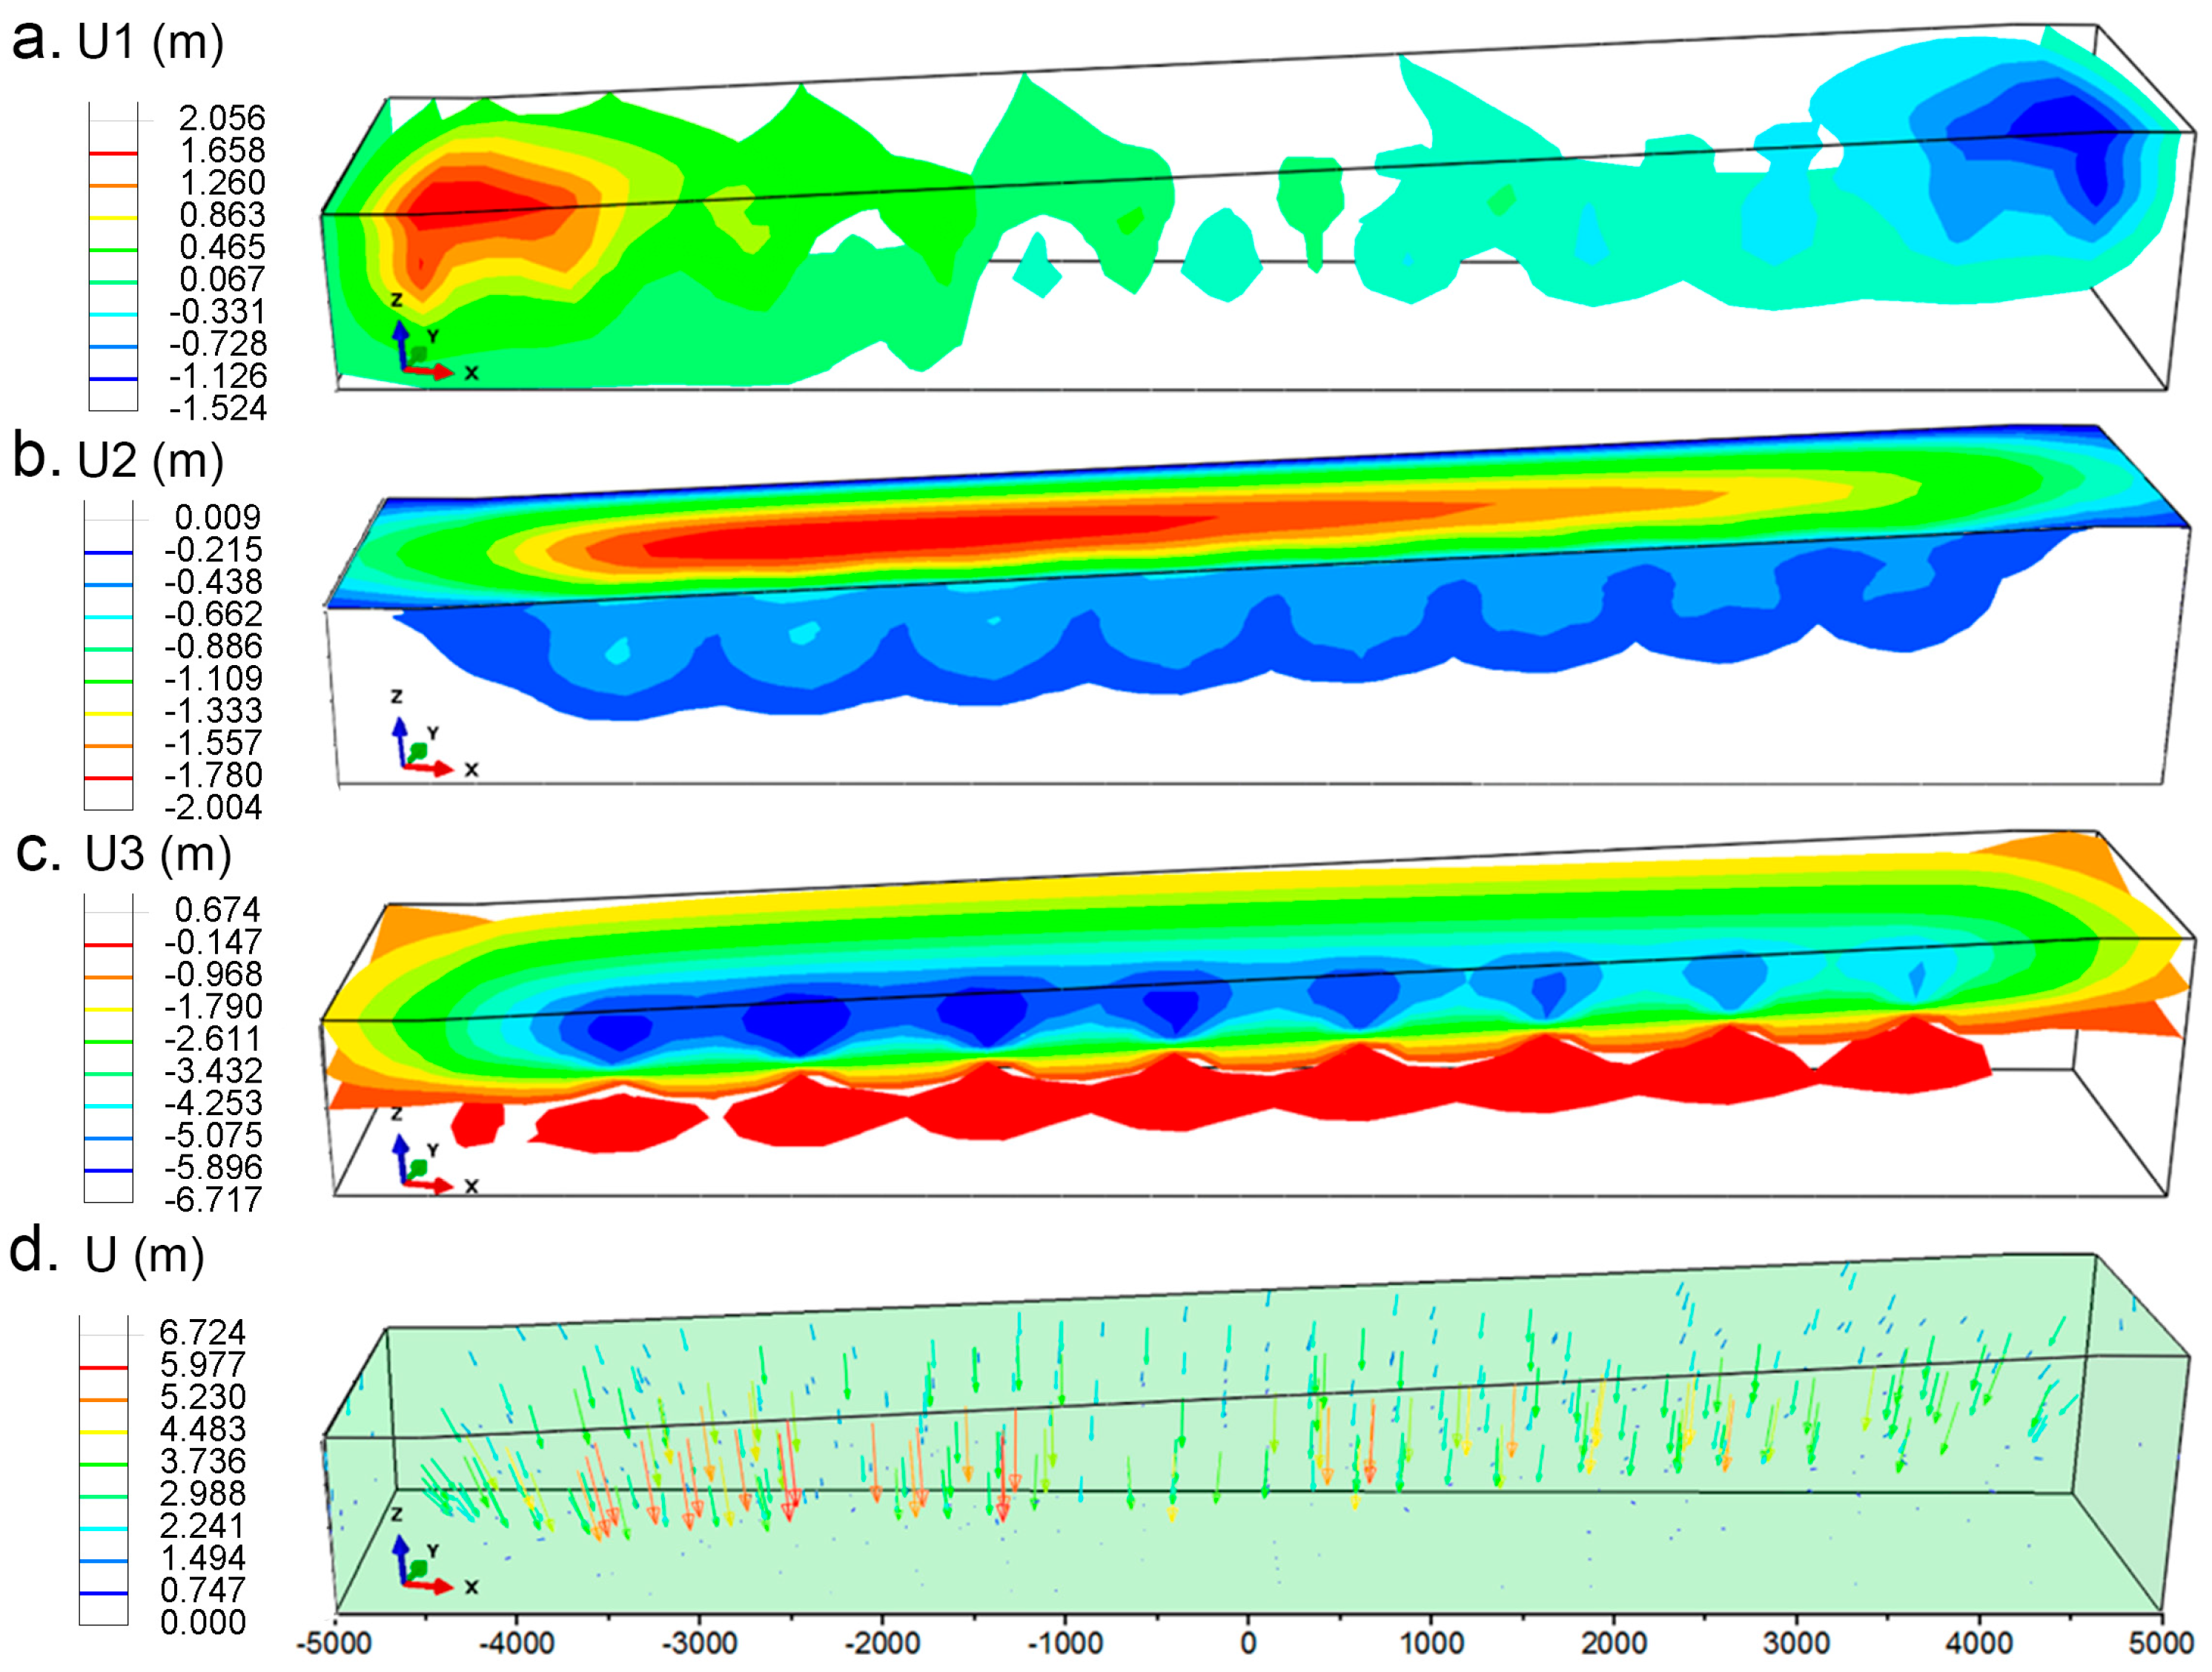
4.3. Seabed Strata Stability

Currently, there is a lack of systematic evaluation criteria for instability of submarine strata. It is feasible to quantify the stability of submarine formations by evaluating the displacement components and strain components in formation in order to determine if any of the related material has reached the plastic deformation stage. Figure 9 shows only a small range of plastic deformation occurs in the hydrate fully decomposed area. It confirms that the plastic yielding remains negligible in the entire stratum. Therefore, the main risk associated with the formation is seafloor subsidence, stratum displacement due to formation strength reduction, and volume deficit, rather than large-scale submarine landslides due to plastic failure.
Figure 9 shows the displacement component in three directions. Figure 10a shows that the displacements along -xirection occurs in the slope top with a maximum of 2 m and the displacement along x direction occurs in the slope foot area with a maximum of 1.5 m. The displacements in the x direction in these two areas are caused by the seafloor subsidence. The strata exhibit minimal effective horizontal displacements due to hydrate dissociation. Model results suggest that hydrate dissociation does not trigger landslides across the entire slope in this block. A comparison between Figure 10c,d shows that displacements in the x direction, observed at the top and toe of the slope, are caused by stratum subsidence. Furthermore, hydrate dissociation results in the settling of the formation around the well, prompting surrounding formations to shift toward the center of the wellbore. Simultaneously, the slope top and toe are stress concentration areas which means that changes of formation physical parameters are more likely to produce a significant effect in these two regions.
Figure 9c shows the displacement component in the z directions at each well corresponding to settlement and rise of the stratum. Maximum subsidence in the negative z direction is 6.71 m which is almost triple that in the other two directions. The strength and density reduction in the hydrate sediment results in subsidence of the overburden strata and rising of the underburden strata. Combined with the hydrate residual saturation result in Figure 5c, the conclusion can be drawn that a higher degree of hydrate dissociation leads to a greater extent and scale of subsidence in submarine formations. Conversely, the uplift of the underlying formation is not solely dependent on hydrate saturation but is also influenced by the effective stress. With reference to Figure 9b, the distribution of the displacement in the y direction is correlated to the seafloor subsidence. The displacement vectors (arrows) and magnitudes (color) in Figure 9d indicate that the displacement directs towards the deep stratum and the middle of the slope.
In summary, the submarine strata movement is dominated by subsidence while the large-scale landslide is mainly in horizontal directions. This result indicates that the geological hazard that can be easily monitored during and after the hydrate production is submarine subsidence rather than landslides. In addition, the shear strength of cement is much lower than its compressive strength so that the horizontal displacement tends to generate a strong sheer stress on the cement ring; therefore, wellbore instability may occur. However, the large displacement in the vertical direction would influence the whole engineering and the result is hard to predict. Due to the complex mechanical behavior of hydrate sediment, it is necessary to conduct triaxial experiments on hydrate sediment constitutive model and strength dynamics to assess the geomechanical responses reliably.

4.4. Influence of Recovering Pressure on Formation Stability

The strata stability response to production pressure can be evaluated through strata displacement and seafloor subsidence. Figure 10 shows the displacement of the submarine strata after using the depressurization method for two years with different production pressures. As depicted in Figure 10a, when the production pressure exceeds 6 MPa, the sedimentation of the overlying stratum and the rise of the underlying stratum increases with decreasing pressure. The settlement and uplift of the formation under a 5 MPa production pressure are less than that under a 6 MPa production pressure, which suggests that lower production pressure does not necessarily lead to greater formation displacement. This phenomenon can also be found in other subplots of Figure 10. For instance, the distribution of the seafloor subsidence in the y direction and the maximum seafloor subsidence around well 6# under the 6 MPa production pressure is greater than that under the 5 MPa production pressure, whereas the subsidence under higher production pressure is less than that under 6 MPa (Figure 10b). Excessively lower production pressure causes rapid decomposition of hydrate, which in turn leads to a rapid settlement of the formation. Rapid settlement decreases the hydrate decomposability range and compacts the surrounding formation prematurely. As a result, the hydrate decomposed range is reduced, and the settlement is reduced. Meanwhile, production pressure has a significant impact on formation settlement.
Figure 10c shows that the subsidence at 50 days under 5 MPa is equal to that at 730 days under 9 MPa and that the formation settlement for 30 days is about half of the sedimentation for two years. The seafloor level experiences a sharp decline due to an initial significant drop in pore pressure at the well, followed by a gradual decrease. Notably, the estimated seafloor subsidence in the first 50 days accounts for over half of the total subsidence observed after two years of production, as shown in Figure 10c. Specifically, seafloor subsidence reaches approximately 3.8 m after half a year and 6.2 m after two years at a production pressure of 6 MPa. The extensive range of seafloor subsidence in the horizontal direction is attributed to the low strength of unconsolidated sediments. This indicates that even a minor reduction in pressure at the production well can lead to significant seafloor subsidence, potentially causing wellbore instability and other engineering hazards and failures. Therefore, it is critical to take production pressure and related geological problems into consideration during hydrate production.

5. Conclusions

This study develops a thermal–multiphase–mechanical coupled model of hydrate sediment using ABAQUS, achieved by programming the USDFLD subroutine. It evaluates the stratum stability in response to varying production pressures applied during the depressurization recovery method. Key findings from this study include the following:
(1)
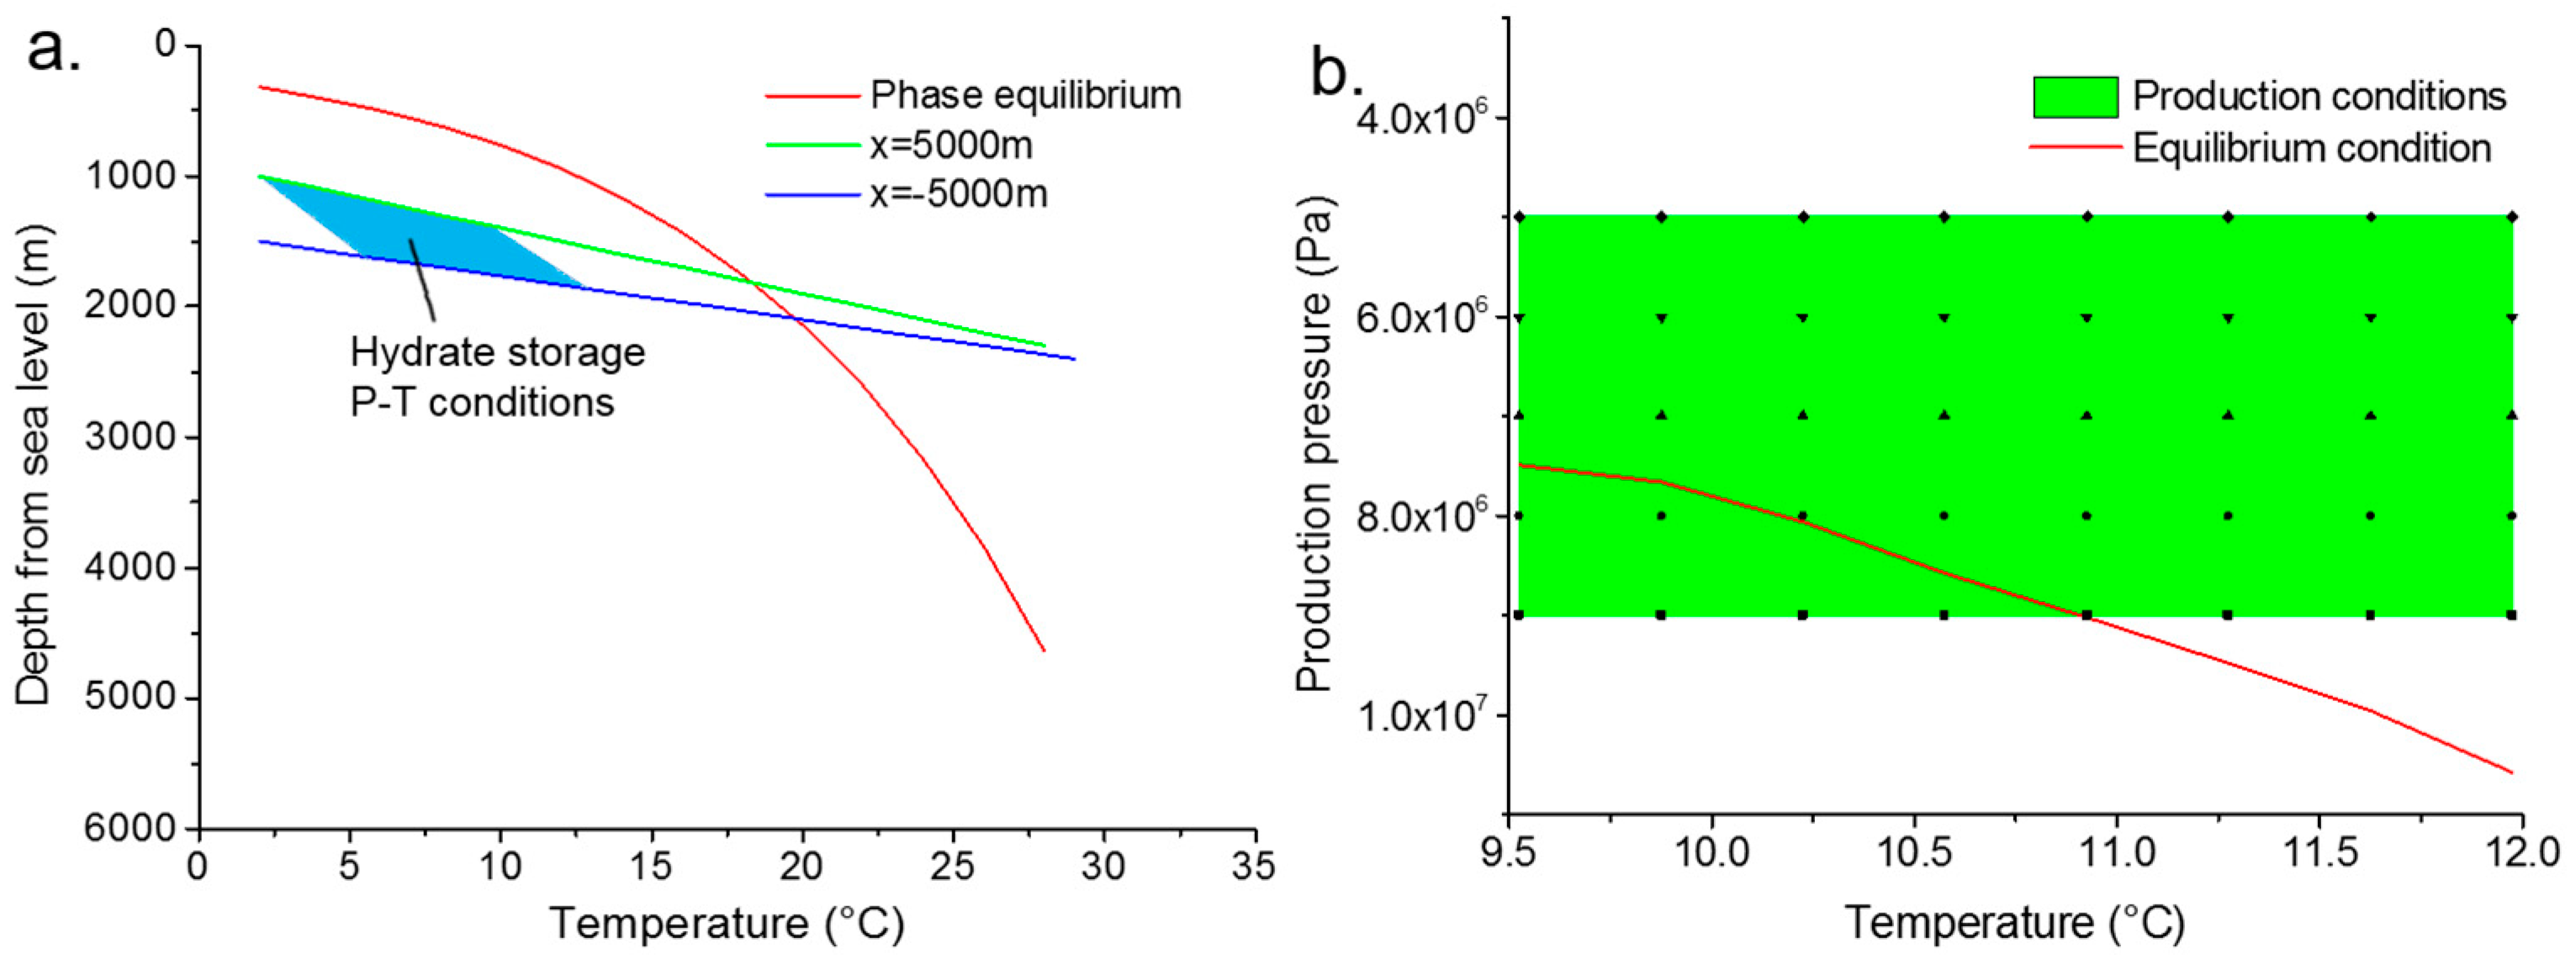
The rate of hydrate dissociation is influenced by fluctuations in production pressure; an increase in pressure affects the dissociation rate. Additionally, there is a positive correlation between the distance from the hydrate temperature and pressure to the phase equilibrium curve and the rate of hydrate dissociation.
(2)
The reduction of pore pressure and the corresponding increase in effective stress due to hydrate decomposition impact the overall stability of the formation. Stress redistribution leads to compaction of the surrounding strata, decreasing porosity and permeability, and trapping pore pressure, which further influences hydrate dissociation rates and patterns.
(3)
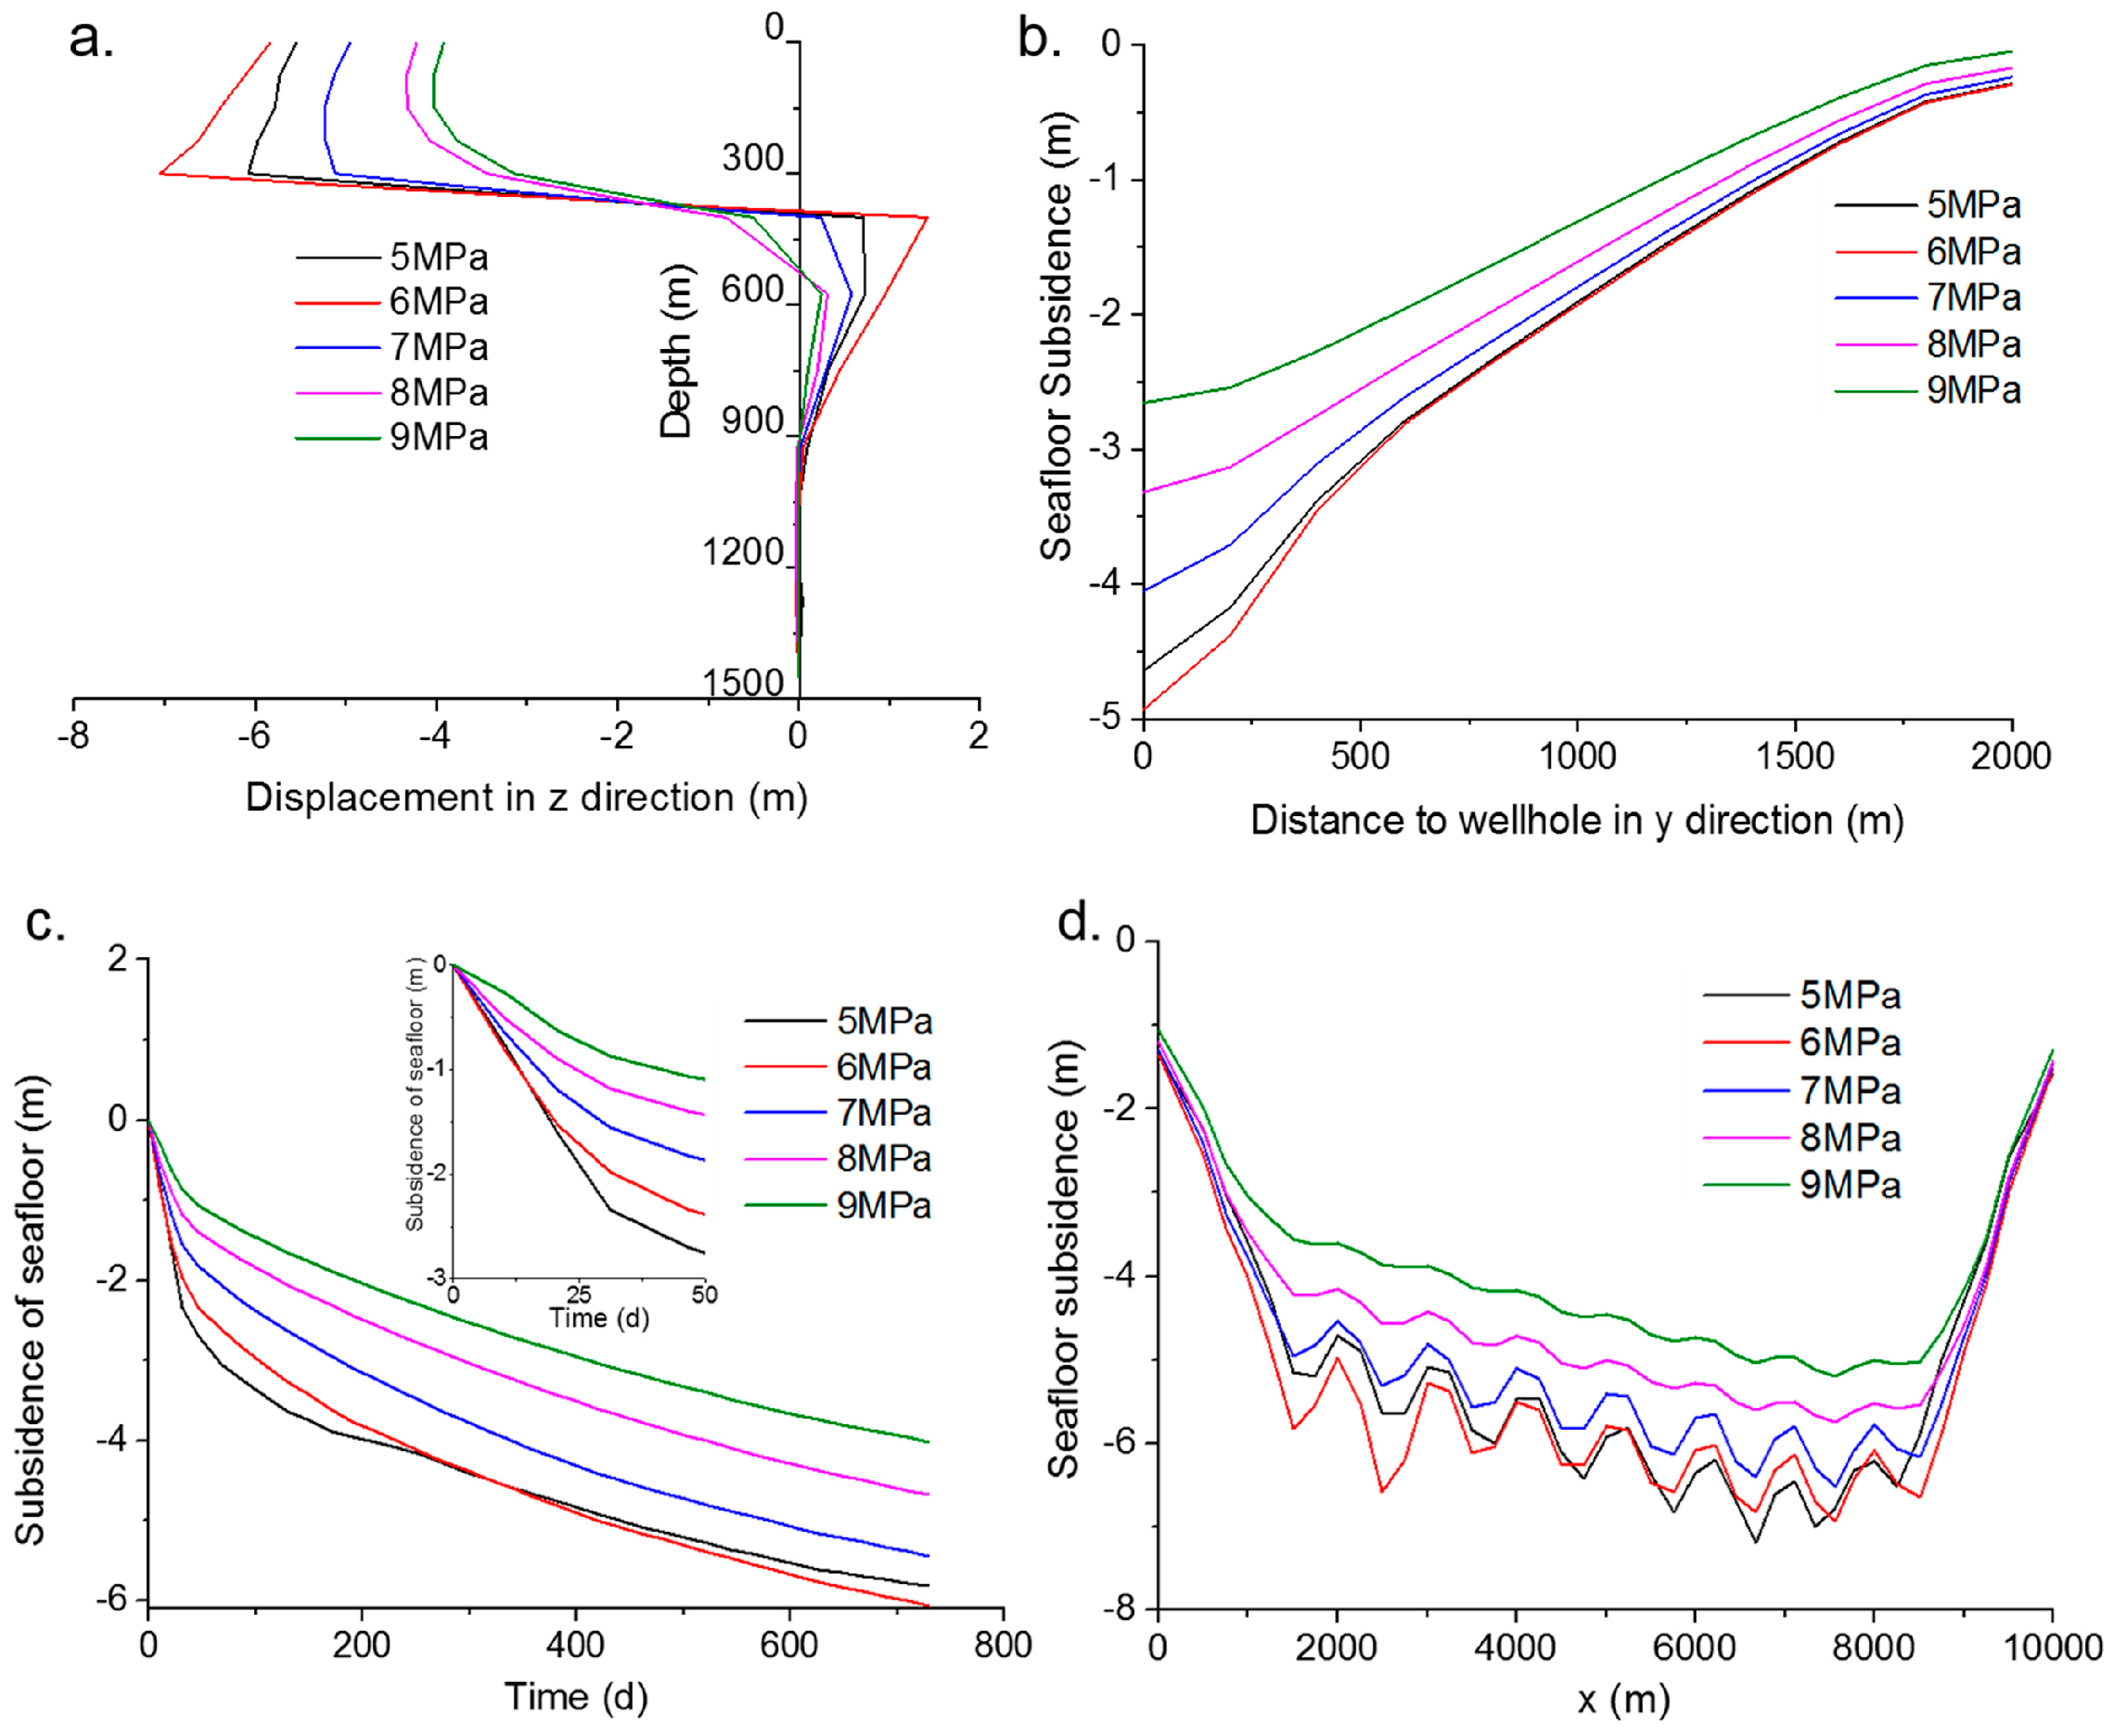
Hydrate dissociation in the Shenhu area is unlikely to cause large-scale submarine landslides. However, it may result in several meters of seafloor subsidence across a broad area. Notably, the subsidence observed during the first 50 days of hydrate production accounts for approximately half of the total settlement observed after two years of production. Therefore, monitoring seafloor subsidence dynamics in the early stages of production is essential.
(4)
While a higher production pressure drop can accelerate the recovery rate, it also increases the risk of severe seafloor subsidence and slippage. Therefore, it is crucial to strike a balance between the rate of hydrate production and the stability of the formation in project design and planning.
While this study initiates the discussion on the geomechanical implications of hydrate production using vertical well grids, both experimental and field tests indicate that horizontal wells are more effective for hydrate extraction but also present more serious geotechnical challenges. In future work, we aim to analyze the impact of horizontal wells on these geomechanical issues.

Author Contributions

B.S. conceptualized the study, conducted the simulations, performed data analysis, and authored the manuscript. Q.Z. provided oversight for the research, offered essential critiques, and contributed to manuscript revisions. All authors have read and agreed to the published version of the manuscript.

Funding

The research received financial support from Professor Qingping Zou through the Natural Environment Research Council of the UK (Grant No. NE/V006088/1).

Institutional Review Board Statement

Not applicable.

Informed Consent Statement

Not applicable.

Data Availability Statement

The data that support the findings of this study are available from the corresponding author upon reasonable request.

Conflicts of Interest

The authors declare no conflicts of interest.

References

  1. Song, B.; Cheng, Y.; Yan, C.; Lyu, Y.; Wei, J.; Ding, J.; Li, Y. Seafloor subsidence response and submarine slope stability evaluation in response to hydrate dissociation. J. Nat. Gas Sci. Eng. 2019, 65, 197–211. [Google Scholar] [CrossRef]
  2. Gajanayake, S.M.; Gamage, R.P.; Li, X.-S.; Huppert, H. Natural gas hydrates—Insights into a paradigm-shifting energy resource. Energy Rev. 2023, 2, 100013. [Google Scholar] [CrossRef]
  3. Yan, C.; Chen, Y.; Tian, W.; Cheng, Y.; Li, Y. Effects of methane-carbon dioxide replacement on the mechanical properties of natural gas hydrate reservoirs. J. Clean. Prod. 2022, 354, 131703. [Google Scholar] [CrossRef]
  4. Wei, N.; Pei, J.; Li, H.; Zhou, S.; Zhao, J.; Kvamme, B.; Coffin, R.B.; Zhang, L.; Zhang, Y.; Xue, J. Classification of natural gas hydrate resources: Review, application and prospect. Gas Sci. Eng. 2024, 124, 205269. [Google Scholar] [CrossRef]
  5. Yan, C.; Dong, L.; Ren, X.; Cheng, Y. Stability of submarine slopes during replacement of methane in natural gas hydrates with carbon dioxide. J. Clean. Prod. 2023, 383, 135440. [Google Scholar] [CrossRef]
  6. Jin, G.; Lei, H.; Xu, T.; Xin, X.; Yuan, Y.; Xia, Y.; Juo, J. Simulated geomechanical responses to marine methane hydrate recovery using horizontal wells in the Shenhu area, South China Sea. Mar. Pet. Geol. 2018, 92, 424–436. [Google Scholar] [CrossRef]
  7. Zhou, S.; Zhao, J.; Li, Q.; Chen, W.; Zhou, J.; Wei, N.; Guo, P.; Sun, W. Optimal design of the engineering parameters for the first global trial production of marine natural gas hydrates through solid fluidization. Nat. Gas Ind. B 2018, 5, 118–131. [Google Scholar] [CrossRef]
  8. Yamamoto, K.; Dallimore, S.R. Aurora-JOGMEC-NRCan Mallik 2006–2008 gas hydrate research project progress. Fire in the Ice. Nat. Gas Oil 2008, 304, 285–4541. [Google Scholar]
  9. Yamamoto, K.; Terao, Y.; Fujii, T.; Ikawa, T.; Seki, M.; Matsuzawa, M.; Kanno, T. Operational overview of the first offshore production test of methane hydrates in the Eastern Nankai Trough. In Proceedings of the Offshore Technology Conference, Houston, TX, USA, 5–8 May 2014; pp. 1–15. [Google Scholar]
  10. Chen, L.; Feng, Y.; Okajima, J.; Komiya, A.; Maruyama, S. Production behavior and numerical analysis for 2017 methane hydrate extraction test of Shenhu, South China Sea. J. Nat. Gas Sci. Eng. 2018, 53, 55–66. [Google Scholar] [CrossRef]
  11. Reagan, M.T.; Moridis, G.J.; Johnson, J.N.; Pan, L.; Freeman, C.M.; Boyle, K.L.; Keen, N.D.; Husebo, J. Field-Scale Simulation of Production from Oceanic Gas Hydrate Deposits. Transp. Porous Media 2015, 108, 151–169. [Google Scholar] [CrossRef]
  12. Rutqvist, J.; Moridis, G.J. Numerical studies on the geomechanical stability of hydrate-bearing sediments. SPE J. 2009, 14, 267–282. [Google Scholar] [CrossRef]
  13. Ahmadi, G.; Ji, C.; Smith, D.H. Numerical solution for natural gas production from methane hydrate dissociation. J. Pet. Sci. Eng. 2004, 41, 269–285. [Google Scholar] [CrossRef]
  14. Liu, X.; Flemings, P.B. Dynamic multiphase flow model of hydrate formation in marine sediments. J. Geophys. Res. 2007, 112. [Google Scholar] [CrossRef]
  15. Moridis, G.J. Numerical studies of gas production from methane hydrates. SPE J. 2003, 8, 359–370. [Google Scholar] [CrossRef]
  16. White, M.D.; Wurstner, S.K.; McGrail, B.P. Numerical studies of methane production from Class 1 gas hydrate accumulations enhanced with carbon dioxide injection. Mar. Pet. Geol. 2011, 28, 546–560. [Google Scholar] [CrossRef]
  17. Hassanpouryouzband, A.; Joonaki, E.; Farahani, M.V.; Takeya, S.; Ruppel, C.; Yang, J.; English, N.J.; Schicks, J.M.; Edlmann, K.; Mehrabian, H.; et al. Gas hydrates in sustainable chemistry. Chem. Soc. Rev. 2020, 49, 5225–5309. [Google Scholar] [CrossRef] [PubMed]
  18. Ruppel, C. Permafrost-associated gas hydrate: Is it really approximately 1% of the global system? J. Chem. Eng. Data 2015, 60, 429–436. [Google Scholar] [CrossRef]
  19. Farahani, M.V.; Hassanpouryouzband, A.; Yang, J.; Tohidi, B. Insights into the climate-driven evolution of gas hydrate-bearing permafrost sediments: Implications for prediction of environmental impacts and security of energy in cold regions. RSC Adv. 2021, 11, 14334–14346. [Google Scholar] [CrossRef]
  20. Yoon, H.C.; Kim, J. The impacts of scaled capillary pressure combined with coupled flow and geomechanics on gas hydrate deposits. Géoméch. Energy Environ. 2024, 37, 100529. [Google Scholar] [CrossRef]
  21. Zhang, Y.; Zhang, P.; Hui, C.; Tian, S.; Zhang, B. Numerical analysis of the geomechanical responses during natural gas hydrate production by multilateral wells. Energy 2023, 269, 126810. [Google Scholar] [CrossRef]
  22. Gupta, S.; Helmig, R.; Wohlmuth, B. Non-isothermal, multi-phase, multi-component flows through deformable methane hydrate reservoirs. Comput. Geosci. 2015, 19, 1063–1088. [Google Scholar] [CrossRef]
  23. Gupta, S.; Deusner, C.; Haeckel, M.; Helmig, R.; Wohlmuth, B. Testing a thermo-chemo-hydro-geomechanical model for gas hydrate-bearing sediments using triaxial compression laboratory experiments. Geochem. Geophys. Geosyst. 2017, 18, 3419–3437. [Google Scholar] [CrossRef]
  24. Hyodo, M.; Li, Y.; Yoneda, J.; Nakata, Y.; Yoshimoto, N.; Nishimura, A. Effects of dissociation on the shear strength and deformation behavior of methane hydrate-bearing sediments. Mar. Pet. Geol. 2014, 51, 52–62. [Google Scholar] [CrossRef]
  25. He, Y.; Song, B.; Li, Q. Coupling Submarine Slope Stability and Wellbore Stability Analysis with Natural Gas Hydrate Drilling and Production in Submarine Slope Strata in the South China Sea. J. Mar. Sci. Eng. 2023, 11, 2069. [Google Scholar] [CrossRef]
  26. Li, Q.; Zhao, D.; Yin, J.; Zhou, X.; Li, Y.; Chi, P.; Han, Y.; Ansari, U.; Cheng, Y. Sediment Instability Caused by Gas Production from Hydrate-bearing Sediment in Northern South China Sea by Horizontal Wellbore: Evolution and Mechanism. Nat. Resour. Res. 2023, 32, 1595–1620. [Google Scholar] [CrossRef]
  27. Miramontes, E.; Sultan, N.; Garziglia, S.; Jouet, G.; Pelleter, E.; Cattaneo, A. Altered volcanic deposits as basal failure surfaces of submarine landslides. Geology 2018, 46, 663–666. [Google Scholar] [CrossRef]
  28. Sun, T.; Wen, Z.; Yang, J. Research on Wellbore Stability in Deepwater Hydrate-Bearing Formations during Drilling. Energies 2024, 17, 823. [Google Scholar] [CrossRef]
  29. Jamil, M.; Rahman, A.H.A.; Siddiqui, N.A.; Ibrahim, N.A.; Ahmed, N. A contemporary review of sedimentological and stratigraphic framework of the late paleogene deep marine sedimentary successions of West Sabah, North-West Borneo. Bull. Geol. Soc. Malays. 2020, 69, 53–65. [Google Scholar] [CrossRef]
  30. Jamil, M.; Siddiqui, N.A.; Ahmed, N.; Usman, M.; Umar, M.; Rahim, H.U.; Imran, Q.S. Facies analysis and sedimentary architecture of hybrid event beds in submarine lobes: Insights from the crocker fan, nw borneo, malaysia. J. Mar. Sci. Eng. 2021, 9, 1133. [Google Scholar] [CrossRef]
  31. Jamil, M.; Siddiqui, N.A.; Umar, M.; Usman, M.; Ahmed, N.; Rahman, A.H.A.; Zaidi, F.K. Aseismic and seismic impact on development of soft-sediment deformation structures in deep-marine sand-shaly Crocker fan in Sabah, NW Borneo. J. King Saud Univ. Sci. 2021, 33, 101522. [Google Scholar] [CrossRef]
  32. Crutchley, G.J.; Mountjoy, J.J.; Pecher, I.A.; Gorman, A.R.; Henrys, S.A. Submarine slope instabilities coincident with shallow gas hydrate systems: Insights from New Zealand examples. In Advances in Natural and Technological Hazards Research; Springer International Publishing: Berlin/Heidelberg, Germany, 2016; Volume 41, pp. 401–409. [Google Scholar] [CrossRef]
  33. Dhakal, S.; Gupta, I. Slope instability of submarine sediments due to hydrate dissociation: A case study of Northern Cascadia Margin. Geoenergy Sci. Eng. 2023, 223, 211558. [Google Scholar] [CrossRef]
  34. Tan, L.; Liu, F.; Huang, Y.; Crosta, G.; Frattini, P.; Cen, X. Production-induced instability of a gentle submarine slope: Potential impact of gas hydrate exploitation with the huff-puff method. Eng. Geol. 2021, 289, 106174. [Google Scholar] [CrossRef]
  35. Dong, B.-C.; Xiao, P.; Sun, Y.-F.; Kan, J.-Y.; Yang, M.-K.; Peng, X.-W.; Sun, C.-Y.; Chen, G.-J. Coupled flow and geomechanical analysis for gas production from marine heterogeneous hydrate-bearing sediments. Energy 2022, 255, 124501. [Google Scholar] [CrossRef]
  36. Canals, M.; Lastras, G.; Urgeles, R.; Casamor, J.; Mienert, J.; Cattaneo, A.; De Batist, M.; Haflidason, H.; Imbo, Y.; Laberg, J.; et al. Slope failure dynamics and impacts from seafloor and shallow sub-seafloor geophysical data: Case studies from the COSTA project. Mar. Geol. 2004, 213, 9–72. [Google Scholar] [CrossRef]
  37. Vanneste, M.; Sultan, N.; Garziglia, S.; Forsberg, C.F.; L’Heureux, J.-S. Seafloor instabilities and sediment deformation processes: The need for integrated, multi-disciplinary investigations. Mar. Geol. 2014, 352, 183–214. [Google Scholar] [CrossRef]
  38. Wan, Z.-F.; Zhang, W.; Ma, C.; Liang, J.-Q.; Li, A.; Meng, D.-J.; Huang, W.; Yang, C.-Z.; Zhang, J.-F.; Sun, Y.-F. Dissociation of gas hydrates by hydrocarbon migration and accumulation-derived slope failures: An example from the South China Sea. Geosci. Front. 2022, 13, 101345. [Google Scholar] [CrossRef]
  39. Pinkert, S.; Grozic, J.L.H.; Priest, J.A. Strain-Softening Model for Hydrate-Bearing Sands. Int. J. Géoméch. 2015, 15, 04015007. [Google Scholar] [CrossRef]
  40. Hu, Z.B.; Yang, Y.X. Study on p-y curves of large-diameter steel pipe piles for offshore wind farm in sand based on in-situ tests. J. Appl. Sci. Eng. 2018, 21, 171–178. [Google Scholar] [CrossRef]
  41. Kamath, V.A. A perspective on gas production from hydrates. In Proceedings of the JNOC’s Methane Hydrate International Symposium, Chiba City, Japan, 20–22 October 1998; pp. 20–22. [Google Scholar]
  42. Sun, X.; Mohanty, K.K. Kinetic simulation of methane hydrate formation and dissociation in porous media. Chem. Eng. Sci. 2006, 61, 3476–3495. [Google Scholar] [CrossRef]
  43. Sánchez, M.; Gai, X.; Santamarina, J.C. A constitutive mechanical model for gas hydrate bearing sediments incorporating inelastic mechanisms. Comput. Geotech. 2017, 84, 28–46. [Google Scholar] [CrossRef]
  44. Lin, J.; Seol, Y.; Choi, J.H. Geomechanical modeling of hydrate-bearing sediments during dissociation under shear. Int. J. Numer. Anal. Methods Géoméch. 2017, 41, 1523–1538. [Google Scholar] [CrossRef]
  45. Ling, K.; Wu, X.; Zhang, H.; He, J. Improved gas resource calculation using modified material balance for overpressure gas reservoirs. J. Nat. Gas Sci. Eng. 2014, 17, 71–81. [Google Scholar] [CrossRef]
  46. Miyazaki, K.; Tenma, N.; Aoki, K.; Yamaguchi, T. A nonlinear elastic model for triaxial compressive properties of artificial methane-hydrate-bearing sediment samples. Energies 2012, 5, 4057–4075. [Google Scholar] [CrossRef]
  47. Uchida, S.; Soga, K.; Yamamoto, K. Critical state soil constitutive model for methane hydrate soil. J. Geophys. Res. 2012, 117. [Google Scholar] [CrossRef]
  48. Chen, X.; Zhang, X.; Lu, X.; Wei, W.; Shi, Y. Numerical study on the deformation of soil stratum and vertical wells with gas hydrate dissociation. Acta Mech. Sin. 2016, 32, 905–914. [Google Scholar] [CrossRef]
Figure 1. Relationship between hydrate saturation and hydrate formation strength parameters: black curve and corresponding axis for elastic modulus, blue curve and axis for cohesion, and red curve for friction angle.
Jmse 12 01410 g001
Figure 2. Model diagram and initial conditions, including well positions and numbers, seabed domain, hydrate zone distribution, and boundary conditions.
Jmse 12 01410 g002
Figure 3. (a) Hydrate phase equilibrium conditions and strata P-T conditions and hydrate existence conditions (b) recovery scenario conditions.
Jmse 12 01410 g003
Figure 4. Accumulated gas production in different wells with regards to different stages.
Jmse 12 01410 g004
Figure 5. Time evolution of hydrate saturation distributions around wells and different times.
Jmse 12 01410 g005
Figure 6. Pore pressure distributions (a) overview; (b) hydrate sediment profile view for the rectangular box indicated in (a); (c) zoom in hydrate sediment profile view of pore pressure drop distribution for 730 days.
Jmse 12 01410 g006
Figure 7. (a) Profile view of hydrate zone; (b) stereoscopic view of Minimum principle stress distributions; (c) minimum principle strain distribution.
Jmse 12 01410 g007
Figure 8. Effective porosity and permeability distributions in different wells after two years of production (a) well 1#, (b) well 2#, (c) well 3#, (d) well 4#.
Jmse 12 01410 g008
Figure 9. Distributions of the strata displacement component in different directions (a) x, (b) y, (c) z, and (d) direction and magnitude.
Jmse 12 01410 g009
Figure 10. Evolution of displacement under different production pressure (a) along z direction at the well NO. 6# after 2 years’ production; (b) along y direction at the well NO. 6# after 2 years’ production; (c) seafloor subsidence with time at the well NO. 6#; (d) total seafloor subsidence on the x–z plane.
Jmse 12 01410 g010
Table 1. Skeleton coefficient of hydrate-bearing sediments.
ParameterValueUnitParameterValueUnit
c 1 293kPa e 2 0.642
c 2 1960kPa e 3 450,000kPa
c 3 1.7 σ 3 1962kPa
δ 1 0.4 σ t 382kPa
δ 2 0.1 δ 3 0.22
e 2.72 δ 4 0.04
e 1 241,200kPa γ 9
Table 2. Thermal and physical properties of numerical model.
ParameterValueParameterValue
Porosity0.4Sand instinct permeability6 mD
NGH density920 kg/m3NGH instinct permeability2 mD
NGH thermal conductivity0.5 W/m KLiquid density1040 kg/m3
NGH specific heat2.1 kJ/kg KLiquid specific heat4.2 kJ/kg K
Sand density2600 kg/m3Liquid thermal conductivity0.5 W/m K
Sand thermal conductivity1.0 W/m KLiquid saturation of Sand1
Sand specific heat1.0 kJ/kg KLiquid saturation of sediment0.2
Disclaimer/Publisher’s Note: The statements, opinions and data contained in all publications are solely those of the individual author(s) and contributor(s) and not of MDPI and/or the editor(s). MDPI and/or the editor(s) disclaim responsibility for any injury to people or property resulting from any ideas, methods, instructions or products referred to in the content.

