Article

Research on the Characteristics of Solid–Liquid Two-Phase Flow in the Lifting Pipeline of Seabed Mining

1
College of Naval Architecture and Ocean Engineering, Dalian Maritime University, Dalian 116026, China
2
Liaoning Provincial Key Laboratory of Rescue and Salvage Engineering, Dalian Maritime University, Dalian 116026, China
3
International Joint Research Centre for Subsea Engineering Technology and Equipment, Dalian Maritime University, Dalian 116026, China
*
Author to whom correspondence should be addressed.
J. Mar. Sci. Eng. 2024, 12(8), 1409; https://doi.org/10.3390/jmse12081409
Submission received: 22 July 2024 / Revised: 14 August 2024 / Accepted: 14 August 2024 / Published: 16 August 2024
(This article belongs to the Special Issue Deep-Sea Mining Technologies: Recent Developments and Challenges)

Abstract

:
Vertical pipes are a significant component of deep-sea mining hydraulic lifting systems, frequently stretching up to thousands of meters. This article employs the coupling approach of computational fluid dynamics for the liquid phase and the Discrete Element Method for the particle phase (CFD-DEM) to simulate solid–liquid two-phase flow in a vertical pipeline, utilizing a scaled vertical lift pipeline model as the study object. By adjusting the conveying parameters and structural factors, the lifting performance of particles and the two-phase flow characteristics under various operating circumstances are examined, and the veracity of the simulation is validated by experimental techniques. The findings reveal that the lifting of particles is impacted by both the conveying parameters and the structural factors. The increase in flow rate can effectively improve the distribution of particles in the pipeline and enhance the followability of particles. The disturbance created by the collision and mixing of particles induced by the change in particle concentration has a tremendous impact on the velocity distribution of the two-phase flow in the pipeline and the pressure distribution of the pipe wall. In addition, there is an ideal lifting flow corresponding to various particle concentrations, which may improve the particle dispersion. The outcome of this research has a certain reference relevance for the selection of the parameters of deep-sea mining lifting systems in the future.

1. Introduction

With the expansion of the social economy, people’s need for mineral resources continues to expand. However, terrestrial mineral resources are becoming rare under long-term large-scale mining. Therefore, people started to focus their attention on the ocean and explore prospects for the development and usage of marine resources [1]. The bottom of the ocean has enormous mineral resources, such as cobalt-rich crusts, polymetallic sulfides, and polymetallic nodules, which have tremendous potential for development [2,3].
After hundreds of sea experiments in numerous nations, three primary undersea mineral transportation systems have been proposed: a pipeline lift, a free shuttle boat, and a continuous chain bucket. Among them, the pipeline lifting conveyance system comprises pneumatic lifting and hydraulic lifting. Pneumatic lifting technology has the benefits of having a simple construction and straightforward installation [4], but owing to its poor operating stability, low lifting efficiency, and restricted lifting height, it is not commonly employed in the area of deep-sea mining [5]. For hydraulic lifting technology, the increasing saltwater flow is employed as the lifting medium to accomplish the lifting of seabed materials. This engineering system has the advantages of steady working performance, a high improvement ability, and high efficiency improvement [6,7], and is generally employed in the area of deep-sea mining engineering [8,9]. Its conveying mechanism is depicted in Figure 1. Researchers have conducted extensive research on the transportation process in various working situations, focusing in particular on aspects such as pipeline particle transport velocity [10,11], pressure loss [12,13], and motion state [14,15] of the lifting system.
During the hoisting process, mineral particles combine with seabed mud and saltwater to generate a highly complicated solid–liquid two-phase flow [16]. Zhou et al. first studied the effects of coarse particles (with a diameter greater than 1 mm) in a vertical pipe on the liquid flow state and solid volume fraction. The findings suggest that the increase in particle concentration and transit speed is followed with a more scattered particle distribution [17]. Chen et al. studied the impact of various particle shapes on convection patterns, local concentration changes, particle forces, transport efficiency, and flow characteristics at varied flow velocities [15]. Zhou et al. investigated the connection between the pipeline orientation and the flow state, and utilized the CFD-EDM approach to analyze the flow characteristics and pressure characteristics of two-phase flow in the pipeline under varied operating circumstances for the first time. Together with the wear model to study the influence on pipeline erosion, two anti-corrosion strategies are outlined. It was shown that the influence of tube shape variations on pressure drop is rather minimal at high conveying speeds; the location with the greatest erosion rate travels from the entry region of the bend to the exit area of the bend as the conveying speed rises [12]. Teng et al. investigated the motion characteristics of three distinct sizes of particles in a vertical pipeline under varying starting lifting settings. They proposed a formula to describe the pressure drop caused by particle phase interaction, which can better forecast the total pressure drop of particle transportation in a vertical pipe. The findings revealed that as the volume percent of the particle phase grew, the solid–liquid two-phase velocities near the middle of the pipeline dropped. Small particles are the source of numerous collisions, resulting in a reduction in liquid-phase velocity and overall pressure drop [18]. Zhang et al. simulated the two-phase mixed flow of coarse particles in a vertical pipeline by optimizing the Euler Lagrange technique. The dimensionless link between the lifting speed of the particle phase and parameters such as the Fr and the density ratio was identified, and optimal lifting parameters were provided for specified operating circumstances. The study results provide an appropriate approach for numerically simulating the hydraulic lift of densely packed coarse particles [19]. Ren et al. examined the mobility and mechanical characteristics of particles during hydraulic lifting utilizing the fictional domain approach based on the CFD-DEM platform. They observed that the rising of particles is the consequence of the conflict between fluid resistance and relative gravity. When the normalized size of Angelica sinensis climbs to 1.3, gravity has a major influence on the rise of particles. In addition, centripetal force is the fundamental source of particle spiral phenomena [7]. Wan et al. explored the flow characteristics of coarse particles in vertical pipelines under strong vibrations and analyzed the effects of rigid pipeline amplitude, vibration frequency, and the initial liquid-phase flow velocity on pipeline vibration under particle liquid phase fluid pipe wall interaction. The findings show that although pipeline vibration may be lessened by increasing the initial liquid-phase flow rate within the pipeline, increasing the frequency and amplitude of the vibration would result in an increase in pressure drop. This discovery establishes a connection between particle distribution and the dynamic characteristics of particles and changes in flow field structure, and improves the distribution of particles in the pipe [20].
The motion trajectory and sedimentation pattern of particles in pipelines may be monitored via physical studies to guide the design and operation of deep-sea mining systems and assess the effect of various transport parameters on ore transportation. Through fluidization tests, Wijk et al. confirmed that the stability analysis hypothesis is applicable when the ratio of particle diameter to pipe diameter is less than or equal to 0.26. The findings suggest that wall friction contributes a tiny percentage to the steady flow of two-phase flow in vertical pipes [21]. Zhao et al. performed research on the hydraulic lifting of spherical particles using a mix of dimensional analysis and experimental approaches. The findings revealed that the vertical suction coefficient fell exponentially with the ratio of the bottom gap to the particle diameter, rose linearly with the ratio of the pipe diameter to the particle diameter, and was practically independent of the Reynolds number. On this basis, an empirical formula for the vertical force of particles and a criteria formula for the vertical start of particles were proposed with a maximum error of less than 15%. This is highly helpful for understanding the hydrodynamic properties of hydraulic mining in the deep sea [22]. Zhao et al. established a computer model for the velocity distribution of big particles in vertical pipelines, and evaluated and assessed the model using vertical particle lifting experiments. The findings demonstrate that the impact of eddy current resistance on velocity distribution cannot be disregarded, and not including the extra coefficient K leads to an increase in the discrepancy between the estimated particle velocity and the observed value [23]. Dai et al. developed an indoor vertical pipeline lifting platform and investigated the flow field within the pipeline throughout the lifting process of particles with varied lifting speeds and sizes using high-speed video equipment. It was shown that a greater lifting flow rate could promote smooth flow; whereas a larger particle concentration increases the probability of pipeline blockage. From the standpoint of stability and economics, it is advised that the lifting speed is 3 m/s and the particle concentration is about 9% [24]. Sun et al. presented a probability model for forecasting the slip velocity of big particles in vertical pipes, which can describe the coupling effect between solid–liquid phases well and anticipate random occurrences such as particle pulsation, particle collision, and eddy current collision. Although the model is not suitable for particles with a diameter of less than 1 mm, it may give a rapid analytical solution for the computation of big particles while considerably reducing computing expenses [25]. Amudha et al. performed three separate experiments by modeling hydraulic lifting in deep-sea mining scenarios: single particle testing, cluster particle testing, and regional impact testing. These test findings are important for calculating the appropriate suction height needed to lift particles under varied operational circumstances [26]. Liu et al. assessed the local concentration and velocity of particles in a vertical pipeline using non-contact optical techniques. The finding reveals that the local liquid-phase flow velocity contributes considerably to particle velocity and slip velocity while having very little influence on local concentration [27].
Based on the existing research, although many scholars have studied the complex solid–liquid two-phase flow in pipelines, there are few studies on the efficiency and safety of particle transportation in lifting pipelines. Therefore, based on the actual hydraulic transmission pipeline and the physical characteristics of polymetallic nodules, this paper studies the efficiency and safety of particle lifting in vertical pipelines based on the combination of CFD-DEM coupling simulation and experiments. The research results of this paper will provide a reference for the selection of vertical pipeline transportation parameters for deep-sea mining.

2. Numerical Modeling Setup

2.1. Governing Equation

2.1.1. Fluid Control Equations

In the Euler Lagrange technique, seawater is viewed as a continuous medium. For the purpose of computational simplicity, additional simplification is carried out by viewing seawater as an incompressible, uniformly viscous Newtonian fluid, and assuming that there is no transfer of mass and energy between the fluid phase and the particle phase. For the given circumstance, the mass and momentum conservation equations in the Navier–Stokes (N-S) equation are employed to explain the motion of the fluid within the pipeline [28]:
u = 0
u t + u u = 1 ρ f p + ν 2 u + f g + f s f
Among these, u is the fluid velocity; p is pressure; ρ f is the fluid density; ν is the kinematic viscosity; f g is the gravity imparted on the fluid; f s f is the force exerted by particles on the fluid.

2.1.2. Particle Control Equations

For the solution of the particle phase, each particle is regarded as an independent discrete media for solution. Its governing equation adheres to Newton’s second law and is principally impacted by the force exerted by the fluid on the particles, the collision force between particles, and its own force. This work utilizes the soft sphere model to precisely represent the intricate interactions among particles in numerical simulations [24,29]. In order to assure the reproducibility of the experiment, a polished and rigid sphere is used, disregarding factors such as surface irregularities, particle fragmentation and deterioration, and the coefficient of particle form.
According to the momentum conservation equation [30]:
m s d V s d t = m s g + F f s + F s s
Among them, m s is the mass of the particles; V s represents the instantaneous velocity of particles; t is time; F f s represents the force exerted by the fluid on the particles; F s s represents the force exerted by other solids on it.
Euler’s rotation equation [31]:
I s d ω s d t = M s s + M f s
I s represents the moment of the inertia of the particle; ω s is the angular velocity of particles; M f s is the torque exerted by the fluid on the particles; M s s represents the torque exerted on the particle by other particles.

2.2. CFD-DEM Coupling

The flow scenario of a solid–liquid two-phase flow is exceedingly complicated, and the fluid and particles need to be numerically estimated individually, yet there are substantial interactions between them. The standard single fluid dynamics technique oversimplifies the particle phase and cannot correctly handle the computing needs of complicated solid–liquid two-phase flows. In the CFD-DEM method, computational fluid dynamics (CFD) is used to calculate the fluid phase as a continuous medium, and the particle information is transferred from the discrete element method (DEM) to the CFD through the coupling interface to transfer energy and momentum. When the particle volume fraction is large and the concentration is high, the CFD-DEM method can be used for coupling to give full play to the advantages of CFD and DEM [32]. Many academics have utilized the CFD-DEM approach to undertake substantial studies on hydraulic lift in vertical pipes [17,24,33]. Therefore, this work used computational fluid dynamics (CFD) and the discrete element method (DEM) for coupled simulations and numerically estimated the solid–liquid two-phase flow system in the hydraulic lifting pipeline of deep-sea mining.
The CFD-DEM coupling mechanism [24,34]: At each time step of CFD-DEM coupling calculation, the flow field and particle information are first obtained based on the previous time step, and the particle force model, contact force model, and differential equation of particle motion are used to determine the force and motion parameters of the particles. Next, based on the force analysis of particles, compute the response force of particles on the fluid and add it to the continuous phase control equation. By solving the continuous phase control equation, flow field information is acquired and then utilized for the following iteration step. Repeat this procedure and repeat it numerous times to reach the convergence of the flow field and particle motion findings, thereby completing the computation of a time step. Continuously doing those many time-step analyses may yield the dynamic features of solid–liquid two-phase flow. The coupling mechanism of CFD-DEM is presented in Figure 2. This coupling mechanism permits bidirectional real-time data interchange, including the reciprocal effect of continuous media and discrete particles. Two software programs alternate between solving equations until a convergent coupling result is found.

2.3. Basic Theory of Solid–Liquid Two-Phase Flow

2.3.1. The Forces Acting on Particles in Fluids

The forces acting on particles in pipes due to fluid primarily consist of resistance resulting from relative motion, extra mass force, Basset force, the lift force of fluid on particles (Magnus force and Saffman force), and pressure gradient force [31,35]. To be specific:
F f s = F d + F a m + F B + F L + F p
F L = F L M + F L S
In the formula, F d is fluid resistance; F a m is the added quality force; F B is Barcelona Power; F L is lift; F L M is the Magrus force of fluid lift on particles; F L S is Saffman force; F P represents the pressure gradient force.
The primary determinant of particle motion is the resistance of viscous particles to fluid [36], and the calculation process relationship is as follows [37]:
F d = 1 2 C d ρ f ( u f V s ) 2 A s
In the formula, C d is the particle resistance coefficient, which is a crucial element in the computation. According to a large number of scholars’ experimental studies, the size of its value is related to the particle Reynolds number [38,39,40,41,42,43]; u f is the local average velocity of the fluid; ( u f V s ) is called the particle slip velocity and can be represented by V s l i p ; A s is the projected area of the particle in the direction of resistance.
Based on the premise of a regular sphere of seabed minerals, A s = 1 4 π d 2 , where d is the diameter of the sphere. Therefore, the resistance formula may be changed into:
F d = π 8 C d ρ f V s l i p 2 d 2

2.3.2. Particle-to-Particle Contact Force

When investigating the dynamic properties of solid–liquid two-phase flow in this article, collisions between particles and between particles and barriers are studied. The Hertz–Mindlin non-sliding contact theory was utilized to model particle collisions [44]. Figure 3 shows a schematic illustration of the Hertz–Mindlin model.
The collision of particles creates normal force F n and tangential force F t , and the force acting on particles may be written as:
F c = F n + F t
The normal force exerted on particles is mimicked using a spring damper, and its formulation is [24]:
F n = F n , s + F n , d
F n , s = 4 3 δ n E e q R e q δ n
F n , d = 2 5 6 I n e I n 2 e + π 2 2 E e q ν n r e l m e q ( R e q δ n ) 1 2
In the formula, F n , s represents the normal elastic force; F n , d is the normal damping force; E e q is the equivalent Young’s modulus; δ n is the normal overlap of particles; R e q is the equivalent radius; e is the recovery coefficient; ν n r e l is the normal phase component of the relative velocity between particles; m e q is the equivalent mass of particles.

2.3.3. Contact Force between Particles and Pipe Walls

The calculation expression for tangential contact force is [24]:
F t = F t , s + F t , d
F t , s = 8 δ t G e q R e q δ n
F t , d = 2 5 6 I n e I n 2 e + π 2 8 G e q ν t r e l m e q ( R e q δ n ) 1 2
Among them, F t , s is the tangential elastic force; F t , d is the tangential damping force; G e q is the equivalent Young’s modulus; ν t r e l is the tangential vector of the relative velocity between particles; δ t is the amount of tangential overlap of particles.
The calculation expression for parameters R e q , m e q , E e q , and G e q in the above expression is as follows [24]:
R e q = 1 1 R a + 1 R b
m e q = 1 1 m a + 1 m b
E e q = 1 1 μ a 2 E a + 1 μ b 2 E b
G e q = 1 2 ( 2 μ a ) ( 1 + μ a ) E a + 2 ( 2 μ b ) ( 1 + μ b ) E b
In the above formula, m a and m b represent the masses of balls a and b when two balls collide; R a and R b are the radii of balls a and b; E a and E b are the elastic moduli of two balls; μ a and μ b are the Poisson’s ratios of two balls.
When particles collide with walls, the above formula is also used for calculation. At this point, the radius of wall b is R b = , and the mass of wall b is m b = , resulting in: R e q = R a , m e q = m a .

2.4. Computational Details

2.4.1. Numerical Scheme

In deep-sea mining engineering, the underwater vertical transportation pipeline is several kilometers long, and the complete numerical modeling of the hoisting system demands a huge amount of processing resources. In addition, when particles mix with fluids during transit, a relatively stable solid–liquid two-phase flow will occur inside the pipeline after a specific amount of time. Therefore, numerical simulation analysis is only required for the early mixing stage until the creation of a stable solid–liquid two-phase flow condition. In order to increase the accuracy of the flow characteristics of particles in the pipe, the internal flow field is encrypted such that the grid of the internal flow field is denser closer to the pipe wall and sparser further away. The same encryption method was used for the lifting of the pipeline by the outside pipe wall of the internal flow field. At the outlet of the pipeline and the upper section of the pipeline, a 0.1 m long space is designated, respectively. The local concentration of particles at this place is assessed by estimating the volume and number of particles in this region. The computation domain and local grid division are presented in Figure 4.
The expression for the local concentration C r o of particles is:
C r o = 1 6 π d 3 n 1 4 π D 2 L
In the formula, d is the particle size; n is the number of particles; D is the width of the pipeline; L is the height of the storage area where L is 0.1 m.
When conducting numerical simulations, seawater with a density of 1025 kg/m3 was employed as the fluid medium, and the gravitational acceleration of the total flow field was adjusted to 9.81 m/s2. The default pressure of the working environment was set to 1 standard atmosphere. The selection of these design characteristics is based on extensive prior research to guarantee that the study design accurately reflects the real-world circumstances and efficiently simulates fluid–particle interaction [17,20,24,45,46]. The structural parameters in this article include pipeline diameter D = 30–50 mm, pipeline length H = 2.5 m, pipeline wall thickness of 5 mm, and conveying parameters (increasing flow rate Q = 10–100 L/min, particle concentration Cr = 2%, 5%, and 10%), particle parameters (particle size d = 2 mm, 3 mm, 4 mm, and 6 mm).

2.4.2. Simulation Grid and Conditions

In the study of polymetallic nodule particles, particles under actual marine conditions were chosen. These particles normally have irregular spherical forms on the seabed, but during mining, they are exposed to fluid movement, resulting in smoother edges and corners. The interaction between spherical particles and liquid-phase flow is a basic issue in viscous fluid mechanics [47]. To increase the effectiveness of numerical simulation, these polymetallic nodules are simplified as smooth and hard spheres during simulation. In the DEM, the particle densities are set to 1500 kg/m³, 2300 kg/m3, and 2700 kg/m3, with a Poisson’s ratio of 0.13 and an elastic modulus of 1.15 × 10¹⁰ Pa. In addition, the material settings for the pipeline are as follows: a density of 7800 kg/m3, a Poisson’s ratio of 0.3, and a shear modulus of 41 GPa. The interaction parameters between particles and walls, as well as between particles, are specified as given in Table 1.
According to real measurement data from the Pacific, the particle size of polymetallic nodules is generally distributed throughout the range of 1–10 cm, with the biggest fraction of nodules having a particle size of 2–4 cm, with an average particle size of 3.2 cm [48]. After the conclusion of undersea ore collection, the collected metal nodules must be delivered to the central station for additional crushing treatment, so that big nodules may be crushed to smaller particle sizes. If the size of the mineral particles in the pipe is too large, it may have an adverse effect on the hydraulic lifting system, such as increasing energy consumption. In serious cases, it may even cause pipe blockage, threatening the safe operation of the deep-sea mining system [49]. In addition, during the crushing process, it is necessary to avoid the nodules from being crushed too finely, because particles that are too tiny may enter the lifting pipeline and be discharged as slurry, which will significantly reduce the collection efficiency of the system and pollute the marine ecology [50]. According to the relevant literature [18,49], four distinct particle sizes were set up in this investigation, including conventional spherical particles of 2 mm, 3 mm, 4 mm, and 6 mm. The duration and velocity of particle setup are compatible with the starting velocity of the flow field within the pipeline.

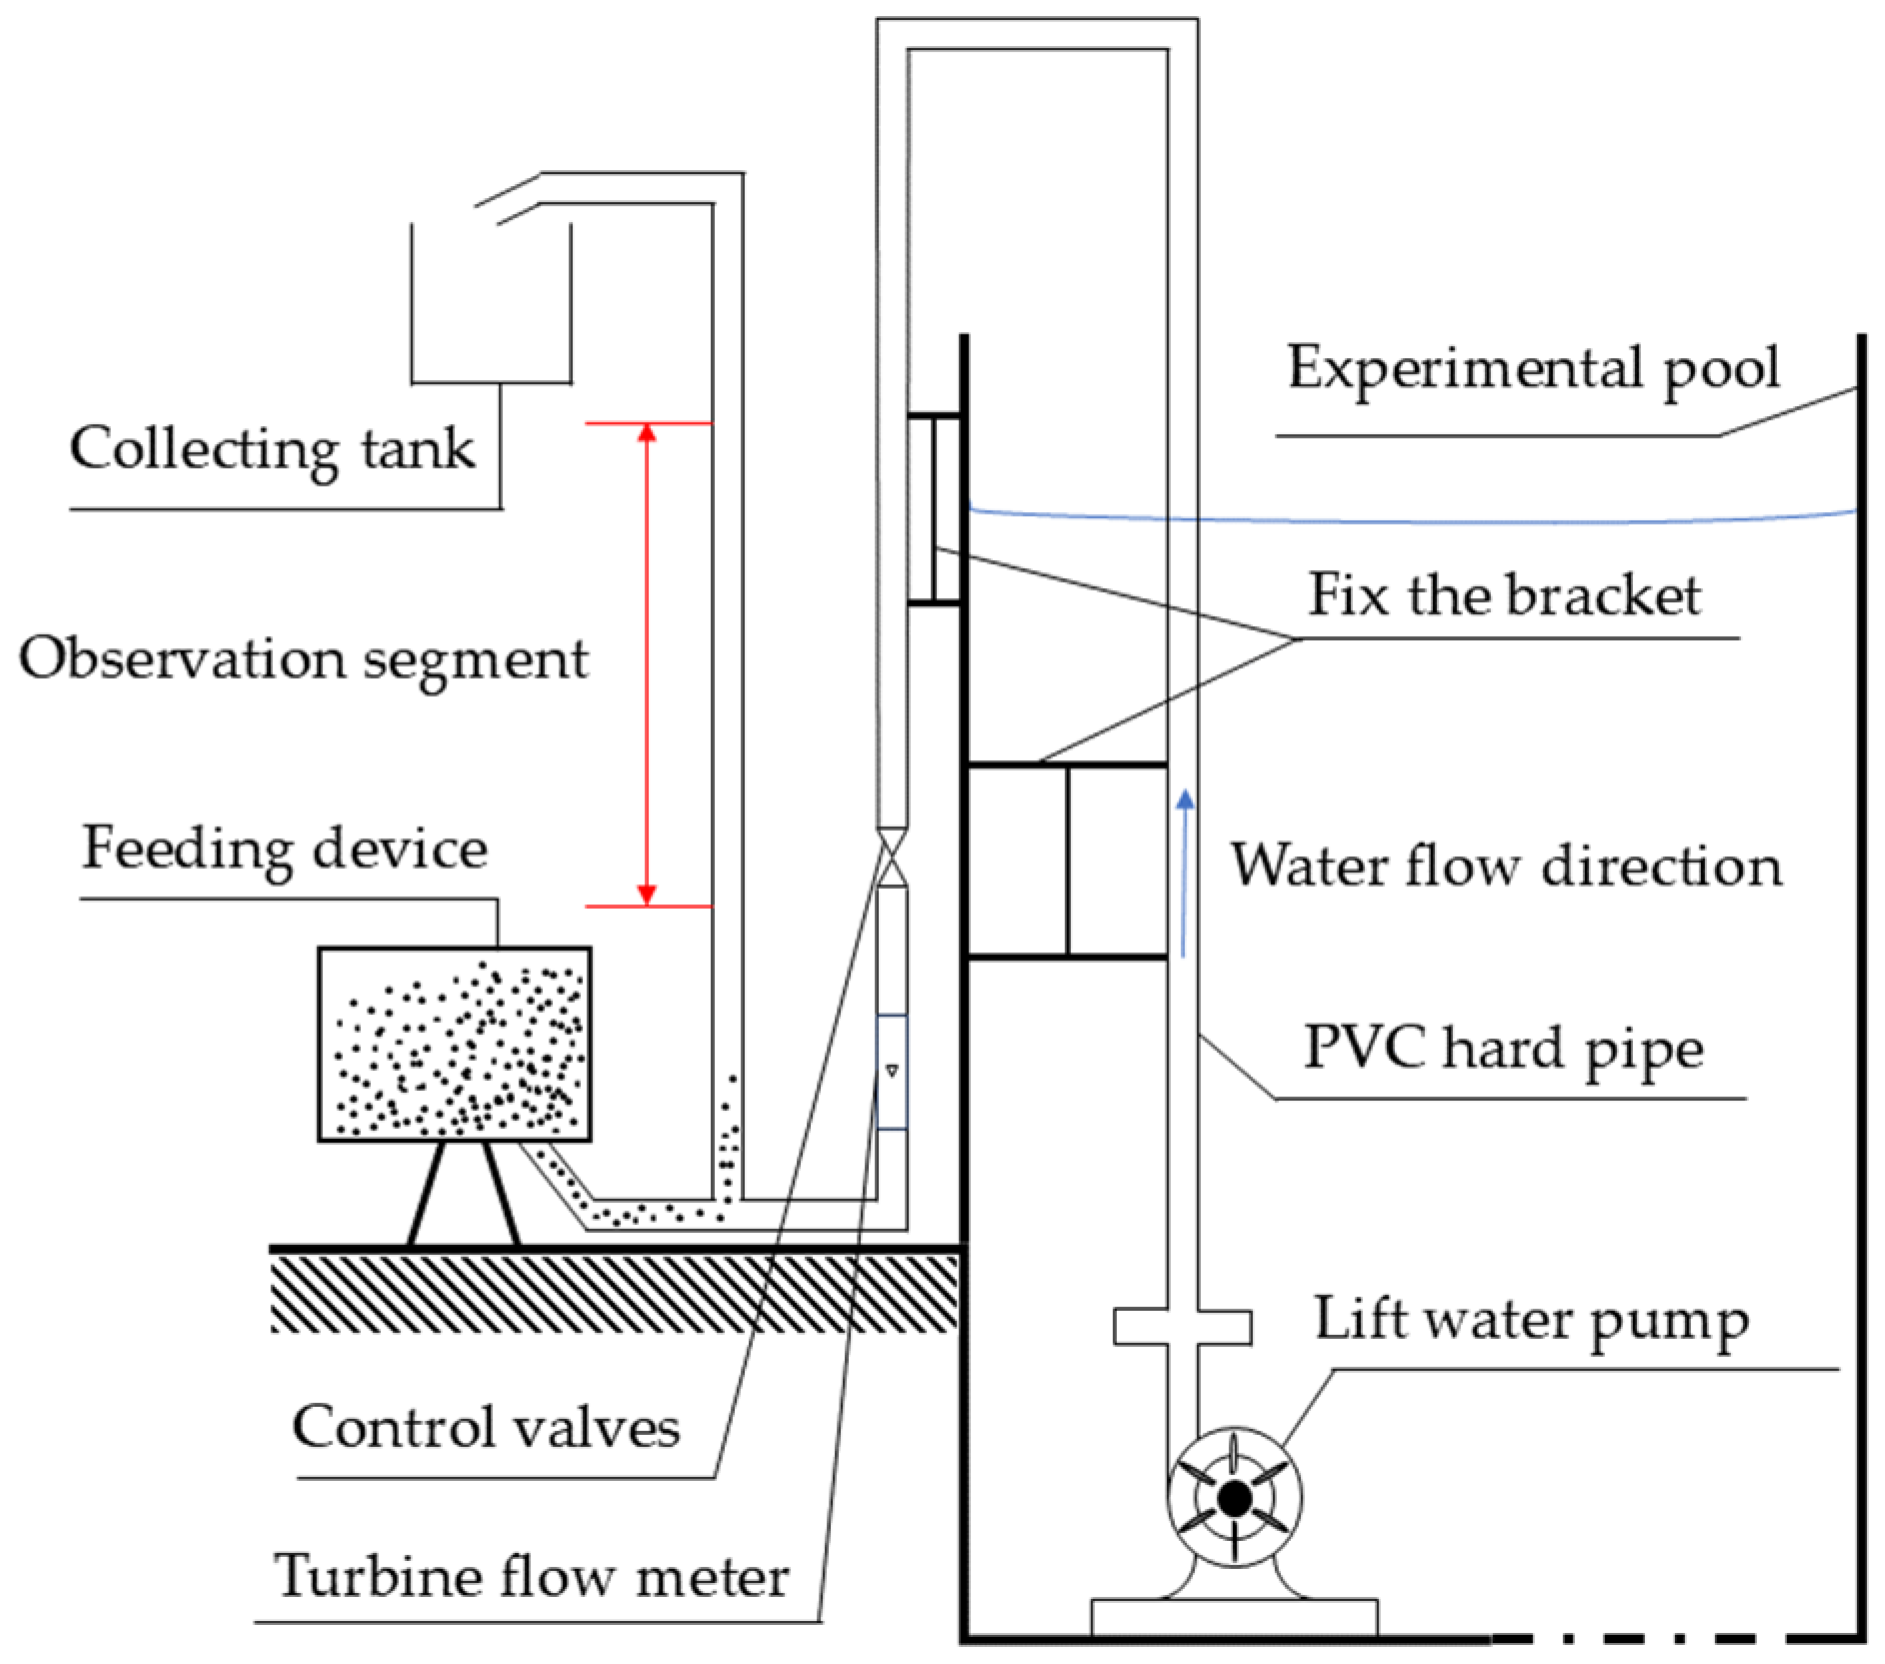
3. Deep-Sea Mining Lifting Pipeline Experimental Platform

In the actual process of particle lifting, the outflow of the lifting pipeline is a solid–liquid combination. This article develops and implements a pipeline lifting scaling experimental platform based on real applications to examine the particle lifting law under the coupling impact of the solid–liquid two-phase flow in the pipeline. The experimental equipment configuration is presented in Figure 5.
The complete experimental platform is mainly composed of a hydraulic lifting system, PVC hard pipes, fixed brackets, feeding device and collection tank. The hydraulic lifting system essentially consists of hydraulic lifting pumps, turbine flow meters, pressure regulating valves, and other components, with the key characteristics indicated in Table 2.
Before the experiment, a check should be made to confirm that the water pump is operating correctly and that there is no leakage at the connection between the PVC hard pipe and the water pump. By manipulating valves and flow meters to manage the water flow rate, the particle concentration is regulated by the feeding mechanism. The feeding device offers particles at a specific concentration, calculates the mass of particles at a certain particle concentration via the percentage of volume concentration, and then gives these mass particles to the feeding device to supply particles. Solid particles are hoisted from the bottom of the pipeline to the collection water tank under the action of liquid-phase disruption, fulfilling the aim of collecting and lifting particles. The particles used for the experiment are vermiculite particles with a density of ρ = 2300   kg / m 3 , and a particle size of roughly 3 mm, as illustrated in Figure 6.
Considering the instability of solid–liquid two-phase flow in pipelines, in order to decrease measurement errors, three sets of repeated sampling were undertaken under the same settings, and the average of the results of the three sets of samples was taken. At the same time, in order to acquire reliable sample data, a delay of 120 s is imposed between the adjustment process and the sampling process, as well as between sampling procedures of the same parameter but with distinct groups before continuing with the following operations.

4. Results and Discussion

4.1. Particle Lifting Performance Analysis

In the actual deep-sea mining project, the quality of solid particle lifting performance directly determines whether the project progresses smoothly. The research on particle lifting performance is mainly reflected in two aspects, namely, the safety and the efficiency of particle lifting. In this section, the impact of conveying parameters (fluid flow rate, particle concentration) and a structural parameter (pipe diameter) on the efficiency of particle lifting was extensively examined. The safety of particle lifting is largely reflected in the influence of the particle concentration on the lifting mechanism. By analyzing the lifting performance of solid particles and establishing the optimal range of conveying parameters, a reference base is offered for real engineering applications.

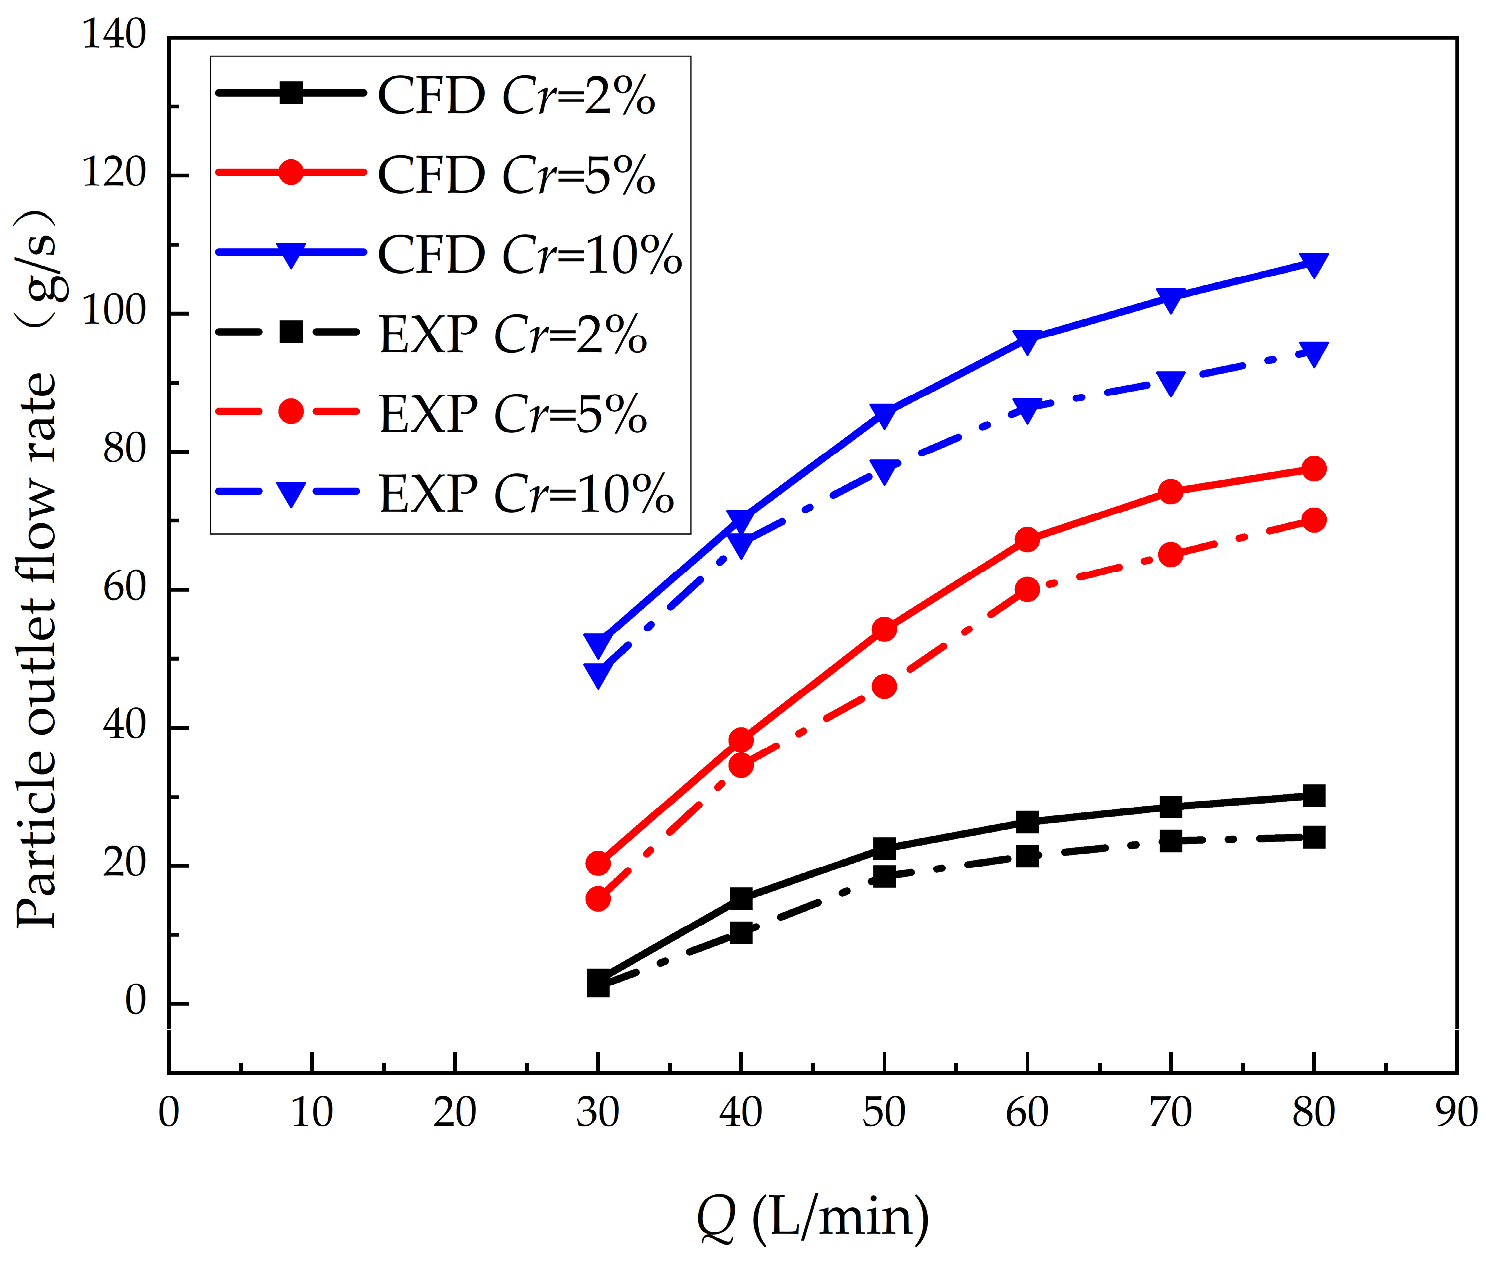
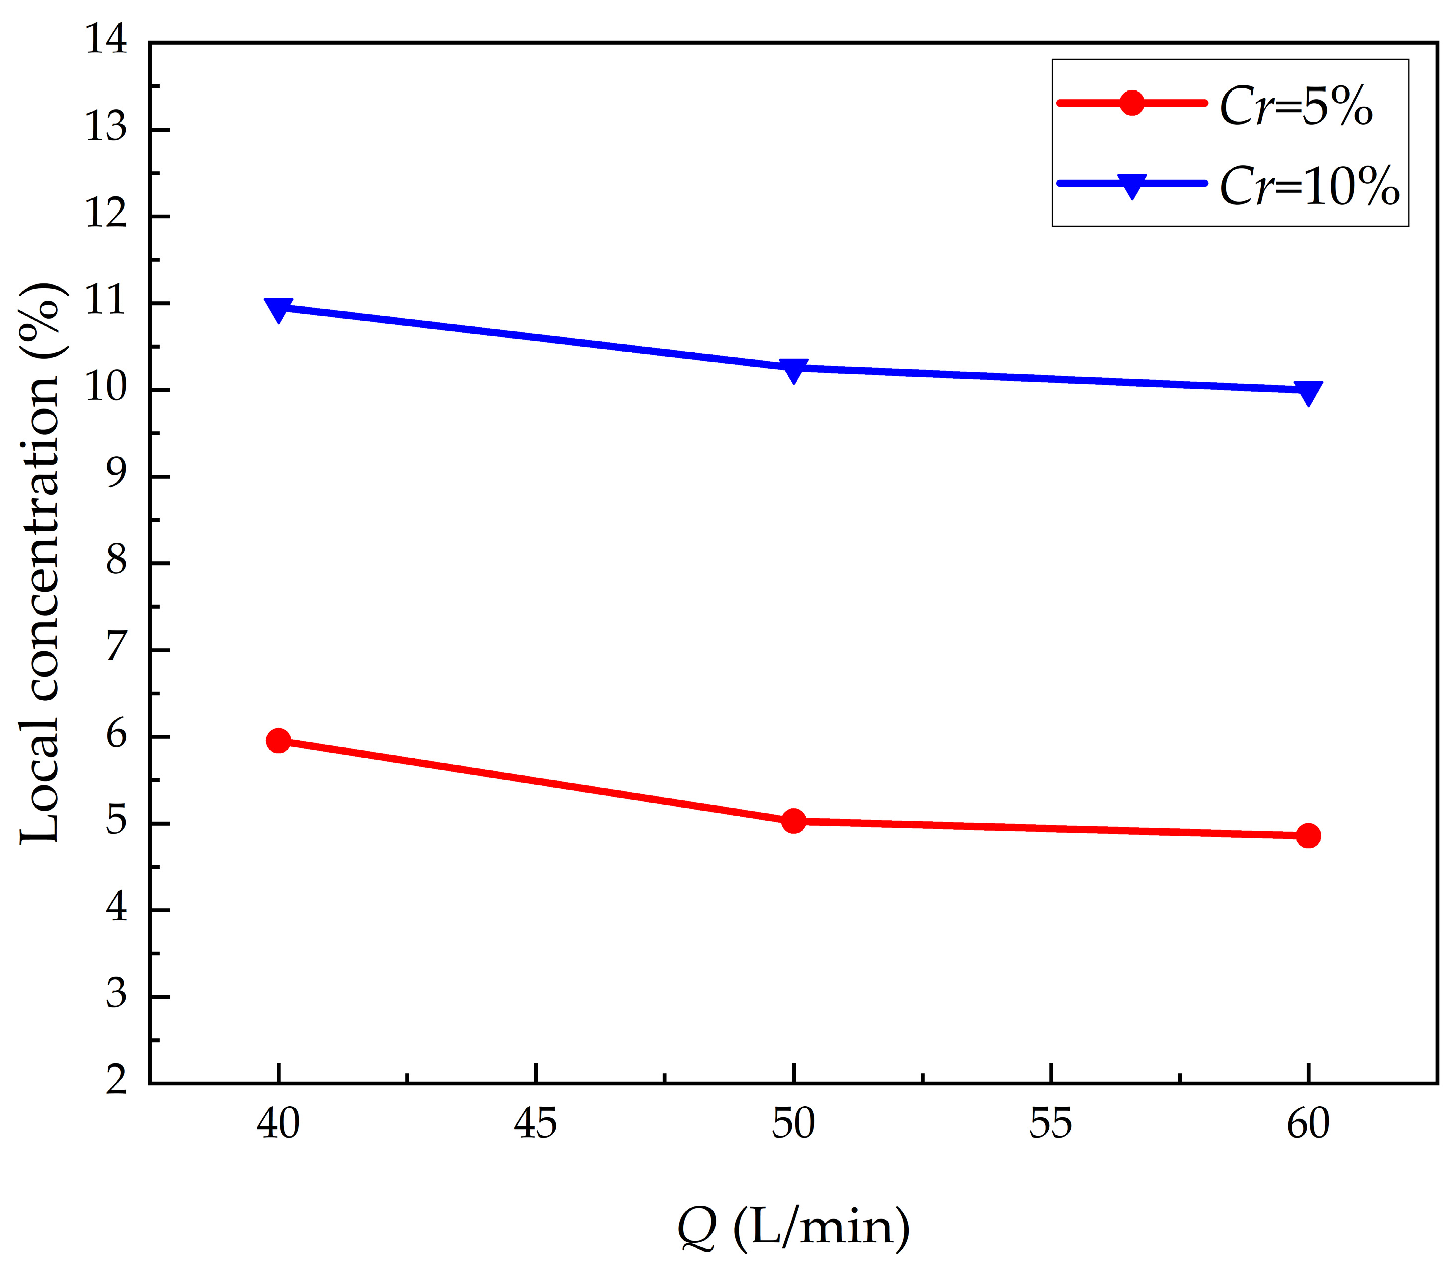
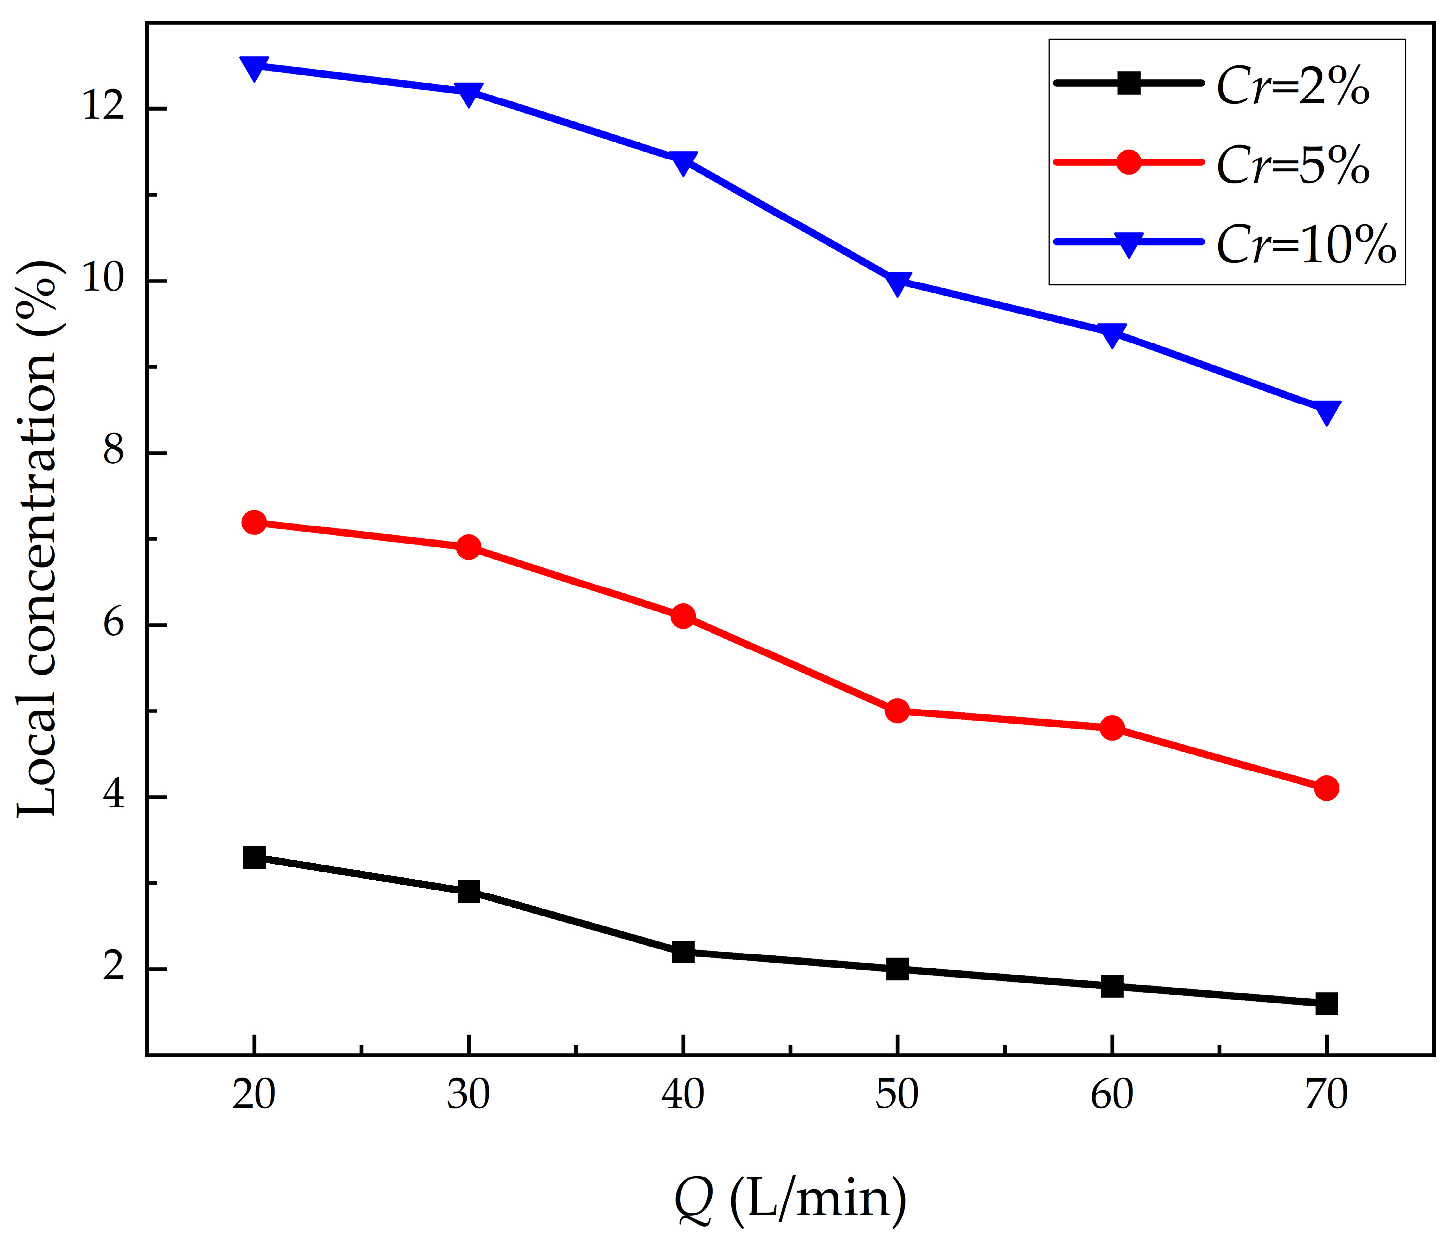
4.1.1. Effect of Conveying Parameters on Lifting Performance

Under the condition of particle density ρ = 2300   kg / m 3 , the particle outlet flow rate under varied lift flow rates is depicted in Figure 7. At lower water flow rates, the fluid lift impact on particles is reduced, resulting in a sluggish lift speed and restricted lift height. This shows that the fluid has an inadequate carrying capacity for particles, making it difficult to accomplish efficient particle lift.
With the steady rise in water flow rate, the lifting speed and height of particles are considerably enhanced, particularly in the medium water flow range, which can more stably and effectively lift particles to the set height, demonstrating the best lifting performance. However, as the water flow rate grows over a certain amount, the improvement in particle enhancement efficiency progressively diminishes, followed by certain unfavorable consequences. Under circumstances of a considerably increased flow rate, collisions between particles and between particles and the riser wall become more frequent and strong, causing instability in the lifting route and eventually reducing lifting efficiency. In addition, the use of increased fluid flow rates may also lead to a considerable rise in energy consumption, consequently impacting the total efficiency gain.
Under low particle concentration circumstances, particles are exposed to relatively homogeneous hydrodynamic forces, allowing them to be gradually and evenly lifted. The contact between particles is limited, and the lifting route of particles is largely steady, which is advantageous to boosting lifting efficiency. With the increase in particle concentration, it was observed in the experiment that the interaction and collision between particles increased, which to some extent improved the power transmission efficiency during the lifting process, thus enabling the speed and height to be increased in the initial stage. Specifically, when the particle concentration is 5%, the feedback of the particle outlet flow rate on the rising flow rate is the largest. However, excessively high particle concentrations also lead to a series of problems, such as pipe blockage and unstable water flow paths, resulting in reduced lifting efficiency. Especially in high-concentration circumstances, the excessive aggregation and collision of particles may lead to the sedimentation of certain particles, consequently decreasing the overall efficiency of improvement.

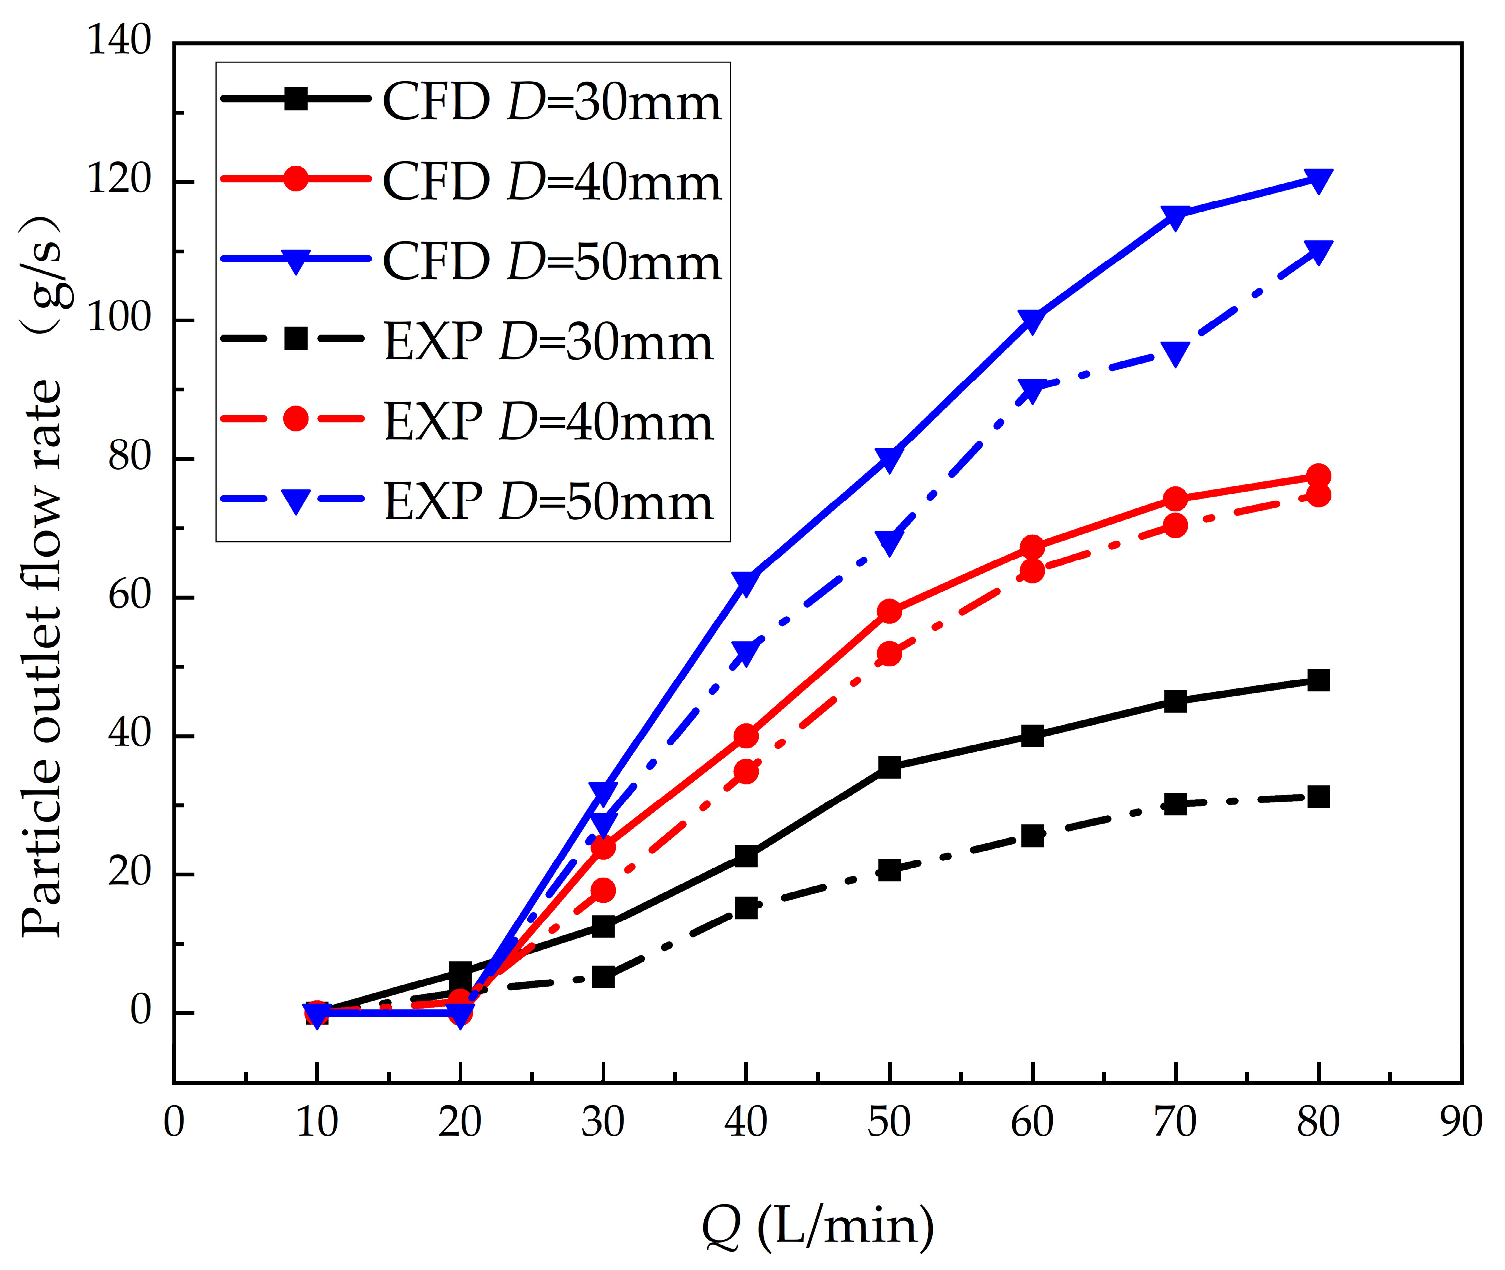
4.1.2. Effect of Structural Parameter on Lifting Performance

In addition to the considerable influence of raising flow rate and particle concentration on particle improvement efficiency, pipe diameter size is also an essential component for boosting performance. Different pipe sizes enhance the corresponding particle outlet flow rate, as indicated in Figure 8.
The flow rate necessary for lifting pipes of various diameters to enter the lifting condition is varied. For vertical pipes with diameters of 30 mm and 40 mm, the initially required lifting flow rate is around 10–20 L/min, while for pipes with diameters of 50 mm, the initial lifting flow rate needed is about 20–30 L/min. When the flow rate is lower than the initial lifting rate, the fluid lifting speed is lower than the settling speed of the particles; hence, the particles cannot be lifted out of the pipeline. Under the condition of a smaller pipe diameter, the relative velocity between particles and fluid rises, and the hydrodynamic influence on particles is higher, which is advantageous for raising the outlet flow rate. However, this also leads to an increase in the collision frequency between particles and the pipe wall during the lifting process, which causes substantial pressure and shear stress on the pipe wall, consequently compromising the lifting performance and durability of the equipment. In addition, owing to space limits, the contact between particles is intensified, which may easily lead to obstruction and impact the overall efficiency of improvement.
When the flow rate is raised beyond the starting value, the particle outlet flow rate rises with the increase in the flow rate. And when the flow rate is raised, the increase in pipe diameter leads to a quicker growth rate of the particle outlet flow rate. A bigger pipe diameter widens the flow area for particles within the pipe, minimizing collisions between particles and between particles and the pipe wall, which is useful for boosting stability and efficiency. Simultaneously, increasing the diameter of the pipe also decreases the likelihood of particle blockage. Nevertheless, an excessively high pipe diameter significantly diminishes the lifting effectiveness and escalates the construction cost.

4.2. Analysis of Particle Distribution

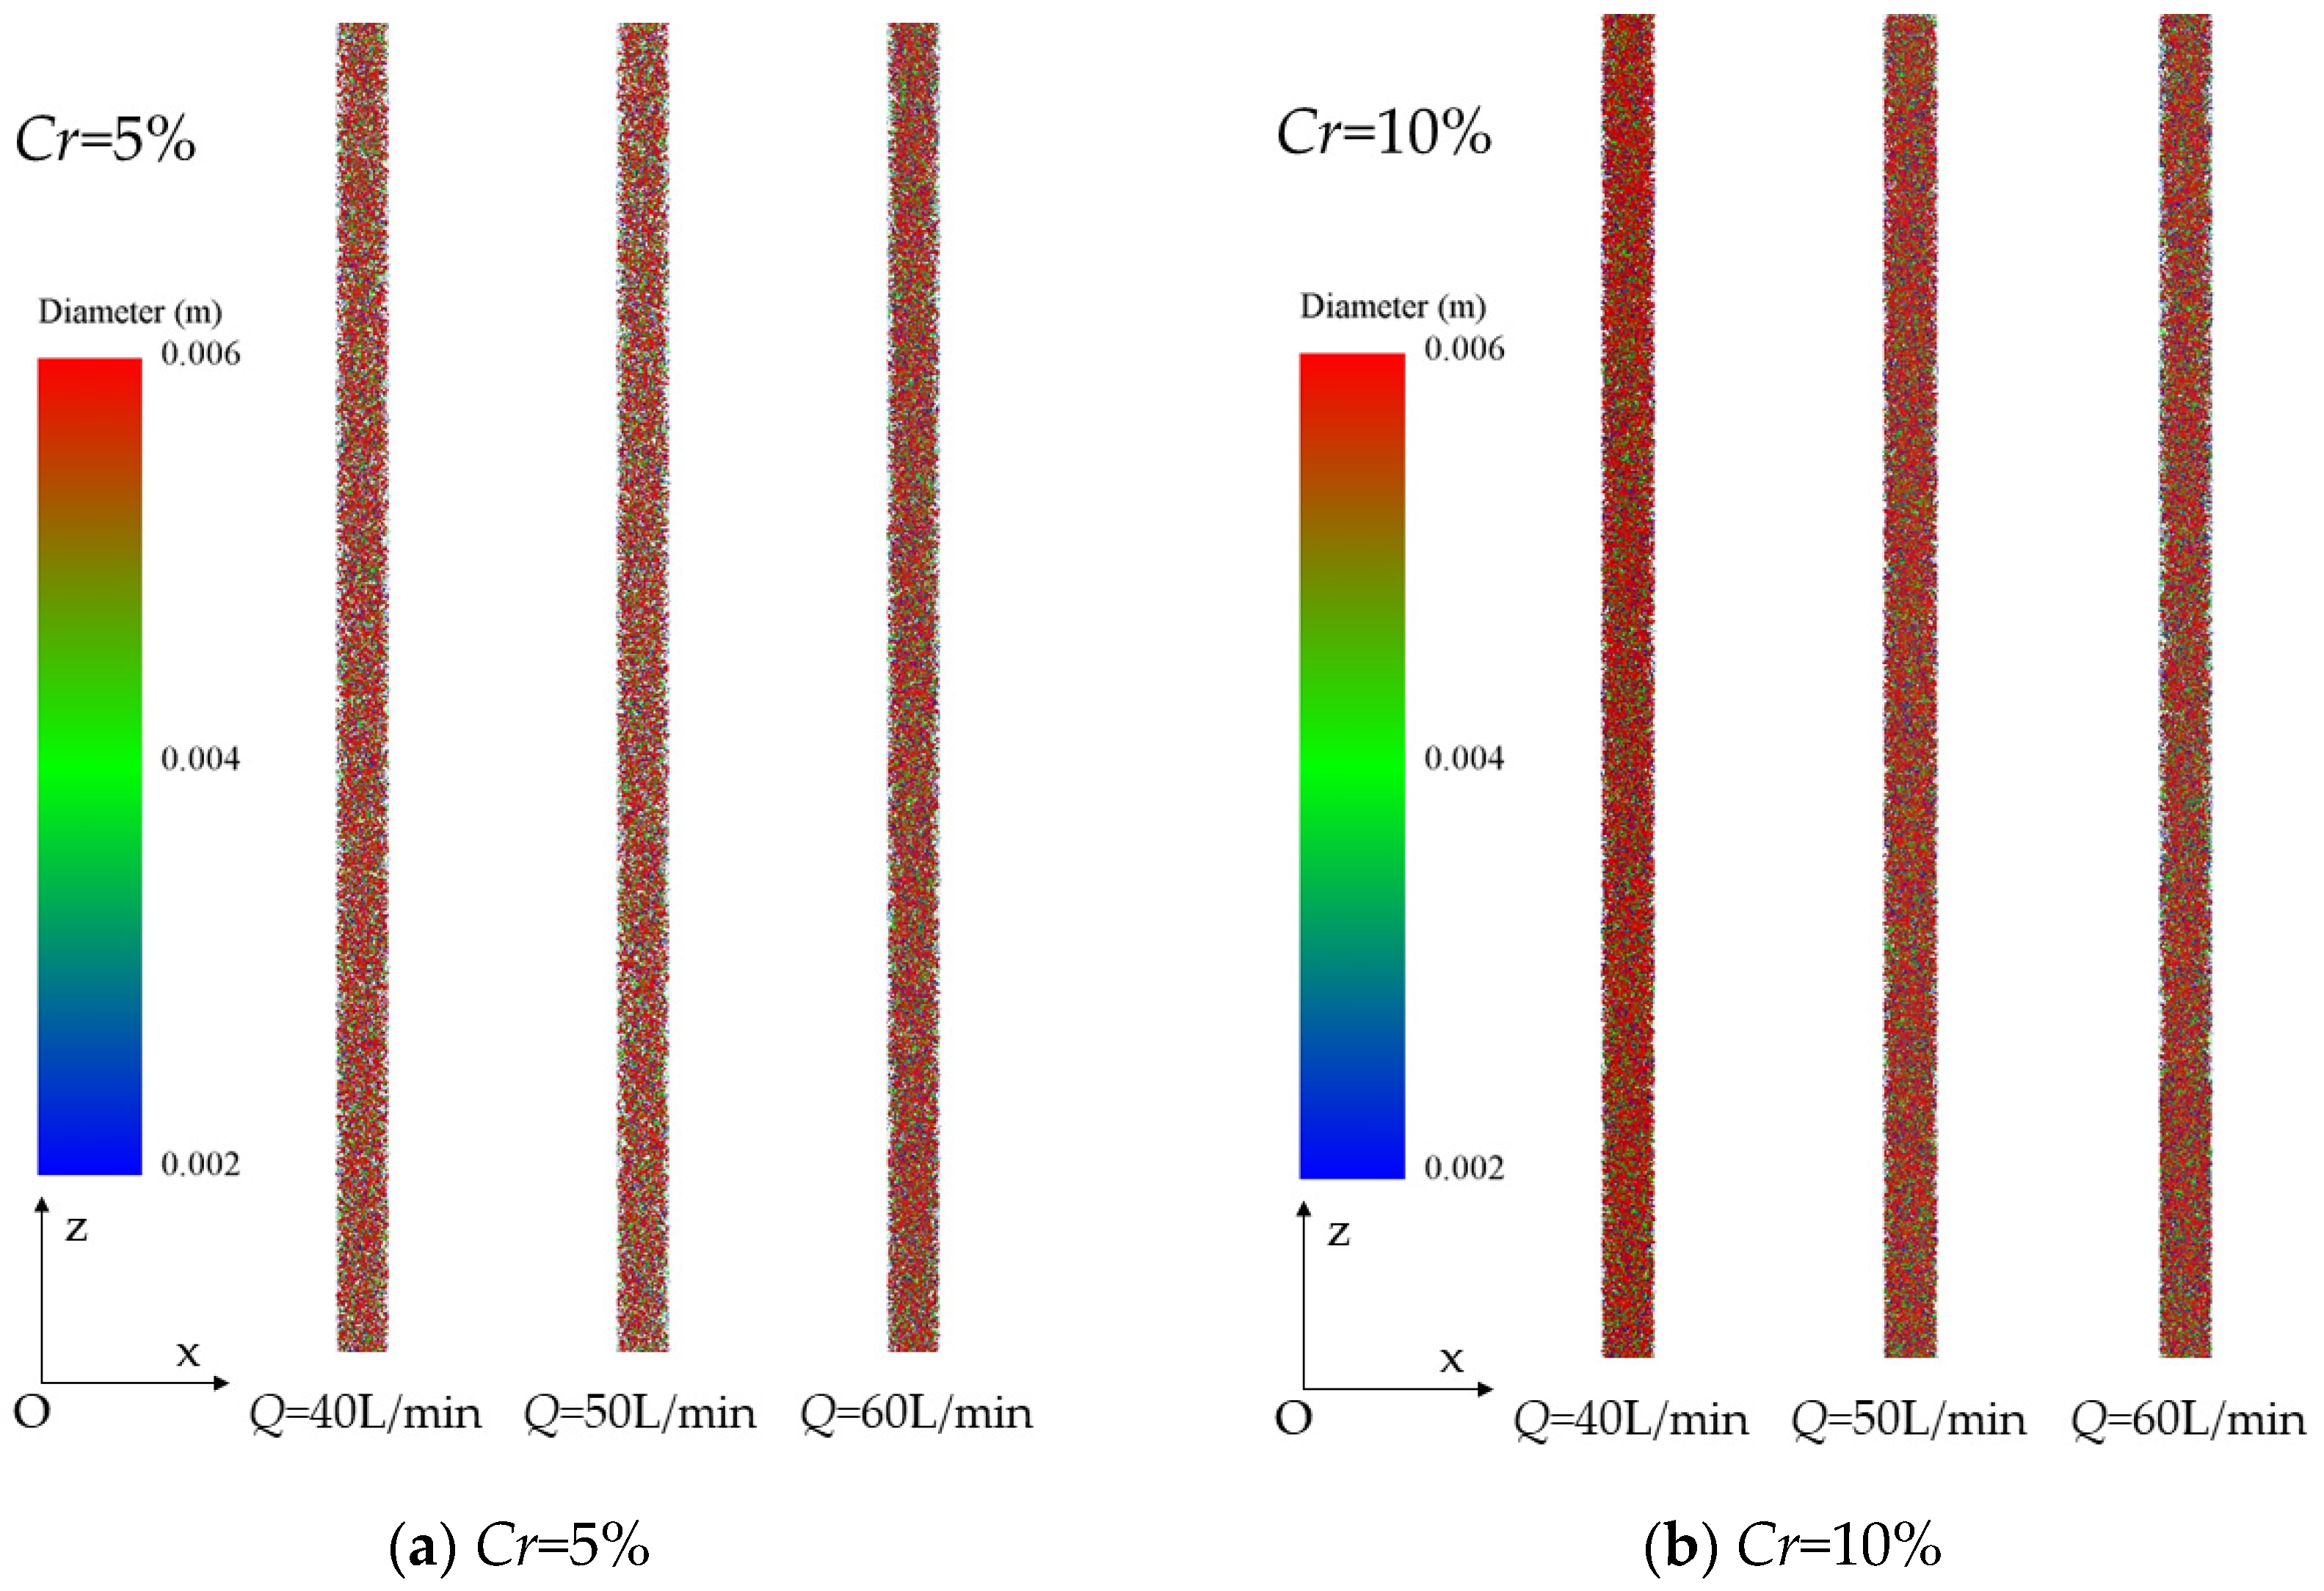
4.2.1. Overall Particle Distribution

Distinct flow rates result in unique motion states of particles [51]. The distribution pattern of particles in vertical pipes under various operating circumstances is critical for improving the transmission of the solid–liquid two-phase flow. Study the general distribution of three various scales of particles in the pipeline, as illustrated in Figure 9.
When the flow rate is low, the kinetic energy produced by the liquid phase is modest, and particles tend to settle predominantly owing to gravity. Large-sized particles accumulate near the middle of the pipeline. With the rise in particle concentration, particles of various sizes collide often, leading to greater interactions and an increase in fluid viscosity. This suppresses particle diffusion, resulting in a more uniform distribution of particles in the pipeline. When the flow rate is increased moderately, particles disperse towards the pipe wall, and the tendency of large-scale particle diffusion is more visible [17]. The concentration in the center of the pipe is significantly reduced. Continuing to raise the flow rate, the inertia effect is amplified, which stimulates the particles to continue diffusing towards the pipe wall. When the particle concentration reaches 5%, there is a considerable clustering effect of particles. Although the initial particle concentration is not large and the aggregation phenomena is not yet severe, it can be expected that as the lifting time proceeds, the clustering effect would cause a drop in the lifting speed of close particles. If the lifting speed is smaller than the particle settling speed, the particles will accumulate in the pipe, resulting in a serious risk of blockage. When the particle concentration is 10%, while the particles aggregate more strongly along the pipe wall, there are still a considerable number of particles in the middle of the pipeline owing to the greater concentration. Therefore, generally, the particle dispersion is more uniform compared to varied flow rates with the same concentration. Under circumstances of high particle concentrations and high lift flow rates, the interaction of the solid–liquid two-phase flow is more conspicuous. During the lift process, particles are not only prone to collision, following, and entrainment by other particles, but they are also impacted by the liquid phase. These factors work together to result in a more equal distribution of particles of various sizes in the pipeline.
Once the particle flow stabilizes, the concentration of particles in a certain time period is measured using the local concentration collection area 1, as seen in Figure 10. When the flow rate is raised to 40 L/min, the local concentration of particles is greater than the original feed concentration. This is because the increase in particle slip velocity at low flow rates generates more substantial particle retention, resulting in a rise in particle concentration in the local region. As the flow rate of the fluid rises, the local concentration of particles progressively drops, and the followability of particles improves.

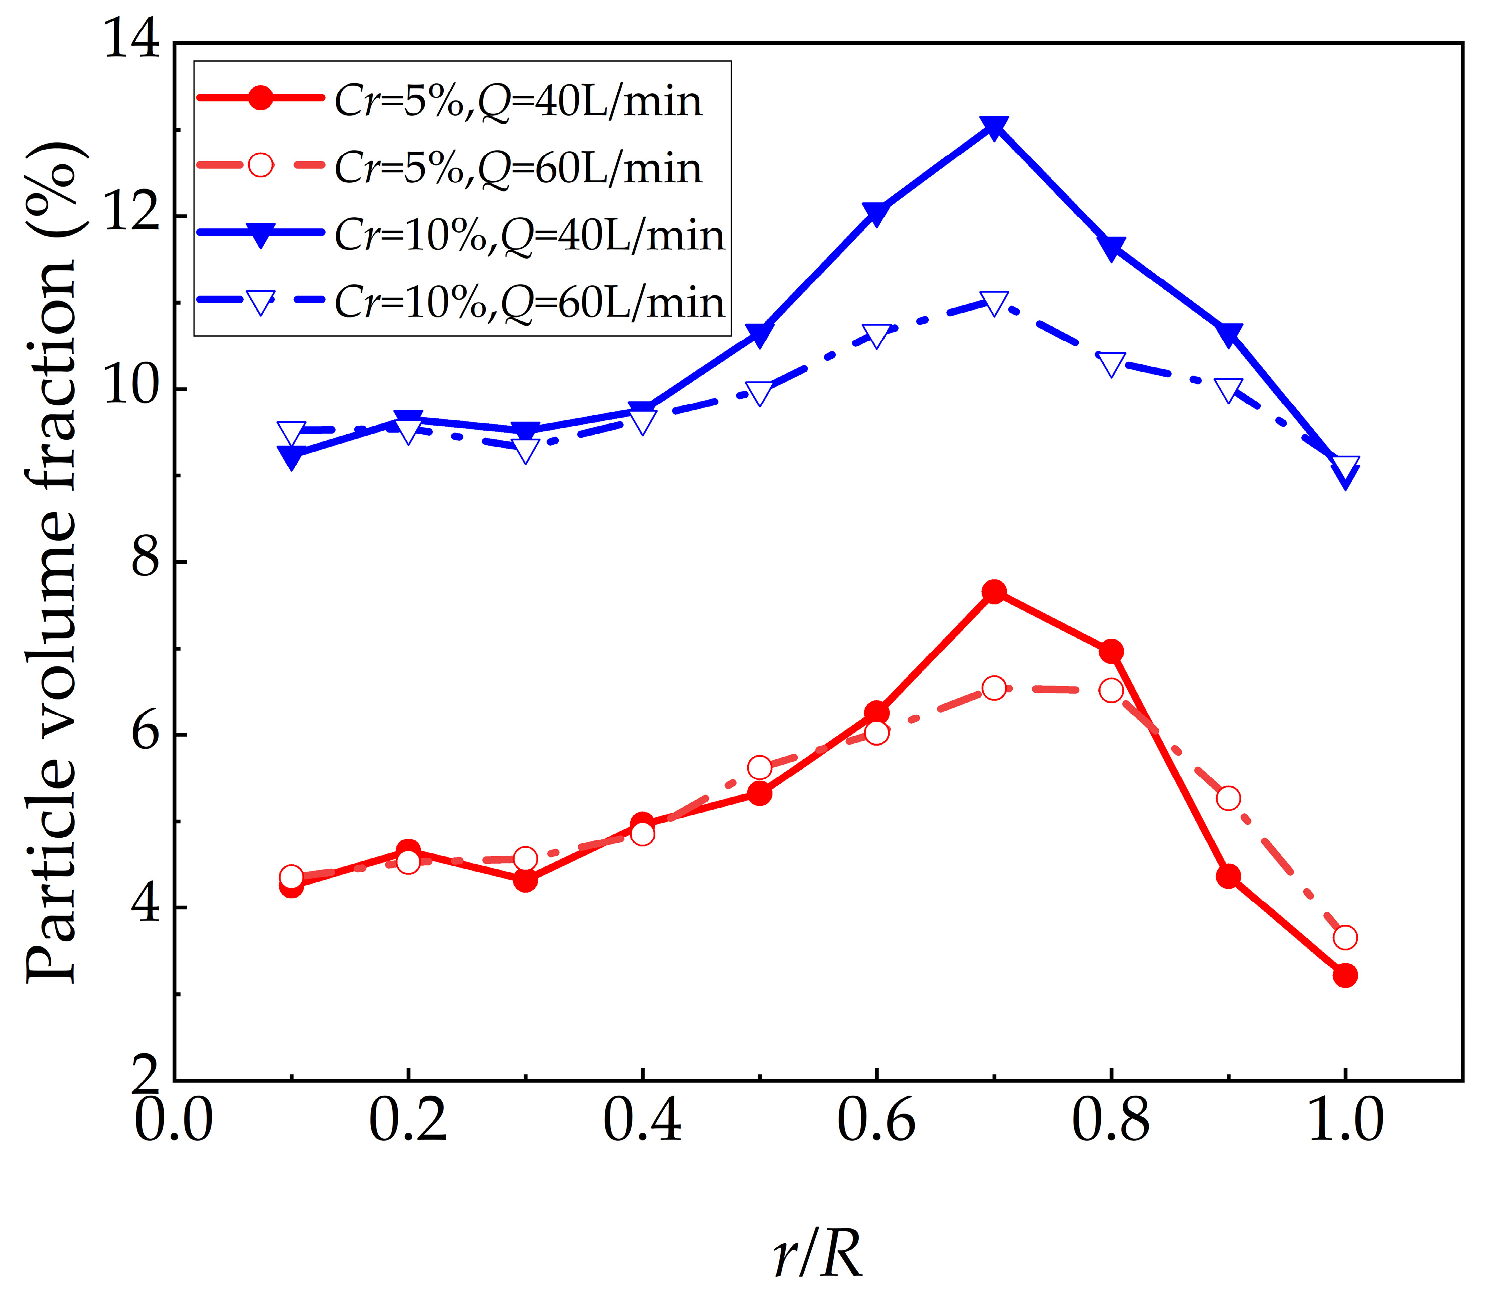
4.2.2. Particle Radial Distribution

The radial distribution of particles in the lifting pipeline under various lifting parameters is depicted in Figure 11. r/R = 0 and r/R = 1, respectively, reflect the location of the particle at the center of the pipeline and the position of the particle at the wall of the pipeline. The volume percentage of particles is determined depending on the concentration distribution of particles along the whole pipeline. It can be easily observed from the graphic that the radial distribution of particles in the pipeline is not uniform. The concentration of particles steadily rises throughout the middle of the pipeline and reaches its greatest value at r/R = 0.7 and 0.8, indicating the local aggregation of particles. Subsequently, the concentration steadily declines, and the concentration at the wall of the particle tube is the lowest value in the pipeline.
The variation trend in particle concentration throughout the radial distribution is mostly consistent under varied operating circumstances. At the same particle concentration, as the flow rate rises, the radial dispersion of particles becomes more uniform. When the flow rate is the same, the lower the concentration, the more uniform the particle dispersion is. Under the discharge of particles from the particle factory, the same radial concentration of particles is raised, but there is a substantial velocity gradient along the pipe wall. According to the Saffman force principle, particles prefer to migrate away from the pipe wall, resulting in a much lower concentration of particles at the pipe wall. When the particle concentration near the wall of the pipeline declines, the particle concentration at a specific distance from the pipeline wall will rise. The greater the local concentration, the less flow flows through the region, which raises the velocity of the fluid and generates a velocity differential between the center of the pipeline and other portions. This velocity differential leads particles in the center of the pipeline to travel outward, finally generating a radial dispersion of particles, as seen in Figure 11.

4.3. Analysis of Velocity Characteristics in Mixed Flow Areas

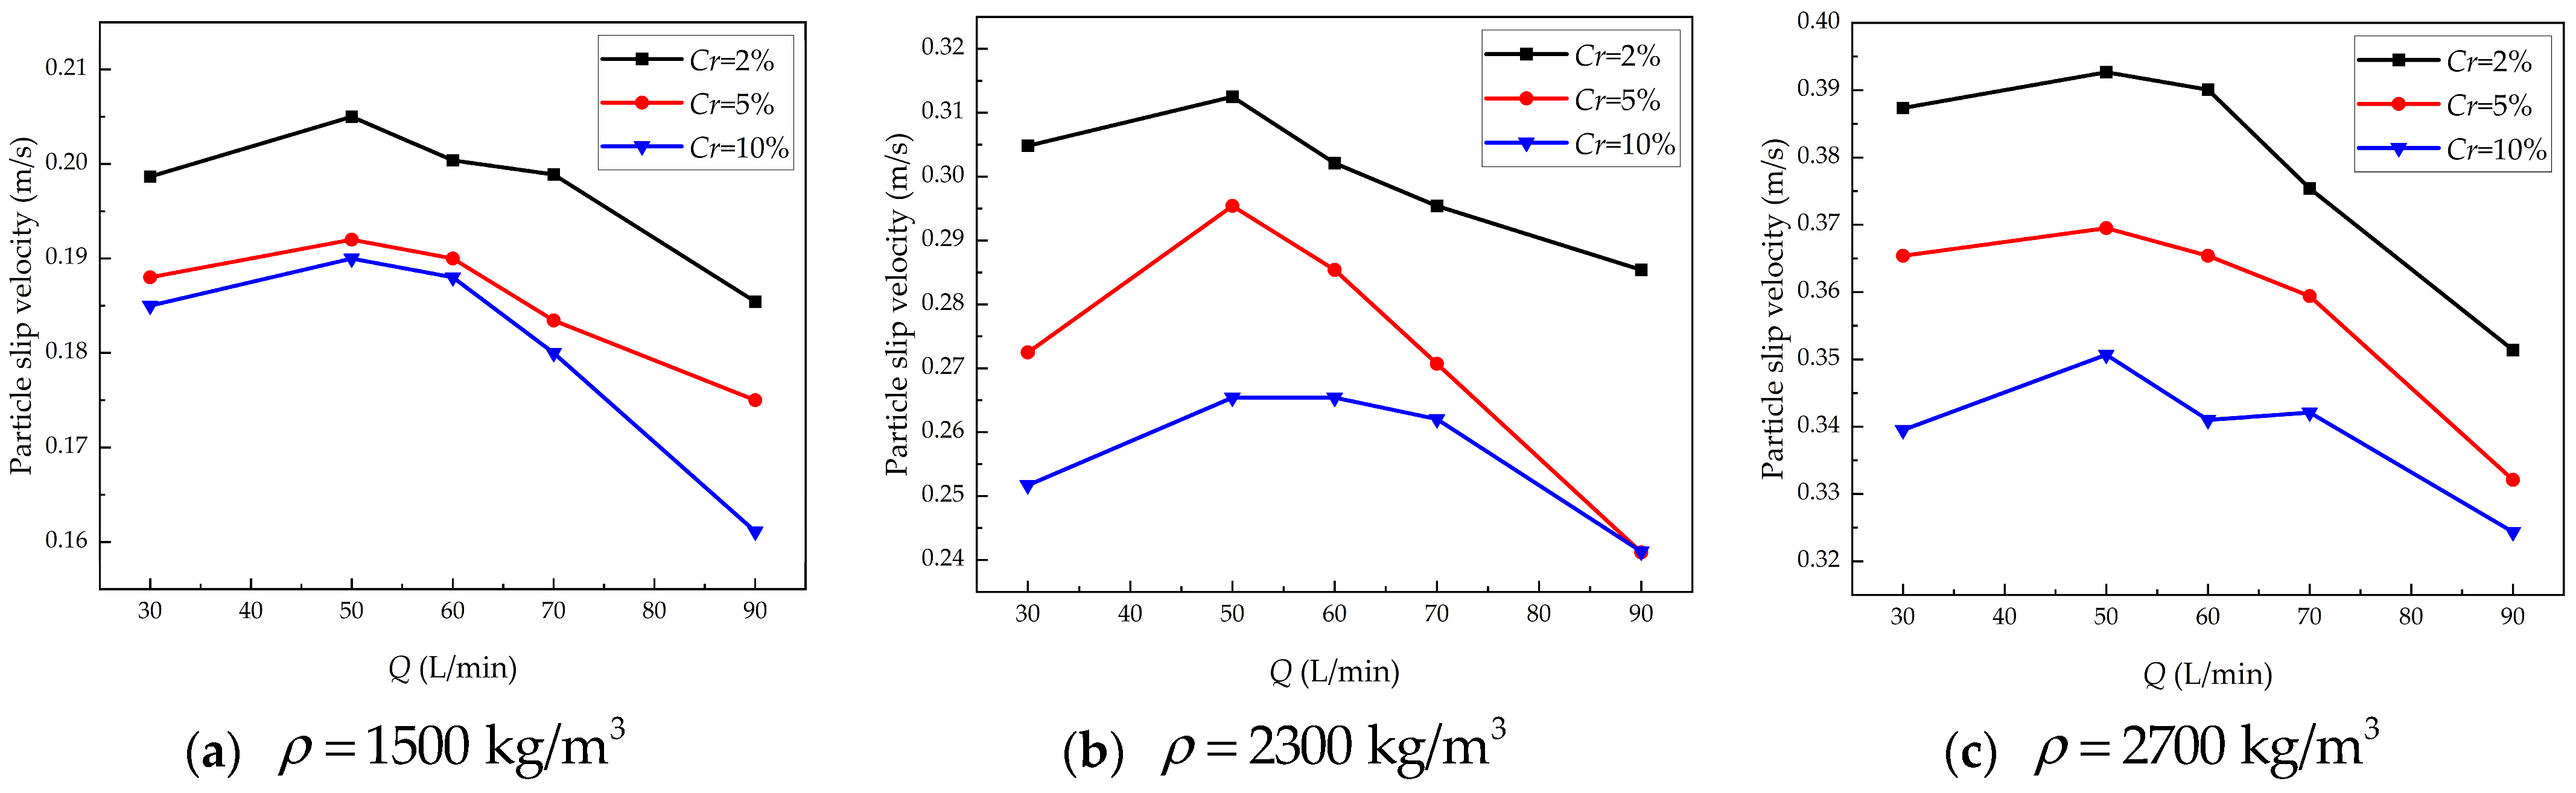
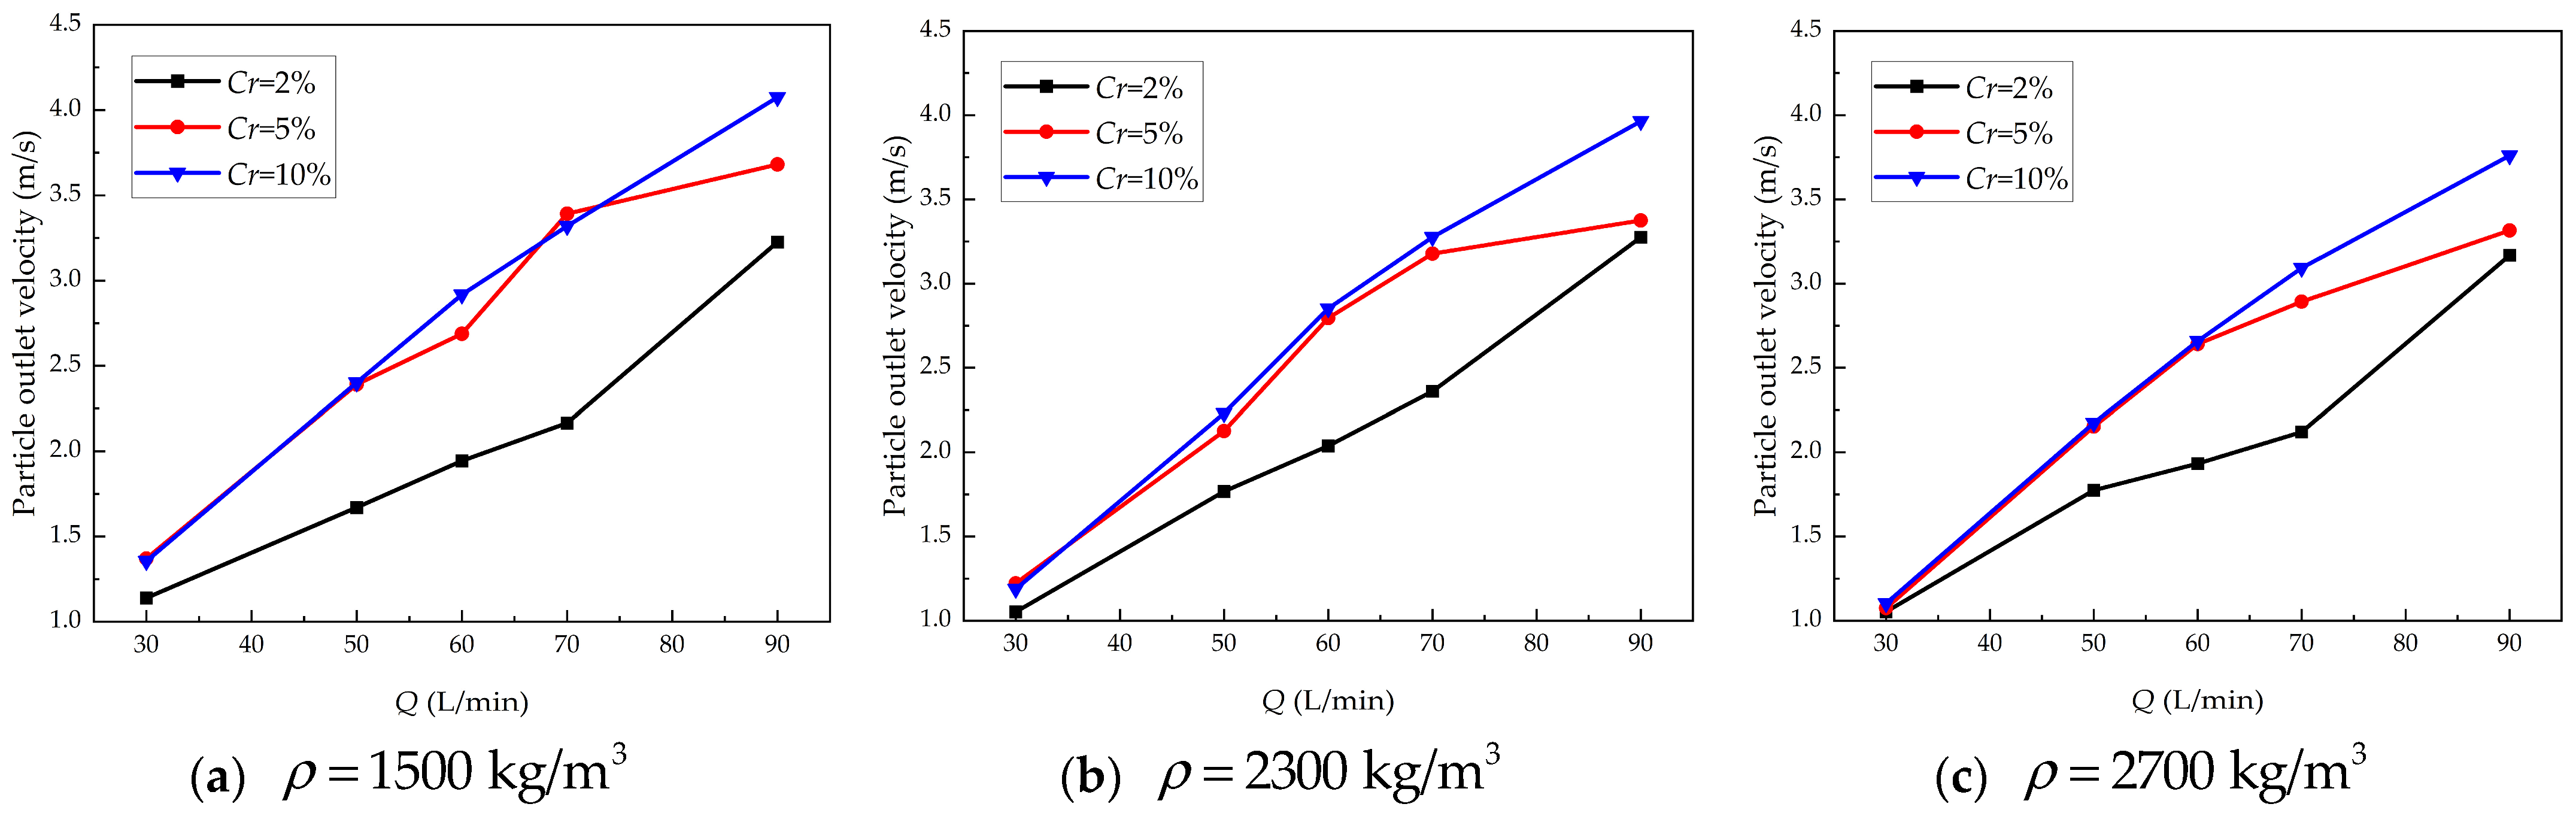
4.3.1. Analysis of Particle Phase Velocity Characteristics

During deep-sea mining, the properties of the ore found on the seabed remain unaltered even after it has been crushed. Hence, while building the conveying system, selecting a suitable conveying flow rate and an ore input concentration are crucial factors. Figure 12 illustrates the acquisition of the local concentration of particles during a certain time period when the particle flow achieves a stable condition, using the local concentration collecting area 1.
When the lifting flow rate is small, the local concentration of particles is too high, leading to the potential occurrence of particle blockage. This, in turn, may have a detrimental impact on the overall stability of the pipeline lifting system. Miedema et al. revealed the mechanism underlying this occurrence. They feared that the lower lift flow rate would form a layer of stationary particles at the bottom of the pipe, which might result in a blockage of the pipe [26]. As the flow rate rises, the local concentration of particles drops, corresponding to a reduction in particle slip velocity with an increase in flow rate. In this situation, the dispersion of particles in the pipeline becomes more uniform.
By collecting the local concentration in area 2, the particle slip velocity and outlet velocity were obtained, as shown in Figure 13 and Figure 14. For the slip velocity of particles, it can be observed from Figure 13a–c that as the lift flow rate in the internal flow field increases, the slip velocity of particles displays a pattern of initially rising and then quickly dropping [26]. When the flow rate Q is raised to less than 50 L/min, the particle slip velocity marginally rises. When the flow rate Q is raised to more than 50 L/min, the particle slip velocity quickly drops. As the particle concentration rises, the slip velocity of particles with differing densities decreases [52]. As the concentration increases, the local concentration of particles in the pipe begins to increase. Momentum exchange between particles and fluid, as well as between particles, is more frequent. As particles lose more kinetic energy, their relative velocity decreases. The viscosity of the solid–liquid two-phase flow becomes greater as the velocity at which the liquid phase is lifted rises. The rise in fluid viscosity leads to an increase in the resistance encountered by particles rising in the fluid, generating a clustering effect. Therefore, the slip velocity of particles reduces.
The variation law of particle outlet velocity with increasing flow rate is given in Figure 14a–c. When the particle concentration is low, the outflow velocity of the particles rises constantly with the rising flow rate. As the particle concentration rises, the slip velocity of particles lowers, and the followability of the solid phase improves. Therefore, the particle outlet velocity is enhanced. However, when the particle concentration goes from medium to high, the particle outlet velocity does not vary considerably with increasing flow rate. It was not until the flow rate reached roughly 70 L/min that there was a substantial difference in particle outlet velocity between the two concentrations. This is because the increase in concentration intensifies the coupling between particles, causing the vortex structures between adjacent particles to collide. Additionally, the boosted energy brought about by the liquid phase dissipates all at once, decreasing transport efficiency.
The maximal variations in outlet and slip velocities brought about by a rise in particle density show entirely different patterns. The variation trend in the slip velocity is comparable to that of large-scale particles [13], and it rises as the particle density increases [43]. The impact of density on particle settling velocity may be used to estimate the influence of particle density on slip velocity. The particle settling velocity expression is V z = 4 g d ( ρ 1 ) / 3 C d , and this equation indicates that the settling velocity of particles rises with increasing particle density. Although there is a large difference in the sedimentation velocity and slip velocity of particles, both may be ascribed to the velocity difference induced by the density differential between particles and fluids. For the particle outlet velocity, an increase in density leads to an increase in the extra mass force of the particles, requiring greater energy to lift the particles from the inlet, resulting in a quicker decay of the velocity in the vertical pipeline. High-density particles demand a water pump with a greater power output to attain the same outlet velocity.
In order to examine the variation law of the flow field characteristics within the vertical pipeline and adjust the lifting parameters, velocity cloud maps of the particle phase longitudinal profile in the mixed flow zone under various operating circumstances were created, as shown in Figure 15. Overall, the velocity distribution is parabolic, indicating that the velocity of particles near the pipe wall is substantially lower than that of particles at the middle of the pipeline. On the one hand, this is because particles near the wall collide with the wall, causing them to lose kinetic energy and lower their velocity. If the particle velocity drops below the critical settling velocity, a particle clustering effect will occur. On the other hand, the boundary layer effect caused by the viscous effect of mixed flow further alters the velocity distribution near the wall. When the particle concentration is low, the increase in flow rate in the middle and low ranges has minimal influence on the change in particle velocity within the pipeline. The impact on the thickness of the boundary layer leads it to grow thinner, particularly when there is a substantial velocity gradient near the solid wall at low concentrations and low flow rates. A bigger rise in flow rate boosts the mixing effect of the solid–liquid two-phase flow, and a local high-speed zone forms in the middle area of the particle phase velocity field. When the particle concentration is modest, the particle phase velocity field is more sensitive to changes in flow rate enhancement. Under the conditions of high concentration and high lifting flow rate, the boundary layer thickness is the smallest and the lifting efficiency is the highest.
The high-speed mixed flow and the rotation of mineral particles will generate local disruptions in the flow field within the pipeline, resulting in cluster effects induced by the collision of adjacent particles, and even particle deposition causing pipeline obstruction. In order to study the changing law of flow field characteristics inside the vertical pipeline, the conveying parameters were changed to obtain the velocity cloud diagram of the longitudinal section of the particle phase in the mixed flow zone (z = 1.5 m) under different working conditions, as shown in Figure 16a–c. Under the combined disturbance of mineral particles and the pipe wall, a turbulent zone with noticeable change in flow characteristics is created in the mixed flow zone. The movement of particles near the pipe wall is greatly impacted by the boundary layer effect, exhibited as the existence of noticeable vortices near the pipe wall. At low concentrations and low flow rates, particle motion is predominantly affected by the liquid phase, with lower kinetic energy and smoother motion. At medium to high flow velocities, there exist multiple vortex structures. The velocity of the vortex core approaches zero, generating a local dead zone. If the particle dead zone continues for too long, it is extremely likely to produce obstruction. As the particle concentration rises, the size of the zone with the maximum velocity dramatically increases, and the scale of the vortex noticeably reduces. At this moment, the kinetic energy of the fluid increases as the flow rate is increased, resulting in a velocity gradient change in the flow field and a velocity maximum area at the center of the pipeline. When transported at high concentrations, the contact between particles is considerably strengthened, and the homogeneity of the particle velocity distribution reduces. Especially when the flow rate is considerably raised, a considerable velocity gradient is generated.
In order to conduct a more detailed examination of the velocity properties of particles with identical sizes at various locations, particles were collected from both the central region and the vicinity of the wall of the pipeline. Three particles were retrieved from comparable places under identical operating circumstances and then averaged, as seen in Figure 17a,b.
For particles in the center of the pipe, the increase in concentration at lower lifting flow rates leads to insufficient initial kinetic energy and reduced lifting efficiency of the lifting system. By raising the lifting flow rate, the lifting efficiency of varied particle concentrations is significantly boosted. When the flow rate is raised to 70 L/min, there is virtually no noticeable variation in the efficiency of enhancing particles of varied concentrations.
For particles near the pipe wall, the lift efficiency differs significantly at low lift flow rates. As the kinetic energy of the liquid phase grows, the movement of particles near the tube wall is no longer finished first under low-concentration circumstances. In a medium lift flow, medium particle concentration lift efficiency is the maximum. At a high concentration and high flow, the frequency of particle–particle and pipe wall collisions rises, and their velocity approaches the maximum amount.
For the velocity characteristics of particles of various sizes (the particle sizes are as follows: particle 1 has a size of 2 mm, particle 2 has a size of 4 mm, and particle 3 has a size of 6 mm) in the middle of the pipeline, the same procedure was used to extract and average the particles of different sizes. The findings are displayed in Figure 18a. When the lifting flow rate is 60 L/min, the followability of particles of different sizes is not much different compared to when Q = 50 L/min, so the study of this lifting flow rate is omitted. For particles in the center range of the pipeline, the upward velocity of small-scale particles after a given lifting distance is larger than the initial lifting velocity of the liquid phase. Medium-size particles have strong followability to the liquid phase, and their upward velocity is roughly the same as that of the liquid phase. The variability of the upward velocity of large-scale particles happens when the flow rate is low. By raising the flow rate, the kinetic energy transfer becomes greater, and the velocity of large-scale particles starts to stabilize.
For particles near the pipe wall, the lifting speed of particles of various sizes is illustrated in Figure 18b. Large-size particles also have poor followability and large variations at low flow rates. Increasing the flow rate leads to a gradual drop in the velocity of large-scale particles at the beginning of the lifting process, followed by a fall in velocity near the outlet of the pipeline. At greater flow rates, the contribution of liquid-phase kinetic energy to particle velocity is substantial. The particles encounter high velocity variations as they rise from the inlet, and then gradually stabilize under the action of the liquid phase. At the two extreme values of the lift flow rate, there is no visible difference in the velocity between the small-scale particles near the pipe wall and the particles in the middle of the pipe, and the lifting efficiency is somewhat reduced under the action of the boundary layer. When the flow rate is raised to 70 L/min, small-scale particles reach the pipeline outlet sooner, before medium- and large-sized particles.

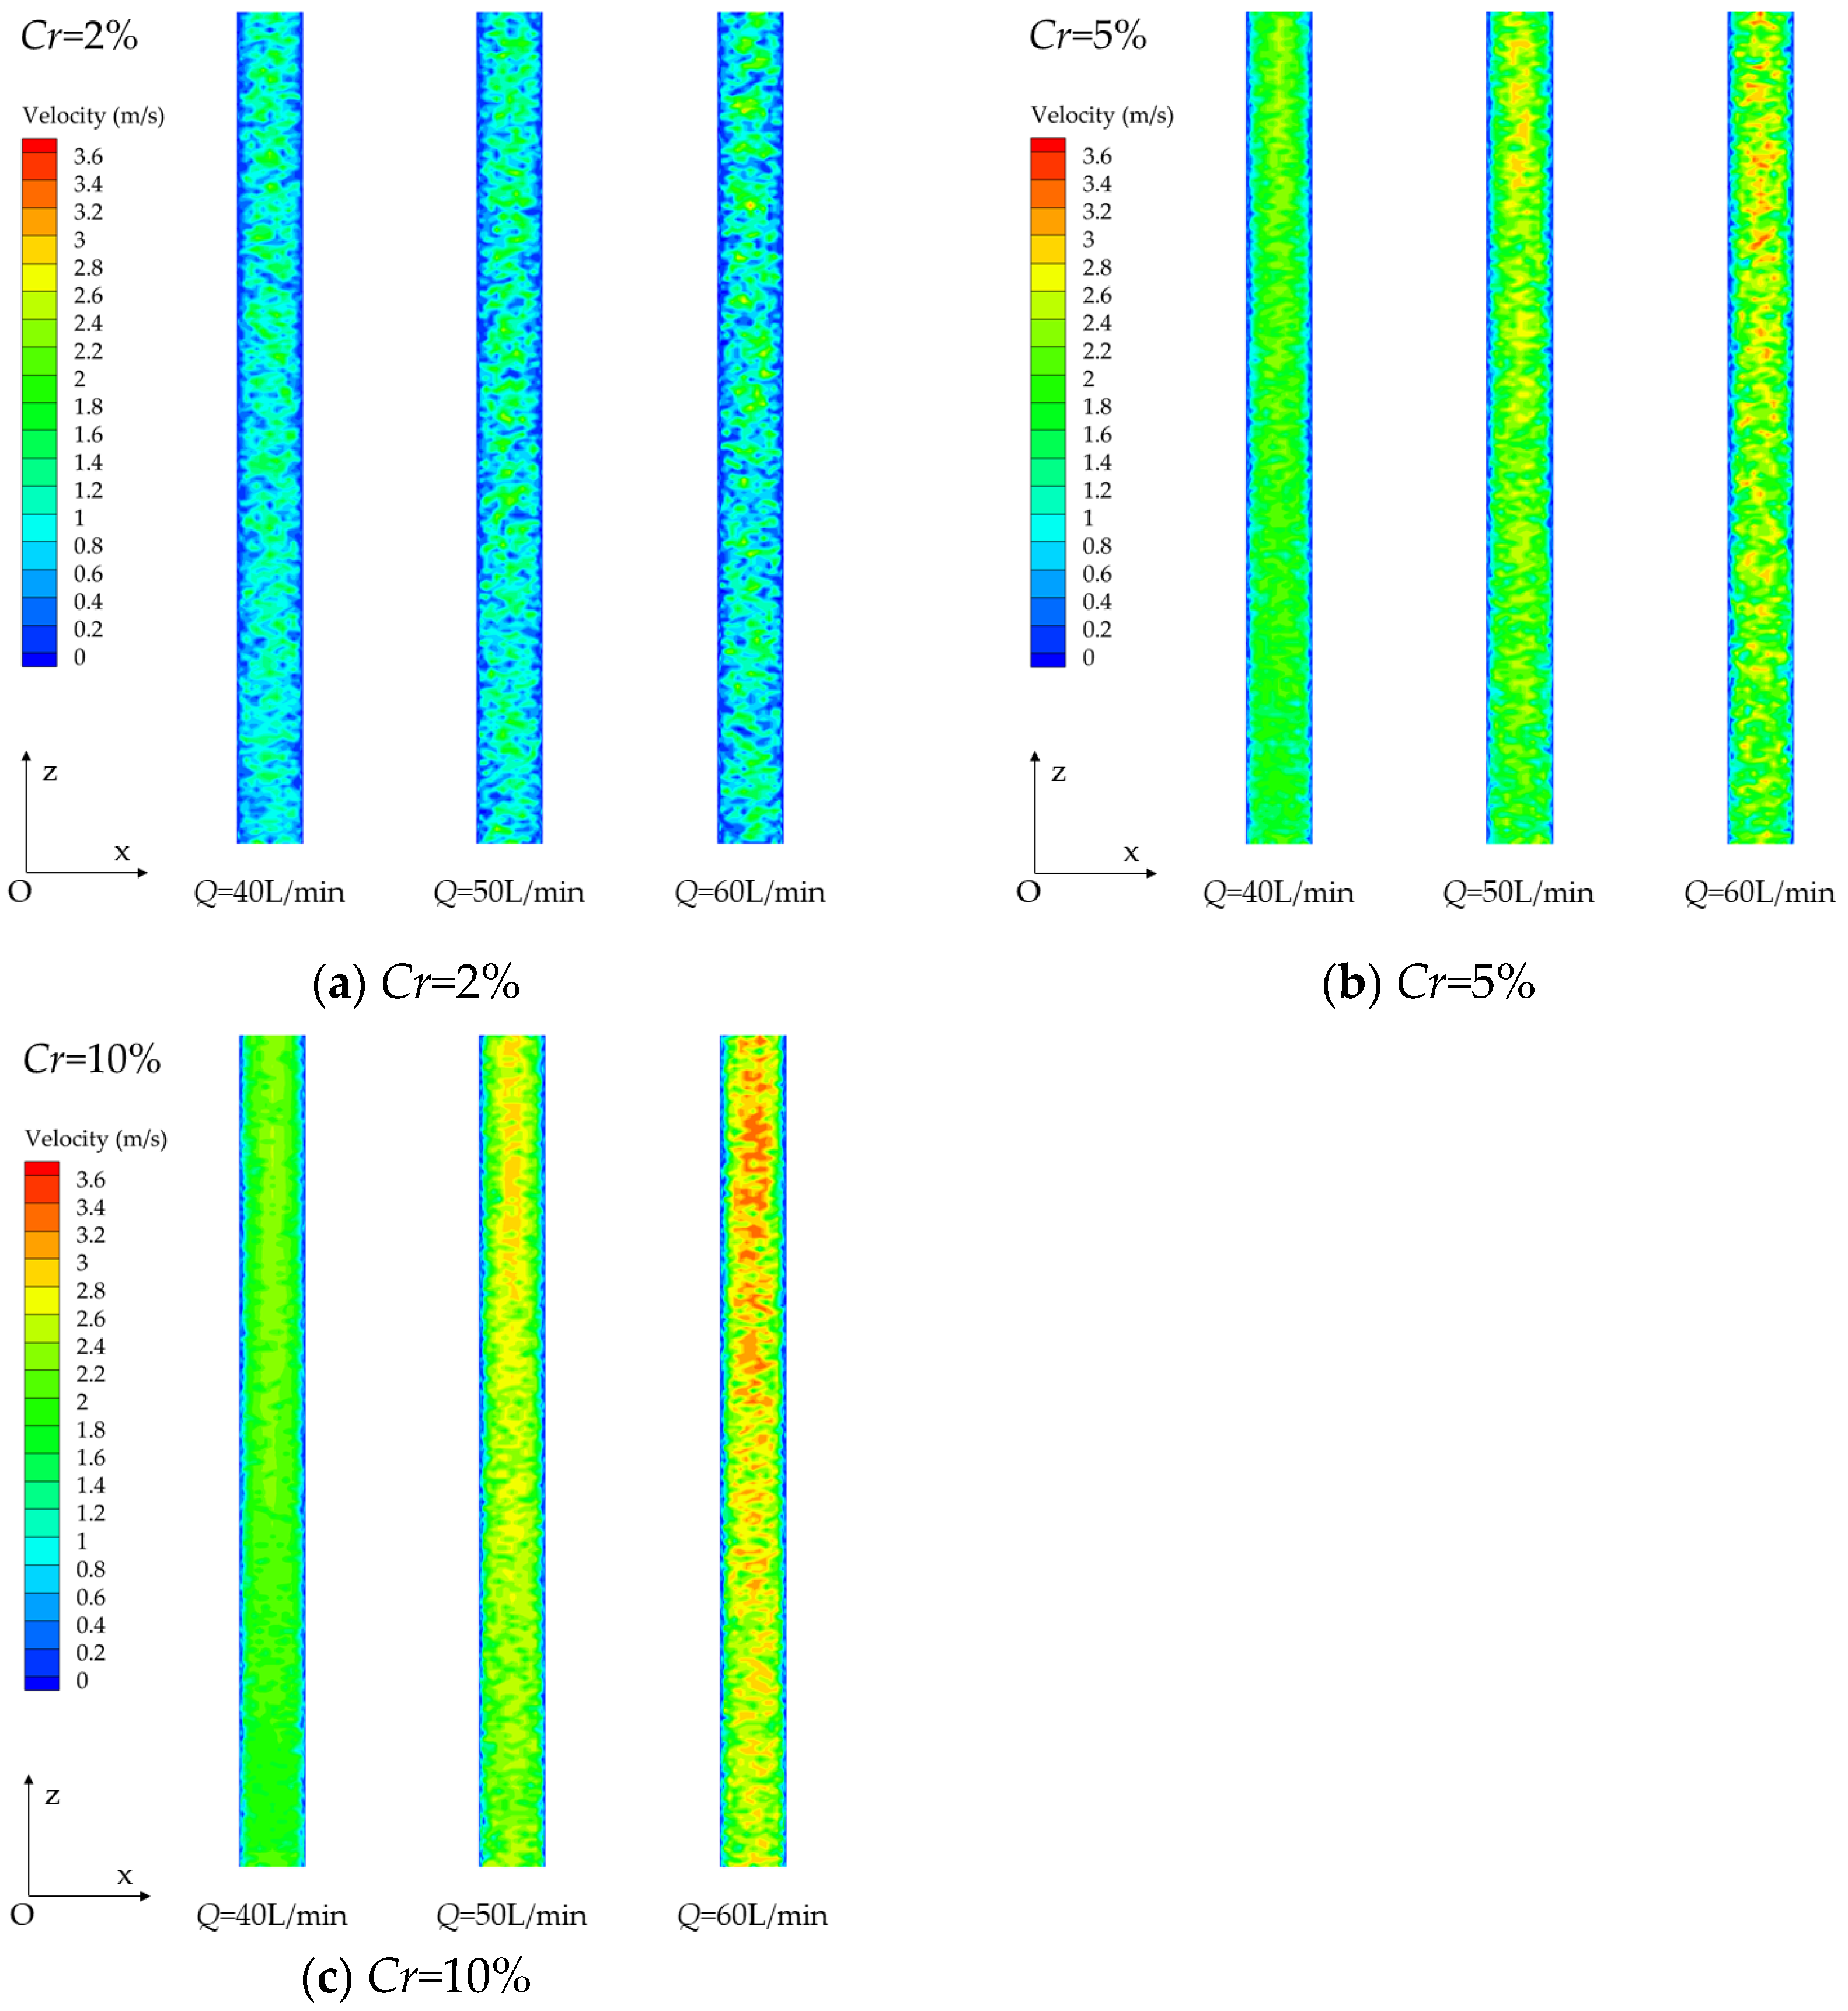
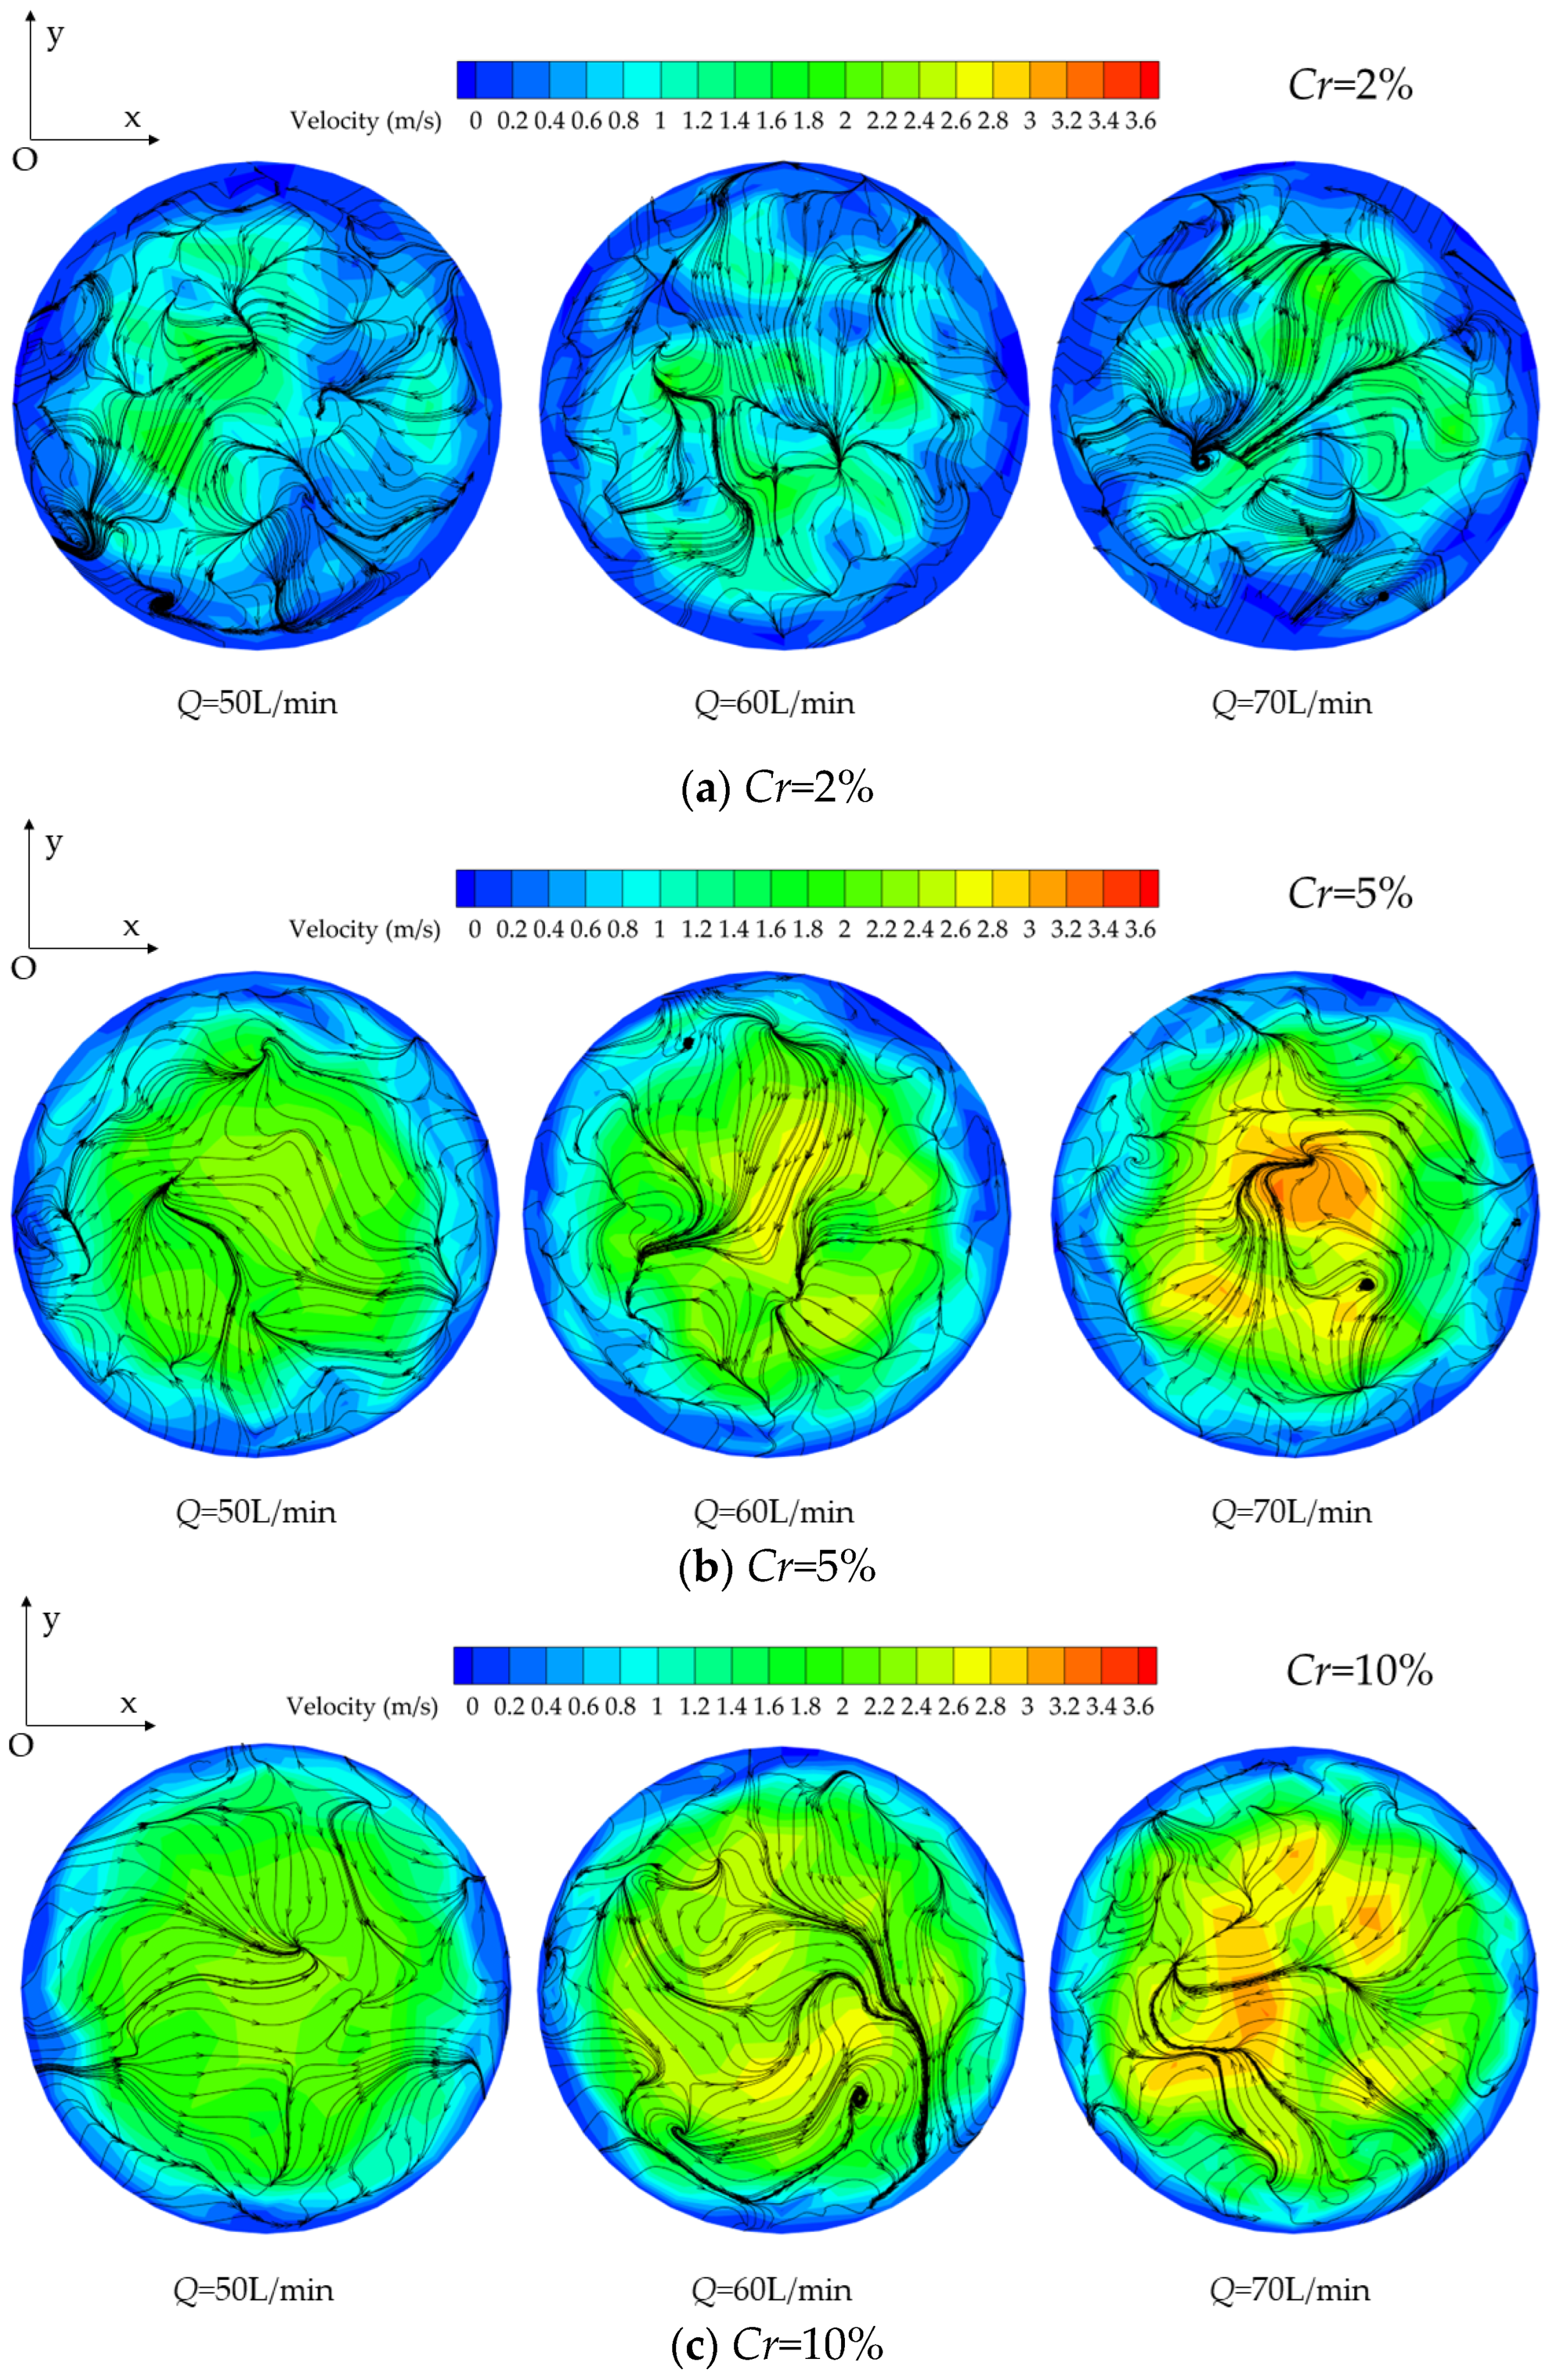
4.3.2. Analysis of Liquid Phase Velocity Characteristics

The velocity cloud map of the liquid phase profile in the mixed flow zone under various operating circumstances is presented in Figure 19. Based on the detailed examination of the velocity characteristics of particles, particles near the center of the pipeline typically arrive at the outlet of the pipeline before particles at other places. Therefore, the initial motion form of the particles as a whole shows a pointed rod shape. The fluid in the upper part of the pipeline is most frequently disturbed by particles, which accelerates the surrounding fluid, making the liquid-phase velocity in the center higher, especially the maximum value area near the outlet position. On the other hand, at the central part of the pipeline, owing to the modest boundary layer influence on the fluid, the liquid-phase flow resistance is low, resulting in a higher velocity at the center. Overall, the liquid-phase velocity distribution may be classified into five phases, A–E. Stage A is the “initial lifting” stage, Stage B is the “prism of a pyramid” stage (where the boundary layer shows obvious thickness and becomes thicker with the lifting height), Stage C is the “multi-peak” stage, Stage D is the “single long peak” stage, and Stage E is the “peak” stage (there is a high-speed zone in the center). The regional division is shown in Figure 19a, with Q = 50 L/min corresponding to the annotation.
The particles are raised in Stage A, and the liquid-phase velocity is somewhat lower than the initial lifting speed, this is consistent with the results obtained by Liu [13]. At this stage, the particles are predominantly impacted by gravity and hydrostatic pressure, and the liquid flow does not form a steady flow. At low flow rates, the kinetic energy is small and it is difficult to support the lifting of particles. At low concentrations, the area is the biggest and progressively shrinks with an increasing flow rate. As the particle concentration grows, the area of the lowest velocity zone in Stage A steadily diminishes or even vanishes. Within the scope of Stage B, the height of the edge platform displays a declining tendency with an increasing flow rate. The fluctuation in particle concentration has a considerable effect on the irregularity of the edges, particularly in the case of shaking at the boundary layer edges between the liquid and the wall at high concentrations and low flow rates. In Stage C, solid–liquid two-phase mixing is considerable, and the kinetic energy of particles progressively converts into flow velocity, while the flow barrier is largely overcome. And, the variations in particle concentration and flow rate have a favorable influence on the peak height of many peaks. When the particles proceed to Stage D, the liquid-phase velocity distribution displays a dramatically different velocity gradient. At high flow rates, the unimodal height rises. As the particle concentration grows, the flow resistance likewise increases, and the breadth of the zone drastically narrows. For Stage E, the interaction between particles is minor under the condition of a lower lifting flow rate, and this stage basically does not emerge. By raising the flow rate, the center high-speed zone started to develop, and evident pinching phenomena occurred under medium and high particle densities. Particles are very likely to aggregate at the pinch-off point, further leading to uneven velocity distribution. When the flow rate reaches its maximum, the phenomenon of pinching diminishes dramatically, and the shift in the velocity gradient lessens significantly.
To further evaluate the variations in the two-phase flow field in Stage D, velocity cloud maps (z = 1.5 m) of the cross-section at the same place within the vertical pipeline under various operating circumstances are presented in Figure 20a–c. The difference in particle phase velocity distribution is that the liquid-phase velocity distribution is uneven, and the velocity gradient rises with the increase in flow rate and particle concentration. The former has a higher influence on the velocity distribution than the latter. When the concentration is low and the flow rate is low, a thick boundary layer emerges in the velocity distribution, and the energy loss in the liquid phase is more severe. The overall flow is laminar, and the contact between particles is decreased, resulting in a rather equal velocity distribution across the liquid phases.
As the flow rate rises, the flow within the pipeline progressively converts from laminar to turbulent, and the velocity distribution becomes uneven. When the particle concentration rises from 5% to 10%, as the lifting flow rate increases, the liquid-phase flow transforms from a relatively low-speed steady-point flow state to an unstable flow state with highly staggered and curved streamlines and a multi-vortex structure. At high concentrations and high flows, the liquid-phase velocity distribution reveals a boundary layer with a tiny thickness and multiple gradients, and vortex structures with relatively uniform scales, which further impact the movement of the particle phase.

4.4. Analysis of Pressure Characteristics in Mixed Flow Areas

Based on the above analysis, as the particle concentration and lift flow rate change, the mixed flow zone show obvious boundary layer effect, which would inevitably produce a certain amount of dynamic pressure and shear stress on the inner wall of the pipe. By analyzing the changes in pipeline dynamic pressure and the distribution of shear stress, the transportation parameters of the two-phase flow in the pipeline can be further optimized, thereby summarizing relevant suggestions on the safety and stability of the deep-sea mining pipeline transportation system and providing a certain reference basis.

4.4.1. Dynamic Pressure of Two-Phase Flow on Pipe Walls

The dynamic pressure variations under various working conditions generally exhibit a similar tendency, that is, the dynamic pressure near the vertical pipe inlet is bigger and rises with the increase of lifting flow, as illustrated in Figure 21. Among them, Figure 21a–c show the dynamic pressure changes in particles of the same size at various concentrations, whereas Figure 21d shows the dynamic pressure changes in particles of different sizes under the same concentration. When the flow rate is raised, the dynamic pressure changes along the z-axis, and the fluctuation amplitude is modest. The velocity gradient is generally minor, and the flow resistance overcome by two-phase flow is minimal, resulting in a lower dynamic pressure and a more uniform distribution. As the flow rate rises, the interaction between solid and liquid phases is improved, and local turbulence and turbulence energy are increased. The changes in the velocity and pressure of the mixed flow are instantly reflected in the dynamic pressure; thus, the dynamic pressure extreme difference starts to rise. According to the Bernoulli equation, the higher the velocity, the greater the dynamic pressure flowing through the pipe wall. Therefore, increasing the lift flow rate causes the fluid and suspended solid particles to flow at a higher velocity, increasing the dynamic pressure on the pipe wall.
Under the same particle concentration, the overall trend of dynamic pressure pulsation for particles of the same size is concave, but for particles of various sizes, the overall trend of dynamic pressure pulsation is convex. The interaction between particles of the same size is relatively uniform and unified.
When lifting particles of different sizes, large-scale particles are subject to greater flow resistance and cause greater disturbances to the flow field; small-scale particles have better followability to the liquid phase and disturb the mixed flow zone more quickly. This is consistent with the research results in the literature [24]. The discrepancy between particle scales further leads to considerable dynamic pressure fluctuations. In real deep-sea mining operations, to minimize severe pipeline wear and erosion produced by particle impact with a larger impact force on the pipe wall, particle size variations should be tuned to adapt to changing operating circumstances.
As for the change in dynamic pressure under various particle concentrations, the dynamic pressure fluctuation is relatively steady at low concentrations, the number of particles is sparse, the fluid resistance is rare, and the dynamic pressure change is largely impacted by the lifting speed. As the particle concentration grows, the dynamic pressure pulsation produces a brief surge in the initial stage. This is because in the first lifting stage, the number of particles grows and a specific amount of kinetic energy has to be gathered before commencing lift. In addition, the rise in concentration promotes solid-phase interactions, leading to a drop in static pressure owing to an increase in local flow velocity, and partly translating into dynamic pressure, resulting in a temporary increase in dynamic pressure in the initial stage. At the same time, the rise in particle concentration is followed by frequent oscillations in the dynamic pressure fluctuation curve. This is because an increase in concentration may readily induce clustering effects in the mixed flow zone, where particles continually hit, split, and form new clusters in the flow, resulting in large swings in dynamic pressure.

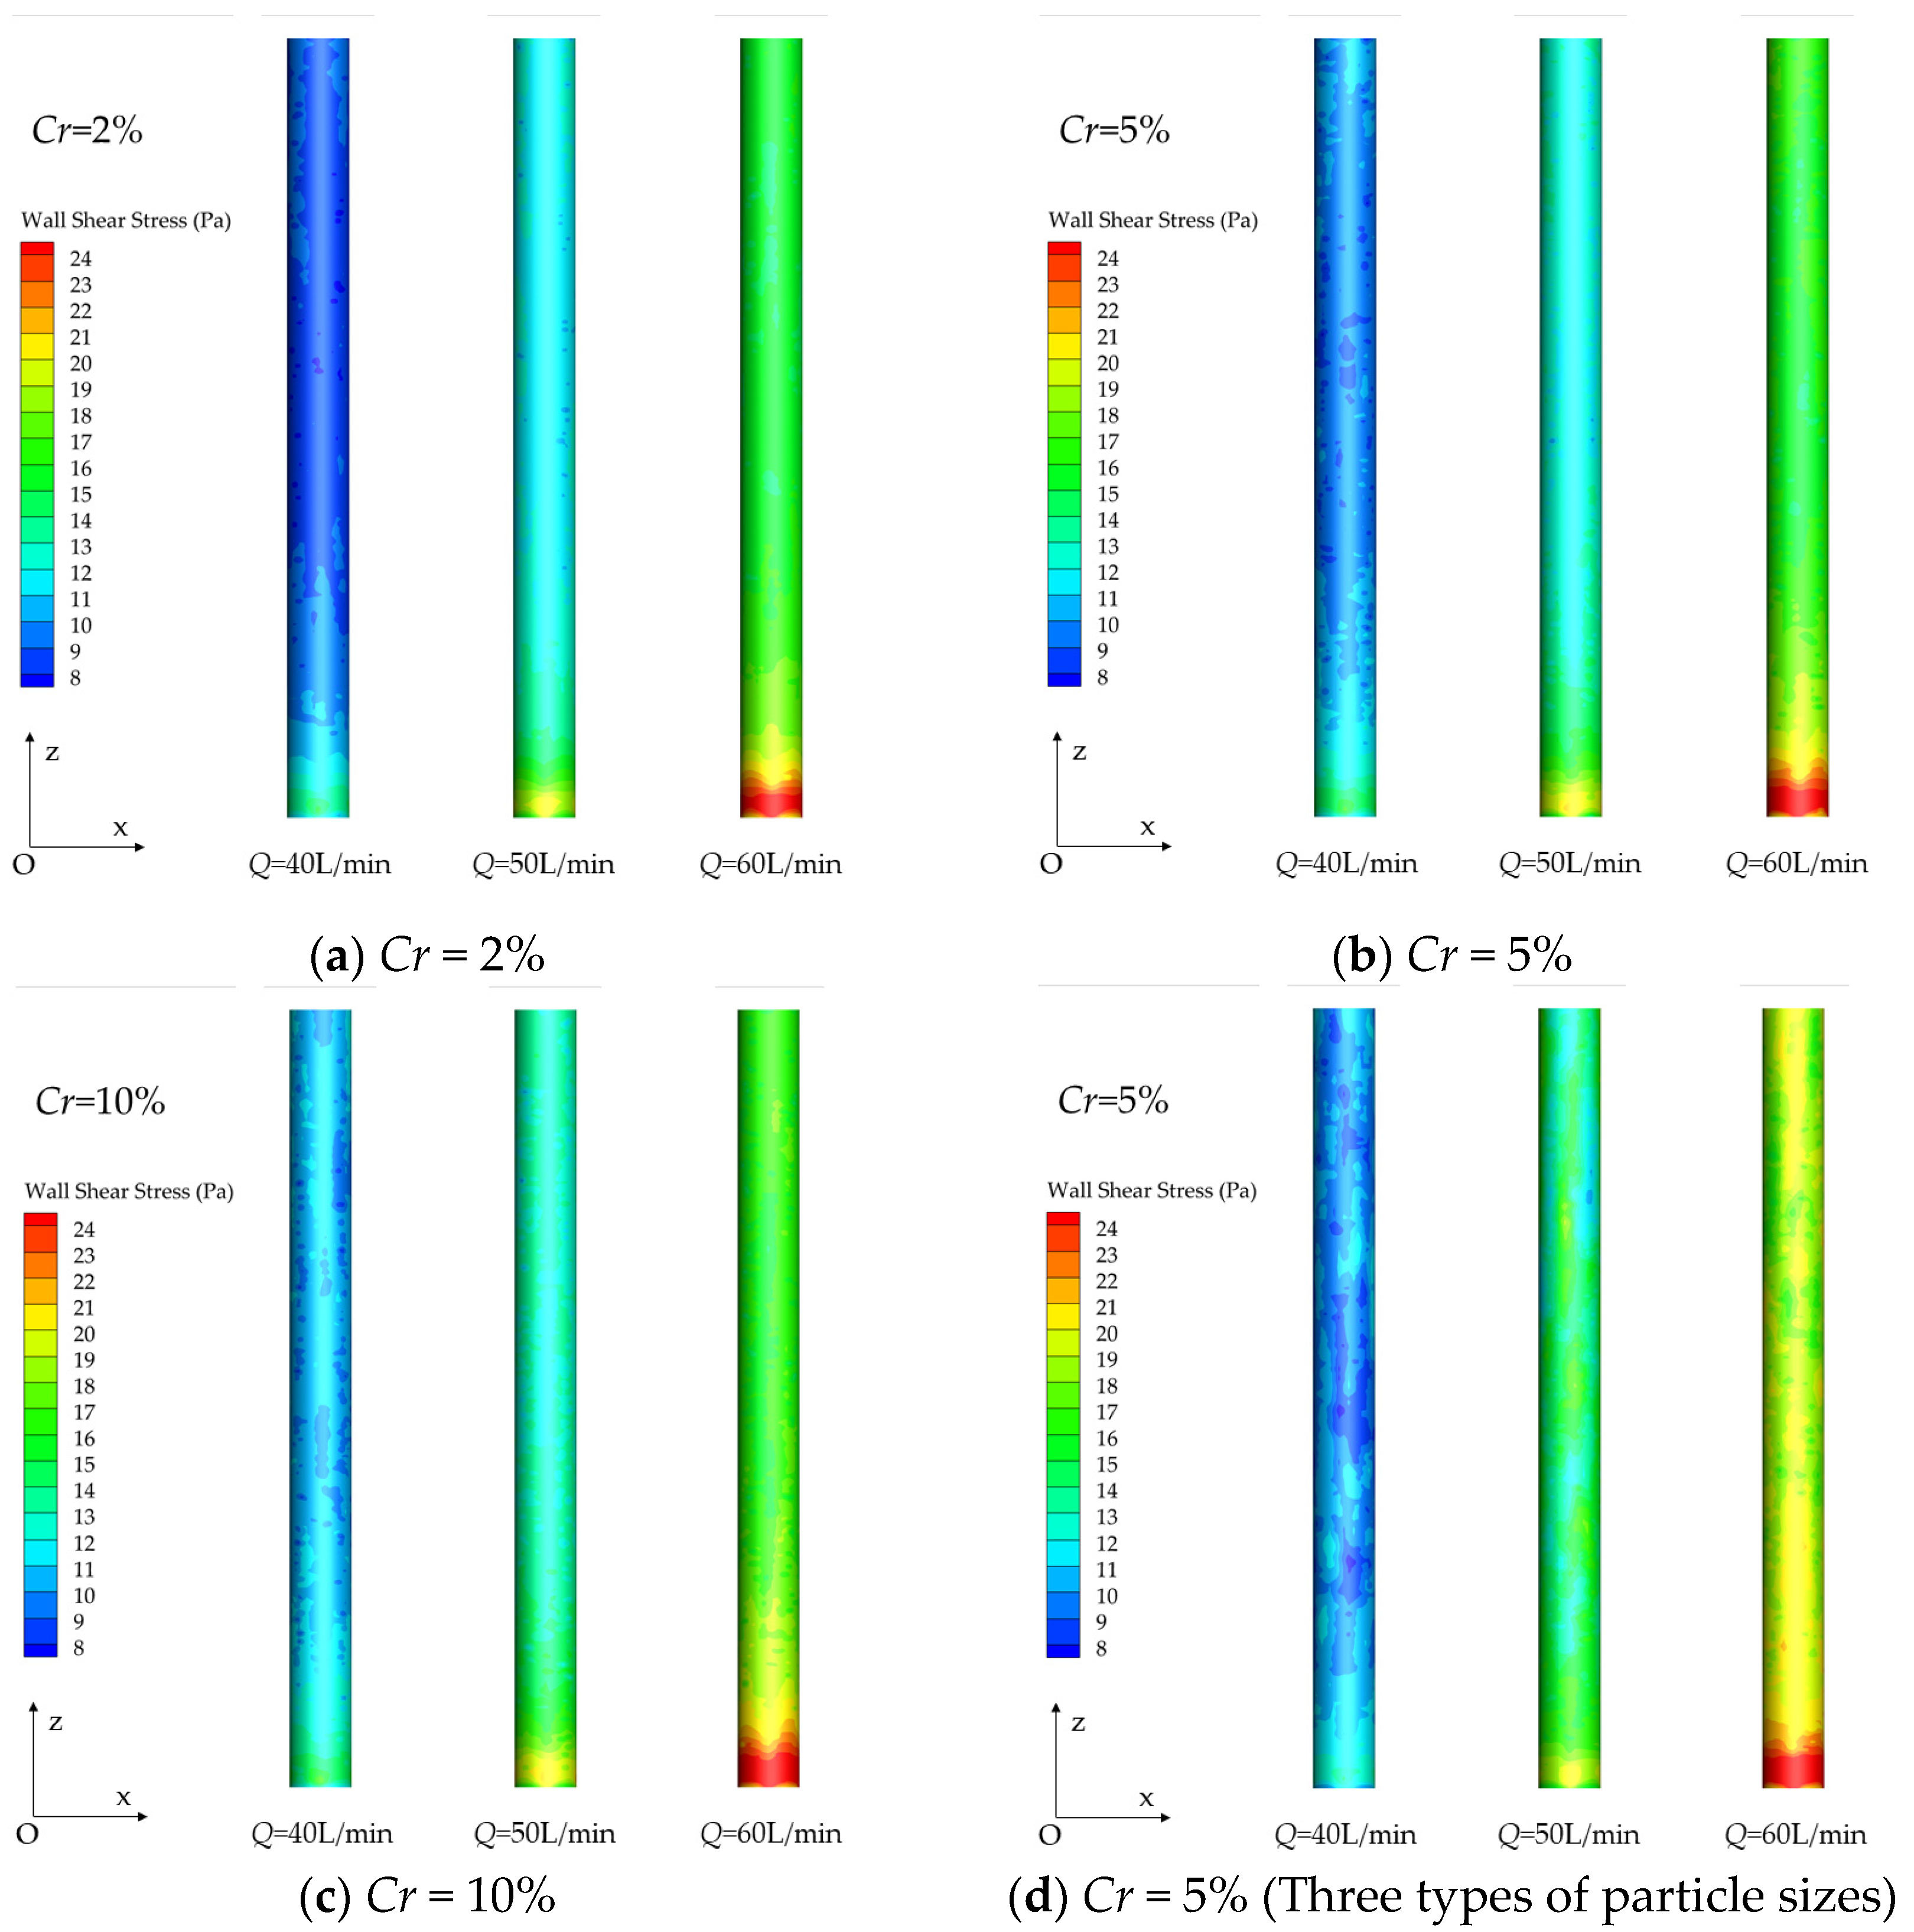
4.4.2. Shear Stress of Two-Phase Flow on Pipe Walls

Wall shear stress is another essential metric, and the distribution cloud maps of the shear stress on the pipe wall induced by the solid–liquid two-phase flow within the pipeline are shown in Figure 22. Among them, Figure 22a–c show the dynamic pressure changes in particles of the same size at various concentrations, whereas Figure 22d shows the dynamic pressure changes in particles of different sizes under the same concentration.
At the same particle concentration, as the flow rate rises, the shear stress of the solid–liquid two-phase flow in the pipeline steadily increases. When the lift flow rate increases, the solid particles move at a higher speed, increasing the impact and friction of particles on the pipe wall, thereby raising the shear stress on the pipe wall. At the same time, raising the flow rate increases the contact between particles and fluid, particularly near the pipe wall, which causes the particles to aggregate and raise the local concentration, influencing the viscosity and shear stress of the particles. In addition, the shear stress on the pipe wall induced by the two-phase flow at the inlet of the pipeline achieves its maximum value. Therefore, in practical engineering, emphasis should be placed on improving protection measures for the pipeline entrance.
When the particle concentration is low, the contact between particles of various sizes is relatively modest, and the shear stress distribution is generally uniform. As the height climbs, the pressure loss along the route [53] (including pipe wall friction loss, local pressure loss, and gravity pressure loss) causes the fluid to lose some kinetic energy, and the shear stress progressively diminishes. Increasing the particle concentration increases the shear stress on the pipe wall induced by two-phase flow. This is because raising the concentration of particles increases the viscosity of the solid–liquid combination and the interactions between particles and between particles and fluid boost the flow resistance. According to the flow characteristics of Newtonian fluids, the shear stress is proportional to the viscosity and the velocity gradient; hence, the increase in viscosity immediately corresponds to a boost in shear stress. Meanwhile, when the particle concentration grows, the interaction and collision frequency between particles also increase. These interactions not only raise the total resistance of the fluid but also increase the shear stress on the pipe wall.
For particles of varied sizes, bigger particles give more flow resistance to the fluid, while smaller particles fill and disperse in the flow field [24], increasing the viscous resistance of the mixed flow, resulting in increased shear stress and lower uniformity of distribution. This is because particles of different sizes are transported simultaneously, and the solid–liquid and solid–solid interactions are more intense. The consequence of shear stress on the pipe wall will have a certain influence on the safety and stability of the lifting system; therefore, it should be assured that it is within an acceptable range to optimize the lifting efficiency.

5. Conclusions

Ensuring the safety and effectiveness of pipeline systems is the most critical feature of deep-sea mining hydraulic lifting systems. Based on the CFD-DEM coupling method and combined with experimental verification, this paper studies and analyzes the dynamic characteristics of solid–liquid two–phase flow in the lifting pipeline system. The motion law of particles in the pipeline and the variables influencing the lifting performance are derived, giving a theoretical foundation for the selection of design parameters and the performance assessment of pipeline transportation systems. The primary findings are as follows:
(1)
The choice of conveying parameters and structural factors in the vertical pipeline during hydraulic lifting significantly affects the efficiency of the lifting process. More precisely, the efficiency of lifting initially improves (Q < 50 L/min) and subsequently declines (Q > 50 L/min). Additionally, the lifting efficiency varies significantly across various ranges of particle concentration. The elevation of particles with low concentrations is appropriate for lower rates of fluid flow. For medium-range particle concentrations, it is straightforward to pick a lifting flow rate of 45–65 L/min. For the lifting of high-concentration particles, a larger lifting flow rate should be chosen to overcome the interaction between particles. The size of the pipe diameter substantially impacts the lifting efficiency and the two-phase flow pattern. The greater the pipe diameter, the higher the initial lifting flow rate required. The smaller the pipe diameter, the lower the initial lifting flow rate can convey the particles to the target height, but the likelihood of obstruction is greatly increased.
(2)
Lifting flow may greatly increase particle dispersion and improve particle followability; a notably high lift flow can effectively alleviate the issue of the poor followability of big particles. The increase in lift flow may make the particles more equally scattered in the radial location, which is favorable to the velocity and pressure distribution. The increase in particle concentration will greatly increase the velocity gradient. A stronger lift flow is needed to overcome the contact between particles, resulting in a considerable local clustering effect of particles. Simultaneously, the disturbance induced by particle collision and mixing caused by variations in particle concentration has a bigger influence on dynamic pressure fluctuations and the shear stress distribution. There is an optimum lift flow corresponding to varied particle concentrations, which may improve particle dispersion.
(3)
Compared with the lifting of particles of the same size, the lifting efficiency of particles of three different sizes under the same operating circumstances is enhanced, and its followability is improved with the reduction in particle size. Furthermore, the dynamic pressure pulsation of solid–liquid two-phase flow on the pipe wall exhibits a transient spike in the initial stage. Overall, the dynamic pressure fluctuation on the wall is weakened, but the peak value is raised, and the distribution of shear stress becomes more unequal.
Several variables influence the behavior of two-phase flow during deep-sea mining operations. Ore particles exhibit non-uniformity in their spherical shape, displaying variations in both size and dimensions. Therefore, our future research will focus on the dynamics of particles of different sizes in vertical pipes.

Author Contributions

Conceptualization, T.S., H.Y. and S.C.; methodology, S.C.; software, T.S. and H.Y.; validation, T.S. and S.C.; formal analysis, T.S. and H.Y.; investigation, H.Y.; resources, S.C.; data curation, T.S., H.Y. and S.C.; writing—original draft preparation, T.S.; writing—review and editing, S.C.; visualization, S.C.; supervision, S.C.; project administration, S.C.; funding acquisition, S.C. All authors have read and agreed to the published version of the manuscript.

Funding

This research was funded by the Fundamental Research Funds for the Central Universities, grant number 3132023513.

Institutional Review Board Statement

No applicable.

Informed Consent Statement

No applicable.

Data Availability Statement

The data presented in this study are available on request from the corresponding author. The data are not publicly available due to scientific requirements.

Conflicts of Interest

The authors declare no conflicts of interest.

References

  1. Liu, X.; Yang, S.; Pang, Y. Analytical and Experimental Investigation into the Resistance of Vertical Plug Flow with Coarse Particles. Ocean Eng. 2024, 308, 118253. [Google Scholar] [CrossRef]
  2. Hein, J.R.; Mizell, K. Deep-Ocean Polymetallic Nodules and Cobalt-Rich Ferromanganese Crusts in the Global Ocean. In The United Nations Convention on the Law of the Sea, Part XI Regime and the International Seabed Authority: A Twenty-Five Year Journey; Brill|Nijhoff: Leiden, The Netherlands, 2022; pp. 177–197. [Google Scholar]
  3. Hein, J.R.; Koschinsky, A.; Kuhn, T. Deep-Ocean Polymetallic Nodules as a Resource for Critical Materials. Nat. Rev. Earth Environ. 2020, 1, 158–169. [Google Scholar] [CrossRef]
  4. Sharma, R. Deep-Sea Mining: Current Status and Future Considerations. In Deep-Sea Mining; Springer International Publishing: Cham, Switzerland, 2017; pp. 3–21. [Google Scholar]
  5. Hu, Q.; Li, Z.; Zhai, X.; Zheng, H. Development of Hydraulic Lifting System of Deep-Sea Mineral Resources. Minerals 2022, 12, 1319. [Google Scholar] [CrossRef]
  6. Abulnaga, B. Slurry Systems Handbook, 2nd ed.; McGraw-Hill: New York, NY, USA, 2021; ISBN 978-1-260-45279-2. [Google Scholar]
  7. Ren, W.L.; Zhang, X.H.; Zhang, Y.; Lu, X.B. Investigation of Motion Characteristics of Coarse Particles in Hydraulic Collection. Phys. Fluids 2023, 35, 043322. [Google Scholar] [CrossRef]
  8. Liu, S. Status and Progress on Researches and Developments of Deep Ocean Mining Equipments. J. Mech. Eng. 2014, 50, 8. [Google Scholar] [CrossRef]
  9. Li, Y.; Cao, J.; Xie, C. Research on the Wear Characteristics of a Bend Pipe with a Bump Based on the Coupled CFD-DEM. J. Mar. Sci. Eng. 2021, 9, 672. [Google Scholar] [CrossRef]
  10. Hosokawa, S.; Tomiyama, A. Turbulence Modification in Gas–Liquid and Solid–Liquid Dispersed Two-Phase Pipe Flows. Int. J. Heat Fluid Flow 2004, 25, 489–498. [Google Scholar] [CrossRef]
  11. Uzi, A.; Levy, A. Flow Characteristics of Coarse Particles in Horizontal Hydraulic Conveying. Powder Technol. 2018, 326, 302–321. [Google Scholar] [CrossRef]
  12. Zhou, M.; Kuang, S.; Xiao, F.; Luo, K.; Yu, A. CFD-DEM Analysis of Hydraulic Conveying Bends: Interaction between Pipe Orientation and Flow Regime. Powder Technol. 2021, 392, 619–631. [Google Scholar] [CrossRef]
  13. Liu, Y.; Chen, L. Numerical Investigation on the Pressure Loss of Coarse Particles Hydraulic Lifting in the Riser with the Lateral Vibration. Powder Technol. 2020, 367, 105–114. [Google Scholar] [CrossRef]
  14. Arolla, S.K.; Desjardins, O. Transport Modeling of Sedimenting Particles in a Turbulent Pipe Flow Using Euler–Lagrange Large Eddy Simulation. Int. J. Multiph. Flow 2015, 75, 1–11. [Google Scholar] [CrossRef]
  15. Chen, Q.; Xiong, T.; Zhang, X.; Jiang, P. Study of the Hydraulic Transport of Non-Spherical Particles in a Pipeline Based on the CFD-DEM. Eng. Appl. Comput. Fluid Mech. 2020, 14, 53–69. [Google Scholar] [CrossRef]
  16. Yang, H.; Liu, S. Measuring Method of Solid-Liquid Two-Phase Flow in Slurry Pipeline for Deep-Sea Mining. Thalass Int. J. Mar. Sci. 2018, 34, 459–469. [Google Scholar] [CrossRef]
  17. Zhou, M.; Wang, S.; Kuang, S.; Luo, K.; Fan, J.; Yu, A. CFD-DEM Modelling of Hydraulic Conveying of Solid Particles in a Vertical Pipe. Powder Technol. 2019, 354, 893–905. [Google Scholar] [CrossRef]
  18. Teng, S.; Kang, C.; Ding, K.; Li, C.; Zhang, S. CFD-DEM Simulation of the Transport of Manganese Nodules in a Vertical Pipe. Appl. Sci. 2022, 12, 4383. [Google Scholar] [CrossRef]
  19. Zhang, Y.; Lu, X.-B.; Zhang, X.-H. Numerical Simulation on Transportation Behavior of Dense Coarse Particles in Vertical Pipe with an Optimized Eulerian–Lagrangian Method. Phys. Fluids 2022, 34, 033305. [Google Scholar] [CrossRef]
  20. Wan, C.; Xiao, S.; Zhou, D.; Zhu, H.; Bao, Y.; Li, T.; Tu, J.; Kyazze, M.S.; Han, Z. Numerical Analysis of Coarse Particle Two-Phase Flow in Deep-Sea Mining Vertical Pipe Transport with Forced Vibration. Ocean Eng. 2024, 301, 117550. [Google Scholar] [CrossRef]
  21. van Wijk, J.M.; Talmon, A.M.; van Rhee, C. Stability of Vertical Hydraulic Transport Processes for Deep Ocean Mining: An Experimental Study. Ocean Eng. 2016, 125, 203–213. [Google Scholar] [CrossRef]
  22. Zhao, G.; Xiao, L.; Peng, T.; Zhang, M. Experimental Research on Hydraulic Collecting Spherical Particles in Deep Sea Mining. Energies 2018, 11, 1938. [Google Scholar] [CrossRef]
  23. Lian, Z.; Tieli, W.; Wenqiang, H. Study on Velocity Distribution of Large Particle in Vertical Slurry Pipeline. Meas. Control 2019, 52, 1282–1288. [Google Scholar] [CrossRef]
  24. Dai, Y.; Zhang, Y.; Li, X. Numerical and Experimental Investigations on Pipeline Internal Solid-Liquid Mixed Fluid for Deep Ocean Mining. Ocean Eng. 2021, 220, 108411. [Google Scholar] [CrossRef]
  25. Sun, D.; Liu, H. A Probability Model for Predicting the Slip Velocity of Large Particles in Vertical Pipes. Powder Technol. 2022, 397, 117102. [Google Scholar] [CrossRef]
  26. Amudha, K.; Bhattacharya, S.K.; Sharma, R.; Gopkumar, K.; Kumar, D.; Ramadass, G.A. Influence of Flow Area Zone and Vertical Lift Motion of Polymetallic Nodules in Hydraulic Collecting. Ocean Eng. 2024, 294, 116745. [Google Scholar] [CrossRef]
  27. Liu, L.; Liu, J.; Li, X.; Xu, L.; Zhang, X. Experimental Investigation on Vertical Hydraulic Transport of Ores in Deepsea Mining. China Ocean Eng. 2024, 38, 42–53. [Google Scholar] [CrossRef]
  28. Liu, L.; Yang, J.; Lu, H.; Tian, X.; Lu, W. Numerical Simulations on the Motion of a Heavy Sphere in Upward Poiseuille Flow. Ocean Eng. 2019, 172, 245–256. [Google Scholar] [CrossRef]
  29. Crowe, C.T.; Schwarzkopf, J.D.; Sommerfeld, M.; Tsuji, Y. Multiphase Flows with Droplets and Particles; CRC Press: Boca Raton, FL, USA, 2011; ISBN 9780429106392. [Google Scholar]
  30. Sippola, P.; Kolehmainen, J.; Ozel, A.; Liu, X.; Saarenrinne, P.; Sundaresan, S. Experimental and Numerical Study of Wall Layer Development in a Tribocharged Fluidized Bed. J. Fluid Mech. 2018, 849, 860–884. [Google Scholar] [CrossRef]
  31. Sun, R.; Xiao, H. SediFoam: A General-Purpose, Open-Source CFD–DEM Solver for Particle-Laden Flow with Emphasis on Sediment Transport. Comput. Geosci. 2016, 89, 207–219. [Google Scholar] [CrossRef]
  32. Chen, G.; Schott, D.L.; Lodewijks, G. Sensitivity Analysis of DEM Prediction for Sliding Wear by Single Iron Ore Particle. Eng. Comput. 2017, 34, 2031–2053. [Google Scholar] [CrossRef]
  33. Deng, L.; Hu, Q.; Chen, J.; Kang, Y.; Liu, S. Particle Distribution and Motion in Six-Stage Centrifugal Pump by Means of Slurry Experiment and CFD-DEM Simulation. J. Mar. Sci. Eng. 2021, 9, 716. [Google Scholar] [CrossRef]
  34. Zeng, J.; Tang, P.; Li, H.; Zhang, D. Simulating Particle Settling in Inclined Narrow Channels with the Unresolved CFD-DEM Method. Phys. Rev. Fluids 2021, 6, 034302. [Google Scholar] [CrossRef]
  35. Zhang, Y.; Lu, X.-B.; Zhang, X.-H. An Optimized Eulerian–Lagrangian Method for Two-Phase Flow with Coarse Particles: Implementation in Open-Source Field Operation and Manipulation, Verification, and Validation. Phys. Fluids 2021, 33, 113307. [Google Scholar] [CrossRef]
  36. Di Felice, R. The Voidage Function for Fluid-Particle Interaction Systems. Int. J. Multiph. Flow 1994, 20, 153–159. [Google Scholar] [CrossRef]
  37. Guo, P.; Kaiser, F.; Rival, D.E. Vortex-Wake Formation and Evolution on a Prolate Spheroid at Subcritical Reynolds Numbers. Exp. Fluids 2023, 64, 167. [Google Scholar] [CrossRef]
  38. Bureau, L.; Coupier, G.; Salez, T. Lift at Low Reynolds Number. Eur. Phys. J. E 2023, 46, 111. [Google Scholar] [CrossRef]
  39. Chen, X.; Sreenivasan, K.R. Reynolds Number Asymptotics of Wall-Turbulence Fluctuations. J. Fluid Mech. 2023, 976, A21. [Google Scholar] [CrossRef]
  40. Chen, J.; Wu, J. Numerical Investigation of Vortex-Induced Vibration of a Porous-Coated Cylinder at Subcritical Reynolds Number with a Combined k-ε Model for Porous Medium. Ocean Eng. 2024, 304, 117828. [Google Scholar] [CrossRef]
  41. Eboibi, O.; Eboibi, B.E.; Danao, L.A.M. Solidity Effects and Azimuth Angles on Flow Field Aerodynamics and Performance of Vertical Axis Wind Turbines at Low Reynolds Number. Sci. Afr. 2024, 24, e02215. [Google Scholar] [CrossRef]
  42. Engelmann, H.E. Vertical Hydraulic Lifting of Large-Size Particles—A Contribution To Marine Mining. In Proceedings of the Offshore Technology Conference, Houston, TX, USA, 8 April 1978. [Google Scholar]
  43. Di Renzo, A.; Di Maio, F.P. Comparison of Contact-Force Models for the Simulation of Collisions in DEM-Based Granular Flow Codes. Chem. Eng. Sci. 2004, 59, 525–541. [Google Scholar] [CrossRef]
  44. Alajbegović, A.; Assad, A.; Bonetto, F.; Lahey, R.T. Phase Distribution and Turbulence Structure for Solid/Fluid Upflow in a Pipe. Int. J. Multiph. Flow 1994, 20, 453–479. [Google Scholar] [CrossRef]
  45. Lusty, P.A.J.; Murton, B.J. Deep-Ocean Mineral Deposits: Metal Resources and Windows into Earth Processes. Elements 2018, 14, 301–306. [Google Scholar] [CrossRef]
  46. Rahmani, M.; Wachs, A. Free Falling and Rising of Spherical and Angular Particles. Phys. Fluids 2014, 26, 083301. [Google Scholar] [CrossRef]
  47. Yamazaki, T. Fundamental Geotechnical Considerations for Design of Deep-Sea Mining Systems. In Deep-Sea Mining; Springer International Publishing: Cham, Switzerland, 2017; pp. 259–304. [Google Scholar]
  48. Zhang, Y.; Dai, Y.; Zhu, X. Numerical Investigation of Recommended Operating Parameters Considering Movement of Polymetallic Nodule Particles during Hydraulic Lifting of Deep-Sea Mining Pipeline. Sustainability 2023, 15, 4248. [Google Scholar] [CrossRef]
  49. Kim, M.G.; Hyeong, K.; Yoo, C.M.; Lee, J.Y.; Seo, I. Characterization of Fines Produced by Degradation of Polymetallic Nodules from the Clarion–Clipperton Zone. Minerals 2021, 11, 205. [Google Scholar] [CrossRef]
  50. Hu, Q.; Zou, L.; Lv, T.; Guan, Y.; Sun, T. Experimental and Numerical Investigation on the Transport Characteristics of Particle-Fluid Mixture in Y-Shaped Elbow. J. Mar. Sci. Eng. 2020, 8, 675. [Google Scholar] [CrossRef]
  51. Miedema, S.A. A Head Loss Model for Homogeneous Slurry Transport for Medium Sized Particles. J. Hydrol. Hydromech. 2015, 63, 1–12. [Google Scholar] [CrossRef]
  52. Song, Y.; Zhu, X.; Sun, Z.; Tang, D. Experimental Investigation of Particle-Induced Pressure Loss in Solid–Liquid Lifting Pipe. J. Cent. South Univ. 2017, 24, 2114–2120. [Google Scholar] [CrossRef]
  53. Zhou, J.; Du, C.; Liu, S.; Liu, Y. Comparison of Three Types of Swirling Generators in Coarse Particle Pneumatic Conveying Using CFD-DEM Simulation. Powder Technol. 2016, 301, 1309–1320. [Google Scholar] [CrossRef]
Figure 1. Hydraulic lifting schematic diagram.
Jmse 12 01409 g001
Figure 2. Schematic diagram of CFD-DEM coupling principles.
Jmse 12 01409 g002
Figure 3. Collision model between particles in DEM.
Jmse 12 01409 g003
Figure 4. Computational domain and local grid division.
Jmse 12 01409 g004
Figure 5. Layout of experimental equipment.
Jmse 12 01409 g005
Figure 6. Image of physical particles.
Jmse 12 01409 g006
Figure 7. Experimental and simulated comparison of the particle outlet flow rate changing with Q.
Jmse 12 01409 g007
Figure 8. The impact of pipe diameter on particle outlet flow rate.
Jmse 12 01409 g008
Figure 9. Distribution of particles of different sizes in the pipeline.
Jmse 12 01409 g009
Figure 10. Local concentration fluctuations of particles under varied operation circumstances.
Jmse 12 01409 g010
Figure 11. Radial distribution of particles in the lifting pipeline under different working conditions.
Jmse 12 01409 g011
Figure 12. The impact of varied flow rates on local particle concentration.
Jmse 12 01409 g012
Figure 13. The variation law of particle slip velocity with increasing flow rate.
Jmse 12 01409 g013
Figure 14. The variation law of particle outlet velocity with increasing flow rate.
Jmse 12 01409 g014
Figure 15. Velocity cloud map of mixed flow zone particle phase longitudinal profile under various operating conditions.
Jmse 12 01409 g015
Figure 16. Velocity cloud map of mixed flow zone particle phase cross-sections (z = 1.5 m) under various operating conditions.
Jmse 12 01409 g016
Figure 17. Particle lifting of the same size, velocity variation of particles at different positions.
Jmse 12 01409 g017
Figure 18. Particle lifting of the various sizes, and velocity variations of particles at different positions.
Jmse 12 01409 g018
Figure 19. Velocity cloud map of mixed flow zone liquid-phase longitudinal profile under various operating conditions.
Jmse 12 01409 g019
Figure 20. Velocity cloud map of mixed flow zone liquid-phase cross-sections (z = 1.5 m) under various operating conditions.
Jmse 12 01409 g020aJmse 12 01409 g020b
Figure 21. Dynamic pressure changes on vertical pipes under different working conditions.
Jmse 12 01409 g021
Figure 22. Wall shear stress cloud maps of the mixed flow zone under various operating conditions.
Jmse 12 01409 g022
Table 1. Interaction parameters between materials.
MaterialRecovery FactorStatic Friction CoefficientRolling Friction Coefficient
Particle–particle0.480.100.01
Particle–wall surface0.450.280.01
Table 2. Hydraulic lifting system parameters.
Experimental EquipmentParameterValue
Lift water pumpMotor modelQD3–50/3–1.5
Power (kW)1.5
Maximum boost flow (m3/h)3
Maximum lift (m)50
Turbine flow meterMeasuring range (L/min)9–110
Calculation accuracy±0.5%
Work pressure (Bar)≤20
Pipeline parametersPipe diameter (mm)30, 40, 50
Wall thickness (mm)5
Pipe length (m)2.5
Experimental poolPool parameters (m)5 × 3 × 2.5
Depth of water (m)2
Disclaimer/Publisher’s Note: The statements, opinions and data contained in all publications are solely those of the individual author(s) and contributor(s) and not of MDPI and/or the editor(s). MDPI and/or the editor(s) disclaim responsibility for any injury to people or property resulting from any ideas, methods, instructions or products referred to in the content.

