Abstract
As part of the strategy to achieve net-zero Greenhouse Gas (GHG) emissions in international maritime shipping, there is ongoing exploration into the use of wind propulsion systems as auxiliary ship propulsion devices. When considering a rigid sail as the wind propulsion system, evaluating the performance of a single sail is relatively simple. However, assessing the performance of multiple sails is more challenging due to the interference between the sails and between the sails and the hull. In this study, the thrust characteristics of two rigid sails attached to a ship are investigated by using Computational Fluid Dynamics (CFD). This includes considering the interference effects between the sails themselves and between the sails and the hull. The research reveals the innovative optimized angle of attack for maximizing thrust under tailwind conditions. At 150° in relative wind direction, the best performance is achieved with a low angle of attack on the fore side sail and a high angle of attack on the aft side sail. At 180° in relative wind direction, a high angle of attack on the fore side sail and a low angle of attack on the aft side sail yield the best results. Here, a “low” angle of attack means that the lift force is greater than the drag force, while a “high” angle of attack means the drag force is greater than the lift force. In this study, the force in the ship’s forward direction is only focused on optimizing the angles of attack of the two sails. However, the side forces caused by the sails are also significant for the ship’s sailing conditions. Therefore, future work will involve optimizing the angles of attack under drifting conditions.
1. Introduction
In 2023, the International Maritime Organization (IMO) revisited the Greenhouse Gas (GHG) reduction target adopted in 2018. The old goal was to reduce GHG emissions by at least 50% by 2050 [1]. The new goal was set to achieve net-zero GHG emissions by 2050 [2]. One strategy under consideration for meeting this goal is the use of wind propulsion systems as auxiliary propulsion for large cargo ships. Khan et al. [3] focused on three wind-assisted propulsion technologies—sails, rotors, and kites—and provide a detailed analysis of their respective advantages and risks. The “Wind Challenger” [4] project involves designing a rigid sail made of CFRP composite materials that can rotate 360° and extend or retract according to wind direction. Marco et al. [5] developed design tools to utilize Flettner rotors as an auxiliary propulsion system for ships and are evaluating their performance. Cadalen et al. [6] researched the modeling and control of tethered kites that utilize wind power to serve as auxiliary propulsion systems for ships. However, studies on fully wind-powered commercial cargo ships are few.
The realization of fully wind-powered commercial vessels faces several challenges, including economic viability, safety, and operation. Autonomous operation is one solution that could address these issues. Felski et al. [7] provided a detailed analysis of the challenges and threats of unmanned ships at sea, based on data obtained from actual navigation tests. If ships could operate unmanned, it would eliminate the need for living quarters and safety equipment on deck. It allows for a new aerodynamically optimized ship design that maximizes the effectiveness of wind propulsion systems.
When considering a rigid wing sail as a wind propulsion device, evaluating the performance of a single sail is relatively easy, with its performance assessed through Computational Fluid Dynamics (CFD) and model tests [8]. However, evaluating the performance of multiple wing sails is more complex due to additional factors such as the positioning and angle of attack of the sails.
In the case of multiple rigid sails, Li et al. [9] analyzed the aerodynamic interactions of cascade rigid sails, but they do not mention the optimal angle of attack for each sail in a tailwind condition. Bordogna [10] conducted wind tunnel tests with two rectangular rigid sails placed at intervals of 2.5 and 4 times the sail chord length. The tests identified the optimized angle of attack for each sail to maximize thrust under the given wind conditions. Bordogna [10] set the angle of attack for the upwind sail to maximize its thrust, and afterward did the same for the downwind sail. However, the results show that the presence of the downwind sail increases the thrust of the upwind sail. This indicates that the thrust of the upwind sail is changed by the influence of the downwind sail. Thus, this method of setting angles does not yield the optimized angles. Additionally, Fujiwara et al. [11] conducted wind tunnel tests to investigate the sail–sail and sail–hull interaction effects. It shows that when multiple sails are combined, the thrust generated by each sail generally decreases compared to a single sail, due to mutual interference effects. When evaluating sail performance, it is necessary to consider the interference effects with the hull.
Therefore, in this study, the characteristics of thrust due to two rigid wing sails attached to a hull, which includes the aerodynamic interactions between the sails and between the sails and the hull, are investigated by using CFD. Section 1 outlines the background and objectives of this study. Section 2 gives a detailed overview of the hull and the rigid wing sail studied in this research. Section 3 investigates the optimized angle of attack for a single-wing sail attached to the hull to achieve maximum thrust. Section 4 examines the optimized angles of attack for two wing sails attached to the hull to achieve maximum thrust. Section 5 presents the conclusions and proposes a novel configuration of angles of attack for the two wing sails in following wind conditions.
2. Rigid Wing Sail and Hull
2.1. Coordinate System and Notation
Figure 1 shows the coordinate system including two rigid wing sails attached to a hull. The sail located on the fore of the ship is referred to as Sail-1 and the other as Sail-2. Additionally, Table 1 shows descriptions of the symbols used in this paper.
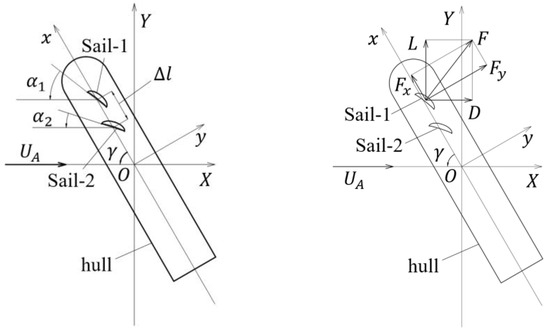
Figure 1.
Coordinate system and location of two rigid wing sails on the hull.

Table 1.
Nomenclature.
2.2. Validation of Rigid Wing Sail Performance
Figure 2 shows the shape of the rigid wing sail on the left and in the middle. This is the same model used by Kanai et al. [12], and its wing profile is obtained from the figure in the reference [12]. The chord length is 20 m, and height is 50 m.
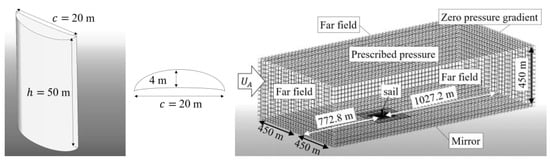
Figure 2.
Left and middle: the shape and the sectional view of a rigid wing sail, right: the computational domain for the single wing sail.
The calculated performance of the single rigid wing sail in uniform flow by CFD is validated by comparing the calculated results by Kanai et al. [12]. At 10 m/s in flow velocity , the angle of attack is changed from 0 to 90° to calculate lift and drag , and the lift coefficient and drag coefficient are obtained by using Formula (1);
where air density is 1.226 and is the wing sail projection area.
The computational domain for the single sail is shown on the right of Figure 2. Table 2 shows the CFD simulation setting, which is determined with reference to the ITTC Recommended Procedures and Guidelines (hereafter, ITTC RP) 7.5-03-02-05 [13]. The Reynold’s number is calculated by Formula (2), where is 10 m/s, the ship’s length is 300 m, and the kinematic viscosity is 1.456 .
Table 2.
CFD calculation setting for the single-wing sail.
Figure 3 shows the comparisons of the CFD results of and . The calculated results in this study are in agreement with the results by Kanai et al. [12], suggesting an accurate replication of the wing sail shape.
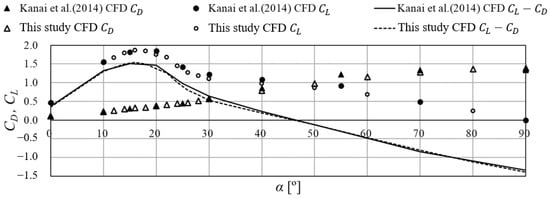
Figure 3.
CFD results of CL and CD for a rigid sail compared with the results of Kanai et al. [12].
From the same figure, it is observed that surpasses at around 45°. Hereafter, angles of attack where lift is greater than drag (approximately less than 45°) are referred to as “low angles of attack”, and vice versa as “high angles of attack”.
Formula (3) expresses the thrust coefficient of the single-wing sail in relation to each relative wind direction , employing and from Formula (1). Figure 4 shows the optimized angle of attack at which is maximized and the corresponding value of . When is less than 140°, most of the thrust is generated by the lift. Conversely, when is above 150°, most of the thrust is generated by the drag. Thus, increases sharply at is 150°.
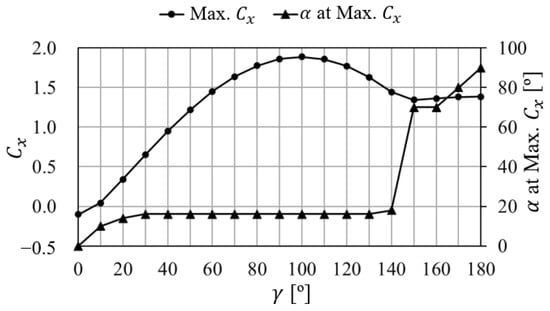
Figure 4.
Maximum Cx and α at the maximum Cx of the single rigid sail.
2.3. Hull Design
This research assumes a near-future scenario of fully wind-powered, autonomously operated large cargo ships, utilizing only rigid wing sails for propulsion. It does not consider any superstructures on deck. It is expected that the ship’s speed is quite low because the vessel is driven only by rigid wing sails. Therefore, the chosen vessel type is a Cape-size Bulker. It does not need a higher speed than other ship types. Figure 5 and Table 3 show a body plan and the main dimensions, respectively. This hull design is inspired by the yacht design [15]. In evaluating the performance of the wing sail, interference with the hull is considered; hence, the wing sail is attached to the hull. However, the aerodynamic analysis focuses only on the area above the waterline, excluding the underwater hull shape.
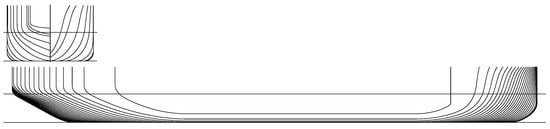
Figure 5.
Body plan of the hull designed by Akane Yasuda.
Table 3.
Principle particulars of the hull.
3. Optimization of Angle of Attack of a Single Wing Sail Attached to a Hull
To investigate the aerodynamic interaction between a hull and a wing sail, of the wing sail attached to the hull is systematically changed in 2° increments at = 0, 60, 90, 120, 150, and 180°. The goal is to identify the that maximizes . Figure 6 shows the position of the rigid wing sail relative to the hull, located at 277.2 m from the Aft Perpendicular (hereafter, AP), which is 4 m fore from the aft end of this hull, along the centerline of the hull. Just like the “Wind Challenger” [4], the sail is attached as close to the bow as possible. As indicated by Ouchi et al. [4], the lower surface of the wing sail is attached to the hull through a supporting structure. For simplicity, the effect of the supporting structure is assumed to be negligibly small, and the wing sail is attached directly to the hull.
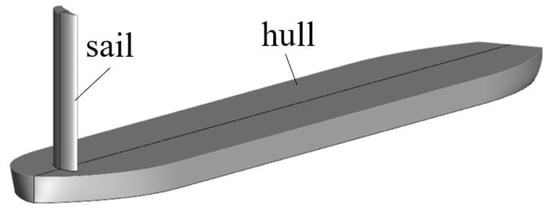
Figure 6.
Configuration of the hull and the sail.
3.1. CFD Calculation Settings for the Wing Sail Attached to the Hull
The CFD calculation settings are almost the same as those for the single-wing sail (Table 2), except for the number of grid points, which is about 2 million. The computational grid for each and is generated separately. The computational domain is set as follows: in the X-direction ±3 , Y-direction ±1.5 , and Z-direction upwards from the water surface 1.5 , with the midship position at the water surface as the origin, as shown in Figure 1. Figure 7 shows the computational domain. Figure 8 shows the vertical inflow wind speed distribution at the inflow boundary surfaces (minimum X surface, maximum Y surface, and minimum Y surface in Figure 7). Below 300 m in the Z-direction, follows the recommended wind speed distribution Formula (4) by Kume et al. [16], and above 300 m, is constant. The relative wind speed at 10 m is set to 10 m/s. , the representative height from the water surface to the top of the wing sail, is 58.5 m, and , the representative wind speed calculated, based on ITTC RP [13] formula (5), is 11.007 m/s. and are non-dimensionalized using . The boundary condition for the bottom surface (sea surface) of the computational domain is Slip. No boundary refined mesh is on the hull surface, whereas for the wing sail surface, a refined mesh with = 50 is established in the boundary layers.
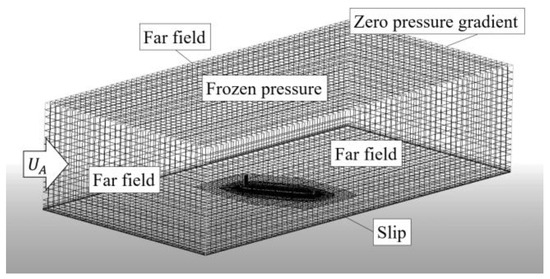
Figure 7.
Grid of the computational domain (γ = 60°, α = 16°).
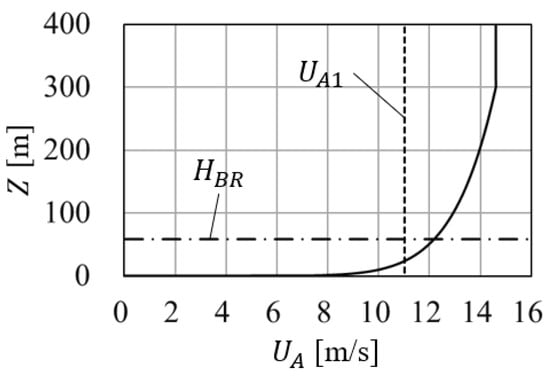
Figure 8.
Input the vertical distribution of UA.
3.2. Results of the Optimized Angle of Attack for the Wing Sail Attached to the Hull
Figure 9 shows the that maximizes for each for the wing sail attached to the hull and the maximum value of . For comparison, the dotted line represents the values for the single-wing sail shown in Figure 4. The optimized angle of attack for the wing sail attached to the hull is 24° at = 120°, which is 8° higher than the optimized angle of 16° for the single wing sail. Figure 10 shows , , and for = 120°, both with and without the hull. The stall angle for the single-wing sail is around 16°, but it relaxes to around 24° when the sail is attached to the hull. The inflow direction to the wing sail is changed due to the hull and may not be the same as the wind direction. This is presumed to decrease the apparent angle of attack. These results indicate that the changed inflow to the wing sail changes the optimized angle of attack due to the interference with the hull. Therefore, it is necessary to consider the impact of the hull when examining the optimized angle of attack. , the maximum value for the wing sail attached to the hull at each , is determined as the reference for evaluating the thrust of the two wing sails in Section 4. Table A1 in Appendix A shows the values of .
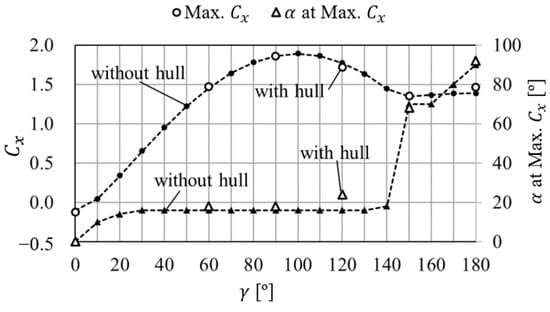
Figure 9.
Maximum Cx and α at the maximum Cx of a rigid sail with/without the hull.
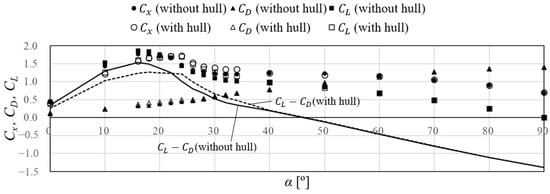
Figure 10.
Cx of the rigid sail with/without the hull (γ = 120°).
4. Optimization of Angles of Attack for Two Wing Sails Attached to a Hull
To maximize due to two wing sails attached to the hull, their angles of attack are optimized. Figure 11 shows the attached positions of the rigid wing sails to the hull. The sails are attached to the centerline of the hull. The first sail (Sail-1) is fore 277.2 m from AP. The second sail (Sail-2) is two different aft distances from Sail-1, which are 2 and 4, to investigate the effects of sail spacing . These configurations refer to Bordogna’s [10] wind tunnel tests conducted with two different wing sail spacings, which are 2.5 and 4. The lift coefficients of Sail-1 and Sail-2 are denoted as and , respectively, with similar notations for drag (, ) and thrust (, ) coefficients. The average values of these coefficients of the two sails are , , and , respectively.
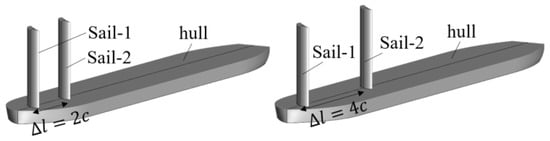
Figure 11.
Configuration of the hull and the two sails.
4.1. CFD Calculation Settings for Two Wing Sails Attached to the Hull
The CFD calculation settings are almost the same as those for the single-wing sail attached to the hull (refer to Section 3.1), except for the number of grid points, which is about 2.6 million. To maximize , and , are changed every 2° from the optimal angle of attack for a single-wing sail, as shown in Figure 9.
The grid convergence study is conducted by using three different grid sizes. This analysis method is based on ITTC RP 7.5-03-01-01 [17]. The grid convergence was checked in = 60°, = 16°, and = 16°. The grid size is changed by refinement ratio . Table 4 shows the number of cells and the results of for each grid.
Table 4.
The number of cells and the results of for each grid.
In this study, the convergence ratio is calculated by Formula (6) [17]. This value () shows the condition is monotonic convergence [17]. For this condition, the error , one-term estimates for error , the order of accuracy and the correction factor are calculated by Formulas (7)–(10) [17], respectively. Where is the estimate for limiting order of accuracy, which is two in this calculation. The corrected uncertainty is estimated by Formula (11) [17]. The corrected simulation result is estimated by Formula (12) [17]. Table 5 shows the calculated values. The numerical uncertainty is smaller than 1%.
Table 5.
The calculated values for the grid convergence study.
4.2. Results of the Optimized Angles of Attack
Figure 12 shows the optimized angles of attacks for each wing sail at = 0, 60, 90, 120, 150, and 180° for the different distances between Sail-1 and Sail-2, to maximize due to two wing sails. Both results are similar, and the maximum difference between them is 8° of at = 180; therefore, the effects of on the optimized angles of attack are not significant. From the comparisons between the results and the results with Bordogna’s wind tunnel tests [10], it is found that they are almost the same for = 0 to 120° but different for = 150 to 180° (for more details, see Section 4.2.5 and Section 4.2.6).
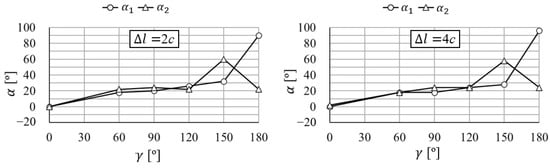
Figure 12.
Optimized α1 and α2.
Figure 13 shows the at the optimized angles of attack for two wing sails attached to the hull. = 2 is more advantageous than = 4 for = 60°, which is a diagonal headwind. But for = 150°, which is a diagonal tailwind, = 4 tends to be more advantageous than = 2.
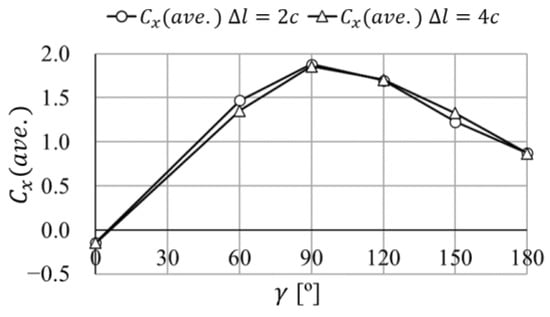
Figure 13.
Maximized Cx(ave.) of the two sails attached to the hull.
The following Section 4.2.1, Section 4.2.2, Section 4.2.3, Section 4.2.4, Section 4.2.5 and Section 4.2.6 explain the effects of changes in and on . The ranges of and are examined with reference to Figure 12. The following results indicate that changing and by every 2° makes a small change in the value of around the optimized angles of attack for two wing sails; however, the changes also include uncertainties in calculations. Therefore, it is meaningless to decide the exact optimized angles of attack in 2° increments. It is noted that the rough range of optimized angles of attack, which is around 5°, is important for this study.
4.2.1. γ = 0°
Figure 14 shows the ratio of to due to changes in and , expressed as a percentage. According to Figure 9 and Figure 13, both and have negative values, indicating that the wing sails are contributing to drag. This means the smaller ratio to , the larger the . The optimized angles of attack to maximize are = 0° and = 0° for = 2, and = 0° and = 2° for = 4.
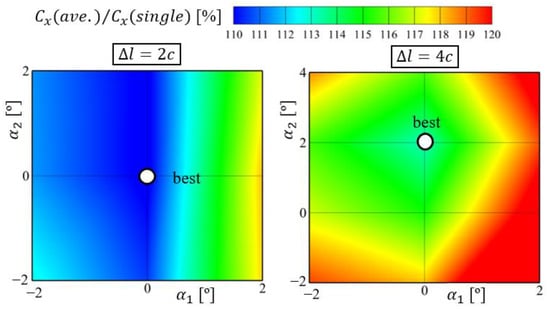
Figure 14.
Cx(ave.) of two sails for γ = 0°.
4.2.2. γ = 60°
Figure 15 shows the ratio of to as same as Figure 14. The optimized angles of attack that maximize are = 18° and = 22° for = 2, and = 18° and = 18° for = 4.
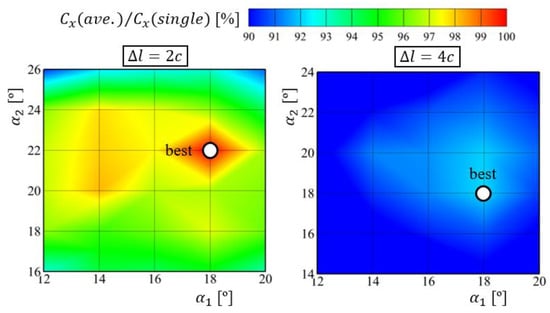
Figure 15.
Cx(ave.) of two sails for γ = 60°.
4.2.3. γ = 90°
Figure 16 shows the ratio of to as same as Figure 14. The optimized angles of attack that maximize are = 20° and = 24° for = 2, and = 18° and = 24° for = 4.
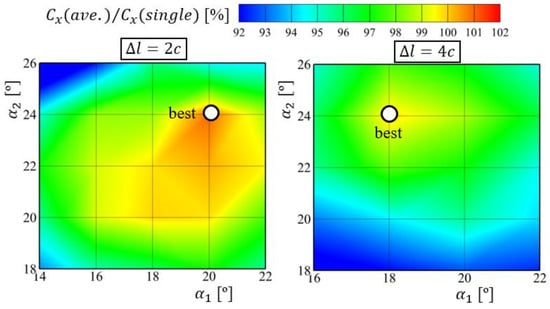
Figure 16.
Cx(ave.) of two sails for γ = 90°.
4.2.4. γ = 120°
Figure 17 shows the ratio of to as same as Figure 14. The optimized angles of attack that maximize are = 26° and = 22° for = 2, and = 24° and = 24° for = 4.
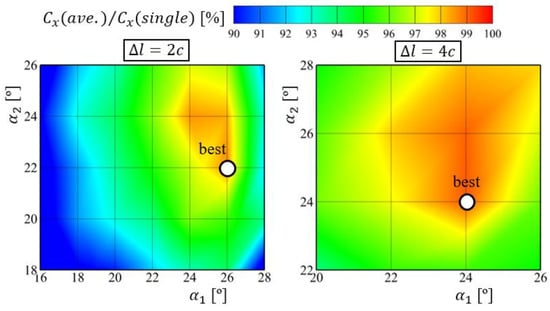
Figure 17.
Cx(ave.) of two sails for γ = 120°.
4.2.5. γ = 150°
According to Formula (3), both lift and drag acting on the wing sail are converted into thrust. Although the drag has a larger contribution to thrust, the contribution from lift is not marginal. Therefore, the first step is to decide whether to optimize and for low angles of attack to leverage lift or high angles of attack to leverage drag. For the second step, the optimized and are investigated within this limited range.
Figure 18 shows , , and when is fixed at 26° as a typical low angle of attack and is changed. For both = 2 and = 4, increases due to an increase in . After reaching the maximum at = 60°, decreases at = 70° due to a decrease in caused by aerodynamic interference between the sails.
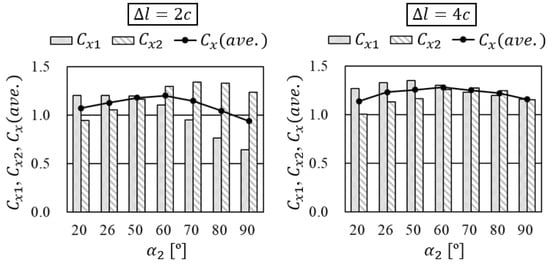
Figure 18.
of the two sails ( = 26°, = 150°).
Figure 19 shows , , and when is fixed at 60° as a typical high angle of attack, and is changed. At = 2, shows a peak at = 30° and does not increase with higher . However, at = 4, reaches its maximum at = 70°. These results indicate a difference in behavior depending on .
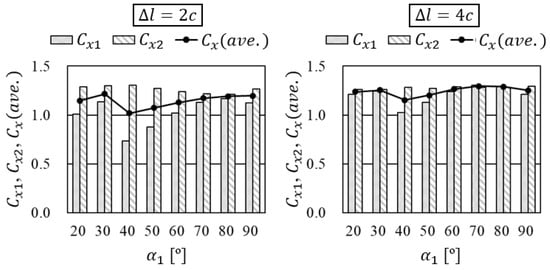
Figure 19.
of the two sails ( = 60°, = 150°).
Figure 20 shows the pressure distribution and streamlines at a height of 25 m (=/2) from the hull deck when and are changed. For = = 26°, Sail-1 is positioned in the wake of Sail-2. It makes negative pressure areas larger and higher. Thus surpasses . For = = 60°, Sail-2 is located on the windward side. becomes the main component of , making higher than . For = 30° and = 60°, the flow separation caused by Sail-2 leads to higher compared to = = 60°. This is thought to be because there is no Sail-1 located behind Sail-2 relative to the direction of the incoming flow. Sail-1, located in the wake of Sail-2, experiences an increase in relative angle of attack, thus increasing . The interaction between Sail-1 and Sail-2 significantly influences and , as shown by the pressure distribution and streamlines. For both = 2 and = 4, optimized angles of attack for maximizing are likely around = 30° and = 60° or = 70° and = 60°.
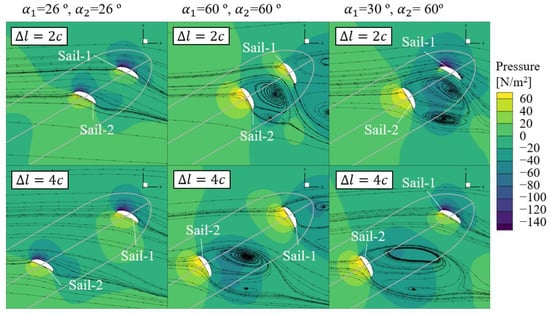
Figure 20.
Pressure distribution and streamlines at 25 m above from the hull deck (γ = 150°).
Figure 21 shows the ratio of to as same as Figure 14. The optimized angles of attack for maximizing are = 32° and = 60° for = 2, and = 28° and = 58° for = 4.
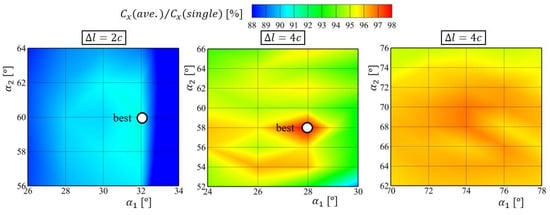
Figure 21.
of two sails for = 150°.
Figure 22 shows the pressure distribution and streamlines at 25 m (=/2) from the hull deck at optimized angles of attack. Here, setting the aft side sail at a high angle of attack for high resistance and the fore side sail at a low angle of attack for high lift is referred to as an “L-shaped arrangement” (see Section 2.2 for definitions of high and low angles of attack). This differs from Bordogna’s wind tunnel test results [10], where maximum thrust is achieved around both sails at 60°. One possible reason for the discrepancy could be the difference in airfoil shapes. The effectiveness of the L-shaped arrangement seems to stem from the increased relative angle of attack on the fore side sail due to the flow separation of the aft side sail. Different airfoil shapes could alter the flow field, potentially making the L-shaped arrangement less effective. As shown in Figure 19, the effectiveness of the L-shaped arrangement decreases with an increase in from 2 to 4, likely because larger reduces the aerodynamic interference between the sails.
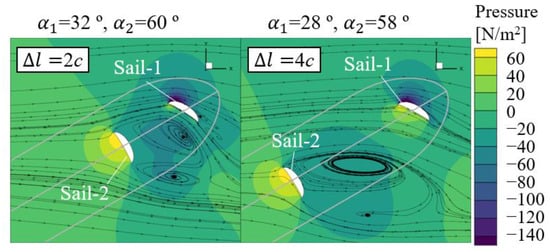
Figure 22.
Pressure distribution and streamlines at 25 m above from the hull deck ( = 150°, optimized and ).
To examine the impact of the sail positions relative to the hull on , Figure 23 shows , , and for six cases where Sail-1’s x-position is changed from 77.2 m to 277.2 m from the AP in 40 m increments, keeping = 2. The closer the two sails are positioned towards the stern, the higher the . Figure 24 shows the pressure distribution and streamlines at 25 m (=/2) from the hull deck with Sail-1’s x-position at 77.2 m and 277.2 m for = 32° and = 60°. Positioning both sails closer to the stern results in a larger positive pressure area for Sail-2 and a wider area with pressure below −40 N/m2 in the wake compared to when placed more towards the bow. This suggests that sails positioned closer to the stern benefit from higher inflow velocities due to less deceleration by the hull, effectively enhancing in downwind conditions.
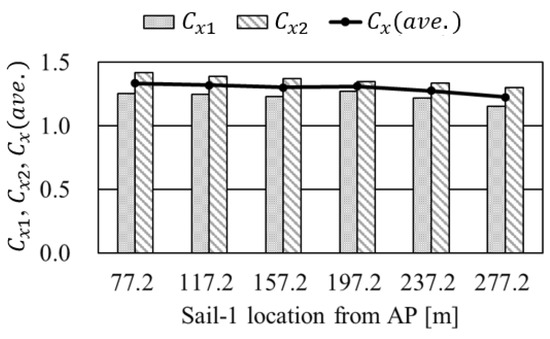
Figure 23.
, , and of the two sails ( = 150°, , = 32°, = 60°).
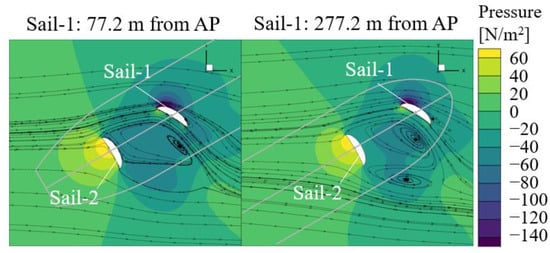
Figure 24.
Pressure distribution and streamlines at 25 m above from the hull deck ( = 150°, , = 32°, = 60°).
4.2.6. γ = 180°
Figure 25 shows , , and for three cases: = = 90°, = 90° and = 0°, and = 0° and = 90°. Additionally, Figure 26 shows the pressure distribution and streamlines at a height of 25 m (=/2) from the hull deck for each case. In the cases shown in the left and right of Figure 26, where = 90°, the flow entering Sail-2 separates, and Sail-1, positioned in the reverse flow region, generates negative , acting as resistance. In the middle of Figure 26, where = 0°, the flow separation at Sail-2 is minimal, leading to no reverse flow region, and both sails generate thrust.
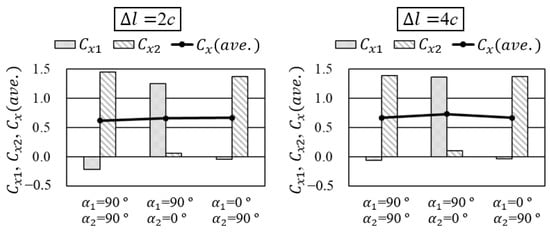
Figure 25.
, , and of the two sails ( = 180°).
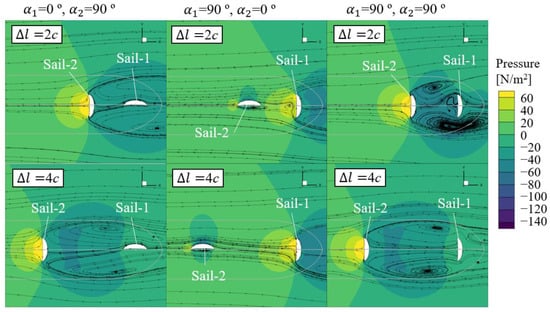
Figure 26.
Pressure distribution and streamlines at 25 m above from the hull deck ( = 180°).
Figure 27 shows , , and when is fixed at 90° and is changed. For both = 2 and = 4, peaks at = 20°. Increasing beyond this point does not surpass that value. This suggests that the combination of = 90° and around 20° maximizes .
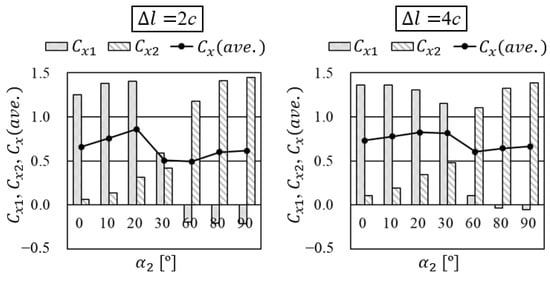
Figure 27.
, , and of the two sails ( = 90°, = 180°).
Figure 28 shows the ratio of to as same as Figure 14. The optimized angles of attack for maximizing are = 90° and = 22° for = 2, and = 96° and = 24° for = 4.
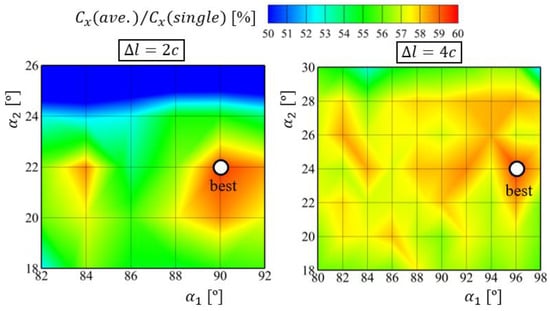
Figure 28.
of the two sails for = 180°.
Figure 29 shows the pressure distribution and streamlines at a height of 25 m (=/2) from the hull deck at the optimized angles of attack that maximize . In this downwind condition, setting the aft side sail at a low angle of attack to minimize separation and the fore side sail at a high angle of attack for high resistance is referred to as a “T-shaped arrangement” (see Section 2.2 for definitions of high and low angles of attack). The T-shaped arrangement differs from previous studies [10] by generating thrust through both sails by suppressing flow separation at the windward sail. This difference is believed to stem from the approach in previous studies, which set the angle of attack for maximum thrust on the windward sail before adjusting for the leeward sail. In this method, the angle of attack for the windward sail (Sail-2) is 90°, which does not result in a T-shaped arrangement.
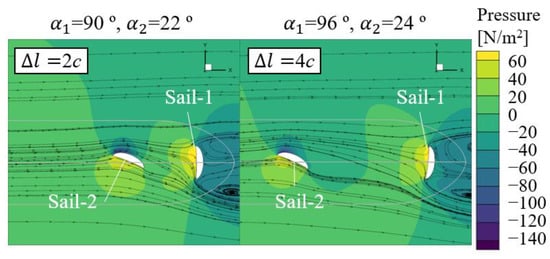
Figure 29.
Pressure distribution and streamlines at 25 m above from the hull deck ( = 180°, optimized and ).
5. Conclusions
This study investigates the optimized angles of attack for maximizing thrust due to the two rigid wing sails attached to a ship’s deck by using CFD. The findings are summarized below:
For 0, 60, 90, and 120° in relative wind directions, the optimized angles of attack identified align closely with those indicated in the previous study [10]. However, for 150 and 180° in relative wind directions, the present results diverge and provide new insights.
At 150° in a relative wind direction, configuring the aft side sail at an angle where drag is superior and the fore side sail at an angle where lift is superior (L-shaped arrangement) achieves maximum thrust. In an L-shaped arrangement, the fore side sail is not directly behind the aft side sail in the direction of the incoming flow. This significantly increases the negative pressure region caused by the aft side sail, thereby greatly enhancing the contribution of drag to thrust. Furthermore, the fore side sail, located in the wake of the aft side sail, experiences an increase in relative angle of attack, enhancing its contribution to thrust through lift. When the distance between the sails is four times the sail chord length, the effectiveness of the L-shaped arrangement diminishes due to reduced interference between the sails compared to when the distance is only twice the sail chord length.
At 180° in a relative wind direction, setting the fore side sail at an angle where drag is superior and the aft side sail at an angle where lift is superior (T-shaped arrangement) results in the highest thrust. In the case in which both sails are set at angles where drag is superior, the fore side sail, being in the wake region of the aft side sail, does not contribute to thrust. However, the T-shaped arrangement generates thrust from both sails by reducing separation on the aft side sail. This outcome remains consistent across two sail spacing options (twice and four times the sail chord length).
In this study, We only focus on the force in the ship’s forward direction and optimize the angles of attack of the two sails. However, the side forces caused by the sails are also significant for the ship’s sailing condition. They dictate the drifting angle. In future work, the angles of attack will be optimized under drifting conditions. These findings, especially the discovery of optimized angles of attack at 150 and 180° relative wind directions, provide significant new insights compared to previously published similar studies.
Author Contributions
Conceptualization, A.Y., T.T. and T.K.; methodology, A.Y.; software, A.Y.; validation, A.Y.; formal analysis, A.Y.; investigation, A.Y., T.T. and T.K.; resources, A.Y.; data curation, A.Y.; writing—original draft preparation, A.Y.; writing—review and editing, A.Y., T.T. and T.K.; visualization, A.Y.; supervision, T.T. and T.K.; project administration, A.Y., T.T. and T.K.; funding acquisition, A.Y. All authors have read and agreed to the published version of the manuscript.
Funding
This research received no external funding.
Institutional Review Board Statement
Not applicable.
Informed Consent Statement
Not applicable.
Data Availability Statement
The original contributions presented in the study are included in the article, further inquiries can be directed to the corresponding author.
Conflicts of Interest
Author Akane Yasuda is employed by the company Nihon Shipyard Co., Ltd. The remaining authors declare that the research was conducted in the absence of any commercial or financial relationships that could be construed as a potential conflict of interest.
Appendix A
Table A1.
The values of .
Table A1.
The values of .
| [°] | 0 | 60 | 90 | 120 | 150 | 180 |
|---|---|---|---|---|---|---|
| −0.127 | 1.469 | 1.860 | 1.720 | 1.351 | 1.466 |
References
- International Maritime Organization. Initial IMO Strategy on Reduction of GHG Emissions from Ships; MEPC 72/17 Add. 1 Annex 11; MEPC.304(80); International Maritime Organization: London, UK, 2018; pp. 1–11. [Google Scholar]
- International Maritime Organization. 2023 IMO Strategy on Reduction of GHG Emissions from Ships; MEPC 80/17 Add. 1 Annex 15 2023; MEPC.377(80); International Maritime Organization: London, UK, 2018; pp. 1–17. [Google Scholar]
- Khan, L.; Macklin, J.J.R.; Peck, B.C.D.; Morton, O.; Souppez, J.-B.R.G. A Review of Wind-Assisted Ship Propulsion for Sustainable Commercial Shipping: Latest Developments and Future Stakes. In Proceedings of the Wind Propulsion Conference, London, UK, 15–16 September 2021; pp. 1–10. [Google Scholar]
- Ouchi, K.; Uzawa, K.; Kanai, A.; Katori, M. “Wind Challenger” the Next Generation Hybrid Sailing Vessel. In Proceedings of the Third International Symposium on Marine Propulsors, Launceston, Australia, 5–8 May 2013; pp. 562–567. [Google Scholar]
- De Marco, A.; Mancini, S.; Pensa, C.; Calise, G.; De Luca, F. Flettner Rotor Concept for Marine Applications: A Systematic Study. Int. J. Rotating Mach. 2016, 2016, 3458750. [Google Scholar] [CrossRef]
- Cadalen, B.; Griffon, F.; Lanusse, P.; Sabatier, J.; Parlier, Y. Modelling and Control of a Tethered Kite in Dynamic Flight. J. Sail. Technol. 2018, 3, 1–24. [Google Scholar] [CrossRef]
- Felski, A.; Zwolak, K. The Ocean-Going Autonomous Ship—Challenges and Threats. J. Mar. Sci. Eng. 2020, 8, 41. [Google Scholar] [CrossRef]
- Tleubergenova, A.Z.; Tanasheva, N.K.; Shaimerdenova, K.M.; Kassymov, S.S.; Bakhtybekova, A.R.; Shuyushbayeva, N.N.; Uzbergenova, S.Z.; Ranova, G.A. Mathematical Modeling of the Aerodynamic Coefficients of a Sail Blade. Adv. Aerodyn. 2023, 5, 14. [Google Scholar] [CrossRef]
- Li, Q.; Nihei, Y.; Nakashima, T.; Ikeda, Y. A study on the performance of cascade hard sails and sail-equipped vessels. Ocean. Eng. 2015, 98, 23–31. [Google Scholar] [CrossRef]
- Bordogna, G. Aerodynamics of Wind Assisted Ships—Interaction Effects on the Aerodynamic Performance of Multiple Wind-Propulsion Systems. Doctoral Thesis, Delft University of Technology, Delft, The Netherlands, 2020. [Google Scholar]
- Fujiwara, T.; Hearn, G.E.; Kitamura, F.; Ueno, M. Sail-Sail and Sail-Hull Interaction Effects of Hybrid-Sail Assisted Bulk Carrier. J. Mar. Sci. Technol. 2005, 10, 82–95. [Google Scholar] [CrossRef]
- Kanai, A.; Ouchi, K.; Yoshimura, Y.; Takasu, S. Model Test and CFD Prediction with a Rigged Sail. In Proceedings of the JASNAOE Annual Spring Meeting, Miyagi, Japan, 26–27 May 2014; pp. 7–10. (In Japanese). [Google Scholar]
- ITTC. Guideline on the CFD-based Determination of Wind Resistance Coefficients. In Proceedings of the 29th International Towing Tanks Conference (ITTC), Virtual, 13–18 June 2021. Number 7.5-03-02-05. [Google Scholar]
- NUMECA International. USER GUIDE FINETM/Marine 10.1; Cadence Design Systems, Inc.: San Jose, CA, USA, 2021; pp. 1–981. [Google Scholar]
- Masuyama, Y.; Nakamura, I.; Tadano, H.; Takagi, K.; Miyakawa, N. Sailing Performance of Ocean Cruising Yacht by Full-Scale Sea Test (Part1: Steady Sailing Performance and Dynamic Performance in Waves). J. Jpn. Soc. Nav. Archit. 1992, 172, 349–364. (In Japanese) [Google Scholar] [CrossRef] [PubMed][Green Version]
- Kume, K.; Ohba, H.; Orihara, H.; Mizokami, S. Wind Velocity Profile and Representative Wind Velocity for Wind Resistance Measurement of Ship Models. J. JASNAOE 2019, 30, 1–13. [Google Scholar] [CrossRef]
- ITTC. Uncertainty Analysis in CFD Verification and Validation Methodology and Procedures. In Proceedings of the 28th International Towing Tanks Conference, Wuxi, China, 17–23 September 2017. Number 7.5-03-01-01; ITTC: 2017. [Google Scholar]


Disclaimer/Publisher’s Note: The statements, opinions and data contained in all publications are solely those of the individual author(s) and contributor(s) and not of MDPI and/or the editor(s). MDPI and/or the editor(s) disclaim responsibility for any injury to people or property resulting from any ideas, methods, instructions or products referred to in the content. |
© 2024 by the authors. Licensee MDPI, Basel, Switzerland. This article is an open access article distributed under the terms and conditions of the Creative Commons Attribution (CC BY) license (https://creativecommons.org/licenses/by/4.0/).