Article

Numerical Determination of Anisotropic Permeability for Unconsolidated Hydrate Reservoir: A DEM–CFD Coupling Method

1
Key Laboratory of Shale Gas and Geoengineering, Institute of Geology and Geophysics, Chinese Academy of Sciences, Beijing 100029, China
2
Innovation Academy for Earth Science, Chinese Academy of Sciences, Beijing 100029, China
3
Key Laboratory of Urban Security and Disaster Engineering of Ministry of Education, Beijing University of Technology, Beijing 100124, China
*
Author to whom correspondence should be addressed.
J. Mar. Sci. Eng. 2024, 12(8), 1447; https://doi.org/10.3390/jmse12081447
Submission received: 20 July 2024 / Revised: 15 August 2024 / Accepted: 17 August 2024 / Published: 21 August 2024
(This article belongs to the Section Marine Energy)

Abstract

:
Natural gas hydrate (NGH) is considered as a type of clean energy to replace coal and oil. During exploitation, permeability is one of the key parameters controlling production efficiency, reservoir stability, and greenhouse gas sequestration. Limited by experimental and numerical simulation tools, in current research, the directionality of permeability is usually ignored. In this work, a DEM–CFD coupling simulation method is developed to compute the anisotropic permeability. The sedimentary process of reservoir sediments is reconstructed, enabling the acquisition of numerical models that possess pore structures consistent with the actual fabric characteristics. The fluid transport process in various directions can be simulated with a finite element method. Taking the natural gas hydrate reservoir in the Shenhu area of the South China Sea as an example, the proposed method is validated and applied to explore the effect of compaction stress on permeability anisotropy. With the increase in compaction stress, the permeability anisotropy exhibited a rapid initial increase, followed by a sustained stabilization. The primary cause is the rearrangement of sediment particles. The non-spherical particles are driven to align in a predominantly horizontal orientation, thereby enhancing anisotropy. The proposed method provides a tool for the efficient exploitation of hydrate resources.

1. Introduction

The problem of energy shortage has emerged as a formidable impediment that hampers and jeopardizes the progress of human society, in light of the rapid advancement of economy and society [1]. The natural gas, as a clean energy source, possesses the advantages of being safe and reliable, having ample storage capacity, thus enabling extensive utilization [2]. The existence of several potential challenges and difficulties, however, cannot be overlooked, such as forecasting the expected production volume; restoring the history of an already developed field; choosing the optimal technology for field development; gas extraction from hydrate; and ensuring the safety of people and structures and analyzing the environmental consequences of field development [3,4,5,6]. The presence of substantial natural gas reserves in natural gas hydrates (NGHs) has been substantiated by the previous research [7,8]. As a kind of ice-like crystalline compound, natural gas hydrate exists in a stable region controlled by certain temperature and pressure conditions [9]. Under standard conditions, 1 m3 of hydrate decomposition can release about 180 m3 of natural gas, which is a kind of clean energy with large energy density [10]. At present, many drilling, geophysical exploration, and test production for natural gas hydrate have been carried out in the world, and the main target reservoirs are located at permafrost and continental shelves [11,12,13]. Some production technologies have been developed like depressurization, heat injection, and hydraulic fracturing [14,15,16,17]. However, the gas production efficiency and stability of these trial production work are far from that of commercial production, and the key factors restricting the gas production efficiency are the seepage characteristics of hydrate reservoirs [18]. Permeability, defined as the volume of fluid passage under a given pressure gradient, is a key parameter to evaluate the economic properties of hydrate reservoirs, and the study of reservoir permeability and its evolution is very important for the safe and efficient exploitation of hydrate resources [19].
From a sedimentological perspective, the NGH reservoirs predominantly pertain to unconsolidated sediments [20]. During deposition, mineral particles are arranged in the direction of water flow or maximum principal stress. Moreover, the variation in mineral composition and particle size will result in sedimentary stratification of the reservoir, which also affect the hydrate distribution [21]. These geological factors will induce primary anisotropy in the permeability of reservoir sediments [22,23,24]. In the process of hydrate exploitation, the increase in effective stress and the decomposition of hydrates lead to the compaction of the pore structure and further change the permeability anisotropy, i.e., horizontal permeability is higher than vertical due to compaction [24,25]. A thorough understanding of the control mechanism and variation law of reservoir permeability anisotropy is of guiding significance to the optimization of production flow. However, most current studies have simplified hydrate reservoirs into isotropic media, focusing on the overall permeability of sediments, and rarely involving the anisotropy characteristics and evolution mechanism of permeability [26,27,28].
In this work, a DEM–CFD coupling simulation method is developed to determine the anisotropic permeability of a hydrate reservoir. The sedimentary process of reservoir sediments is reconstructed by a discrete element method, and a numerical model of pore structure consistent with the actual fabric characteristics is obtained. The fluid transport process in various directions can be simulated using geometric models, and the anisotropic permeability can be determined through the application of the finite element method. Taking the natural gas hydrate reservoir in the Shenhu area of the South China Sea as an example, the proposed method is validated and applied to explore the effect of compaction stress on permeability anisotropy.

2. Materials and Methods

Methodologically, theoretical analysis, experimental testing, and numerical simulation are the main methods to determine the permeability of hydrate reservoir [29]. Theoretically, a number of theoretical models are proposed to describe the permeability–saturation relationship [30,31,32]. In these theoretical models, the pore flow process is often idealized and approximated as parallel capillary tubes to obtain analytical solutions [32]. However, the variation in pore size, tortuosity, and non-uniform distribution of the hydrate in the actual pore structure can significantly affect permeability, which poses limitations on the application of theoretical models, particularly when anisotropy is considered [23]. The experimental tests, in comparison with the theoretical models, offer a more direct means of determining the sediment permeability and can be categorized into two types: in situ testing and laboratory testing. Among them, the object of in situ testing is the whole reservoir, and the common methods include formation testing and nuclear magnetic resonance logging [32,33]. The objects of the laboratory tests are pressure core samples or artificially prepared samples. Morphologically, the standard samples are predominantly cylindrical and can only be tested along the axial direction, making it challenging to obtain anisotropic properties [34,35]. Moreover, the sample sediments are often disturbed and cannot maintain the in situ fabric characteristics. Accordingly, some sample reconstruction methods are employed to reproduce the in situ characteristics of reservoir sediments. For example, the pluviation method is widely employed due to its ability to replicate the sediment deposition process in natural environments, thereby yielding artificial samples with comparable fabric [36,37]. The experimental tests generally demonstrate a high level of reliability. However, they do involve substantial testing costs and technical intricacies.
For conventional theoretical and experimental methods, it is difficult to characterize the control mechanism of micro-pore characteristics on sediment permeability. The microscopic numerical simulation based on the pore morphology provides a new way to solve this problem [38]. The numerical simulation includes 2 steps: (1) modeling of pore space and (2) simulation of seepage progress. With numerical or experimental tools like the discrete element method (DEM), CT scanning, and four-parameter random growth, the geometric model containing pore structure information can be constructed to restore in situ reservoir characteristics [38,39,40]. The fluid transport is simulated based on the principle of fluid mechanics. For pore-scale simulation, the most widely used method is the pore network model (PNM). This method simplifies the porous media into a ball–stick combination, and then performs flow simulation in the simplified pore network. All the seepage channels are considered to be straight pipes (stick), and the flow rate is calculated by analytical solutions [41,42,43]. However, the simplified geometric pore network fails to fully capture the intricate pore structure, and the assumption of circular tube flow does not align with reality, thus rendering it inadequate for practical applications [44]. Based on the real pore geometry, the computational fluid dynamics (CFD) method can restore the seepage process more accurately [45,46]. Methodologically, there are two categories of CFD simulation, i.e., mesh-based methods and particle-based methods [47]. The mesh-based methods, including finite difference method (FDM), finite volume method (FVM), finite element method (FEM), and Lattice Boltzmann Method (LBM), discretize the fluid into meshes to solve Navier–Stokes equations [48,49]. While the particle-based methods mainly include smoothed particle hydrodynamics method (SPH) and molecular dynamics method, which discretize the fluid into particles or molecules to solve the motion trajectory of each particle [50,51]. The CFD method possesses the advantage of exhibiting high levels of accuracy, albeit at the expense of necessitating extensive computational resources.

3. DEM–CFD Coupling Simulation

Theoretically, permeability is defined as the fluid-passing ability of a specific pore medium. Therefore, the numerical determination of permeability for the hydrate reservoir requires the simulation of the pore fluid transport process. In this work, a DEM–CFD coupling simulation method is developed to compute the anisotropic permeability. The first step, technically, involves the modeling of reservoir sediments. The DEM is used to generate sediment particles and apply in situ stress conditions. After that, the pore space can be extracted and 3D geometric models can be constructed. With the geometric models, the CFD method can be applied to simulate the fluid transport process in different directions, and the anisotropic permeability can be determined.

3.1. Reservoir Sediment Modeling According to Geological Origins

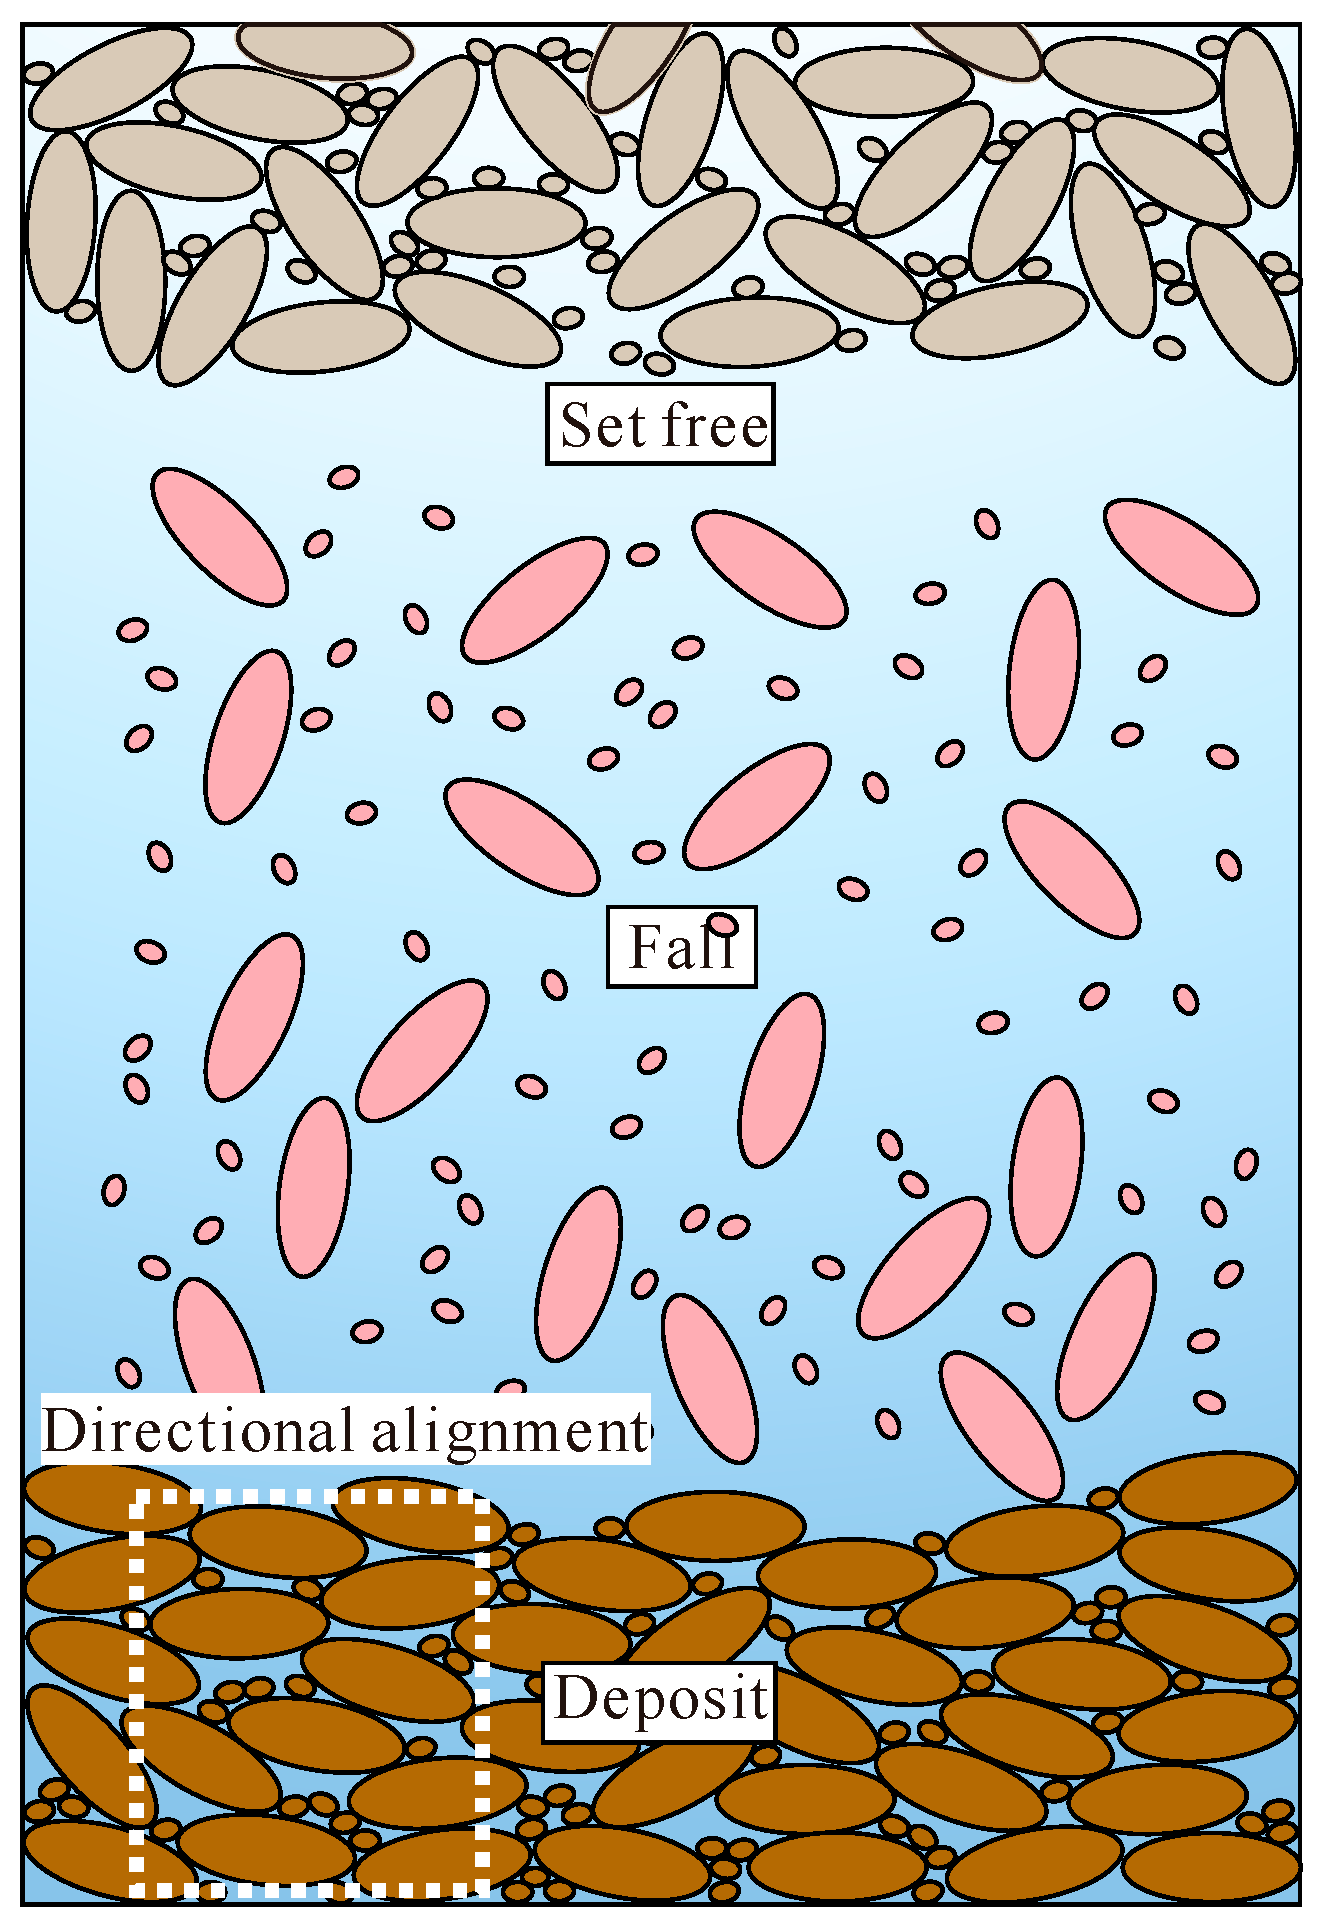
Naturally, hydrates often occur in unconsolidated and weakly consolidated sediments. In the process of formation, these sediments mainly experienced hydrodynamic carrying, deposition, compaction, and cementation, which form a complex directional pore structure. In order to restore the fabric characteristics of reservoir sediments, it is necessary to simulate the natural formation process of sediments in the construction of numerical model, so as to obtain a numerical model consistent with the in situ characteristics. Experimentally, some sample reconstruction methods, like pluviation, tamping, and vibration, have been applied to the sample preparation of anisotropic permeability tests. Among them, the pluviation method could reproduce the natural deposition processes by releasing sediment particles at a certain height in water [36]. By adopting this approach, the particle arrangement of the sample closely resembles its in situ state and exhibits significant directional characteristics, thereby leading to anisotropy in the physical properties.
For the pluviation method, the physical process mainly includes the following: (1) particle release, where sand particles are released through the screen and freely fall from a certain height; (2) particle descent, where sand particles descend in water under the action of gravity and medium resistance; (3) particle collision and rebound, where sediment particles collide and bounce off each other upon contact, and specific collision angles and particle shapes cause the particles to rotate and rearrange; (4) sedimentation stabilization, where the kinetic energy of the particles gradually dissipates during the process of collision–rebound–collision, leading to a continuous decrease in particle velocity until it reaches 0 at a specific location.
Based on the concept of pluviation, the discrete element method (DEM) is employed to numerically construct sediment models with realistic fabric. As a prominent framework for distinct-element modeling, the particle flow method (PFC 5.0) possesses the capability to analyze mechanical problems under both quasi-static and dynamic conditions. The macroscopic mechanical behavior of materials is characterized by employing particle aggregates. All particles are treated as rigid bodies with a specific mass, capable of independent movement, translation, and rotation. Forces and moments occur upon contact between particles [52,53].
In this work, all sediment particles are simplified into ball and clump units. A clump is a rigid collection of several rigid pebbles (balls) and has the ability to customize shapes to characterize irregular sediment particles. For irregular, non-spherical particles, 2 methods with different precision are developed: (1) Identify the shape of each particle and model each particle separately. Some microscopic tools, like CT, SEM, etc., can be employed to identify the shape of sediment particles and construct geometric models for each particle. In the PFC method, these geometric models can be used as templates for clump generation, so as to obtain high-precision models; (2) Identify the shape of limited particles and model random particles according to the statistical shape parameters. A classic indicator, known as the Zingg diagram, can be utilized to quantitatively assess particle shape based on the elongation ratio (a/b) and flatness ratio (b/c), where a, b, and c represent the long, intermediate, and short orthogonal axes of a specific particle [54,55]. Mathematically, as the elongation ratio increases, the particles tend to approach an acicular shape, while a higher flatness ratio indicates a tendency towards a flake shape. Based on the statistical data of the Zingg diagram, ellipsoid templates are constructed and ellipsoid particles are randomly generated (Figure 1). The shape parameter distribution for numerical particles is set to match the statistical data of actual sediment particles. The latter method is generally considered more practical as it entails less computational complexity and enables the inclusion of a larger number of particles.
After particle generation, the process of pluviation is simulated with the particle flow method (Figure 2). Theoretically, for the descent of particles, Newton’s second law is employed to depict the translational motion of particles [40]:
F i = m i d 2 r i d t 2
where Fi represents the resultant force on the ith particle; mi is the mass of ith particle; ri represents the position of ith particle.
The rotation of a particle after collision is described by Euler’s equation, which can be formulated as follows [40]:
τ i = d d t ( I ω i )
where τi is the collision moment on the ith particle; I is the inertia tensor; ωi is the angular velocity of ith particle.
Contact models are utilized to compute the contact force and contact moment. For particle collision, rebound, and energy dissipation during deposition, a linear model can be employed to calculate the force–displacement relationship. The contact force Fc can be decomposed into linear and dashpot components [56,57]:
F c = F l + F d
where Fl is the linear component, which provides the linear elastic and frictional behavior; Fd is the dashpot component, which provides the viscous behavior [56,57].

3.2. Geometric Model of Pore Space

The extraction of pore space and construction of geometric models are essential for simulating the seepage progress. Theoretically, the CFD computation with finite element method (FEM) is grounded on the geometric representation of mesh (use software of COMSOL Multiphysics 5.6). However, for the PFC models, the geometric representation is based on the ball and clump units. Therefore, an interface program needs to be developed to connect the geometric models of these two methods. In this work, the CFD computation is conducted with COMSOL Multiphysics, and MATLAB is used to program the interface. Specifically, the programming of the interface is based on the following steps: (1) Export the position and size data of all particles (balls and clumps) in PFC and store them in a binary file; (2) Read the particle data with Matlab and identify the shape of each clump. When the non-spherical particles are treated as ellipsoids, they can be directly generated according to the clump size data (i.e., long, intermediate, and short orthogonal axes, a, b, c). While when the real shape of each non-spherical particle is needed, the 3D templates from microscopic tools are employed to build particles with complex geometries; (3) Determine the attitude angle of each particle. For the non-spherical particles, the attitude angle controls their arrangement. Three pebbles from one clump are selected to calculate the normal vector and further determine the attitude angle (Figure 3a); (4) According to the size, position, shape, and attitude angle for a specified particle, a geometric model can be established by COMSOL Multiphysics with MATLAB, and the combination of all particles constitutes a specific fabric (Figure 3b); (5) Boolean operation is applied to cut sediment particles from a cube to obtain a cubic geometric model of pore space.

3.3. Pore-Scale Seepage Simulation

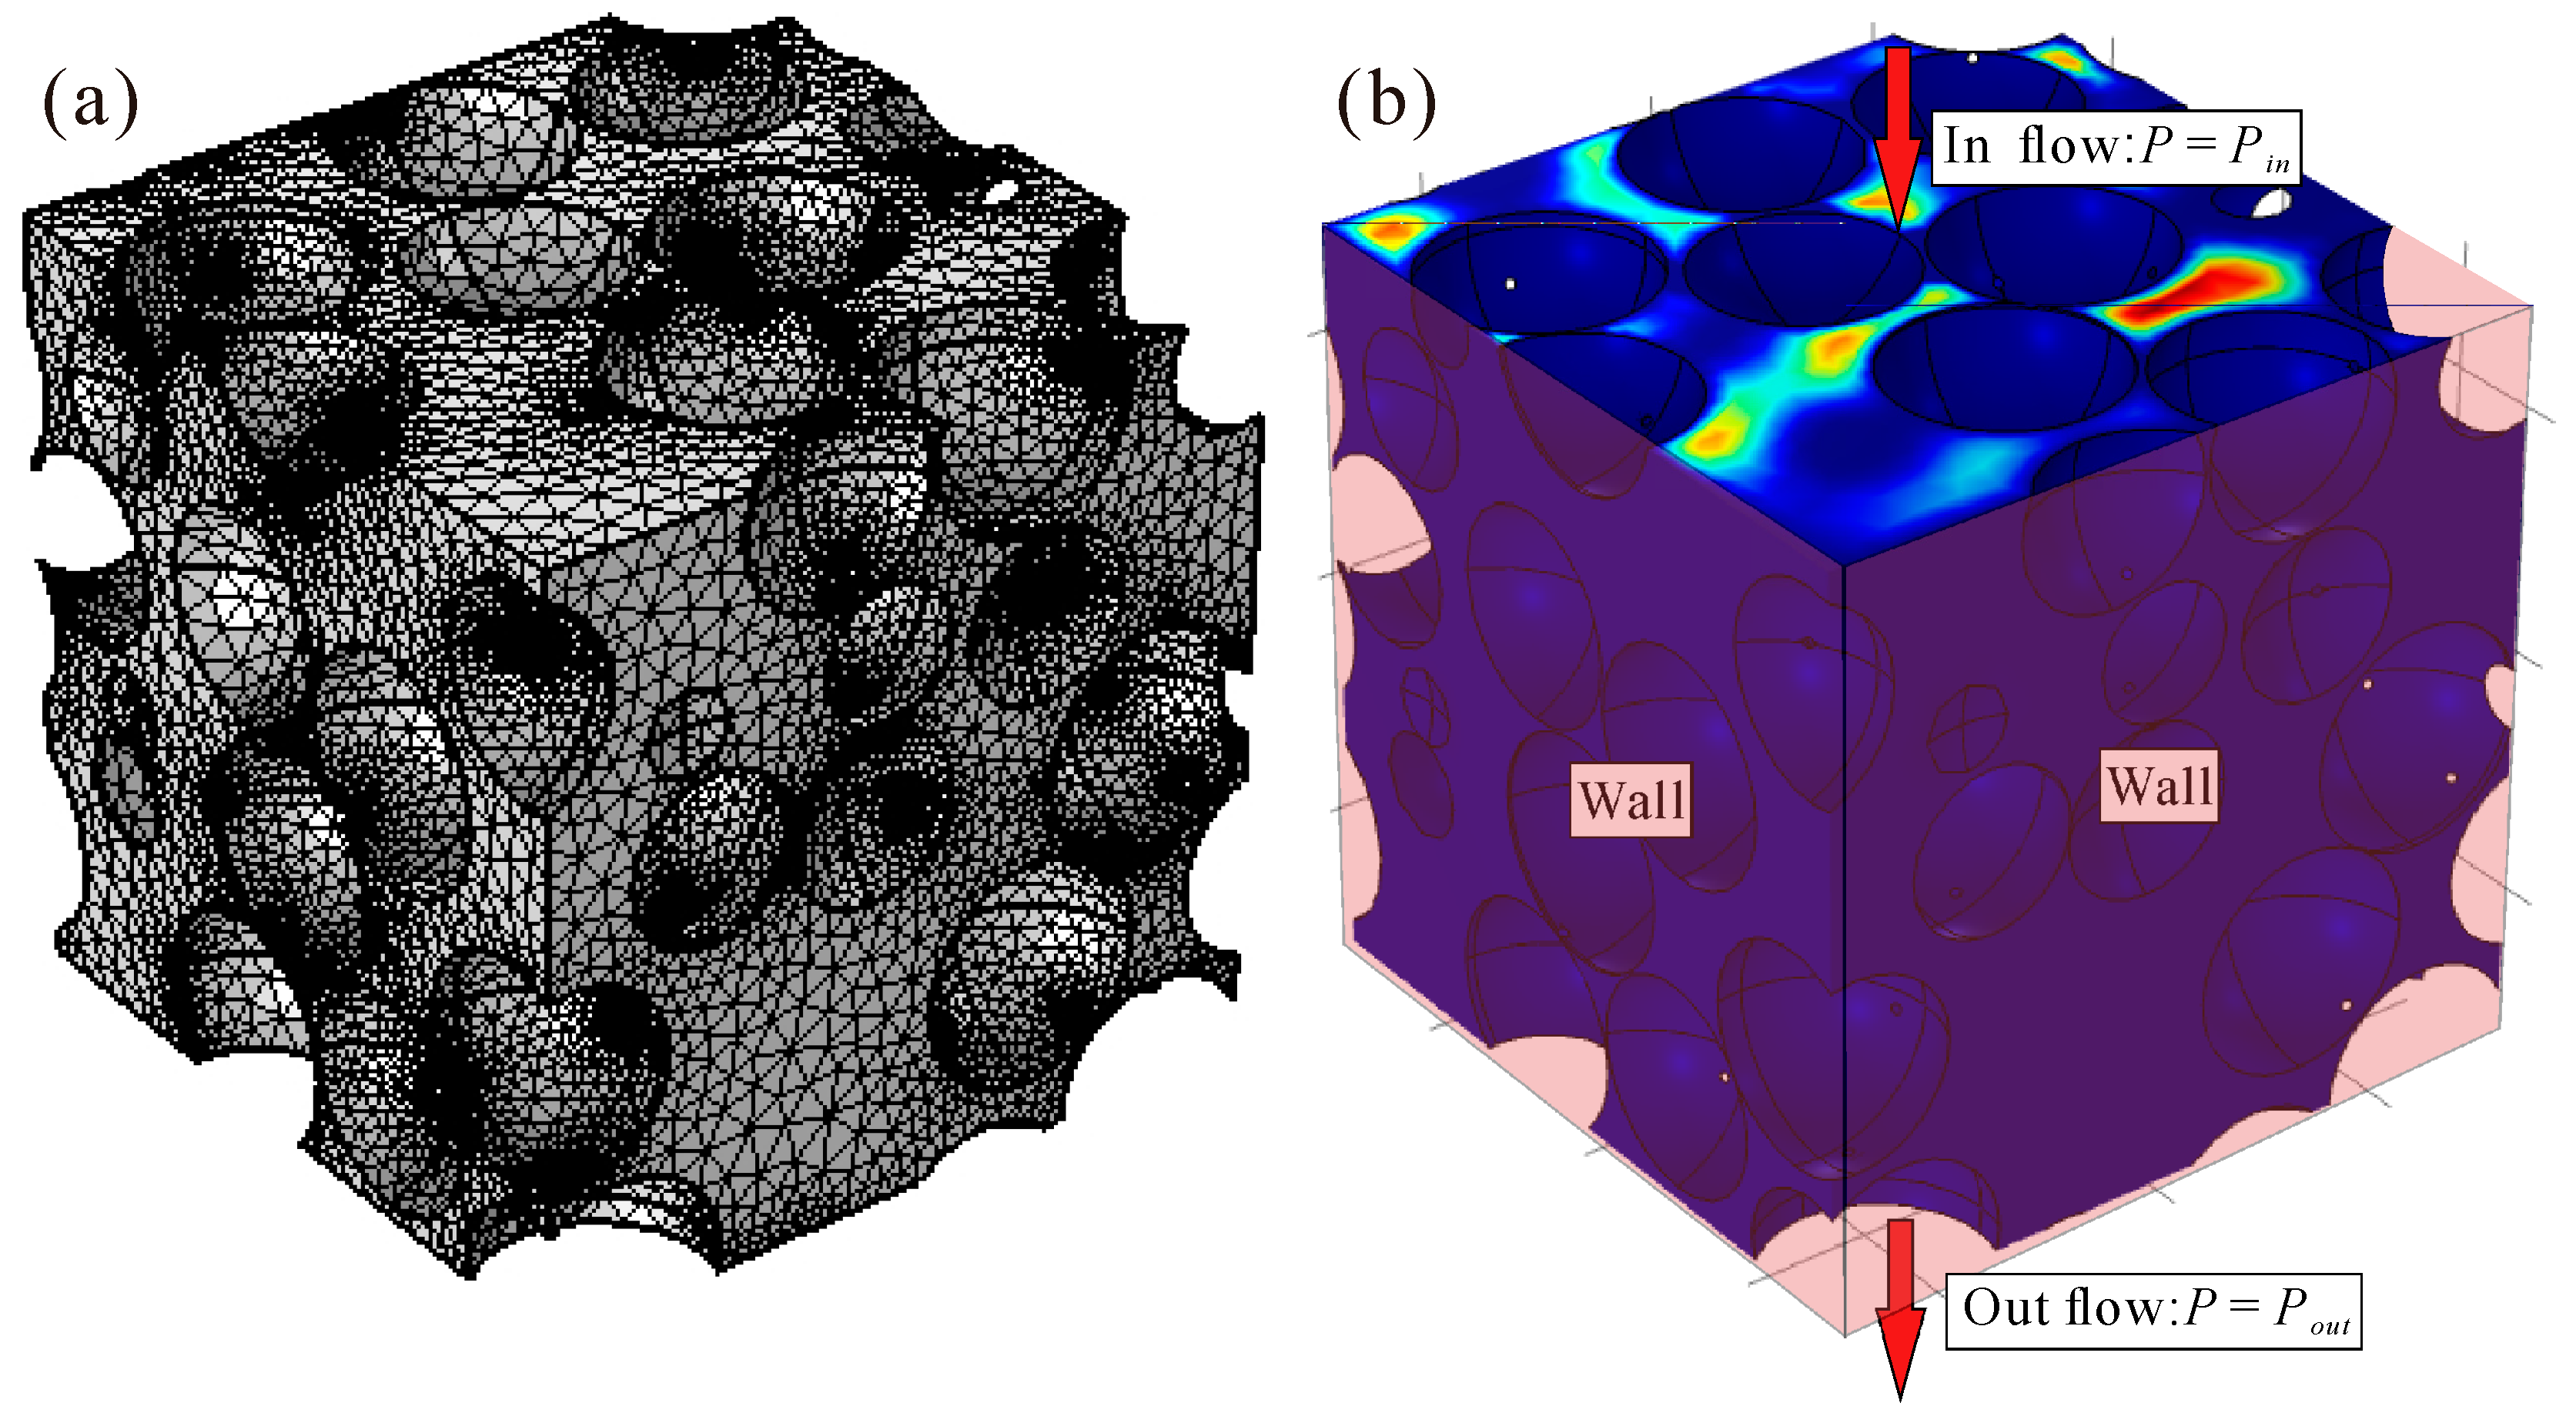
The CFD simulation in pore space is conducted using COMSOL Multiphysics based on the finite element method. The first step, technically, is the mesh generation of geometric models. In the default meshing tool, mesh parameters, including maximum size, minimum size, maximum growth rate, curvature factor, and narrow area resolution are used to control mesh precision. Moreover, the meshes in angles are refined to ensure the calculation accuracy of the pore throat flow (Figure 4a). By adjusting these parameters, the mesh quality is ensured to be greater than 0.65. After that, a mesh independence test should be conducted for each model by changing the mesh precision and comparing the solution results.
After the generation of mesh, the simulation of fluid transport in pore space is conducted. By applying the principles of momentum conservation and mass conservation, the motion of fluid can be governed by the Navier–Stokes equation as follows:
ρ u t + ρ ( u ) u = ( p I + K ) + F ρ u = 0
where ρ is fluid density; p is pressure; u is velocity vector; I is identity matrix; K is viscous stress tensor; and F is the volume force vector.
The viscous stress tensor K for an incompressible Newtonian fluid can be derived as follows:
K = μ ( u + ( u ) T )
where μ is dynamic viscosity.
According to the definition of Darcy’s law, the flow in pore space should exhibit creeping flow, characterized by a significantly higher viscous stress compared to inertial stress. Therefore, Equation (5) can be simplified to Stokes equations as follows:
ρ u t = ( p I + K ) ρ u = 0
The significance of the inertial effect, particularly for gas media, should be emphasized when the flow rate is excessively high. Under such circumstances, the relationship between flow rate and pressure gradient becomes non-linear. To obtain absolute permeability, it is necessary to correct the apparent permeability calculated using actual flow rates. However, in this study, we can circumvent the inertial effects on permeability by disregarding inertial stress in the Stokes equations.
To obtain the permeability anisotropy, seepage simulations are conducted in the three orthogonal directions of the cubic model. The top and bottom boundaries are designated as in-flow and out-flow boundaries with constant pressure, while the four sides and all particle surfaces are defined as walls with zero flow velocity and no-slip conditions (refer to Figure 4b). The test fluid could be liquid or gas. The permeability is determined using Darcy’s law. In the case of a liquid medium, the fluid is assumed to be incompressible. Hence, Darcy’s law can be formulated as follows:
k = U o u t μ L P i n P o u t
where Uout is outlet velocity; L is side length of geometric model; Pin is inlet pressure; and Pout is outlet pressure.
In the case of a gas medium, the fluid is assumed to be compressible. Darcy’s law can be formulated as follows:
k = 2 U o u t μ L P 0 P i n 2 P o u t 2
where P0 is the reference pressure, which takes the value of 1 atm.

4. Case Studies

4.1. Homogeneous Model Consisting of Identically Sized Spherical Particles

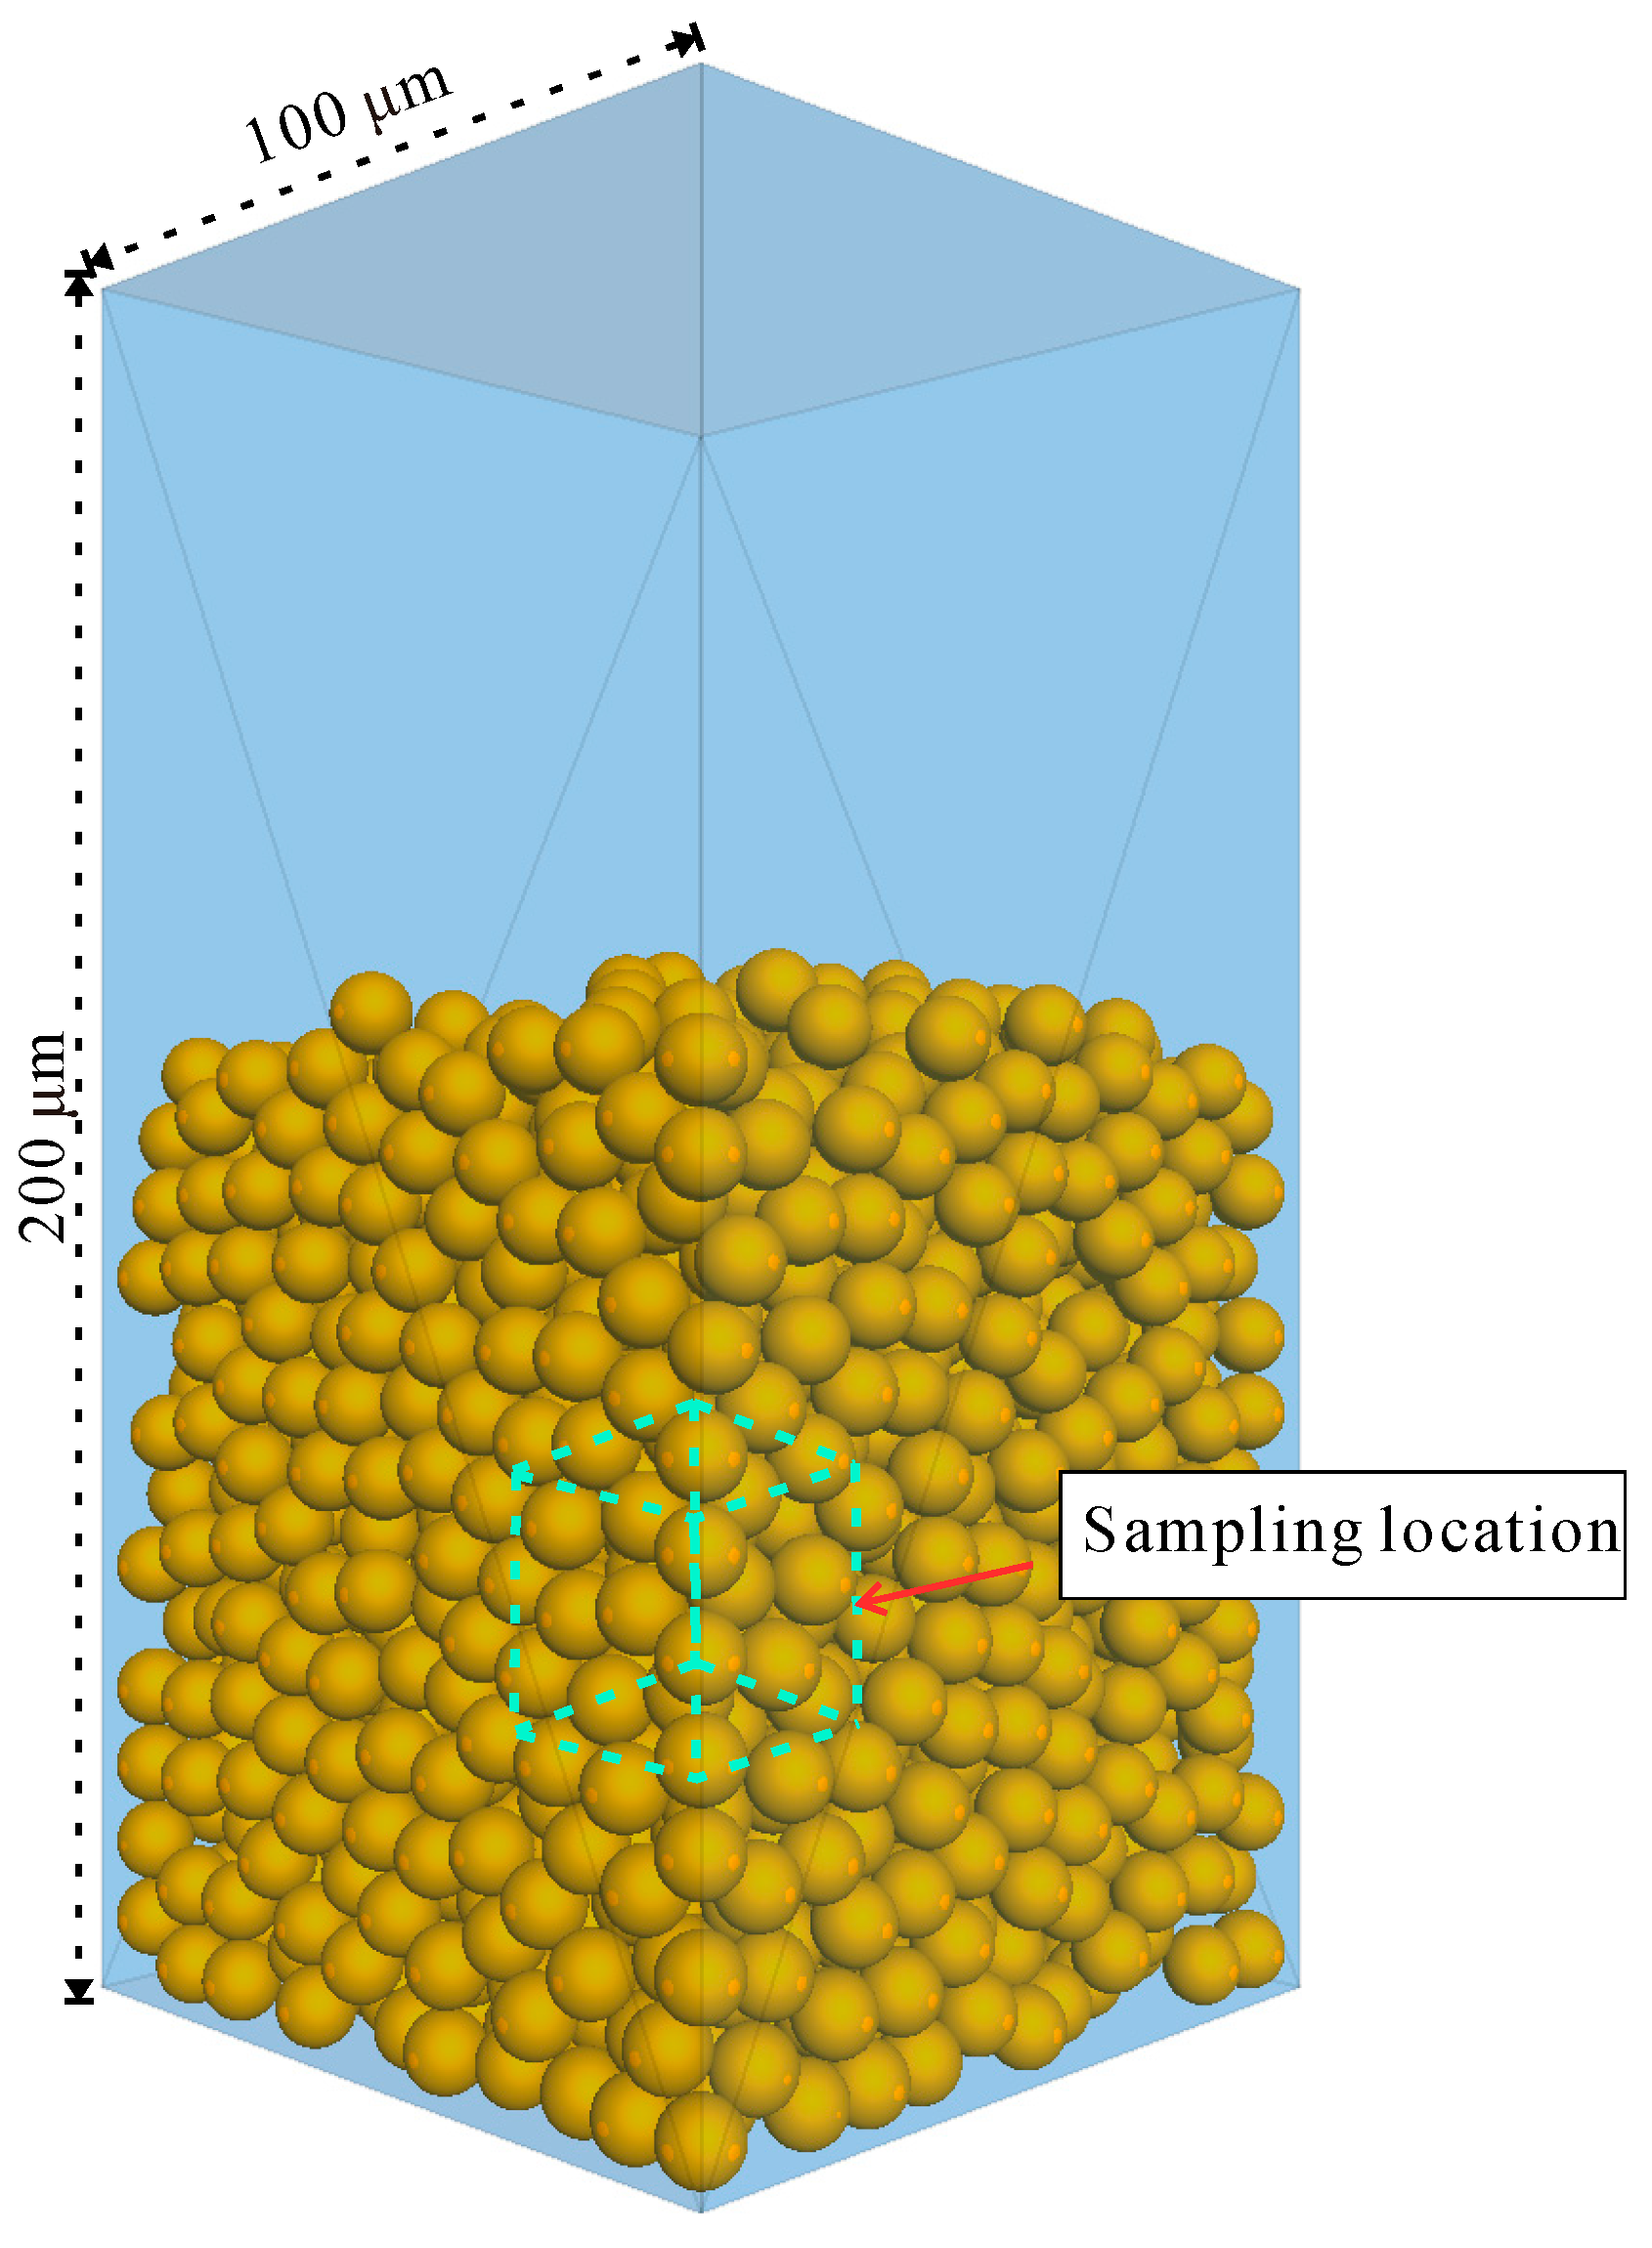
Serving as a typical case, the permeability of identically sized spherical particles is frequently employed to validate the precision of the proposed methodology. In this work, a sediment model is constructed with spherical particles (diameter of 9 μm, see Figure 5). All the particles are liberated at a height of 200 μm and subsequently deposited at the base of the model. To mitigate the disturbance of the boundary effect, particles located at the core of each specimen are selectively employed to extract the pore space. A cubic region measuring 30 μm along each edge is strategically positioned at the center of the packing model. Ensuring a minimum distance of 35 μm from any boundary, the associated boundary effects are found to be trivially insignificant. Subsequently, all particles contained within or in physical contact with the cubic region are meticulously identified based on their spatial coordinates, dimensions, and orientation angles to extract the geometric model of pore space (see Figure 5). The porosity of this case is 0.408.
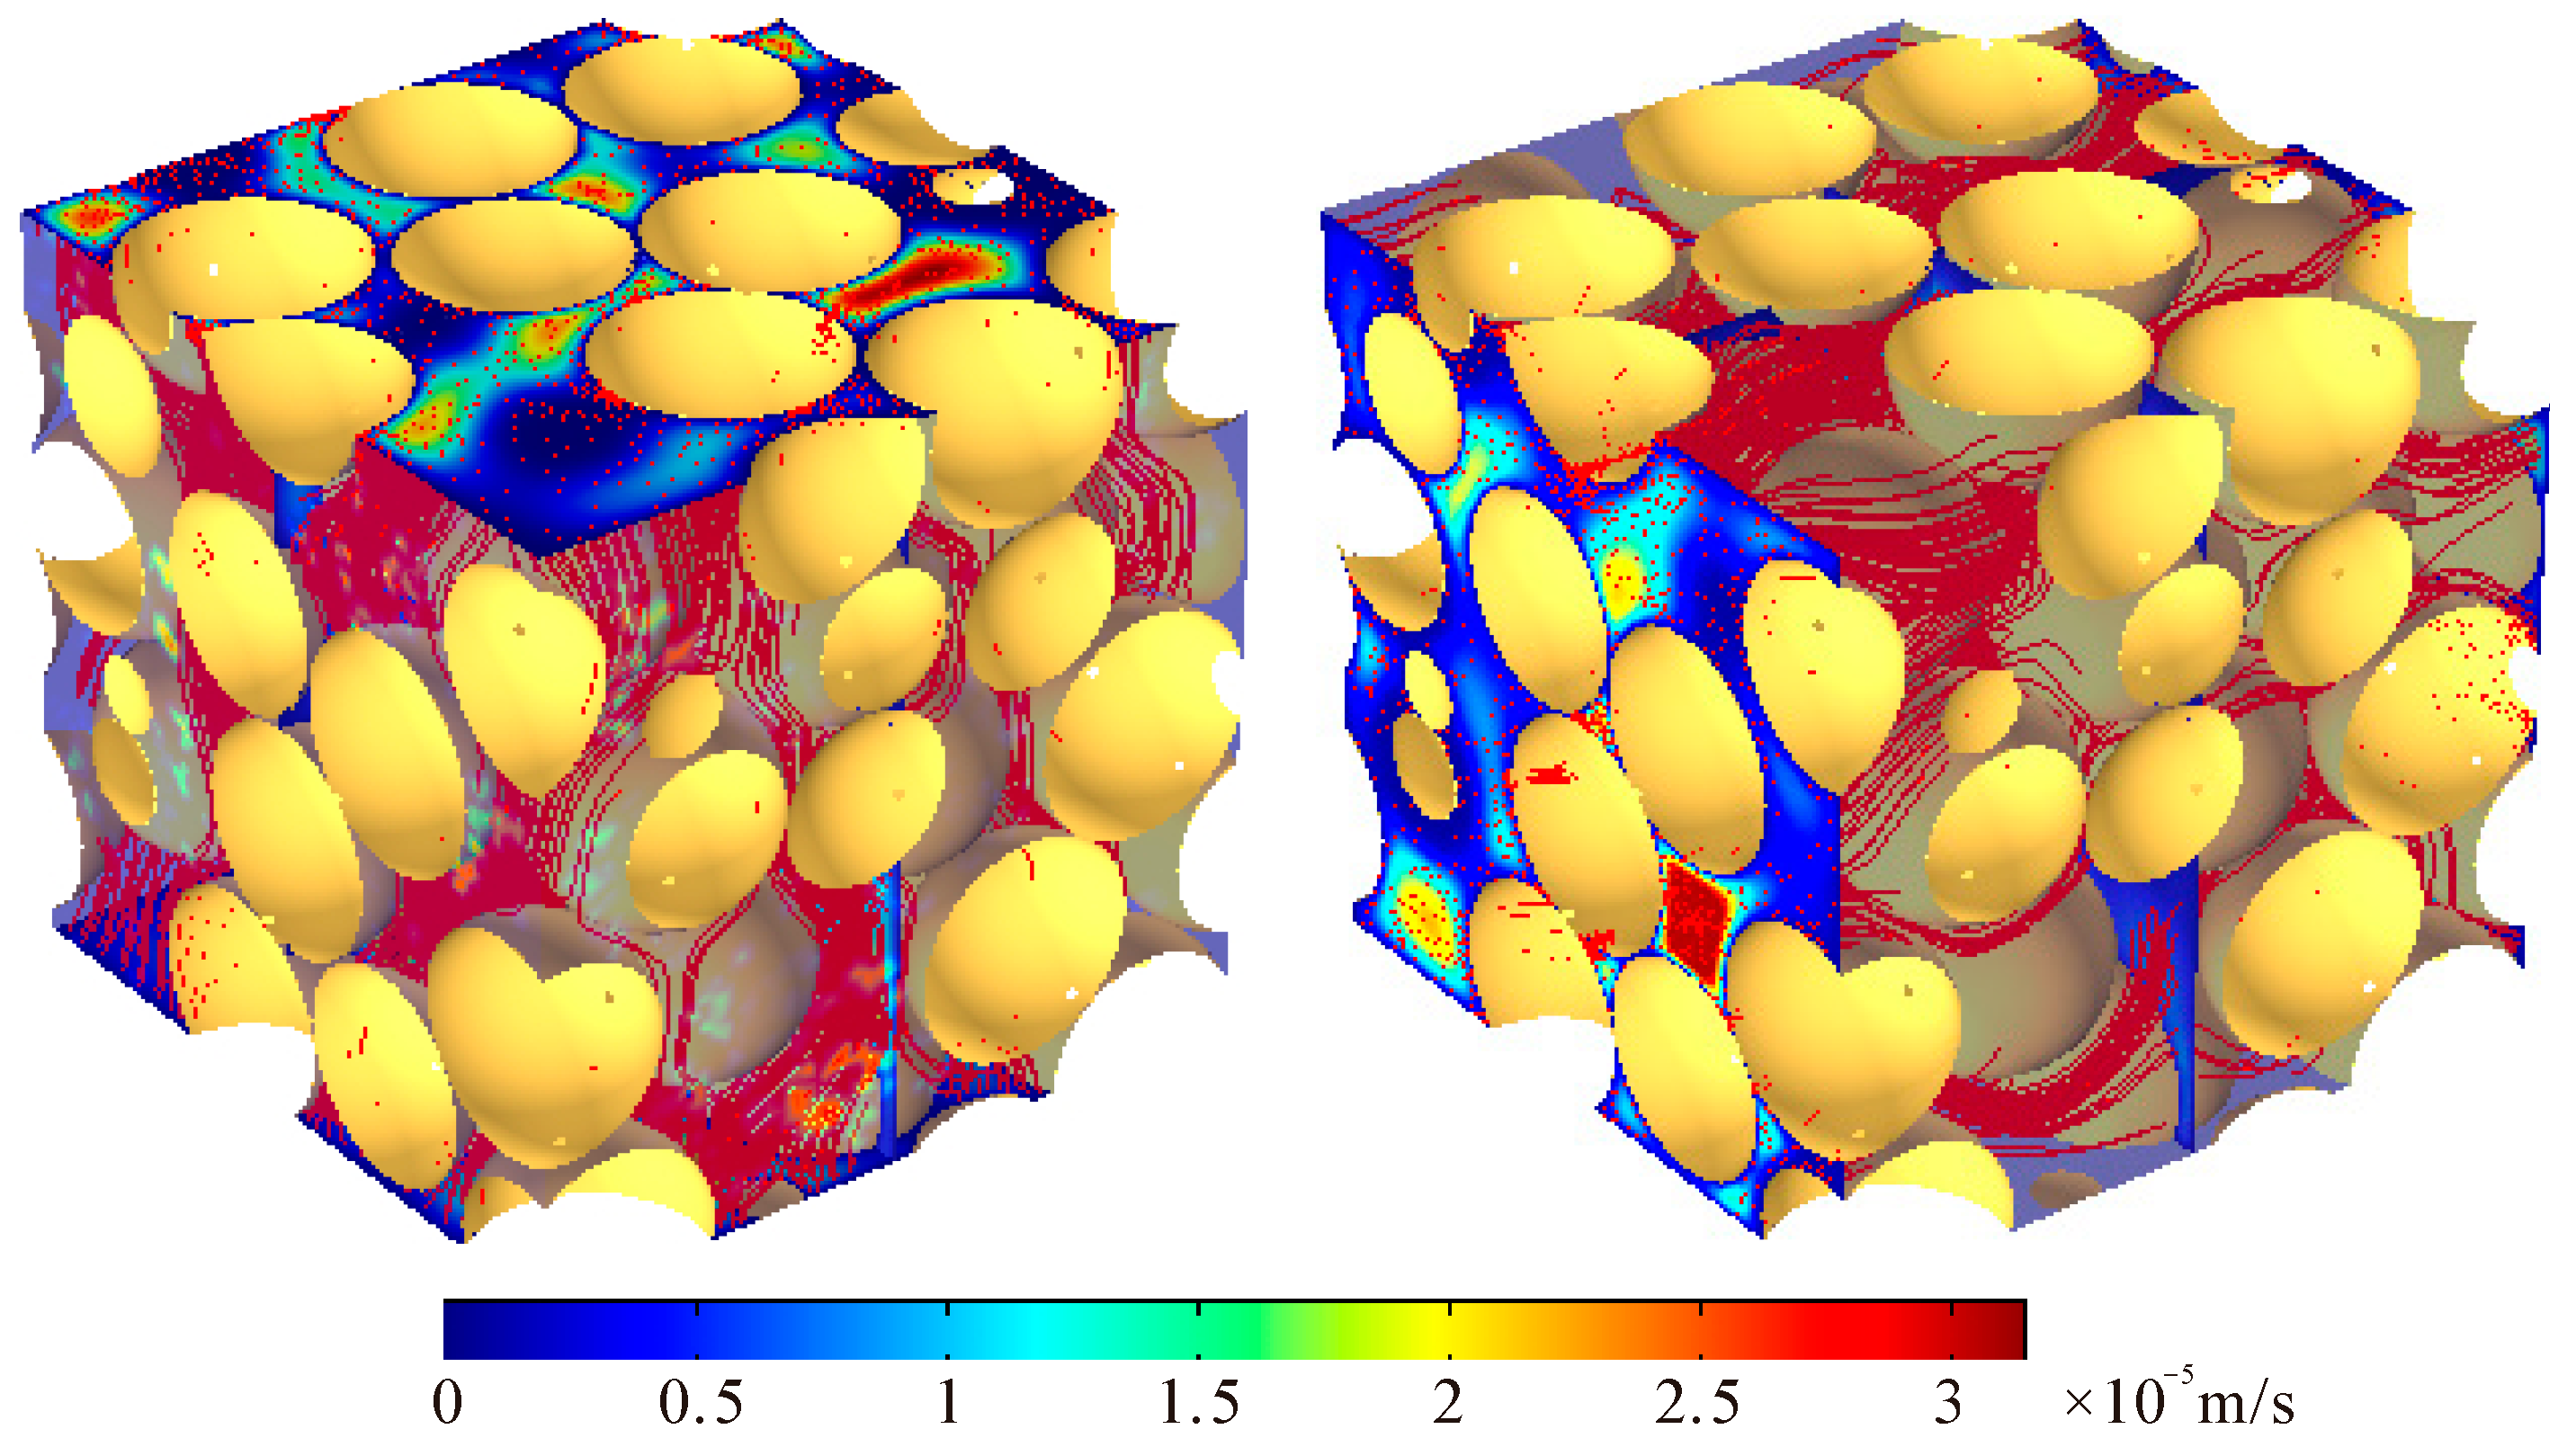
The flow field in the pore space of each sample can be obtained by solving all the governing equations in COMSOL Multiphysics (refer to Figure 6). Water is selected as the test fluid. The outlet velocity Uout is calculated through fluid mass integral, which can then be inserted into Equation (7) to determine the permeability in each direction.
With the above CFD simulation method, the flow field in pore space of each sample can be obtained by solving all the governing equations in COMSOL Multiphysics (see Figure 6). Water is chosen to be the test fluid with the physical parameters shown in Table 1. The outlet velocity Uout is determined through the integration of fluid mass, which can then be utilized in Equation (7) for the calculation of permeability in each direction. According to the simulation results, the horizontal permeability kh and vertical permeability kv are 84.33 and 81.45 mD, respectively, resulting in kv/kh = 0.97. Therefore, the porous media consisting of identically sized spherical particles exhibits limited anisotropy in permeability. The seepage in the pore space is governed by the prevailing channels, with flow lines being concentrated within the larger pores.
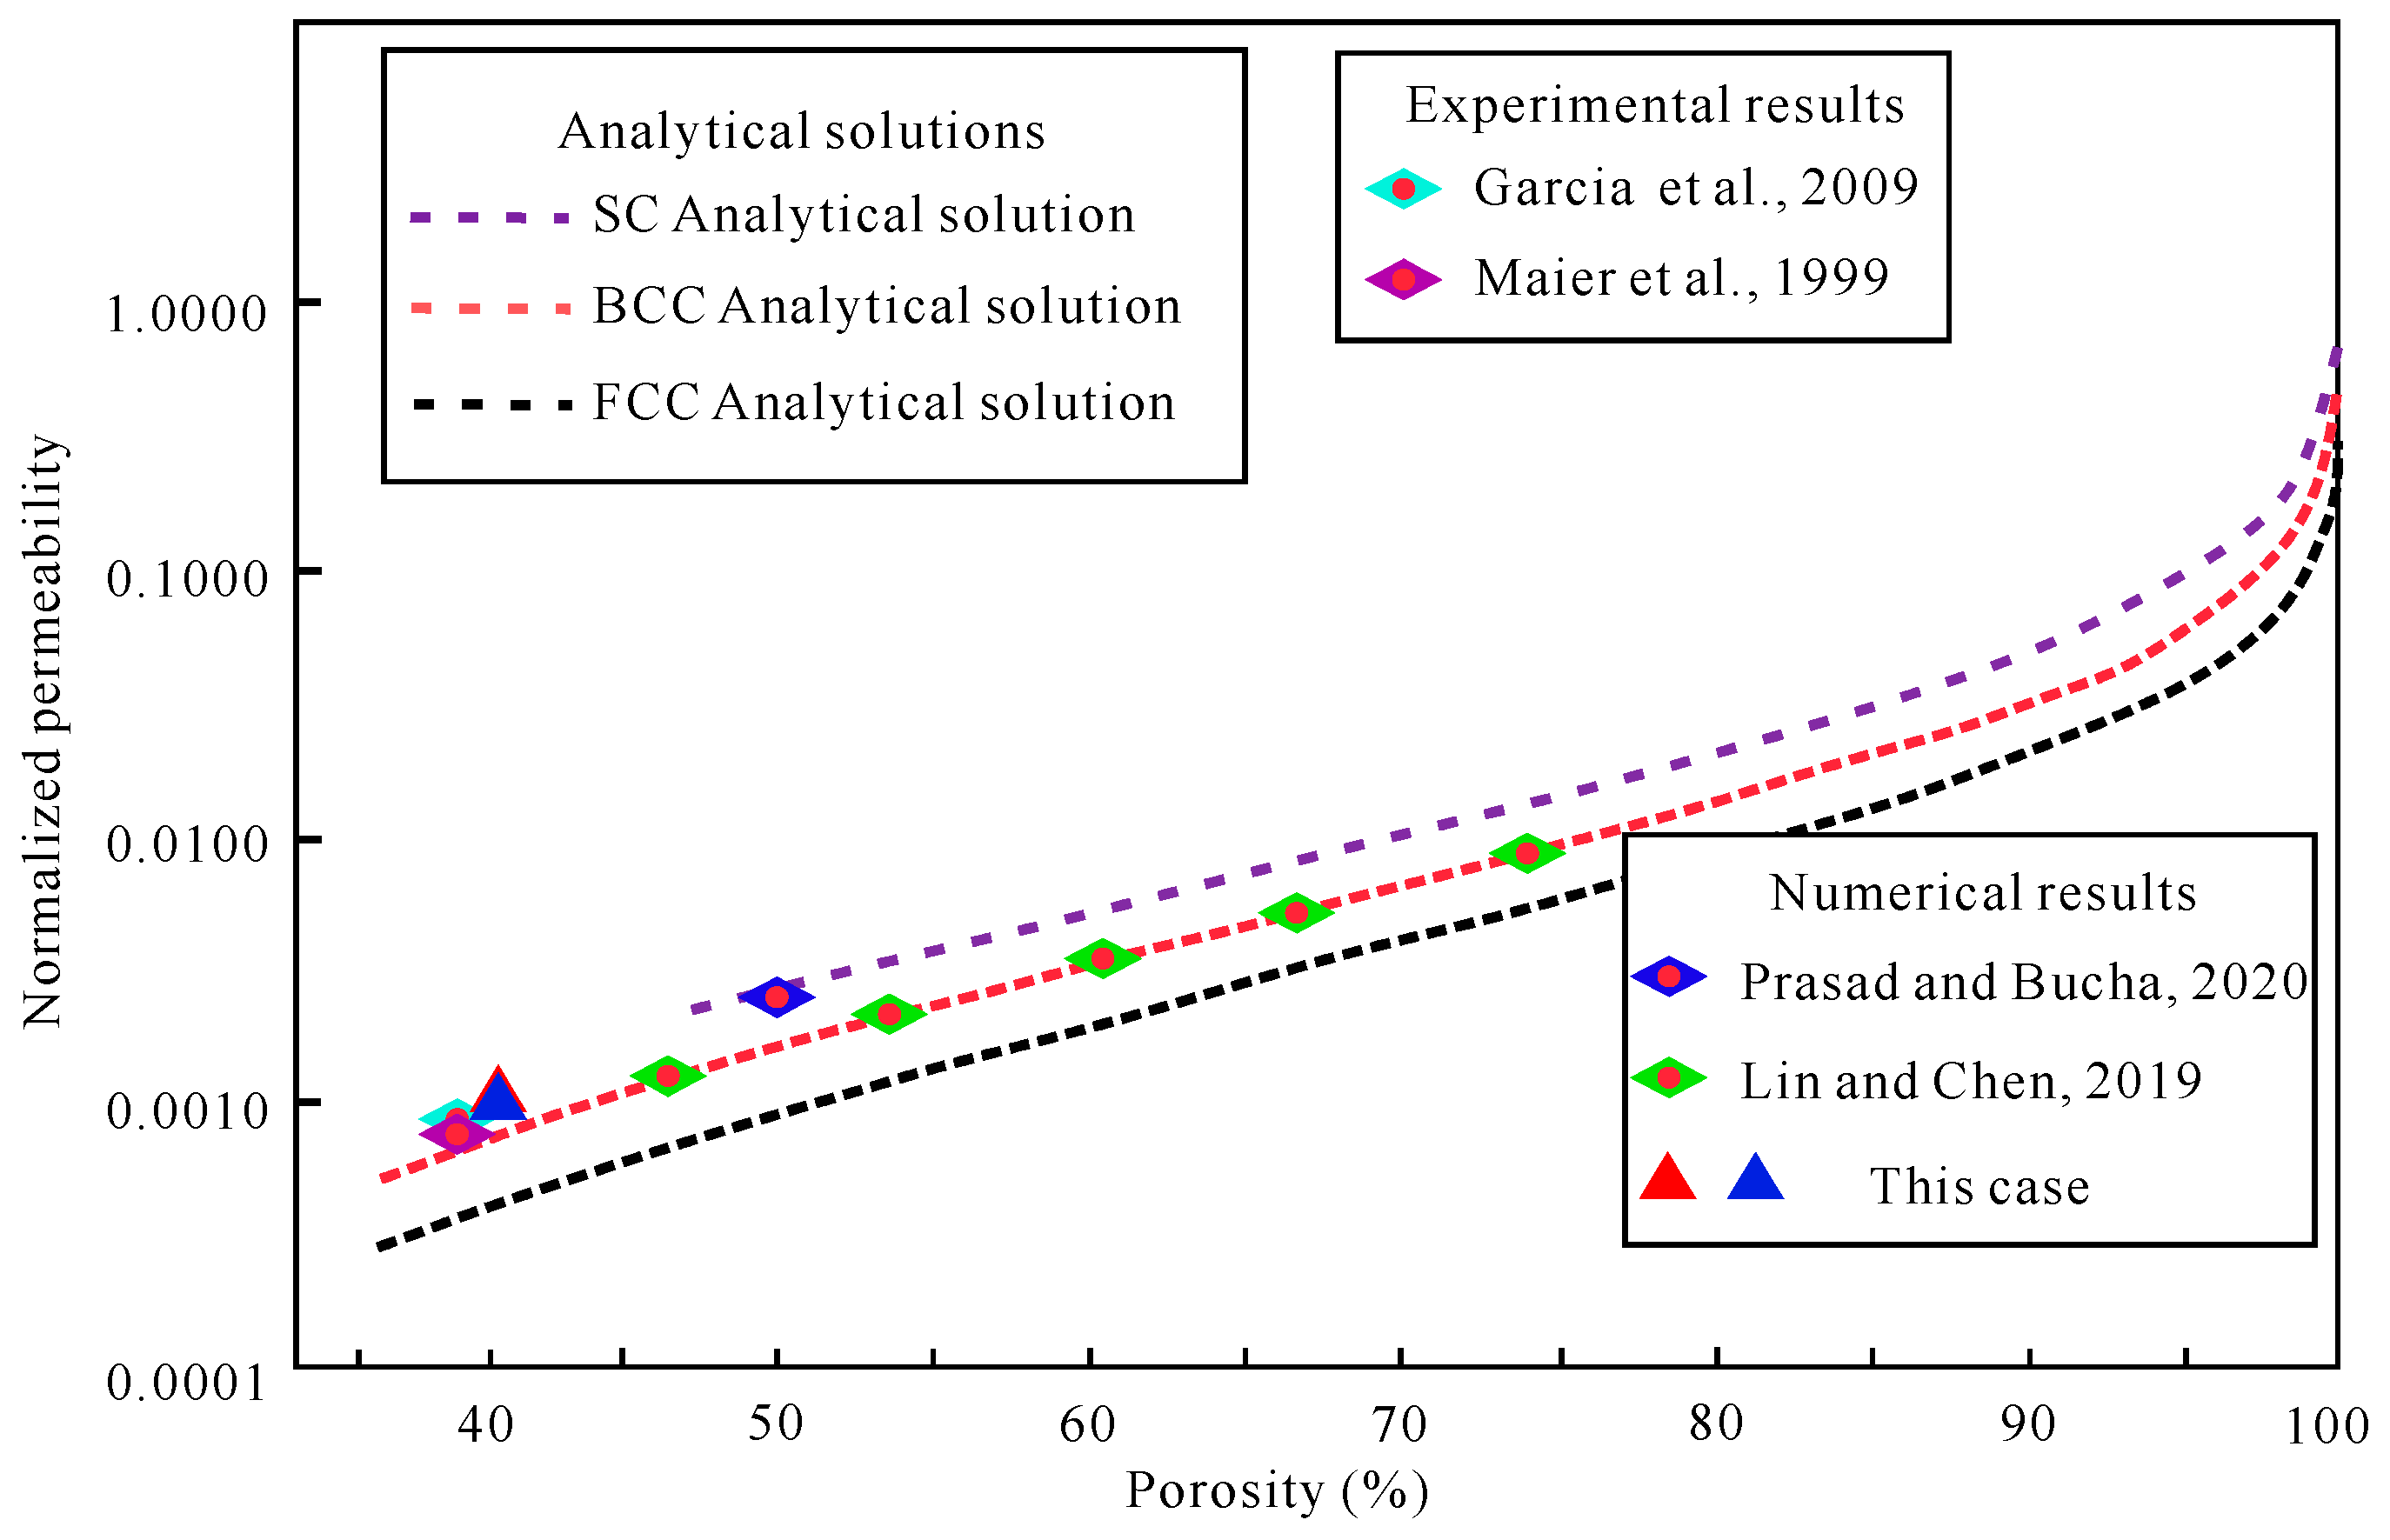
The analytical solutions for permeabilities of idealized simple cubic (SC), body-centered cubic (BCC), and face-centered cubic (FCC) arrays of spheres have been provided as representations of idealized packing structures [58,59]:
k = L 2 G π a C d
where L is the size of cubic sample; G is a coefficient and is assigned values of 6, 12, and 24 for the SC, BCC, and FCC arrays of spheres, respectively; a is particle size; Cd is the drag coefficient and was introduced by Sangani and Acrivos [60].
Additionally, previous studies have reported more experimental and numerical results. For instance, Maier et al. and Garcia et al. conducted experiments to test the normalized permeabilities P (P = k/a2), with a porosity of 0.37, yielding results of 7.48 × 10⁻⁴ and 8.24 × 10⁻⁴, respectively [40,61]; Lin and Chen [59], Prasad and Bucha [62] computed the permeabilities at different porosities using the Lattice Boltzmann method. The analytical, experimental, and numerical findings from these studies exhibit a high level of consistency with this work (see Figure 7). Therefore, the proposed method has a considerable level of accuracy and applicability.

4.2. Heterogeneous Model Consisting of Plate-Shaped, Elongated, and Spherical Particles

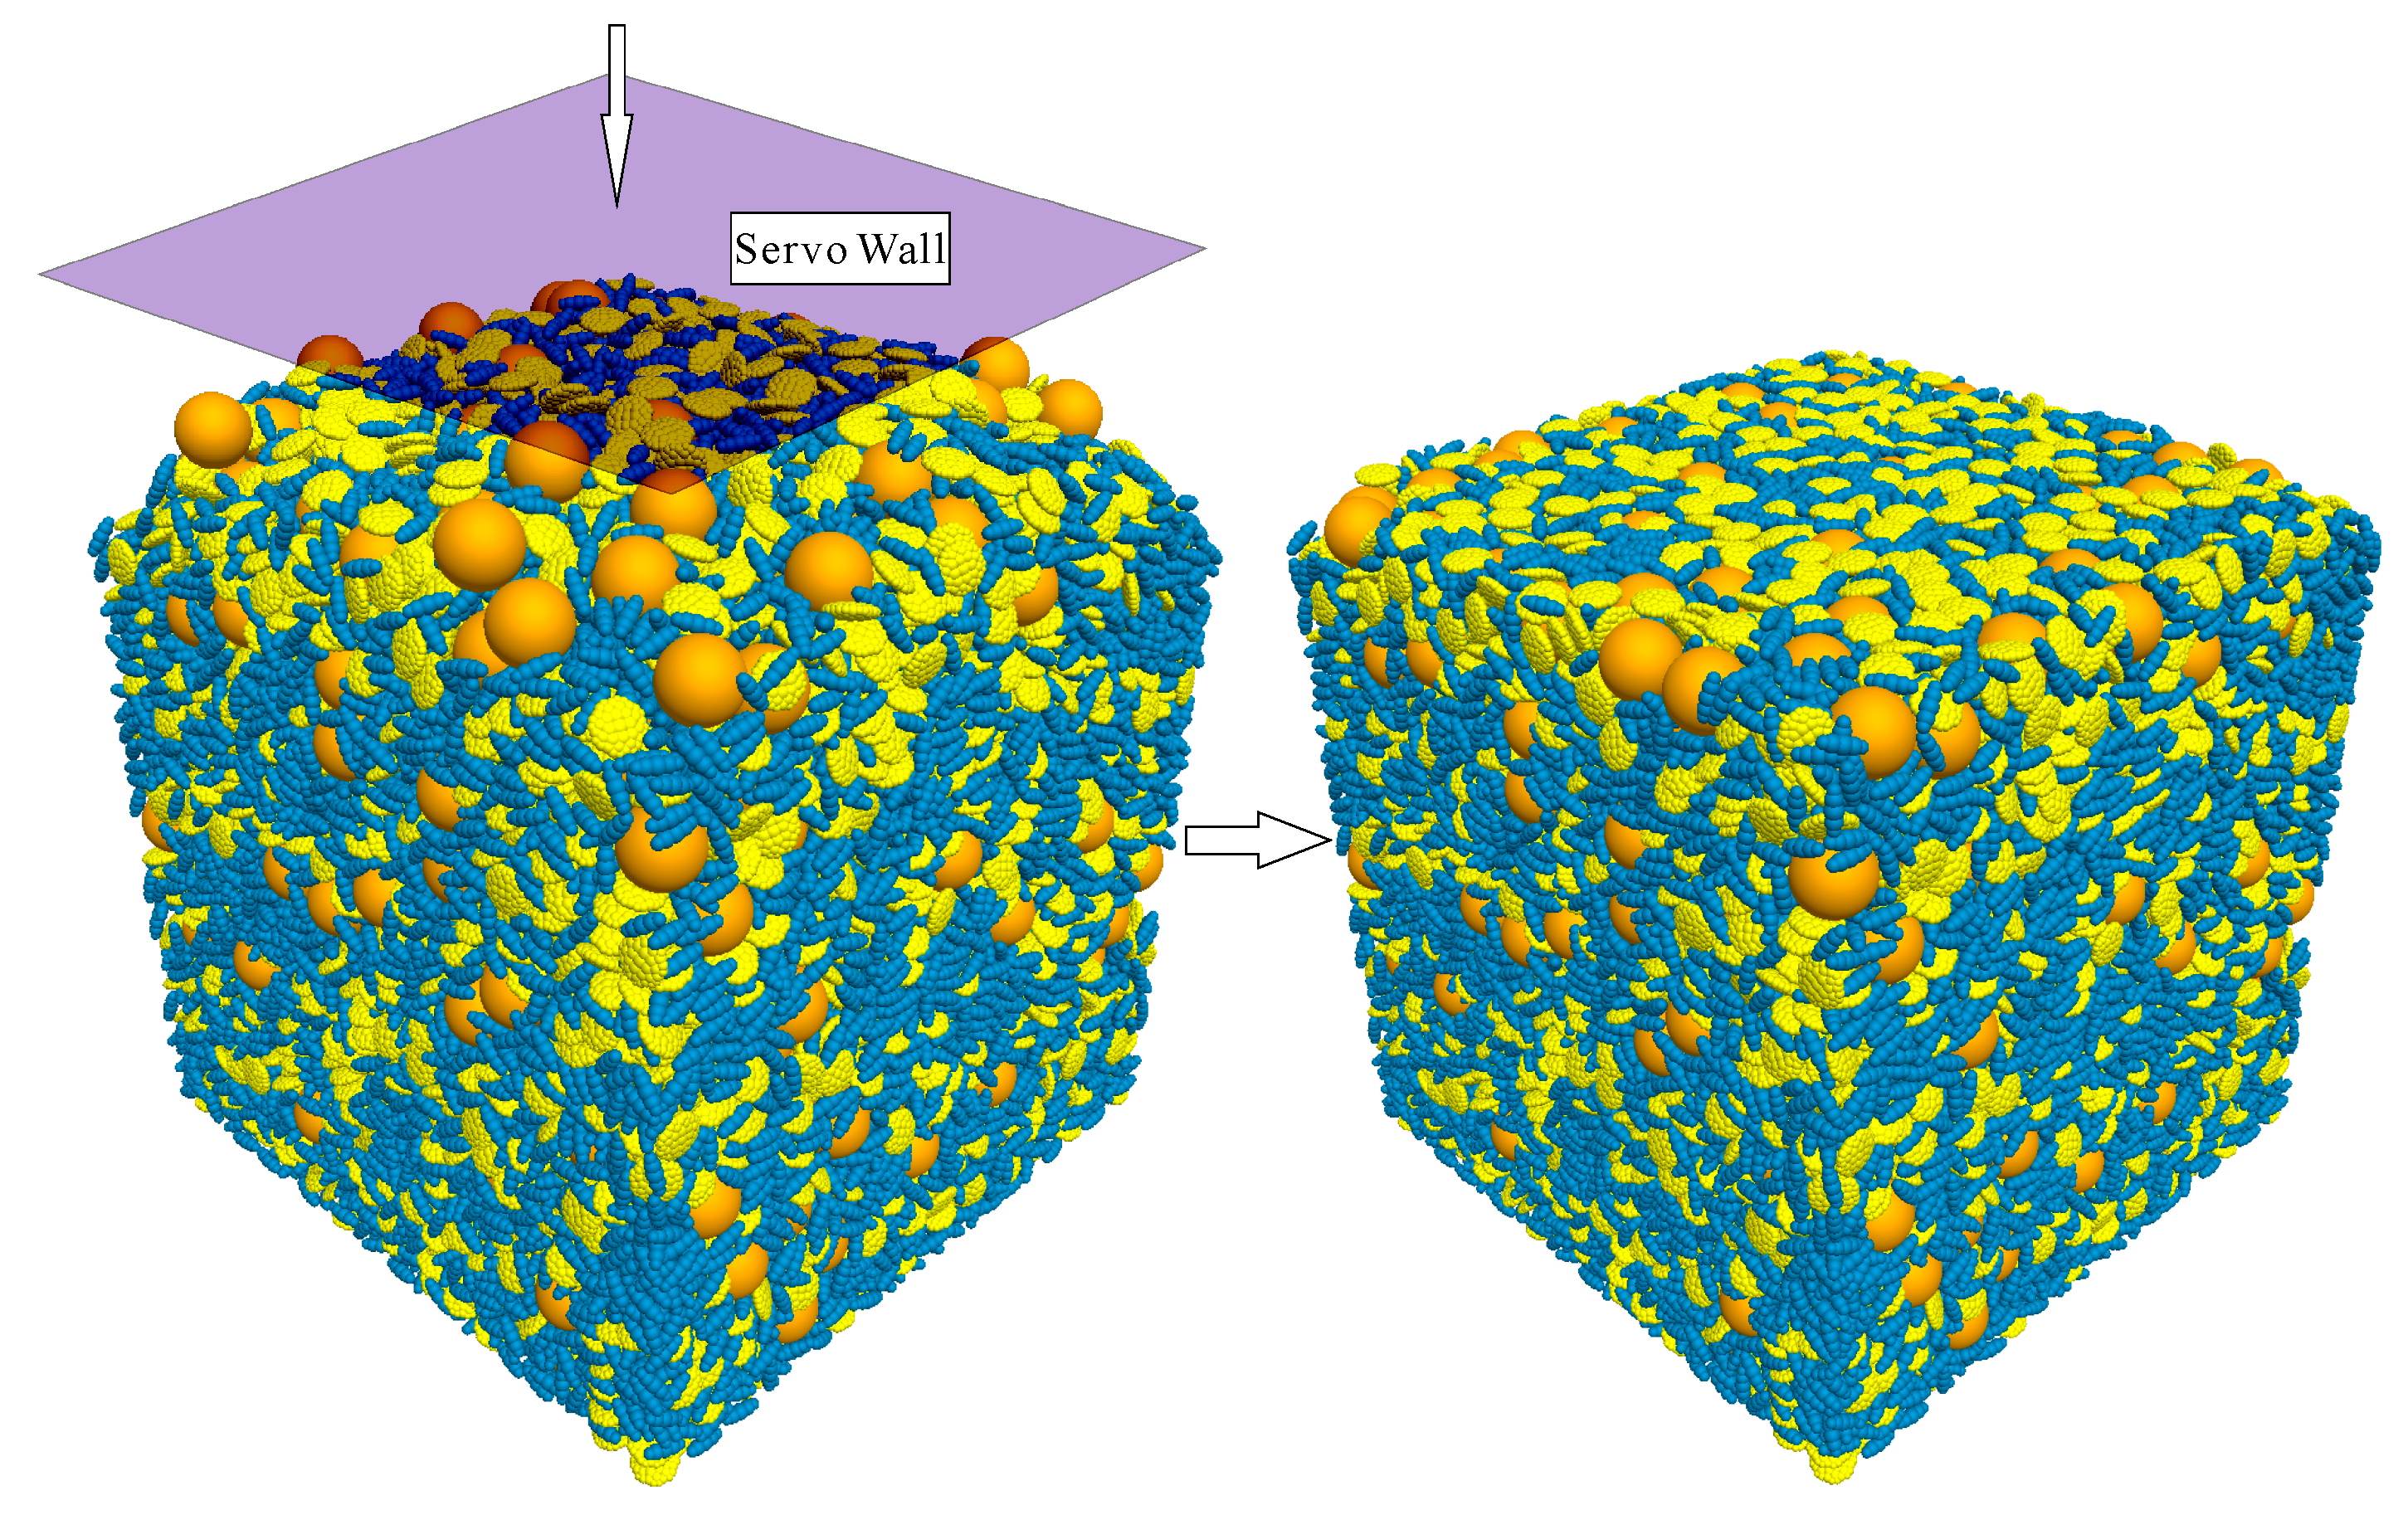
The numerical samples are established based on the microstructure and mineral characteristics of hydrate-bearing sediments in the Shenhu area, South China Sea, incorporating plate-shaped, elongated, and spherical particles (for more details, refer to our previous study by Li, Zhang [23]). The predominant minerals present in this reservoir comprise calcite (foraminifer), clay minerals, quartz, and plagioclase [63]. The distinguishing mineral characteristic of this reservoir, in comparison to other hydrate reservoirs, lies in its substantial clay component, which often exhibit elongated and plate-shaped geometrical shapes [64,65]. The horizontal permeability kh and vertical permeability kv for uncompacted sediments are, respectively, 24.31 mD and 13.72 mD with kv/kh = 0.56. As comparisons, the permeability anisotropy for cores from India’s National Gas Hydrate Program Expedition 02 exhibits kv/kh = 0.54, while the result for pressure-core sediments recovered from the Krishna–Godavari Basin, offshore India, is 0.25 [26,66]. It has been indicated that the plate-shaped is the cause of permeability anisotropy. In this work, the impact of compaction is further investigated. According to the theoretical calculation, the in situ compaction stress has the potential to reach 15.24 MPa [67]. Therefore, loads are applied to the model in stages from 0 to 16 MPa (1 MPa per stage) with a servo wall boundary (see Figure 8). At each stage, seepage simulation is conducted and the evolution of permeability anisotropy is computed.
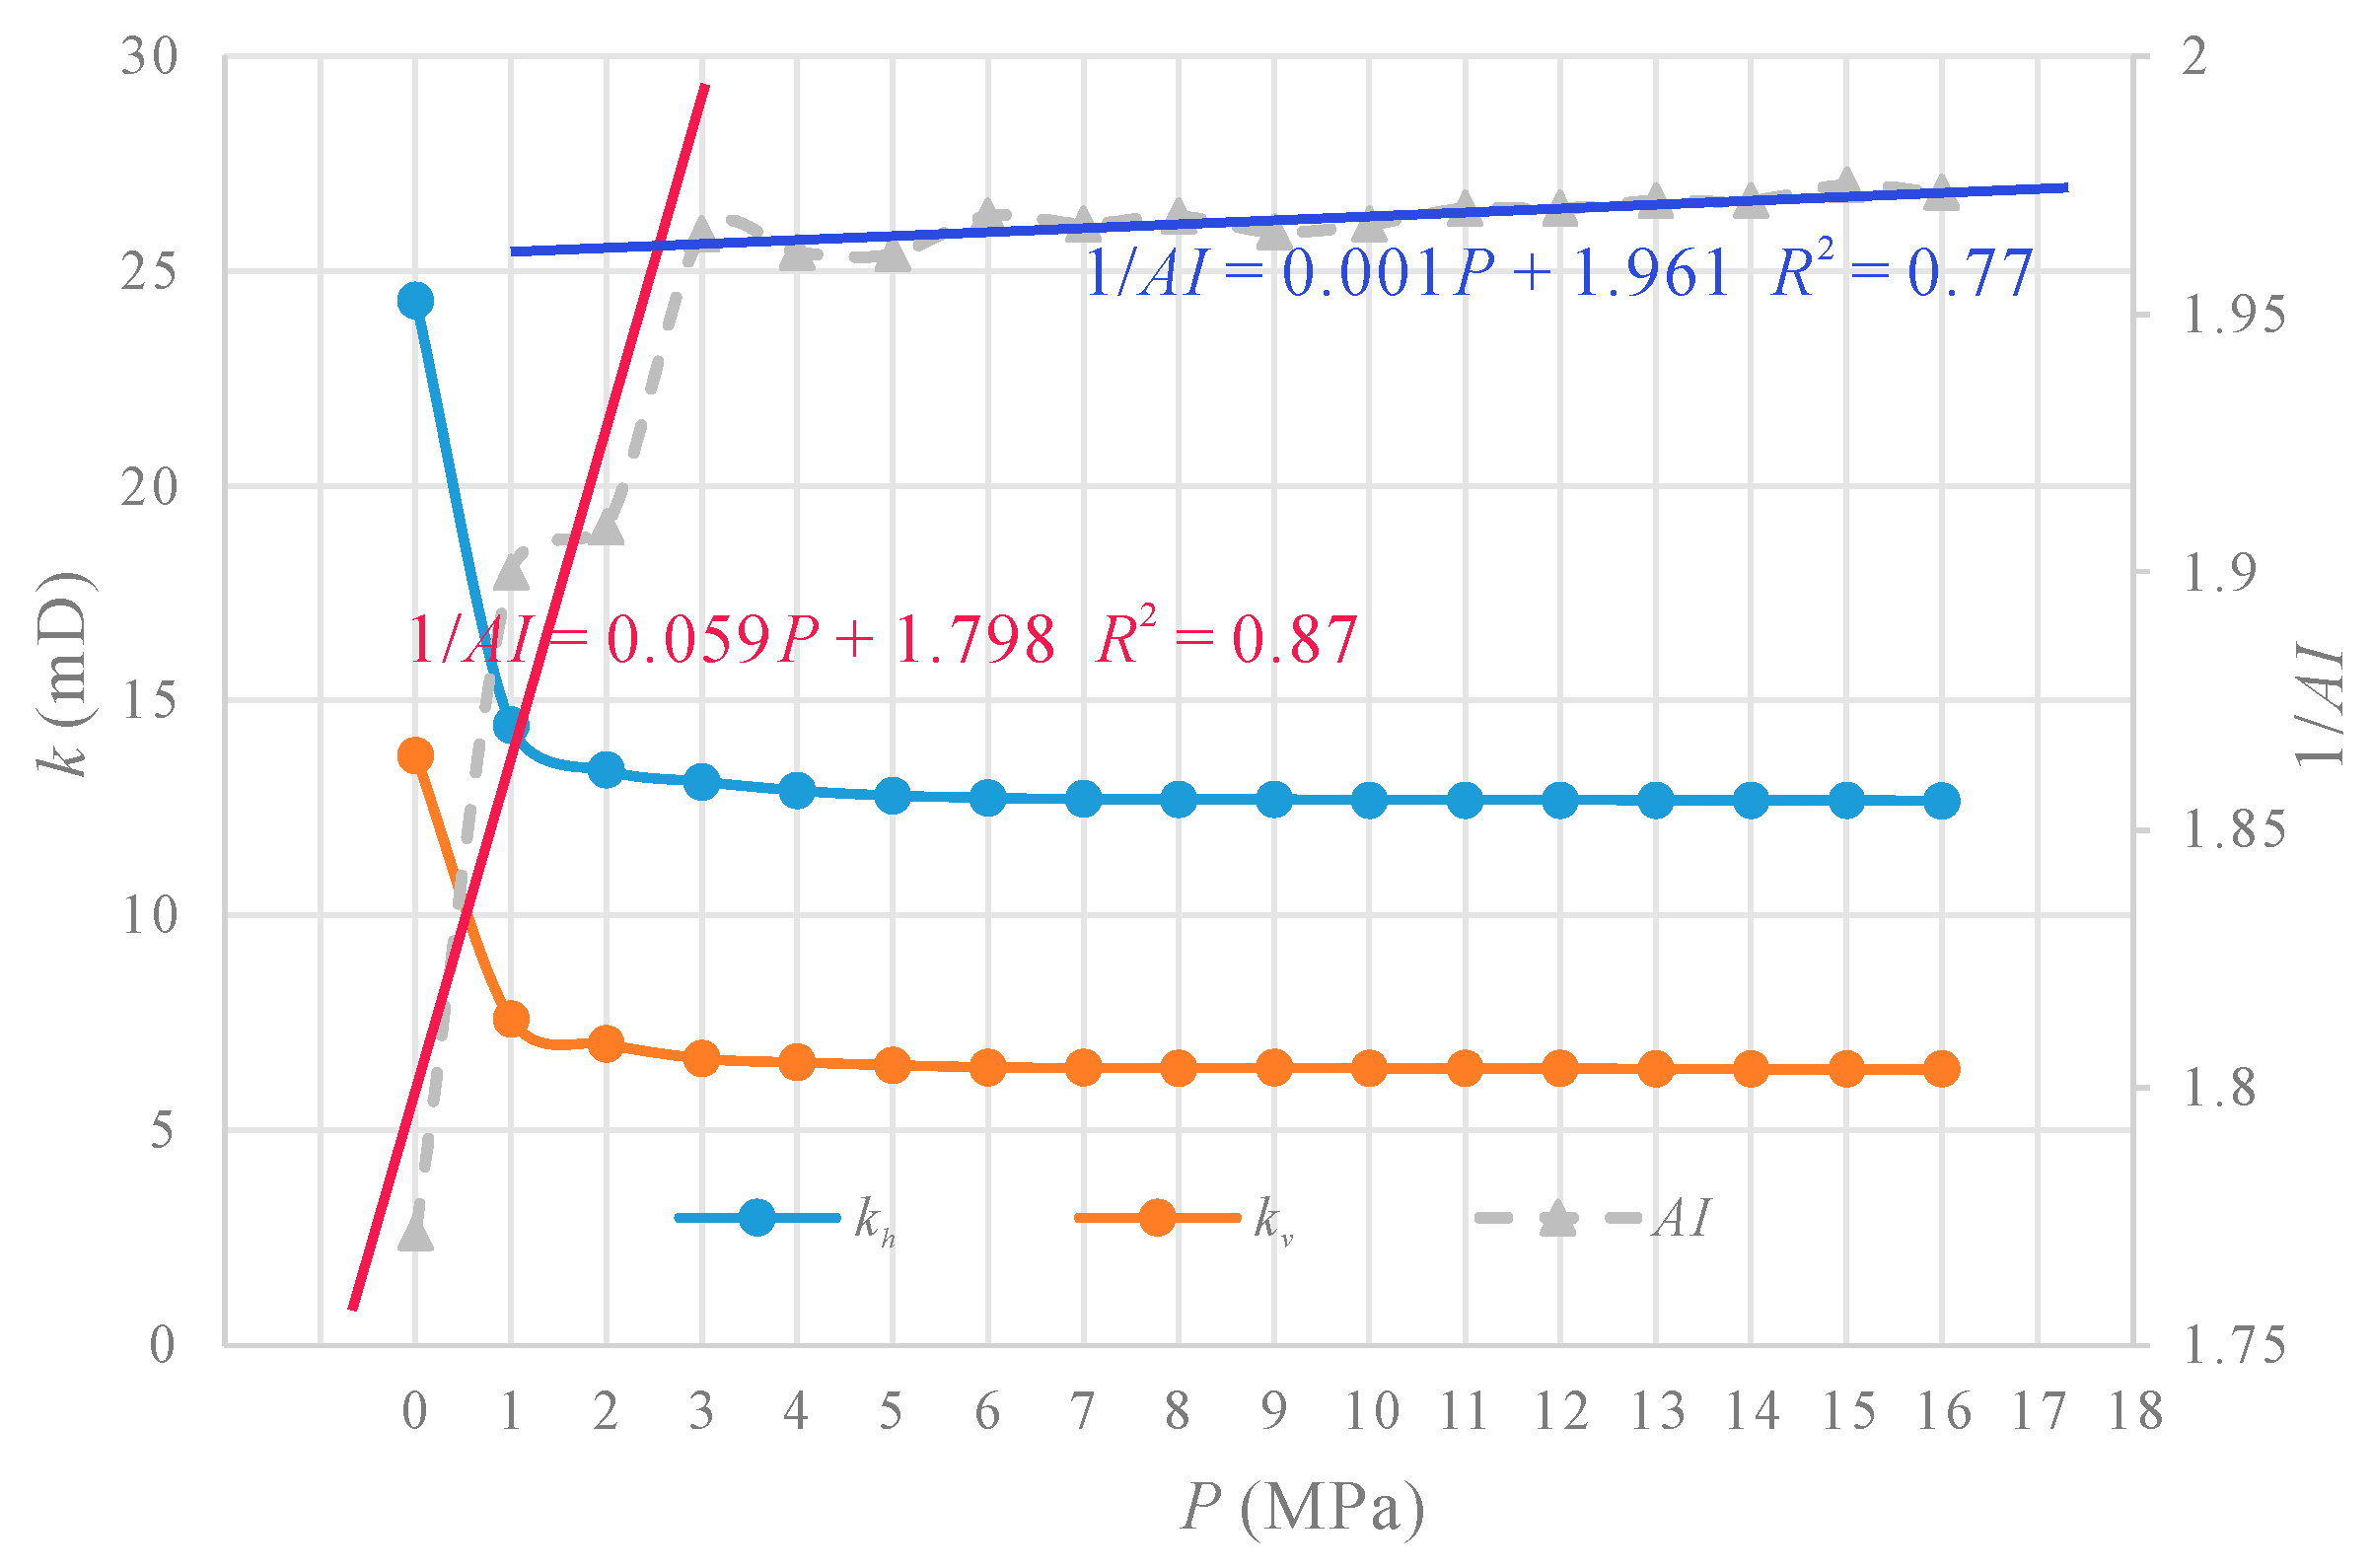
According to the simulation results, both horizontal and vertical permeability decrease with increasing compaction stress. Moreover, the decrease in the lower stress interval is considerably more pronounced compared to the reduction observed in the relatively high stress interval. Within the pressure range of 0 to 3 MPa, the horizontal permeability decreases from 24.31 mD to 13.11 mD (46.07%), and the vertical permeability decreases from 13.72 mD to 6.67 mD (51.38%) (Kv/Kh from 0.56 to 0.52). While within the pressure range of 3 MPa to 16 MPa, the horizontal permeability decreases from 13.11 mD to 12.67 mD (1.81%), and the vertical permeability decreases from 6.67 mD to 6.42 mD (1.82%) (Kv/Kh from 0.52 to 0.51). The reduction in permeability is more significant in the vertical direction compared to the horizontal direction, resulting in an increase in permeability anisotropy. Defining the ratio of vertical to horizontal permeability (Kv/Kh) as the anisotropy index (AI), the value of AI decreases from 0.56 to 0.51 with increasing compaction stress. Meanwhile, the rise of anisotropy also presents a piecewise feature. The increase of 1/AI in the lower stress interval is significantly greater than that in the relatively high stress interval (see Figure 9). To predict the change in anisotropy with compaction stress, a piecewise mathematical model is constructed. Within the pressure range of 0 to 3 MPa, the decline rate of the anisotropy index is 0.059/MPa, while within the pressure range of 3 to 16 MPa, the decline rate of the anisotropy index is 0.001/MPa.
{ 1 / A I = 0.059 P + 1.798   P < 3 MPa   R 2 = 0.87 1 / A I = 0.001 P + 1.961   P 3 MPa   R 2 = 0.77
Theoretically, the permeability anisotropy is controlled by the directional arrangement of the plate-shaped particles [23]. The average inclination angles for elongated and plate-shaped particles are calculated (Figure 10). Within the pressure range of 0 to 2 MPa, the particle position is rotatable in a relatively high porosity, and the compaction stress can drive particle rearrangement. All the non-spherical particles tend to be arranged horizontally to reduce inclination angles. Therefore, at this stage, the average inclination angles for elongated and plate-shaped particles decrease sharply. Nevertheless, as the stress increases, the porosity decreases rapidly, and the particle system forms a tight packing, which limits particle rotation. At this stage, the deceleration in average inclination angles for elongated and plate-shaped particles slows down. The decrease in the inclination angle indicates a more horizontal arrangement of particles, resulting in an enhanced permeability anisotropy. Moreover, the piecewise function of the evolution for inclination angle is also consistent with the variation in permeability anisotropy.

5. Conclusions

In this study, a DEM–CFD coupling simulation method is developed to numerically determine the permeability of an unconsolidated hydrate reservoir. Based on the microstructure and mineral characteristics of hydrate-bearing sediments in the Shenhu area, South China Sea, two typical cases are tested, and the model accuracy is verified. Mainly, the following conclusions are obtained:
(1)
According to the physical process of sedimentation, a reservoir sediments-modeling method is developed based on the DEM framework, which has the ability to restore the anisotropy of physical properties. An interface program is designed to connect the geometric models of DEM and FEM, and pore-scale computational fluid mechanics simulation is conducted to obtain the anisotropic permeability for the hydrate reservoir.
(2)
An idealized homogeneous model consisting of identically sized spherical particles are constructed, and the permeability is obtained with DEM–CFD coupling simulation. The analytical, experimental, and numerical results from previous studies exhibit a high level of consistency with this study, which verifies the accuracy and applicability of the proposed method.
(3)
With the increase in compaction stress, the permeability anisotropy exhibited a rapid initial increase, followed by a sustained stabilization. The primary cause is the rearrangement of sediment particles. The non-spherical particles are driven to align in a predominantly horizontal orientation, thereby enhancing anisotropy. A piecewise mathematical model is developed to accurately predict the evolution of permeability anisotropy with a turning point of 3 MPa.
In the future work, more true-shaped particles will be investigated to build more accurate numerical models. Moreover, experimental verification of the proposed numerical method is also the focus of the next work.

Author Contributions

Conceptualization, R.L. and L.Z.; methodology, R.L. and Z.H.; software, R.L. and S.W.; validation, Z.H. and L.Z.; formal analysis, R.L. and J.Z.; investigation, Z.H. and J.Z.; resources, L.Z.; data curation, R.L., F.H. and S.W.; writing—original draft preparation, R.L.; writing—review and editing, Z.H. and L.Z.; visualization, R.L.; supervision, Z.H. and L.Z.; project administration, Z.H. and L.Z.; funding acquisition, Z.H., J.Z. and L.Z. All authors have read and agreed to the published version of the manuscript.

Funding

This research was funded by [the Second Tibetan Plateau Scientific Expedition and Research Program (STEP) [2019QZKK0904] and [the National Natural Science Foundation of China] grant number [42107190].

Institutional Review Board Statement

Not applicable.

Informed Consent Statement

Not applicable.

Data Availability Statement

All relevant data are within the paper.

Acknowledgments

We would like to thank the editors and anonymous reviewers who have helped to improve the paper.

Conflicts of Interest

The authors declare no conflict of interest.

References

  1. Song, Y.C.; Yang, L.; Zhao, J.F.; Liu, W.G.; Yang, M.J.; Li, Y.H.; Liu, Y.; Li, Q.P. The status of natural gas hydrate research in China: A review. Renew. Sustain. Energy Rev. 2014, 31, 778–791. [Google Scholar] [CrossRef]
  2. Dong, K.; Sun, R.; Hochman, G.; Zeng, X.; Li, H.; Jiang, H. Impact of natural gas consumption on CO2 emissions: Panel data evidence from China’s provinces. J. Clean. Prod. 2017, 162, 400–410. [Google Scholar] [CrossRef]
  3. Aydin, G. Forecasting Natural Gas Production Using Various Regression Models. Pet. Sci. Technol. 2015, 33, 1486–1492. [Google Scholar] [CrossRef]
  4. Wu, L.C.; Zhu, Y.S.; Liu, Y.X.; Zhou, Z.H.; He, D.B. Development techniques of multi-layer tight gas reservoirs in mining rights overlapping blocks: A case study of the Shenmu gas field, Ordos Basin, NW China. Pet. Explor. Dev. 2015, 42, 904–912. [Google Scholar] [CrossRef]
  5. Shagapov, V.S.; Chiglintseva, A.S.; Rusinov, A.A. Theoretical modeling of gas extraction from a partially gas-saturated porous gas-hydrate reservoir with respect to thermal interactions with surrounding rocks. Theor. Found. Chem. Eng. 2016, 50, 449–458. [Google Scholar] [CrossRef]
  6. Li, Z.F.; Han, J. Environmental safety and low velocity of the development of submarine natural gas hydrate with examples of test production in South China Sea. Environ. Sci. Pollut. Res. 2021, 28, 6259–6265. [Google Scholar] [CrossRef]
  7. Chong, Z.R.; Yang, S.H.B.; Babu, P.; Linga, P.; Li, X.S. Review of natural gas hydrates as an energy resource: Prospects and challenges. Appl. Energy 2016, 162, 1633–1652. [Google Scholar] [CrossRef]
  8. Kvenvolden, K.A. Gas hydratesgeological perspective and global change. Rev. Geophys. 1993, 31, 173–187. [Google Scholar] [CrossRef]
  9. Sloan, E.D. Fundamental principles and applications of natural gas hydrates. Nature 2003, 426, 353–359. [Google Scholar] [CrossRef]
  10. Boswell, R.; Collett, T.S. Current perspectives on gas hydrate resources. Energy Environ. Sci. 2011, 4, 1206–1215. [Google Scholar] [CrossRef]
  11. Kurihara, M.; Sato, A.; Funatsu, K.; Ouchi, H.; Yamamoto, K.; Numasawa, M.; Ebinuma, T.; Narita, H.; Masuda, Y.; Dallimore, S.R.; et al. Analysis of Production Data for 2007/2008 Mallik Gas Hydrate Production Tests in Canada. In Proceedings of the International Oil and Gas Conference and Exhibition in China, Beijing, China, 8–10 June 2010; p. SPE–132155-MS. [Google Scholar]
  12. Li, J.-F.; Ye, J.-L.; Qin, X.-W.; Qiu, H.-J.; Wu, N.-Y.; Lu, H.-L.; Xie, W.-W.; Lu, J.-A.; Peng, F.; Xu, Z.-Q.; et al. The first offshore natural gas hydrate production test in South China Sea. China Geol. 2018, 1, 5–16. [Google Scholar] [CrossRef]
  13. Han, Z.; Zhang, L.; Zhou, J.; Pan, Z.; Wang, S.; Li, R. Effects of hydrate occurring mechanisms and saturation on the mechanical properties of hydrate-bearing sediments: Numerical study based on simplified DEM simulation. J. Nat. Gas Sci. Eng. 2022, 108, 104804. [Google Scholar] [CrossRef]
  14. Zangqa, S.; Saffou, E.; Gholami, R.; Zimmermann, U.; Raza, A.; Manzi, M.S.D.; Durrheim, R. Hydraulic fracturing potential of tight gas reservoirs: A case study from a gas field in the Bredasdorp Basin, South Africa. Gas Sci. Eng. 2024, 128, 205364. [Google Scholar] [CrossRef]
  15. Bosikov, I.I.; Klyuev, R.V.; Mayer, A.V. Comprehensive assessment of hydraulic fracturing technology efficiency for well construction during hydrocarbon production. J. Min. Inst. 2022, 258, 1018–1025. [Google Scholar] [CrossRef]
  16. Yan, P.; Luan, H.J.; Jiang, Y.J.; Liang, W.; Liu, M.K.; Chen, H.B. Influence of depressurization mode on natural gas hydrate production characteristics: One-dimensional experimental study. Geoenergy Sci. Eng. 2024, 234, 212671. [Google Scholar] [CrossRef]
  17. Yu, Q.; Tang, H.; Li, C.; Chen, Z.; Zhang, K.; Yu, Y.; Liang, S. Numerical Simulation of Natural-Gas-Hydrate Decomposition in Process of Heat-Injection Production. Processes 2023, 11, 2349. [Google Scholar] [CrossRef]
  18. Mahabadi, N.; Dai, S.; Seol, Y.; Jang, J. Impact of hydrate saturation on water permeability in hydrate-bearing sediments. J. Pet. Sci. Eng. 2019, 174, 696–703. [Google Scholar] [CrossRef]
  19. Delli, M.L.; Grozic, J.L.H. Experimental determination of permeability of porous media in the presence of gas hydrates. J. Pet. Sci. Eng. 2014, 120, 1–9. [Google Scholar] [CrossRef]
  20. Ruppel, C.D.; Kessler, J.D. The interaction of climate change and methane hydrates. Rev. Geophys. 2017, 55, 126–168. [Google Scholar] [CrossRef]
  21. Torres, M.E.; Trehu, A.M.; Cespedes, N.; Kastner, M.; Wortmann, U.G.; Kim, J.H.; Long, P.; Malinverno, A.; Pohlman, J.W.; Riedel, M.; et al. Methane hydrate formation in turbidite sediments of northern Cascadia, IODP Expedition 311. Earth Planet. Sci. Lett. 2008, 271, 170–180. [Google Scholar] [CrossRef]
  22. Stewart, M.L.; Ward, A.L.; Rector, D.R. A study of pore geometry effects on anisotropy in hydraulic permeability using the lattice-Boltzmann method. Adv. Water Resour. 2006, 29, 1328–1340. [Google Scholar] [CrossRef]
  23. Li, R.R.; Zhang, L.Q.; Zhou, J.; Han, Z.H.; Pan, Z.J.; Schüttrumpf, H. Investigation on permeability anisotropy in unconsolidated hydrate-bearing sediments based on pore-scale numerical simulation: Effect of mineral particle shape and pore-filling. Energy 2023, 267, 126456. [Google Scholar] [CrossRef]
  24. Li, R.R.; Zhang, L.Q.; Han, Z.H.; Zhou, J.; Wang, S.; Schuettrumpf, H. Effect of interlayer mixed zone and effective stress on permeability anisotropy of NGH turbidite reservoir. Energy 2023, 284, 129172. [Google Scholar] [CrossRef]
  25. Zhang, Z.; Liu, L.L.; Ning, F.L.; Liu, Z.C.; Sun, J.Y.; Li, X.D.; Sun, J.X.; Hyodo, M.; Liu, C.L. Effect of stress on permeability of clay silty cores recovered from the Shenhu hydrate area of the South China Sea. J. Nat. Gas Sci. Eng. 2022, 99, 104421. [Google Scholar] [CrossRef]
  26. Yoneda, J.; Oshima, M.; Kida, M.; Kato, A.; Konno, Y.; Jin, Y.; Jang, J.B.; Waite, W.F.; Kumar, P.; Tenma, N. Permeability variation and anisotropy of gas hydrate-bearing pressure-core sediments recovered from the Krishna-Godavari Basin, offshore India. Mar. Pet. Geol. 2019, 108, 524–536. [Google Scholar] [CrossRef]
  27. Hu, C.; Jia, Y.G.; Duan, Z.B. The influence of inhomogeneous hydrate formation on permeability anisotropy of porous media. Geo-Mar. Lett. 2021, 41, 10. [Google Scholar] [CrossRef]
  28. Rudyk, S.; Al-Musalhi, M.; Taura, U.; Spirov, P. Matching of Water Breakthroughs in a Low-Resistivity Oil Reservoir Using Permeability Anisotropy. Appl. Sci. 2024, 14, 4618. [Google Scholar] [CrossRef]
  29. Ren, X.W.; Guo, Z.Y.; Ning, F.L.; Ma, S.Z. Permeability of hydrate-bearing sediments. Earth-Sci. Rev. 2020, 202, 103100. [Google Scholar] [CrossRef]
  30. Masuda, Y.; Naganawa, S.; Ando, S.; Sato, K. Numerical calculation of gas production performance from reservoirs containing natural gas hydrates. SPE J. 1997, 29, 38291. [Google Scholar]
  31. Wang, Q.; Chen, X.; Zhang, L.; Wang, Z.; Wang, D.; Dai, S. An Analytical Model for the Permeability in Hydrate-Bearing Sediments Considering the Dynamic Evolution of Hydrate Saturation and Pore Morphology. Geophys. Res. Lett. 2021, 48, e2021GL093397. [Google Scholar] [CrossRef]
  32. Kleinberg, R.L.; Flaum, C.; Griffin, D.D.; Brewer, P.G.; Malby, G.E.; Peltzer, E.T.; Yesinowski, J.P. Deep sea NMR: Methane hydrate growth habit in porous media and its relationship to hydraulic permeability, deposit accumulation, and submarine slope stability. J. Geophys. Res. Solid Earth 2003, 108, 2508. [Google Scholar] [CrossRef]
  33. Zhang, Z.; Liu, L.L.; Lu, W.J.; Liu, C.L.; Ning, F.L.; Dai, S. Permeability of hydrate-bearing fine-grained sediments: Research status, challenges and perspectives. Earth-Sci. Rev. 2023, 244, 104517. [Google Scholar] [CrossRef]
  34. Seol, Y.; Kneafsey, T.J. Methane hydrate induced permeability modification for multiphase flow in unsaturated porous media. J. Geophys. Res.-Solid Earth 2011, 116, B08102. [Google Scholar] [CrossRef]
  35. Konno, Y.; Yoneda, J.; Egawa, K.; Ito, T.; Jin, Y.; Kida, M.; Suzuki, K.; Fujii, T.; Nagao, J. Permeability of sediment cores from methane hydrate deposit in the Eastern Nankai Trough. Mar. Pet. Geol. 2015, 66, 487–495. [Google Scholar] [CrossRef]
  36. Lagioia, R.; Sanzeni, A.; Colleselli, F. Air, water and vacuum pluviation of sand specimens for the triaxial apparatus. Soils Found. 2006, 46, 61–67. [Google Scholar] [CrossRef]
  37. Deng, P.; Zhu, J.T. Anisotropy of Unsaturated Layered Soils: Impact of Layer Composition and Domain Size. Soil Sci. Soc. Am. J. 2015, 79, 487–494. [Google Scholar] [CrossRef]
  38. Wang, M.; Pan, N. Numerical analyses of effective dielectric constant of multiphase microporous media. J. Appl. Phys. 2007, 101, 114102. [Google Scholar] [CrossRef]
  39. Kou, X.; Li, X.-S.; Wang, Y.; Liu, J.-W.; Chen, Z.-Y. Heterogeneity of hydrate-bearing sediments: Definition and effects on fluid flow properties. Energy 2021, 229, 120736. [Google Scholar] [CrossRef]
  40. Garcia, X.; Akanji, L.T.; Blunt, M.J.; Matthai, S.K.; Latham, J.P. Numerical study of the effects of particle shape and polydispersity on permeability. Phys. Rev. E 2009, 80, 021304. [Google Scholar] [CrossRef]
  41. Zhang, Y.C.; Li, C.F.; Ma, J.S.; Liu, L.L.; Golsanami, N.; Wan, Y.Z.; Liu, C.L. Investigating the effective permeability evolution as a function of hydrate saturation in the hydrate-bearing sands using a kinetic-theory-based pore network model. Comput. Geotech. 2022, 150, 104930. [Google Scholar] [CrossRef]
  42. Mahabadi, N.; Dai, S.; Seol, Y.; Yun, T.S.; Jang, J. The water retention curve and relative permeability for gas production from hydrate-bearing sediments: Pore-network model simulation. Geochem. Geophys. Geosyst. 2016, 17, 3099–3110. [Google Scholar] [CrossRef]
  43. Wang, J.Q.; Zhao, J.F.; Zhang, Y.; Wang, D.Y.; Li, Y.H.; Song, Y.C. Analysis of the effect of particle size on permeability in hydrate-bearing porous media using pore network models combined with CT. Fuel 2016, 163, 34–40. [Google Scholar] [CrossRef]
  44. Hou, J.; Ji, Y.K.; Zhou, K.; Liu, Y.G.; Wei, B. Effect of hydrate on permeability in porous media: Pore-scale micro-simulation. Int. J. Heat Mass Transf. 2018, 126, 416–424. [Google Scholar] [CrossRef]
  45. Kossel, E.; Deusner, C.; Bigalke, N.; Haeckel, M. The Dependence of Water Permeability in Quartz Sand on Gas Hydrate Saturation in the Pore Space. J. Geophys. Res.-Solid Earth 2018, 123, 1235–1251. [Google Scholar] [CrossRef]
  46. Fang, F.; Ning, F.L.; Ou, W.J.; Wang, D.D.; Zhang, Z.; Yu, Y.J.; Lu, H.F.; Wu, J.Y.; Vlugt, T.J.H. The dynamic behavior of gas hydrate dissociation by heating in tight sandy reservoirs: A molecular dynamics simulation study. Fuel 2019, 258, 116106. [Google Scholar] [CrossRef]
  47. Markauskas, D.; Kruggel-Emden, H.; Sivanesapillai, R.; Steeb, H. Comparative study on mesh-based and mesh-less coupled CFD-DEM methods to model particle-laden flow. Powder Technol. 2017, 305, 78–88. [Google Scholar] [CrossRef]
  48. Talele, V.; Vadaje, Y. An ANN-based data-predictive approach for comparative study between CFD finite difference and finite volume method. Int. J. Mod. Phys. C 2022, 33, 1–20. [Google Scholar] [CrossRef]
  49. Jeong, W.; Seong, J. Comparison of effects on technical variances of computational fluid dynamics (CFD) software based on finite element and finite volume methods. Int. J. Mech. Sci. 2014, 78, 19–26. [Google Scholar] [CrossRef]
  50. Oelschlager, K. Simulation of the solution of a viscous porous medium equation by a particle method. SIAM J. Numer. Anal. 2002, 40, 1716–1762. [Google Scholar] [CrossRef]
  51. Portella, G.; Polupanow, T.; Zocher, F.; Boytsov, D.A.; Pohl, P.; Diederichsen, U.; de Groot, B.L. Design of Peptide-Membrane Interactions to Modulate Single-File Water Transport through Modified Gramicidin Channels. Biophys. J. 2012, 103, 1698–1705. [Google Scholar] [CrossRef] [PubMed]
  52. Cundall, P.A. A computer model for simulating progressive, large-scale movements in block rock systems. In Proceedings of the Symposium of the International Society for Rock Mechanics, Society for Rock Mechanics (ISRM), Nancy, France, 4–6 October 1971; Volume 1(II-B). [Google Scholar]
  53. Hart, R.; Cundall, P.A.; Lemos, J. Formulation of a three-dimensional distinct element model—Part II. Mechanical calculations for motion and interaction of a system composed of many polyhedral blocks. Int. J. Rock Mech. Min. Sci. Geomech. Abstr. 1988, 25, 117–125. [Google Scholar] [CrossRef]
  54. Blott, S.J.; Pye, K. Particle shape: A review and new methods of characterization and classification. Sedimentology 2008, 55, 31–63. [Google Scholar] [CrossRef]
  55. Liang, R.; Schruff, T.; Jia, X.D.; Schuttrumpf, H.; Frings, R.M. Validation of a stochastic digital packing algorithm for porosity prediction in fluvial gravel deposits. Sediment. Geol. 2015, 329, 18–27. [Google Scholar] [CrossRef]
  56. Cundall, P.A.; Strack, O.D.L. A discrete numerical model for granular assemblies. Géotechnique 1979, 29, 47–65. [Google Scholar] [CrossRef]
  57. Jin, G.; Torres-Verdin, C.; Lan, C. Pore-Level Study of Grain-Shape Effects on Petrophysical Properties of Porous Media. In Proceedings of the SPWLA 50th Annual Logging Symposium, The Woodlands, TX, USA, 21–24 June 2009. SPWLA–2009-62136. [Google Scholar]
  58. Zhang, M.; Ye, G.; Breugel, K.V. Microstructure-based modeling of permeability of cementitious materials using multiple-relaxation-time lattice Boltzmann method. Comput. Mater. Sci. 2013, 68, 142–151. [Google Scholar] [CrossRef]
  59. Lin, J.; Chen, H. Lattice Boltzmann simulation of fluid flow through random packing beds of Platonic particles: Effect of particle characteristics. Particuology 2019, 47, 41–53. [Google Scholar] [CrossRef]
  60. Sangani, A.S.; Acrivos, A. Slow flow through a periodic array of spheres. Int. J. Multiph. Flow 1982, 8, 343–360. [Google Scholar] [CrossRef]
  61. Maier, R.S.; Kroll, D.M.; Davis, H.T.; Bernard, R.S. Simulation of flow in bidisperse sphere packings. J. Colloid Interface Sci. 1999, 217, 341–347. [Google Scholar] [CrossRef]
  62. Prasad, M.K.; Bucha, T. Magnetohydrodynamic creeping flow around a weakly permeable spherical particle in cell models. Pramana 2020, 94, 24. [Google Scholar] [CrossRef]
  63. Shi, S.; Chen, X.; Ma, J.; Sun, Y.; Sun, C. Natural Gas Hydrate Reservoir Classification and Characterization in the Well W19 of Shenhu Sea Area, northern South China Sea. Spec. Oil Gas Reserv. 2019, 26, 24–29. [Google Scholar] [CrossRef]
  64. Lyu, X.; Li, Q.; Ge, Y.; Zhu, J.; Zhou, S.; Fu, Q. Fundamental characteristics of gas hydrate-bearing sediments in the Shenhu area, South China Sea. Front. Energy 2021, 15, 367–373. [Google Scholar] [CrossRef]
  65. Guo, X.S.; Nian, T.K.; Zhao, W.; Gu, Z.D.; Liu, C.P.; Liu, X.L.; Jia, Y.G. Centrifuge experiment on the penetration test for evaluating undrained strength of deep-sea surface soils. Int. J. Min. Sci. Technol. 2022, 32, 363–373. [Google Scholar] [CrossRef]
  66. Dai, S.; Kim, J.; Xu, Y.; Waite, W.F.; Jang, J.; Yoneda, J.; Collett, T.S.; Kumar, P. Permeability anisotropy and relative permeability in sediments from the National Gas Hydrate Program Expedition 02, offshore India. Mar. Pet. Geol. 2019, 108, 705–713. [Google Scholar] [CrossRef]
  67. Mao, P.X.; Sun, J.X.; Ning, F.L.; Hu, G.W.; Wan, Y.Z.; Cao, X.X.; Wu, N.Y. Effect of permeability anisotropy on depressurization-induced gas production from hydrate reservoirs in the South China Sea. Energy Sci. Eng. 2020, 8, 2690–2707. [Google Scholar] [CrossRef]
Figure 1. Sediment particles and their numerical characterization: (a) actual reservoir sediments; (b) ellipsoid clump units with similar particle shape.
Jmse 12 01447 g001
Figure 2. Simulation of physical process for pluviation method.
Jmse 12 01447 g002
Figure 3. Characterization of non-spherical particles and extraction of attitude angle: (a) particle flow method; (b) finite element method, the red arrows represent normal vectors.
Jmse 12 01447 g003
Figure 4. Generalized model of CFD simulation: (a) mesh of pore space; (b) boundary conditions, the color indicates the flow velocity and red represents higher flow velocity.
Jmse 12 01447 g004
Figure 5. Sediments model consisting of identically sized spherical particles.
Jmse 12 01447 g005
Figure 6. Horizontal and vertical flow field for homogeneous model.
Jmse 12 01447 g006
Figure 7. Experimental results, numerical results, and analytical results for permeability in samples with uniform spherical particles [40,59,61,62].
Jmse 12 01447 g007
Figure 8. Compaction of model with servo wall.
Jmse 12 01447 g008
Figure 9. Permeability and anisotropy evolution with increasing compaction stress.
Jmse 12 01447 g009
Figure 10. Average inclination angle evolution with increasing compaction stress.
Jmse 12 01447 g010
Table 1. Parameters in CFD simulation.
ParameterValue
Density (kg/m3)1000
Dynamic viscosity (Pa·s)0.001
L (μm)30
Pin (Pa)1
Pout (Pa)0
Disclaimer/Publisher’s Note: The statements, opinions and data contained in all publications are solely those of the individual author(s) and contributor(s) and not of MDPI and/or the editor(s). MDPI and/or the editor(s) disclaim responsibility for any injury to people or property resulting from any ideas, methods, instructions or products referred to in the content.