Article

Synergistic Integration of Multiple Wave Energy Converters with Adaptive Resonance and Offshore Floating Wind Turbines through Bayesian Optimization

Department of Ocean Engineering, Texas A&M University, 3145 TAMU, College Station, TX 77840, USA
*
Author to whom correspondence should be addressed.
J. Mar. Sci. Eng. 2024, 12(8), 1455; https://doi.org/10.3390/jmse12081455
Submission received: 9 July 2024 / Revised: 31 July 2024 / Accepted: 16 August 2024 / Published: 22 August 2024
(This article belongs to the Special Issue The Control, Modeling, and the Development of Wave Energy Convertors)

Abstract

:
We developed a synergistic ocean renewable system where an array of Wave Energy Converters (WEC) with adaptive resonance was collocated with a Floating Offshore Wind Turbine (FOWT) such that the WECs, capturing wave energy through the resonance adapting to varying irregular waves, consequently reduced FOWFT loads and turbine motions. Combining Surface-Riding WECs (SR-WEC) individually designed to feasibly relocate their natural frequency at the peak of the wave excitation spectrum for each sea state, and to obtain the highest capture width ratio at one of the frequent sea states for annual average power in a tens of kilowatts scale with a 15 MW FOWT based on a semi-submersible, Bayesian Optimization is implemented to determine the arrangement of WECs that minimize the annual representation of FOWT’s wave excitation spectra. The time-domain simulation of the system in the optimized arrangement is performed, including two sets of interactions: one set is the wind turbine dynamics, mooring lines, and floating body dynamics for FOWT, and the other set is the nonlinear power-take-off dynamics, linear mooring, and individual WECs’ floating body dynamics. Those two sets of interactions are further coupled through the hydrodynamics of diffraction and radiation. For sea states comprising Annual Energy Production, we investigate the capture width ratio of WECs, wave excitation on FOWT, and nacelle acceleration of the turbine compared to their single unit operations. We find that the optimally arranged SR-WECs reduce the wave excitation spectral area of FOWT by up to 60% and lower the turbine’s peak nacelle acceleration by nearly 44% in highly occurring sea states, while multiple WECs often produce more than the single operation, achieving adaptive resonance with a larger wave excitation spectra for those sea states. The synergistic system improves the total Annual Energy Production (AEP) by 1440 MWh, and we address which costs of Levelized Cost Of Energy (LCOE) can be reduced by the collocation.

1. Introduction

Floating Offshore Wind Turbines (FOWTs), designed to harness higher wind speeds farther from the shore in water depths up to 1000 m, have excessively large floating platform loads and motions compared to the fixed wind turbines on land [1]. Meanwhile, extracting high energy from ocean waves is complex due to the constantly varying sea states and multiple conversions required to obtain electrical power from irregular waves. The reported satisfactory performance by Wave Energy Converters (WECs) tends to entail infeasible Levelized Cost Of Energy (LCOE) values as many devices emulate the principle of a hydro-dam, which takes kinetic energy with respect to a fixed or strong boundary, leading to excessive costs [2].
Collocated systems, the integration of FOWTs with WECs in the same geographical area, have initially been examined to increase energy capture and reduce the variability in absorbed power [3,4,5]. Within such a system, the complementary requirements for efficient energy absorption by the FOWT and WECs would entail that the energy absorbed by the WECs from the waves subsequently minimizes the loads and platform motions of the FOWT. These excessive loads and platform motions negatively affect turbine performance, fatigue loading, costs, and also pose an enhanced risk of shutdown [3,4,5]. The research on synergistic collocated systems has mostly been limited to wave height reduction due to WEC energy absorption, which extends the FOWT maintenance window, limiting downtime and operational costs [6,7,8]. In recent studies, collocation has also been shown to improve the capacity factor and reduce the variability in electrical power transmitted to the grid [9,10]. The impact of collocation on mooring line fatigue loads is evaluated using modified wave heights due to a single WEC without taking into account the hydrodynamic coupling in radiation and diffraction between FOWT and the WEC [11]. Limited work has been carried out on exploring the role of WECs in mitigating the motions and loads of the FOWT platform, considering the hydrodynamic interaction between the FOWT and WEC. A coupled theoretical model detailing the interactions between the FOWT and WECs in the frequency domain is assessed, which may not be valid when components such as the power-take-off (PTO) operate nonlinearly [12]. A few more studies have investigated this effect in the context of seabed-fixed offshore wind turbines, which are not concerned with motions and loads acting on the platform [13,14].
The goal of the present study is to minimize the loads and motions acting on the FOWT using the identification of an optimal arrangement of multiple WECs, which adaptively change their natural frequency in varying sea states, including the interactions of wind turbine dynamics, mooring lines, and the nonlinear PTO loads for the WECs, which has not been addressed comprehensively in the present literature.
In this paper, we integrate the Surface-Riding Wave Energy Converter (SR-WEC) [15] and the 15-MW reference FOWT [16], focusing on coupled hydrodynamics in radiation and diffraction between them in a collocated array. We employ Bayesian optimization to efficiently identify the optimal spatial arrangement of the SR-WECs, which minimizes the annual representative wave excitation spectra acting on the FOWT using Boundary Element Method (BEM) [17]. The performance of the optimized array is evaluated in different sea states in the time domain, including the effect of aerodynamic loads, mooring line loads, and nonlinear PTO loads of the SR-WEC using WEC-Sim and MOST (MATLAB for Offshore Simulation Tool, v1.0.0, Department of Mechanical and Aerospace Engineering, Politecnico di Torino, 10129, Torino, Italy) [18,19]. The hydrodynamic loads and motions of the FOWT platform and power performance of the SR-WECs in the collocated array are compared to their respective stand-alone devices. The Levelized Cost of Energy (LCOE) of the collocated system with cost reduction synergies is calculated with guidelines developed by the National Renewable Energy Laboratory (NREL) System Advisor Model (SAM, 2023.12.17, National Renewable Energy Laboratory, Golden, CO, USA) [20].

2. Synergistic Integration of Floating Offshore Wind Turbines with SR-WECs

The recently developed Surface-Riding Wave Energy Converter (SR-WEC), in Figure 1a has a cylindrical floating body to minimize yaw disturbance in ocean waves. The SR-WEC’s rotation in pitch linearly moves a permanent magnet translator relative to the fixed stator on top of the floating body, generating electrical power. Its performance is maximized by the three-dimensional relocation of the mass units, adaptively changing its pitch natural frequency in varying sea states [15].
The SR-WEC is integrated with a 15-MW Reference Wind Turbine attached to the floating semi-submersible platform VolturnUS, which consists of three columns arranged in the shape of a Y around a fourth column atop which the tower is located, as in Figure 1b [16,21]. With 120 m long turbine blades fixed to a hub located 150 m from the mean water level (MWL), the FOWT’s mooring system consists of three 850 m long lines connected to the outer columns and anchored to the seabed.

2.1. Spatial Arrangement of SR-WECs in Collocated Array through Bayesian Optimization

A collocated array was created to integrate the FOWT with s SR-WECs, whose coupled equation of motion in the frequency domain at a regular wave frequency ω is given as follows:
M + A ω 11 A ( s + 1 ) 1 ω : : A 1 ( s + 1 ) ω M + A ω ( s + 1 ) ( s + 1 ) X ¨ 1 : X ¨ s + 1 + B 11 ω B ( s + 1 ) 1 ω : : B 1 ( s + 1 ) ω B ( s + 1 ) ( s + 1 ) ω X ˙ 1 : X ˙ s + 1 + K 11 0 : : 0 K ( s + 1 ) ( s + 1 ) X 1 : X s + 1 = F 1 ω : F s + 1 ω ,
where M q q and A q q ω are the mass and added inertia matrix, B q q ω and K q q are the radiation-damping and hydrostatic-restoring matrix, and F q ω is the excitation vector on the right-hand side of Equation (1) for the q t h body, whose motion is described by vector X q . The coupled terms A p q ω and B p q ω are the added inertia and the radiation damping acting on the p t h body due to the q t h body.
With the excitation vector of the FOWT F 1 ω being frequency dependent, the representative load for the jth degree of freedom (DOF) is the spectral area in irregular waves, which is given as follows:
L j , 1 m n = ω min ω max F E x c , j , 1 m n ω d ω ,   where   F E x c , j , 1 m n ω = F j , 1 ω 2 S m n ω ,
where the wave spectrum S m n ω is characterized by a significant wave height H s m and peak period T p n , and F j , 1 ω is the FOWT hydrodynamic excitation for the jth DOF.
The wave climate at a deployment site presents the annual occurrence of various sea states with a resource characteristic bin whose product with L j , 1 m n at each sea state is added to obtain Λ j , 1 M B for the collocated FOWT, which represents the annual hydrodynamic loads in the j t h degree of freedom at the site, which is normalized by Λ j , 1 S B , similarly calculated for the stand-alone FOWT to obtain a ratio given as follows:
Λ ¯ j , 1 = Λ j , 1 M B Λ j , 1 S B ,   where   Λ j , 1 = m = 1 N H n = 1 N T L j , 1 m n O c c S m n ω ,
where O c c S m n ω is the sea state occurrence in the resource characteristic bin of dimensions ( N H × N T ). The hydrodynamic excitation represents the energy first transferred to a floating structure(s) from waves. For each individual SR-WEC, this transfer from irregular waves would further be converted into mechanical energy and then to electrical energy to be maximized by adaptive resonance, as explained in the following section. For the collocated FOWT, it represents the loads resulting from the hydrodynamic interactions with the SR-WEC array. While the WECs maximize the annual energy production, taking the most energy of the waves from the excitation to electricity, it would be desirable to subsequently minimize the wave excitation on the collocated FOWT on an annual basis, quantified by the objective function Λ ¯ j , 1 in Equation (3).
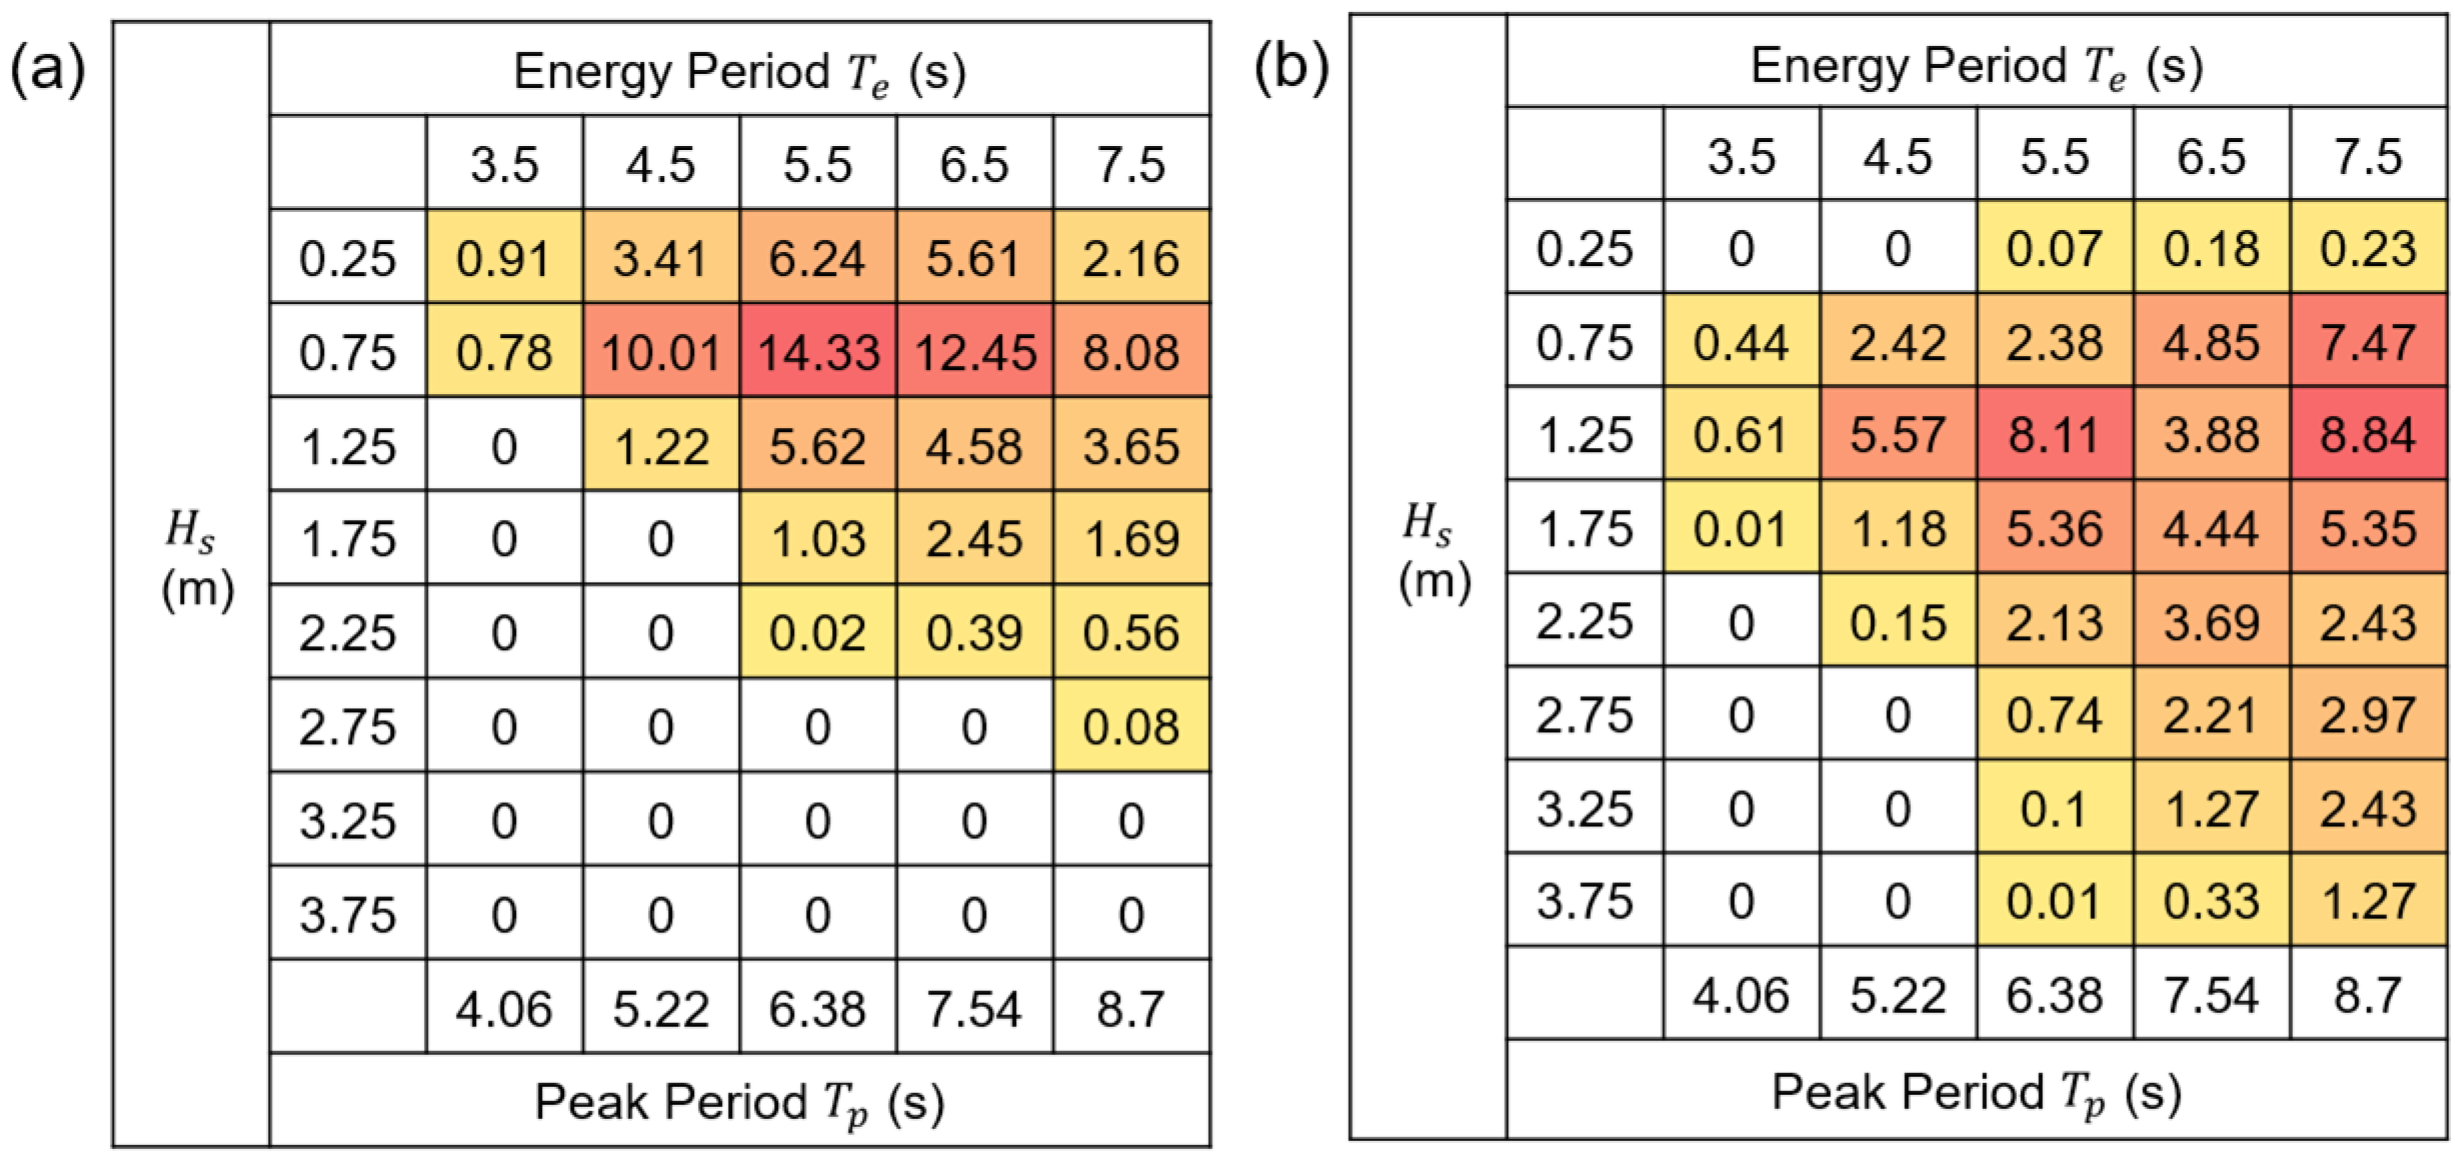
The resource characteristic bins of two deployment sites off the coast of North Carolina, Site A, located near National Data Buoy Center (NDBC) buoy 44056 at the USACE Field Research Facility (FRF), and Site B, located near NDBC buoy 41002, are shown in Figure 2 for the selected sea states [15,22].
The optimal spatial arrangement of the collocated array minimizes Λ ¯ j , 1 , known as the objective function, whose value is evaluated using a resource-intensive BEM simulation with n input parameters a = a 1 , a 2 a n , which are located in a domain X known as the search space. Bayesian optimization efficiently minimizes the objective function within a limited number of simulations. The optimization process begins by evaluating Λ ¯ j , 1 a 0 for a randomly selected set of input parameters a 0 from X .
Using these, a model of Λ ¯ j , 1 , known as Gaussian Process ( G P ), is constructed in X . It is a probability distribution where the previously evaluated Λ ¯ j , 1 a 0 form a joint normal distribution with Λ ¯ j , 1 a evaluated at a new input a . G P models can fit a variety of underlying function distributions and are robust to any noise in the underlying observations. They are characterized by mean μ ( a ) and variance σ 2 a , which can predict Λ ¯ j , 1 ( a ) and quantify the uncertainty in prediction at any input point in X .
The mean and variance of the G P are updated at the mth iteration with a new output, Λ ¯ j , 1 a m . The efficiency of the Bayesian optimization is achieved by the intelligent selection of the next point a m + 1 to evaluate Λ ¯ j , 1 a m + 1 . The selection is made using a function known as the acquisition function α , which finds the a m + 1 statistically anticipated to maximize the improvement from the currently predicted minima Λ ¯ j , 1 a m i n . The new points selected by α balances between finding new points around the current minima and finding new points in unexplored areas of X with a tunable parameter known as the exploration ratio. A detailed description of the Bayesian optimization process can be found in [23].

2.2. Time-Domain Simulation Coupled with Aerodynamic, Mooring, and Power Take-Off Loads

The optimal spatial arrangement identified in Section 2.1 is analyzed in the time domain using WEC-Sim coupled with MOST, including the effects of aerodynamic, mooring, nonlinear PTO, and hydrodynamic loads.
The aerodynamic loads acting on the FOWT are solved using blade element momentum theory, where forces and torque acting on the turbine blades are solved by combining a localized method that discretizes rotor blades into 2D airfoils to calculate the loads and a global approach known as momentum theory which considers total aerodynamic loads in the disk traced by the rotor [24]. The combination of these approaches results in a closed system of equations given as follows:
a 1 a = σ λ r 4 sin 2 φ C L α cos φ + C D α sin φ , a 1 a = σ λ r 4 λ r sin 2 φ C L α sin φ C D α cos φ ,
in which a and a are described as axial and angular induction factors, representing the reduction in wind speeds and induced angular velocity behind the turbine, respectively, while λ r and σ λ r are the local speed ratio and solidity ratio, respectively. φ is the relative angle deviation, and C L , C D , and α are the coefficient of lift, drag, and angle of attack, respectively. In MOST, the aerodynamic loads are accessed from pre-calculated lookup tables which speed up the simulation, validated with the benchmark OpenFAST [19].
WEC-Sim uses a simplified spring-damper mooring force to model bodies with soft mooring lines. For cases where the lines strongly affect the dynamics of the floating body, WEC-Sim can be coupled with dynamic solver MoorDyn, which models mooring lines as lumped masses connected by the spring/damper or static solver Mooring Analysis Program (MAP++, v1.2) (Marco Masciola, Jason Jonkman, and Amy Robertson National Renewable Energy Laboratory, Boulder CO, USA), which rapidly calculates the mooring loads from a lookup table [25].
The SR-WEC extracts energy using a linear PTO nonlinearly coupled with the floating body due to the variable hydrostatic and hydrodynamic coefficients caused by the translator motion. The floating body and the translator constitute a serial multibody system connected to each other by joints, with the translator’s sliding motion relative to the floating body, known as a prismatic joint, and defined by a generalized coordinate vector q 1 1 × 1 = ξ m with one DOF. In the head sea condition, the floating body can move in three DOFs—surge, heave, and pitch—represented by the vector q 2 3 × 1 = [ x c , z c , θ c ] . The equation of motion of the acceleration of the generalized coordinates q ¨ is given as follows:
M q ¨ = Γ C ,
where M is the coupled mass matrix, and the forces are divided into the external forces Γ and the Coriolis forces C at the joint, respectively, which can be solved using recursive methods like Composite Rigid Body Method (CRBM) [26]. Expanding the right-hand-side of Equation (5) using Simscape Multibody has Γ C comprised of translational loads F T and rotational loads τ T from the Cummins’ equation and gravity acting on the floating body and translator with subscripts f and m , respectively.
The linear PTO applies a reactive force F P T O on the translator to extract power [27]. The floating body’s mass and moment of inertia about the y-axis are M f and I y y f , while the corresponding terms for the translator are M m and I y y m , respectively. The equation of motion of the translator along the stator, including this force, is given as follows:
M m ξ ¨ m = M m ξ m ω c 2 + x ¨ c cos θ c + z ¨ c sin θ c θ ¨ c z PTO F PTO + F mx T cos θ c + F mz T sin θ c .
For the 3 DOF joint, the matrix equation of motion is given as follows:
M f + M m sin 2 θ c M m sin θ c cos θ c M f z CG cos θ c + M m ξ m sin θ c M m sin θ c cos θ c M f + M m cos 2 θ c M f z CG sin θ c M m ξ m cos θ c M f z CG cos θ c + M m ξ m sin θ c M f z CG sin θ c M m ξ m cos θ c I yy f + I yy m +   f z CG 2 + M m ξ m 2 x ¨ c z ¨ c θ ¨ c = F x 1 F z 1 Γ y 1 ,
where   F x 1 F z 1 Γ y 1 = F f x T + F m x T sin θ c F m z T cos θ c sin θ c F P T O cos θ c +   f z C G M m z P T O ω c 2 sin θ c + M m 2 ω c ξ ˙ m sin θ c F f z T + F m z T cos θ c F m x T sin θ c cos θ c F P T O sin θ c + M f z C G M m z P T O ω c 2 cos θ c + M m 2 ω c ξ ˙ m cos θ c F P T O z P T O + ξ m F m x T sin θ c F m z T cos θ c τ f y T + τ m y T + z C G F f x T cos θ c + F f z T sin θ c m 2 ξ ˙ m ω c m z P T O ω c 2 .
The terms z C G and z P T O in Equations (6)–(8) are the perpendicular distances from the MWL to the floating body’s initial position’s vertical center of gravity and the center of the stator, respectively.
The techno-economic performance of the collocated array is measured using the Levelized Cost of Energy (LCOE), which is the minimum unit cost of energy in USD/kWh that recovers all input costs and provides returns to the investors. The annual performance of a wind turbine is evaluated as a function of wind speed using an empirically derived ideal power curve, with the losses accounted for, while the AEP of a WEC is the product of its power matrix, which is the average power absorbed at each sea state and the wave resource characteristic bin, such as in Figure 2 [28,29,30].
A flowchart describing the methodology of the synergistic integration between the FOWT and the SR-WEC array is shown in Figure 3.

3. Synergistic Integration of FOWT with SR-WEC

3.1. Optimal Spatial Arrangement Using Bayesian Optimization

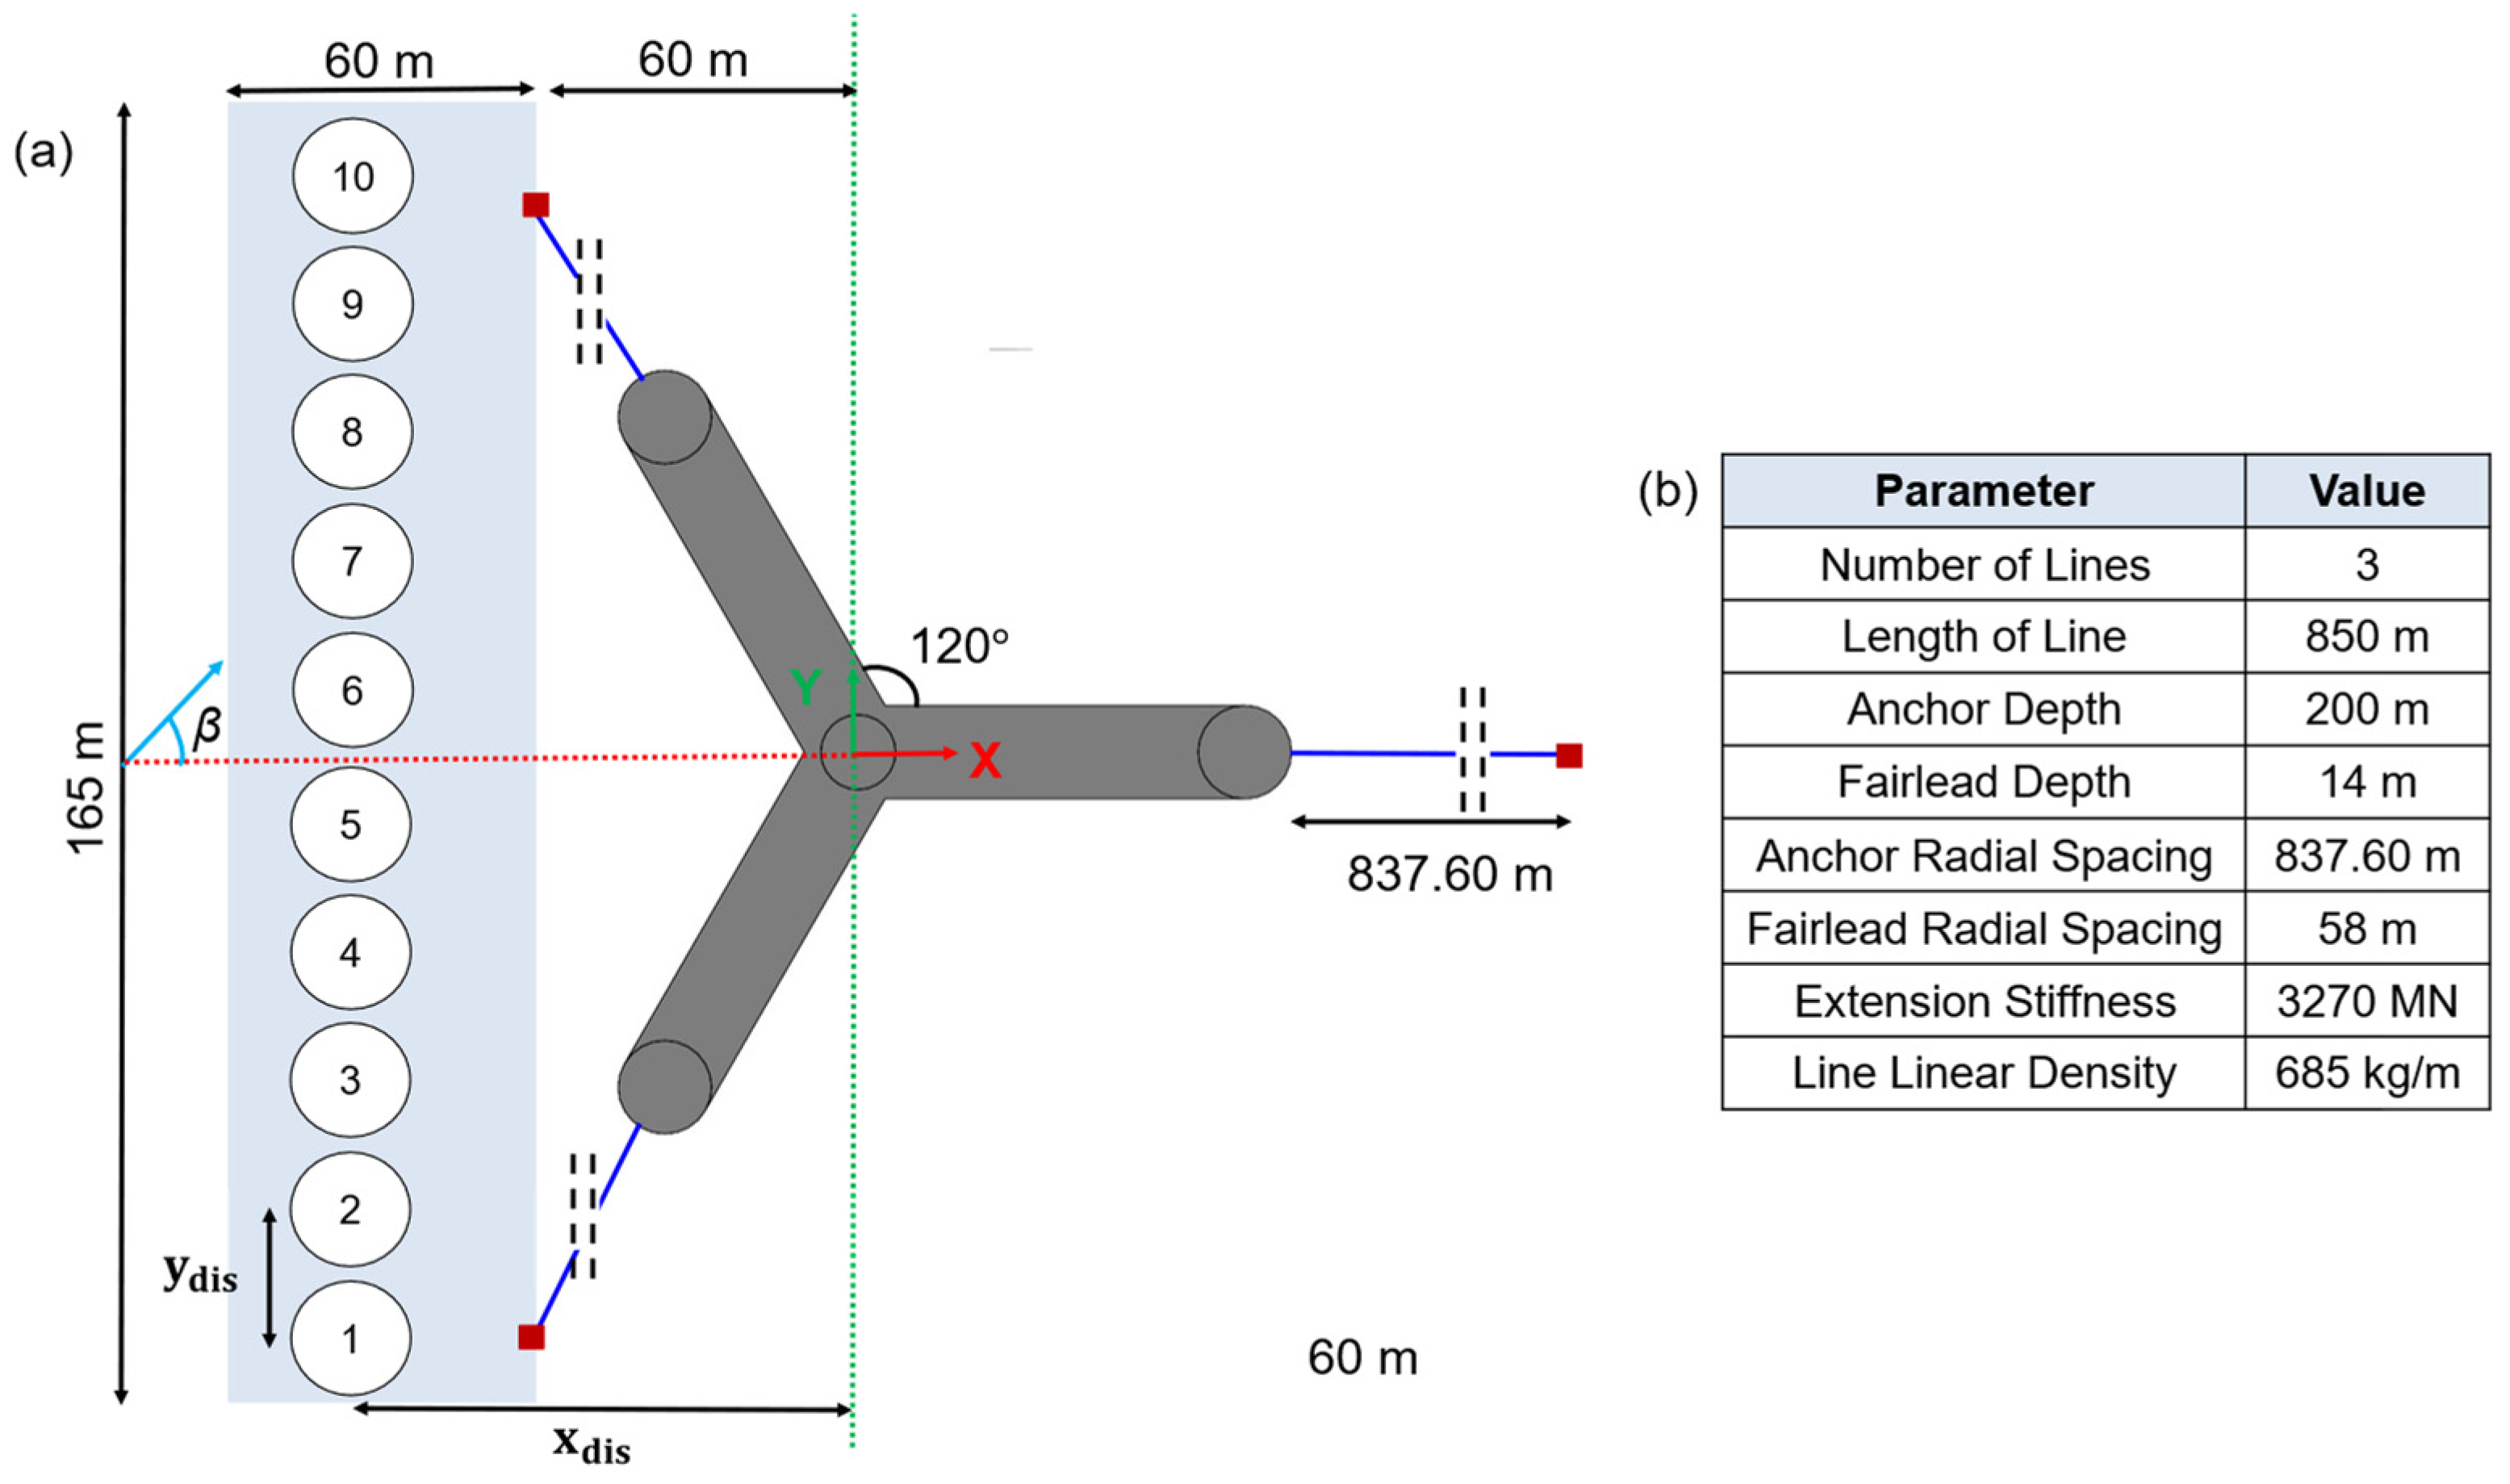
The FOWT is located at the origin of the global coordinate system (XYZ), with ten SR-WECs labeled from 1 to 10 making up the WEC assembly in Figure 4. The SR-WEC with the cylindrical submerged volume in this study has the dimensions of radius R = 6 m and draft D = 7.5 m, with a smoothed edge, R e d g e = 1 m along the base of the volume to reduce the effect of viscous damping.
With the FOWT positioned symmetrically about the X-axis, the SR-WECs, located within the highlighted region in Figure 4 with an area of 9900 m 2 , are arranged in a straight line to encounter waves in the head sea condition, with wave heading β = 0 ° . The panel models of the FOWT in Figure 5a,b have only a small number of panels to speed up the BEM simulation. However, they are still sufficiently fine, as the wave excitation coefficients F j , q ω for surge, heave, and pitch are well matched with a reference and a finer mesh in Figure 5c,d, respectively [16].
The spatial arrangement of the SR-WECs is parametrized by two variables: the distance x d i s along the X-axis of the SR-WEC line from the origin and the equal intra-SR-WEC spacing y d i s in Figure 4. As the simulation is evaluated in a head sea condition, the SR-WECs are arranged in a straight line with a constant x d i s for all bodies to maximize the reduction in hydrodynamic loads. Bayesian optimization is applied separately at both sites in Figure 2 to minimize the objective function presented along with the other parameters of Bayesian optimization in Figure 6c.
The objective function evaluated at 100 iterations as a function of x d i s and y d i s is shown in Figure 6a,b.
The objective function at both Site A and B was minimized at the lower limit of the intra-SR-WEC spacing y d i s at 13 m, with the optimal x d i s value in the two cases obtained at 83.17 and 83.43 m, respectively. The minimum objective function achieved using Bayesian optimization is 0.6037 and 0.6405 at Sites A and B, which denote an almost 40% and 36% reduction in the annual hydrodynamic loads of the collocated FOWT in three DOFs compared to the stand-alone, respectively.
In Figure 7, we observe that the minimum objective function value efficiently reaches its global minima within 10% of the iterations. Observing the density distribution of different x d i s and y d i s evaluated during Bayesian optimization, the majority of the points were close to the optimal values due to the small exploration ratio, which leans toward higher exploitation, but the 2D search space was well explored, as seen Figure 6a,b.
To test additional array placements apart from a straight line, Bayesian optimization is applied at Site B, where each SR-WEC’s x d i s along the X-axis is independent, while y d i s and the other optimization parameters are unchanged. However, the optimal arrangement obtains the minimum objective function of 0.6814, 6.22% larger than the arrangement in Figure 6b, indicating that a straight-line arrangement is better applicable in the head sea condition. As the optimal parameters at Sites A and B are very close to each other, the optimal arrangement at Site B was selected for further analysis in this study.
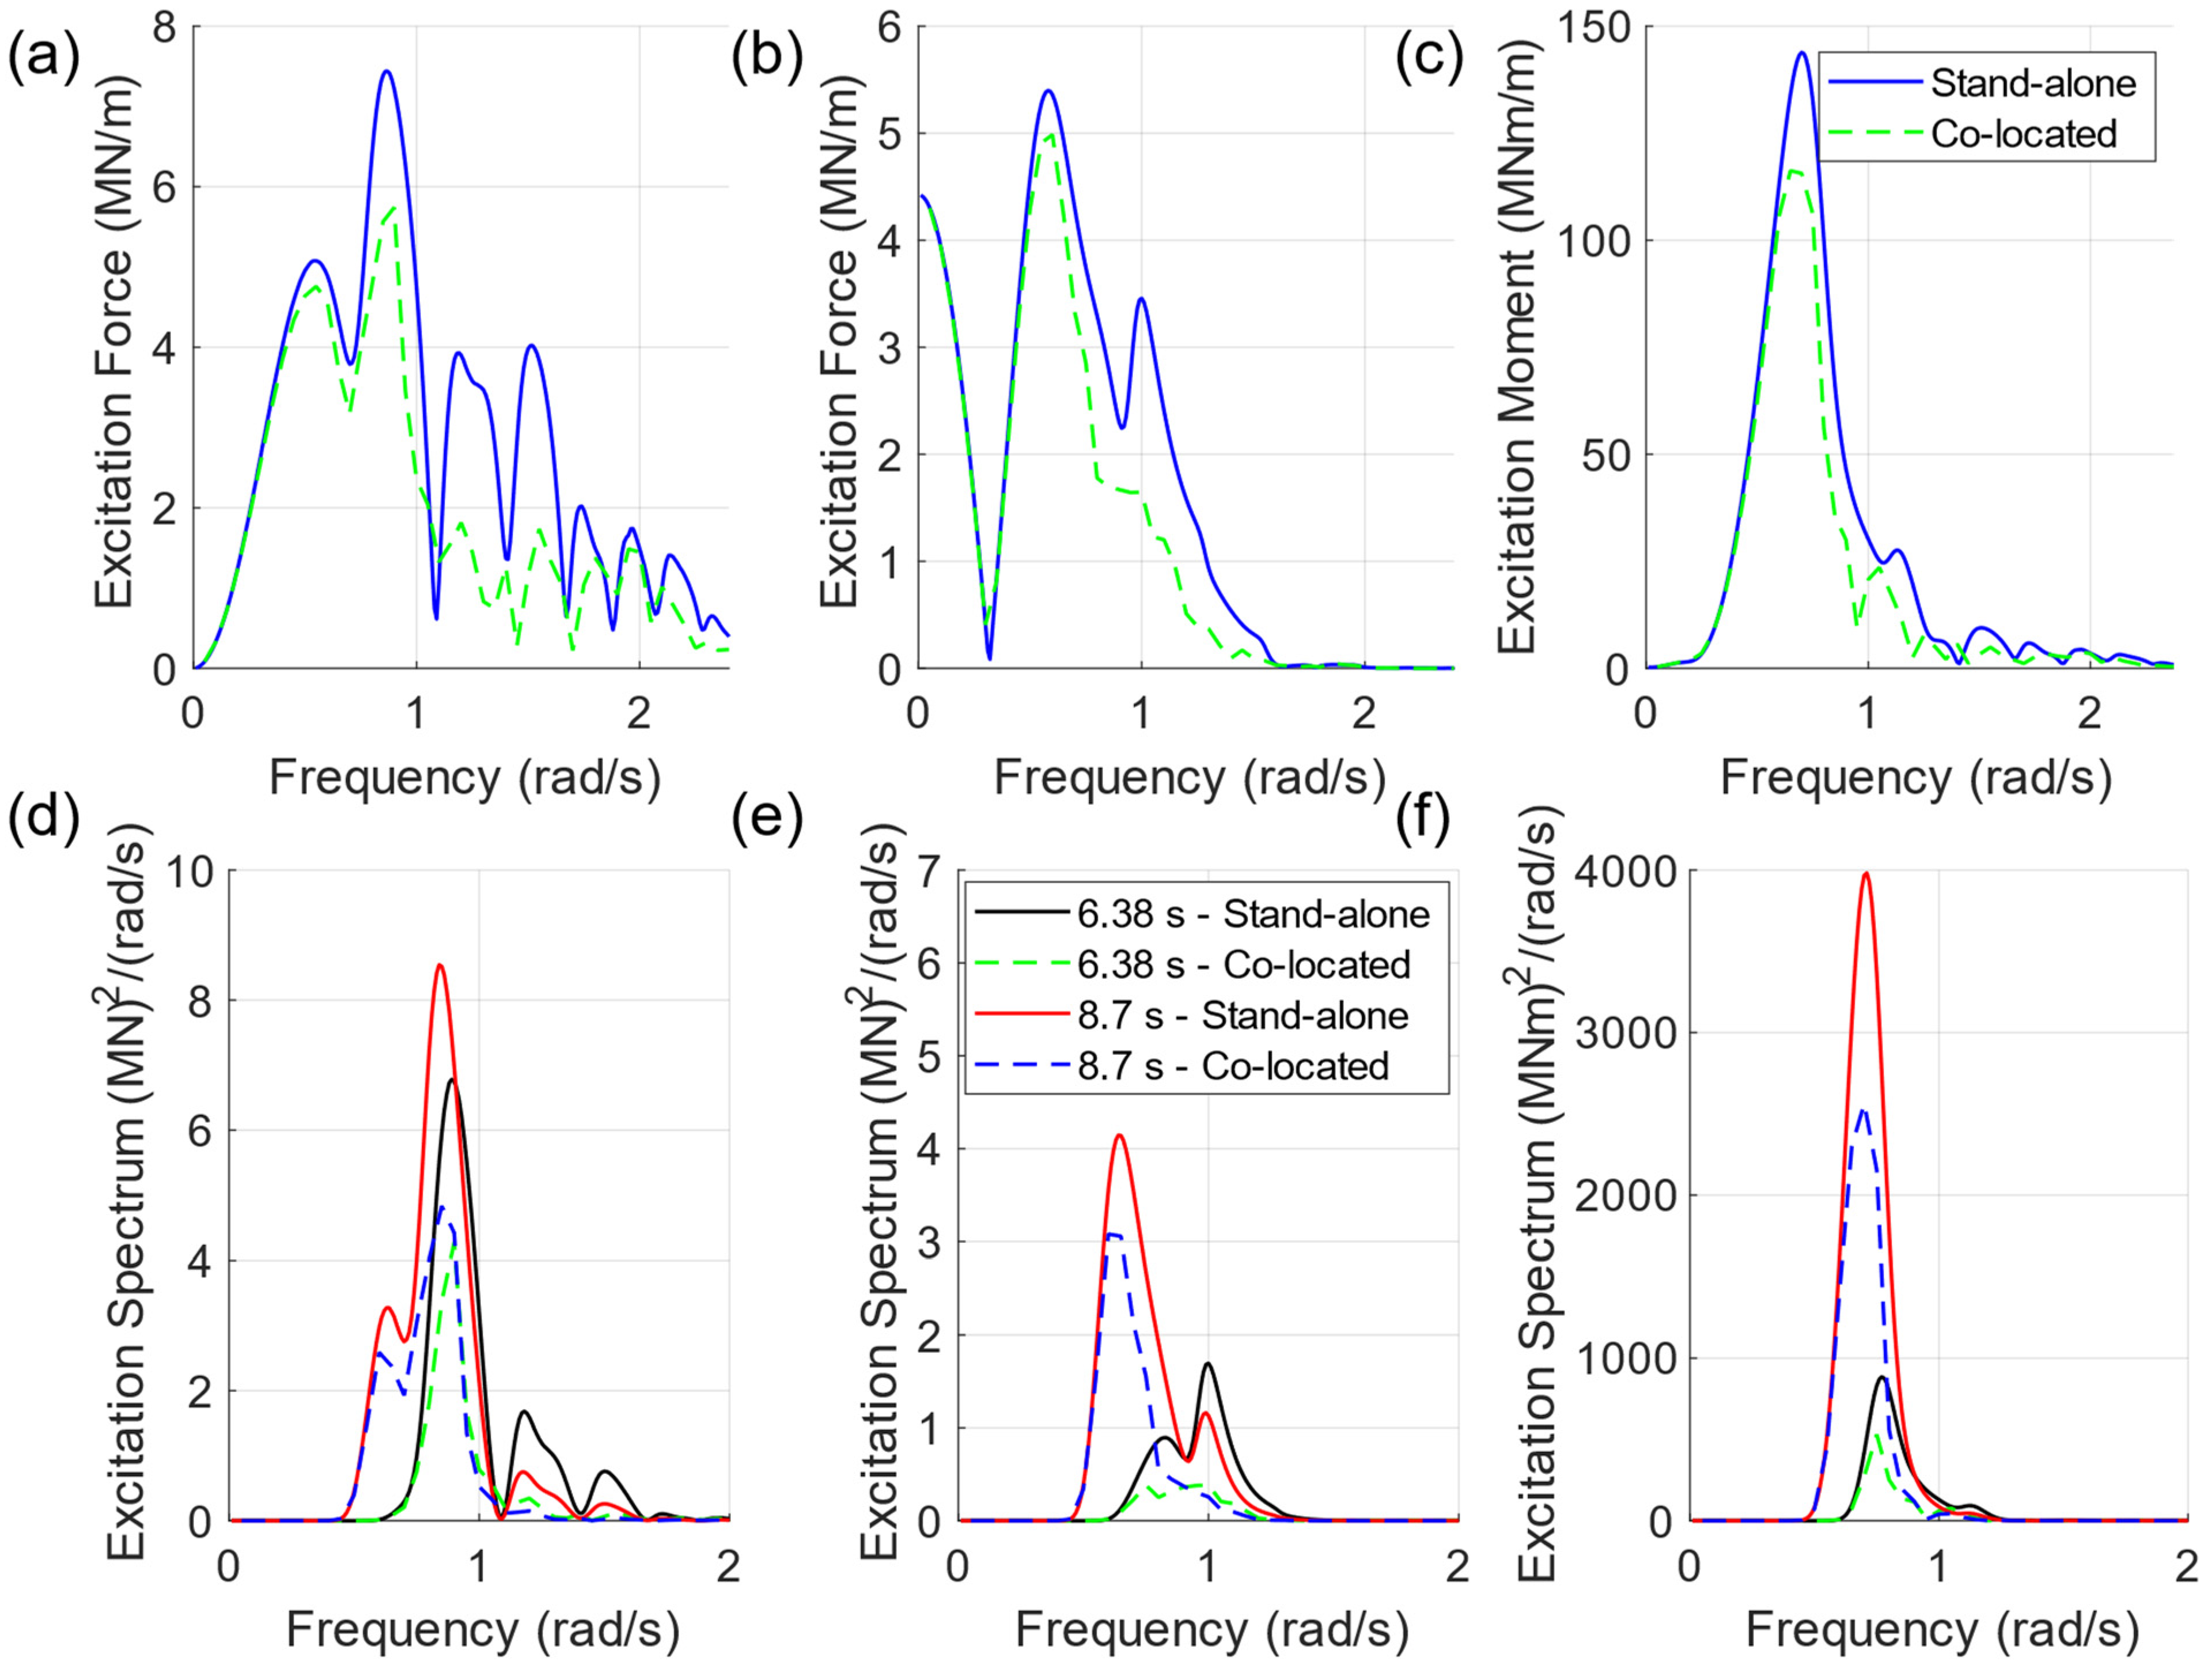
The excitation loads and spectra of the FOWT in the optimally arranged collocated array are compared with the values for a stand-alone FOWT. Observing Figure 8a–c, there is limited variation between the two at ω < 0.7 rad/s, as the wavelengths in this range are much larger than x d i s . Contrasting with that, there is a strong reduction in the excitation loads at ω > 0.7 rad/s for all degrees of freedom, where the wavelength and x d i s are in the same order of magnitude. The excitation spectra are shown for two T p cases—at 6.38 s and at 8.7 s—in Figure 8d–f, which have the collocated FOWT excitation spectral area at 40% and 60% of the stand-alone case averaged across the three DOFs, respectively.
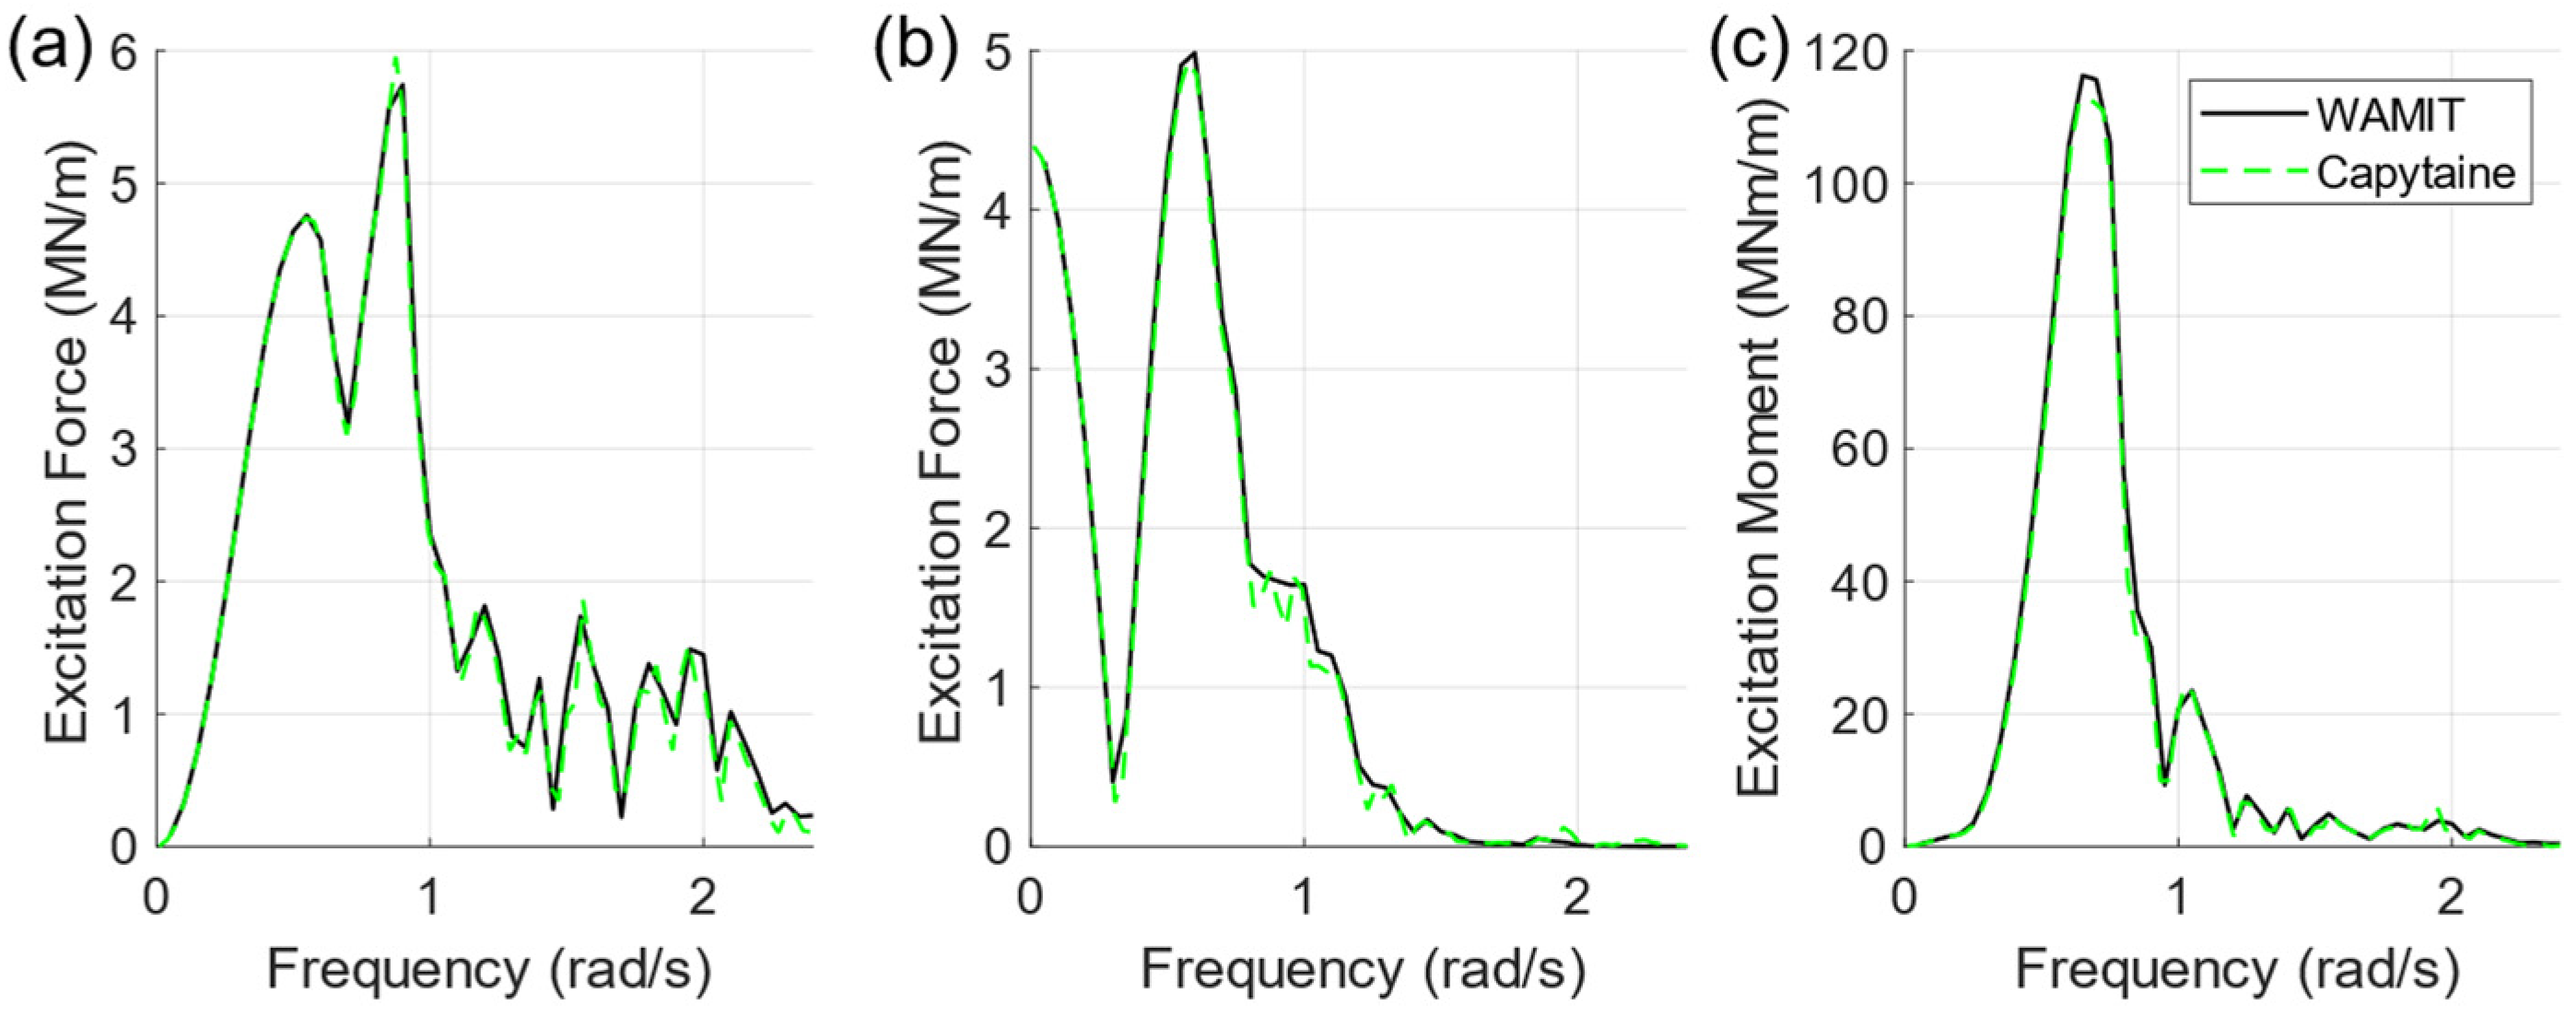
To verify the computation of the excitation loads and spectra of the collocated FOWT in Figure 8, we compared them with the results obtained using Capytaine, an open-source BEM program developed based on NEMOH [31,32]. The results presented in Figure 9 are well matched.

3.2. Motion Response and Power Performance in Time-Domain Simulation

WEC-Sim coupled with MOST is used to evaluate the responses and loads acting on the components of the optimally arranged collocated array, including aerodynamic, mooring, and nonlinear PTO coupling loads. The dynamics of the collocated array are evaluated in thirty-five sea states represented by a JONSWAP spectrum, accounting for around 67% and 80% of all waves at Sites A and B, respectively, with H s ranging from 0.75 m to 3.75 m and T p from 4.06 s to 8.7 s. At each sea state, the simulation length is 3900 s, with an initial ramping time of 300 s.
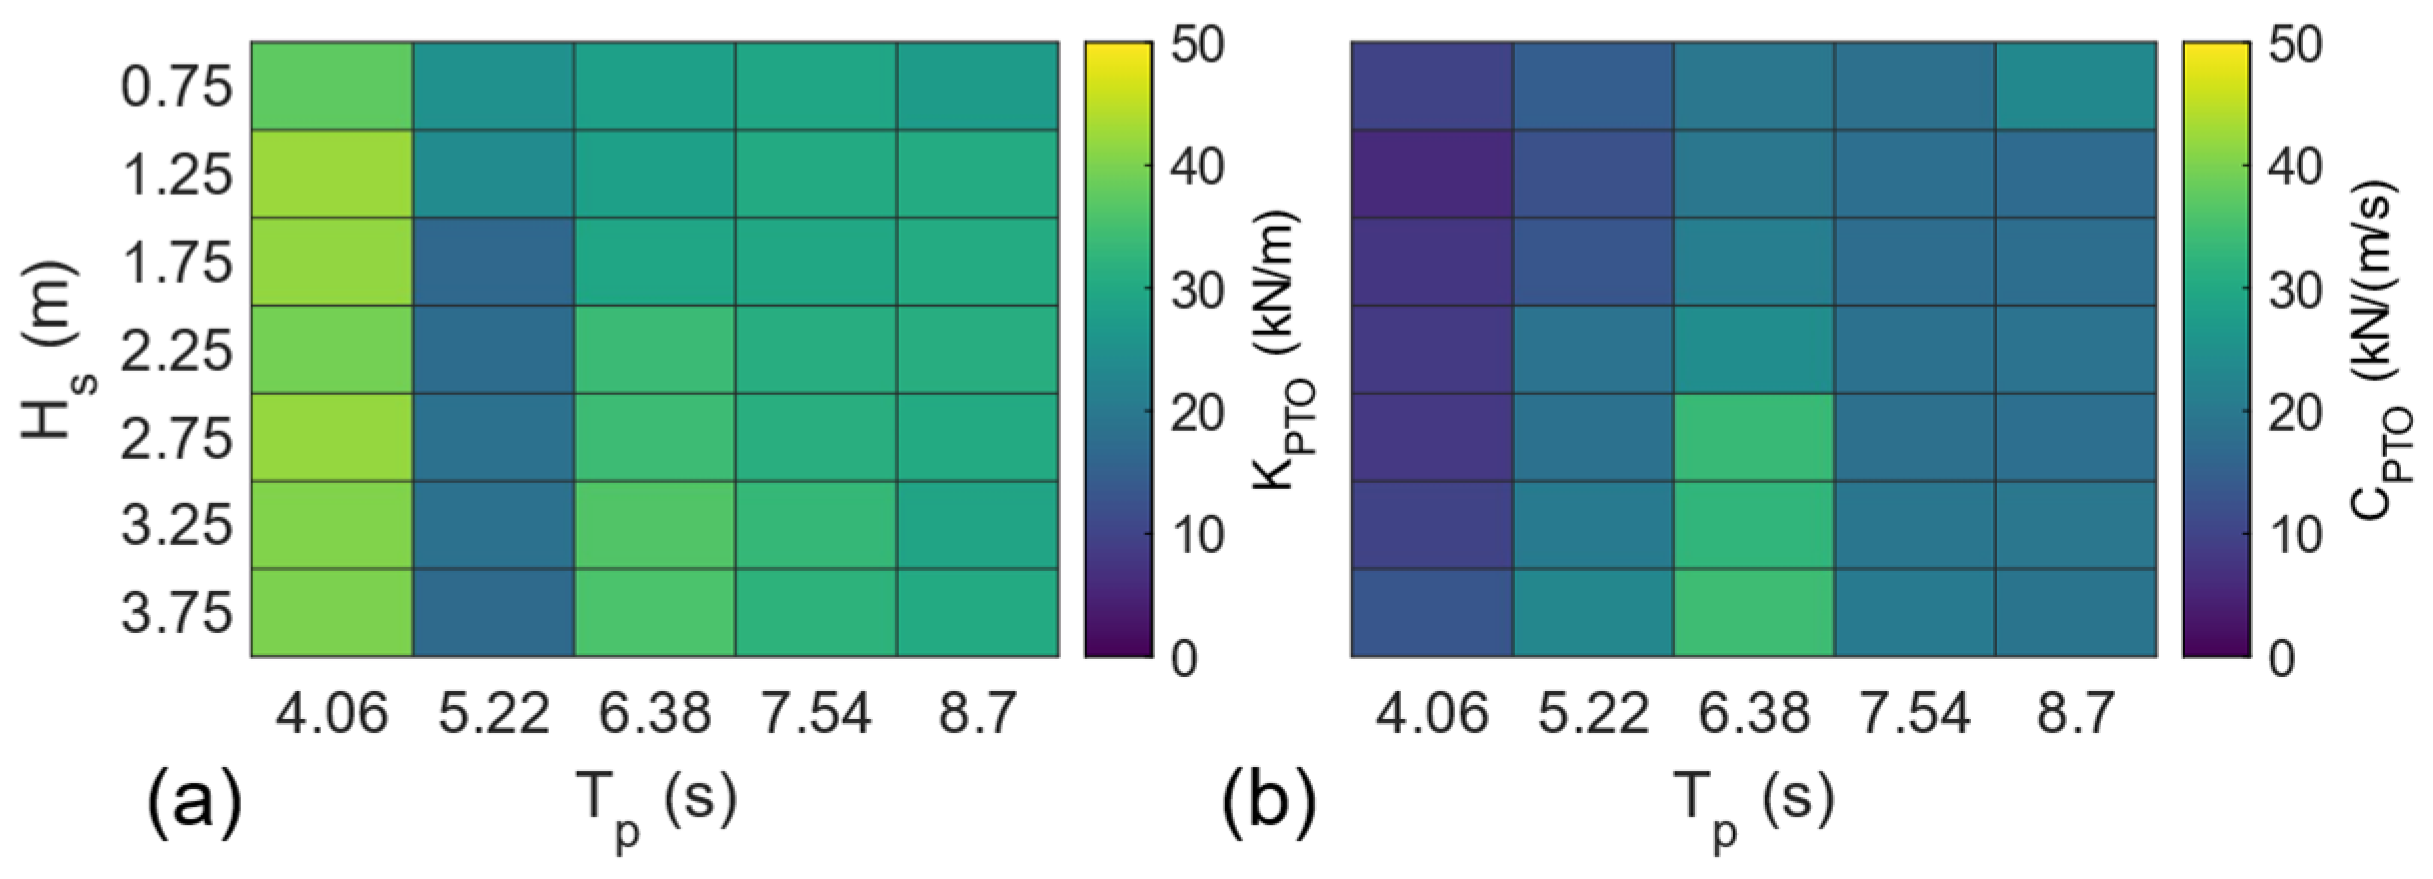
The stator length is set to 12 m, and an end-stop force with stiffness and damping coefficients of 100 MN/m and 100 MN/(m/s) acts on the translator. Furthermore, each SR-WEC has linear viscous damping coefficients set to 3% of critical damping in the main degrees of freedom in the head sea condition and a simplified mooring force in the surge direction with a stiffness coefficient of 1800 N/m. The SR-WEC has optimized PTO and adaptive resonance coefficients to maximize power capture at each sea state for the single unit in Figure 10.
The FOWT mass, moment of inertia, and quadratic damping coefficients are set to reference values with the mooring loads evaluated using MAP++ (v1.2, Marco Masciola, Jason Jonkman, and Amy Robertson National Renewable Energy Laboratory, Boulder, CO, USA) for the lines defined in Figure 4 [16]. At each sea state, the wind speed U 10 at a height of 10 m above the MWL is evaluated as a function of the wave fetch X , set at 100 km and H s for the JONSWAP spectrum S m n ω , which is used to evaluate the wind speed at the hub, following the Hellmann exponential law [33,34]. The constant wind speed U 150 is given as follows:
U 150 = ( 15 ) 0.1 × U 10 = 6.025 H s 1 . 1 ¯ .
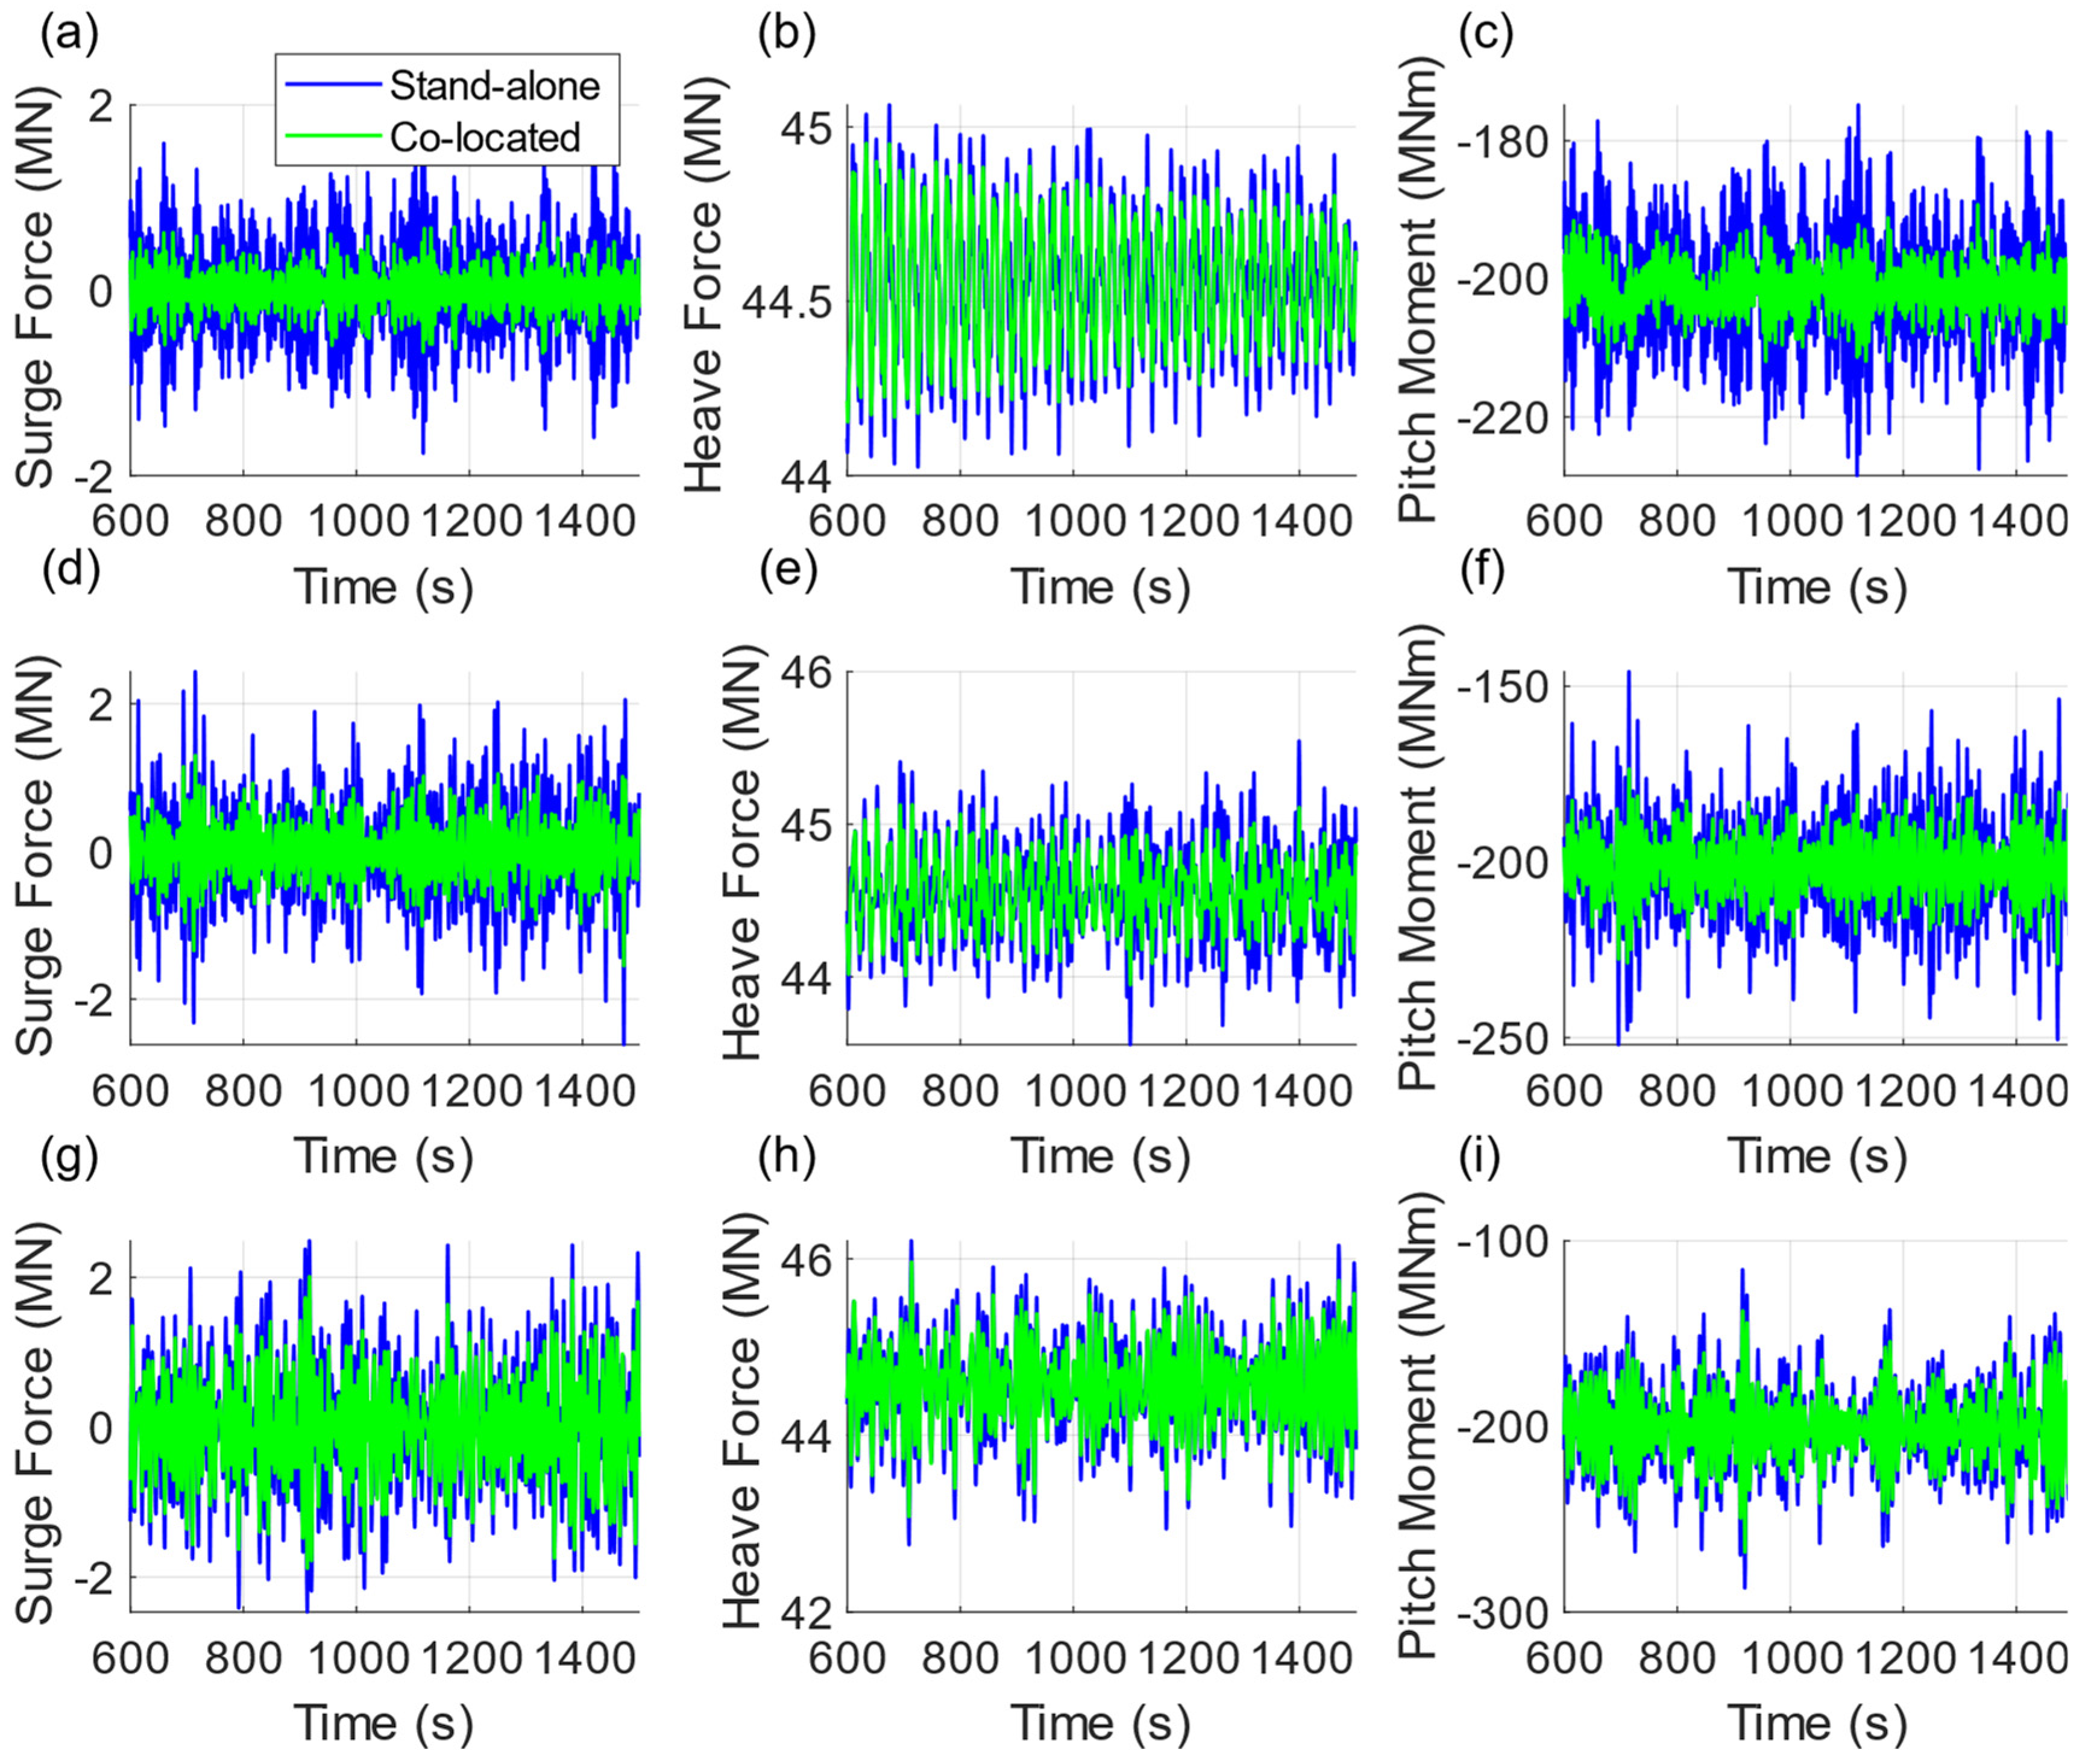
The total hydrodynamic loads acting on the collocated FOWT are evaluated at H s = 1.25 m and three T p values of 4.06, 5.22, and 8.7 s shown in Figure 11. The force amplitude of the collocated FOWT in all three DOFs is smaller than the corresponding stand-alone value at 4.06 s and increases with higher T p values.
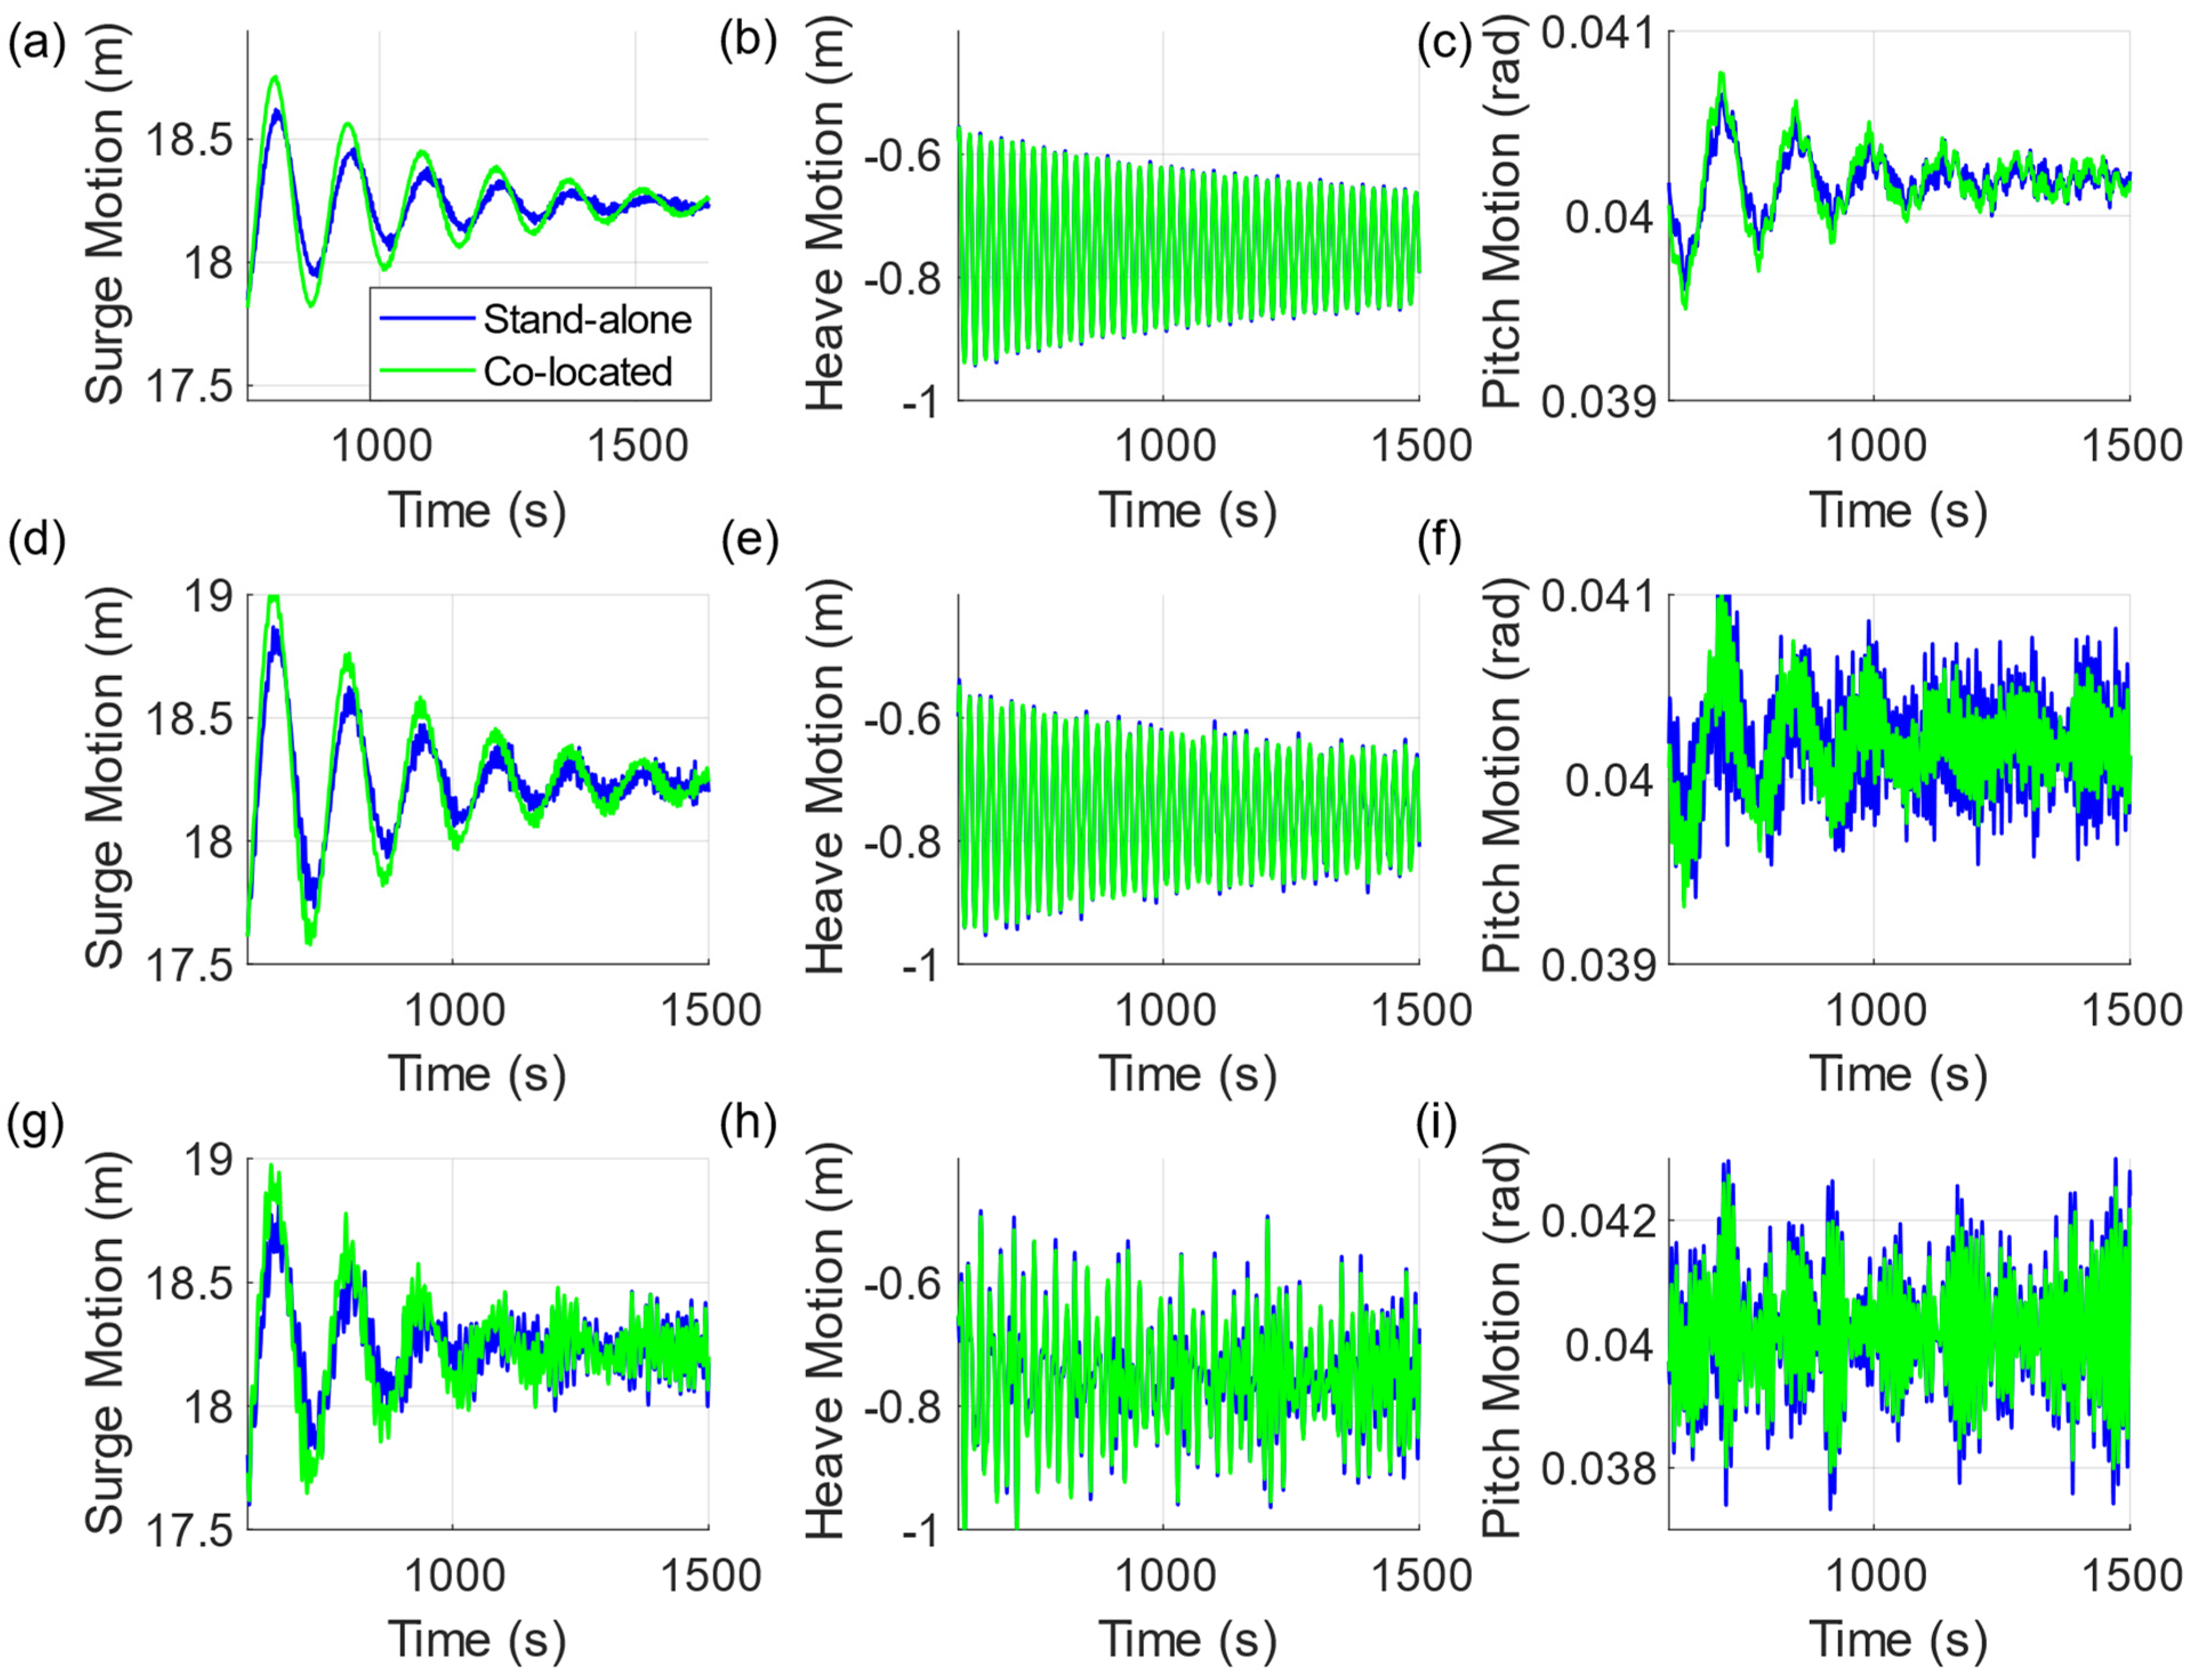
This is compared to Figure 8a–c, which shows that the collocation has higher synergy at ω > 1 rad/s contributing to the reduction observed at the lower T p values. The time history of the FOWT motion at the same sea states is shown in Figure 12.
The platform motions of the FOWT at all T p values are dominated by low-frequency components due to the aerodynamic and mooring loads, which results in marginal impact due to the reduction in hydrodynamic loads. The small overlap between the wave spectrum and the excitation at lower T p further reduces the contribution of hydrodynamic loads to the platform’s motion.
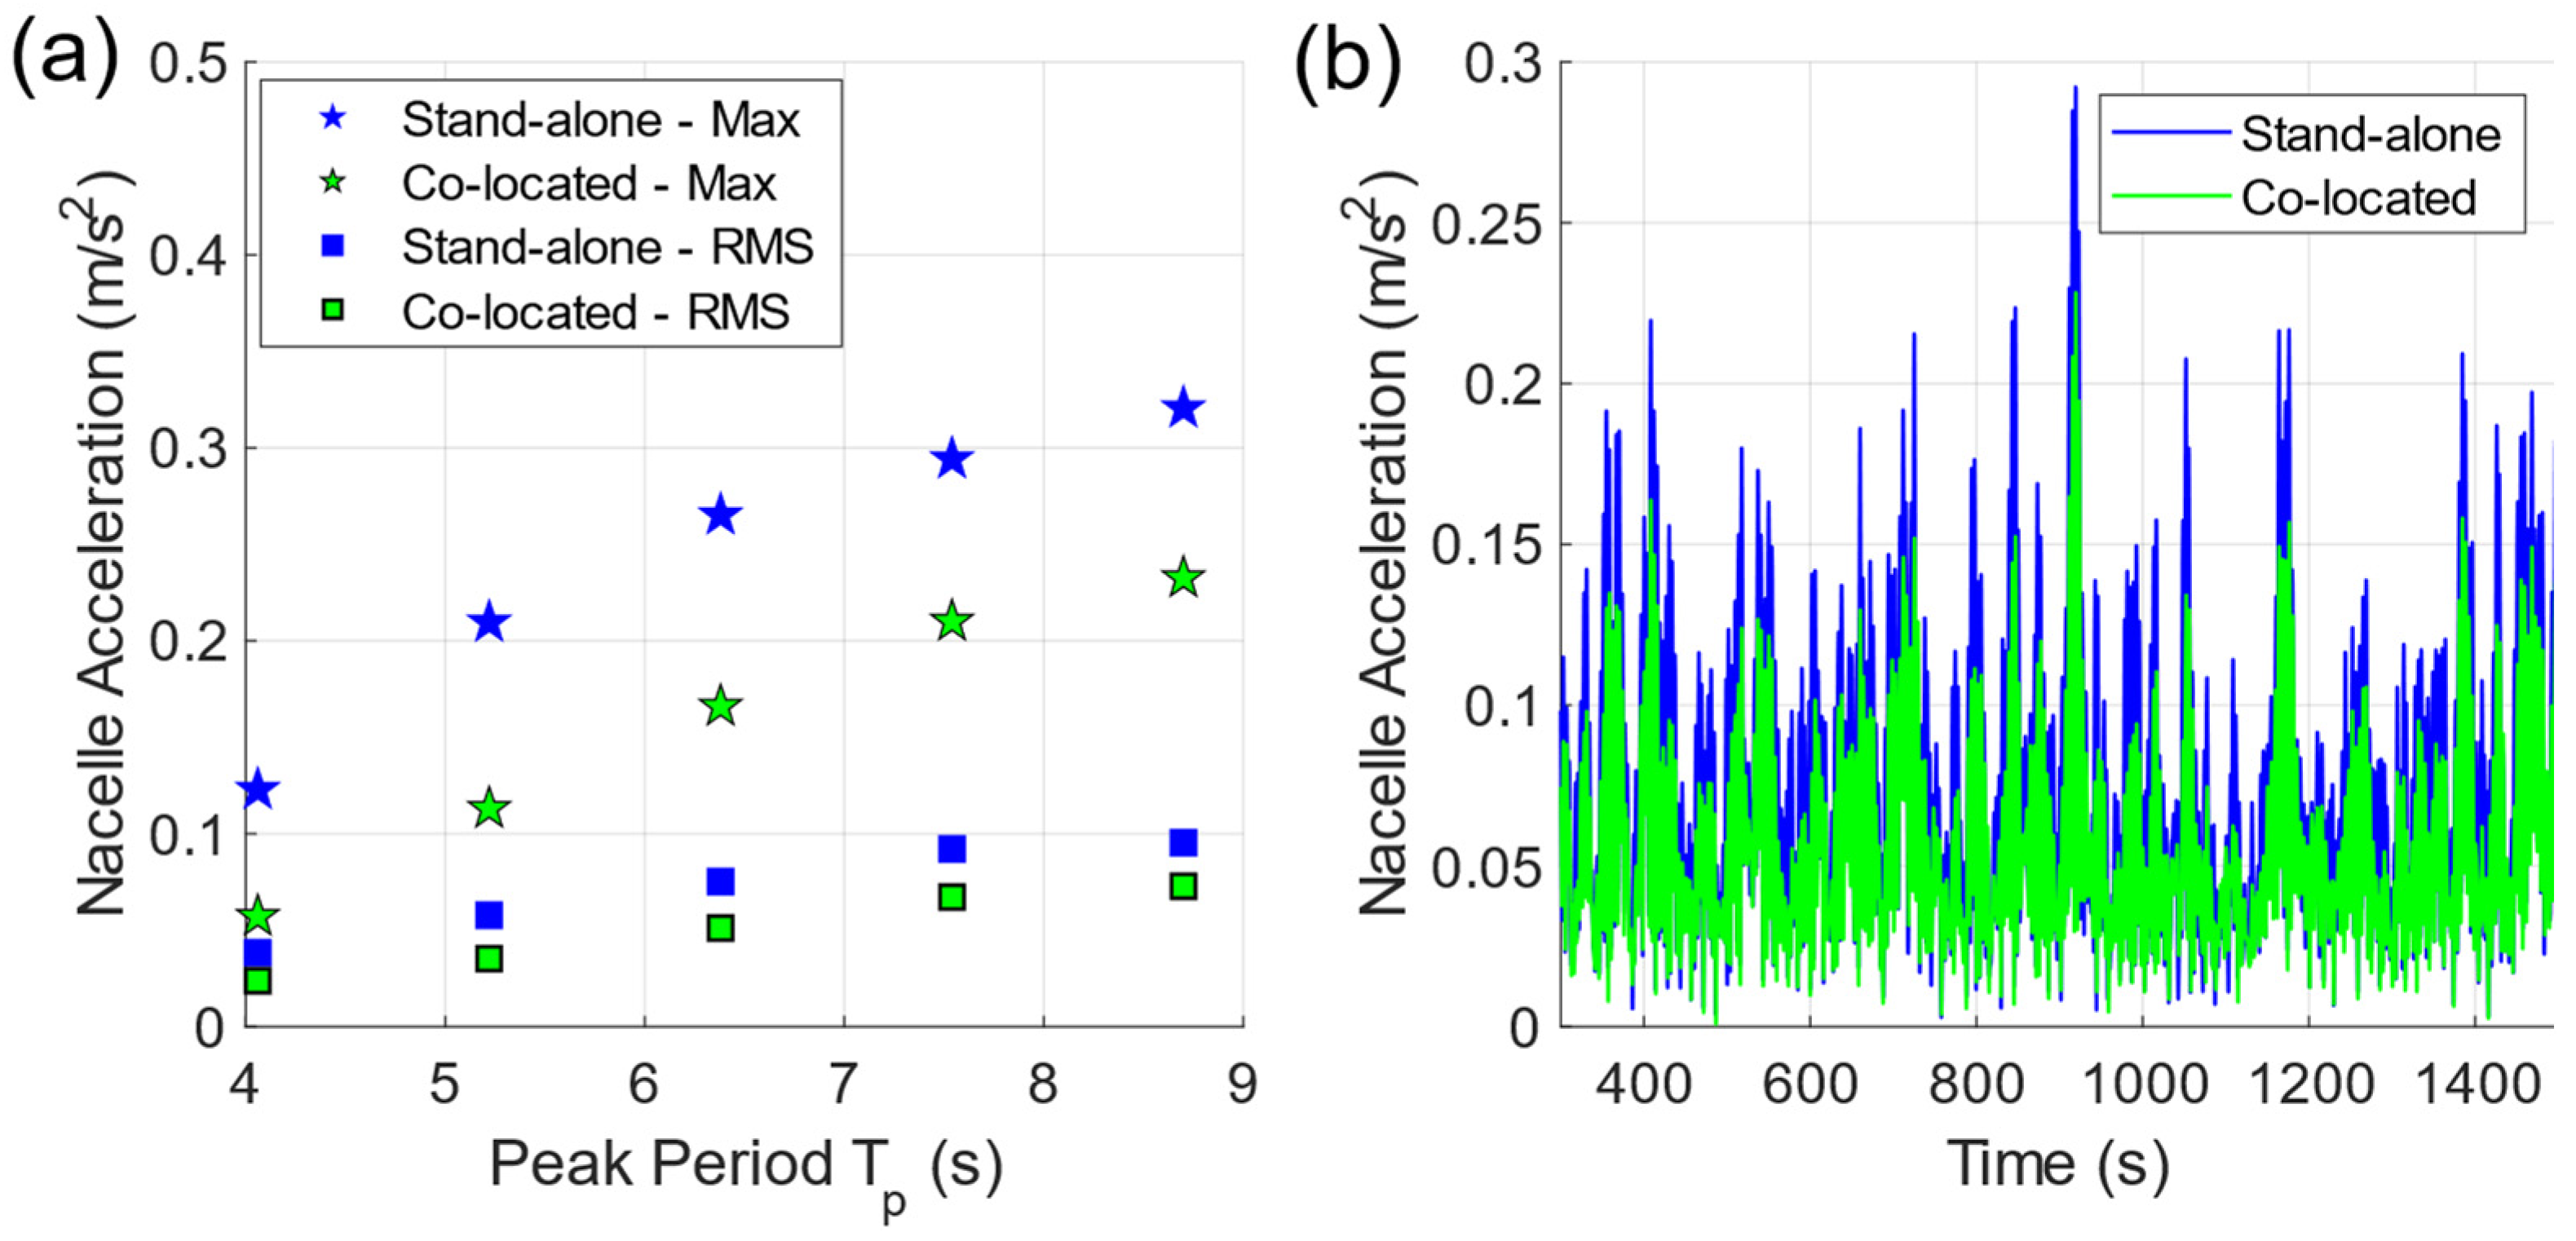
The acceleration of the FOWT nacelle is evaluated for a set of sea states at H s = 1.25 m in Figure 13, with collocation positively impacting both the RMS and peak value of the nacelle acceleration, which reduces by up to 58% and 67% compared to the stand-alone FOWT.
The effect of collocation on the SR-WEC performance is evaluated using a power ratio r P = 100 P ¯ i / P ¯ m a x , where P ¯ i is the power absorbed by the i t h SR-WEC in the array while P ¯ m a x is the optimal power for an individual WEC at the given sea state. The power limit of a unit SR-WEC in this study is set to 80 kW.
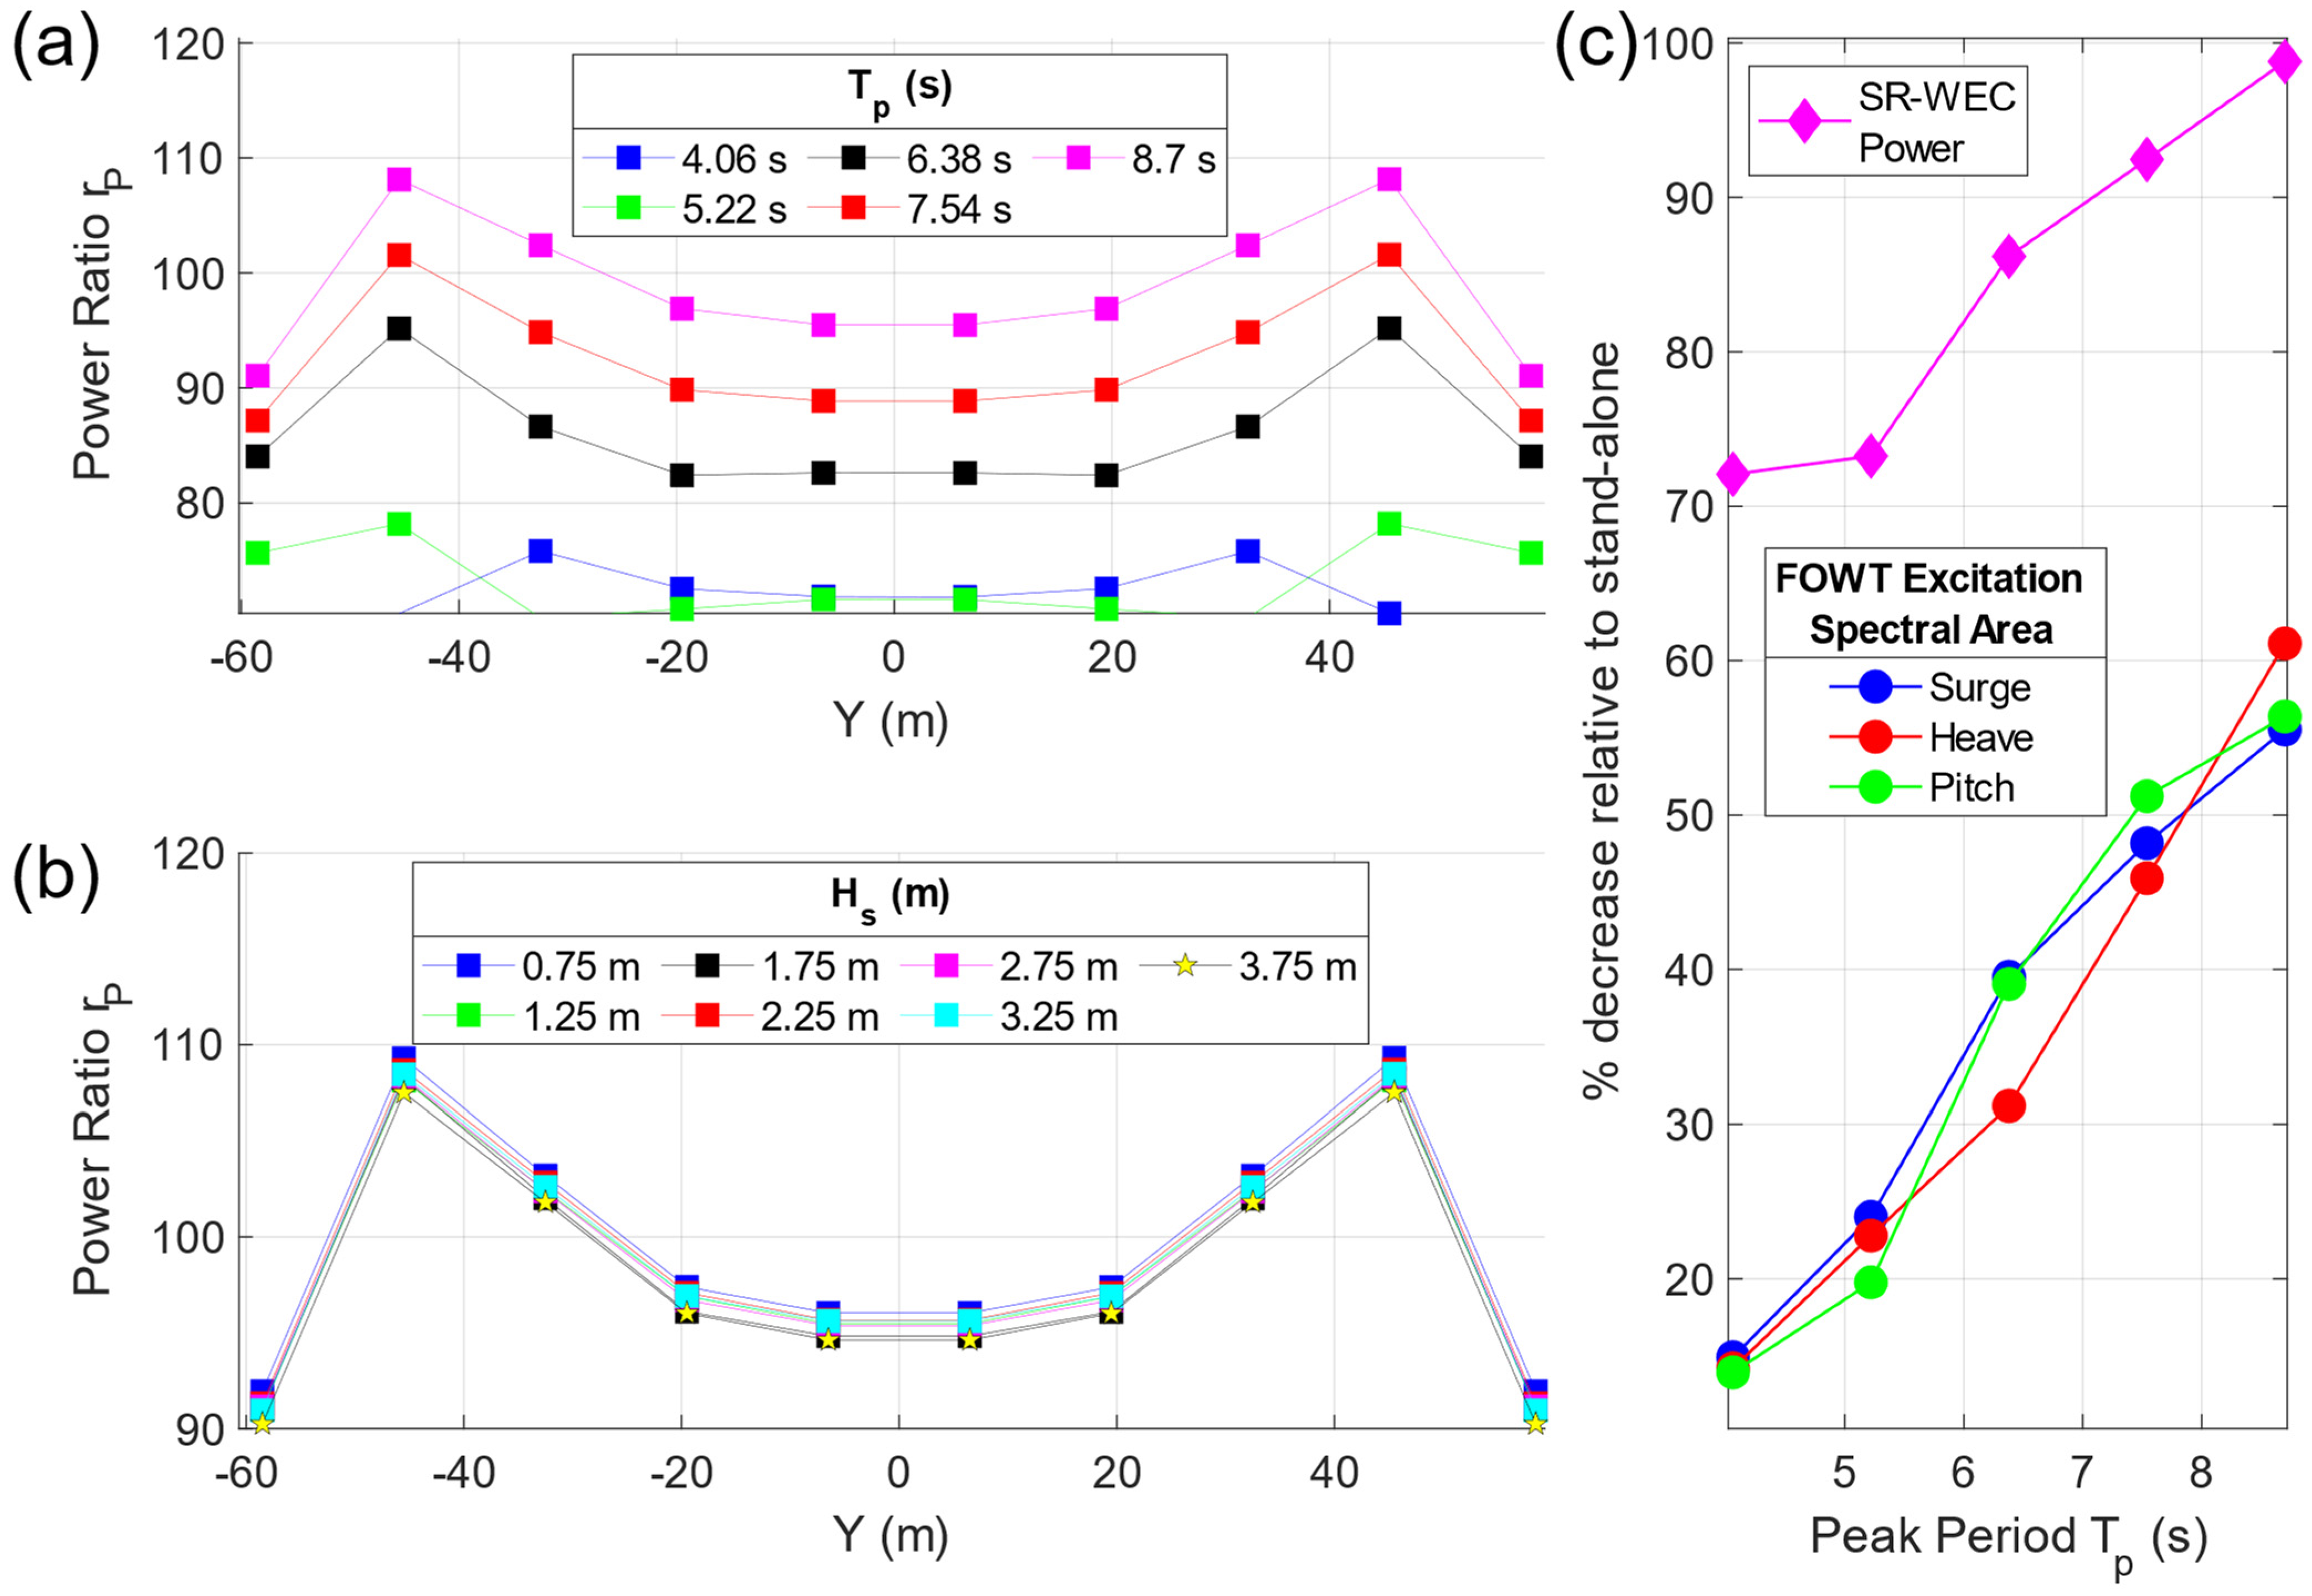
The SR-WEC performance is symmetrically spatially distributed about Y = 0, as shown in Figure 14a, where the highest r P obtained at the penultimate SR-WECs for all T p > 4.06 s, with values up to 108.2% observed. However, at 4.06 s, the third SR-WEC from either end has the highest performance. The total energy captured by the SR-WECs ranges from 72% to 99% of the individual performance, with T p changing from 4.06 to 8.7 s. Varying H s at the same T p of 8.7 s in Figure 14b changes the spatial distribution of r P marginally, with slightly improved performance at low H s values. The FOWT spectral area as a % of the stand-alone is directly proportional to the SR-WECs’ power as a % of the single unit in Figure 14c.
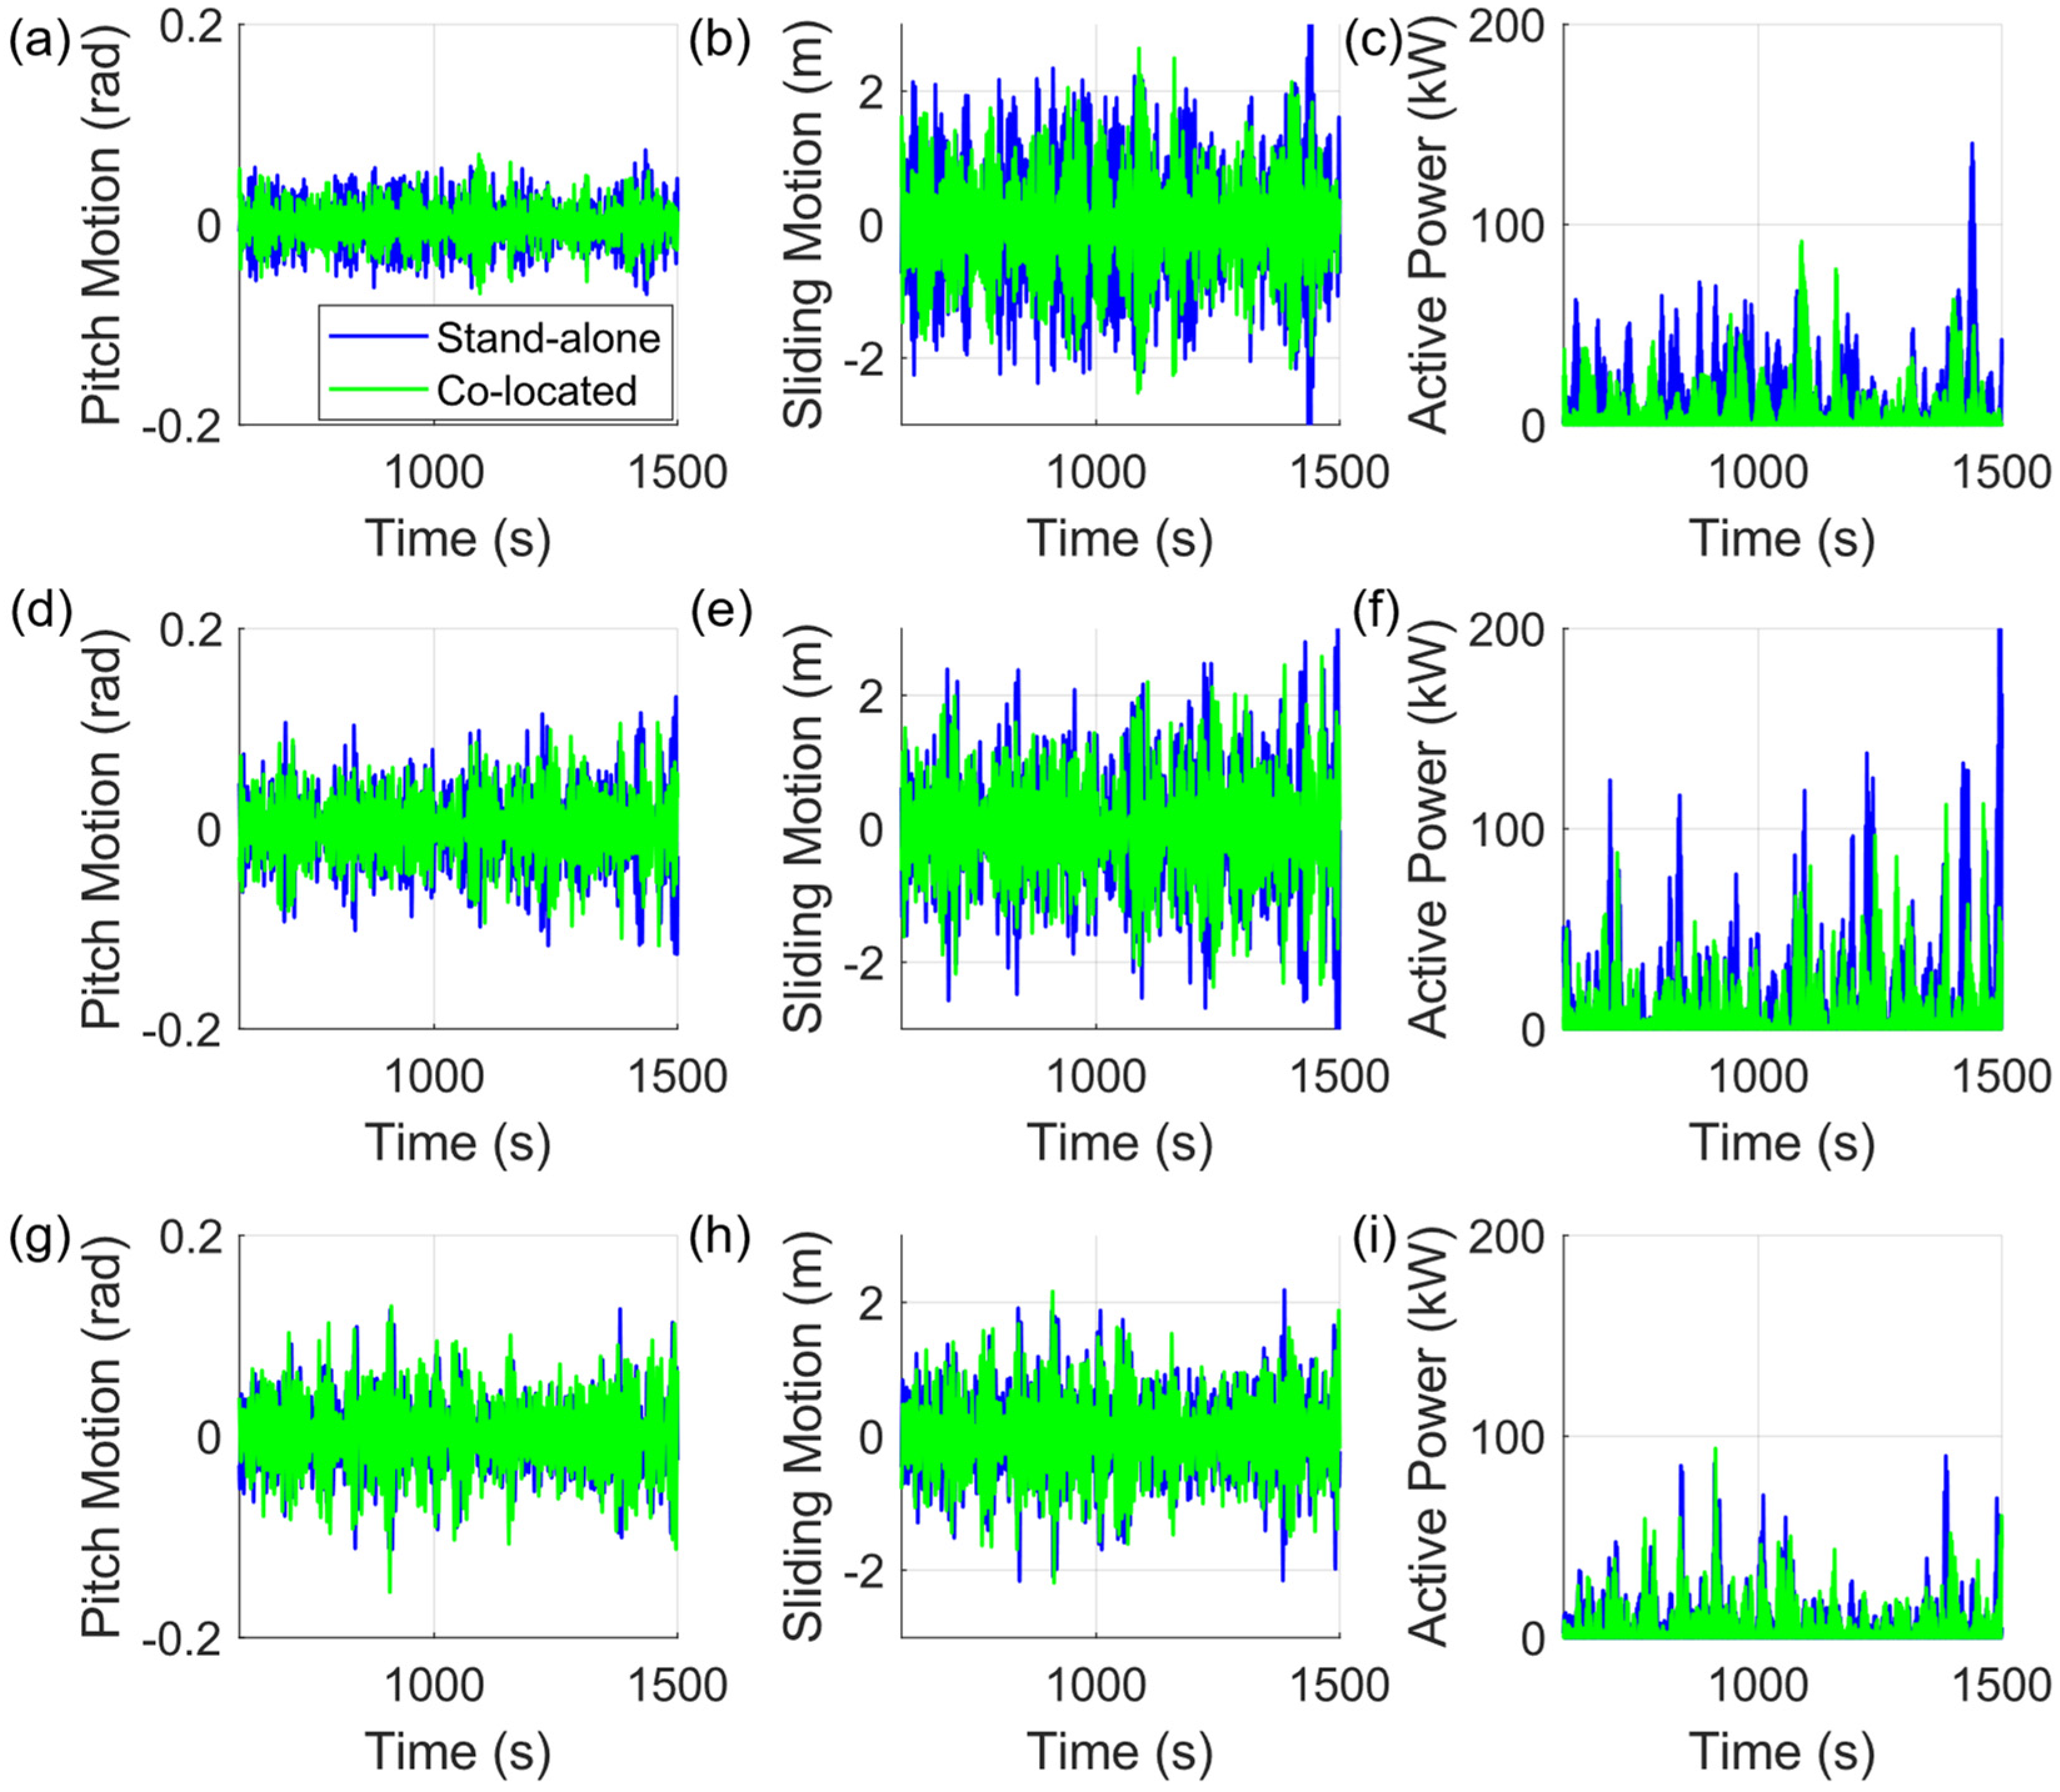
The performance of SR-WEC 2 from Figure 4. is compared to a stand-alone SR-WEC in Figure 15. in terms of pitch, sliding motion, and active power at three T p values of 4.06, 5.22, and 8.7 s, respectively. While the collocated SR-WEC has smaller pitch and sliding motion amplitudes at 4.06 s and 5.22 s, the amplitudes at the most commonly occurring sea state at 8.7 s are higher in the collocated system.
Observing Figure 16, the spectral peaks of the pitch and sliding power spectral density of SR-WEC 2 in the collocated case are coincident with the wave excitation spectral peak at each T p value, indicating that the optimum stand-alone operational parameters cause the collocated SR-WEC to resonate in pitch and sliding motion with the wave excitation spectral peak. The larger pitch and sliding power spectral density at 8.7 s observed in Figure 16c,f are due to the increased wave excitation spectral area in the collocated system in Figure 16i.
The AEP of the ten SR-WECs is evaluated at Site B, obtaining 1.44 GWh at a capacity factor of 21% with an average annual power of 171.6 kW. Considering a limitedly optimized linear generator based on the design in [27], the SR-WEC costs are computed for a 1 MWh energy storage system (ESS). As there is no wind speed data specific to the deployment sites in Figure 2, we use the representative offshore wind data for eastern Virginia, located north of Site B [20]. The FOWT’s AEP is 56.36 GWh at a capacity factor of 42.9%, with total losses of 17.76%. The FOWT costs, calculated in USD/kW, are presented in Table 1 [28].
Within the collocated array, the SR-WECs’ power can be transmitted to the grid through shared electrical infrastructure compared to the ESS, which is designed to power offshore infrastructure. The array’s Balance of System (BoS) costs are updated with an intra-array cable system at USD 353/m [35]. The OpEx costs of the array can be lowered, as a larger maintenance window is available due to the shadow effect, and a combined maintenance schedule can share the costs of offshore supply vessels (OSV) and labor. Furthermore, the SR-WEC’s small OpEx is afforded by unique design advantages presented as all the moving parts are fully sealed, and soft mooring can be subsumed into the FOWT OpEx, with the collocated OpEx set to 88% of the stand-alone FOWT’s value [36]. While incorporating the reduced wave loads and motions acting on the FOWT platform and tower will lead to safer operations and a more cost-effective structural assembly, it has not been considered in this study.
Based on the individual AEPs in Table 1, the combined array increases AEP by 2.55%, with the contribution of WECs reaching closer to 4% on a monthly basis due to seasonal variation in FOWT power production. The LCOE of a collocated array is USD 0.123/kWh, which is only 10% of the stand-alone WEC values, indicating the strong synergy between the two.

4. Conclusions

A synergistic offshore floating renewable energy system comprising an array of WECs with adaptive resonance is collocated with a FOWT, with the energy absorbed by the WECs in different sea states with adaptively varying resonance moderating the hydrodynamic loads and platform motions of the FOWT. The kilowatt-scale SR-WEC, which can change its pitch natural frequency to coincide with the incoming irregular waves and entails the highest Capture Width Ratio (CWR) at commonly occurring sea states, is used to construct a 10 WEC array collocated with the 15-MW reference turbine positioned on the VolturnUS semi-submersible floating platform. With the objective function selected as the annual representative wave excitation spectra in three degrees of freedom of the FOWT at a given deployment site, Bayesian optimization is used to identify the spatial arrangement of the multiple floating SR-WECs, which minimizes the objective function.
The arrangement obtained from Bayesian optimization is evaluated in the time domain using WEC-Sim coupled with MOST, which includes the effects of the aerodynamic and wind turbine loads and mooring lines for the FOWT and the nonlinear PTO loads acting on each WEC. The FOWT and WECs are coupled to each other through the hydrodynamics of diffraction and radiation evaluated in WAMIT. At sea states comprising more than two-thirds of annual occurrence, the hydrodynamic loads of the FOWT, the power performance of the WECs, and the nacelle acceleration of the turbine in the collocated system are compared to their stand-alone counterparts. The optimal spatial arrangement of the SR-WECs was evaluated separately at two sites off the coast of North Carolina. The FOWT in the collocated system has a wave excitation spectral area between 16% at T p of 4.06 s and 60% of the corresponding stand-alone case. In the time domain simulation of the optimal collocated system, the RMS and peak values of the turbine nacelle acceleration are reduced by nearly 58% and 67%, respectively, from the single-unit operation due to the smaller hydrodynamic loads. Using the stand-alone device’s optimal operational parameters, the SR-WECs’ pitch and sliding motion in the collocated system adaptively resonate with the wave excitation spectra at different T p cases. Their power performance is symmetrically spatially distributed about the X-axis, with collocation improving the production of 40% of the array compared to single unit operation at highly occurring sea states. The collocated system increases its annual energy production by 1.44 GWh, with a competitive LCOE at USD 0.123/kWh, considering a basic cost-reduction framework, around 10% of the value for a stand-alone SR-WEC array.
The synergistic ocean renewable system can reduce the hydrodynamic loads and platform motions of the FOWT along with increasing the performance of SR-WECs with the collocated array, while achieving a competitive LCOE.
The present work is focused on identifying the optimal arrangement of the SR-WEC array with adaptive resonance to reduce the annual wave excitation acting on the FOWT and consequent evaluation of FOWT global performance and SR-WEC power absorption through a coupled time domain simulation in irregular waves. Subsequent studies could form a multi-objective optimization to identify the optimal arrangement of the SR-WECs with variable x d i s and y d i s that minimize the omnidirectional wave loads and optimal parameters that maximize the power output of the collocated FOWT. The LCOE components, such as shared electrical infrastructure, influenced by collocation are identified in this study. However, the effects of reduced wave loads and platform motions in the context of the design of the FOWT hull, turbine, tower, and mooring system are not considered. As the multi-component LCOE optimization is a complex process, the next study can revise these designs, driving down both CapEx and OpEx towards a lower LCOE.

Author Contributions

Conceptualization, H.K.; Methodology, A.M. and H.K.; Software, A.M.; Validation, A.M. and H.K.; Formal analysis, A.M. and H.K.; Investigation, A.M. and H.K.; Writing—original draft, A.M.; Writing—review and editing, H.K.; Supervision, H.K.; Project administration, H.K.; Funding acquisition, H.K. All authors have read and agreed to the published version of the manuscript.

Funding

This research is supported by a U.S. Department of Energy’s Water Power Technologies Office project, DE-EE0008630.

Institutional Review Board Statement

Not applicable.

Informed Consent Statement

Not applicable.

Data Availability Statement

The numerical data presented in this study are available upon request from the corresponding author at the author’s discretion.

Acknowledgments

Portions of this research were conducted with the advanced computing resources provided by Texas A&M High-Performance Research Computing. The authors thank Shrikesh Sheshaprasad and Hamid A. Toliyat for providing the linear generator dimensions used for LCOE evaluation.

Conflicts of Interest

The authors declare no conflict of interest.

References

  1. Papi, F.; Bianchini, A. Technical challenges in floating offshore wind turbine upscaling: A critical analysis based on the NREL 5 MW and IEA 15 MW Reference Turbines. Renew. Sustain. Energy Rev. 2022, 162, 112489. [Google Scholar] [CrossRef]
  2. Jenne, D.S.; Yu, Y.-H.; Neary, V. Levelized Cost of Energy Analysis of Marine and Hydrokinetic Reference Models; National Renewable Energy Lab. (NREL): Golden, CO, USA, 2015.
  3. Pérez-Collazo, C.; Greaves, D.; Iglesias, G. A review of combined wave and offshore wind energy. Renew. Sustain. Energy Rev. 2015, 42, 141–153. [Google Scholar] [CrossRef]
  4. Fusco, F.; Nolan, G.; Ringwood, J.V. Variability reduction through optimal combination of wind/wave resources—An Irish case study. Energy 2010, 35, 314–325. [Google Scholar] [CrossRef]
  5. Babarit, A.; Ahmed, H.B.; Clément, A.H.; Debusschere, V.; Duclos, G.; Multon, B.; Robin, G. Simulation of electricity supply of an Atlantic island by offshore wind turbines and wave energy converters associated with a medium scale local energy storage. Renew. Energy 2006, 31, 153–160. [Google Scholar] [CrossRef]
  6. Astariz, S.; Iglesias, G. Enhancing wave energy competitiveness through co-located wind and wave energy farms. A review on the shadow effect. Energies 2015, 8, 7344–7366. [Google Scholar] [CrossRef]
  7. Astariz, S.; Perez-Collazo, C.; Abanades, J.; Iglesias, G. Towards the optimal design of a co-located wind-wave farm. Energy 2015, 84, 15–24. [Google Scholar] [CrossRef]
  8. Teixeira-Duarte, F.; Ramos, V.; Rosa-Santos, P.; Taveira-Pinto, F. Multi-objective decision tool for the assessment of co-located wave-wind offshore floating energy parks. Ocean. Eng. 2024, 292, 116449. [Google Scholar] [CrossRef]
  9. Jonasson, E.; Fjellstedt, C.; Temiz, I. Grid impact of co-located offshore renewable energy sources. Renew. Energy 2024, 230, 120784. [Google Scholar] [CrossRef]
  10. van der Zant, H.F.; Pillet, A.-C.; Schaap, A.; Stark, S.J.; de Weijer, T.A.; Cahyaningwidi, A.A.; Lehner, B.A. The energy park of the future: Modelling the combination of wave-, wind- and solar energy in offshore multi-source parks. Heliyon 2024, 10, e26788. [Google Scholar] [CrossRef]
  11. Clark, C.E.; Paredes, G.M. Effects of co-located floating wind-wave systems on fatigue damage of floating offshore wind turbine mooring cables. In Proceedings of the International Conference on Offshore Mechanics and Arctic Engineering, San Francisco, CA, USA, 4–7 November 2018; p. V001T001A024. [Google Scholar]
  12. Zhu, K.; Zheng, S.; Michele, S.; Cao, F.; Shi, H. Theoretical modeling of a co-located system with a floating wind platform and vertical truncated cylinders array. Renew. Energy 2024, 223, 120025. [Google Scholar] [CrossRef]
  13. Gubesch, E.; Sergiienko, N.Y.; Nader, J.-R.; Ding, B.; Cazzolato, B.; Penesis, I.; Li, Y. Experimental investigation of a co-located wind and wave energy system in regular waves. Renew. Energy 2023, 219, 119520. [Google Scholar] [CrossRef]
  14. Clark, C.E.; Velarde, J.; Sønderkær Nielsen, J. Fatigue load reductions in offshore wind turbine monopile foundations in co-located wind-wave arrays. In Proceedings of the International Conference on Offshore Mechanics and Arctic Engineering, San Francisco, CA, USA, 4–7 November 2018; p. V001T001A037. [Google Scholar]
  15. Jin, C.; Meduri, A.; Kang, H. Multivariable design optimization for adaptive resonance of a surface riding wave energy converter. Ocean Eng. 2023, 286, 115576. [Google Scholar] [CrossRef]
  16. Allen, C.; Viscelli, A.; Dagher, H.; Goupee, A.; Gaertner, E.; Abbas, N.; Hall, M.; Barter, G. Definition of the UMaine VolturnUS-S Reference Platform Developed for the IEA Wind 15-Megawatt Offshore Reference Wind Turbine; National Renewable Energy Lab. (NREL): Golden, CO, USA, 2020.
  17. Lee, C. Theory Manual; Massachusettes Institute of Tech: Cambridge, MA, USA, 1995. [Google Scholar]
  18. Ogden, D.; Ruehl, K.; Yu, Y.-H.; Keester, A.; Forbush, D.; Leon, J.; Tom, N. Review of WEC-Sim development and applications. Int. Mar. Energy J. 2022, 5. [Google Scholar] [CrossRef]
  19. Sirigu, M.; Faraggiana, E.; Ghigo, A.; Bracco, G. Development of MOST, a fast simulation model for optimisation of floating offshore wind turbines in Simscape Multibody. Proc. J. Phys. Conf. Ser. 2022, 2257, 012003. [Google Scholar] [CrossRef]
  20. Blair, N.; DiOrio, N.; Freeman, J.; Gilman, P.; Janzou, S.; Neises, T.; Wagner, M. System Advisor Model (SAM) General Description (Version 2017.9.5); NREL/TP-6A20-70414; National Renewable Energy Laboratory (NREL): Golden, CO, USA, 2018.
  21. Gaertner, E.; Rinker, J.; Sethuraman, L.; Zahle, F.; Anderson, B.; Barter, G.; Abbas, N.; Meng, F.; Bortolotti, P.; Skrzypinski, W. Definition of the IEA 15-Megawatt Offshore Reference Wind Turbine; National Renewable Energy Laboratory (NREL): Golden, CO, USA, 2020.
  22. Neary, V.S. Characterization of US Wave Energy Converter (WEC) Test Sites: A Catalogue of Met-Ocean Data; EERE Publication and Product Library: Washington, DC, USA, 2015. [Google Scholar]
  23. Garnett, R. Bayesian Optimization; Cambridge University Press: Cambridge, UK, 2023. [Google Scholar]
  24. Ledoux, J.; Riffo, S.; Salomon, J. Analysis of the blade element momentum theory. SIAM J. Appl. Math. 2021, 81, 2596–2621. [Google Scholar] [CrossRef]
  25. Wendt, F.F.; Andersen, M.T.; Robertson, A.N.; Jonkman, J.M. Verification and validation of the new dynamic mooring modules available in FAST v8. In Proceedings of the ISOPE International Ocean and Polar Engineering Conference, Rhodes, Greece, 26 June–1 July 2016; p. ISOPE-I-16-315. [Google Scholar]
  26. Wood, G.D.; Kennedy, D.C. Simulating mechanical systems in Simulink with SimMechanics. Mathworks Rep. 2003, 210. [Google Scholar]
  27. Sheshaprasad, S.; Naghavi, F.; Hasanpour, S.; Albader, M.; Gardner, M.C.; Kang, H.; Toliyat, H.A. Optimal Electric Power Take-off Strategy for Surface Riding Wave Energy Converter. In Proceedings of the 2022 IEEE Energy Conversion Congress and Exposition (ECCE), Detroit, MI, USA, 9–13 October 2022; pp. 1–7. [Google Scholar]
  28. Stehly, T.; Duffy, P. 2020 Cost of Wind Energy Review; National Renewable Energy Lab. (NREL): Golden, CO, USA, 2021.
  29. Yu, Y.-H.; Jenne, D.; Thresher, R.; Copping, A.; Geerlofs, S.; Hanna, L. Reference Model 5 (rm5): Oscillating Surge Wave Energy Converter; National Renewable Energy Lab. (NREL): Golden, CO, USA, 2015.
  30. Short, W.; Packey, D.J.; Holt, T. A Manual for the Economic Evaluation of Energy Efficiency and Renewable Energy Technologies; National Renewable Energy Lab. (NREL): Golden, CO, USA, 1995.
  31. Ancellin, M.; Dias, F. Capytaine: A Python-based linear potential flow solver. J. Open Source Softw. 2019, 4, 1341. [Google Scholar] [CrossRef]
  32. Babarit, A.; Delhommeau, G. Theoretical and numerical aspects of the open source BEM solver NEMOH. In Proceedings of the 11th European Wave and Tidal Energy Conference (EWTEC2015), Nantes, France, 6–11 September 2015. [Google Scholar]
  33. Carter, D. Prediction of wave height and period for a constant wind velocity using the JONSWAP results. Ocean Eng. 1982, 9, 17–33. [Google Scholar] [CrossRef]
  34. Bañuelos-Ruedas, F.; Angeles-Camacho, C.; Rios-Marcuello, S. Analysis and validation of the methodology used in the extrapolation of wind speed data at different heights. Renew. Sustain. Energy Rev. 2010, 14, 2383–2391. [Google Scholar] [CrossRef]
  35. Clark, C.E.; Miller, A.; DuPont, B. An analytical cost model for co-located floating wind-wave energy arrays. Renew. Energy 2019, 132, 885–897. [Google Scholar] [CrossRef]
  36. Astariz, S.; Perez-Collazo, C.; Abanades, J.; Iglesias, G. Co-located wave-wind farms: Economic assessment as a function of layout. Renew. Energy 2015, 83, 837–849. [Google Scholar] [CrossRef]
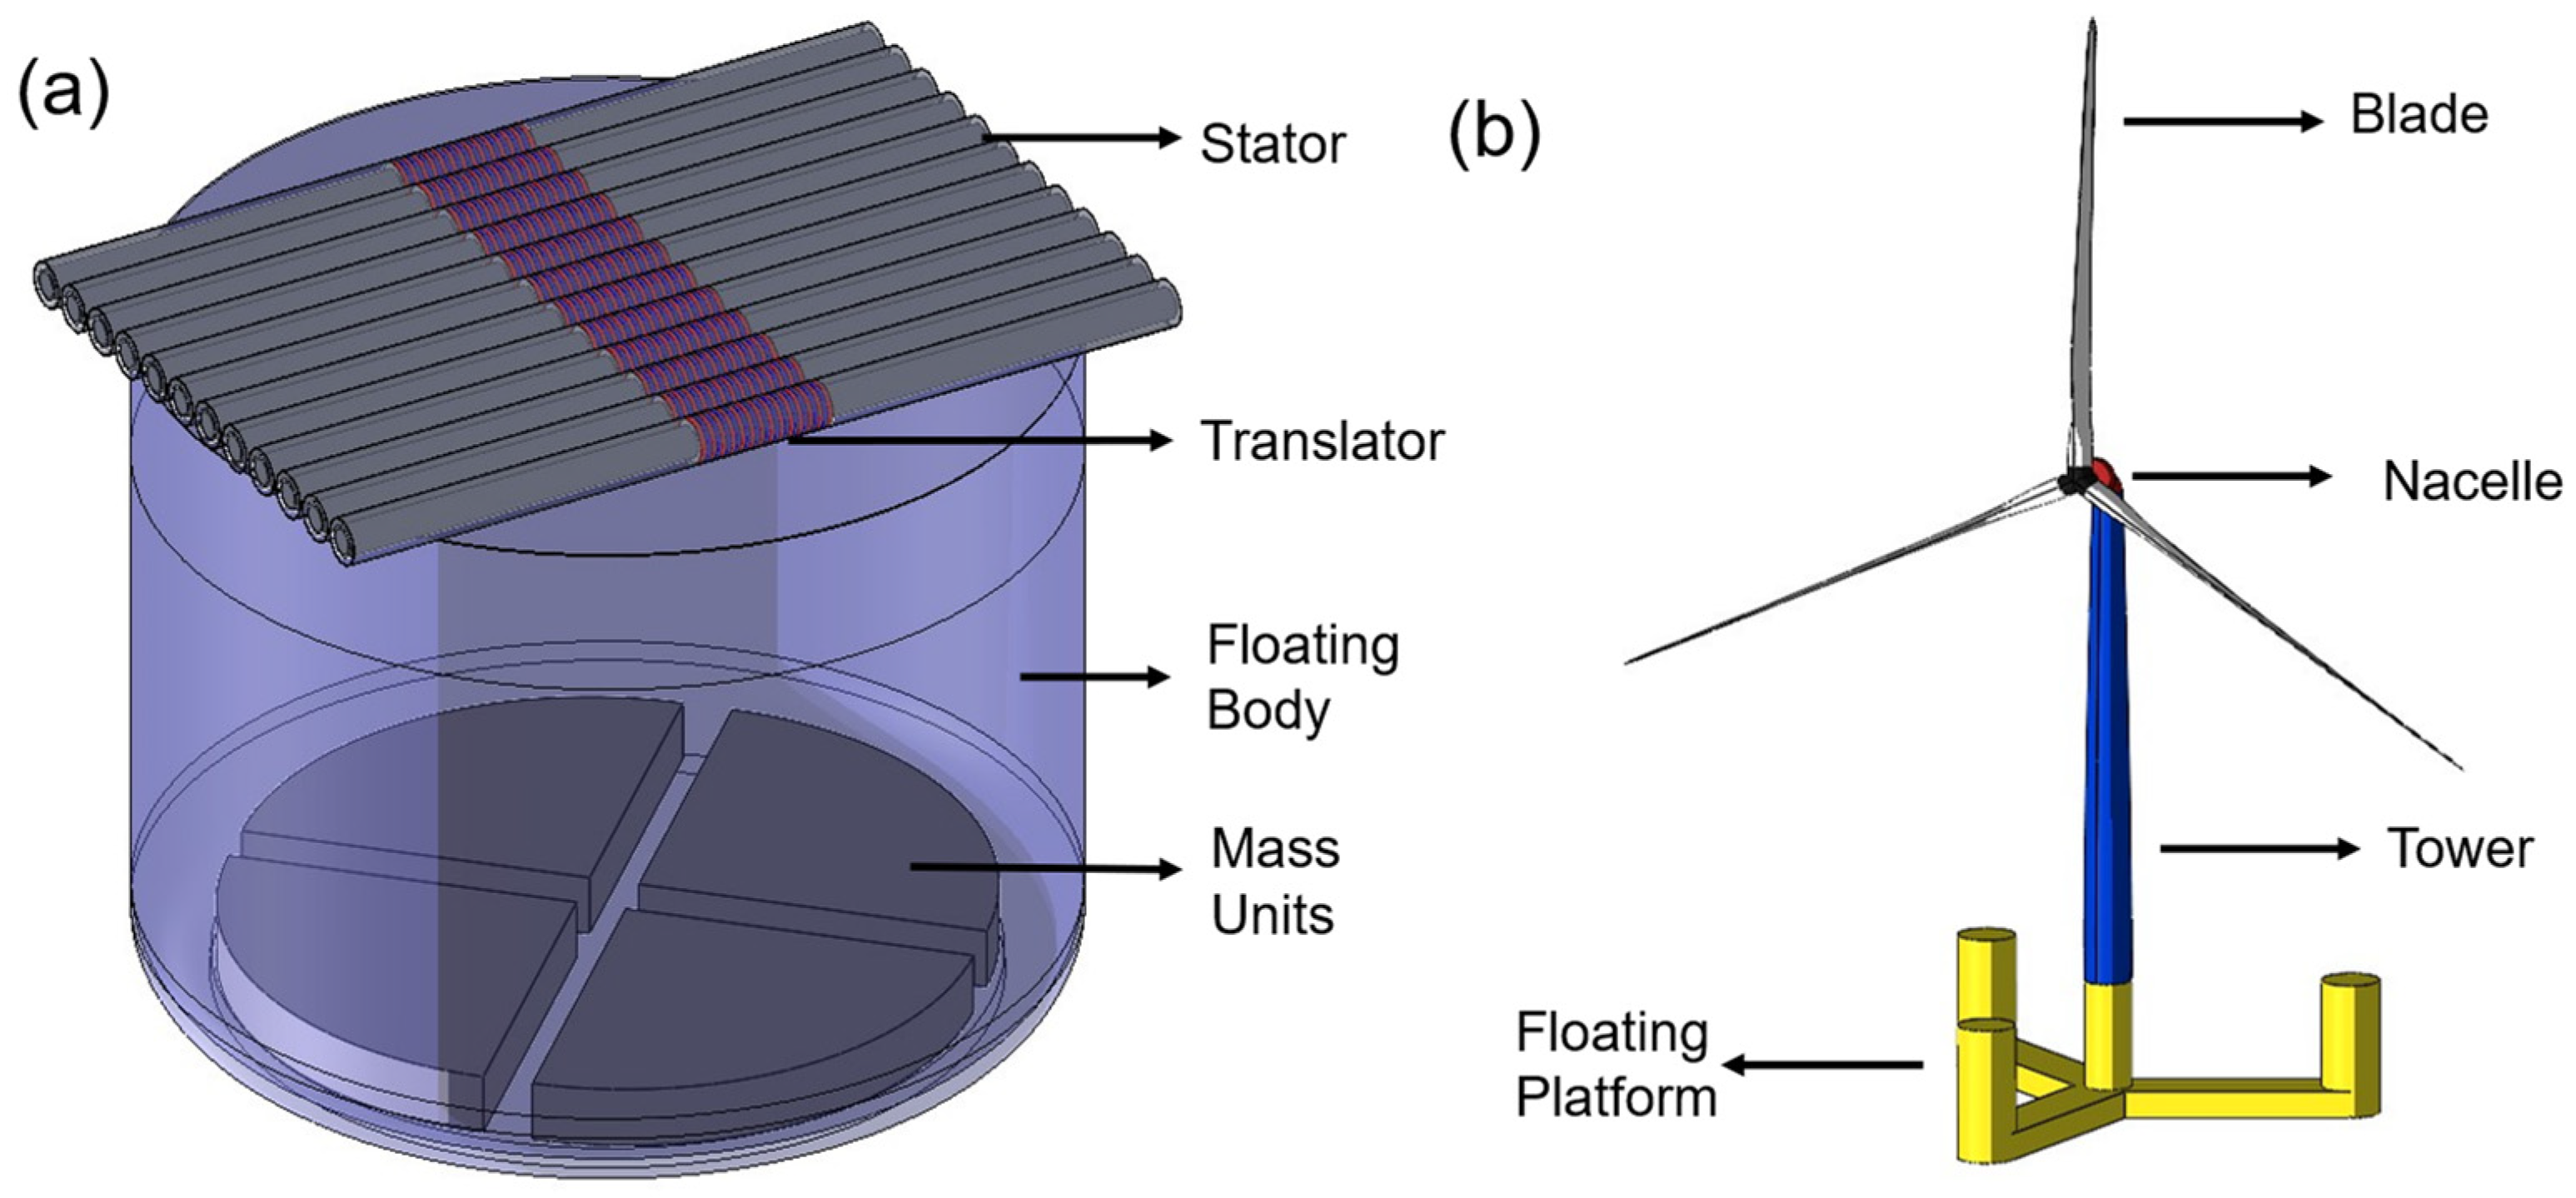
Figure 1. Main components of (a) intermediate scale SR-WEC and (b) IEA 15-MW FOWT [18] (drawings not to scale).
Jmse 12 01455 g001
Figure 2. Wave resource characteristic bin for selected sea states at (a) Test Site A (located near NDBC Buoy 44056, 36.11 N, 75.44 W) and (b) Test Site B (located near NDBC Buoy 41002, 31.88 N, 74.92 W).
Jmse 12 01455 g002
Figure 3. Flowchart of the synergistic integration of the FOWT with the SR-WEC array.
Jmse 12 01455 g003
Figure 4. (a) Plan view of array with FOWT, SR-WECs (labeled 1–10) (not to scale) (b) FOWT Mooring Line Parameters [16].
Jmse 12 01455 g004
Figure 5. Selected mesh of (a) FOWT (b) SR-WEC used in Bayesian optimization. Comparison of wave excitation loads in surge, heave, and pitch for (c) FOWT (d) SR-WEC.
Jmse 12 01455 g005
Figure 6. Objective function 1 3 j = [ 1,3 , 5 ] Λ ¯ j , 1 as a function of x d i s and y d i s for (a) Site A, (b) Site B, and (c) optimization parameters.
Jmse 12 01455 g006
Figure 7. Density of input parameters and minimum objective function evaluated in Bayesian optimization for (a) Site A and (b) Site B.
Jmse 12 01455 g007
Figure 8. Excitation loads in (a) surge, (b) heave, and (c) pitch. Excitation spectra in (d) surge, (e) heave, and (f) pitch at H s = 1.25 m, T p = 6.38 s, 8.7 s of collocated FOWT compared with stand-alone FOWT.
Jmse 12 01455 g008
Figure 9. Excitation loads in (a) surge, (b) heave, and (c) pitch of collocated FOWT compared between WAMIT and Capytaine.
Jmse 12 01455 g009
Figure 10. Optimal (a) PTO stiffness coefficient K P T O and (b) PTO damping coefficient C P T O for SR-WEC at individual sea states.
Jmse 12 01455 g010
Figure 11. Total hydrodynamic load in surge, heave, and pitch for collocated FOWT compared to stand-alone FOWT at (ac) H s = 1.25 m, T p = 4.06 s, (df) H s = 1.25 m, T p = 5.22 s, and (gi) H s = 1.25 m, T p = 8.7 s.
Jmse 12 01455 g011
Figure 12. FOWT platform motions in surge, heave, and pitch for collocated FOWT compared to stand-alone FOWT at (ac) H s = 1.25 m, T p = 4.06 s, (df) H s = 1.25 m, T p = 5.22 s, and (gi) H s = 1.25 m, T p = 8.7 s.
Jmse 12 01455 g012
Figure 13. Nacelle acceleration at H s = 1.25 m (a) maximum (peak) RMS values as a function of T p (b) time history at T p = 8.7 s.
Jmse 12 01455 g013
Figure 14. Spatial distribution of (a) r P as a function of T p at H s = 1.25 m, (b) r P as a function of H s at T p = 8.7 s, and (c) FOWT excitation spectra, and power of SR-WECs as a % of the stand-alone with different T p at H s 1.25 m.
Jmse 12 01455 g014
Figure 15. Performance of SR-WEC 2 in floating body pitch, translator sliding motion, and active power compared to stand-alone SR-WEC at (ac) H s = 1.25 m, T p = 4.06 s, (df) H s = 1.25 m, T p = 5.22 s, and (gi) H s = 1.25 m, T p = 8.7 s.
Jmse 12 01455 g015
Figure 16. Power spectral density of SR-WEC 2 pitch motion at H s = 1.25 m (a) T p = 4.06 s, (b) T p = 5.22 s, and (c) T p = 8.7 s. Power spectral density of SR-WEC 2 translator sliding motion at H s = 1.25 m, (d) T p = 4.06 s, (e) T p = 5.22 s, and (f) T p = 8.7 s. SR-WEC 2 pitch wave excitation spectra at H s = 1.25 m (g) T p = 4.06 s, (h) T p = 5.22 s, and (i) T p = 8.7 s.
Jmse 12 01455 g016
Table 1. Costs, LCOE of stand-alone SR-WEC array, and FOWT compared to a collocated array.
IndexParameterStand-Alone
SR-WEC Array
Stand-Alone
FOWT
Co-Located SR-WEC-FOWT
C1Device Cost ($)$14,713,630$19,515,000$34,228,630
C2Balance of System Cost ($)$750,000$48,510,000$48,913,320
C3Financial Cost($)$154,236$12,240,000$12,394,236
C4Total Capital Cost ($) (C1 + C2 + C3)$15,617,866$80,265,000$95,536,186
C5Annual OpEx (FOC) ($)$42,680$1,770,000$1,557,600
C6Fixed Charge Rate (%)10.80%5.82%5.82%
C7AEP (kWh)1,443,12856,362,30857,805,438
C8LCOE ($/kWh) ((C6 × C4 + C5)/C7)$1.198$0.114$0.123
Disclaimer/Publisher’s Note: The statements, opinions and data contained in all publications are solely those of the individual author(s) and contributor(s) and not of MDPI and/or the editor(s). MDPI and/or the editor(s) disclaim responsibility for any injury to people or property resulting from any ideas, methods, instructions or products referred to in the content.