Article

Inception of Constructional Submarine Conduit by Asymmetry Generated by Turbidity Current

by
Daniel Bayer da Silva
1,*,
Eduardo Puhl
1,
Rafael Manica
1,
Ana Luiza de Oliveira Borges
1 and
Adriano Roessler Viana
2
1
Núcleo de Estudos de Correntes de Densidade (NECOD), Instituto de Pesquisas Hidráulicas (IPH), Universidade Federal do Rio Grande do Sul (UFRGS), Av. Bento Gonçalves, 9500, Porto Alegre 91501-970, RS, Brazil
2
Centro de Pesquisa Leopoldo Américo Miguez de Mello (CENPES), Petróleo Brasileiro S.A. (PETROBRAS), Av. Horácio Macedo, 950, Rio de Janeiro 21941-915, RJ, Brazil
*
Author to whom correspondence should be addressed.
J. Mar. Sci. Eng. 2024, 12(9), 1476; https://doi.org/10.3390/jmse12091476
Submission received: 1 August 2024 / Revised: 16 August 2024 / Accepted: 23 August 2024 / Published: 24 August 2024
(This article belongs to the Section Geological Oceanography)

Abstract

:
Submarine conduits are features responsible for transporting clastic debris from continents to the deep ocean. While the architecture of conduits has been extensively studied, the process of their inception remains unclear. This study highlights the possibility that some conduits are initiated by depositional processes involving turbidity currents. Here, we present the results of eight experiments where gravity currents were allowed to develop their own pathways. The simulation tank represented natural scales of continental shelves, slopes, and basins. The initial experiments involved sediment-laden flows with low density (1–10% in volume). In first experiment runs (Series I), sediment deposition occurred primarily on the shelf and slope, resulting in an asymmetric transverse profile. This asymmetry facilitated subsequent conservative currents (1034 to 1070 kg/m3 due to salt dissolution) flowing alongside during the second series, resulting in the formation of a constructive submarine conduit. This feature is analogous to gully formations observed in various locations. This study correlates these findings with gully-like features and proposes a model where non-confined density flows can evolve into confined flows through the construction of asymmetric topography. An evolutionary model is proposed to explain the mechanism, which potentially elucidates the formation of many submarine conduits.

1. Introduction

Comprehending deep-water processes remains one of the most challenging subjects for both academia and the oil and gas industry. Current knowledge is insufficient to fully describe the sediment transport and sedimentation processes in these environments. Pioneering works [1,2,3,4,5,6] have provided valuable insights into the complexity and difficulties of these environments, particularly due to the challenges in obtaining data. Intriguing phenomena occur in such settings, such as the presence of terrigenous sediment in marine basins at depths of approximately 4000 m [7,8]. This has puzzled researchers worldwide, as they strive to understand how this material is transported over such great distances from the coast, from river mouths to distal lobes in the deep sea.
Flume experiments [2,9] demonstrated that sediment gravity flows have the potential to transport large amounts of terrigenous sediments downward, including a specific type of flow known as turbidity currents [10,11,12,13,14,15,16]. Since the discovery of sandy deposits in the deep sea, there has been ongoing debate regarding their origin. Turbidity currents are considered fundamental for this transportation [13,15]. However, how these sands travel such great distances is still frequently debated, particularly concerning the behavior of the flow and its pathway to reach these locations. The key to fully understanding this process lies in comprehending how these flows originate, evolve, and deposit sediment. A crucial aspect of this comprehension is understanding the environments where these flows occur naturally, often referred to as submarine conduits. Since then, this sedimentological process has been studied and described by numerous authors using various approaches [16,17,18,19,20,21,22,23,24,25,26].

1.1. Submarine Conduits

Submarine conduits are topographic features responsible for transporting clastic debris to deep marine environments [4]. While oceanic currents and contourites [27] serve similar functions, they are not within the scope of this study. The marine sedimentation environment is commonly categorized into the continental shelf, continental slope, and basin [28]. Within these environments, various types of sediment conduits can be identified.
According to [29], submarine canyons are morphological features carved into continental margins, serving as conduits for sediment transport from shelves to basins [14,30,31,32]. Ref. [33] discusses theories regarding canyon formation, including drowned river-cut [34], fault troughs [35], subaerial erosion by rivers [36] in [30], water circulation [37], and tsunamis [38]. However, Ref. [29] initially proposed turbidity current excavation as the most plausible explanation. Ref. [30] emphasizes that all theories involve erosion as a fundamental factor in canyon formation.
Submarine channels act as pathways for turbidity currents, terminating in a depositional terminal splay shortly after passing through an erosive zone called the Channel–Lobe Transition Zone (CLTZ) [16,39]. These channels are maintained by erosion along the channel floor and the deposition of levees along channel margins [16].
Submarine gullies are commonly found on the upper continental slopes of most continental margins [6,40] and are recognized as erosional pathway features [7,40,41]. They typically appear as relatively small-scale, straight, shallow channelized features and often intersect with submarine canyons at higher angles, forming a dendritic pattern [40,42,43].
On the continental shelf, a well-developed drainage network is formed [44,45,46], primarily due to periodic sea level fluctuations (during glacial ages), resulting in the progradation of fluvial systems. Additionally, deltas of various origins and shapes can establish independent drainage networks within the deltaic plain, extending from the deltaic front to the prodelta [47,48]. These conduits often extend to the continental-shelf break region, connecting with other conduit systems such as submarine canyons on the continental slope [4,29,49]. Submarine canyons serve as primary conduits for transporting terrigenous sediments from the continental shelf to the basin region and are regularly characterized by their dimensions and geometry, which are highlighted in seismic images. Consequently, this feature represents one of the most extensively studied conduits to date [32,50,51,52,53].
The slope of the deep marine environment represents the most abrupt break in the entire system, giving rise to significant escarpments and various mass flows [54,55,56,57]. Some of these processes may directly contribute to the formation of submarine gullies, often associated with submarine canyons. These features encompass trenches, fault valleys, sea valleys, and troughs, without clear distinctions between them [58]. Typically, these morphological features are smaller in scale (10–100 m) compared to submarine canyons [59]. Submarine gullies occasionally extend from the slope to the continental rise or basin plain, where they connect with other systems known as deep submarine channels. These channels are located in the basin region at significant depths and can extend over distances exceeding a hundred kilometers [60,61].
Since their discovery on the continental margins of North America in the 1940s, deep-water channels have been a focus of significant research efforts [3]. They are recognized as important hydrocarbon reservoirs [39,61,62], and they were the object of multidisciplinary investigation. These include in situ investigations using piston cores [3,63], seismic analysis [43,64], descriptions based on continental outcrops [39,65,66,67], and numerical and physical modeling [68,69,70,71,72,73,74,75,76,77].

1.2. Phenomenon Magnitude: Process Scale

The diversity of physiographies in submarine conduits demonstrates a wide range of geometrical dimensions and scales (Table 1). Due to the challenges in acquiring field data, some internal features are not well detected by sonars and seismic surveys in both marine regions and on land outcrops (e.g., submarine channels, as noted by [73,78]). One approach to addressing this issue is through physical modeling, where experiments can replicate the prototype (natural phenomenon) using its actual scales. However, it is not feasible to replicate all scales involved when dealing with systems spanning hundreds of thousands of meters [79]. Therefore, scaled representations must be employed to mimic natural dimensions in laboratory settings.

1.3. Conduit Inception

The architectural analysis of conduits has been extensively studied [64,66,85,87,88,89,90]. However, there are significant concerns regarding inception processes. For instance, Ref. [64] suggested submarine canyon initiation through erosion caused by turbidity currents, while Ref. [87] proposed similar inception processes for certain types of gullies. Additionally, Refs. [91,92,93] have also studied the formation of submarine channels via turbidity currents.
It is important to note that many of these authors emphasize erosive processes as dominant in conduit inception (sometimes the only process). However, Ref. [94] documented the presence of aggradational processes in the formation of submarine conduits, specifically submarine channels. Other studies also suggest predominant depositional processes in conduit inception [50,87,95].
Based on that premise, this work aims to experimentally demonstrate the capability of turbidity currents to predominantly construct submarine conduits through depositional processes, albeit with associated erosional processes of secondary importance. Furthermore, this work intends to offer a new perspective by demonstrating the possibility that some submarine features, previously interpreted as erosive based on their morphology/topography, may actually originate from depositional processes.

2. Materials and Methods

2.1. Experimental Apparatus

The experiments were conducted at NECOD, Federal University of Rio Grande do Sul (UFRGS), in a basin tank with a length of 2.15 m, a width of 1.69 m, and a depth of 0.70 m (Figure 1). This tank was constructed to replicate a natural marine environment (Campos Basin, Southern Brazil) with components representing continental shelf, slope, and basin at 1:50.000 natural scales. The shelf and slope are 58.6 cm long but are inclined at 1.5° and 4.0°, respectively. The basin region of model consisted in a horizontal area with a length of 0.977 m and a width of 1.69 m (Figure 1). The experiments were conducted in submerged conditions.
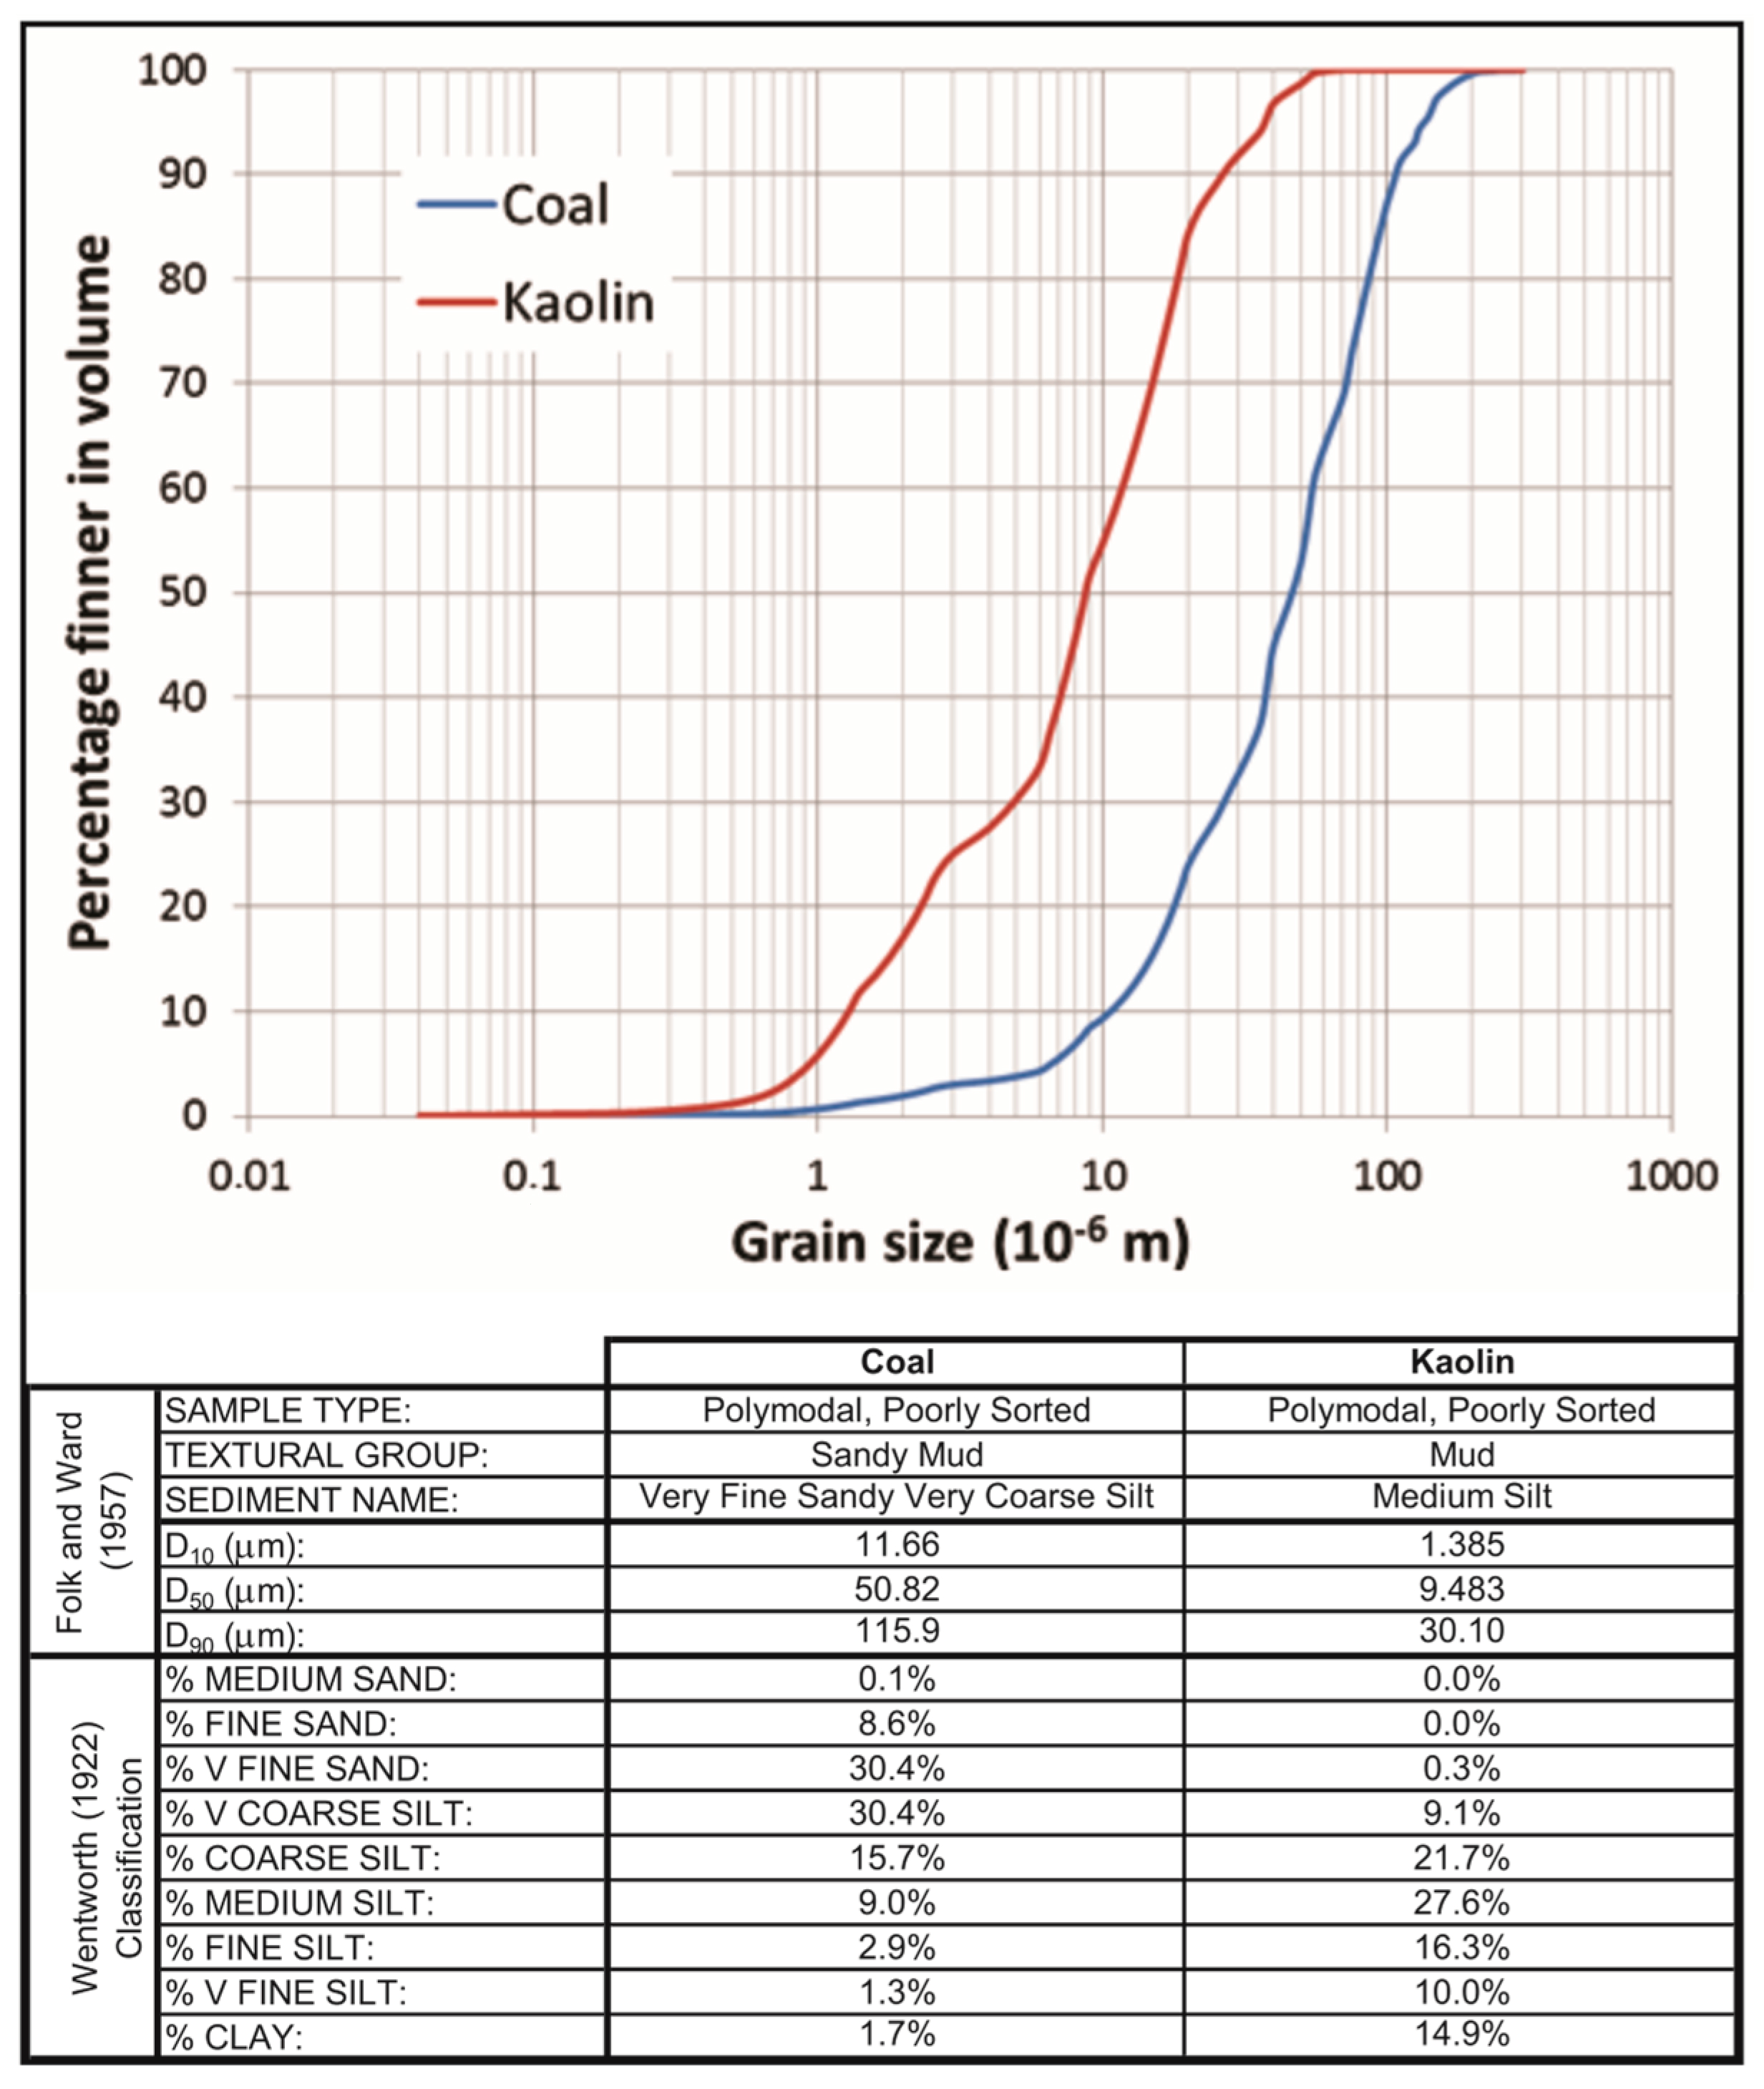
An auxiliary reservoir was used to prepare mixtures of water and sediment, or water and salt, which were injected into the tank through an output. Injection was controlled using a valve and a flow meter (SIEMENS model Sitrans F M MAG 1100, Nürnberg, Germany). The sediments used in the experiments were as follows: crushed coal (density 1.19 g/cm3 and d50 = 40 µm), representing sand and silt sizes at natural scale, and kaolin (density 2.65 g/cm3 and d50 = 6.5 µm), representing cohesive clay size at natural scale (Figure 2).
Coal is used to scale down grain sizes in the model, aligning with the fall velocity proportionate to the flow velocity [96]. Coal facilitates the replication of grain sizes at scale, without cohesive effects (scale effects). Kaolin is utilized to simulate clay sizes due to its availability in large quantities and low cost.
Two digital cameras (Nikon D-5000, Tokyo, Japan and Panasonic Lumix DMC-FZ30, Osaka, Japan) recorded the evolution of all runs at a rate of 0.2 Hz, and instantaneous velocity measurements were conducted using an Acoustic Doppler Velocity profiler (ADV-Nortek’s Vectrino®, Rud, Norway) at a rate of 20 Hz. Additionally, at the end of each run, bathymetries of the deposits were measured using a laser scanner system (Micro-epsilon model OptoNCDT IDL 1700-750, Ortenburg, Germany), and a digital 3D surface evolution model was constructed using AspenTech’s GOCAD® (https://www.aspentech.com/en/, Bedford, MA, USA).

2.2. Experiments

The experiments were conducted by filling the tank with clean water up to the top and injecting the mixture at a specific flow rate. Upon entry, the mixture, denser than the surrounding water, flowed along the tank bottom, depositing sediment as it descended (in the case of turbidity currents). Ambient water entrainment reduced the current’s density and velocity progressively. After completion, sediment settled undisturbed for a minimum of 24 h before slowly draining through a bottom outlet to preserve the final deposit morphology. Bathymetric surveys were conducted after each experiment to document deposit characteristics.
The experiments studied in this work were divided (Table 2) into two series; however, each experiment was allowed to flow on top of the deposit generated by the last run. The first series consisted of 5 cohesive flows (65–75% kaolin ratio and a total time of 231 min). The second series comprised 3 runs with dyed brine of densities ranging from 1035 to 1070 kg/m3. Initially, the initial experiments (runs E1 to E5) were conducted to allow conditions for the self-confinement of the flow and to identify circumstances under which a conduit could be formed. Subsequently, the saline flows (runs E6 to E8) were used to track the preferential path of the flow and its erosive capacity.

3. Results

The results presented here were divided in the two series simulated.

3.1. Series I

For the sake of comparison, some properties of the simulated flow afterwards (Figure 3) show a timeseries evolution of the main properties measured, such as average flow rate and volumetric concentration of the sediment mixture. Although the flow rate was manually controlled by a valve throughout the experiment, some fluctuations in the data were observed due to partial clogging in the feeder system. However, these variations did not affect the final results.
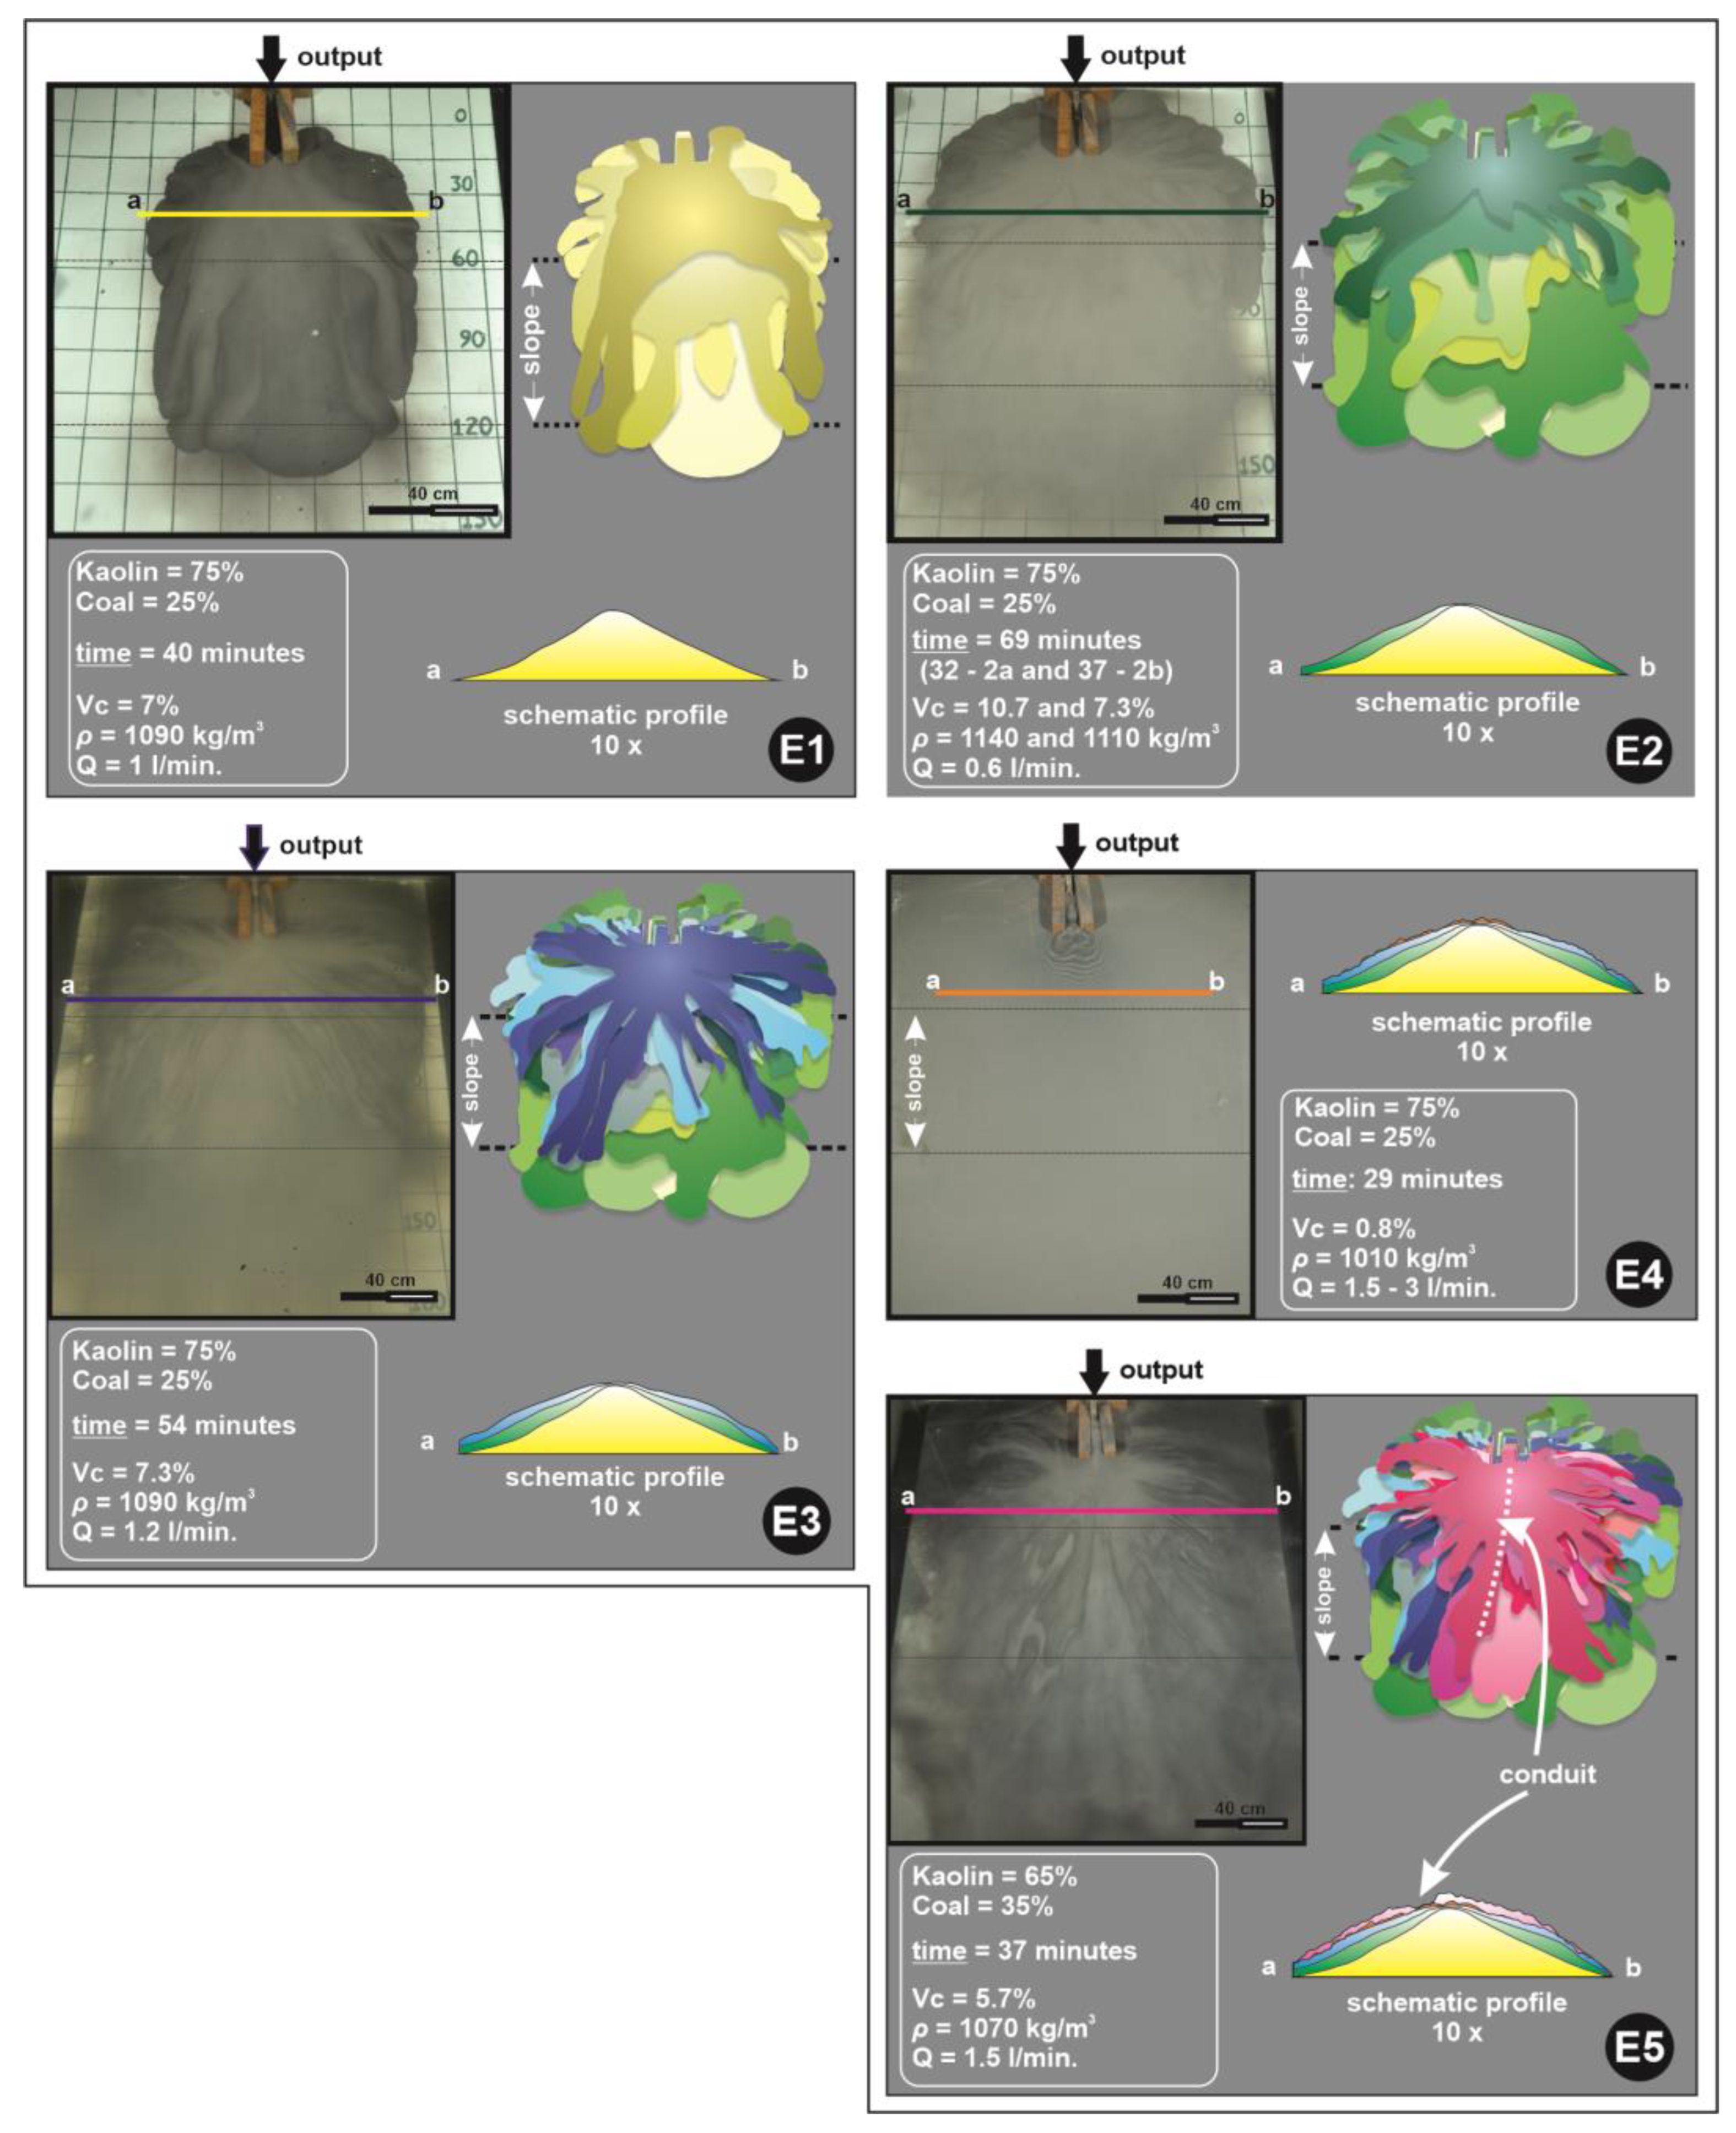
Based on video analyses of the flows, Figure 4 demonstrates the evolution of all the experiments from Series I, showing the relationship between the flow and the final deposit generated. In run E1 (Vc = 7.04%; Q = 1 L min−1), deposition occurred primarily in the central part of the shelf and slope up to the basin. In contrast, run E2 (Vc = 10.70%a and 7.34%b; Q = 0.6 L min−1) shows lateral compensation and filling of free spaces, as depicted in the schematic profiles. Indeed, these two runs were responsible for transporting a larger amount of sediment to the basin.
Run E3 (Vc = 7.29%; Q = 1.2 L min−1) continued to fill the gaps above the irregular and asymmetrical deposit formed previously; however, these flows built some “tongues” in several directions without a preferential path. During run E4, the discharge was increased (1.5 to 3.0 L min−1), and the concentration was reduced, which led to few sediment remobilizations, mainly in front of the injection point, barely changing the shape of the deposit (Figure 4). On the other hand, in run E5 (Vc = 5.68%; Q = 1.5 L min−1), a preferential path (conduit) was constructed, mainly due to asymmetry generated in the top region of the deposit, directing the flow entirely through it.
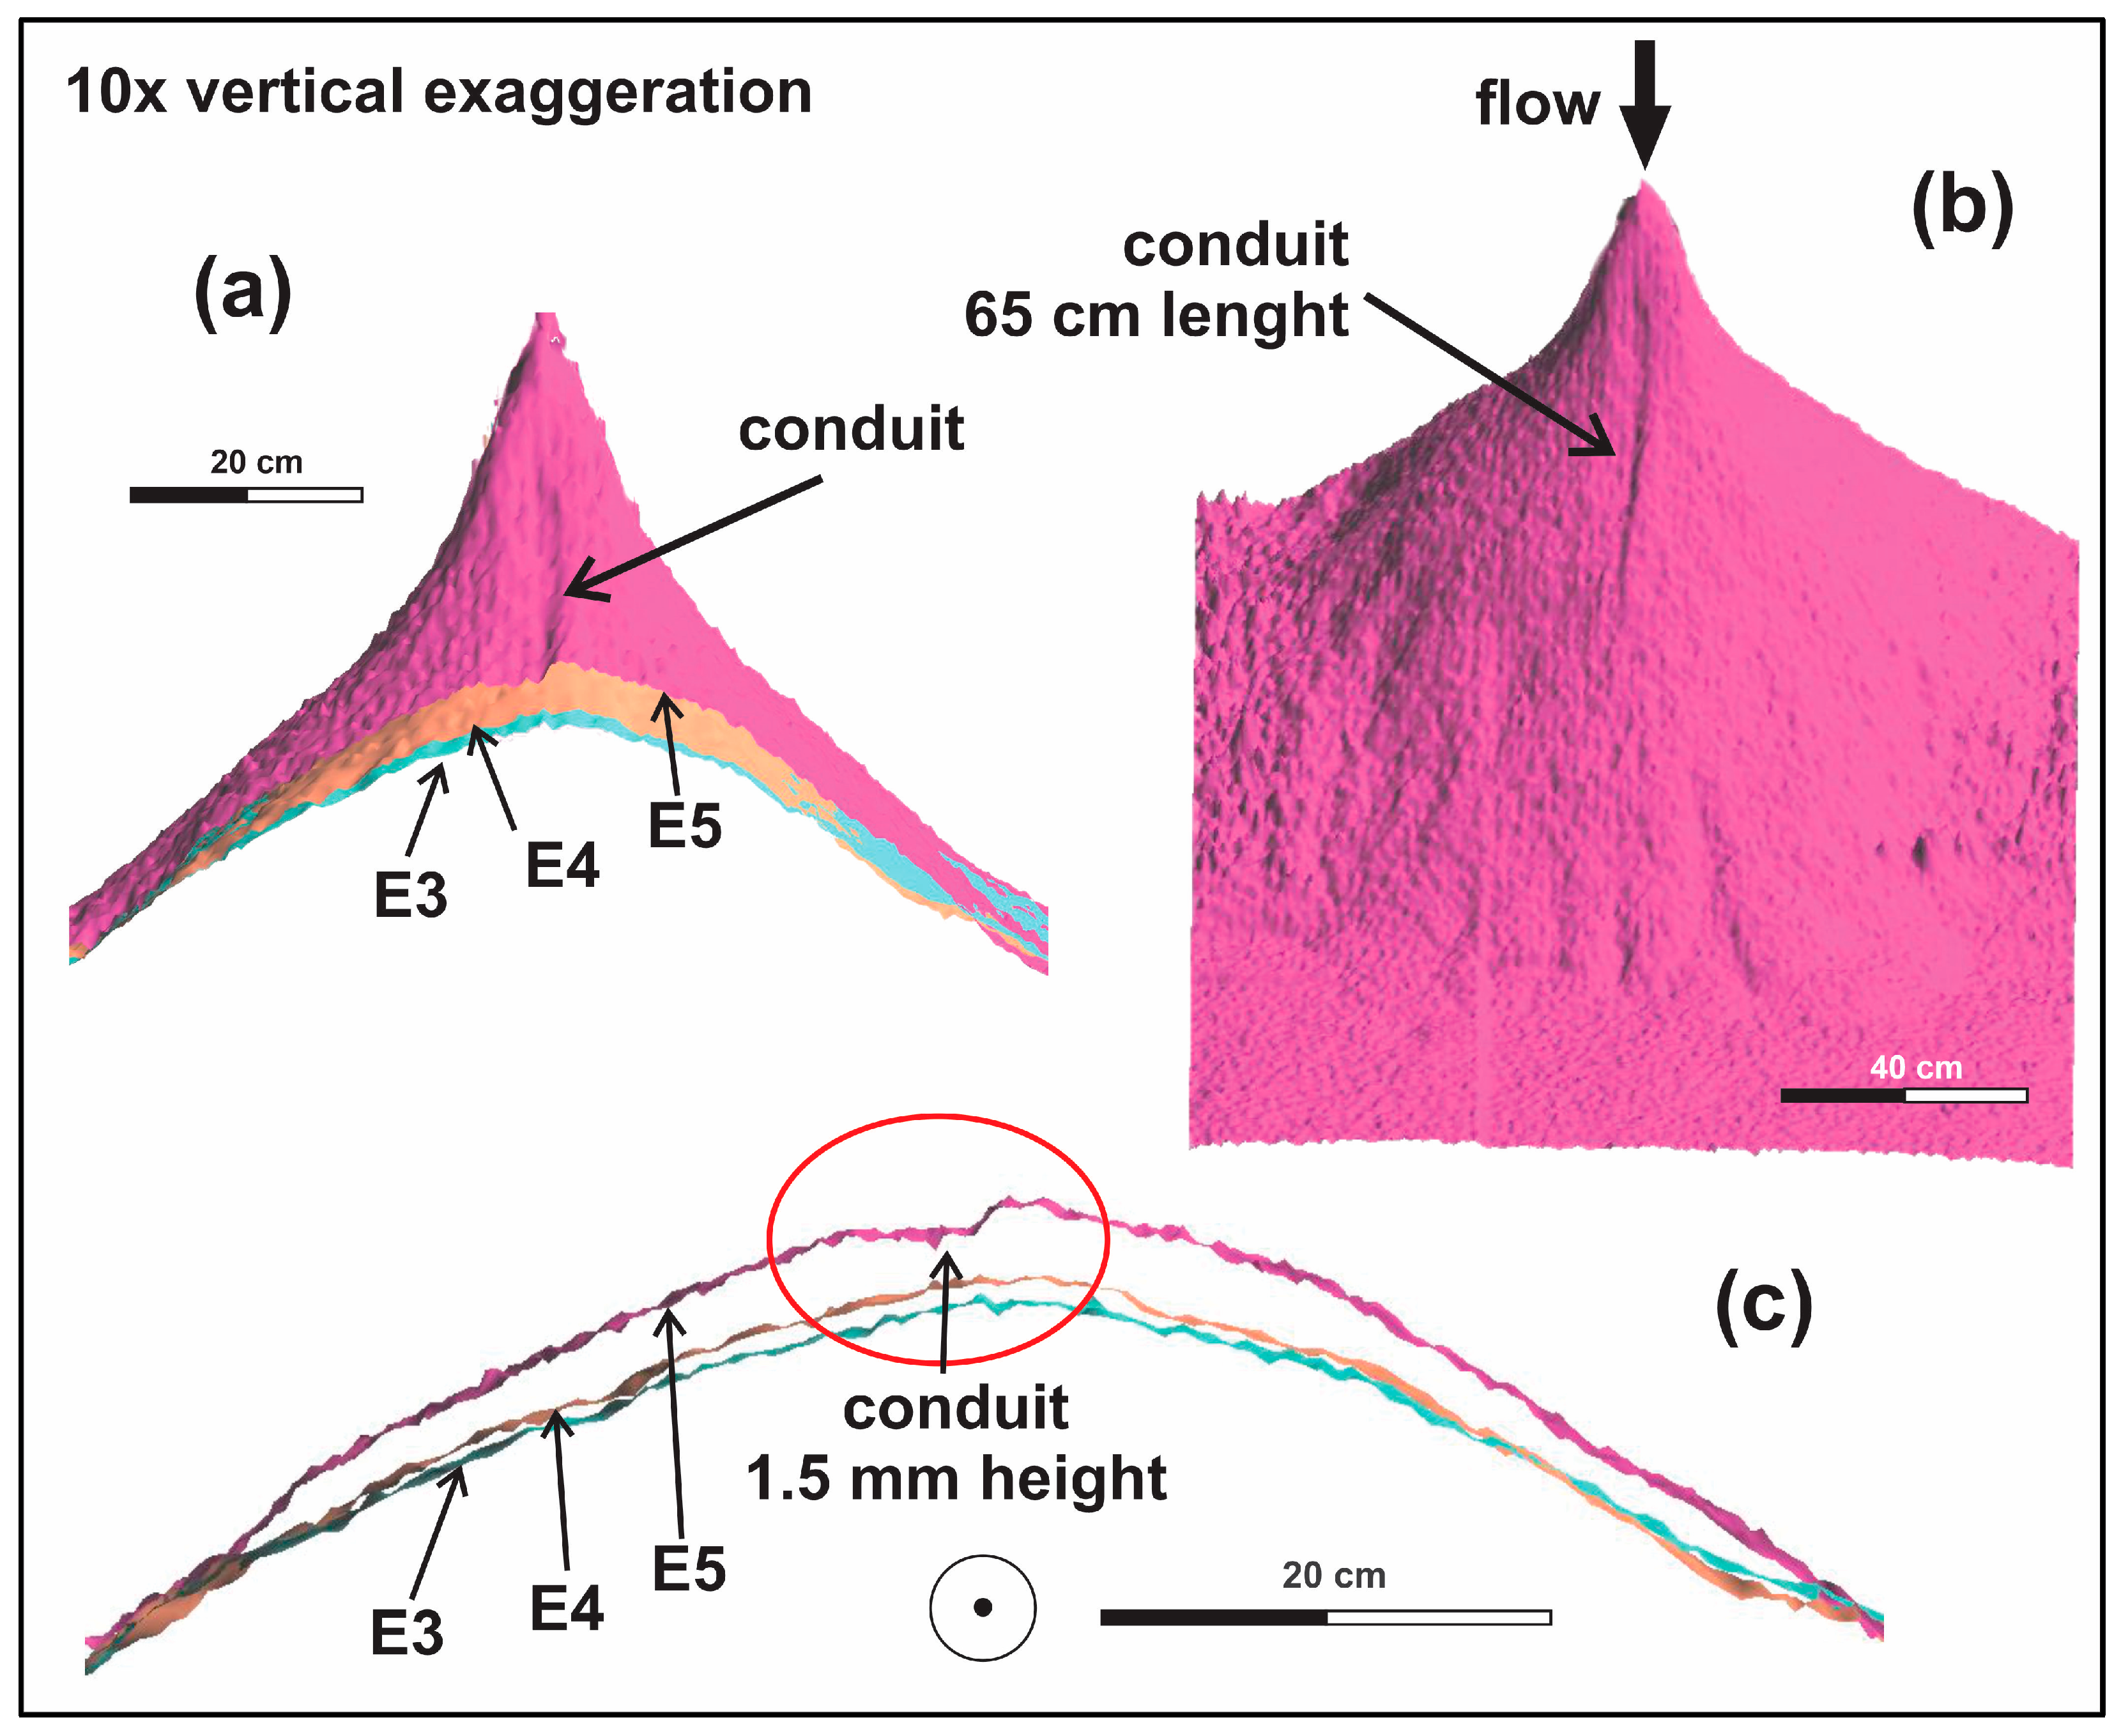
In order to better visualize the conduit created during run E5, Figure 5 shows a schematic profile of the digital 3D surface model (based on laser bathymetry). Via an analysis of the time evolution layers deposited (from E3, E4, and E5), it is inferred that the submarine conduit emerged primarily in the last run, limited over the shelf and slope, presenting a final asymmetric transverse profile (E5) with a height of 1.5 mm and length of 65 cm (Figure 6).

3.2. Series II

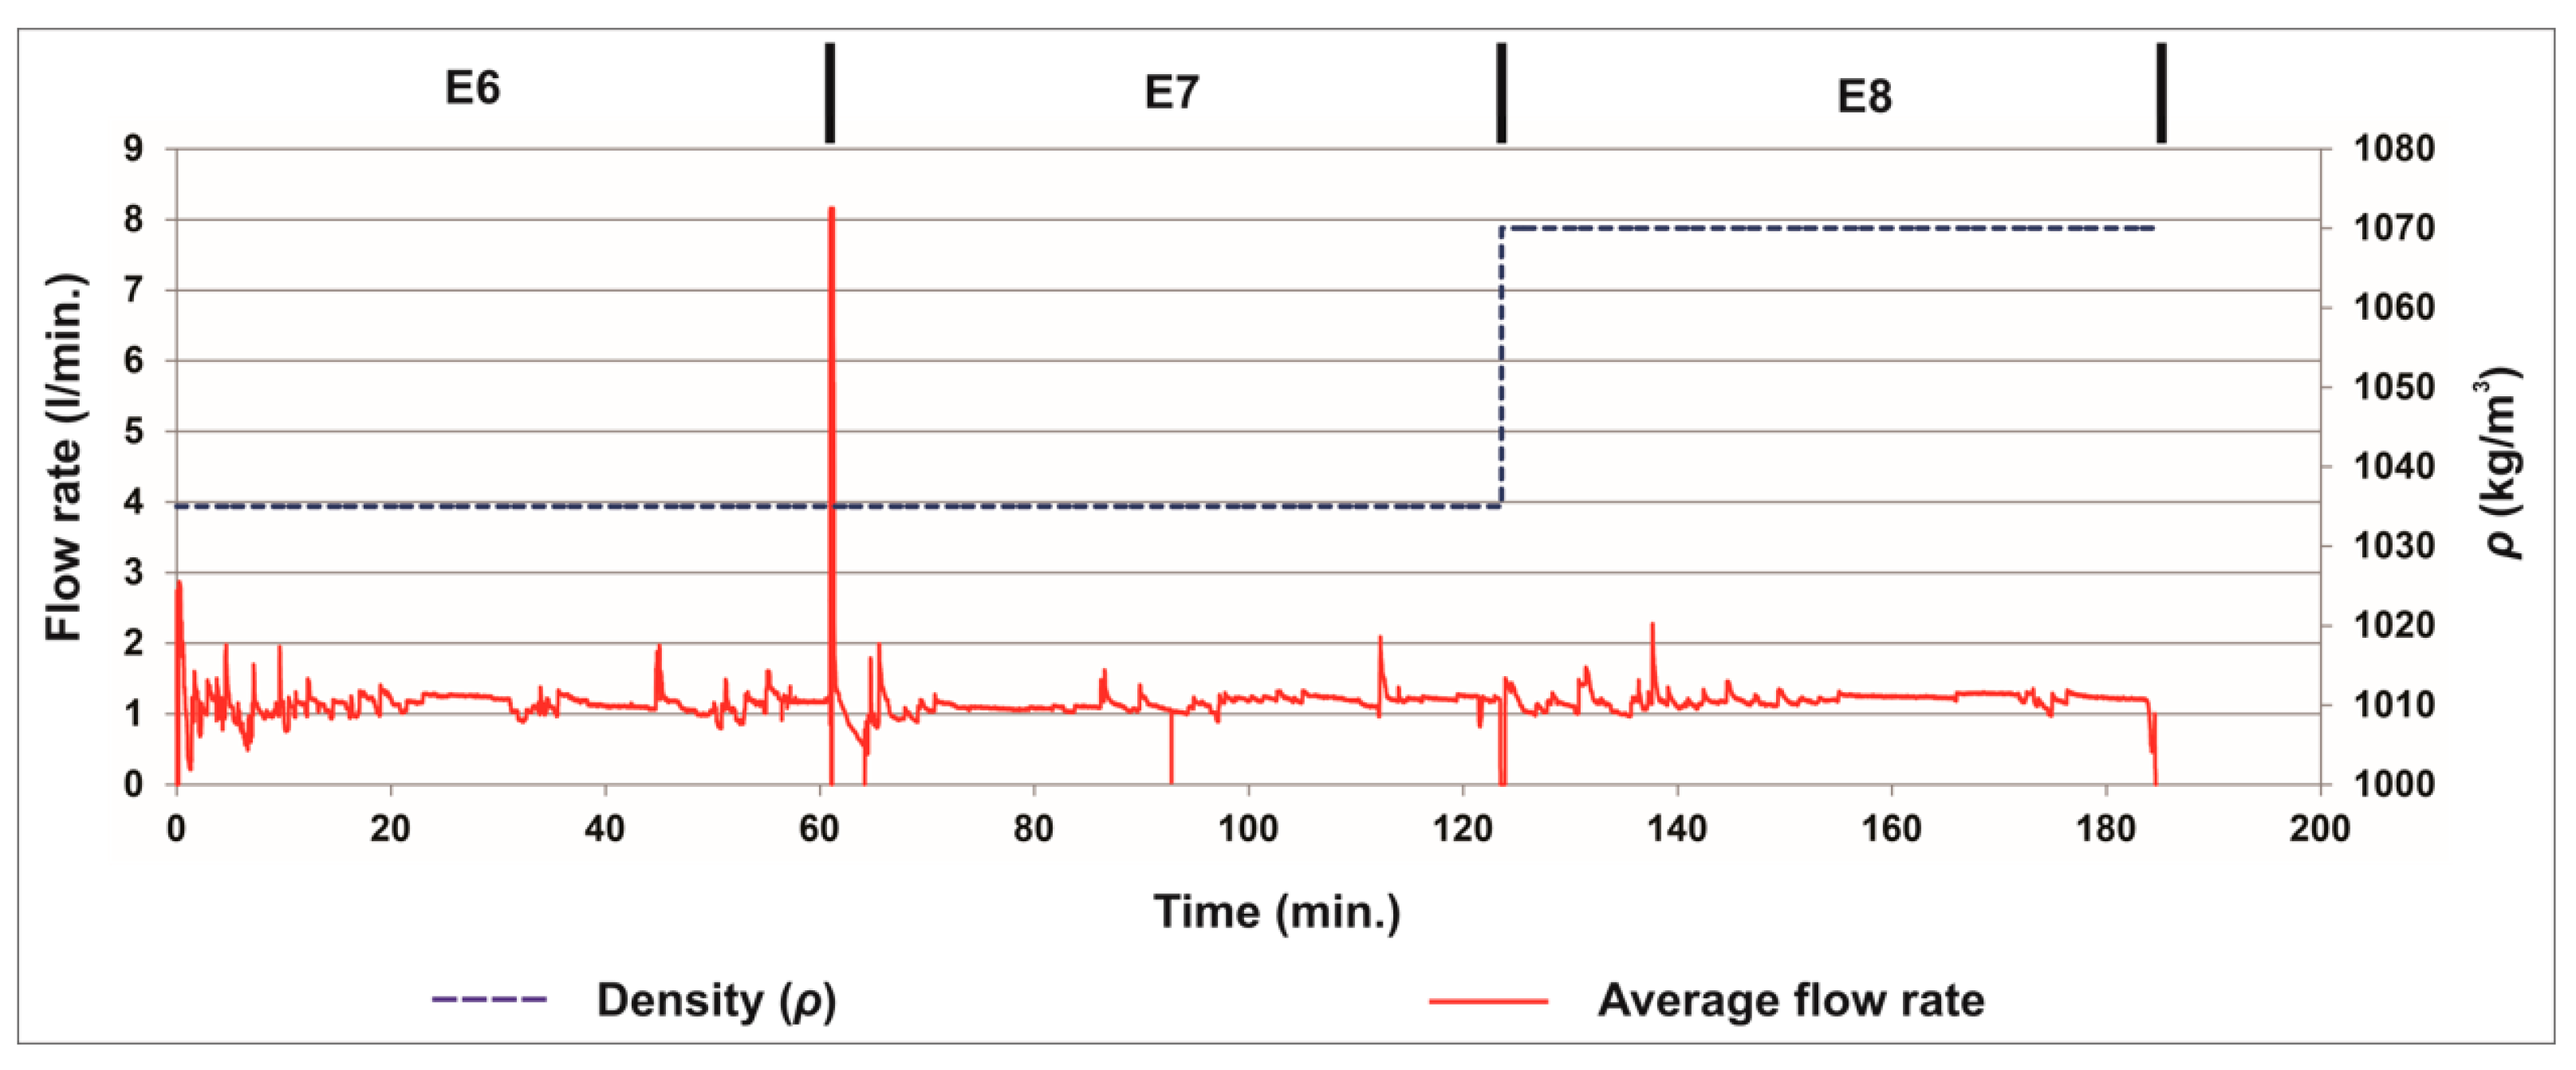
The results of Series I suggested the formation of a submarine conduit. To validate this, a new series of dyed saline currents was conducted. Again, a timeseries of flow properties from Series II is presented in Figure 6. The average flow rate peaked at 60 min, showing inconsistencies at that moment likely due to air in the pipes of the injection system. However, we believe this result was not significant when considering the total experiment time. Additionally, the flow rate remained almost constant throughout the 185 min simulation, with only minor fluctuations.
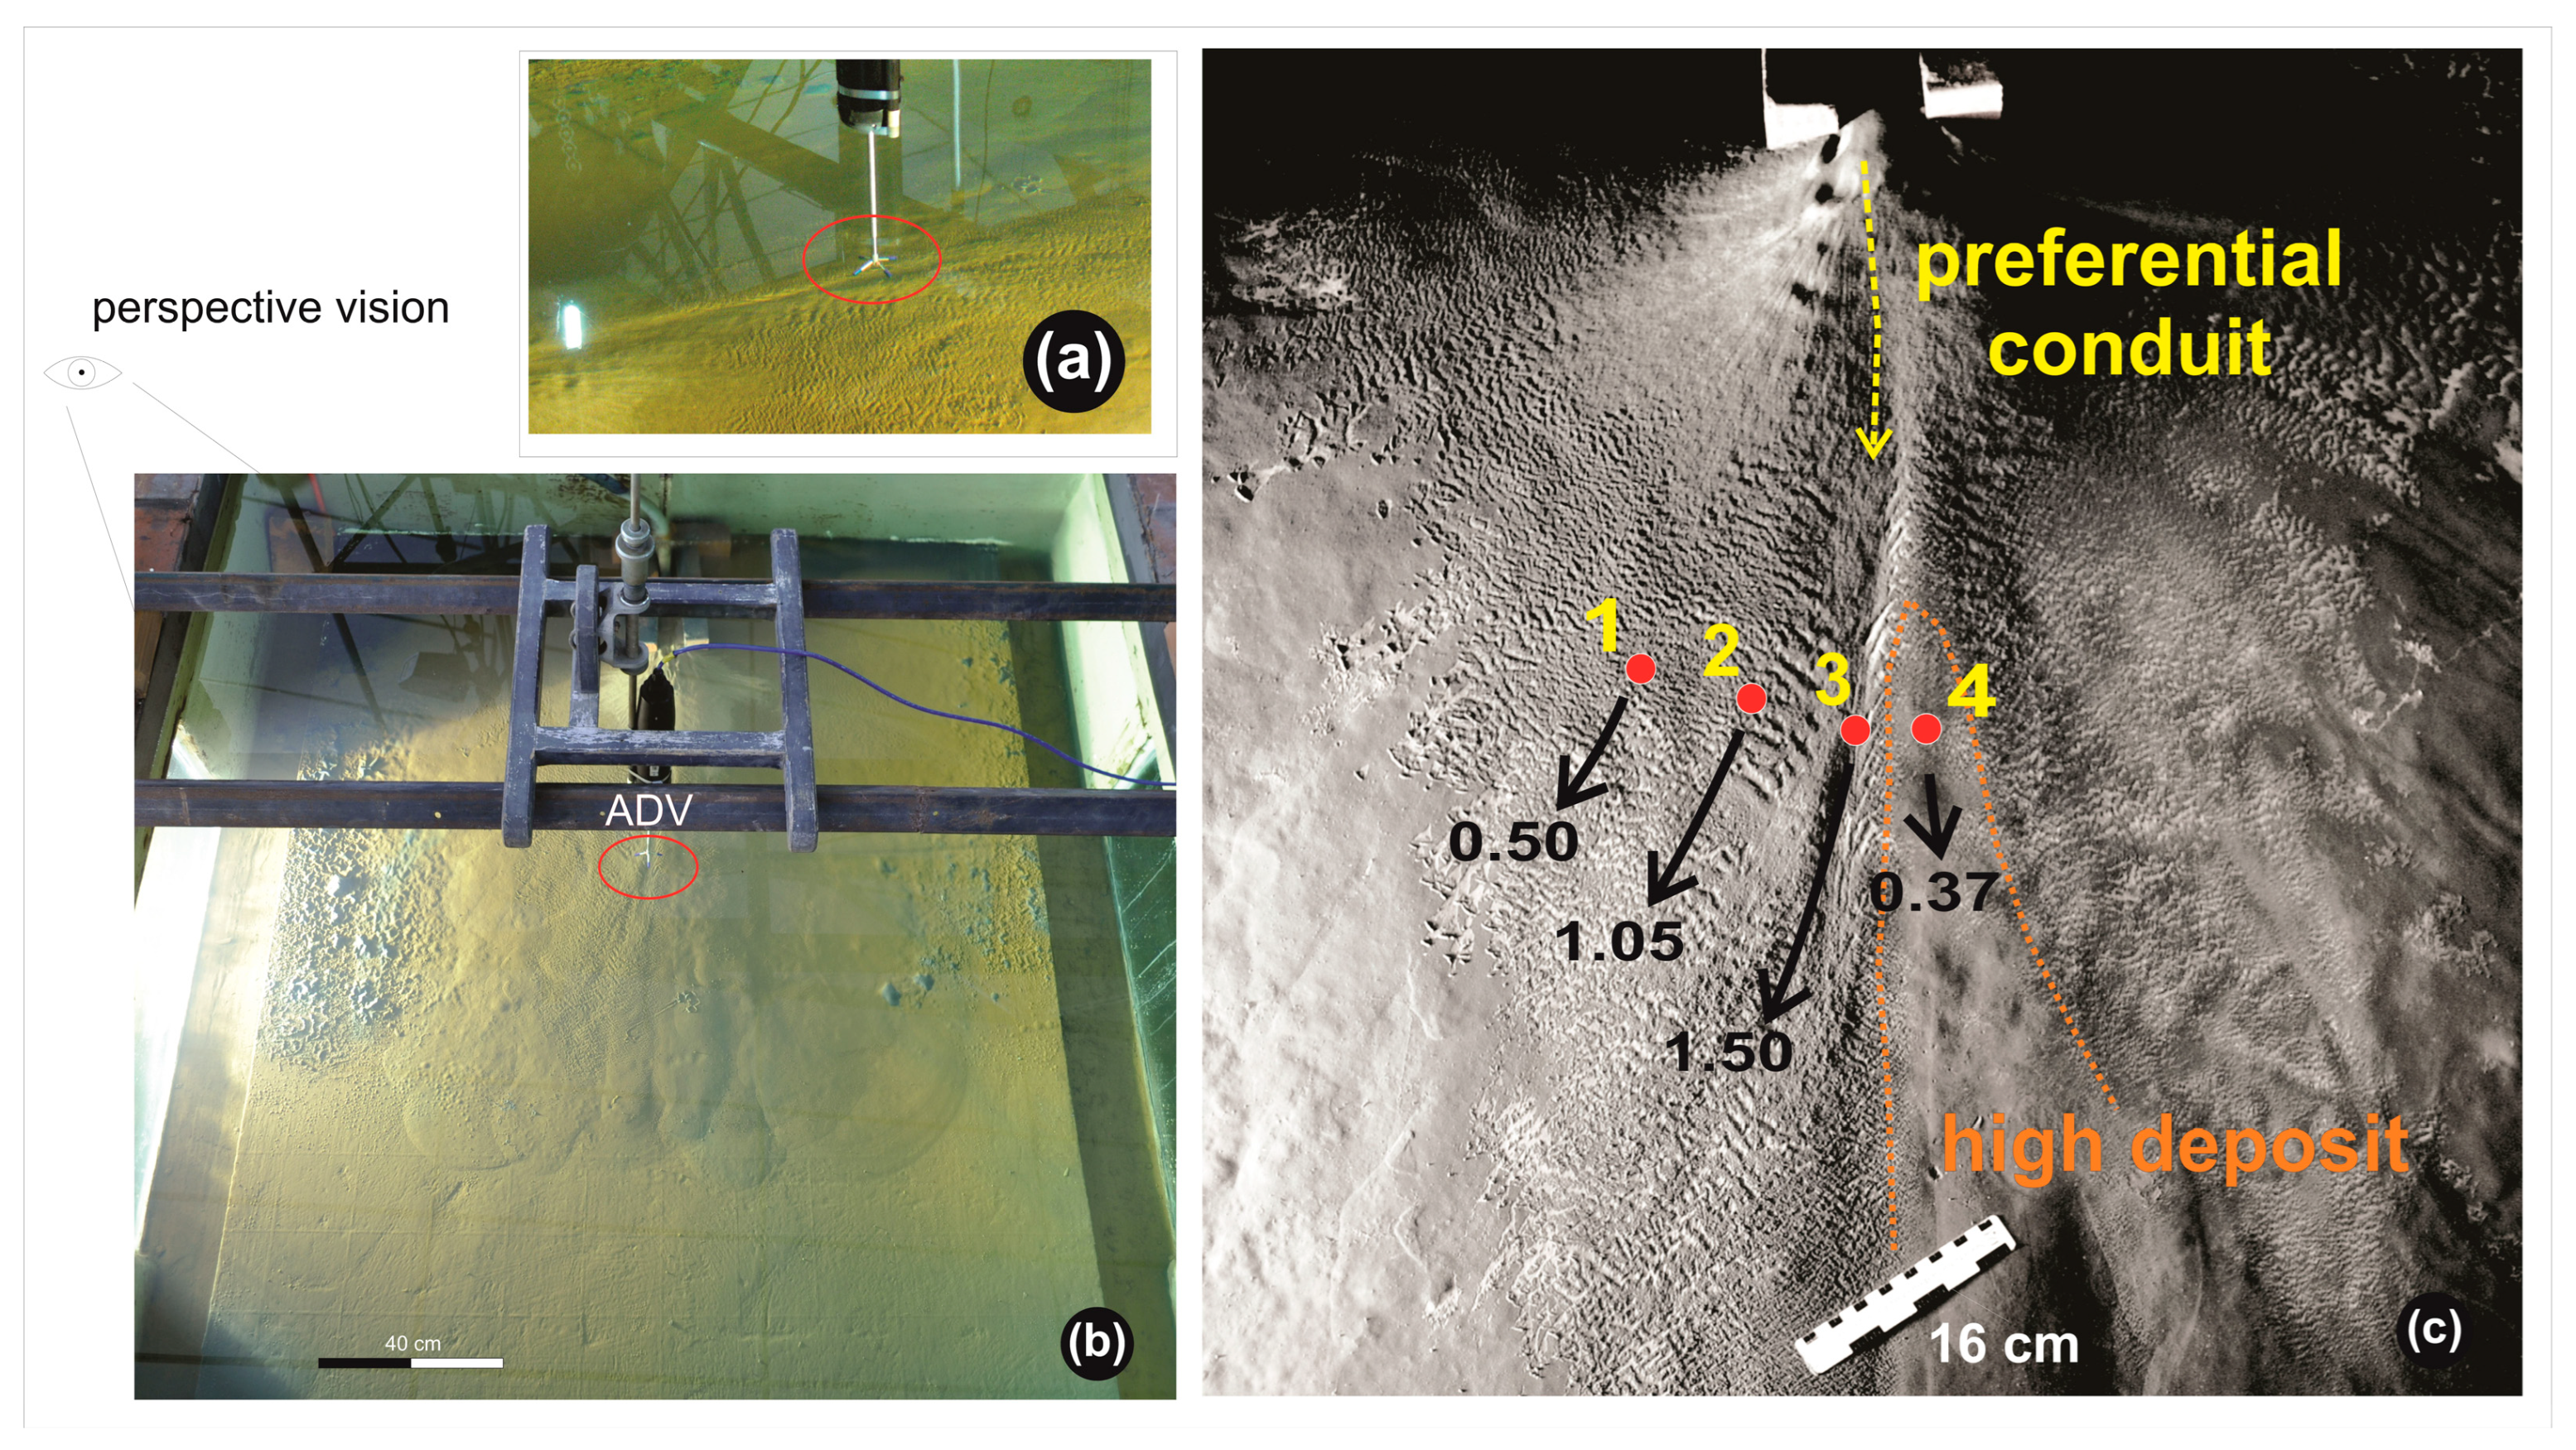
During runs E7 and E8, instantaneous velocity measurements (Figure 7) were taken using ADV at four fixed points (Figure 7c) numbered from 1 to 4 as follows: (1) away from the conduit, on the low relief; (2) next to the conduit; (3) within the thalweg of the conduit; and (4) on the high deposit. Table 3 displays the mean velocities for each measurement point and the respective times of measurements. In run E7, no measurements were taken at the high deposit, whereas in run E8, measurements were taken at the low relief (point 3) and high relief (point 4). Additionally, the experiment was recorded using two video cameras positioned for a top view (Figure 7b) and a perspective view (Figure 7a) of the tank.
According to Table 3, the comparison of velocities measured during the same run indicates a significant difference between flow velocity inside the conduit (3) and adjacent locations (1, 2, and 4). Clearly, there was channelization of the flow causing an acceleration inside the conduit.
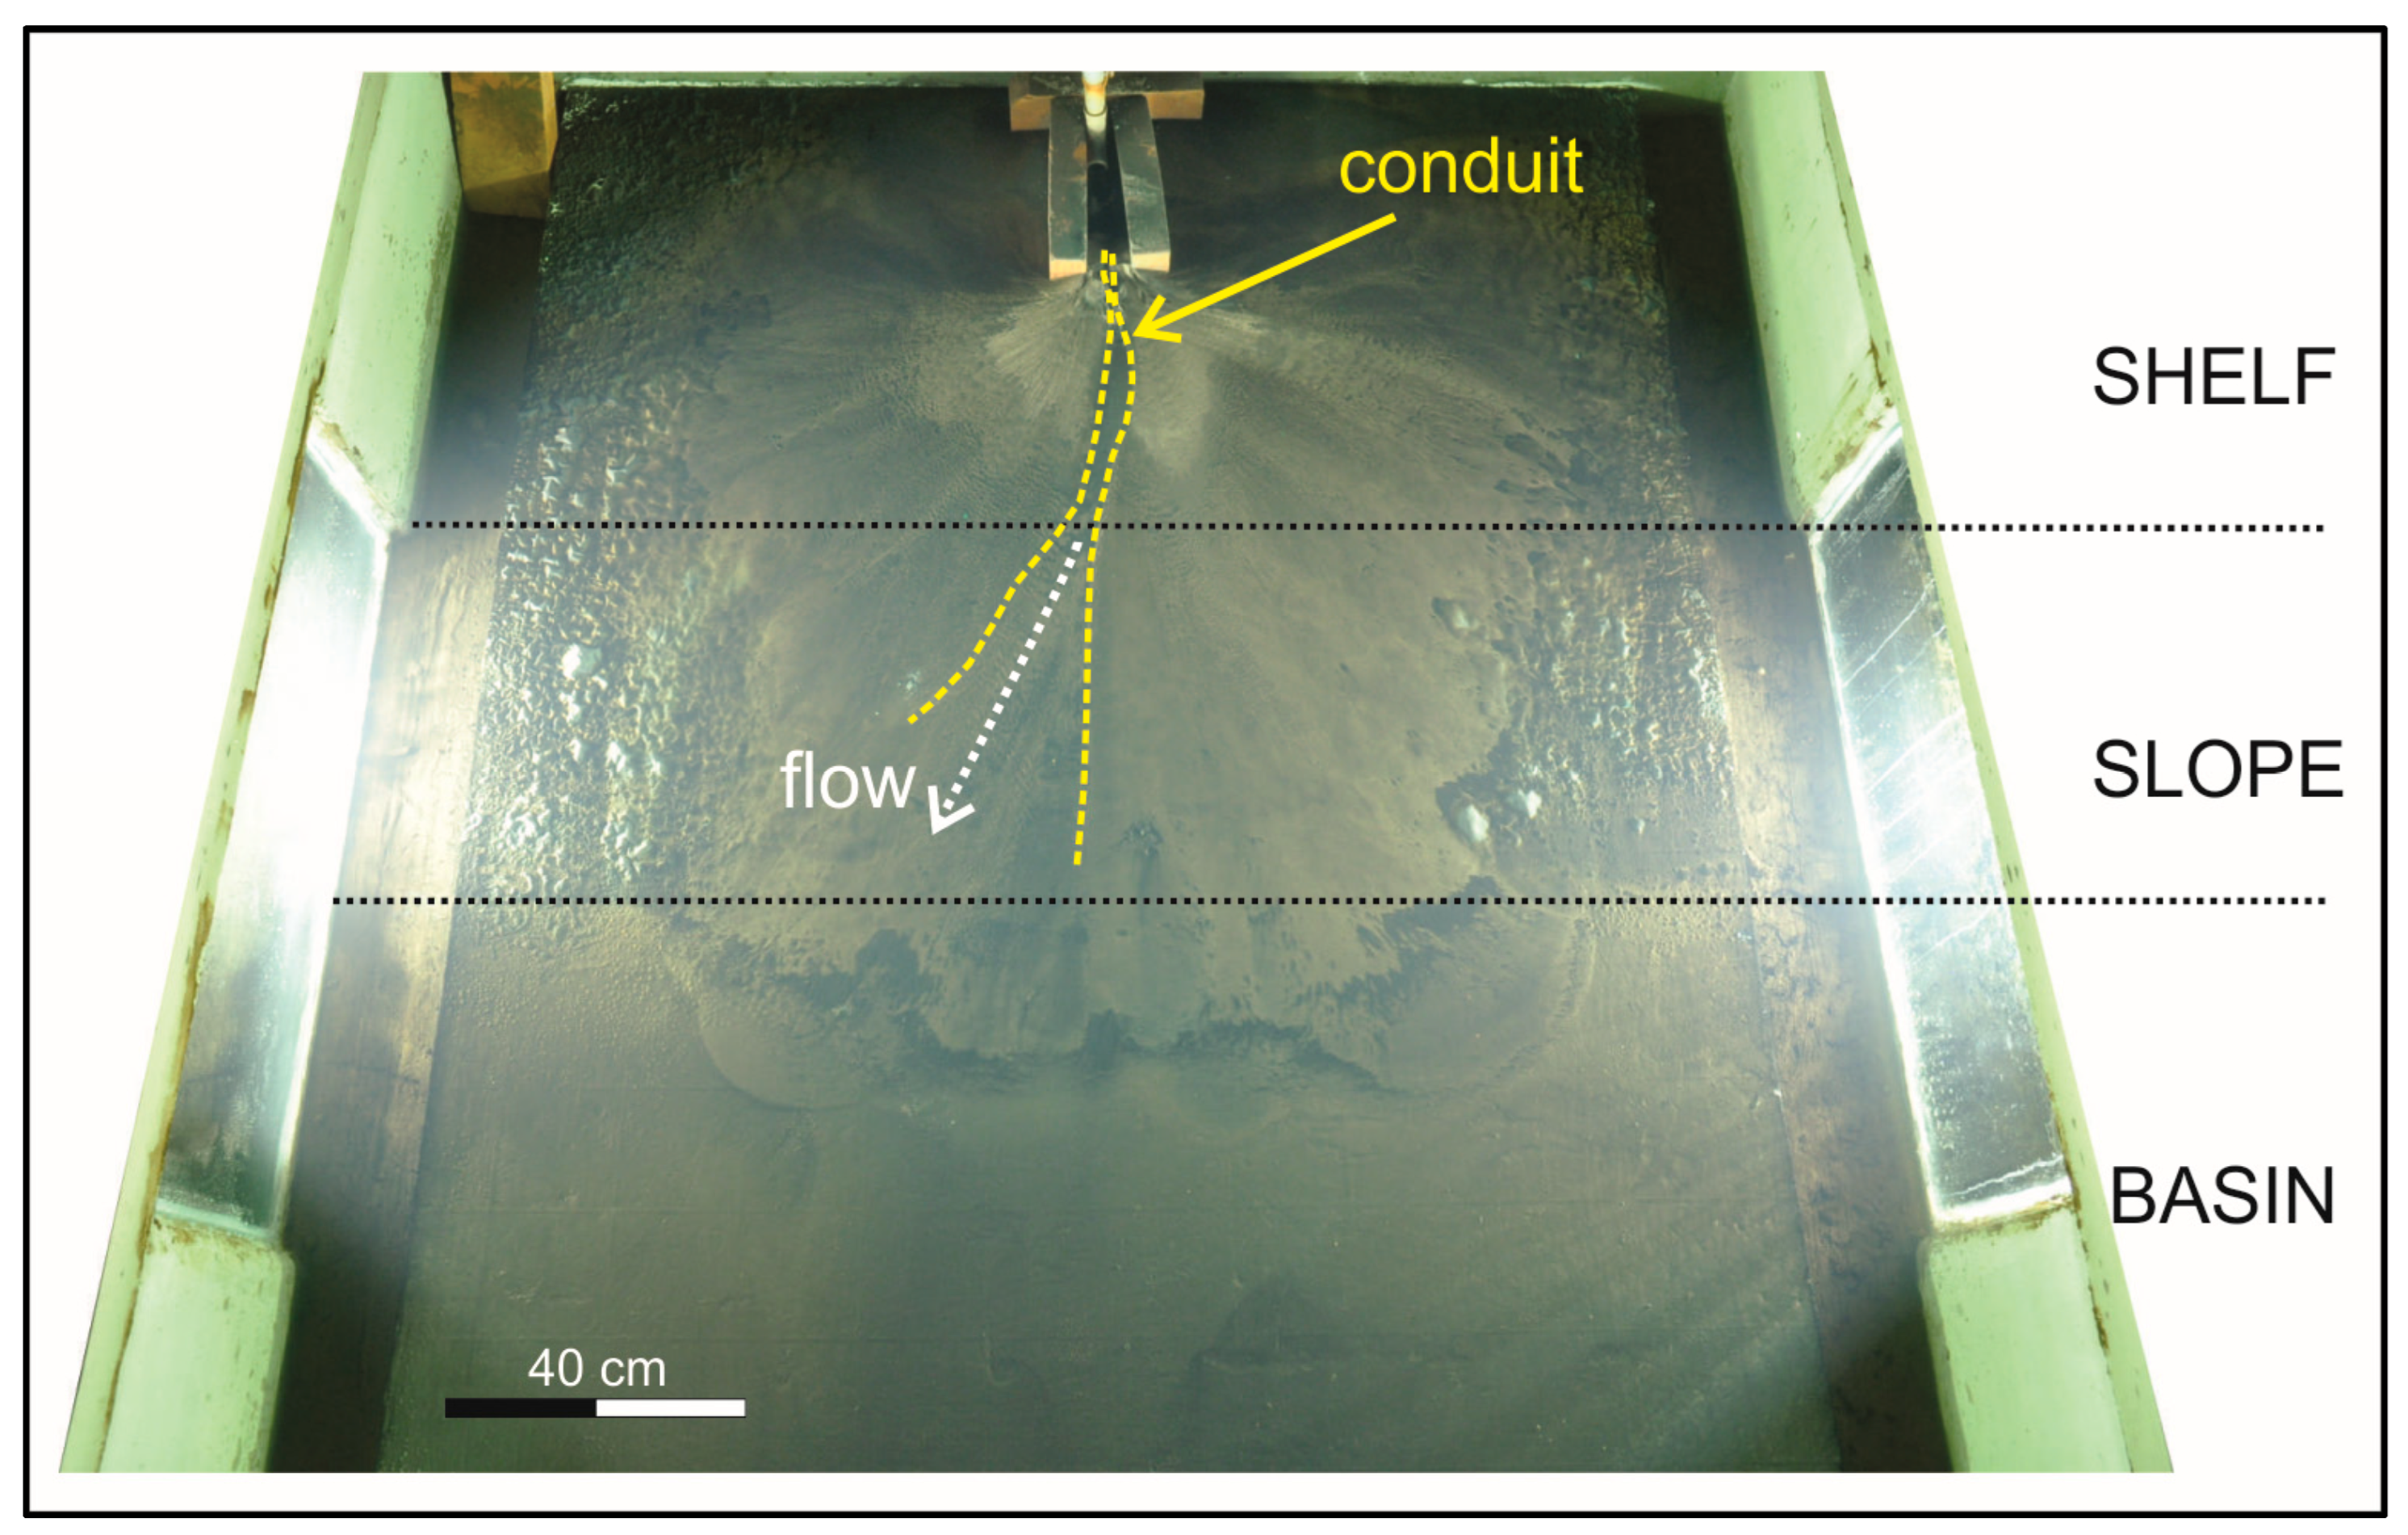
The final deposit at the end of Series II is shown in Figure 8. Approximately 2 days were allowed for the sediment to settle before the picture was taken prior to draining the tank. From Figure 8, it is possible to see that most of the sediment was deposited radially on the shelf and slope, with a small portion deposited in the basin. Dotted lines highlight the submarine conduit, confined to the region of the shelf and slope without reaching the horizontal basin.

4. Discussion

As has been pointed out before, many studies have focused on the generation of submarine conduits through erosive processes [68,70]. This can be explained by the challenge of visualizing the initial moment of conduit formation, as observed in three stages of conduit evolution during the experiments: (1) the establishment of the passage through deposition of adjacent material; (2) the erosive flow entering the passage, excavating it; and (3) the subsequent filling of the conduit. Below, we discuss the results obtained in the experiments and their significance to the processes of inception of submarine conduits through depositional mechanisms.

4.1. Construction Mechanism of the Conduit Observed

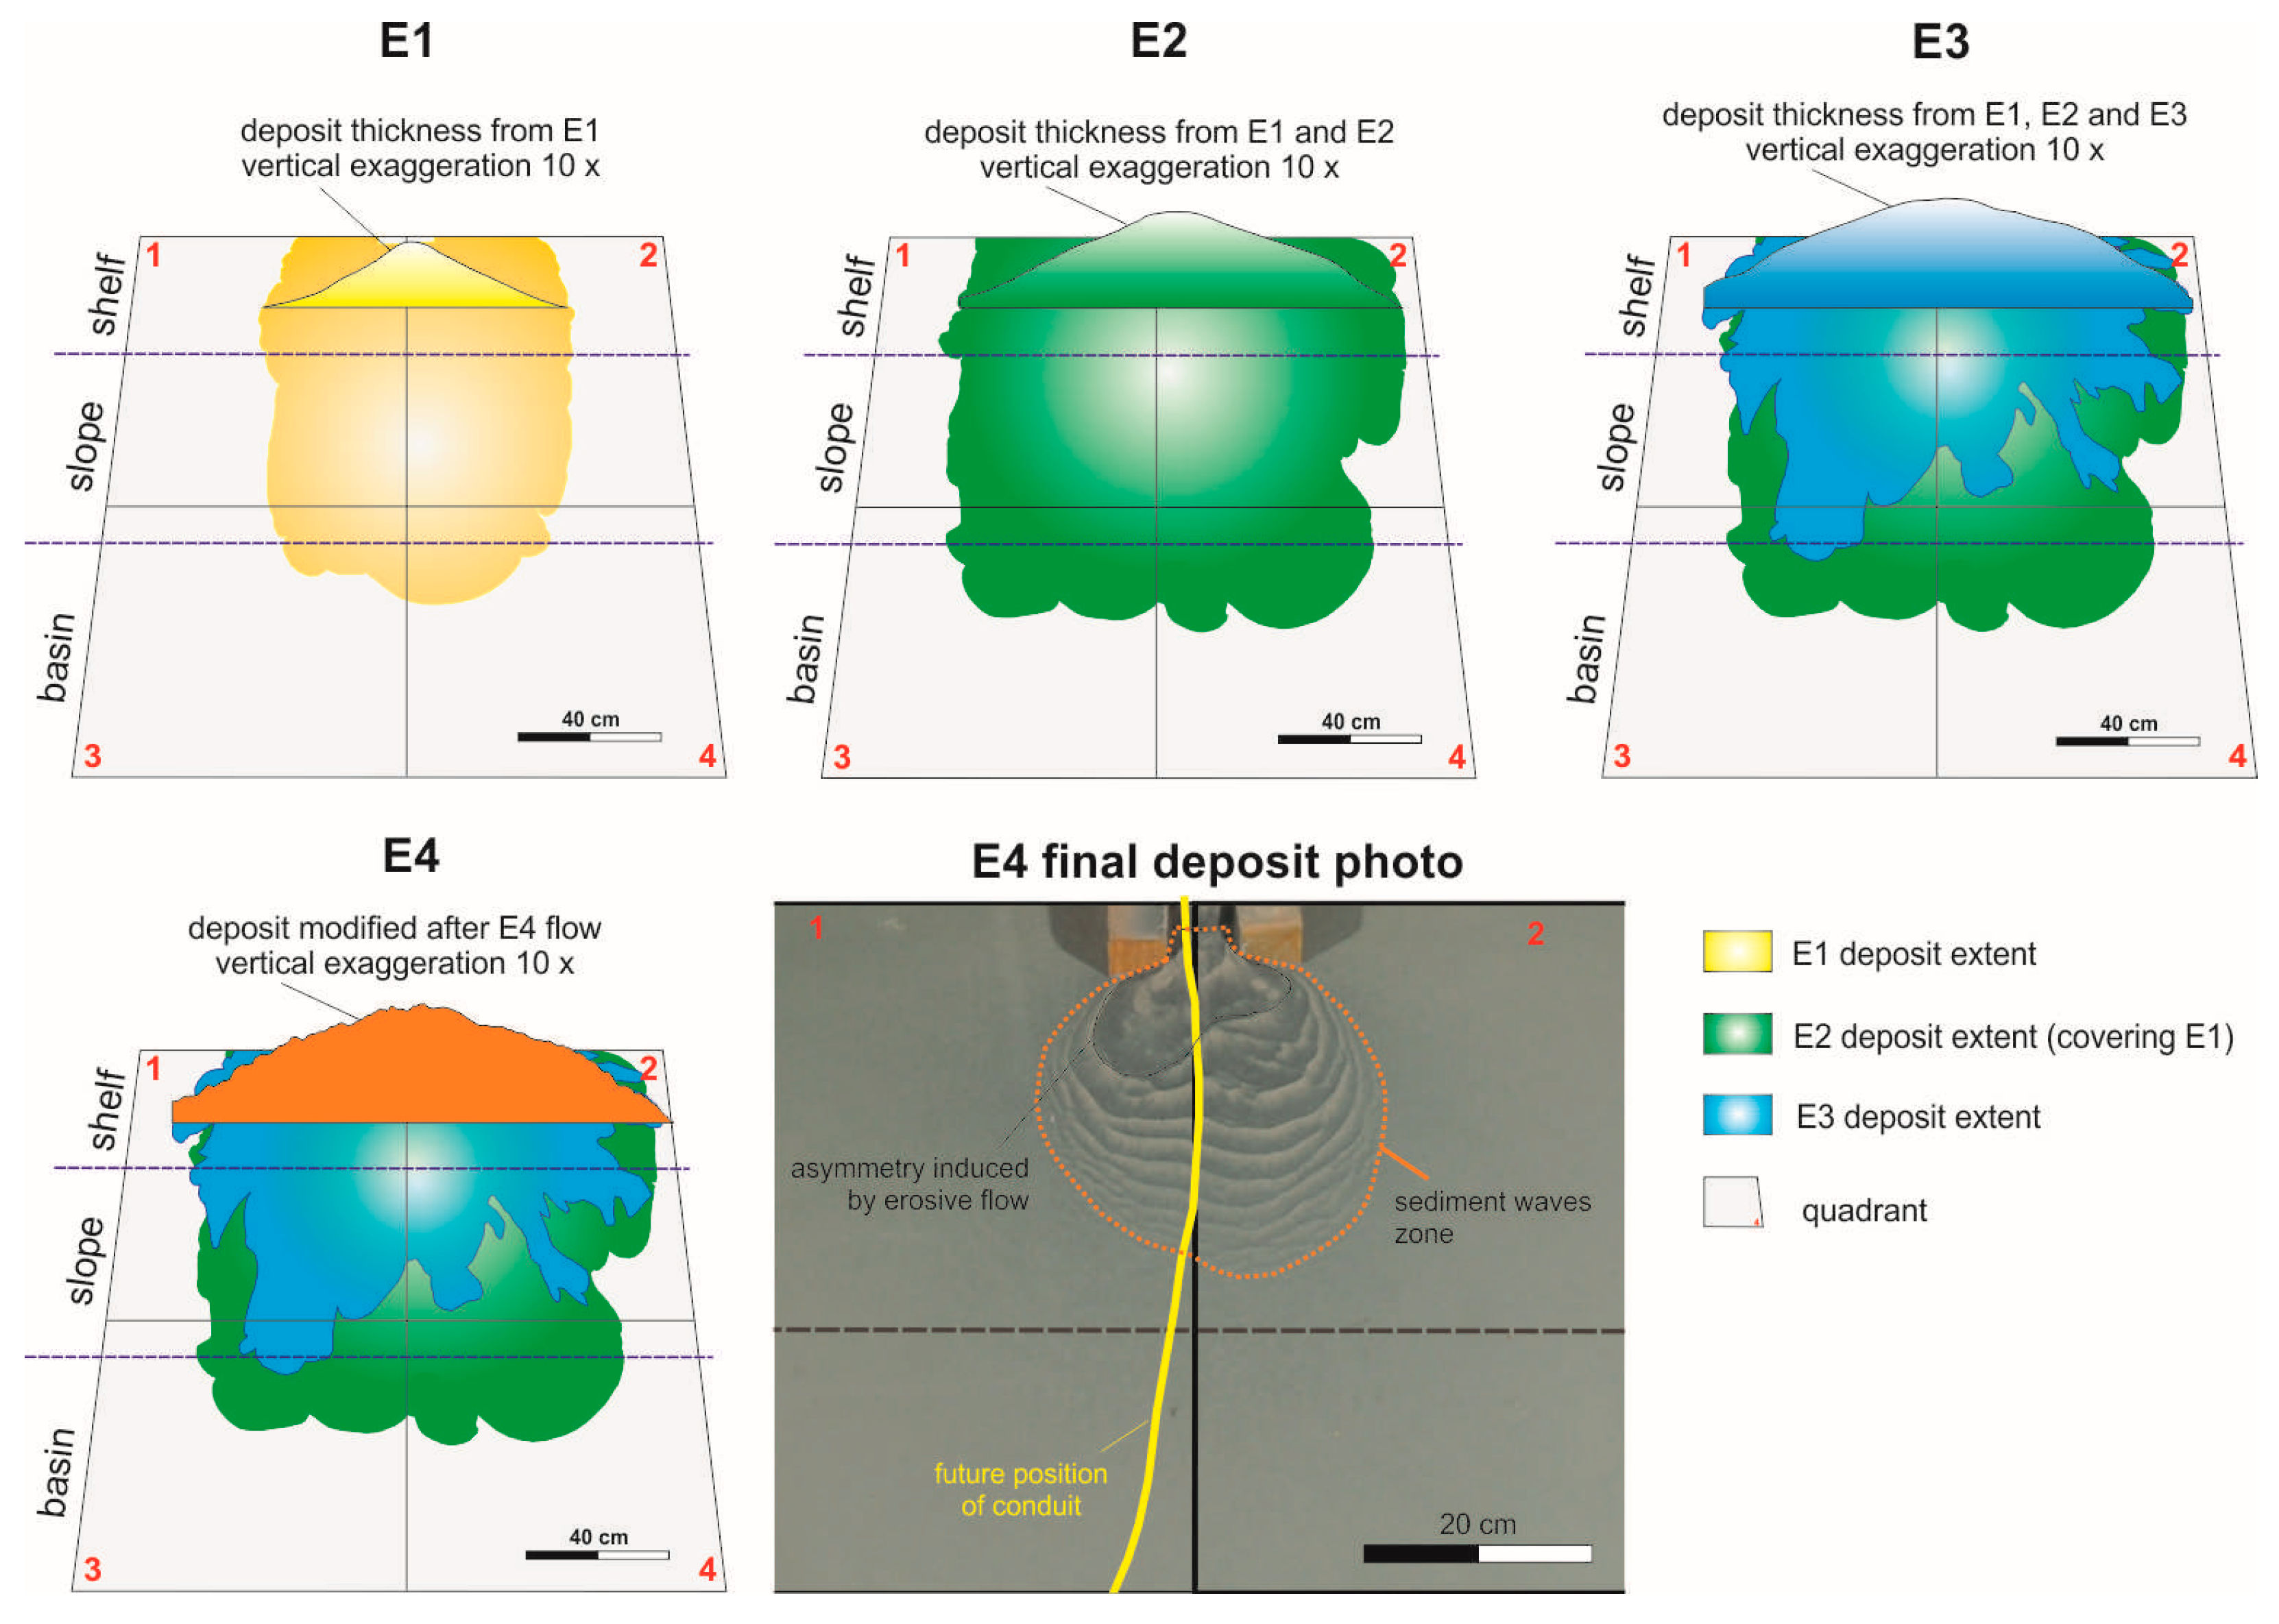
The results of the experiments revealed the inception of a constructional conduit, where erosional processes played a secondary role. To understand the creation of this submarine conduit, key aspects of the previous flow (before running E5’s conduit) are described below. Figure 9 illustrates the evolution of deposits from runs E1 to E4, along with the temporal evolution of a vertical profile of the deposit transverse to the flow in the region where the conduit originated (shelf area). It is important to note that the first three runs of Series I (particularly E1 and E2) were responsible for constructing a nearly asymmetric bed layer, predominantly located in front of the sediment source (outlet) region (shelf/slope).
During run E4, the abrupt change in flow parameters was significant (Q = 1.5–3.0 L/min; Vc = 0.8%), and no deposition was observed. Instead, the region in front of the source point was dominated by erosion, resulting in slightly asymmetric bedforms (Figure 9). According to flow visualization, there was no clear evidence of the formation of a preferential flow path by the end of run E4, indicating that this run did not initiate the conduit inception process.
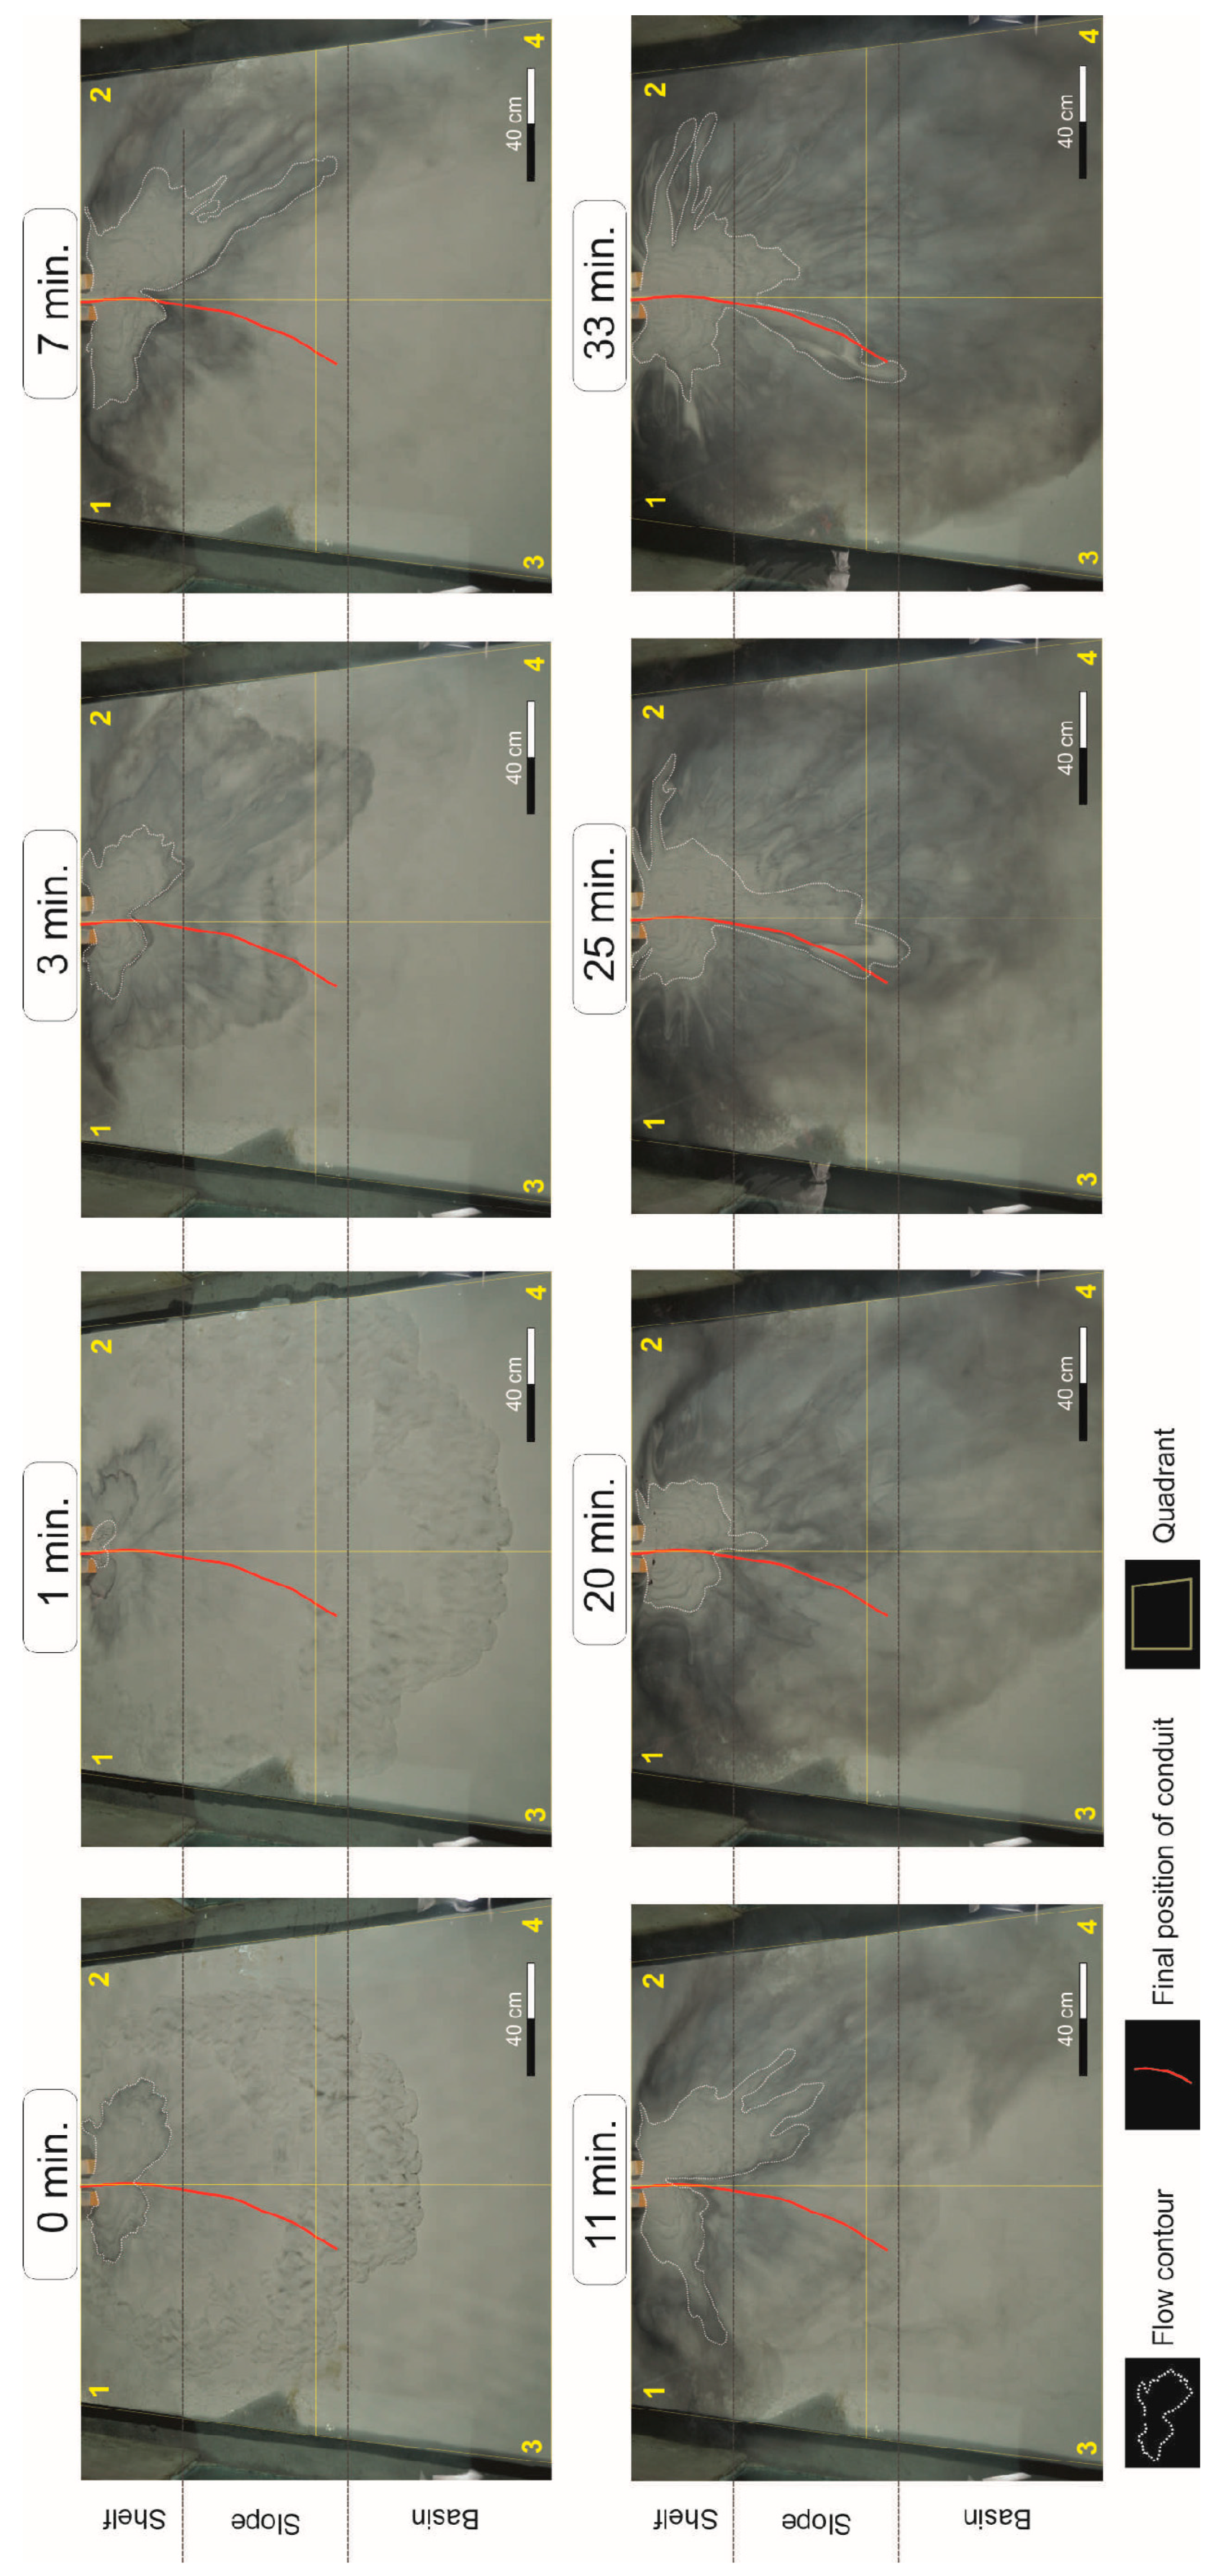
By contrast, Figure 10 depicts the flow visualization analysis of run E5 and the time evolution of flow contours and their distribution across illustrated quadrants. It can be observed that deposition during run E5 was asymmetric, primarily occurring in quadrant 2, which created a gap between quadrant 1 and 2. Unlike previous runs, the flow continued to deposit sediment in the already filled section (quadrant 2), despite available accommodation space in quadrant 1 (no lateral compensation).
In the shelf region, the simulated turbulent turbidity current spread out throughout the experiment. However, some of them formed tongue-like structures (e.g., at 7, 11, and 25 min in Figure 10) that can be associated with mass flows. These morphologies could be responsible for the curve-like shape of the conduit formed. Additionally, from bathymetric data of the deposit, we can infer an asymmetric levee deposit mainly constructed by turbidity currents. In natural environments, this feature typically forms due to tectonic activity (such as salt tectonics), faults, mass flow deposits, and other factors. Ref. [97] analyzed deposit asymmetry in an outcrop in the Isaac Formation (Canada), which enhanced the confinement of the submarine channel through levee aggradation localized at the channel’s edge. The authors suggest processes similar to the simulated results from this study.
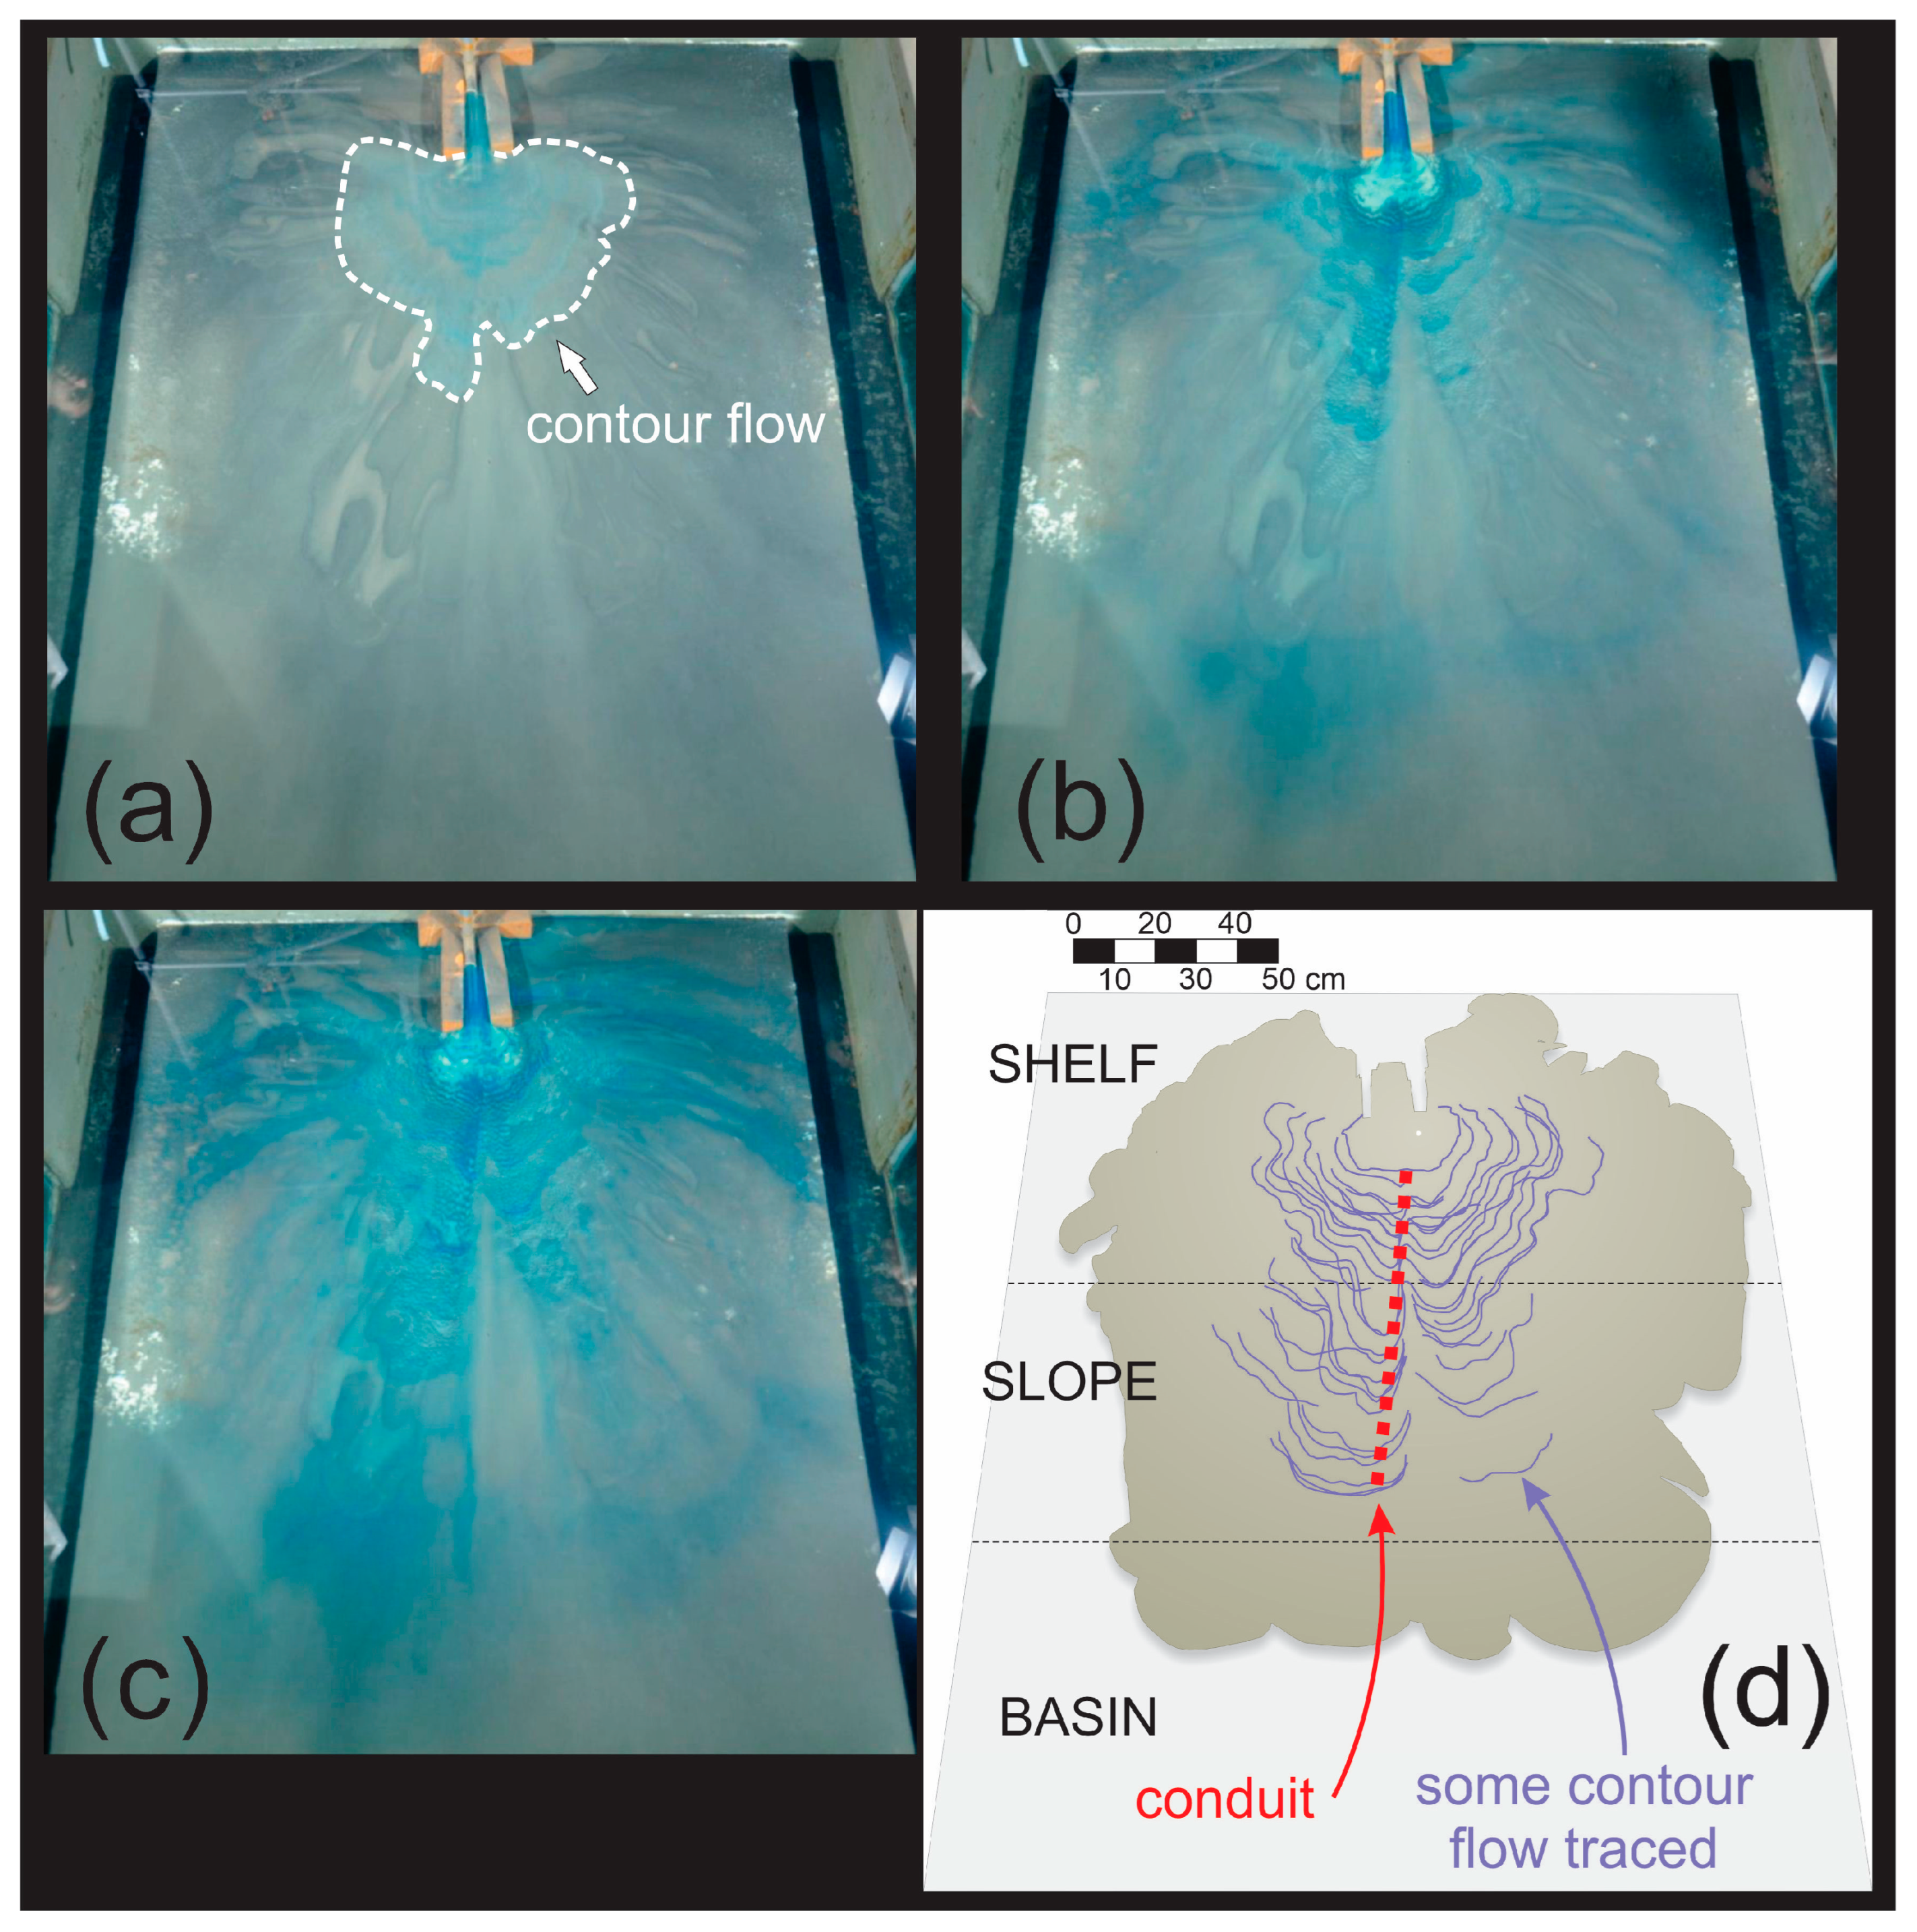
All subsequent saline flows (runs E6 to E8 of Series II) exhibited behavior similar to run E5, where the majority of the injected current flowed through the formed conduit. This aspect is highlighted in Figure 11a–c, which show the time evolution of the dyed saline flow. Additionally, flow evolution was tracked through video analysis (Figure 11d), and contour lines of flow evolution indicate a significant correlation with the formed conduit.

4.2. Scale Effect (Similarity Analysis)

The transference of natural environment information to physical models are a challenge. Manipulations are performed to assist in the interpretation of scales as the usage of coal (allows grains in scale) and exaggeration in slope (process visualization), for example.
According to dimensional analysis studies on turbidity currents [96,98], the model scaling should prioritize the equivalence of the Froude number (Fr) while also considering the Reynolds number (Re). However, the flows must remain in the turbulent regime (Re > 2000).
In the case of the simulations performed, the equivalence of the Froude number can be verified according to the following scales:
  • Velocity (V): It is estimated that the velocity in the model ranged between 0.05 and 0.10 m/s, with an average value of 0.08 m/s. In the prototype (natural environment), these velocities reach average values of 2.50 m/s [99];
  • Density of the mixture (ρ): Considering a mixture with a sediment concentration of 10% by volume, the density of the mixtures in the model ranges around 1028–1057 kg/m3. In the prototype, considering quartz, the density is around 1175 kg/m3;
  • Current thickness (H): In nature, the most common flows have a current height of about 2.50 m, whereas in the model, a representative value of 0.05 m can be considered.
Considering the listed scales, we can equate (Equation (1)) the Froude number scale as follows:
F r P F r M = V ˜ g ˜ ( Δ ρ ρ ) ˜ H ˜ 30 10 3 40 F r P F r M = 0.86
where F r = V g ( Δ ρ ρ ) H ,   g is acceleration of gravity, and the symbol ~ denotes the ratio between the scale of the quantity in the prototype and in the model.
On the other hand, the estimated Reynolds number of the flows corresponds (Equation (2)) to the value of
R e = V H ν 0.08 0.05 0.000001 4000
where ν is the kinematic viscosity of the mixture.
Therefore, the simulated flows remain within the turbulent regime. Thus, it is evident that the flows in the model exhibit significant similarity to natural flows, and the results can be analyzed according to the theory of physical model similarity.
Additionally, the grain size finds its equivalence according to the parameter resulting (Equation (3)) from dimensional analysis, highlighted by [96], given by the ratio between the particle settling velocity ( w s ) and the flow velocity ( V ). Thus, the following can be obtained:
( w s V ) P = ( w s V ) M
Therefore,
( w s ) P = V P V M ( w s   ) M
So,
( w s ) P = 30 ( w s   ) M
Thus, we can find the equivalent particle diameter in the prototype using analytical laws, such as [100] Rubey’s Law. Accordingly, sand fractions (62–2000 μm) in the prototype correspond to grains ranging from 12 to 75 μm for kaolin, while for coal, the correspondence lies within the range of 12–125 μm.

4.3. Conduit Inception Model

In the laboratory, we can simplify the problem and isolate certain effects for evaluation. However, uncertainties are inherent in models. In this case, simulating the entire system (subaerial settings, shelf, slope, and basin) encompasses a range of scales, including geological time. Our intention here is to observe a specific scale and extrapolate to the natural world using similarity theory. To achieve this, we employ techniques such as using coal (which allows us to scale down grains without cohesive effects) and replicating basin settings in scaled forms.
In natural environments, various types of submarine conduits (e.g., gullies, canyons, submarine channels, and troughs) can form. However, this study does not specifically focus on investigating the formation of each specific type of submarine conduit. Instead, it aims to discuss the initial processes involved in the formation of these submarine morphologies from a broader perspective.
Traditionally, certain submarine topographic features such as submarine channels and gullies are thought to form primarily through erosional processes. However, this study demonstrates that these features can also originate in predominantly depositional environments. Similarly, other studies have also suggested this alternative for the formation of submarine canyons [50] and gullies [87]. In contrast, Ref. [97] proposes a model (Figure 12a) based on an analogous outcrop, where the initial path is created by rough bed layers of debris that help confine the flow during the early stages of conduit formation.
Ref. [101] defines a submarine channel as a structure that serves as a long-term conduit for the downslope transport of sediment. According to this definition, it is reasonable to exclude comparisons with furrows and grooves, as both are considered types of bedforms [102] rather than proper conduits.
Ref. [95] presents a study from the Tiber delta (Tyrrhenian Sea, Italy), describing features similar to gullies observed in our experiment, including (1) a location on a shelf edge and upper slope; (2) slightly curvilinear features that tend towards straightness; and (3) little or no evidence of erosive processes. These findings suggest that the results presented here could represent an inception process for a gully in a depositional environment, generated by deposit asymmetry.
Many authors have identified gullies as common structures observed along submarine slopes on numerous continental margins [66,87,91,103]. Ref. [104] defines submarine gullies as “all downslope-trending submarine channels on a smaller scale.” Similarly, Ref. [105] describes them as “linear marine sedimentary conduits.” However, there is a general consensus that distinguishing gullies from channels or submarine canyons is often challenging [87,91].
Regarding the inception of submarine conduit morphologies in nature (Figure 13), a wide range of processes has been considered, including mass wasting/slumping, turbidity current scour, hyperpycnal flow down delta slopes, sea level oscillations, fluid sapping, wind-induced rip currents, and internal waves [68,86,95,101,106,107,108,109,110,111].
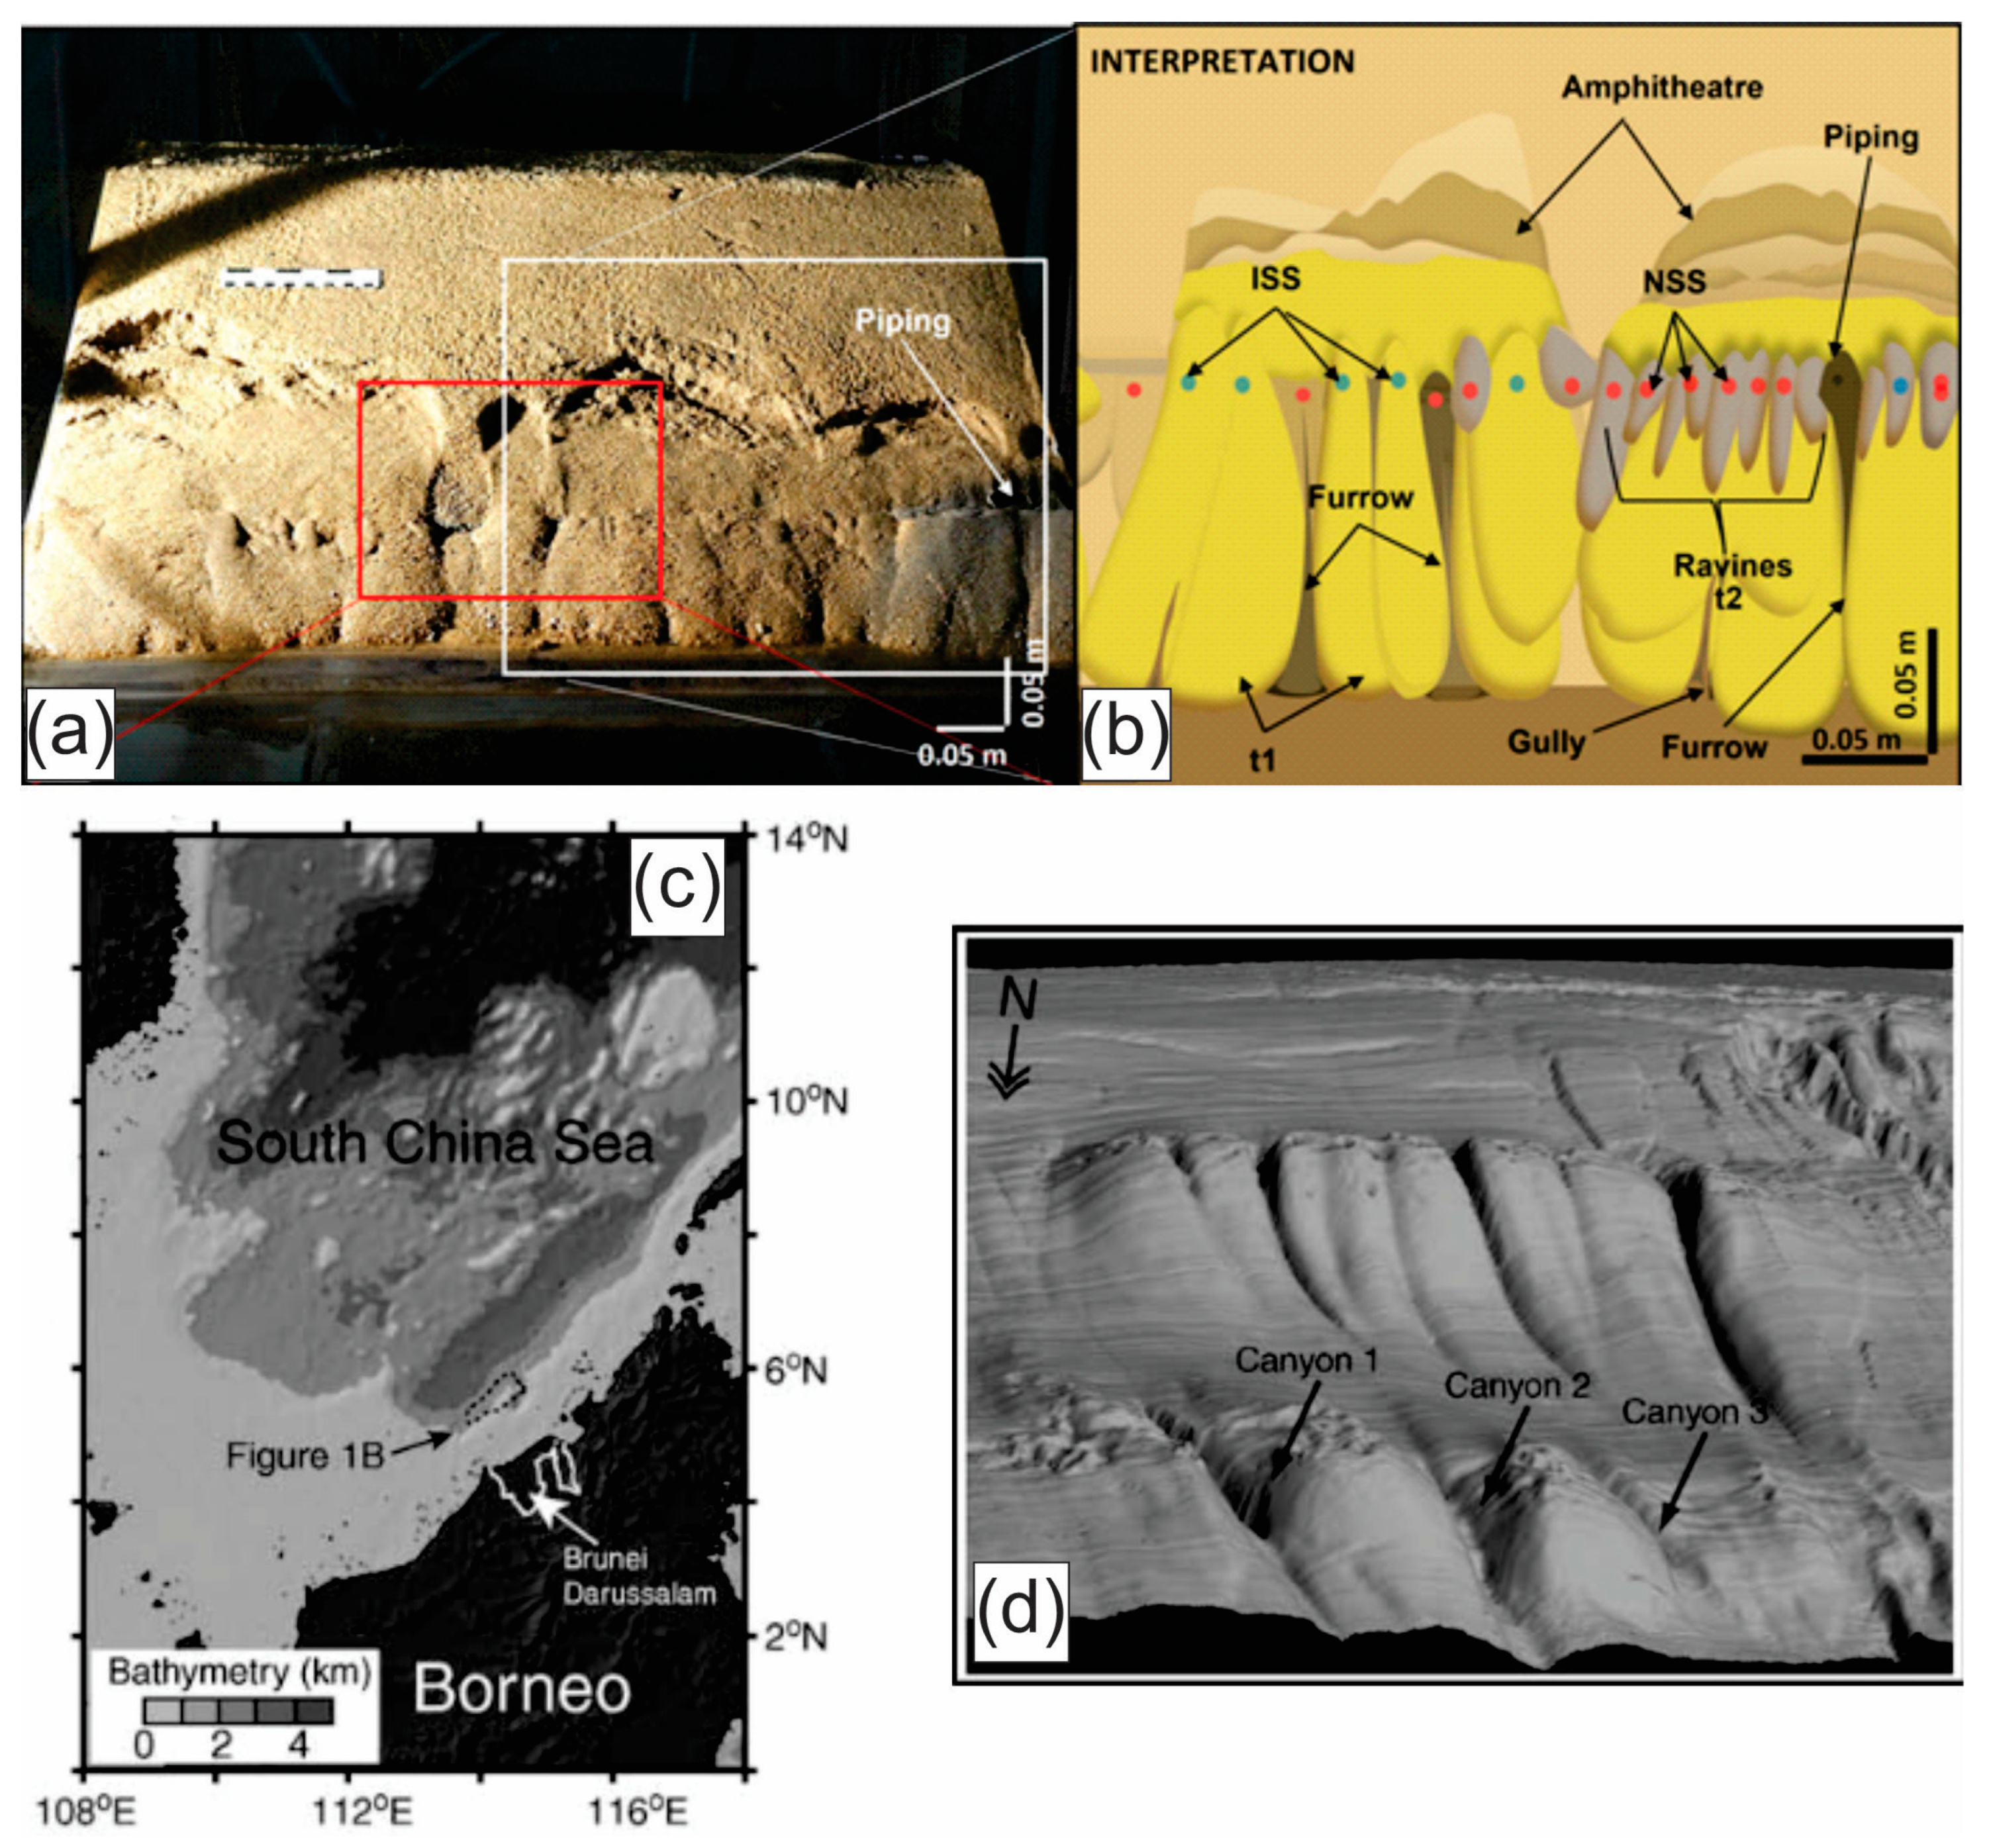
Ref. [50] states that the generation of submarine canyons in the Brunei Darussalam formation was attributed to flow characteristics that prevented deposition in the thalweg. In this scenario, natural confinement of the flow and high velocities within the central part of the conduit facilitated sediment entrainment into the flow rather than deposition. Nevertheless, sediments were deposited outside the conduit, along the margins and lateral sides. The experiments conducted in this study support this model, as the conduit inception occurred without sediment choking within the flow.
This experiment-based inception model is illustrated at Figure 14, where unconfined turbulent flow with low erosive capacity is able to aggrade the central part of its body (Figure 14a,b). This topographic feature influences the flow, and sediment deposition occurs laterally where there is an abundance of accommodation space (lateral compensation).
The Figure 14c illustrates the formation of a high plateau on one side (left side of the flow), where the flow was diverted. Importantly, concurrent mass wasting/slump deposits from the high slope in the distal portion of the system (slope) exert influence on the conduit length similar to turbulent flow, creating a topographic high. This asymmetry in the deposit allows a portion of the flow to remain confined (Figure 14d), with minimal to no deposition in this region, aligning with the concept described by [50]. The model described above demonstrates progression towards an erosive phase in the thalweg, potentially evolving into well-known features such as gullies and canyons. However, further experiments are needed, including variations in flow properties and sediment injection conditions, to validate these findings.

5. Conclusions

The primary contribution of this research is the development of a model elucidating the inception mechanism of submarine conduits, primarily driven by depositional processes with minimal sediment transport within the conduit. The density current succession generated a small valley where saline flows concentrated.
The bottom features suggest potential evolution towards an erosive state, influenced by changes in internal flow properties. Topographic features play a crucial role in directing the flow, thereby forming the conduit.
The experimental results enhance our understanding of submarine conduit formation, even before these conduits become pathways for sediment transport. This suggests that channels previously interpreted as erosive might have been formed without erosive conditions.
The data obtained are significant for interpreting natural deposits in deep marine environments, particularly in identifying submarine conduit morphologies. Furthermore, they provide insights into unusual submarine features that contribute to sediment transfer to basins. This is particularly relevant to the petroleum industry, especially regarding coarse sediments and the characterization of sediment flow paths related to turbidite reservoirs.
In conclusion, physical modeling proves to be a valuable tool for such studies, allowing the replication and control of natural processes at a small scale.

Author Contributions

Conceptualization, D.B.d.S. and E.P.; Methodology, D.B.d.S. and E.P.; Formal analysis, R.M.; Resources, A.R.V.; Writing—original draft, D.B.d.S.; Writing—review & editing, D.B.d.S., E.P. and R.M.; Supervision, R.M. and A.L.d.O.B.; Project administration, R.M. and A.R.V. All authors have read and agreed to the published version of the manuscript.

Funding

This research was funded by Petróleo Brasileiro (PETROBRAS) by grant number 4600313480.

Institutional Review Board Statement

Not applicable.

Informed Consent Statement

Not applicable.

Data Availability Statement

Data are contained within the article.

Acknowledgments

We thank all at NECOD group for their assistance with experimental work. Special thanks to Willow Zhang and the anonymous reviewers for their valuable comments that significantly improved the manuscript.

Conflicts of Interest

Adriano Roessler Viana was employed by Petróleo Brasileiro S.A. The authors declare that the research was conducted in the absence of any commercial or financial relationships that could be construed as a potential conflict of interest.

References

  1. Dana, J.D. A Manual of Geology, 4th ed.; Theodore Bliss & Co.: Philadelphia, PA, USA, 1863; p. 798. [Google Scholar]
  2. Kuenen, P.H.; Migliorini, C.I. Turbidity currents as a case of graded bedding. J. Geol. 1950, 58, 91–127. [Google Scholar] [CrossRef]
  3. Menard, H.W. Deep-sea channels, topography, and sedimentation. AAPG Bull. 1955, 39, 236–255. [Google Scholar]
  4. Shepard, F.P.; Dill, R.F. Submarine Canyons and Other Sea Valleys, 1st ed.; Rand McNally & Co.: Chicago, IL, USA, 1966; p. 381. [Google Scholar]
  5. Shepard, F.P. Submarine Geology, 3rd ed.; Harper & Row Publishers: New York, NY, USA, 1973; p. 517. [Google Scholar]
  6. Bagnold, R.A. Mechanics of marine sedimentation. In The Sea; Hill, M.N., Ed.; Wiley: New York, NY, USA, 1976; pp. 507–528. [Google Scholar]
  7. Shepard, F.P. Transportation of sand into deep water. SEPM Spec. Publ. 1951, 2, 53–65. [Google Scholar]
  8. Ericson, D.B.; Ewing, M.; Heezen, B.C. Turbidity Currents and Sediments in the North Atlantic. AAPG Bull. 1952, 36, 489–511. [Google Scholar]
  9. Kuenen, P.H. Properties of turbidity currents of high density. SEPM Spec. Publ. 1951, 2, 14–33. [Google Scholar]
  10. Heezen, B.C.; Ewing, M. Turbidity currents and submarine slumps, and the 1929 Grand Banks earthquake. Am. J. Sci. 1952, 250, 849–873. [Google Scholar] [CrossRef]
  11. Lowe, D.R. Sediment gravity flows. 2. Depositional models with special reference to high density turbidity currents. J. Sed. Petrol. 1982, 52, 279–298. [Google Scholar]
  12. Mulder, T.; Syvitski, J.P.M. Turbidity Currents Generated at River Mouths during Exceptional Discharges to the World Oceans. J. Geol. 1995, 103, 285–299. [Google Scholar] [CrossRef]
  13. Mulder, T.; Alexander, A. The physical character of subaqueous sedimentary density flows and their deposits. Sedimentology 2001, 48, 269–299. [Google Scholar] [CrossRef]
  14. Piper, D.J.W.; Normark, W.R. Processes That Initiate Turbidity Currents and Their Influence on Turbidites: A Marine Geology Perspective. J. Sediment. Res. 2009, 79, 347–362. [Google Scholar] [CrossRef]
  15. Meiburg, E.; Kneller, B. Turbidity Currents and Their Deposits. Annu. Rev. Fluid Mech. 2010, 42, 135–156. [Google Scholar] [CrossRef]
  16. Stevenson, C.J.; Talling, P.J.; Wynn, R.B.; Masson, D.G.; Hunt, J.E.; Frenz, M.; Akhmetzhanhov, A.; Cronin, B.T. The flows that left no trace: Very large-volume turbidity currents that bypassed sediment through submarine channels without eroding the sea floor. Mar. Pet. Geol. 2013, 41, 186–205. [Google Scholar] [CrossRef]
  17. Bagnold, R.A. The flow of cohesionless grains in fluids. Philos. Trans. R. Soc. Lond. Ser. A Math. Phys. Sci. 1956, 249, 235–297. [Google Scholar] [CrossRef]
  18. Simpson, J.E. Gravity currents in the laboratory, atmosphere, and ocean. Ann. Rev. Fluid Mech. 1982, 14, 213–234. [Google Scholar] [CrossRef]
  19. Middleton, G.V.; Hampton, M.A. Sediment gravity flows: Mechanics of flow and deposition. In Turbidites and Deep-Water Sedimentation; Middleton, G.V., Bouma, A.H., Eds.; SEPM Pacific Section Short Course: Anaheim, CA, USA, 1973; pp. 1–38. [Google Scholar]
  20. Mutti, E.; Normark, W.R. Comparing examples of modern and ancient turbidite systems: Problems and concepts. In Marine Clastic Sedimentology: Concepts and Case Studies; Leggett, J.R., Zuffa, G.G., Eds.; Graham and Trotman: London, UK, 1987; pp. 1–37. [Google Scholar]
  21. Kneller, B.; Buckee, C. The structure and fluid mechanics of turbidity currents: A review of some recent studies and their geological implications. Sedimentology 2000, 47, 62–94. [Google Scholar] [CrossRef]
  22. Heerema, C.J.; Talling, P.J.; Cartigny, M.J.; Paull, C.K.; Bailey, L.; Simmons, S.M.; Parsons, D.R.; Clare, M.A.; Gwiazda, R.; Lundsten, E.; et al. What determines the downstream evolution of turbidity currents? Earth Planet. Sci. Lett. 2020, 532, 116023. [Google Scholar] [CrossRef]
  23. Bailey, L.P.; Clare, M.A.; Rosenberger, K.J.; Cartigny, M.J.B.; Talling, P.J.; Paull, C.K.; Gwiazda, R.; Parsons, D.R.; Simmons, S.M.; Xu, J.; et al. Preconditioning by sediment accumulation can produce powerful turbidity currents without major external triggers. Earth Planet. Sci. Lett. 2021, 562, 116845. [Google Scholar] [CrossRef]
  24. Wells, M.G.; Dorrel, R.M. Turbulence processes within turbidity currents. Annu. Rev. Fluid Mech. 2021, 53, 59–83. [Google Scholar] [CrossRef]
  25. Henry, P.; Özeren, M.S.; Yakupoglu, N.; Çakir, Z.; De Saint-Léger, E.; Desprez De Gésincourt, O.; Tengberg, A.; Chevalier, C.; Papoutsellis, C.; Postacloglu, N.; et al. Mass flows, turbidity currents and other hydrodynamic consequences of small and moderate earthquakes in the Sea of Marmara. Nat. Hazards Earth Syst. Sci. 2022, 22, 3939–3956. [Google Scholar] [CrossRef]
  26. Pope, E.L.; B Cartigny, M.J.; Clare, M.A.; Talling, P.J.; Gwyn Lintern, D.; Vellinga, A.; Hage, S.; Açikalin, S.; Bailey, L.; Chapplow, N.; et al. First source-to-sink monitoring shows dense head controls sediment flux and runout in turbidity currents. Sci. Adv. 2022, 8, eabj3220. [Google Scholar] [CrossRef] [PubMed]
  27. Viana, A.R.; Almeida, W., Jr.; Almeida, C.W. Upper slope sands: Late Quaternary shallow-water sandy contourites of Campos Basin, SW Atlantic Margin. In Deep-Water Contourite Systems: Modern Drifts and Ancient Series, Seismic and Sedimentary Characteristics; Stow, D.A.V., Pudsey, C.J., Howe, J.A., Faugères, J.-C., Viana, A.R., Eds.; Geological Society, London, Memoirs: London, UK, 2002; Volume 22, pp. 261–270. [Google Scholar]
  28. Mcgregor, B.A. The Submerged Continental Margin: Increasingly sophisticated technology has produced detailed images of the continental margin, giving a fuller picture of geologic processes under the sea. Am. Sci. 1984, 72, 275–281. [Google Scholar]
  29. Daly, R.A. Origin of submarine canyons. Am. J. Sci. 1936, 31, 410–420. [Google Scholar] [CrossRef]
  30. Shepard, F.P. Submarine Canyons: Multiple Causes and Long-Time Persistence. AAPG Bull. 1981, 65, 1062–1077. [Google Scholar]
  31. Fisher, W.L.; Galloway, W.E.; Steel, R.J.; Olariu, C.; Kerans, C.; Mohrig, D. Deep-water depositional systems supplied by shelf-incising submarine canyons: Recognition and significance in the geologic record. Earth Sci. Rev. 2021, 214, 103531. [Google Scholar] [CrossRef]
  32. Cerrillo-Escoriza, J.; Lobo, F.J.; Puga-Bernabéu, A.; Bárcenas, P.; Mendes, I.; Pérez-Asensio, J.N.; Durán, R.; Andersen, T.J.; Carrión Torrente, A.; García, M.; et al. Variable downcanyon morphology controlling the recent activity of shelf-incised submarine canyons (Alboran Sea, western Mediterranean). Geomorphology 2024, 453, 109127. [Google Scholar] [CrossRef]
  33. Stow, D.A.V.; Mayall, M. Deep-water sedimentary systems: New models for the 21st century. Mar. Pet. Geol. 2000, 17, 125–135. [Google Scholar] [CrossRef]
  34. Spencer, J.W. Submarine valleys off the American coasts and in the North Atlantic. Geol. Soc. Am. Bull. 1903, 14, 207–226. [Google Scholar] [CrossRef]
  35. Wegener, A. The Origin of Continents and Oceans; Dutton: New York, NY, USA, 1924; 212p. [Google Scholar]
  36. Bourcart, J. Essai sur les regressions et transgressions marines. Soc. Geol. Fr. Bull. 1938, 5, 393–474. [Google Scholar]
  37. Johnson, D.W. The Origin of Submarine Canyons, a Critical Review of Hypotheses; Columbia University Press: New York, NY, USA, 1939; 126p. [Google Scholar]
  38. Bucher, W.H. Submarine valleys and related geologic problems of the North Atlantic. Geol. Soc. Am. Bull. 1940, 51, 489–512. [Google Scholar] [CrossRef]
  39. Wynn, R.B.; Cronin, B.T.; Peakall, J. Sinuous deep-water channels: Genesis, geometry and architecture. Mar. Pet. Geol. 2007, 24, 341–387. [Google Scholar] [CrossRef]
  40. Vachtman, D.; Mitchell, N.C.; Gawthorpe, R. Morphologic signatures in submarine canyons and gullies, central USA Atlantic continental margins. Mar. Pet. Geol. 2013, 41, 250–263. [Google Scholar] [CrossRef]
  41. Pratson, L.F.; Ryan, W.B.F. Automated drainage extraction for mapping the Monterey submarine drainage system, California margin. Mar. Geophys. Res. 1996, 18, 757–777. [Google Scholar] [CrossRef]
  42. Field, M.E.; Clarke, S.H. Small-scale slumps and slides and their significance for basin slope processes, southern California borderland. In Geology of Continental Slopes: SEPM Special Publication; Doyle, L.J., Pilkey, O.H., Eds.; SEPM: Tulsa, Oklahoma, USA, 1979; Volume 27, pp. 327–342. [Google Scholar]
  43. Chiocci, F.L.; Casalbore, D. Submarine gullies on Italian upper slopes and their relationship with volcanic activity revisited 20 years after Bill Normark’s pioneering work. Geosphere 2011, 7, 1284–1293. [Google Scholar] [CrossRef]
  44. Duncan, C.S.; Goff, J.A.; Austin, J.A.; Fulthorpe, C.S. Tracking the last sea-level cycle: Seafoor morphology and shallow stratigraphy of the latest Quaternary New Jersey middle continental shelf. Mar. Geol. 2000, 170, 395–421. [Google Scholar] [CrossRef]
  45. Boss, S.K.; Hoffman, C.W.; Cooper, B. Influence of fluvial processes on the Quaternary geologic framework of the continental shelf, North Carolina, USA. Mar. Geol. 2002, 183, 45–65. [Google Scholar] [CrossRef]
  46. Maia, R.M.C.; dos Reis, A.T.; Alves, E.C.; Silva, C.G.; Guerra, J.V.; Gorini, C.; Silva, A.; Arantes-Oliveria, R. Architecture and Stratigraphic framework of shelf sedimentary systems off Rio de Janeiro State, Northern Santos Basin-Brazil. Braz. J. Oceanogr. 2010, 58, 15–29. [Google Scholar] [CrossRef]
  47. Kuehl, S.A.; Levy, B.M.; Moore, W.S.; Allison, M.A. Subaqueous delta of the Ganges-Brahmaputra river system. Mar. Geol. 1997, 144, 81–96. [Google Scholar] [CrossRef]
  48. Harris, P.T.; Hughes, M.G.; Baker, E.K.; Dalrymple, R.W.; Keene, J.B. Sediment transport in distributary channels and its export to the pro-deltaic environment in a tidally dominated delta: Fly River, Papua New Guinea. Cont. Shelf Res. 2004, 24, 2431–2454. [Google Scholar] [CrossRef]
  49. Twichell, D.C.; Roberts, D.G. Morphology, distribution, and development of submarine canyons in the United States Atlantic continental slope between Hudson and Baltimore Canyons. Geology 1982, 10, 408–412. [Google Scholar] [CrossRef]
  50. Straub, K.M.; Mohrig, D. Constructional canyons built by sheet-like turbidity currents: Observations from offshore Brunei Darussalam. J. Sediment. Res. 2009, 79, 24–39. [Google Scholar] [CrossRef]
  51. Lastras, G.; Acosta, J.; Muñoz, A.; Canals, M. Submarine canyon formation and evolution in the Argentine Continental Margin between 44°30′ S and 48° S. Geomorphology 2011, 128, 116–136. [Google Scholar] [CrossRef]
  52. Puga-Bernabéu, A.; Webster, J.M.; Beaman, R.J.; Guilbaud, V. Variation in canyon morphology on the Great Barrier Reef margin, north-eastern Australia: The influence of slope and barrier reefs. Geomorphology 2013, 191, 35–50. [Google Scholar] [CrossRef]
  53. Hodgson, D.M.; Peakall, J.; Maier, K.L. Submarine Channel Mouth Settings: Processes, Geomorphology, and Deposits. Front. Earth Sci. 2022, 10, 790320. [Google Scholar] [CrossRef]
  54. Kowsmann, R.O.; Viana, A.R. Movimentos de massa provocados por cunhas progradantes de nível de mar baixo: Exemplo na Bacia de Campos. BGP 1992, 6, 97–102. [Google Scholar]
  55. Mulder, T. Gravity Processes and Deposits on Continental Slope, Rise and Abyssal Plains. Dev Sedimentol. 2011, 63, 25–148. [Google Scholar] [CrossRef]
  56. Baeten, N.J.; Laberg, J.S.; Vanneste, M.; Forsberg, C.F.; Kvalstad, T.J.; Forwick, M.; Vorren, T.O.; Haflidason, H. Origin of shallow submarine mass movements and their glide planes—Sedimentological and geotechnical analyses from the continental slope off northern Norway. J. Geophys. Res. Earth Surf. 2014, 119, 2335–2360. [Google Scholar] [CrossRef]
  57. Kneller, B.; Dykstra, M.; Fairweather, L.; Milana, J.P. Mass-transport and slope accommodation: Implications for turbidite sandstone reservoirs. Am. Assoc. Pet. Geol. Bull. 2016, 100, 213–235. [Google Scholar] [CrossRef]
  58. Shanmugam, G. Deep-Water Processes and Facies Models: Implications for Sandstone Petroleum Reservoirs; Elsevier: Amsterdam, The Netherlands, 2006; p. 199. [Google Scholar]
  59. Gales, J.A.; Forwick, M.; Laberg, J.S.; Vorren, T.O.; Larter, R.D.; Graham, A.G.C.; Baeten, N.J.; Amundsen, H.B. Arctic and Antarctic submarine gullies—A comparison of high latitude continental margins. Geomorphology 2013, 201, 449–461. [Google Scholar] [CrossRef]
  60. Babonneau, N.; Savoye, B.; Cremer, M.; Klein, B. Morphology and architecture of the present canyon and channel system of the Zaire deep-sea fan. Mar. Pet. Geol. 2002, 19, 445–467. [Google Scholar] [CrossRef]
  61. Mayall, M.; Jones, E.; Casey, M. Turbidite channel reservoirs and key elements in facies prediction and effective development. Mar. Pet. Geol. 2006, 23, 821–841. [Google Scholar] [CrossRef]
  62. Heiniö, P.; Davies, R.J. Knickpoint migration in submarine channels in response to fold growth, western Niger Delta. Mar. Pet. Geol. 2007, 24, 434–449. [Google Scholar] [CrossRef]
  63. Piper, D.J.W.; Normark, W.R. Turbidite deposition patterns and flow characteristics, Navy Submarine Fan, Californian Borderland. Sedimentology 1983, 30, 681–694. [Google Scholar] [CrossRef]
  64. Baztan, J.; Berné, S.; Olivet, J.L.; Rabineau, M.; Aslanian, D.; Gaudin, M.; Réhault, J.P.; Canals, M. Axial incision: The key to understand submarine canyon evolution (in the western Gulf of Lion). Mar. Pet. Geol. 2005, 22, 805–826. [Google Scholar] [CrossRef]
  65. Kane, I.A.; Kneller, B.C.; Dykstra, M.; Kassem, A.; McCaffrey, W.D. Anatomy of a submarine channel-levee: An example from Upper Cretaceous slope sediments, Rosario Formation, Baja California, Mexico. Mar. Pet. Geol. 2007, 24, 540–563. [Google Scholar] [CrossRef]
  66. Surpless, K.D.; Ward, R.B.; Graham, S.A. Evolution and stratigraphic architecture of marine slope gully complexes: Monterey Formation (Miocene), Gaviota Beach, California. Mar. Pet. Geol. 2009, 26, 269–288. [Google Scholar] [CrossRef]
  67. Celis, S.A.; García-García, F.; Rodríguez-Tovar, F.J.; Giraldo-Villegas, C.A.; Pardo-Trujillo, A. Coarse-grained submarine channels: From confined to unconfined flows in the Colombian Caribbean (late Eocene). Sediment. Geol. 2024, 459, 106550. [Google Scholar] [CrossRef]
  68. Izumi, N. The formation of submarine gullies by turbidity currents. J. Geophys. Res. 2004, 109, C03048. [Google Scholar] [CrossRef]
  69. Keevil, G.M.; Peakall, J.; Best, J.L. The influence of scale, slope and channel geometry on the flow dynamics of submarine channels. Mar. Pet. Geol. 2007, 24, 487–503. [Google Scholar] [CrossRef]
  70. Peakall, J.; Amos, K.J.; Keevil, G.M.; William Bradbury, P.; Gupta, S. Flow processes and sedimentation in submarine channel bends. Mar. Pet. Geol. 2007, 24, 470–486. [Google Scholar] [CrossRef]
  71. Islam, M.A.; Imran, J.; Pirmez, C.; Cantelli, A. Flow splitting modifies the helical motion in submarine channels. Geophys. Res. Lett. 2008, 35, L22603. [Google Scholar] [CrossRef]
  72. Kane, I.A.; McCaffrey, W.D.; Peakall, J. Controls on sinuosity evolution within submarine channels. Geology 2008, 36, 287–290. [Google Scholar] [CrossRef]
  73. Straub, K.M.; Mohrig, D. Quantifyng the morphology and growth of levee in aggrading submarine channel. J. Geophys. Res. 2008, 113, F03012. [Google Scholar]
  74. Amos, K.J.; Peakall, J.; Bradbury, P.W.; Roberts, M.; Keevil, G.; Gupta, S. The influence of bend amplitude and planform morphology on flow and sedimentation in submarine channels. Mar. Pet. Geol. 2010, 27, 1431–1447. [Google Scholar] [CrossRef]
  75. Kane, I.A.; McCaffrey, W.D.; Peakall, J.; Kneller, B.C. Submarine channel levee shape and sediment waves from physical experiments. Sediment. Geol. 2010, 223, 75–85. [Google Scholar] [CrossRef]
  76. Koller, D.; Manica, R.; Borges, A.L.O.; Fedele, J. Experimental bedforms by saline density currents. Braz. J. Geol. 2019, 49, e20180118. [Google Scholar] [CrossRef]
  77. Pantopoulos, G.; Manica, R.; MCarthur, A.D.; Kuchle, J. Particle shape trends across experimental cohesive and non-cohesive sediment gravity flow deposits: Implications for particle fractionation and discrimination of depositional settings. Sedimentology 2021, 69, 1495–1518. [Google Scholar] [CrossRef]
  78. Schwenk, T.; Spieβ, V.; Hübscher, C.; Breitzke, M. Frequent channel avulsions within the active channel–levee system of the middle Bengal Fan—An exceptional channel–levee development derived from Parasound and Hydrosweep data. Deep-Sea Res. II 2003, 50, 1023–1045. [Google Scholar] [CrossRef]
  79. Paola, C.; Straub, K.; Mohrig, D.; Reinhardt, L. The “unreasonable effectiveness” of stratigraphic and geomorphic experiments. Earth-Sci. Rev. 2009, 97, 1–43. [Google Scholar] [CrossRef]
  80. Pirmez, C.; Flood, R.D. Morphology and structure of Amazon channel. Proc. ODP Initial Rep. 1995, 155, 23–45. [Google Scholar]
  81. Amblas, D.; Gerber, T.P.; Canals, M.; Pratson, L.F.; Urgeles, R.; Lastras, G.; Calafat, A.M. Transient erosion in the Valencia Trough turbidite systems, NW Mediterranean Basin. Geomorphology 2011, 130, 173–184. [Google Scholar] [CrossRef]
  82. McHugh, C.M.G.; Ryan, W.B.F. Sedimentary features associated with channel overbank flow: Examples from the Monterey Fan. Mar. Geol. 2000, 163, 199–215. [Google Scholar] [CrossRef]
  83. Carlson, P.R.; Karl, H.A. Discovery of two new large submarine canyons in the Bering Sea. Mar. Geol. 1984, 56, 159–179. [Google Scholar] [CrossRef]
  84. Carlson, P.R.; Karl, H.A. Development of large submarine canyons in the Bering Sea indicated by morphologic, seismic, and sedimentologic characteristics. Geol. Soc. Am. Bull. 1988, 100, 1594–1615. [Google Scholar] [CrossRef]
  85. Estrada, F.; Ercilla, G.; Alonso, B. Quantitative study of a Magdalena submarine channel (Caribbean Sea): Implications for sedimentary dynamics. Mar. Pet. Geol. 2005, 22, 623–635. [Google Scholar] [CrossRef]
  86. Micallef, A.; Mountjoy, J.J. A topographic signature of a hydrodynamic origin for submarine gullies. Geology 2011, 39, 115–118. [Google Scholar] [CrossRef]
  87. Lonergan, L.; Jamin, N.H.; Jackson, C.A.-L.; Johnson, H.D. U-shaped slope gully systems and sediment waves on the passive margin of Gabon (West Africa). Mar. Geol. 2013, 337, 80–97. [Google Scholar] [CrossRef]
  88. Li, W.; Alves, M.T.; Rebesco, M.; Sun, J.; Li, J.; Li, S.; Wu, S. The Baiyun Slide Complex, South China Sea: A modern example of slope instability controlling submarine-channel incision on continental slopes. Mar. Pet. Geol. 2020, 114, 104231. [Google Scholar] [CrossRef]
  89. Mitchell, W.H.; Whittaker, A.C.; Mayall, M.; Lonergan, L. New models for submarine channel deposits on structurally complex slopes: Examples from the Niger delta system. Mar. Pet. Geol. 2021, 129, 105040. [Google Scholar] [CrossRef]
  90. Heijnen, M.S.; Clare, M.A.; Cartigny, M.J.B.; Talling, P.J.; Hage, S.; Pope, E.L.; Bailey, L.; Sumner, E.; Gwyn Lintern, D.; Stacey, C.; et al. Fill, flush or shuffle: How is sediment carried through submarine channels to build lobes? Earth Planet. Sci. Lett. 2022, 584, 117481. [Google Scholar] [CrossRef]
  91. Field, M.E.; Gardner, J.V.; Prior, D.B. Geometry and significance of stacked gullies on the northern California slope. Mar. Geol. 1999, 154, 271–286. [Google Scholar] [CrossRef]
  92. Pirmez, C.; Beaubouef, R.T.; Friedmann, S.J.; Mohrig, D.C. Equilibrium profile and base level in submarine channels: Examples from late Pleistocene systems and implications for the architecture of deepwater reservoirs. In Proceedings of the GCSSEPM Foundation 20th Annual Research Conference Deep-Water Reservoirs of the World, Houston, TX, USA, 3–6 December 2000; pp. 782–805. [Google Scholar]
  93. Pirmez, C.; Imran, I. Reconstruction of turbidity currents in Amazon Channel. Mar. Pet. Geol. 2003, 20, 823–849. [Google Scholar] [CrossRef]
  94. Nelson, C.H.; Kulm, L.D. Submarine fans and deep-sea channels. In Turbidites and Deep-Water Sedimentation; Middleton, G.V., Bouma, A.H., Eds.; SEPM Pacific Section Short Course: Anaheim, CA, USA, 1973; pp. 39–78. [Google Scholar]
  95. Chiocci, F.L.; Normark, W.R. Effect of sea-level variation on upper-slope depositional processes offshore of Tiber delta, Tyrrhenian Sea, Italy. Mar. Geol. 1992, 104, 109–122. [Google Scholar] [CrossRef]
  96. Middleton, G.V. Small-scale models of turbidity currents and the criterion for auto-suspension. J. Sediment. Petrol. 1966, 36, 202–208. [Google Scholar]
  97. Khan, Z.A.; Arnott, R.W.C. Stratal attributes and evolution of asymmetric inner- and outer-bend levee deposits associated with an ancient deep-water channel-levee complex within the Isaac Formation, southern Canada. Mar. Pet. Geol. 2011, 28, 824–842. [Google Scholar] [CrossRef]
  98. Peakall, J.; Ashworth, P.; Best, J.L. Physical modelling in fluvial geomorphology: Principles, applications and unresolved issues. In The Scientific Nature of Geomorphology; Rhoads, B.L., Thorn, C.E., Eds.; Wiley & Sons: Chichester, UK, 1996; pp. 221–253. [Google Scholar]
  99. Zeng, J.; Lowe, D.R. Numerical simulation of turbidity current flow and sedimentation: I. Theory. Sedimentology 1997, 44, 67–84. [Google Scholar] [CrossRef]
  100. Rubey, W.W. Settling velocities of gravel, sand and silt particles. Am. J. Sci. 1933, 148, 325–339. [Google Scholar] [CrossRef]
  101. Mutti, E. Distinctive thin-bedded turbidite facies and related depositional environments in the Eocene Hecho Group (South-central Pyrenees, Spain). Sedimentology 1977, 24, 107–131. [Google Scholar] [CrossRef]
  102. Fedele, J.J.; García, M.H. Laboratory experiments on the formation of subaqueous depositional gullies by turbidity currents. Mar. Geol. 2009, 258, 48–59. [Google Scholar] [CrossRef]
  103. Dott, R.H., Jr.; Bird, K.J. Sand transport through channels across an Eocene shelf and slope in south western Oregon, USA. In Geology of Continental Slopes; Doyle, L.J., Pilkey, O.H., Eds.; SEPM: Tulsa, OK, USA, 1979; Volume 27, pp. 327–342. [Google Scholar]
  104. Buffington, E.C.; Moore, D.G. Geophysical evidence on the origin of gullied submarine slopes, San Clemente, California. J. Geol. 1963, 71, 356–370. [Google Scholar] [CrossRef]
  105. Pickering, K.T.; Hiscott, R.N.; Hein, F.J. Submarine canyons, gullies, and other sea valleys. In Deep Marine Environments: Clastic Sedimentation and Tectonics; Unwyn Hyman: London, UK, 1989; pp. 133–159. [Google Scholar]
  106. Coleman, J.M.; Prior, D.B.; Lindsay, J.F. Deltaic influences on shelf edge instability processes. In The Shelf Break: Critical Interface on Continental Margins; Stanley, D.J., Moore, G.T., Eds.; SEPM: Tulsa, Oklahoma, USA, 1983; Volume 33, pp. 121–137. [Google Scholar]
  107. Flood, R.D. Classification of sedimentary furrows and a model for furrow initiation and evolution. Geol. Soc. Am. Bull. 1983, 94, 630–639. [Google Scholar] [CrossRef]
  108. Orange, D.L.; Breen, N.A. The effects of fluid escape on accretionary wedges: 2. Seepage force, slope failure, headless submarine canyons and vents. J. Geophys. Res. 1992, 97, 9277–9295. [Google Scholar] [CrossRef]
  109. Spinelli, G.A.; Field, M.E. Evolution of continental slope gullies on the northern California margin. J. Sediment. Res. 2001, 71, 237–245. [Google Scholar] [CrossRef]
  110. Boffo, C.H.; de Oliveira, T.A.; da Silva, D.B.; Manica, R.; Borges, A.L.D.O. Continental-slope instability triggered by seepage: An experimental approach. J. Sediment. Res. 2020, 90, 921–937. [Google Scholar] [CrossRef]
  111. Boffo, C.H.; Bayer da Silva, D.; Manica, R.; de Oliveira Borges, A.L.; Roessler Viana, A. Submarine slope destabilization and gully formation by water sapping: Physical simulation of an underestimated trigger of subaqueous sediment gravity flows. Sedimentology 2022, 69, 1599–1625. [Google Scholar] [CrossRef]
Figure 1. (a) A 3D view of the experimental setup, scaled according to the dimensions and names of the environmental analogs; (b) plan view; (c) cross-sectional view.
Jmse 12 01476 g001
Figure 2. Grain size distribution of the sediments (coal and kaolin) used in the experiments.
Jmse 12 01476 g002
Figure 3. Time evolution chart of main parameters for the 5 runs of Series I. The dashed blue line indicates the variation in density (see Figure 4 and Table 2), and the red line shows the variation in flow rate. Each run is marked at the top of the graphic.
Jmse 12 01476 g003
Figure 4. Video-based analysis of the deposit evolution in Series I composed of a sequence of runs (E1E5). Subfigure E1E5: each one corresponds to a run and includes a photo of the corresponding final deposit, representation of some of the main flow deposits, data from the run, and a schematic profile (vertical exaggeration of 10 times) of the final deposit marked on the photo (a–b profile). These profiles were overlaid in each run to illustrate the continuity of the experiment and the final deposit situation.
Jmse 12 01476 g004
Figure 5. Schematic profiles from the 3D model of the final deposits of each run (E3, E4, and E5). (a) Front view with a transverse cut; (b) Top view; (c) Transverse slice from (a). The vertical exaggeration is 10 times. The figures were created from Paradigm’s GOCAD®.
Jmse 12 01476 g005
Figure 6. Time evolution chart of the main parameters of the 3 runs of Series II. The dashed blue line indicates the density variation, and the red line indicates the flow rate variation.
Jmse 12 01476 g006
Figure 7. (a) A perspective view of ADV probe at the measuring position (b) and its top view. Note the red circle around the ADV probe (a,b). (c) An image of the final deposit showing the locations where measurements were taken. The numbers and values correspond to the regions in Table 3.
Jmse 12 01476 g007
Figure 8. A photo of the final deposit formed at the end of run 8 in the tank. Dotted lines indicate the conduit generated.
Jmse 12 01476 g008
Figure 9. Scheme representing the vertical evolution of the deposit. Subfigures E1E4: the deposits after each run, including a transverse profile of the deposit at the end of each run. Subfigure E4 final deposit: shows sediment waves (indicated by orange traced zones). Also, in yellow, the ‘future position’ of the conduit is shown, related to the asymmetry induced by erosive flow (indicated by black traced zones).
Jmse 12 01476 g009
Figure 10. E5 evolution with the main instant of conduit creation (red curved line). From 7 min: the asymmetry that forms the conduit is remarkable.
Jmse 12 01476 g010
Figure 11. Some moments of flow from E6. (a) The initial moment where the dyed saline flow began to utilize the conduit to confine part of its flow; (b,c) the middle and final moments, respectively, showing the flow concentrated within the conduit; (d) flow lines traced at different moments of the flow.
Jmse 12 01476 g011
Figure 12. (a) A scheme adapted from [97], illustrating an incipient condition where the rugosity on top of debrite helps localize flows. (b) An image adapted from [50] showing a straight gully shape similar to this experiment and the growth of a gully without apparent erosion.
Jmse 12 01476 g012
Figure 13. Two examples of constructional conduits: (a) a photograph and (b) interpretative drawing from [111] showing topographic depressions between the tongues, visible after draining the tank at the end of the experiment. Ravines, gullies, and furrows formed after the deposition of tongue-shaped features are visible. (c) A bathymetric map of the South China Sea and 3D perspective view (d) showing three canyons in the region from [50] demonstrate that submarine canyons, which might be interpreted as erosional features when analyzing only the present-day seafloor, can in some cases be net-depositional features.
Jmse 12 01476 g013
Figure 14. An illustration depicting the evolutionary process of submarine conduit inception in a region characterized by a slight slope (shelf/upper slope). (a) turbulent flow entering the region; (b) aggradation at the central part; (c) flow interaction with floor and assymetrical deposition; (d) flow confinement at conduit. The yellow arrows indicate the preferential path of flow within the system, with its size reflecting the volume of displaced material in that region.
Jmse 12 01476 g014
Table 1. Field based data on the dimensions of the main types of submarine conduits.
Submarine ConduitsLocalityLength (km)Reference
Submarine canyonHawaiian IslandsHawaii10[59]
La JollaSouthern California14[4]
AmazonNorthern Brazil60[80]
ArenysCatalan margin76[81]
FoixCatalan margin97[81]
MontereyMonterey Bay, California122[82]
BlanesCatalan margin184[81]
NavarinskBering Sea258[83]
BeringBering Sea400[84]
Submarine channelChannel ABrunei Darussalam offshore25[73]
Channel leveeWestern Niger delta95[62]
MagdalenaCaribbean Sea184[85]
ValenciaNW Mediterranean Basin430[81]
AmazonNorthern Brazil807[80]
BengalBay of Bengal3000[78]
GullyNoggin canyonsGreat Barrier Reef margin>0.1[52]
Cook StraitHikurangi subduction margin0.15–1.6[86]
Simeto river mouthItalian upper slope0.2–3[43]
Volturno river mouthItalian upper slope1–4[43]
Tiber delta mouthItalian upper slope1.5–5.5[43]
Antarctic marginAntarctic Peninsula<10[59]
Arctic marginNorway and Svalbard continental margin>10[59]
GabonMargin of Gabon6.5–60[87]
Table 2. Characteristics of all runs separated into Series I and II.
SeriesRunMixture Sediment Composition (%)
K = kaolin; C = coal
Volumetric Concentration (Vc%)Average Flow Rate (L/min)Mixture Density (kg/m3)Duration (min)
Series IE1K = 75; C = 257.0411090.540
E2aK = 75; C = 2510.700.61137.532
E2bK = 75; C = 257.340.61108.837
E3K = 75; C = 257.291.21093.855
E4K = 75; C = 250.831.5–31010.630
E5K = 65; C = 355.681.51065.337
Series IIE6Salt-1.25103561
E7Salt-1.20103562
E8Salt-1.25107062
Table 3. Velocities for each measurement point and respective time of measurements in minutes (in brackets).
Velocities for Each Measurement Point (cm s−1)
RunDistance from Bottom (mm)E7E8
(1) Away from conduit280.50 (14)-
(2) Next to conduit251.05 (13)-
(3) Conduit23(E7)/25(E8)1.50 (13)1.36 (30)
(4) High deposit28-0.37 (30)
Disclaimer/Publisher’s Note: The statements, opinions and data contained in all publications are solely those of the individual author(s) and contributor(s) and not of MDPI and/or the editor(s). MDPI and/or the editor(s) disclaim responsibility for any injury to people or property resulting from any ideas, methods, instructions or products referred to in the content.