Article

Kinematic Stability Analysis of Anchor Cable Structures in Submerged Floating Tunnel under Combined Parametric–Vortex Excitation

1
College of Engineering, Ocean University of China, Qingdao 266404, China
2
College of Intelligent Manufacturing, Huanghai University of Qingdao, Qingdao 266427, China
3
College of Cadet, Binzhou Vocational University, Binzhou 256603, China
*
Author to whom correspondence should be addressed.
J. Mar. Sci. Eng. 2024, 12(9), 1478; https://doi.org/10.3390/jmse12091478
Submission received: 30 May 2024 / Revised: 29 June 2024 / Accepted: 23 July 2024 / Published: 25 August 2024
(This article belongs to the Section Coastal Engineering)

Abstract

:
The submerged floating tunnel is a marine transportation infrastructure that links two shorelines. The tunnel tube body’s buoyancy exceeds gravity, with anchoring ensuring equilibrium. Anchoring reliability is crucial. This study presents a three-way coupled kinematic model for the mooring structure, formulated on Hamilton’s principle and Kirchhoff’s assumption. It explores the impact of the tube body’s buoyancy-to-weight ratio and the sea current’s angle of incidence on mooring motion response. By solving the motion analysis model, Hill’s equation system is derived to assess the parameter instability of the anchor cable structure. The coefficient of excitation instability intervals for the submerged floating tunnel is determined and validated. The findings indicate the following: (1) Increasing the float-weight ratio reduces displacement response amplitudes in all directions, bringing downstream and transverse currents closer to their initial positions; (2) Changes in current direction angles result in decreased downstream excitation strength and increased transverse displacement response with the same excitation direction; (3) The instability interval visualization effectively predicts anchor cable structure instability under parametric excitation. Structures within the instability region are deemed unstable, while those outside are considered stable.

1. Introduction

In the 21st century, the connection between countries is gradually becoming closer; the transportation problem is the most important; cross-sea passage is primarily conducted by ships; for connecting the island and the mainland, the traditional ships struggle to meet the needs of the public passage; a marine immersed tunnel can be a good solution to this problem [1]. Immersed tunnels have significant environmental requirements; the immersed tunnels built around the world are typically constructed outside of the submerged seas, but for the Taiwan Strait and other deeper water areas, the immersed tunnel is difficult to build [2]. The submerged floating tunnel can be a good solution to this problem despite its high operational difficulty and the complexity introduced by the ocean and other environmental loads. However, due to limited research on the reliability of its structure, it has become a major scientific research problem [3,4].
The application site of levitated tunnel design determines the complexity of environmental loads in levitated tunnels, and the influence of waves with different wave parameters on levitated tunnels should not be underestimated. Seo et al. [5] and Chen et al. [6] simulated waves with different wave parameters through wave flumes to study the hydrodynamics of levitated tunnel tubular segments. Wenlong Luo et al. [7] and Fang Wang et al. [8] studied the effect of different regular waves on the submerged floating tunnel (SFT) with an elliptical cross-section through experiments in addition to the regular waves. Qinxi Li et al. [9] further investigated the tubular cross-section by experimentally setting up different wave periods and wave parameters, such as wave height, to study the difference between the tubular body of circular and polygonal cross-section. Yeol Paik et al. [10] used the potential flow theory and the boundary element theory to pick up the wave force to study the dynamic response of a three-dimensional beam cell SFT. P.X. Zou et al. [11] studied the different force conditions of the SFT circular cross-section and the Bessel cross-section case in the extreme environment by CFD and found that the Bessel cross-section was more affected by the acceleration of fluid, and the circular cross-section was more affected by the velocity of fluid. Xiuwen Yuan et al. [12] investigated the effect of different thinning methods on the response of the tunnel under wave action.
The effect of the sea current load on both the tube body and the anchor cable of the SFT is very large; in a certain environment, the anchor cable and the tube body will be affected by the action of the sea current and produce vortex-excited vibration; the vibration of the tube body will also produce parametric excitation of the anchor cable, which will also have a very large impact on the anchor cable [13,14]. Zou et al. [15] experimentally investigated the effect of different tube roughness on the vortex-excited vibration under a uniform flow. Wanhai Xu et al. [16] experimentally investigated the effect of incoming flow direction on the vortex excitation vibration of an underwater cylinder, and the effect of ocean current on the SFT is very large. Guoji Xu et al. [17] investigated the dynamic response of a suspended tunnel under a non-homogeneous wave current by studying the characteristics of the water column in the Qiongzhou Strait. Xu Long et al. [18] investigated the effect of the buoyancy-weight ratio of the suspended tunnel body on the response of the tunnel under the wave current condition and concluded that the buoyancy–weight ratio of the tunnel is the most reasonable when the tunnel is 1.2. Guannan Wang et al. [19] investigated the effect of different end constraints on the overall response of the tunnel. Su Zhibin et al. [20] regarded the anchor cable structure as an Euler–Bernoulli beam and established the structural parameter-excited vibration equations based on it, then simplified and solved it by the Galerkin method and analyzed the effect of different parameters on the stability of the structure by Lyapunov exponential method.
Currently, there are no completed submerged floating tunnels in the world, and research on the structure of submerged floating tunnels is limited to dynamic response. Previous numerical studies have been two-dimensional, assuming the movement of the tunnel body as axial vibration of the anchor cable. However, the actual movement of the anchor cables in submerged floating tunnels is three-dimensional, while the tunnel body moves in two directions. This study, based on the Kirchhoff hypothesis and Hamilton principle, derives the vibration equations in three directions of the anchor cables, revealing the dynamic response in three directions and investigating the influence of the tunnel body’s buoyancy ratio and the flow angle of the sea on anchor cable vibration. Furthermore, the stability of the anchor cables is greatly affected by different parameter excitation frequencies. By employing the Hill method to study the derived equations of motion under different parameter excitations, this research identifies the unstable region of anchor cable parameters, providing a scientific basis for this study of anchor cable stability. The anchored submerged floating tunnel is modeled in Figure 1.

2. Mathematical Modeling and Validation

2.1. Mathematical Modeling

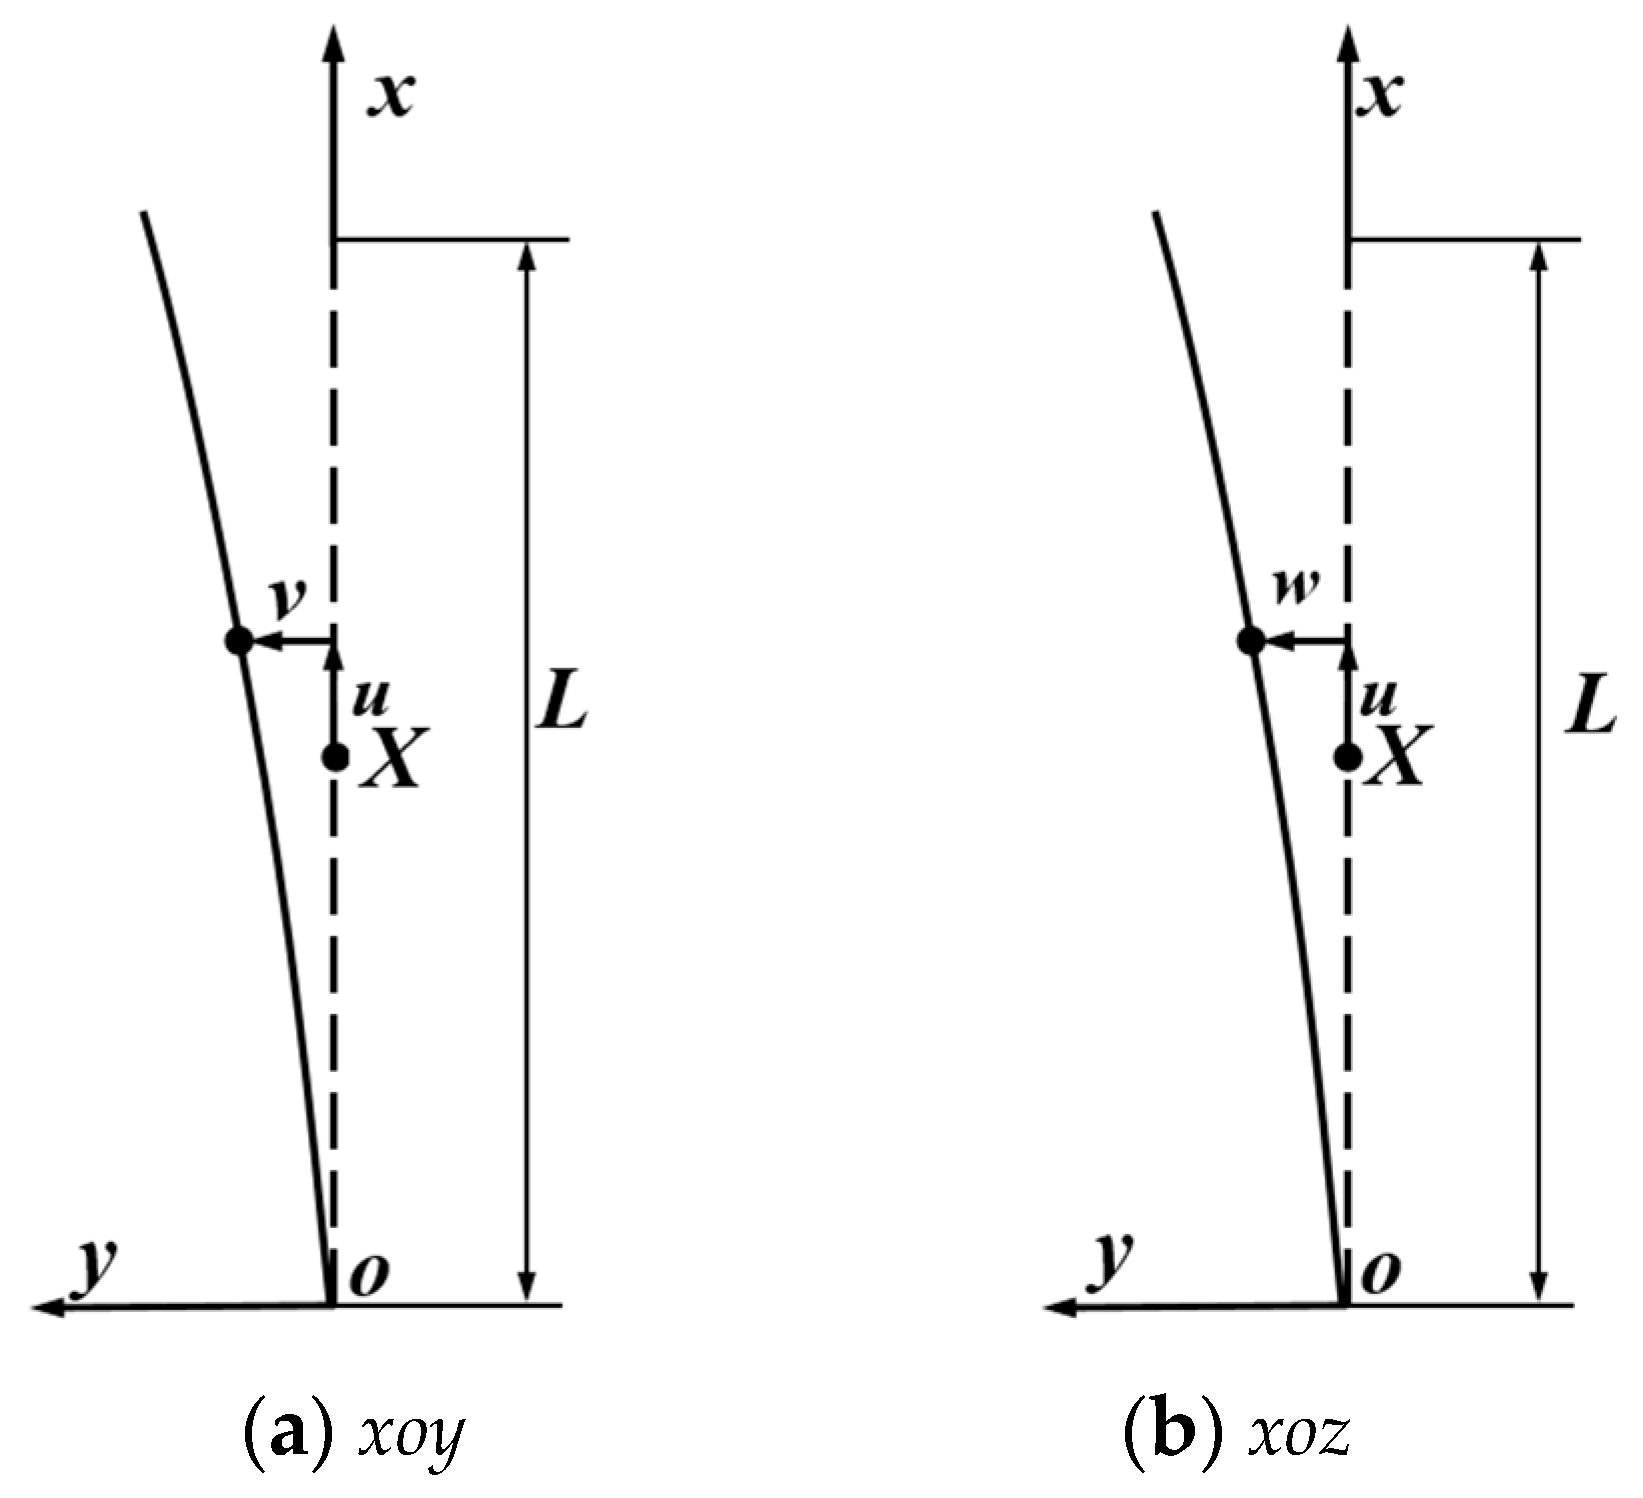
The anchor cable structure of the SFT is regarded as a beam with a length of L. Take the bottom end of the structure as the coordinate origin, and the axial direction of the anchor cable is set as the x-axis so as to establish a three-dimensional coordinate system. Select any anchor cable unit as x, assuming that the anchor cable is deformed by the external force; the coordinates of unit x are changed, and the displacements along the coordinate axes x, y, and z are recorded as u, v, and w, respectively, as shown in Figure 2. Based on the Kirchhoff assumption [21], according to the Green strain tensor formula and the second type of Kirchhoff stress formula, the stresses generated by the deformation of the anchor cable structure can be obtained as
σ i j = E ξ i j
where σ denotes stress; ξ denotes deformation; E denotes Young’s modulus of elasticity, according to Hamilton’s principle [22,23]:
δ t d κ d t + δ t d W d t = 0
where κ is a Lagrangian function to represent the difference between the kinetic and potential energy of the anchor cable, which can be expressed as
κ = K E P E = 0 L 1 2 ρ A 0 ( u ˙ 2 + v ˙ 2 + w ˙ 2 ) + I 0 ( v ˙ 2 + w ˙ 2 ) + C s t d v v d v + t d w w d w 1 2 E I 0 ( v 2 + w 2 ) 1 2 E A 0 u + 1 2 v 2 + w 2 2 d X + 1 2 k θ 2
δ W = 0 L f X ( X , t ) δ u + f Y ( X , t ) δ v + f Z ( X , t ) δ w d X
The partial differential form of the analytical model of the three-way coupled motion of the anchor cable structure can be obtained using the following formula:
ρ A 0 u ¨ E A 0 u + 1 2 v 2 + w 2 = f X
ρ A 0 v ¨ + C s v ˙ E A 0 u + 1 2 v 2 + w 2 v + E I 0 v IV ρ I 0 v ¨ = f Y
ρ A 0 w ¨ + C s w ˙ E A 0 u + 1 2 v 2 + w 2 w + E I 0 w IV ρ I 0 w ¨ = f Z
Its corresponding boundary conditions, collapsed, can be obtained as follows:
u 0 , t = v 0 , t = w 0 , t = 0
E I 0 v L , t = E I 0 w L , t = 0
k ϑ δ ϑ E I 0 v 0 , t + E I 0 w 0 , t = 0
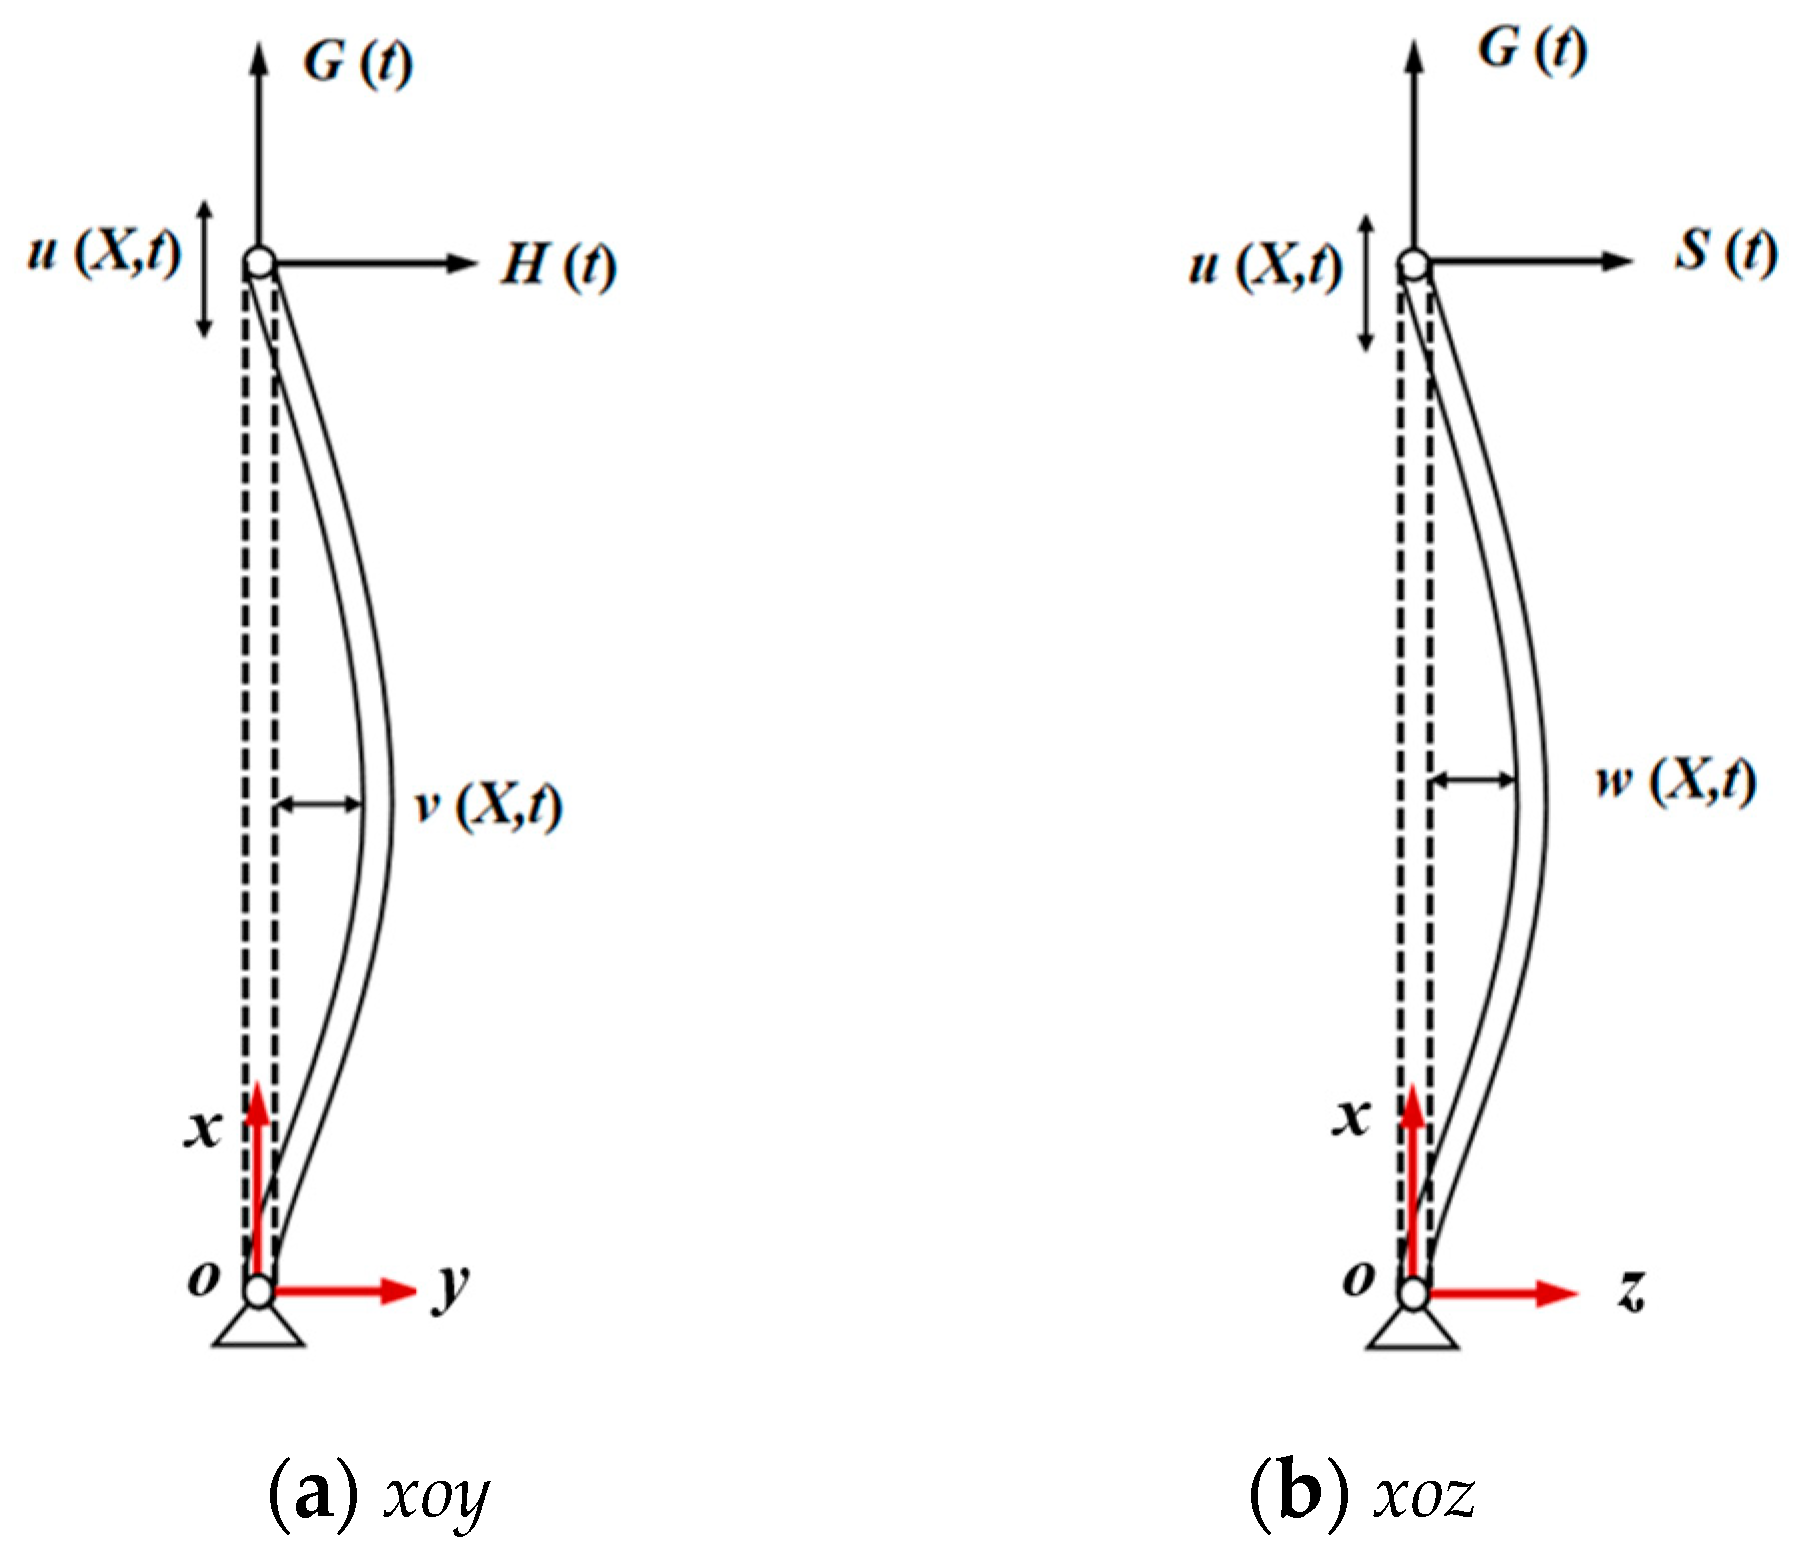
where ϑ = v ( 0 , t ) 2 + w ( 0 , t ) 2 . The parametric excitation of the upper end of the anchor cable structure, the structural form, and the representation symbols of the mass motion of the upper end are shown in Figure 3. Assuming that the anchor cable structure does not twist and is hinged at both ends, the boundary conditions then change to
u 0 , t = v 0 , t = w 0 , t = 0 E I 0 v 0 , t = E I 0 w 0 , t = 0 E I 0 v L , t = E I 0 w L , t = 0 u ( L , t ) = G ( t ) + u 0 = G ( t ) + T L / E A 0 v L , t = H t ; w L , t = S t
In this formula, the axial deformation of the anchor cable structure occurs under the action of the initial tension, where T is the initial tension of the anchor cable structure; G (t), H (t), and S (t) are the time-range functions of the movement of the upper-end point of the anchor cable structure along the x-axis, y-axis, and z-axis directions, respectively. The external excitation of the x-axis direction of the anchor cable structure is mainly gravity and buoyancy, and considering that the anchor cable stays in the water environment for a long time, the external load in the y-axis and z-axis direction is mainly the water damping generated by the vibration of the structure, including the dragging force and inertia force, which can be obtained by Morison’s formula. Therefore, the external loads of the anchor cable structure are, respectively, as follows:
f X ( x , t ) = ρ w a t e r A 0 g ρ A 0 g
f Y ( x , t ) = ρ w a t e r A 0 C m v ¨ 1 2 ρ w a t e r D C D sgn ( v ˙ ) v ˙ 2
f Z ( x , t ) = ρ w a t e r A 0 C m w ¨ 1 2 ρ w a t e r D C D sgn ( w ˙ ) w ˙ 2
where ρ w a t e r denotes the density of the water body; g denotes the acceleration of gravity; Cm denotes the mass coefficient; CD denotes the drag coefficient; D is the diameter of the cross-section of the anchor cable, and sgn denotes a function of the plus and minus signs of the extracted parameters. According to the Galerkin method, the vibration displacement response of the anchor cable can be expressed as
u ( X , t ) = ( G ( t ) + u 0 ) X L + n = 1 R u n ( t ) sin n π X L
v ( X , t ) = H ( t ) X L + n = 1 R v n ( t ) sin n π X L
w ( X , t ) = S ( t ) X L + n = 1 R w n ( t ) sin n π X L
The equations for the vibration–displacement response of the anchor cable obtained by the Galerkin method are substituted into the system of partial differential equations for the analytical model of the three-way coupled motion of the anchor cable structure. The equations are collapsed by trigonometric orthogonality to obtain the final form of the three-way coupled motion analysis model of the anchor cable structure.

2.2. Numerical Model Validation

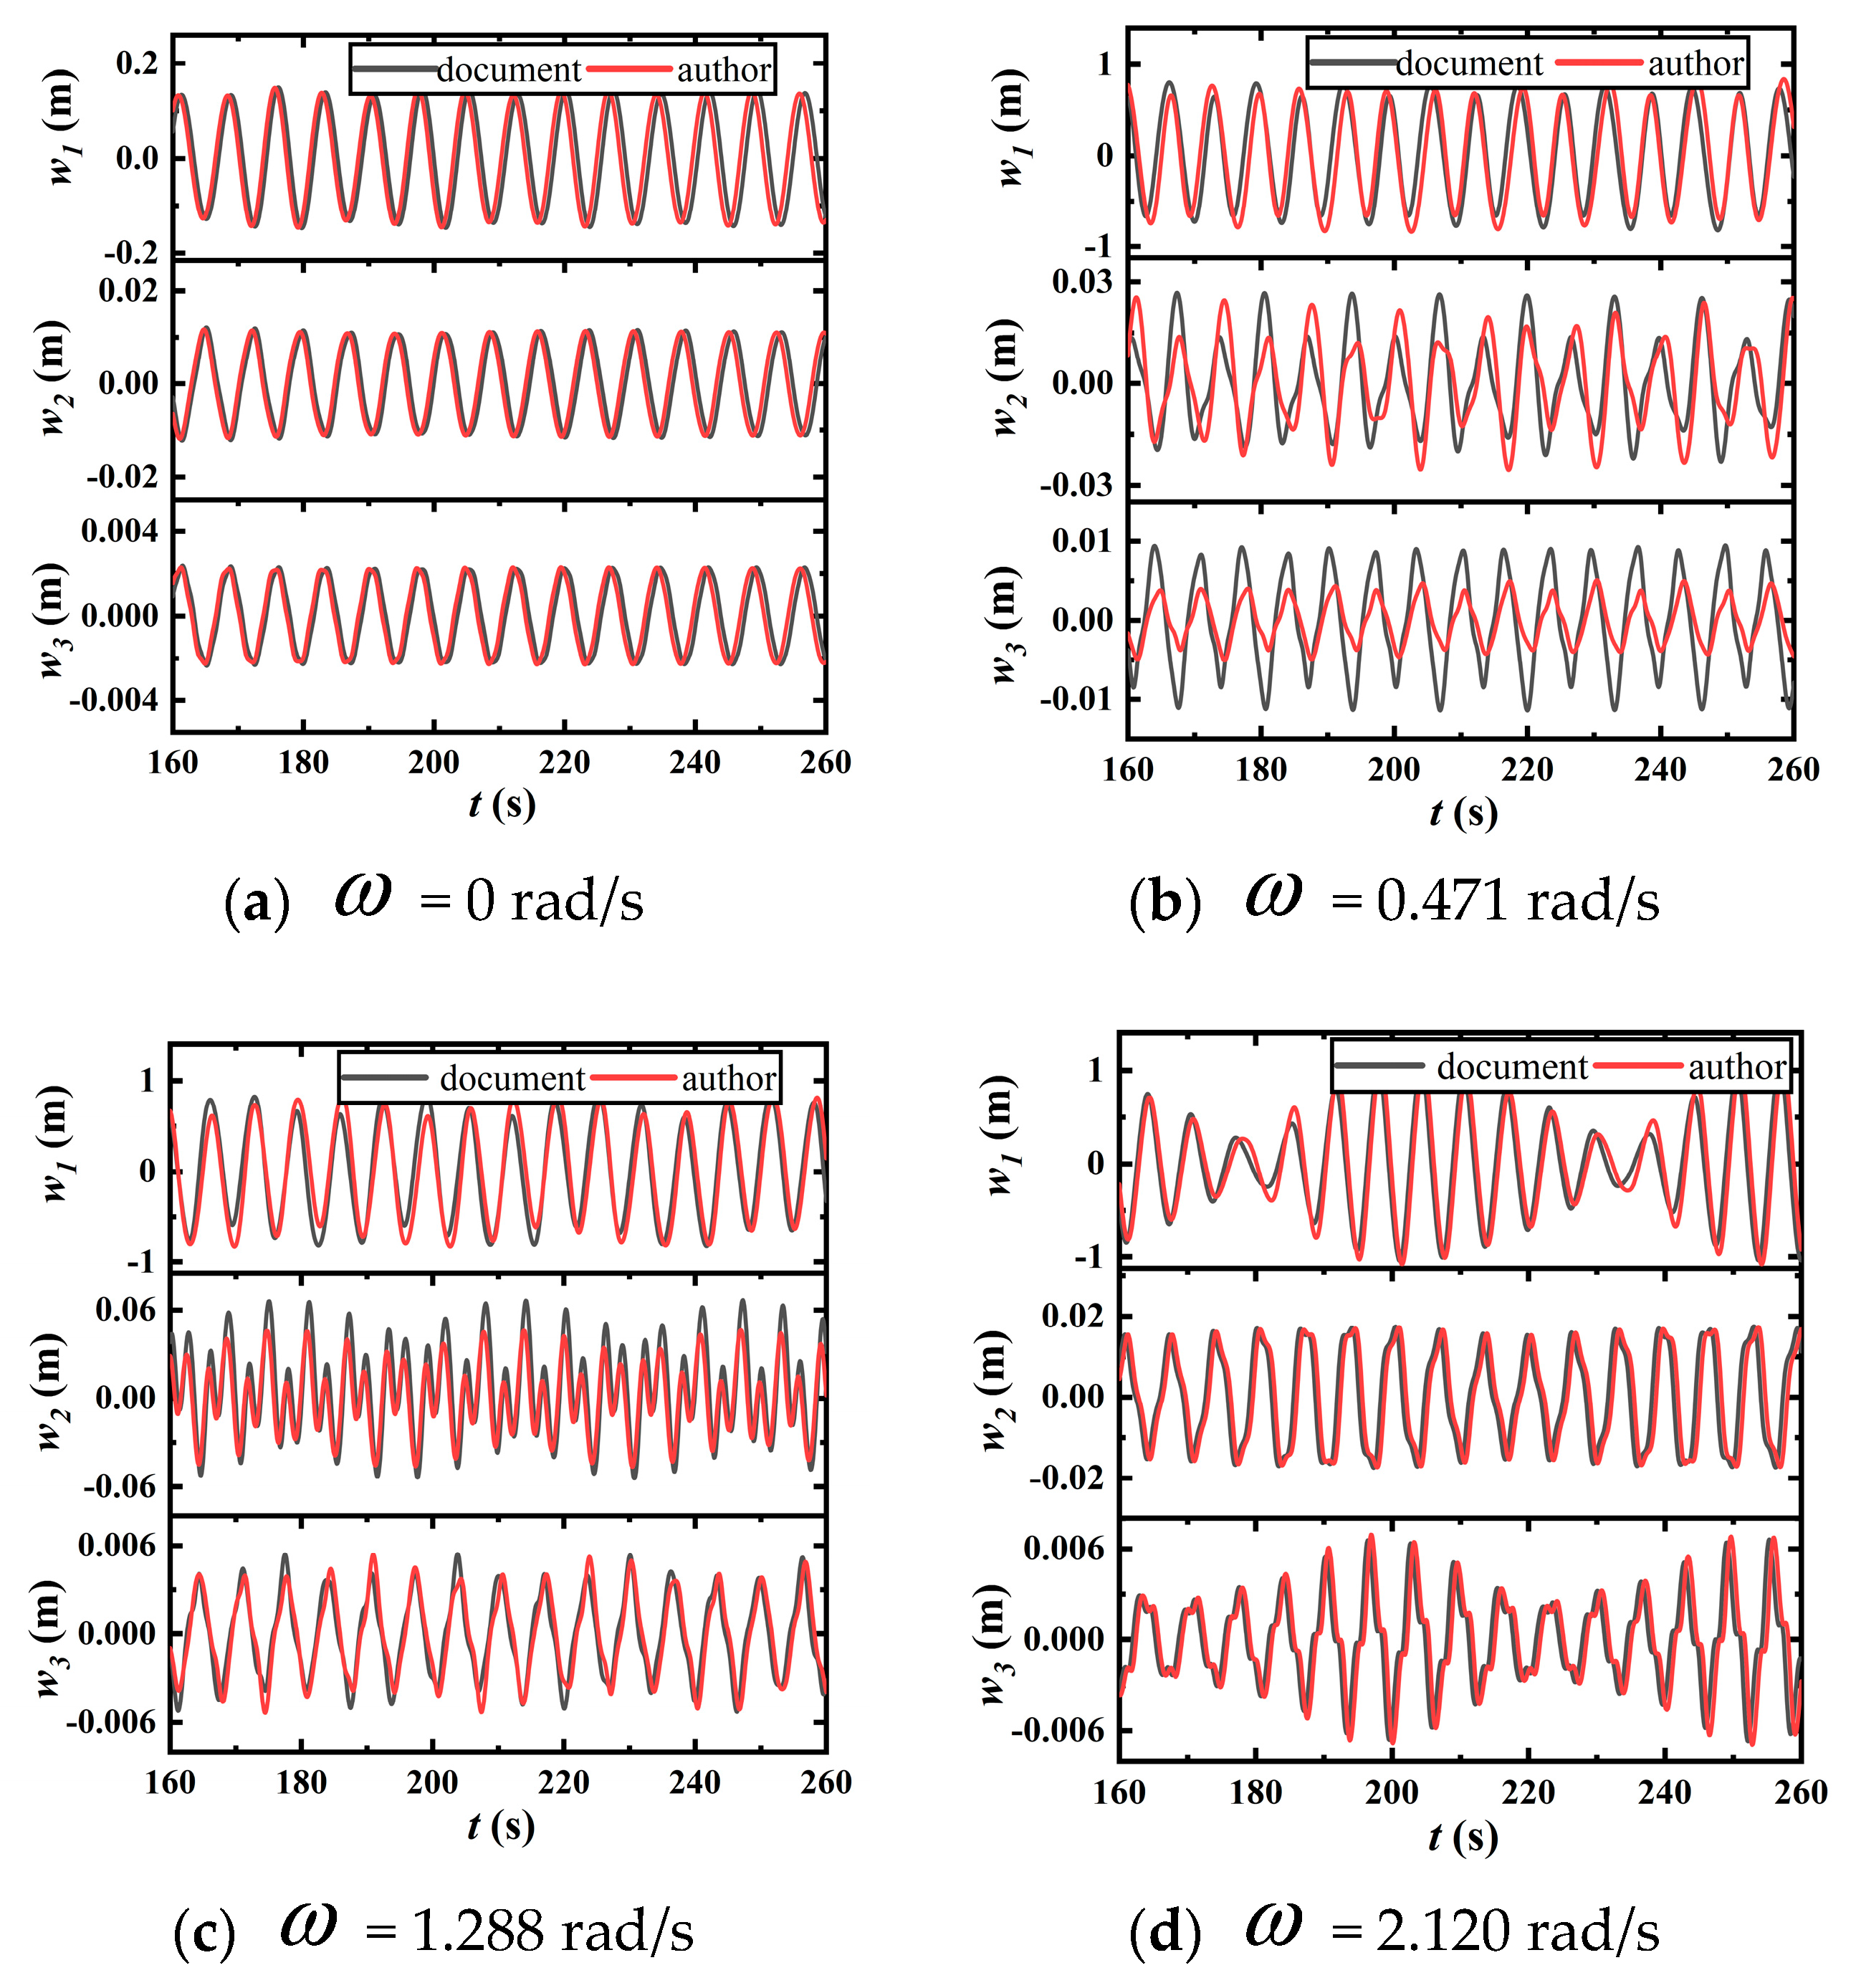
This study compares the prediction outcomes of a three-way coupled motion analysis model for an anchor cable structure with the findings presented in a scholarly publication on SFT [24]. This comparative analysis aims to assess the credibility of the aforementioned model by using identical structural dimensions and environmental variables for both sets of data. By evaluating the prediction results of the model alongside the referenced thesis under consistent operational conditions, a strong concordance is observed in the transverse flow patterns of the initial three modes. The temporal evolution of displacement for these modes is notably consistent, as illustrated in Figure 4. Consequently, it is concluded that the model accurately predicts the displacement response of the anchor cable structure.

3. Effect of Float-to-Weight Ratio and Flow Angle on the Kinematic Response of Anchor Structures

3.1. Effect of Float-to-Weight Ratio on the Kinematic Response of Anchor Cable

The buoyancy-to-weight ratio (BWR) is an important parameter affecting the displacement response of the anchor cable structure of the anchor cable type SFT, which mainly influences the initial tension of the anchor cable structure. It is assumed that the form of the SFT anchor cable structure’s cable deployment is vertical, and the residual buoyancy of the tube body for each section of the cable spacing is borne by a pair of anchor cables. According to the relevant tube parameters adopted by scholars in the current research [25], the anchor cable spacing is set to be 60 m; the outer diameter of the tube is 20 m, and the buoyant force of the tube section is equal to the weight of seawater in the volume of the tube section. Based on this, the initial tension values of the corresponding anchor cable structure under different buoyancy-to-weight ratios can be obtained, as shown in Table 1.
For the anchor cable type SFT, its BWR is generally greater than 1. Therefore, the BWR of 1.1~2.0 is selected to calculate the initial tension of the anchor cable structure under the corresponding working conditions. A typical representative multi-degree-of-freedom parametric excitation condition is selected to analyze the mid-span displacement response of the anchor cable structure under different BWRs. As shown in Figure 5a–c, with the increase in BWR, the amplitude values of the mid-span displacement response of the anchor cable structure under each combination of parametric excitation frequency show a decreasing trend, and the rate of the decrease in the amplitude value of the structure is greatly reduced at BWR = 1.4. Figure 5d,e shows the variation curves of the equilibrium position of the displacement response of the anchor cable structure in the downstream and cross-flow directions, respectively. The equilibrium position of the anchor cable structure changes significantly with the increase in the BWR for some of the parametric excitation frequency combinations, but the trend of the mid-span equilibrium position of the anchor cable structure slows down considerably at BWR = 1.4 for both the downstream and cross-flow directions of the structure. Due to the increase in the initial tension of the anchor cable structure, the amplitude value of its displacement response decreases continuously, but the intrinsic frequency increases correspondingly. When the intrinsic frequency is a large value, the vibration frequency of the displacement response of the anchor cable structure increases, at which time its fatigue damage needs to be further considered.

3.2. Effect of Flow Angle on the Kinematic Response of an Anchor Cable Structure

It is rare that the current flow direction is exactly perpendicular to the axial direction of the SFT tube, i.e., α = 90°. In general, the flow angle can have any value from 0 to 180°. When α = 90°, the direction of the current and the transverse motion of the tube are in the same plane, and the anchor structure does not need to consider the effect of transverse excitation, while when α ≠ 90°, the directions of the current and the transverse motion of the tube are in two planes, and the coordinate system of the anchor structure changes with the direction of the current; at this time, the transverse motion of the tube will not only produce the cis-excitation of the anchoring structure but also the transverse excitation. Therefore, the motion function of the upper-end point of the anchor cable structure caused by the motion of the tube body can be expressed as follows:
G ( t ) = U cos ω u t
H ( t ) = sin α V sin ω v t
S ( t ) = cos α V sin ω v t
When the axial excitation strength is large, the transverse flow displacement response of the anchor cable structure is highly susceptible to interference; so, in order to facilitate the analysis of the effect of the flow angle on the displacement response of the structure, a low axial excitation strength is selected, i.e., U = 0.03 m, V = 2 m. The influence of the change in flow angle on the displacement response of the anchor cable structure is mainly concentrated in the downstream and cross-flow direction, and its axial displacement response has little influence on the amplitude value (see Figure 6a). From Figure 6b, it can be found that the amplitude curves of the displacement response of the anchor cable structure in the downstream direction show a trend of increasing and then decreasing with the increase in the flow angle, and the four sets of curves reach the peak at 90°, i.e., the maximum value and the minimum value at 0° or 180°; correspondingly, the equilibrium position is also the largest degree of deviation from the initial position at α = 90°. In contrast, the amplitude of the transverse displacement response of the structure has a minimum at α = 90° and a maximum at 0° or 180°, and its equilibrium position is also the same, being near the initial position at α = 90°, and the furthest away from the initial position at 0° or 180°.
Under each combination of excitation frequencies, the amplitude of the displacement response of the anchor cable structure in the cross-flow direction is larger than that in the down-flow direction. As shown in Table 2, the maximum or minimum values of the displacement response amplitude in the transverse flow direction of the anchor cable structure are significantly larger than those in the downstream flow direction of the corresponding structure. Therefore, the change in flow angle will make the cis-parametric intensity and transverse parametric intensity change, which, in turn, affects the structure in the same plane with its cis- and transverse displacement changes; when the cis-parametric intensity increases, the transverse parametric intensity decreases. At this time, the structure of the cis-parametric displacement response amplitude increases, corresponding to a decrease in the amplitude of the transverse displacement response value.

4. Instability Analysis of Analytical Model of Three-Way Coupled Motion of Anchor Cable

4.1. Instability Analysis of an Analytical Model of Three-Way Coupled Motion of an Anchor Cable

For the analysis of structural instability under multi-degree-of-freedom parametric excitation, the Mathieu equation [26] is not applicable and needs to be transformed into the more general Hill equation [27]. Since the parametric excitation only affects the parameters within the system and there is no need to consider the external loads on the structure, the axial displacements of the structure have very small values and are not significantly affected by the motion of the upper endpoints. Therefore, both axial motion and external loads of the anchor cable structure can be neglected. From this, the instability analysis equation based on the three-way coupled motion analysis model of the anchor cable structure under multi-degree-of-freedom parametric excitation can be obtained as
v ¨ n ( t ) + E A 0 m ¯ 3 2 H ( t ) L 2 + ( G ( t ) + u 0 ) L n π L 2 v n ( t ) + E A 0 m ¯ S ( t ) L H ( t ) L + 1 2 S ( t ) L n π L 2 w n ( t ) + E I 0 m ¯ n π L 4 v n ( t ) = 0
w ¨ n ( t ) + E A 0 m ¯ 3 2 S ( t ) L 2 + ( G ( t ) + u 0 ) L n π L 2 w n ( t ) + E A 0 m ¯ H ( t ) L S ( t ) L + 1 2 H ( t ) L n π L 2 v n ( t ) + E I 0 m ¯ n π L 4 w n ( t ) = 0
Assuming that only simple harmonic motions in the axial and axial directions are generated at the upper endpoint of the anchor cable structure with the same frequency, there is no motion in the z-axis direction of the upper endpoint since the surge motion of the tube is not considered. Then, the motion of the upper endpoint in the three directions can be expressed as
G t = U cos ω t H t = V sin ω t S t = 0
where U denotes the amplitude of the motion in the x-axial direction of the upper endpoint; V denotes the amplitude of the motion in the y-axial direction of the upper endpoint, and ω denotes the input frequency of the motion in both directions, i.e., the reference frequency. Substituting Equation (23) into Equations (21) and (22), it can be obtained using the following formula:
v ¨ n ( t ) + ω n 2 + ε * γ + cos ω t γ cos 2 ω t v n ( t ) = 0
w ¨ n ( t ) + ω n 2 + ε * cos ω t w n ( t ) + ε sin 2 ω t v n ( t ) = 0
where
γ = 3 V 2 4 L U ε * = E A 0 m ¯ U L n π L 2 ε = E A 0 2 m ¯ V L 2 n π L 2
Equations (24) and (25) are related to each other through v n ( t ) . If the displacement time curve of Equation (24) is divergent, i.e., the amplitude of v n ( t ) tends to infinity, then Equation (25) is also divergent. That is, v n ( t ) oscillates infinitely within a fixed range; the influence on Equation (25) is small, and the relevant parameter term of w n ( t ) plays a dominant role, so the parameter term of v n ( t ) in Equation (25) does not affect the stability of the anchor cable and can be ignored. Let ω t = 2 τ , then v ¨ n ( t ) = ω 2 v ¨ n ( τ ) / 4 ; w ¨ n ( t ) = ω 2 w ¨ n ( τ ) / 4 , substituted into Equations (24) and (25) and can be obtained as follows:
v ¨ n + δ + ε γ + cos 2 τ γ cos 4 τ v n = 0
w ¨ n + δ + ε cos 2 τ w n = 0
Assuming that the length of the anchor cable structure L = 140 m; the amplitude of the movement of the upper endpoint in the x-axis direction U = 0.05 m, and the amplitude of the movement in the y-axis direction V = 2 m, γ = 0.4285. The rest of the parameters are denoted as
δ = 4 ω 2 ω n 2 = 4 ω 2 E I 0 m ¯ n π L 4 + T 0 m ¯ n π L 2 ε = 4 ω 2 ε * = 4 ω 2 E A 0 m ¯ U L n π L 2
After determining the value of γ and substituting it into Equations (27) and (28), the form of the solution of the equation is expressed through the Fourier series, and the matrix form of Equations (27) and (28) can be obtained after collating it through the productized sum and difference formula:
A 2 i a 2 i c 2 i + A 2 i 1 a 2 i 1 c 2 i 1 + B 2 i b 2 i s 2 i + B 2 i 1 a 2 i 1 s 2 i 1 = 0
where the matrices for solving the boundary curves of the unstable zone are denoted, respectively:
A 2 i = δ ˜ ε 2 ε γ 2 ε δ ˜ 4 ε γ 2 ε 2 ε γ 2 ε γ ε 2 δ ˜ 16 ε 2 ε γ 2 ε 2 δ ˜ 36 ε γ 2 ε 2 ε γ 2 ε γ 2 ε 2 δ ˜ 4 i 1 2 ε 2 ε γ 2 ε 2 δ ˜ 4 i 2
B 2 i = δ ˜ 4 + ε γ 2 ε 2 ε γ 2 ε 2 δ ˜ 16 ε 2 ε γ 2 ε 2 δ ˜ 36 ε γ 2 ε 2 ε γ 2 ε γ 2 ε 2 δ ˜ 4 i 1 2 ε 2 ε γ 2 ε 2 δ ˜ 4 i 2
A 2 i 1 = δ ˜ 1 + ε 2 ε 2 ε γ 2 ε γ 2 ε 2 ε γ 2 δ ˜ 9 ε 2 ε γ 2 ε 2 δ ˜ 25 ε γ 2 ε 2 ε γ 2 ε γ 2 ε 2 δ ˜ 2 i 3 2 ε 2 ε γ 2 ε 2 δ ˜ 2 i 1 2
B 2 i 1 = δ ˜ 1 ε 2 ε 2 + ε γ 2 ε γ 2 ε 2 + ε γ 2 δ ˜ 9 ε 2 ε γ 2 ε 2 δ ˜ 25 ε γ 2 ε 2 ε γ 2 ε γ 2 ε 2 δ ˜ 2 i 3 2 ε 2 ε γ 2 ε 2 δ ˜ 2 i 1 2
where a 2 i , a 2 i 1 , and b 2 i are the corresponding column vectors, and c 2 i 1 , c 2 i , s 2 i , and s 2 i 1 are represented as follows:
c 2 i = cos 0 t , cos 2 t , , cos 2 i 1 t , cos 2 i t T s 2 i 1 = sin t , sin 3 t , , sin ( 2 i 1 ) t T c 2 i 1 = cos t , cos 3 t , , cos ( 2 i 1 ) t T s 2 i = sin 2 t , sin 4 t , sin 6 t , , sin 2 i t T
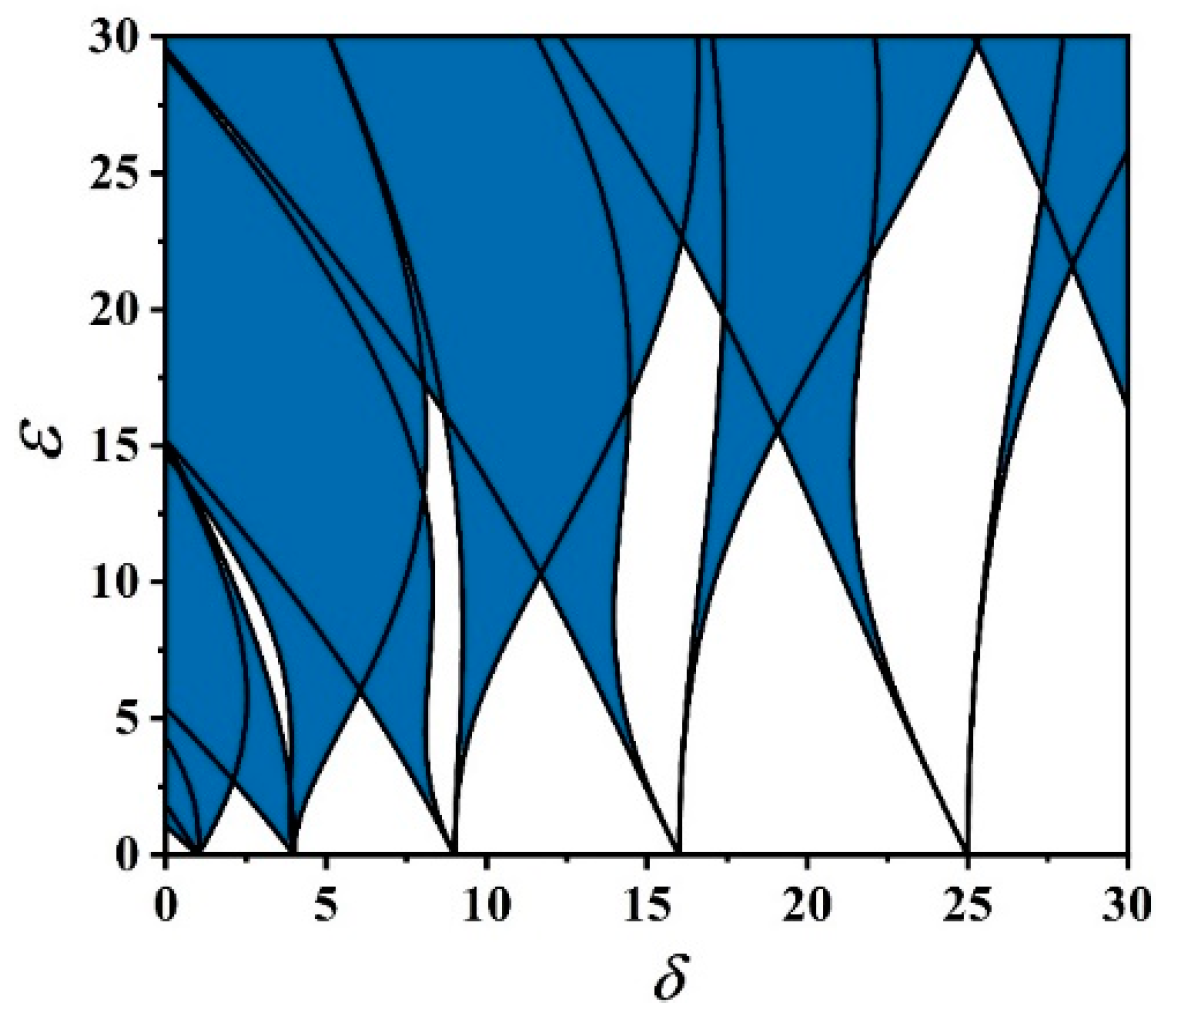
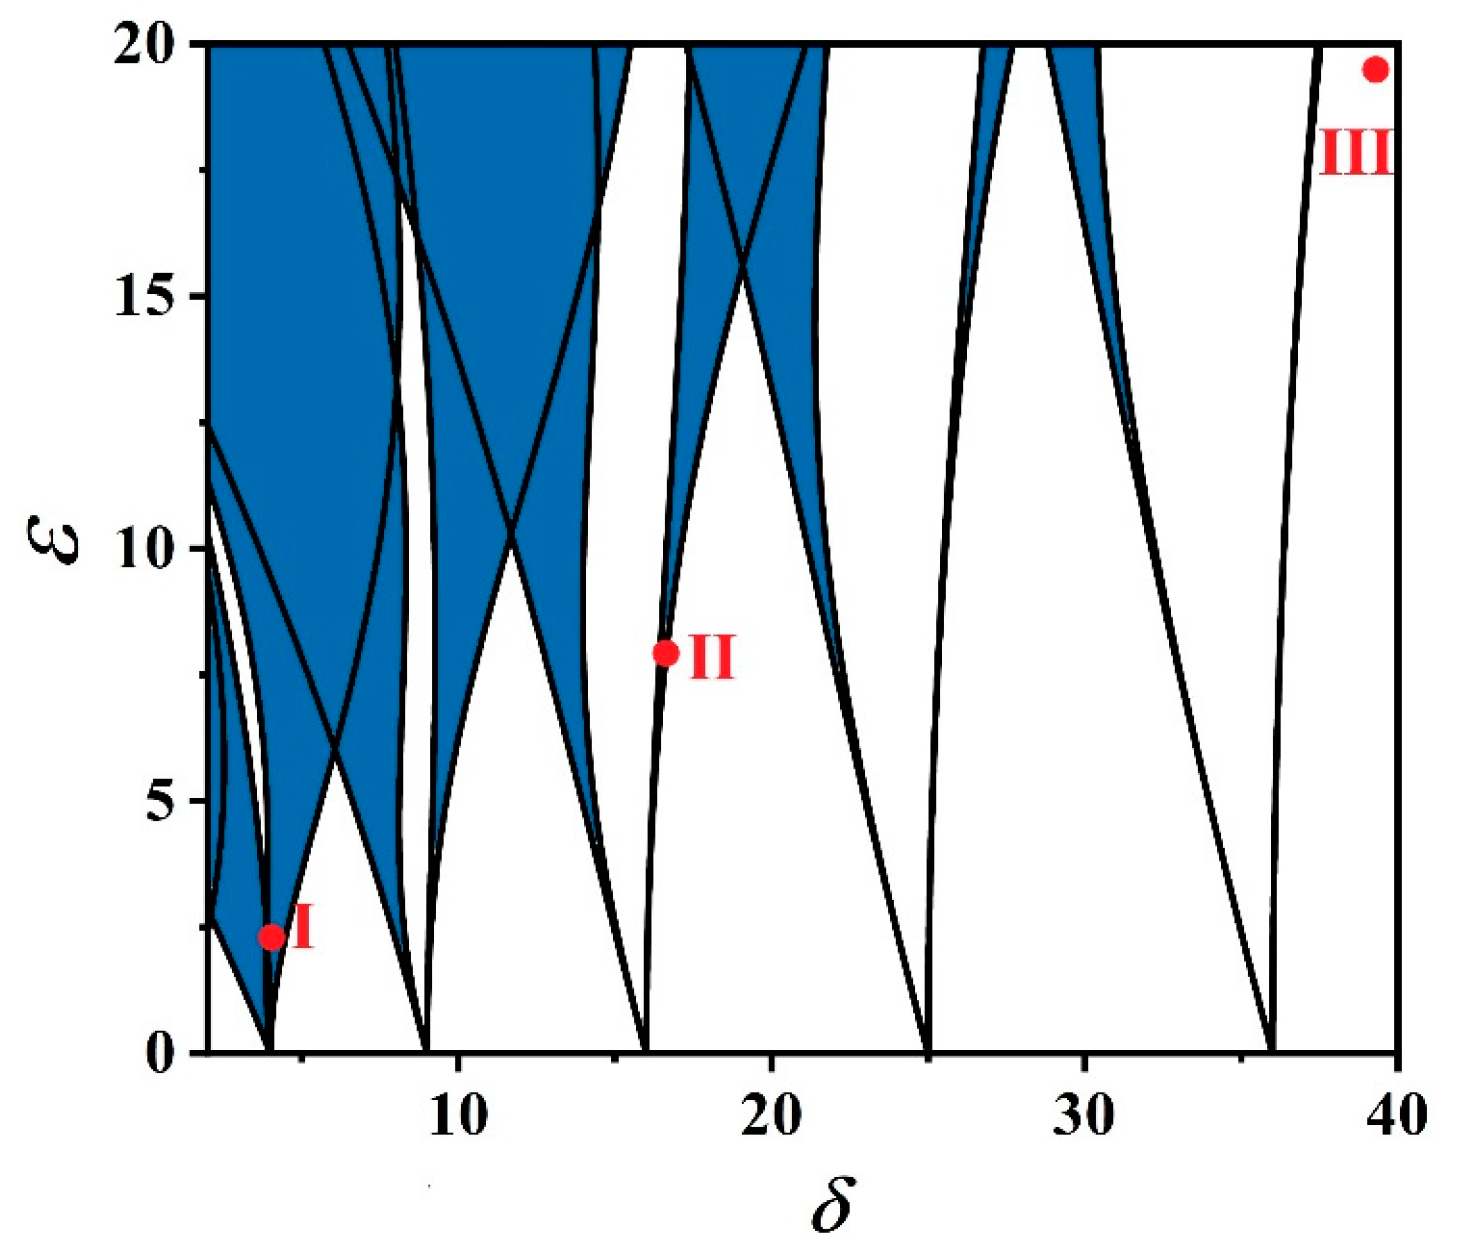
In this paper, the first 6 × 6 matrices in Equations (30)–(33) are intercepted according to practical needs, and the boundary curves of the unstable intervals and the images of their unstable regions can be obtained by solving the corresponding determinant equations, and the corresponding boundary curves and unstable intervals can be obtained by solving Equations (27) and (28) through the determinant method, and the corresponding boundary curves and unstable intervals can be obtained, because Equations (27) and (28) express the movement of the anchored cable structure in two directions, and what is described is the same structure. Therefore, only when both directions are stable at the same time, is the anchor cable structure stable, and if the motion in one direction is unstable, it means that the structure is unstable. The resulting two unstable intervals are superimposed, i.e., the unstable interval of the anchor cable structure, as shown in Figure 7 (The black curve is the boundary curve, and the blue area is the unstable area).

4.2. Instability Analysis

In this section, in order to investigate the stability of the anchor cable structure of the SFT under the excitation of numerical simulation parameters, the different modes of the anchor cable structure corresponding to ( δ , ε ) are taken as the design points, and the first three orders of modes are selected for the analysis. The position of each design point on the instability image is used to predict the parametric instability of the anchor cable structure at that design point, and the Equations (27) and (28) corresponding to the design point are solved by the Runge–Kutta method to obtain the structural displacement time-course curves and planar trajectory diagrams for each design point. Since there is no completed SFT, the relevant parameters needed for the calculation are set up by combining the relevant parameters of the proposed foreign SFT and referring to the data used in the research of some experts and scholars [24,28]. Assuming that the anchor cable SFT is vertical, the net buoyancy of the tunnel tube for each cable spacing is borne by a pair of anchor cables, with a set buoyancy-to-weight ratio of BWR = 1.4, a cable spacing of 60 m, and an outer diameter of the tunnel body of 20 m, the initial tension of a single anchor cable is 2.70 × 10⁷ N. The rest of the dimensions and environmental parameters of the anchor cable structure are shown in Table 3. Based on the results of 2.1, the intrinsic frequencies of the first three modes were obtained, of which the intrinsic frequency of the first-order mode was 2.8099 rad/s; that of the second-order mode was 5.7190 rad/s, and that of the third-order mode was 8.8208 rad/s.
It is assumed that the upper-end point of the anchor cable structure is in simple harmonic motion with the same frequency in the x-axial direction and y-axial direction; U = 0.05 m; V = 2 m. According to the different input frequency ω , the coordinates of the design points of the first three modes of the anchor cable structure are calculated, and the specific parameters are shown in Table 4. In Table 4, I indicates the design number of the first-order modal design point of the structure at a certain input frequency of the anchor cable structure and corresponds to it, while II and III indicate the design numbers of the second-order and third-order modal design points of the structure. The coordinates of the first three modal design points of the anchor cable structure for some working conditions in Table 4 are marked on the corresponding images of the unstable zone, and the points are labeled with the design numbers I, II, and III, which correspond to the first-order, second-order, and third-order modes of the anchor cable structure.
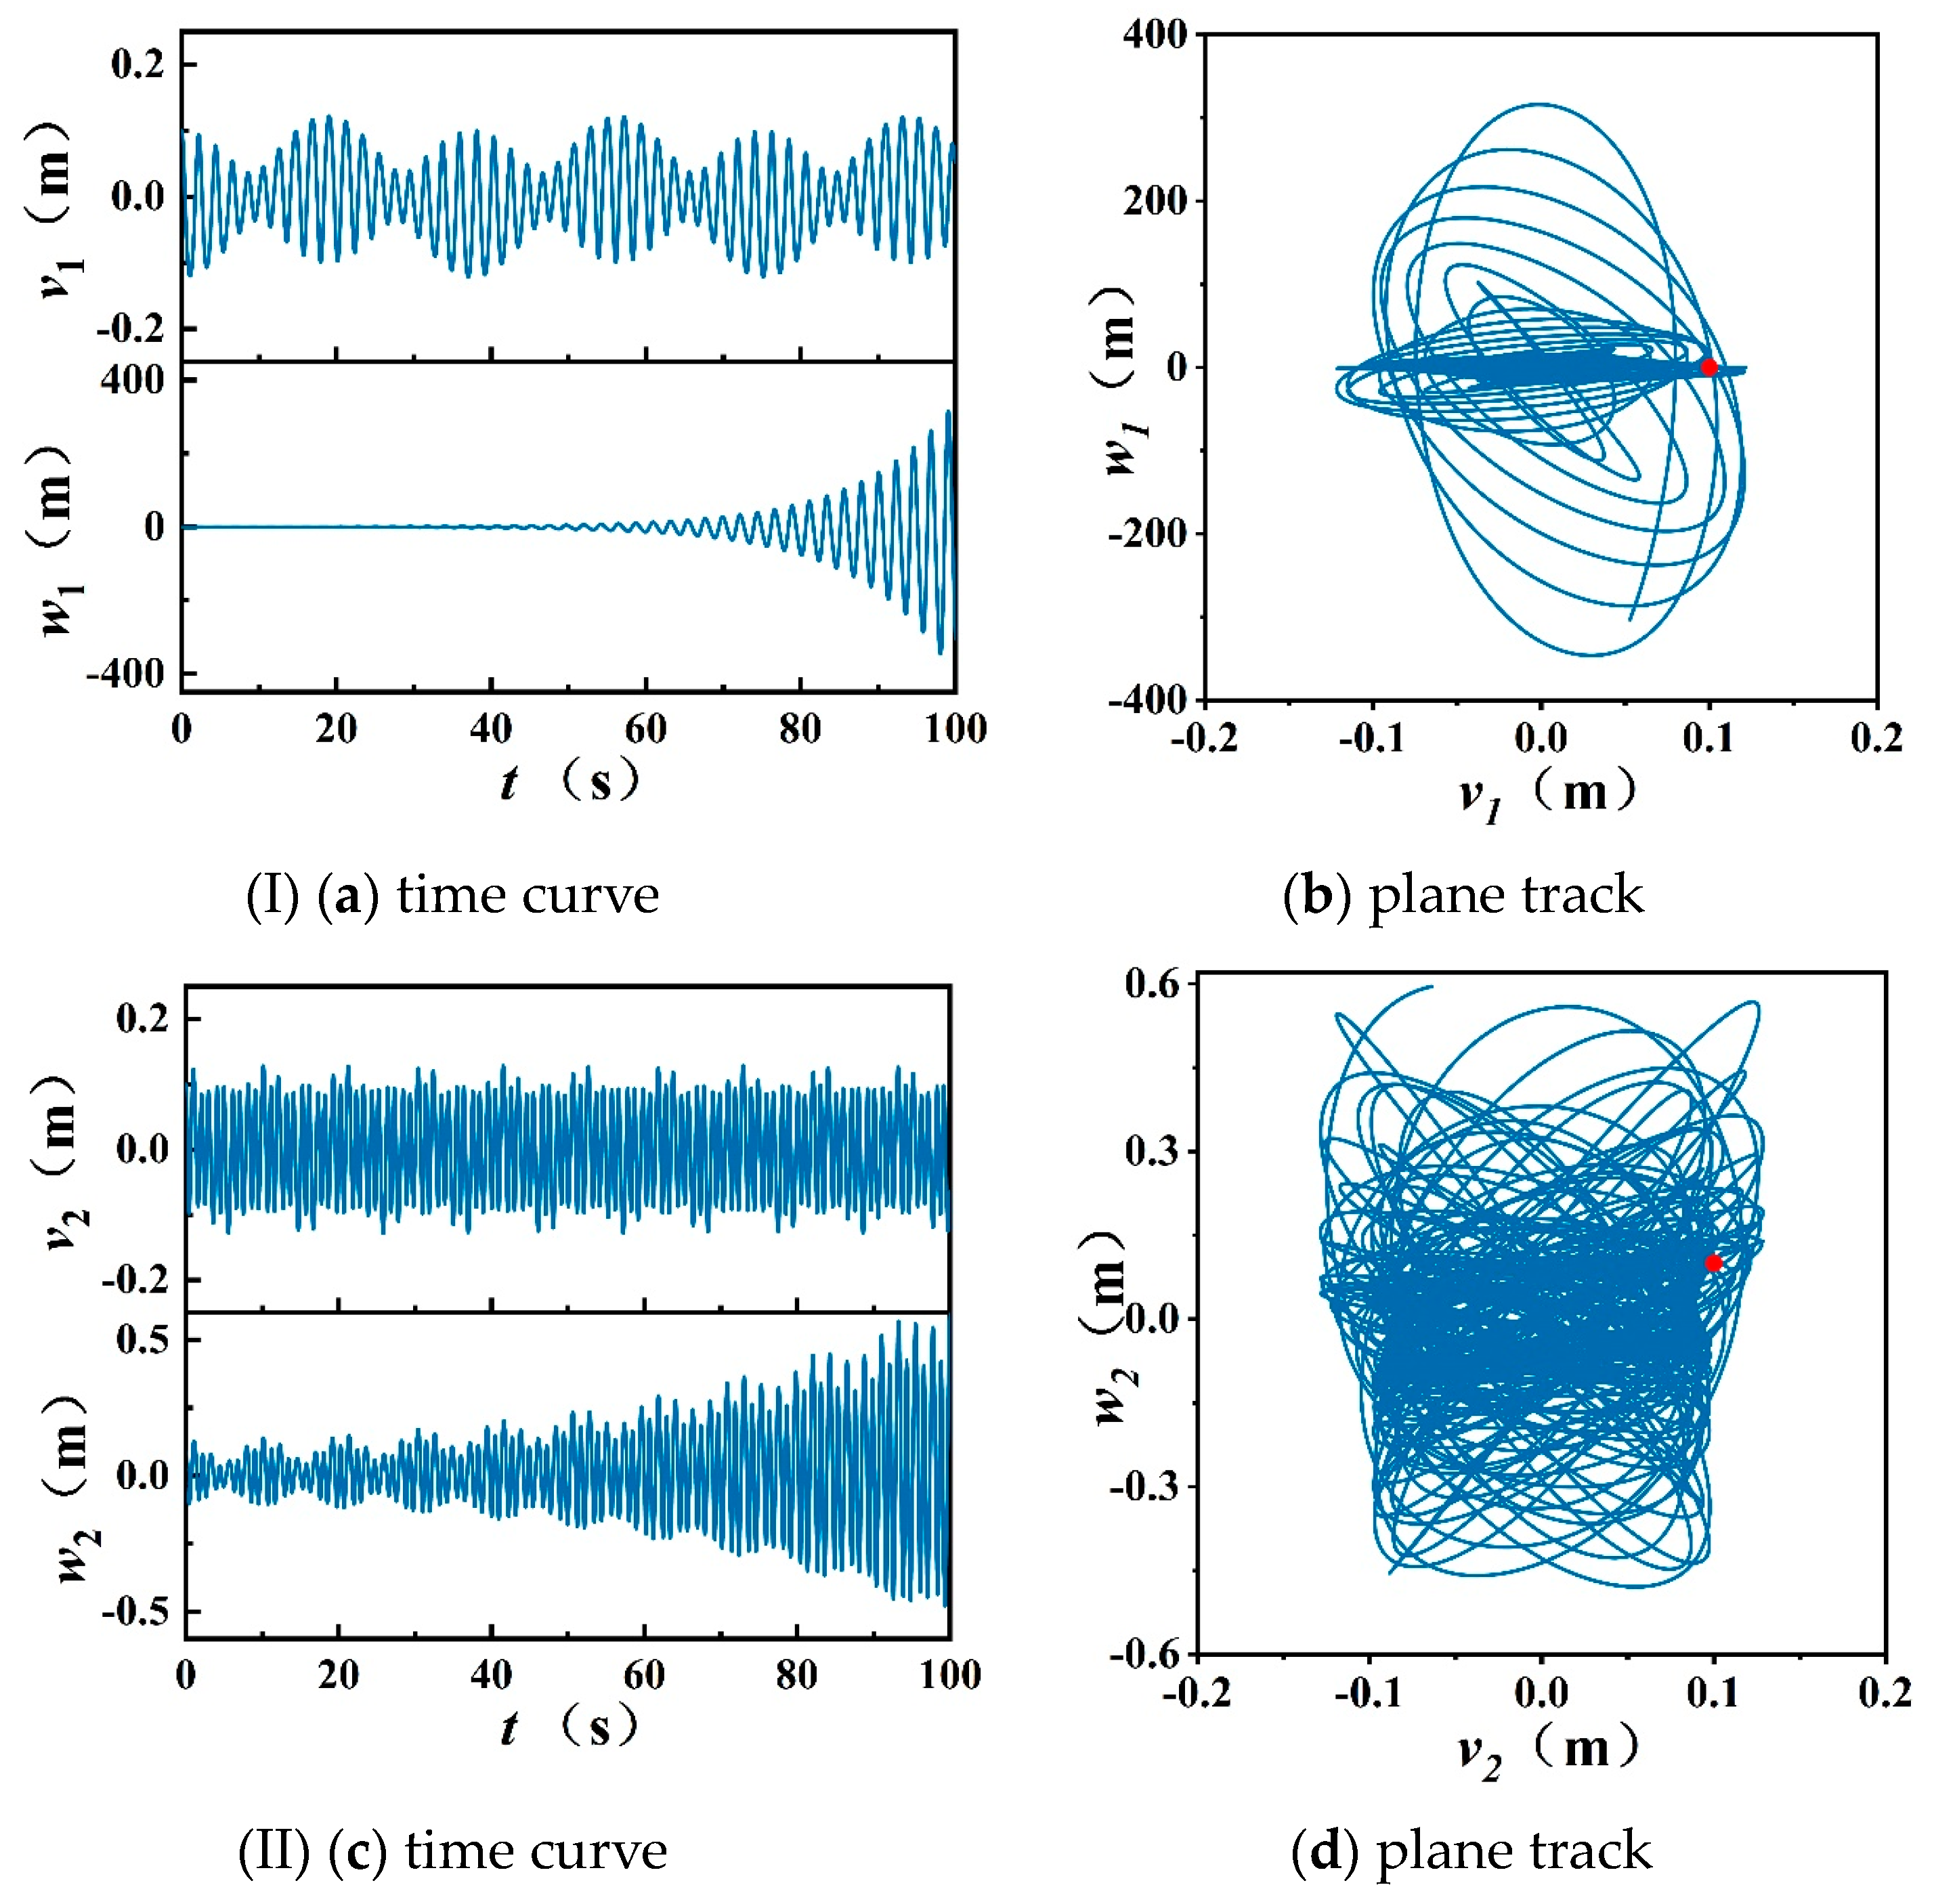
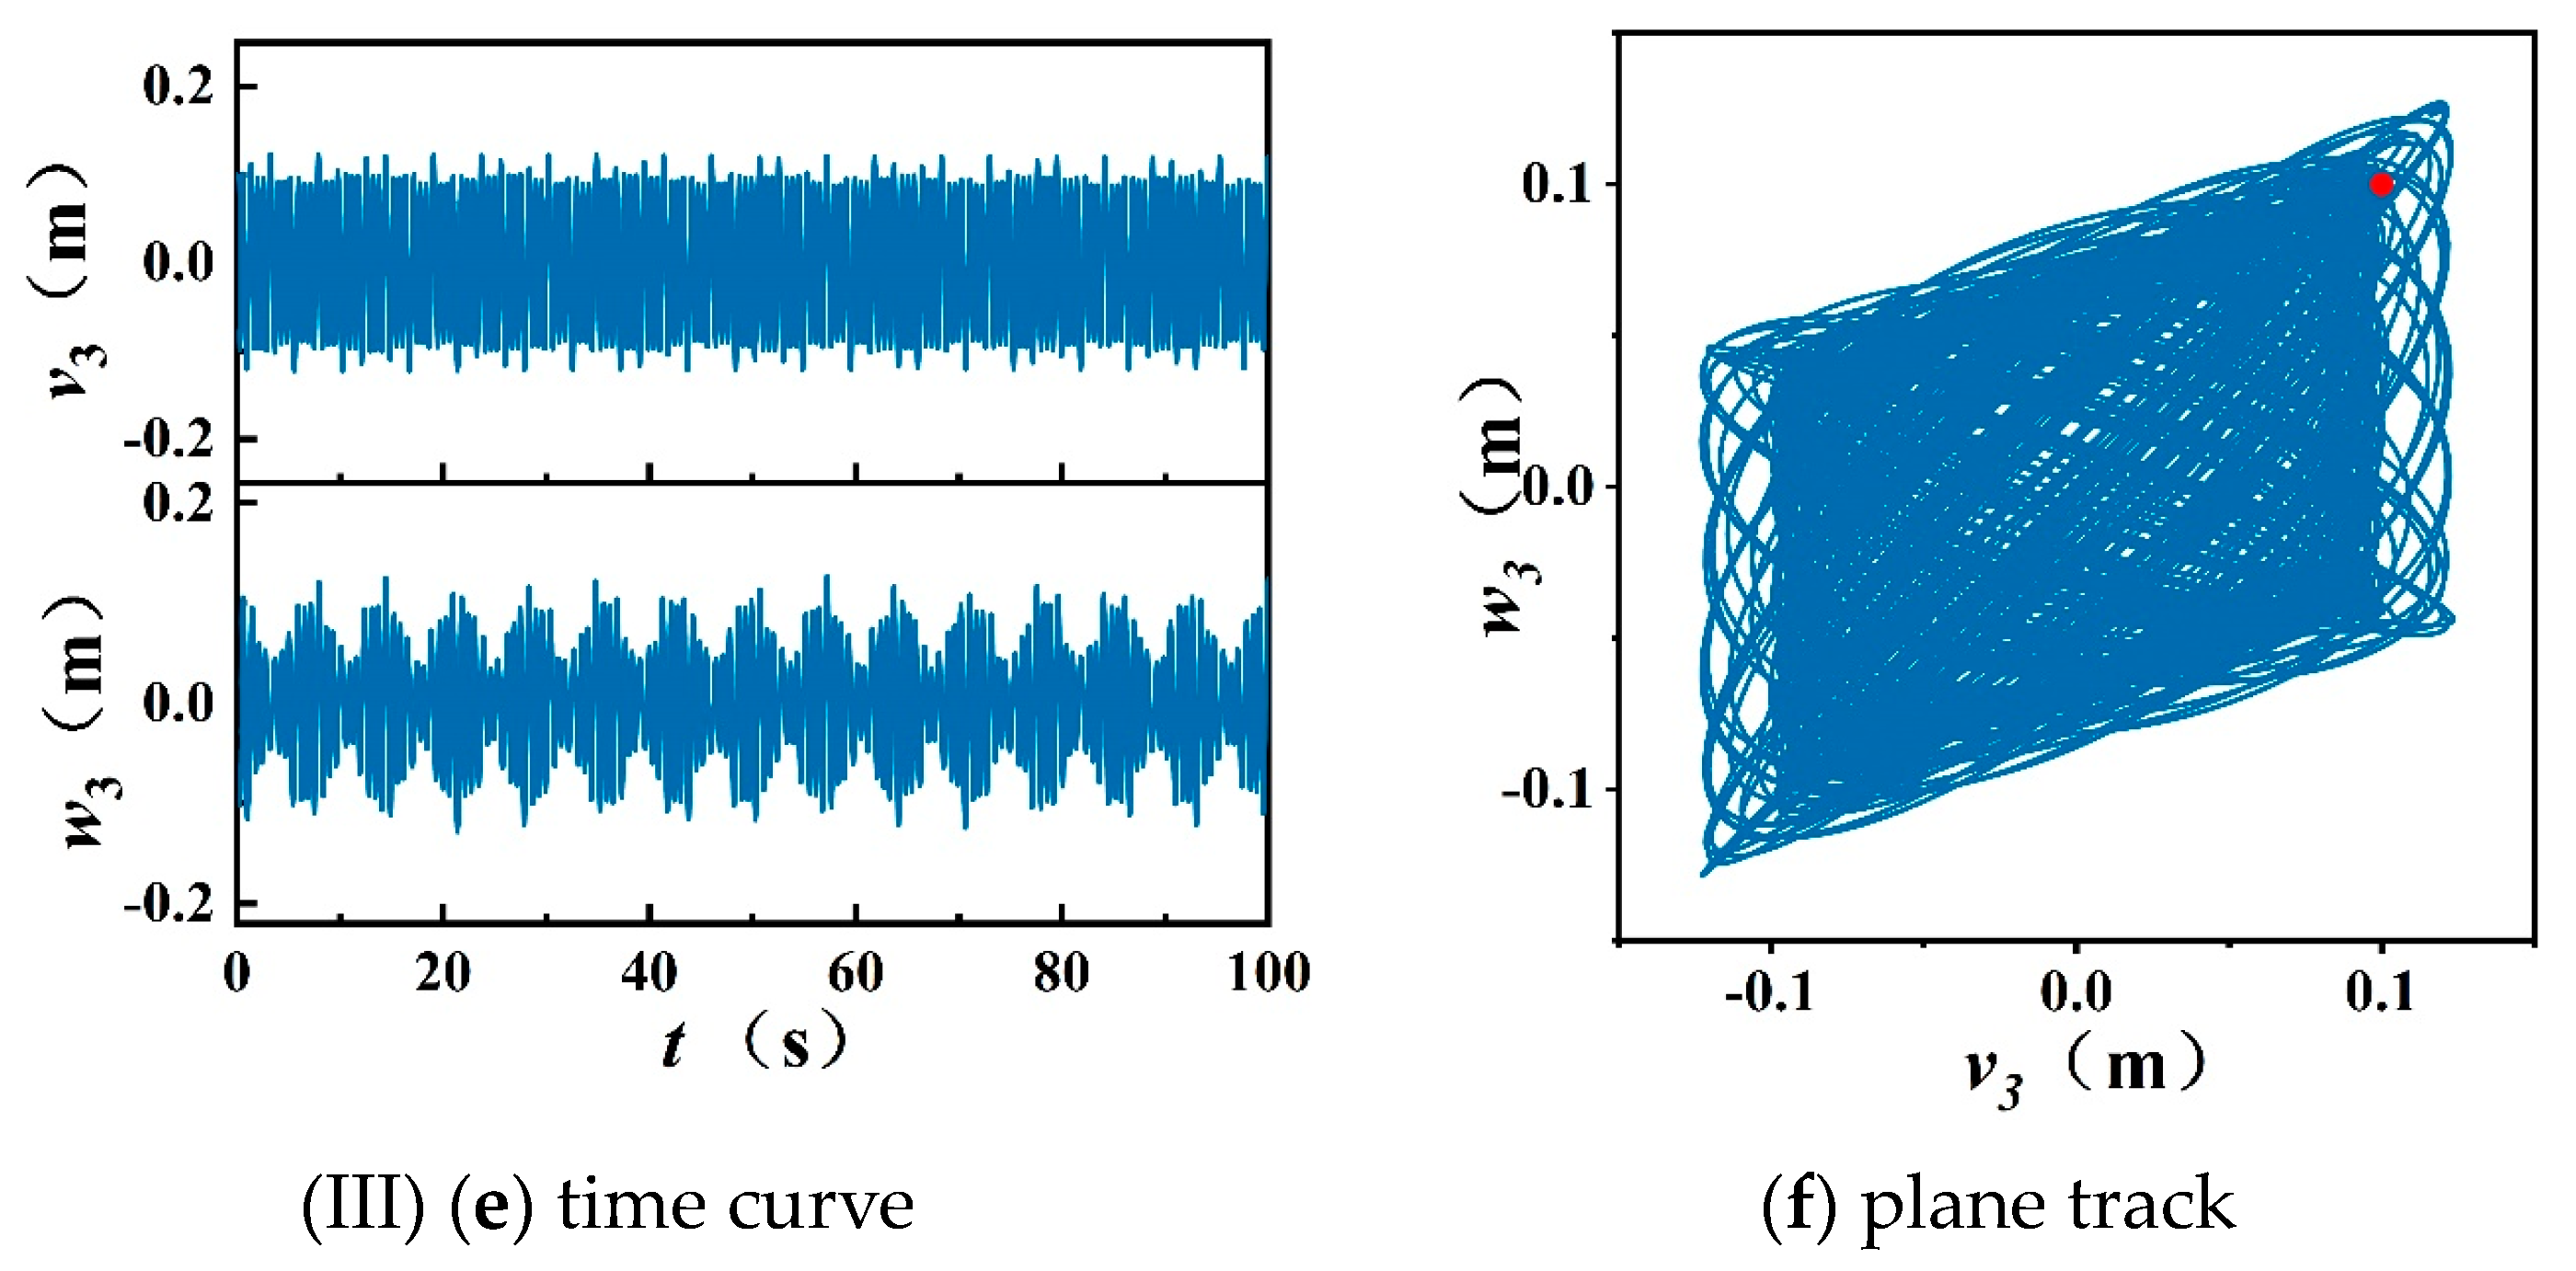
By judging the position of the selected design point in the image of the unstable interval, the displacement time curve and displacement plane trajectory diagram of the anchor cable structure from 0 to 100 s under the corresponding working condition are calculated, and the stability analysis is carried out. It is assumed that the initial displacements of the anchor cable structure in both directions are 0.1 m, the initial velocities are 0 m/s, and the initial displacement points are marked in the form of red dots in the displacement plane trajectory diagram of the anchor cable structure.
Figure 8 shows that when the input frequency ω = 2.8 rad/s at the upper-end point of the anchor cable structure, the design points I and II of the first three order modes of the anchor cable structure fall on the unstable region, and III falls on the stable region. The corresponding displacement time course curves and displacement plane trajectory diagrams are shown in Figure 9.
Figure 9a,c shows the bi-directional displacement curves corresponding to design points I and II, and the amplitude of w n ( t ) shows an amplifying trend with time, which is also called structural instability. Figure 9e is the bi-directional displacement time curve of design point III, whose amplitudes oscillate infinitely in the interval of [−0.2 m, 0.2 m]. The amplitude of w 1 ( t ) design point I increases to about 400 m in 100 s, and the amplitude of w 2 ( t ) design point II increases to about 0.5 m in 100 s. Although the growth rate is slow compared with design point I, it obviously shows an increasing trend, and at 100 s, the amplitude of w 1 ( t ) is larger than that of w 2 ( t ) . Figure 9f shows the displacement trajectory of design point III, which is stable and orderly, and the overall boundary is presented as a parallelogram, indicating that the structure vibrates stably under parametric excitation. Figure 9b,d are the displacement trajectories of design points I and II. Compared with the orderly and stable displacement trajectories of design point III, the displacement trajectories of design points I and II are dispersed and disordered. The w 1 ( t ) of design point I is much larger than v 1 ( t ) , so the displacement trajectory shows a dispersed state, and the boundary of the trajectory develops into an elongated shape; the w 2 ( t ) of design point II grows slowly, and there is not much difference between the amplitude of design point II and that of design point v 2 ( t ) in the time of 100 s, so the displacement trajectory is more disorderly, and it is in the transition stage from Figure 9b–f, and the boundary of the trajectory is trapezoidal in shape. Therefore, the anchor structures at design points I and II are in an unstable state under the parametric excitation, while the anchor structure at design point III is in a stable state, and the above results are consistent with the predictions of the unstable interval images in Figure 8.
The displacement time-range curves and plane trajectories of each design point in Table 4 are similar to those shown in Figure 9, so they are not introduced one by one, and the location of the fall point of each design point on the unstable interval and the convergence of the corresponding structural displacement time-range curves are shown in Table 5. In Table 5, ○ indicates that the design point falls in the stable region, such as the design points I and II in Figure 9; ● indicates that the design point falls in the unstable region, such as the design point III in Figure 9; ✔ indicates that the corresponding structural displacement curves of the design point converge in both directions, such as the design points I and II in Figure 9; ✘ indicates that at least one of the structural displacement curves corresponding to the design point diverges in one direction, such as the design point III in Figure 9.
As shown in Table 5, when a parameter point falls within the stability region, the corresponding structural displacement time-range curve is convergent; on the contrary, if the parameter point falls within the instability region, the corresponding structural displacement time-range curve is divergent. This indicates that the instability interval obtained based on Equations (27) and (28) is applicable to the stability analysis of Equations (21) and (22).
Under the action of parametric excitation, the amplitude of the displacement time-range curve of the anchor cable structure appears to increase significantly and even appears to be unstable. This phenomenon is called parametric excitation resonance, which mainly occurs when the frequency of parametric excitation is about one or two times that of a certain order mode of the structure. Taking the first-order mode as an example, the parametric excitation frequency is ω ω 1 for F2 and ω 2 ω 1 for F4, F5, and F6, and the time-distance curves of the displacement of the anchor cable structure corresponding to these design points are dispersed, i.e., the structure undergoes the parametric excitation resonance, and instability occurs. Among the various cases of parameter resonance in anchor cable structures, parameter resonance is more likely to occur when the parametric excitation is twice the intrinsic mode of the structure. Taking the third-order modes as an example, F10, F11, and F12 all belong to the range of ω 2 ω 3 ; i.e., when ω is in the range of 15.6–21.3 rad/s, the structure is bound to experience parameter resonance, and the interval span of ω is larger than 5.7 rad/s, whereas F7 is a type of ω ω 3 , and when ω is in the range of 6.6–10.2 rad/s, the structure may undergo a parametric resonance ω with an interval spanning less than 3.6 rad/s.

5. Conclusions

This study herein presents a three-way coupled motion analysis model for anchor cable structures, and its accuracy is validated within this work. Subsequently, the impact of the floating weight ratio and sea current incidence angle on the vibration of anchor cables within submerged floating tunnels is examined using an equation. The instability range of anchor cable structures is determined through analysis of Hill’s system of equations relating to the instability parameters, which is then confirmed. The ensuing outcomes are as follows:
(1)
The float-to-weight ratio is a crucial parameter influencing the primary tension of the anchor cable system, whereby a heightened ratio corresponds to an increased tension level. As the initial tension escalates, the displacement response amplitude across various orientations diminishes. Notably, a ratio below 1.4 intensifies the impact on anchor cable displacement, while ratios surpassing 1.4 alleviate such effects;
(2)
The alteration in the flow angle has a direct impact on the intensity of the downstream and transverse references. As the flow angle changes and results in a decrease in the strength of the downstream reference, there is a corresponding increase in the strength of the transverse reference. Consequently, the transverse displacement response of the anchor cable structure aligns with the direction of the transverse reference, leading to a proportional increase;
(3)
The depiction of the instability range derived from Hill’s equation serves as a tool for forecasting the instability of the anchor cable structure when subjected to parametric excitation. When the relevant parameter falls within the instability zone, the structure is deemed unstable; conversely, it is stable. Parametric resonance is incited when the input frequency of the parametric excitation aligns with approximately one or two times the intrinsic frequency of any order of the anchor structure. This resonance leads to a substantial escalation in the displacement of the corresponding structure modes, resulting in instability. Notably, when the parametric excitation frequency is double the intrinsic frequency, the resonance span broadens significantly.
The present study acknowledges the constraint of the Galerkin method, thereby not accounting for the axial orientation of the anchor cable extension. Furthermore, the irregular variability of sea current velocity with depth is duly noted. It is recognized that in practical scenarios, the parameter excitation of the anchor cable deviates from a simplistic sinusoidal function, consequently influencing the vibrational response of the anchor cable. While a constant value is attributed to damping in this investigation, it is acknowledged that actual damping is subject to various influencing factors.

Author Contributions

Conceptualization, writing—original draft preparation, methods, software, validation, formal analysis, investigation, resources, data organization, writing—review and editing, visualization, supervision, J.X.; conceptualization, writing—original draft preparation, methods, project management, funding acquisition, visualization, supervision, S.S.; conceptualization, writing—original draft preparation, methodology, data organization, writing—review and editing, visualization, Y.D. and A.Z.; conceptualization, writing—original draft preparation, methods, software, validation, formal analysis, surveys, resources, data organization, C.G. and F.L. All authors have read and agreed to the published version of the manuscript.

Funding

This research project is supported by multiple funding sources, including the NSFC-Shandong Joint Fund (U2106223), the Shandong Provincial Major Scientific and Technological Innovation Project (2021CXGC010707), and the Shandong Provincial Natural Science Foundation (ZR2022ME092).

Institutional Review Board Statement

Not applicable.

Informed Consent Statement

Not applicable.

Data Availability Statement

The data presented in this study are available from the corresponding author upon reasonable request.

Conflicts of Interest

The authors declare that they have no conflicts of interest.

References

  1. Xiang, Y.; Yang, Y. Challenge in design and construction of submerged floating tunnel and state-of-art. Procedia Eng. 2016, 166, 53–60. [Google Scholar] [CrossRef]
  2. Deng, S.; Ren, H.; Xu, Y.; Fu, S.; Moan, T.; Gao, Z. Experimental study of vortex-induced vibration of a twin-tube submerged floating tunnel segment model. J. Fluids Struct. 2020, 94, 102908. [Google Scholar] [CrossRef]
  3. Ding, H.; Cheng, L.; Li, K. Progress and prospect of research on structural dynamic response of submerged floating tunnels. Tunn. Constr. 2019, 39, 901–912. (In Chinese) [Google Scholar]
  4. Huang, L.-N.; Li, X.; Wu, S. Research progress on key issues of submerged floating tunnel. China Harb. Constr. 2017, 37, 7–10, 70. [Google Scholar]
  5. Seo, S.-I.; Mun, H.-S.; Lee, J.-H.; Kim, J.-H. Simplified analysis for estimation of the behavior of a submerged floating tunnel in waves and experimental verification. Mar. Struct. 2015, 44, 142–158. [Google Scholar] [CrossRef]
  6. Chen, X.; Chen, Q.; Chen, Z.; Cai, S.; Zhuo, X.; Lv, J. Numerical modeling of the interaction between submerged floating tunnel and surface waves. Ocean Eng. 2021, 220, 108494. [Google Scholar] [CrossRef]
  7. Luo, W.; Huang, B.; Tang, Y.; Ding, H.; Li, K.; Cheng, L.; Ren, Q. Numerical Simulation of Dynamic Response of Submerged Floating Tunnel under Regular Wave Conditions. Shock Vib. 2022, 2022, 4940091. [Google Scholar] [CrossRef]
  8. Wang, F.; Li, K.; Huang, B.; Cheng, L.; Ding, H. Experimental Investigation of the Dynamic Behavior of Submerged Floating Tunnels under Regular Wave Conditions. J. Mar. Sci. Eng. 2022, 10, 1623. [Google Scholar] [CrossRef]
  9. Li, Q.; Jiang, S.; Chen, X. Experiment on Pressure Characteristics of Submerged Floating Tunnel with Different Section Types under Wave Condition. Pol. Marit. Res. 2018, 25, 54–60. [Google Scholar] [CrossRef]
  10. Paik, I.Y.; Oh, C.K.; Kwon, J.S.; Chang, S.P. Analysis of wave force induced dynamic response of submerged floating tunnel. KSCE J. Civ. Eng. 2004, 8, 543–550. [Google Scholar] [CrossRef]
  11. Zou, P.X.; Bricker, J.D.; Uijttewaal, W.S.J. Impacts of extreme events on hydrodynamic characteristics of a submerged floating tunnel. Ocean Eng. 2020, 218, 108221. [Google Scholar] [CrossRef]
  12. Yuan, X.; Liu, J.; Zhou, J.; Guo, A. Effect of cable layout on hydrodynamic response of submerged floating tunnel under wave action. Ocean Eng. 2023, 280, 114257. [Google Scholar] [CrossRef]
  13. Cifuentes, C.; Seungjun, K.; Kim, M.H.; Park, W.S. Numerical simulation of the coupled dynamic response of a submerged floating tunnel with mooring lines in regular waves. Ocean Syst. Eng. 2015, 5, 109–123. [Google Scholar] [CrossRef]
  14. Brancaleoni, F.; Castellani, A.; D’Asdia, P. The response of submerged tunnels to their environment. Eng. Struct. 1989, 11, 47–56. [Google Scholar] [CrossRef]
  15. Zou, P.X.; Ruiter, N.; Bricker, J.D.; Uijttewaal, W.S.J. Effects of roughness on hydrodynamic characteristics of a submerged floating tunnel subject to steady currents. Mar. Struct. 2023, 89, 103405. [Google Scholar] [CrossRef]
  16. Xu, W.; Ma, Y.; Ji, C.; Sun, C. Laboratory measurements of vortex_induced vibrations of a yawed flexible cylinder at different yaw angles. Ocean Eng. 2018, 154, 27–42. [Google Scholar] [CrossRef]
  17. Xu, G.; Chen, X.; Xue, S.; Townsend, J.F.; Chen, X.; Tang, M. Numerical assessment of non-uniform terrain and inhomogeneous wave–current loading effects on the dynamic response of a submerged floating tunnel. Ocean Eng. 2023, 288, 115942. [Google Scholar] [CrossRef]
  18. Xu, L.; Fei, G.; Youshi, H. Feasibility study on buoyancy-weight ratios of a submergedd floating tunnel prototype subjected to hydrodynamic loads. J. Mech. (Engl. Ed.) 2015, 5, 750–761. [Google Scholar]
  19. Wang, G.; Zhang, N.; Huang, G. Coupled effect of multi-factor on the vibration of submergedd floating tunnel under impact load. Ocean Eng. 2022, 262, 112181. [Google Scholar] [CrossRef]
  20. Su, Z.B.; Sun, S.N. Seismic Response of Submergedd Floating Tunnel Tether. China Ocean Eng. (Engl. Ed.) 2013, 27, 43–50. [Google Scholar] [CrossRef]
  21. Han, S.M.; Benaroya, H. Nonlinear coupled transverse and axial vibration of a compliant structure 2: Orced vibration. J. Sound Vib. 2000, 237, 874–899. [Google Scholar]
  22. Kims, H.; Yamato, H. An Experimental Study of the Longitudinal Motion Control of a Fully Submerged Hydrofoil Model in Following Seas. Ocean Eng. 2004, 31, 523–537. [Google Scholar]
  23. Bai, J.; Kim, Y. Control of the Vertical Motion of a Hydrofoil Vessel. Ships Offshore Struct. 2010, 5, 189–198. [Google Scholar] [CrossRef]
  24. Mai, J.; Luo, Z.; Guan, B. Vortex agitation response of tension legs in submerged floating tunnel under flow. J. Southwest Jiaotong Univ. 2004, 39, 600–604. [Google Scholar]
  25. Wang, G. Numerical Analysis and Experimental Study on the Structural Response of Submerged Floating Tunnel under Wave Current. Ph.D. Thesis, Southwest Jiaotong University, Chengdu, China, 2008. [Google Scholar]
  26. Liu, Y.; Chen, L. Nonlinear Vibration. Master’s Thesis, Higher Education Press, Beijing, China, 2001. [Google Scholar]
  27. Tang, Y.-G. Advanced Structural Dynamics. Master’s Thesis, Tianjin University Press, Tianjin, China, 2002. (In Chinese). [Google Scholar]
  28. Yang, S.; Yan, C.; Wu, Z. Dynamic response analysis of anchor cables in submerged floating tunnel under random seismic effects. J. Disaster Prev. Mitig. Eng. 2021, 41, 304–310. (In Chinese) [Google Scholar]
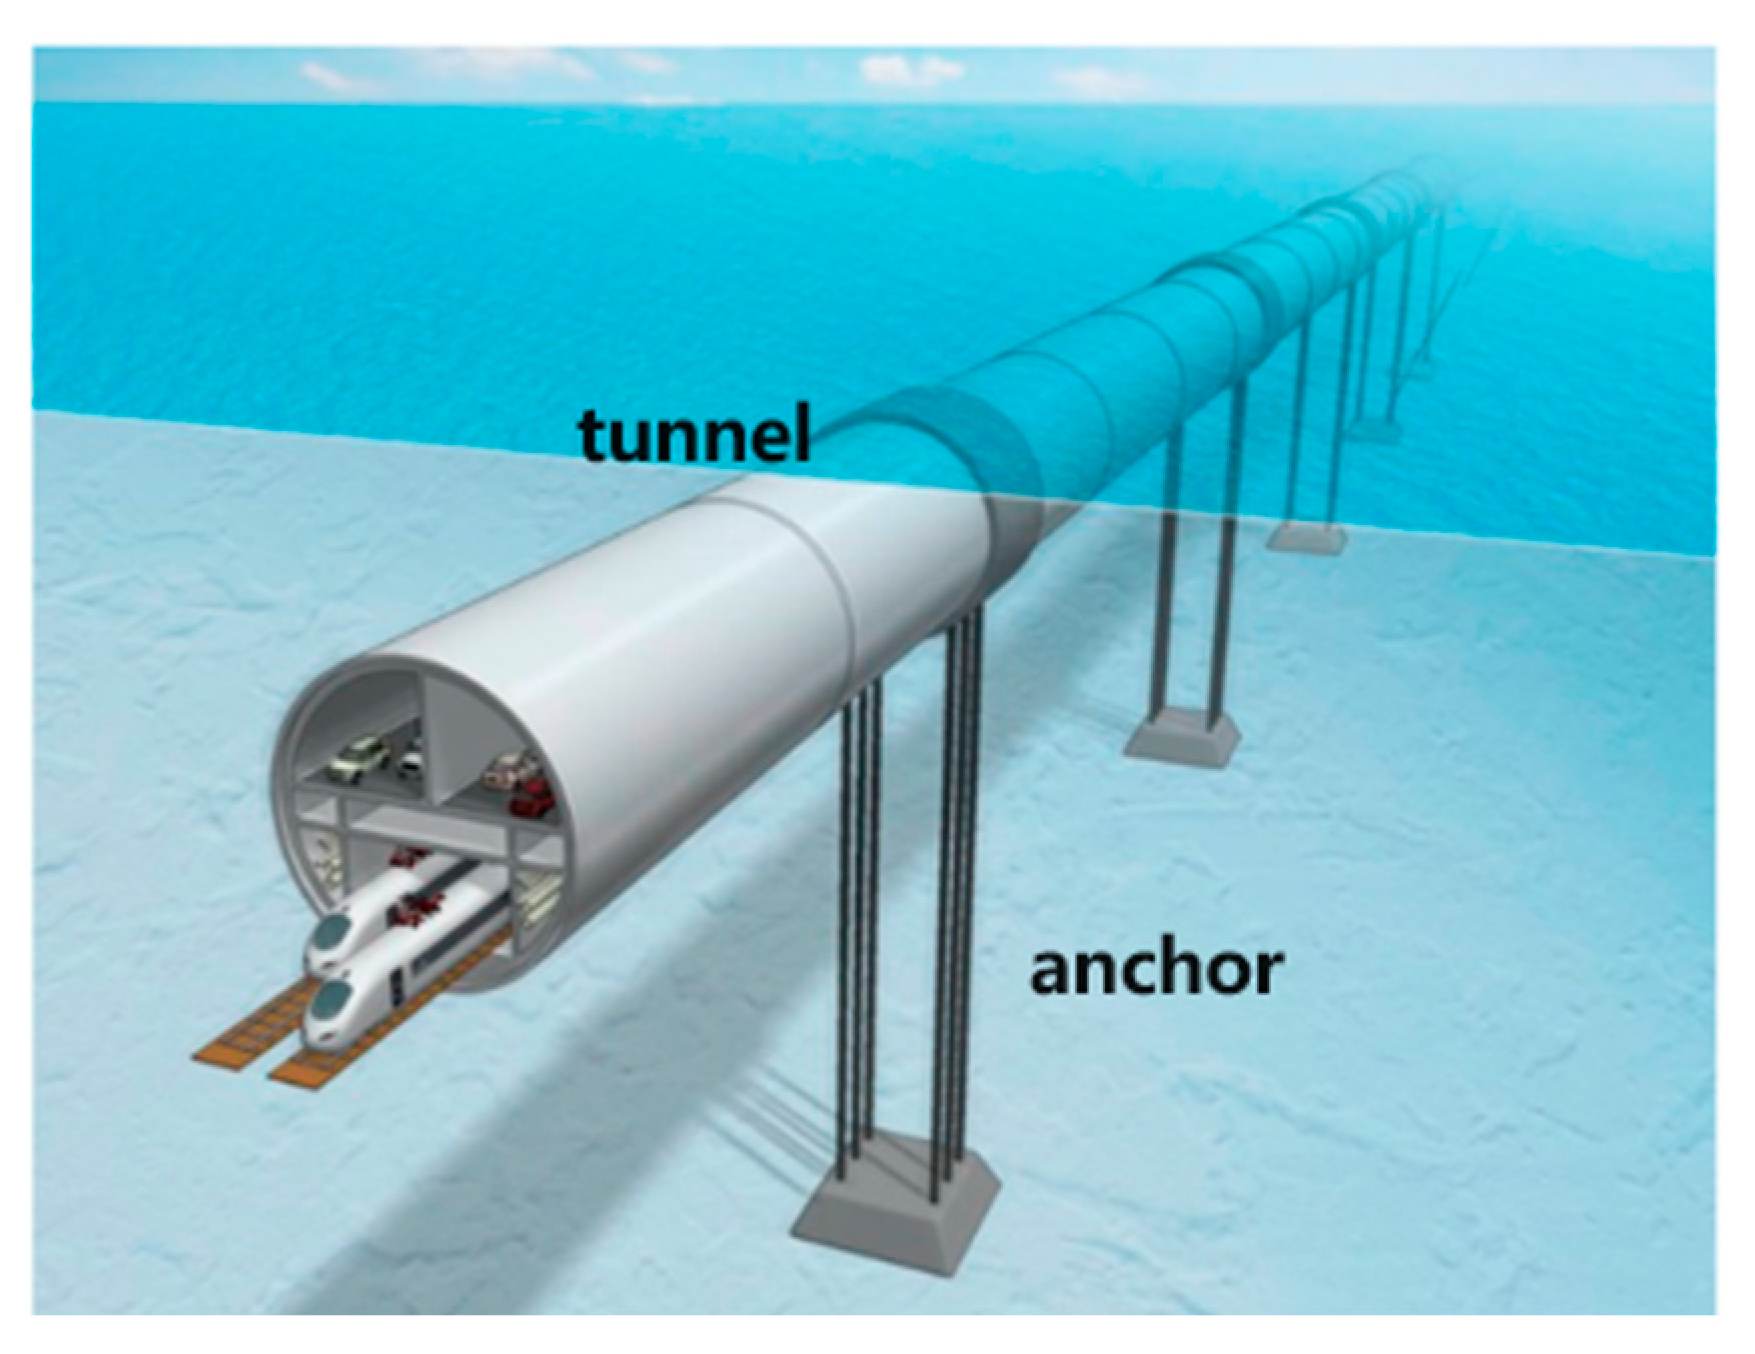
Figure 1. Anchor cable type of submerged floating tunnel mold.
Jmse 12 01478 g001
Figure 2. Three-dimensional view of the beam before and after deformation.
Jmse 12 01478 g002
Figure 3. Schematic diagram of anchor cable vibration model.
Jmse 12 01478 g003
Figure 4. Comparison of time-range curves of the third-order modes of the transverse flow forward of the anchor structure.
Jmse 12 01478 g004
Figure 5. Plot of amplitude value and equilibrium position of mid-span displacement response of anchor structure (U = 0.05 m, V = 2 m).
Jmse 12 01478 g005
Figure 6. Plot of amplitude value and equilibrium position of the mid-span displacement response of the anchor structure (U = 0.03 m, V = 2 m).
Jmse 12 01478 g006
Figure 7. Stimulus instability interval diagram for anchor cable structures.( Blue represents unstable intervals; same below).
Jmse 12 01478 g007
Figure 8. Image of unstable interval (F2: ω = 2.8 rad/s).
Jmse 12 01478 g008
Figure 9. Design point displacement time course curves and displacement plane trajectory diagrams (F2: ω = 2.8 rad/s).
Jmse 12 01478 g009aJmse 12 01478 g009b
Table 1. Correspondence between the buoyancy–weight ratio of the tunnel and the initial tension of the anchor cable structure.
BWRInitial Tension T (×107 N)BWRInitial Tension T (×107 N)
1.10.861.63.55
1.21.581.73.89
1.32.181.84.21
1.42.701.94.48
1.53.162.04.73
Table 2. Schematic values of amplitude for anchor structures with different flow angles.
Working Condition15°45°90°120°180°
c u = 1 A v 1.803.414.323.941.33
c v = 1 A w 5.334.341.833.685.47
c u = 1 A v 0.701.652.341.990.30
c v = 2 A w 2.591.840.481.342.52
c u = 2 A v 2.484.175.114.872.23
c v = 1 A w 7.035.883.215.707.15
c u = 2 A v 0.461.311.911.600.04
c v = 2 A w 1.581.100.300.761.55
Table 3. Parameters of suspended tunnel anchor cable mode.
ParameterSymbol/UnitNumerical Value
Anchor lengthL/m140
DiameterD/m0.5
Densityρ/(kg·m−3)7850
Seawater densityρwater/(kg·m−3)1025
Modulus of elasticityE/Pa2.1 × 1011
Gravity accelerationg/(N·kg−1)9.8
Table 4. Design point coordinates for the first three orders of modes of the anchor cable structure.
Working Condition ω (rad/s)( δ , ε )
IIIIII
F11.4(16.11, 8.68)(66.74, 34.73)(158.78, 78.15)
F22.8(4.03, 2.17)(16.68, 8.68)(39.69, 19.53)
F34.4(1.63, 0.87)(6.75, 3.51)(16.07, 7.91)
F45.4(1.08, 0.58)(4.49, 2.33)(10.67, 5.25)
F55.9(0.90, 0.48)(3.75, 1.95)(8.94, 4.40)
F66.6(0.73, 0.39)(3.01, 1.96)(7.15, 3.52)
F78.4(0.45, 0.24)(1.85, 0.96)(4.41, 2.17)
F810.2(0.30, 0.16)(1.26, 0.65)(2.99, 1.47)
F913.8(0.17, 0.09)(0.69, 0.36)(1.63, 0.80)
F1015.6(0.13, 0.07)(0.54, 0.28)(1.28, 0.63)
F1116.2(0.12, 0.06)(0.50, 0.26)(1.19, 0.58)
F1221.3(0.07, 0.04)(0.29, 0.15)(0.69, 0.34)
Table 5. Stability and convergence of the anchor structure at each design point.
Working ConditionIIIIII
StabilityConvergenceStabilityConvergenceStabilityConvergence
F1
F2
F3
F4
F5
F6
F7
F8
F9
F10
F11
F12
Disclaimer/Publisher’s Note: The statements, opinions and data contained in all publications are solely those of the individual author(s) and contributor(s) and not of MDPI and/or the editor(s). MDPI and/or the editor(s) disclaim responsibility for any injury to people or property resulting from any ideas, methods, instructions or products referred to in the content.