Article

Sediment Types with Alternation of Sandy and Rocky Shores Influence the Distribution of Clams in an Area Characterized by High-Energy Hydrodynamic Conditions

by
Jean-Claude Dauvin
1,*,
Olivier Basuyaux
2,† and
Jean-Philippe Pezy
1
1
UFR des Sciences, Université de Caen Normandie, CNRS UMR 6143 M2C, 24 Rue des Tilleuls, F-14000 Caen, France
2
SMEL, Centre Expérimental, ZAC Blainville-sur-Mer, F-50560 Blainville-sur-Mer, France
*
Author to whom correspondence should be addressed.
Current address: M2e, 22 La Boivinerie, F-50560 Blainville-sur-Mer, France.
J. Mar. Sci. Eng. 2024, 12(9), 1488; https://doi.org/10.3390/jmse12091488
Submission received: 25 July 2024 / Revised: 18 August 2024 / Accepted: 21 August 2024 / Published: 28 August 2024
(This article belongs to the Section Marine Ecology)

Abstract

:
To identify short-term changes (14–69 days) in the adult abundance of two closely related shallow-burrowing bivalves (Ruditapes spp.), a series of observations and displacement assessments were made during the 2014–2018 period. This study was initiated to estimate the natural displacement of clams in a high-energy hydrodynamic tidal regime along the western coast of Cotentin in Normandy, France (western basin of the English Channel, northeastern Atlantic). The raking of several different surfaces and sediment types at successive periods separated by about one month shows clam displacement in most of the selected quadrats. The mean abundance displacement derived from all the observations carried out in 2014, 2016 and 2018 is estimated at 1.8 ind·m−2 mo−1, a value that should be compared with the mean density of between 2.0 and 12.5 ind·m−2 along the western coast of Cotentin. These displacements are confirmed with experiments using clams marked with an inox metal washer and detected with a Minelab Sovereign GT multi-frequency metal detector. During the course of the experiments, about 20% of the clams show a displacement. Most of the displacements are moderate, being less than 2 m, but some clams could be displaced by more than 20 m.

1. Introduction

The physical transport of bottom sediments on intertidal soft-bottom habitats is known to have a substantial effect on the spatial distribution patterns of marine invertebrates, in particular infaunal bivalves [1]. These processes have been well documented for post-larvae and juveniles, mainly for dense bivalve populations in muddy and sand flat habitats such as in the case of Cerastoderma edule (Linnaeus, 1758), Macoma balthica (Linnaeus, 1758), or Mya arenaria Linnaeus, 1758, in European or North American waters [2,3,4,5,6,7,8,9,10] or other bivalves in other intertidal zones of the world-wide ocean [11,12,13,14]. Ref. [4] stressed that the passive transport of Mya arenaria across the sediment surface led to a potential reduction in the effects of overfishing on commercial clam beds.
The native grooved carpet shell clam Ruditapes decussatus (Linnaeus, 1758) and the introduced Manila (=asari) clam R. philippinarum are among the main target species for recreational fishing on the west coast of Cotentin (western basin of the English Channel) [15]. This latter species was introduced in the 1970s to be cultivated in several zones on the French side of the English Channel and on the Atlantic coast [15]. One of the consequences of this introduction is that the Manila clam has now supplanted the native European clam in many estuaries and lagoons [15,16,17,18,19,20] and has become an important resource for recreational and professional fishers on the western coast of Cotentin [20]. Owing to the increase in the resource, there has been increased pressure on this target species, especially when harvesting is carried out with clam rakes not only by professional but also by recreational fishers [15,20].
Intertidal sediment and fauna transport has been described at spatial scales varying from centimetres to kilometres [21,22,23,24]. From their studies of an intertidal sandflat near Manukau Harbour (Manukau, New Zealand), ref. [21] demonstrated that natural sediment reworking replaces about 2–3 m of sand per day. They also showed that the fauna exhibits passive behaviour similar to sand grains, exhibiting a pattern of alternating erosion–deposition. In the same area, ref. [11] observed the post-settlement transport of two bivalves Macomona liliana (Iredale, 1915) and Austrovenus stutchburyi (W. Wood, 1828) under strong hydrodynamic conditions, i.e., increased wind-generated wave activity. In the same area and for the same species, Ref. [12] had shown that juvenile bivalves were dispersed over scales of metres within one tidal cycle. Furthermore, these authors show that the dispersal of these two species is decoupled from sediment bedload transport. Significant positive correlations between sediment transport and macrofauna density are generally considered to be consistent with passive movement as part of the bedload and suspended load [3,4,21].
Such displacements have also been documented for the Manila clam Ruditapes philippinarum (Adams and Reeve, 1850) in its native area. In the Banzu tidal flat in Tokyo Bay, Refs. [22,23] showed that the dispersal of young Manila clams (26–28 mm) was related to changes in the bottom level due to wave action.
In her review of the dispersal of intertidal invertebrates mainly molluscs, Ref. [24] pointed out that dispersal affected not only the post-larvae and juveniles but also the adults. Extremely strong storms could disperse intertidal macrofauna into distant subtidal areas. Nevertheless, this author stressed that the dispersal of adult macrofauna occurs mainly at a small scale. Adults and juveniles of the bivalve Paphies australis (Gmelin, 1791) have been observed in the intertidal zones of New Zealand; the bivalves were buoyed up by the secretion of long mucus threads [25]. The number of drifting bivalves caught in traps was higher during the flood tide than ebb tide, and there was only a small difference between spring and neap tides. Ref. [25] observed that large epiphytic algal growths on the shell favoured displacement of the bivalves with the tidal currents.
In summary, a review of the literature on the role of physical–biological coupling in the displacement of sediment and post-larvae, juvenile, and adult bivalves shows that such interactions are common in both soft-bottom intertidal and subtidal areas. The displacement of organisms can be passive—comparable to sediment grain transport—or active such as in bivalves with the secretion of byssus threads or in other species showing adaptation of mucus secretion associated with mechanisms for opening/closing valves [26,27], and also with burrowing behaviour as observed in most infaunal bivalves.
To improve our knowledge of this resource on the western coast of Cotentin, the 3POC (Pêche à Pied à la Palourde sur la Côte Ouest du Cotentin) programme was implemented in 2014 to study the distribution of both species, as well as their density, stocks and fishing pressures [15,20]. Ref. [15] hypothesized that adult Ruditapes clams could be transported along with sand sediment to populate fishing areas in a zone with high-energy hydrodynamics. Moreover, the different sediment types on this heterogeneous coast with an alternation of sandy and rocky shores influence the distribution of bivalves including clams in an area characterized by high-energy hydrodynamic conditions. The displacement of adult clams has been detected mainly in non-cohesive sand sediment [15,20]. In this area of the western basin of the English Channel, during spring tides, it is possible to observe the displacement of intertidal sand dunes with a volume of between 25,000 and 30,000 t and crests higher than 2 m [28].
The aim of this study is to present a series of observations and displacement experiments on Ruditapes spp. clams during the 2014–2018 period, to determine the effect of raking on displacement and to assess natural displacement.

2. Material and Methods

2.1. Sampling Sites

Located in the Normano-Breton Gulf, the wide intertidal zone of the western coast of Cotentin comprises a mixture of sandy, gravelly, sandy–rocky and rocky substrates. The upper beach is composed mainly of sand dunes undergoing intense erosion and sandy intertidal dunes and flats subject to rapid displacement owing to high-energy hydrodynamics in a megatidal environment (tidal range > 12 m during equinoctial spring tide) [15,28,29,30,31]. The upper part of the foreshore from Blainville-sur-Mer in the north to Saint-Martin de Bréhal in the south (Figure 1) is made up of sand, and then a succession of coarse sand and rocky habitats farther seaward [22,27]. The clam sampling sites were located on the intertidal zone about 1–2 km from the tide line, being accessible at each mean spring tide.

2.2. Clam Sampling Strategies

Clams were sampled during four periods between 2014 and 2018 at three main sites (Figure 1): Blainville-sur-Mer (B), Agon-Coutainville (A) and Saint-Martin-de-Bréhal (S). Clams were raked with a professional rake (16.5 cm width; seven teeth with length 7 cm; distance between teeth 2.8 cm), over the entire surface and to a 15 cm depth [15]. The target clam species were identified and their maximum length was measured using a digital calliper with a precision of 0.05 mm.

2.2.1. Quadrat Raking Method

2014 Sampling

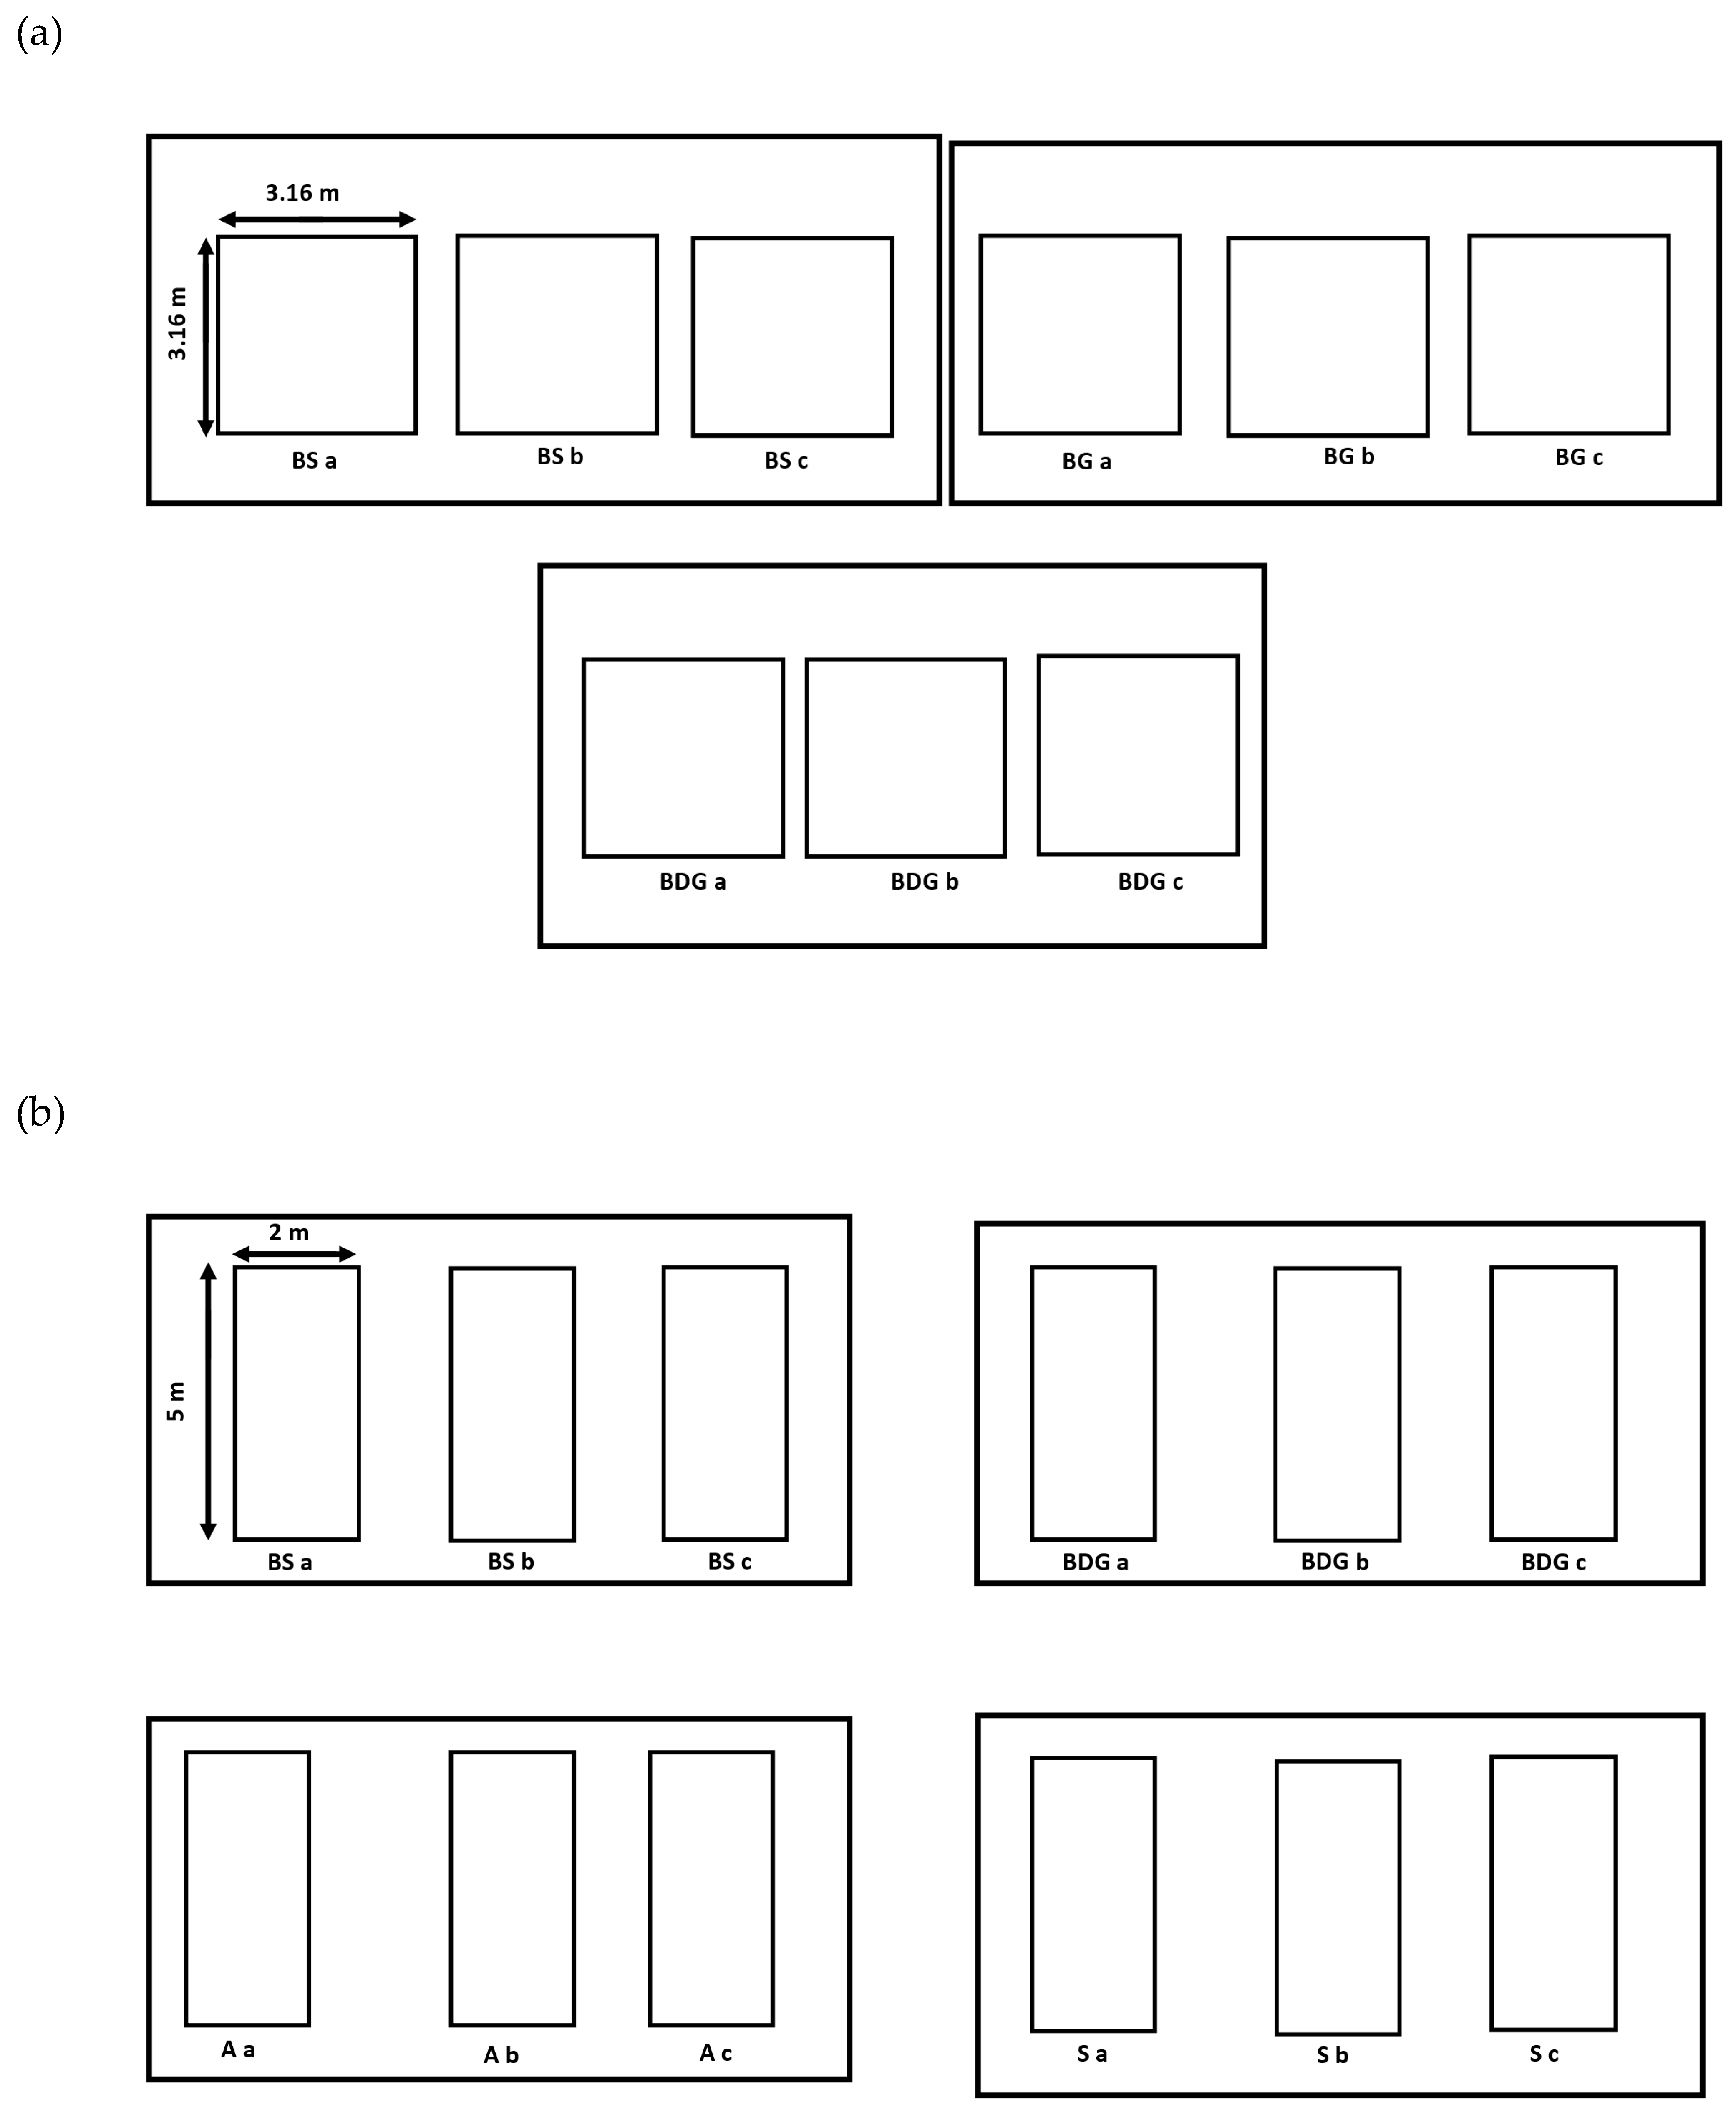
To assess the displacement of adult clams at B in 2014, three sediment types were sampled: sandy habitat (BS), gravelly habitat (BG) and deep gravelly habitat (BDG). For each sediment type, three stations (a, b, and c) with a surface area of 10 m2 (3.16 m × 3.16 m) were randomly delimited and raked at T0 (Figure 2a) [22]. For BS and BDG, the initial (T0) and final (T1) rakings were carried out on 18 February and 18 March versus 3 March (T0) and 31 March (T1) for BG. Before raking at Blainville-sur-Mer, sediment was sampled by core haphazardly from each station in the three sediment types. At the laboratory, the samples were dried in an oven at 60 °C for 24 or 48 h and passed through a column of 32 sieves using a vibrating sieve (60 amplitudes per min) for 15 min.
Then, three main categories of sediment were defined: silt–clay (<63 mm), sand (63–500 µm), and coarse sand and gravel (>500 µm). The mean percentages (±95% confidence interval) of particle size for silt–clay, sand and gravel were 0.45 ± 0.17, 24.00 ± 2.65 and 75.57 ± 2.54 for the sandy habitat, 0.70 ± 0.10, 15.60 ± 5.00 and 83.71 ± 5.07 for the gravelly habitat, and 0.77 ± 0.04, 8.90 ± 3.62 and 90.34 ± 3.58 for the deep gravelly habitat [15].
All clams were collected visually (hand-picked) directly by rakers rather than by sieving the different types of sediment from each station within a site.

2016 Sampling

To test the displacement of adult clams at the four sites (BS, BDG, A and S) in 2016, three stations of 10 m2 (5 m × 2 m) were selected randomly and raked with a professional rake (Figure 2b). At BS and BDG, three stations a, b, and c were raked on 26 February (T0), 23 March (T1) and 25 April (T2). At the A site, three stations a, b, and c were raked on 7 March (T0) and on 6 April (T1), and at S, three stations a, b, and c were raked on 8 March (T0) and 7 April (T1). The sediment was composed of gravel and sandy gravel at A and muddy sandy gravel at S [20]. All clams sampled were visually handpicked by rakers as described above.

2018 Sampling

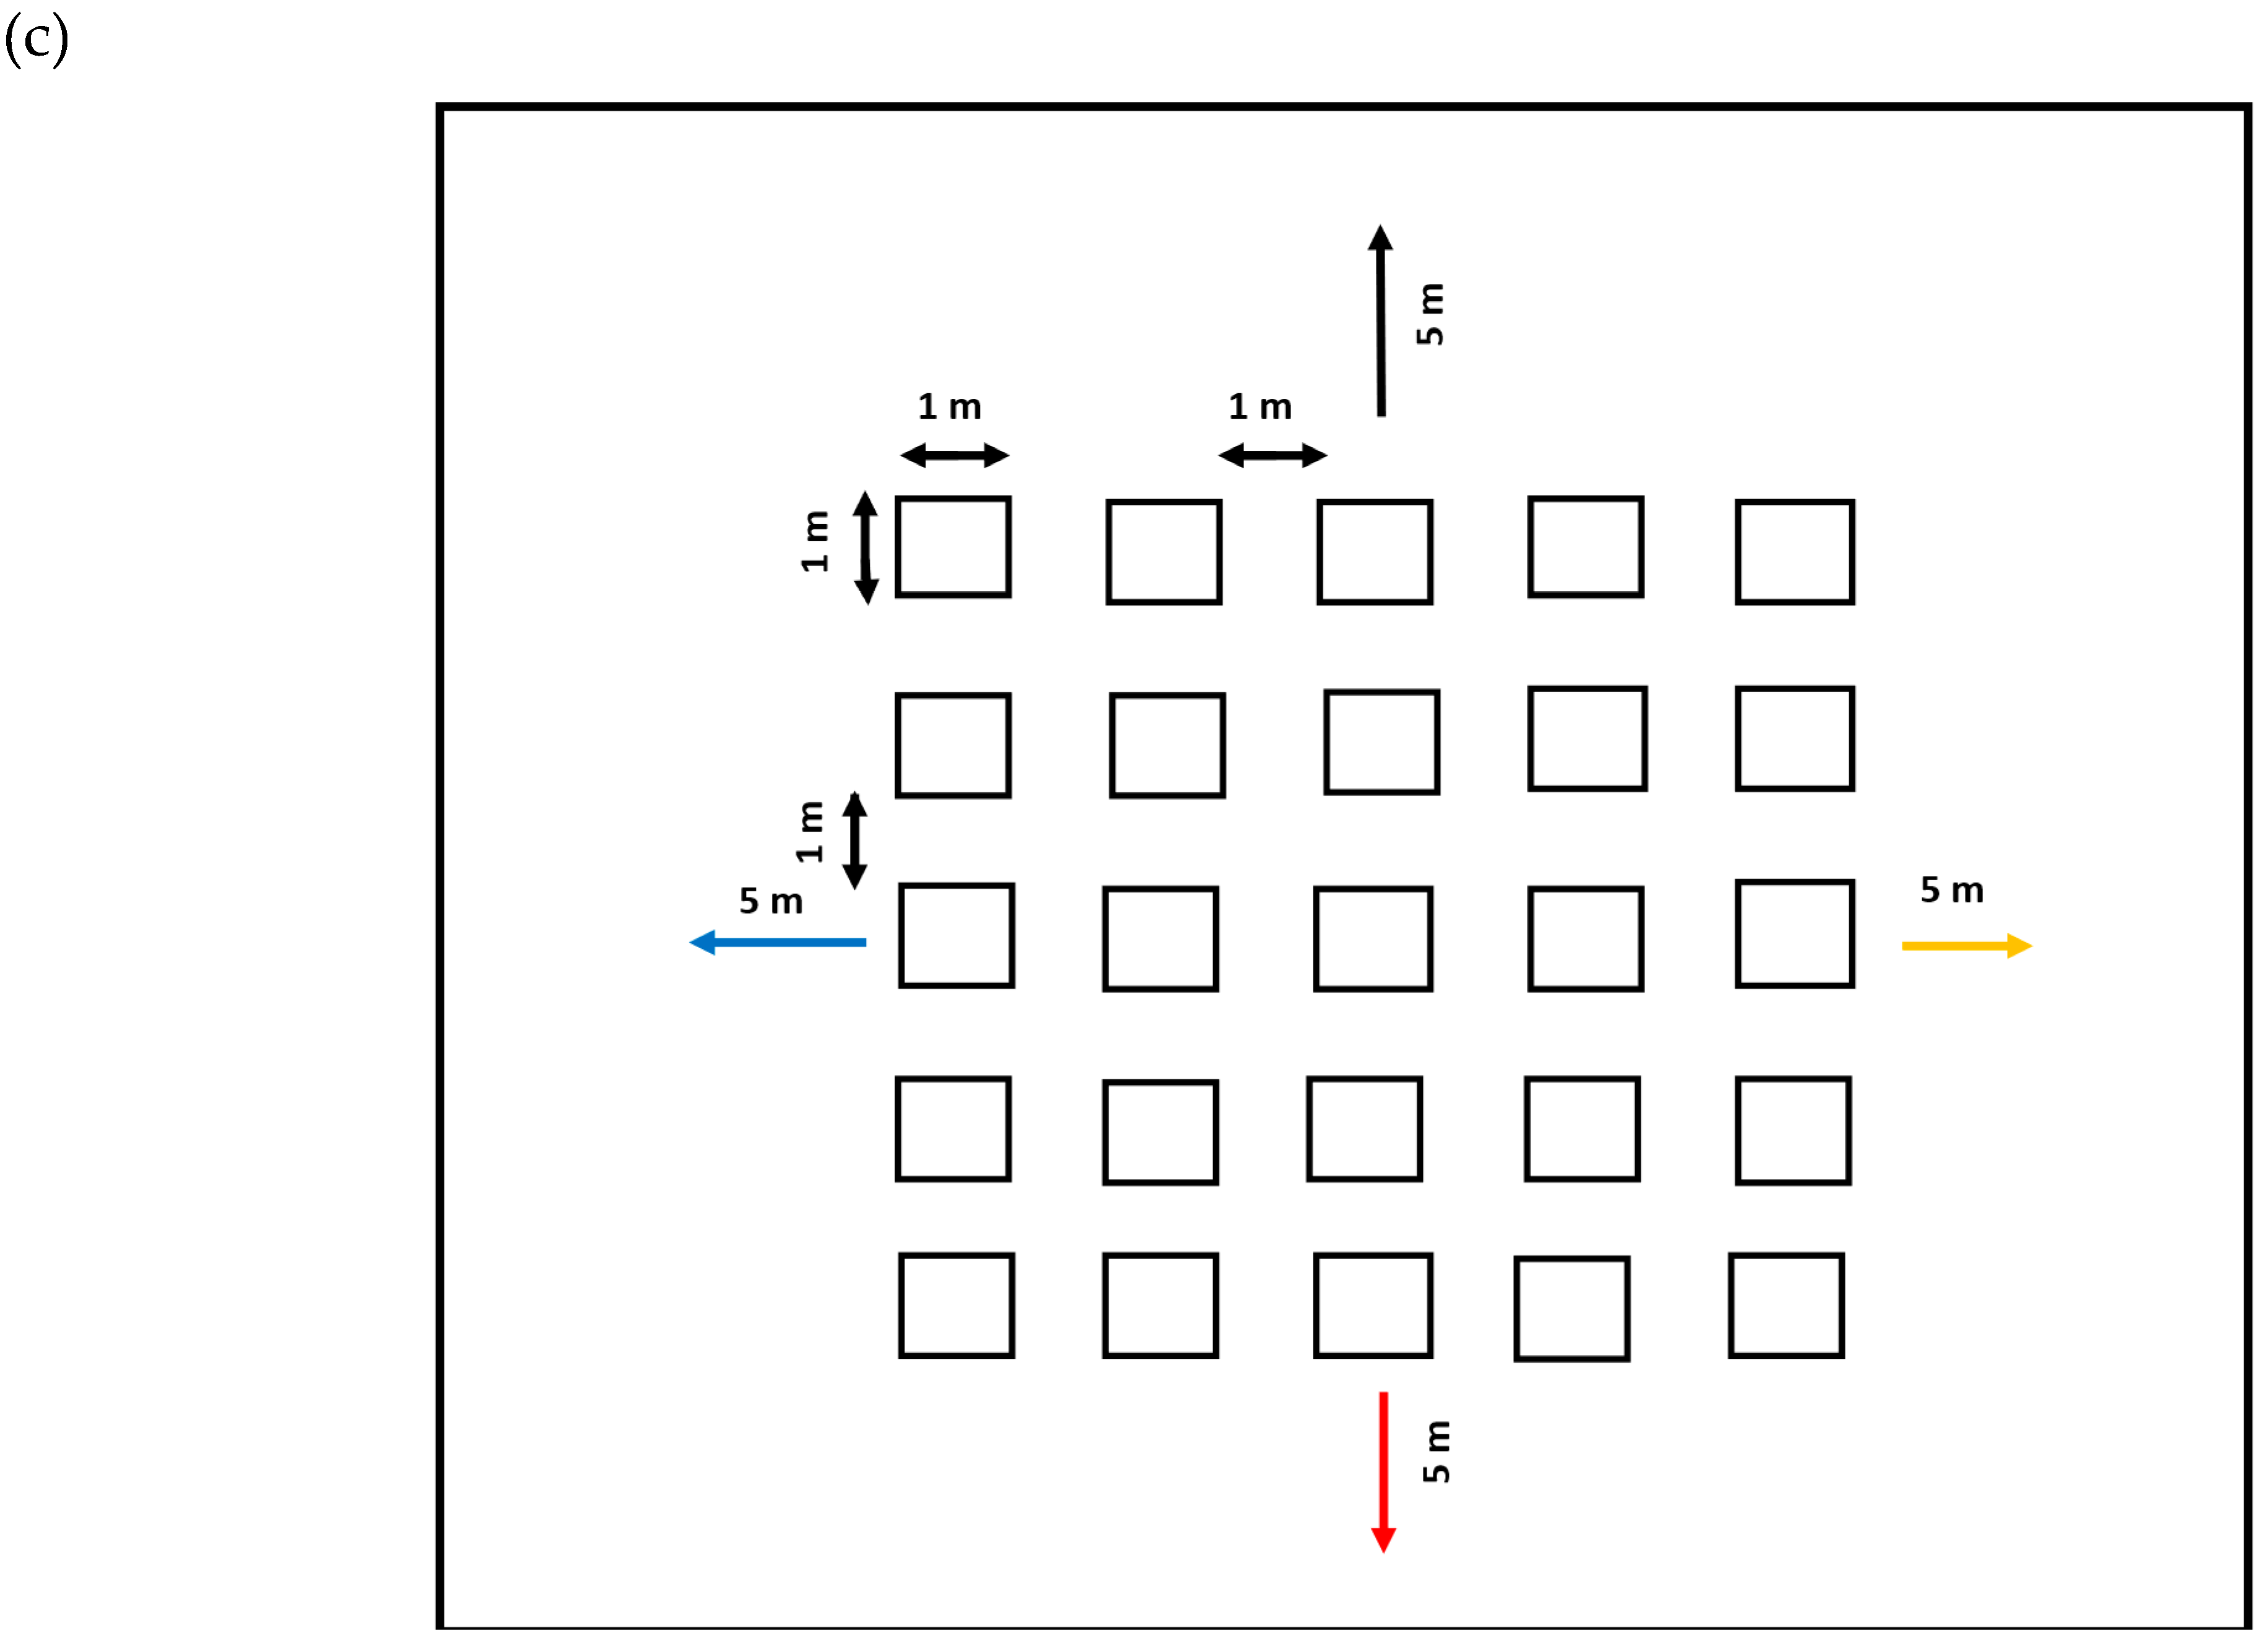
To assess natural displacement, on 18 January 2018, a 9 m × 9 m quadrat was deployed at the sand site of Blainville-sur-Mer (BS, Figure 1). This quadrat contained 25 squares of 1 m per side, with each square being separated from its neighbour by 1 m. Each square was raked with the same sampling design as in 2014 and 2016 (Figure 2c). The raked sediment was collected with a shovel, deposited on a 5 mm mesh sieve and sieved to collect all the clams living in the 25 sampled squares.

2.2.2. Mark–Recapture Method

2017 Displacement Assessment

Displacement assessments were set up in 2017 to improve our understanding of the movement of clams on the intertidal zone of the sand site at Blainville-sur-Mer (BS) and Agon (A). Clams were marked with an inox metal washer, as carried out by [32] to monitor longshore movement in the bivalve Donax serra Röding, 1798, and placed on both of the experimental sites by hand (Figure 3). A Minelab Sovereign GT multi-frequency metal detector (1.5 to 30 kHz) with a 35 × 25 cm elliptical disc was used to track changes in the positions of clams after several days. The efficacity of this tool was established previously by O. Basuyaux.
Two hundred clams were caught and 62 empty shells were collected from the Blainville-sur-Mer site on 19 May 2017 and divided into two homogeneous batches (100 live and 31 dead). An inox metal washer (1.47 g, diameter 16 mm) was attached to each shell using a putty glue (Sikaflex type) (Mastic-colle Sikaflex Pro 11 FC, Manutan, Paris, France) and each clam was numbered with a marker. The two valves of the dead clams were closed with the same putty glue and painted yellow to distinguish them from the live clams.
At the beginning of the displacement test, the wet weight of live clams was 23.8 ± 6.2 g, with a mean length of 42.8 ± 3.8 mm, while the wet weight of dead clams was 23.9 ± 4.8 g with a mean length of 42.9 ± 4.8 mm; in summary, the size and the mass of both batches of clams were similar.
One hundred live clams and 31 dead clams collected from B were buried in the sediment on sites BS and A on 25 May 2017. A 60 cm long rebar was implanted in the sediment to locate the site accurately. A one-metre radius was drawn around the rebar (Figure 3). The clams were repositioned infaunally equidistant from the circle in all directions by making a small pit in the sediment and taking care to place both syphons of the clams upwards. Clams were initially harvested within the 1 m circle with a rake. Then, raking was continued from outside the 1 m circle up to the 2 m circle and, finally, clams were located using the metal detector. The distance of the clams to the centre of the 1 m circle and their orientation were measured on 8 June 2017 after a period of 14 days.
In a second displacement assessment, on 14 June 2017, a batch of 100 live clams were placed on the BS and A sites again. The clams were collected on 7 August 2017, after a period of 54 days, following the same protocol used during the first displacement assessment.

2018 Displacement Assessment

On 18 January 2018 at the BS site, 98 clams each (mean shell length > 40 mm) were placed linearly at 5 m on each side of the large quadrat to assess their natural displacement; they were sunk in a small pit in the sediment and taking care to place both syphons of the clams upwards (Figure 2c). Clams were painted in four colours (black, yellow, red and blue) for each side of the large quadrat and then numbered; they were also marked with an inox metal washer. On 27 February and 28 March 2018, like in 2017, a metal detector was used to track net changes in the positions of the clams, i.e., 40 and 69 days after implantation in the sediment.

2.3. Environmental Data

Two types of data were collected to analyze the link between clam displacement and the tidal and meteorological conditions.
The tidal coefficient corresponds to the size of the tide in relation to its mean and varies between 20 and 120. It provides information on the amplitude of spring tides (coefficient > 80) and neap tides (coefficient < 80), and ranges from 33 to 114 during the 2014–2018 series of experiments. The wind speed and direction were measured at Gouville-sur-Mer four kilometres north of Blainville-sur-Mer: FFM, mean wind speed in m·s−1; FXI, instantaneous maximum wind speed in m·s−1 (from 1 to 360°); and DXI: direction of the instantaneous maximum speed of wind in m·s−1 (from 1 to 360°). Both datasets are available in the Supplementary Materials.

2.4. Statistical Analyses

As the Manila clam Ruditapes philippinarum represented 87% to 98% of the Ruditapes harvested depending on the sampled site on the western coast of Cotentin [15,20], all the clams were pooled as Ruditapes spp.
Statistical analyses were performed to test the difference in numbers and size of clams between successive periods and between sites. The Shapiro–Wilk normality test and Bartlett’s test of homogeneity of variances were performed for each sample to validate the criteria for the application of a two-way ANOVA with interaction to test the spatio-temporal changes (years and station factors) for 2014 and 2016 sampling [33]. For 2016, tests were performed on two groups of data (T0 and T1 common stations and T1 and T2 common stations). For 2018, only a one-way ANOVA was performed to test the temporal effect (date factor). The Tukey Honestly Significant Difference test was applied when ANOVA showed significant differences. The R software package (4.4.1 version) was used to perform ANOVA, as well as the Shapiro, Bartlett and Tukey tests.
ANOVA was also used to test hypotheses about differences in mean shell length in the 2016 sampling, i.e., to determine if the size–frequency distributions that were displayed differed by site or sediment type. A test of independence by creating size class bins that were comparable was made between sampling times. This was analyzed using a chi-square test of independence or a G-test.

3. Results

3.1. Quadrat Raking

3.1.1. 2014 Sampling

The 2014 sampling was performed to assess the displacement of adult clams at the B site at three distinguished stations before (T0) and after raking (T1). The total number of clams collected was 796, including 580 at T0 and 216 at T1. The total clam (Ruditapes spp.) abundance varied from 13.3 ind·m−2 at BG to only 0.4 ind·m−2 at BS (Table 1). The mean total clam abundance ± standard deviation was higher at BG (10.5 ± 2.5 ind·m−2) than at BDG (6.6 ± 2.3 ind·m−2) and BS (2.2 ± 2.0 ind·m−2) (Table 1).
The numbers of clam displacements calculated as the change in density between T0 and T1 following raking were of the same order of magnitude at all three sites (Table 1). Nevertheless, the ratio between the abundances observed at both sampling dates was higher for the sand habitat than for the two other gravel habitats. The abundance was significantly higher at T0 than at T1 (Table 2). Similarly, the abundance was significantly higher at BG than at BS (Table 2). The abundance at BDG was not significantly different from BG and BS (Table 2). The interaction of date and sediment type was significant for the clam abundances (Table 2).
The sizes of the clams at the two sampling dates (Figure 4) showed very small differences, both between the three sites and the two dates. The clams ranged in size from 17.74 mm up to 54.61 mm, with mean sizes between 37.24 and 40.02 mm. At BS, the sizes ranged from 23.70 to 48.65 mm at T0 (mean size = 37.49 ± 4.59 mm) and from 22.05 to 46.32 mm T1 (mean size = 37.24 ± 4.86 mm); at BDG, the sizes ranged from 19.86 to 54.61 mm (mean size = 38.41 ± 5.57 mm) at T0 and from 23.55 to 49.87 mm at T1 (mean size = 40.02 ± 4.47 mm), while, at BDG, the sizes ranged from 17.74 to 50.91 mm (mean size = 39.13 ± 6.25 mm) at T0 and from 24.24 to 52.78 mm at T1 (mean size = 41.04 ± 4.52 mm).

3.1.2. 2016 Sampling

The 2016 sampling was performed to assess the displacement of adult clams at four sites of the western coast of Cotentin before (T0) and after raking (T1 and T2). A total of 968 clams were harvested, including 697 from B, 70 from A and 201 from S (Table 3). At the beginning of the sampling campaign, the mean abundance of clams was 10.0 ± 4.2 ind·m−2 at BS, 2.4 ± 2.4 ind·m−2 at BDG, 1.7 ± 0.7 ind·m−2 at A and 5.8 ± 1.0 ind·m−2 at S (Table 3). For the four sites, the number of clams displaced between sampling dates was of the same order of magnitude at BG, A and S, but higher at BS where the density was higher at T0. By comparison, the mean clam abundance at T1 was 4.6 ± 1.3 ind·m−2 at BS, 1.0 ± 0.3 ind·m−2 at BG, 0.6 ± 0.7 ind·m−2 at A and 0.9 ± 0.3 ind·m−2 at S (Table 3). The abundance was significantly higher at T0 for BG, S, A and BS than at T1 (Table 2). The abundance was significantly higher at BS than at S, BDG and A (Table 2). No significant interaction was observed between the two factors (Table 2).
Nevertheless, the ratio between the abundances observed for both Blainville-sur-Mer sites at the two dates is of the same order of magnitude for the two other gravel habitats at A and S (Table 3). At T2, the numbers of clams showing colonization between sampling dates are of the same order of magnitude at BS (4.9 ± 1.7 ind·m−2), but lower at BDG (0.4 ± 0.2 ind·m−2). Again, the ratio between the abundances observed at the two dates was higher for the sand habitat than for the other gravel habitats (Table 3). The abundance was significantly higher at T0 than at T1 and T2 (Table 2). The abundance was significantly higher at BS than at BDG (Table 2). No significant interaction between the two factors was observed (Table 2).
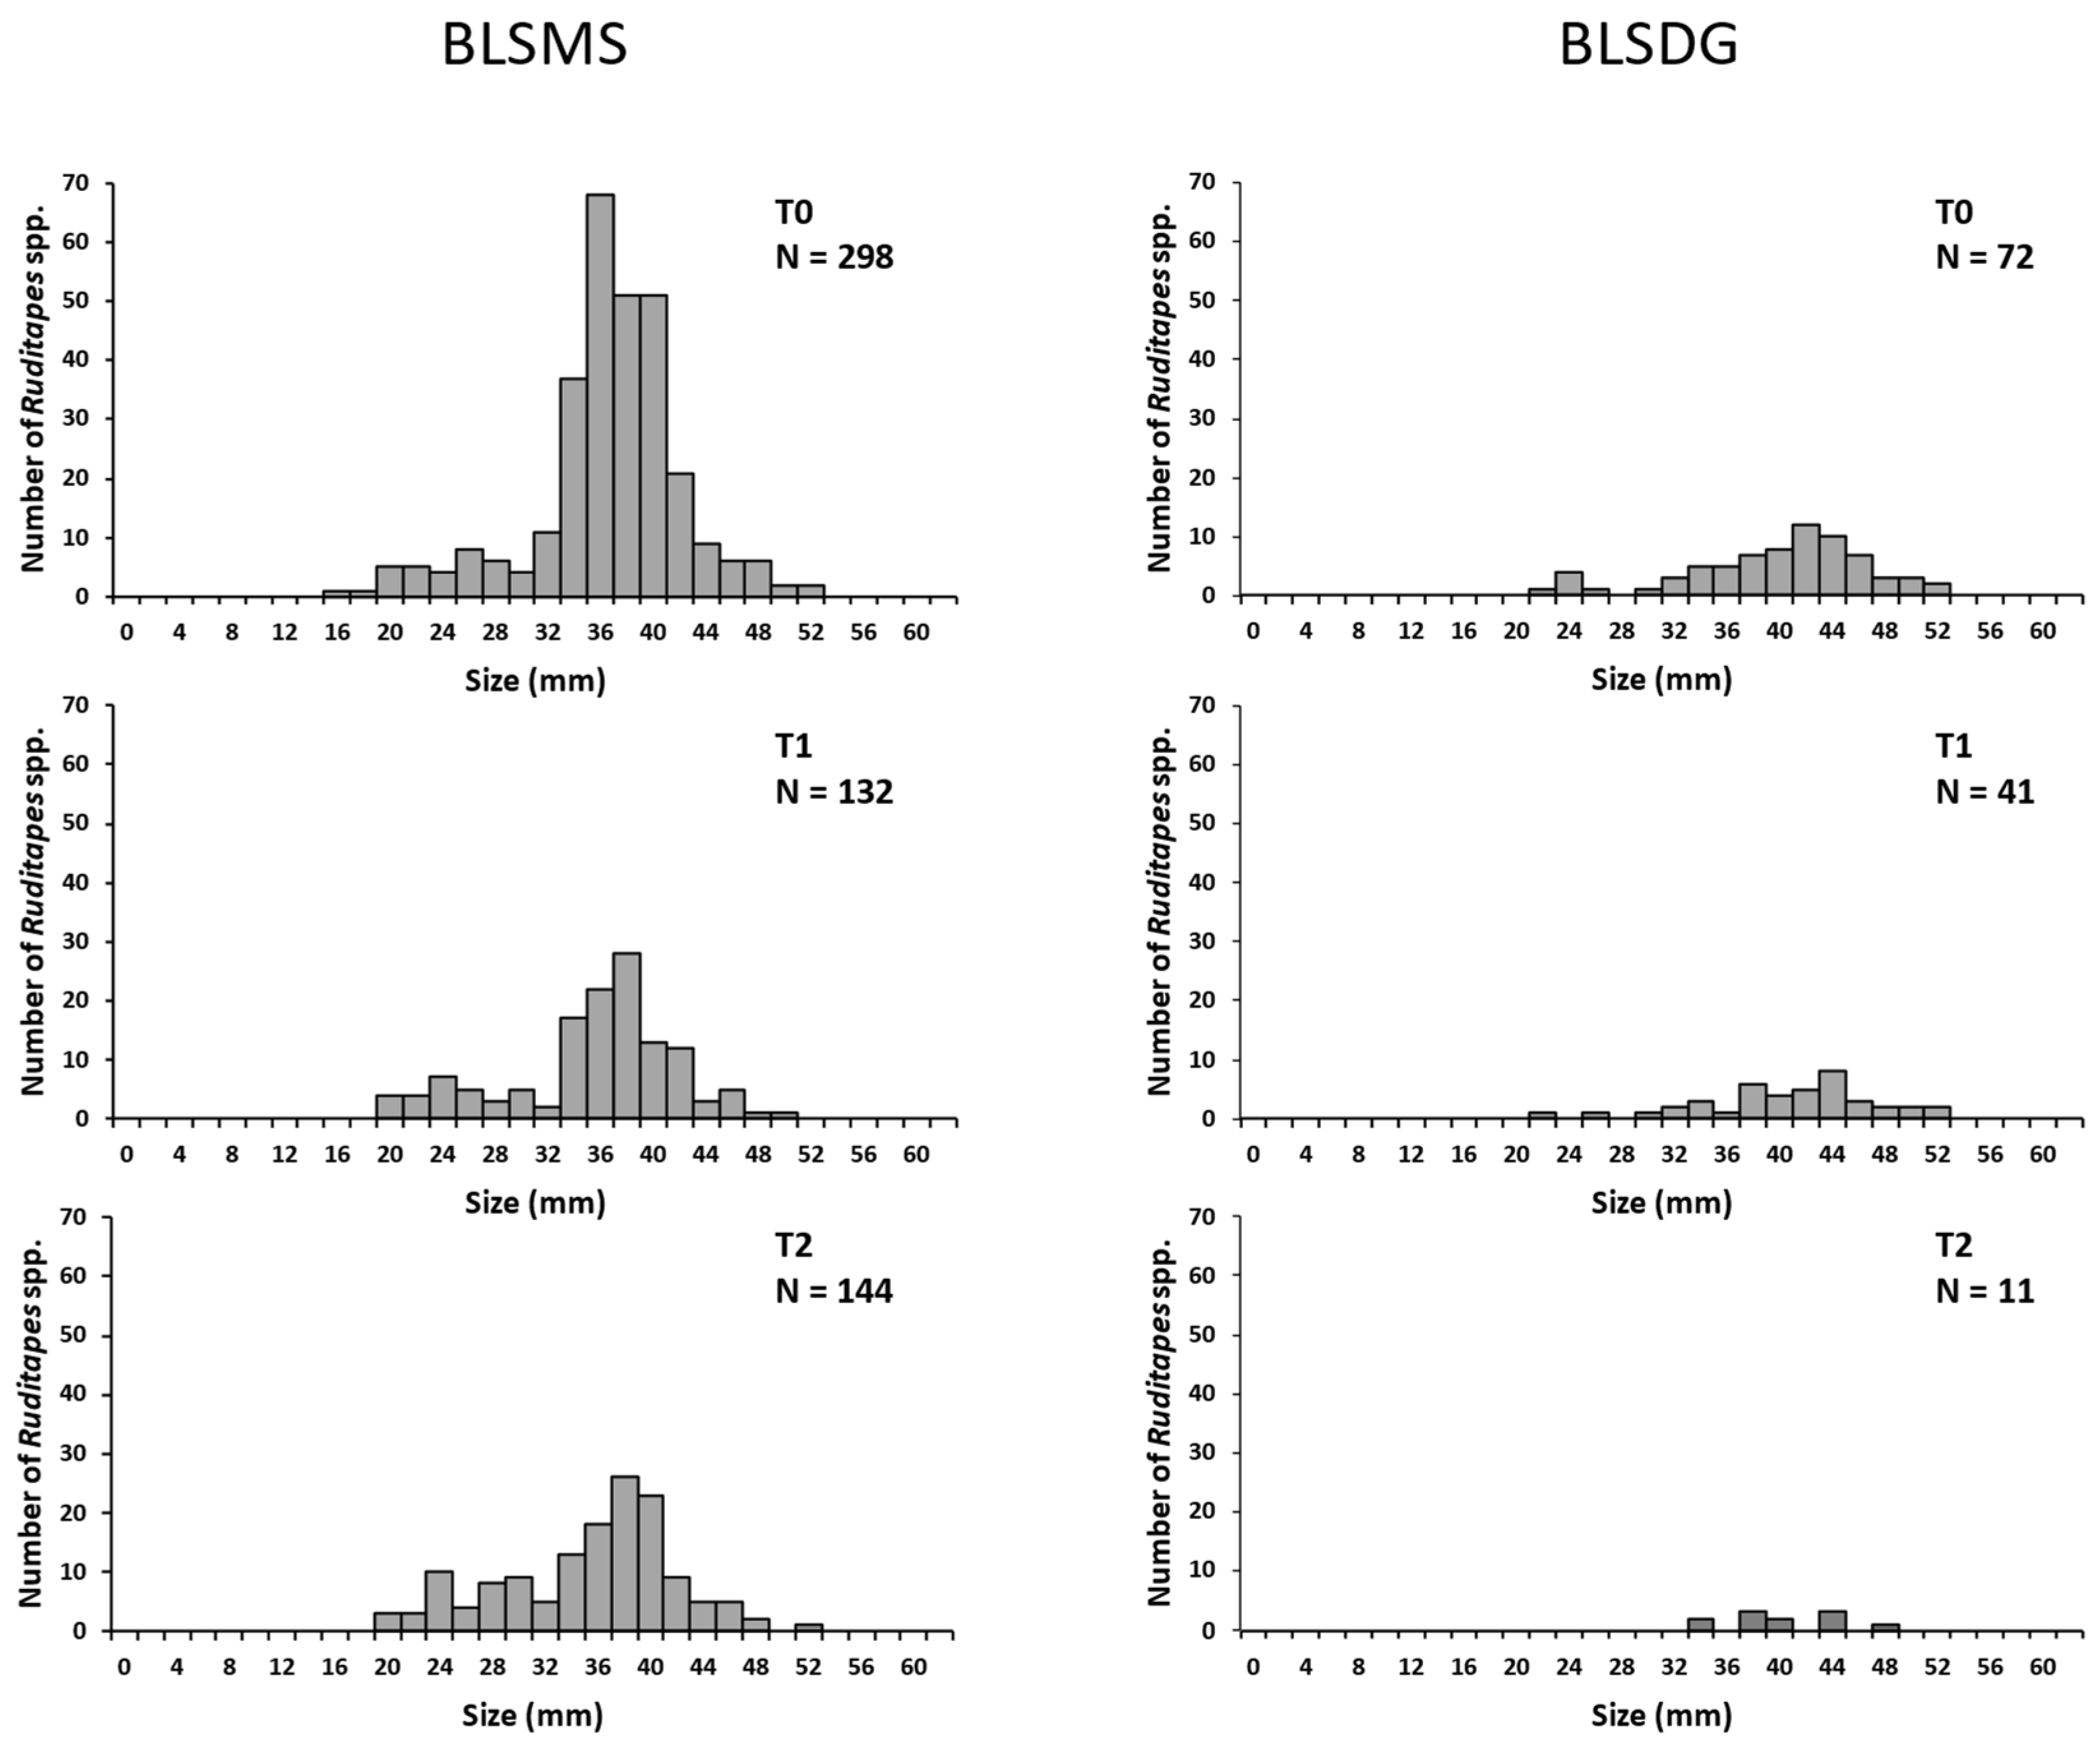
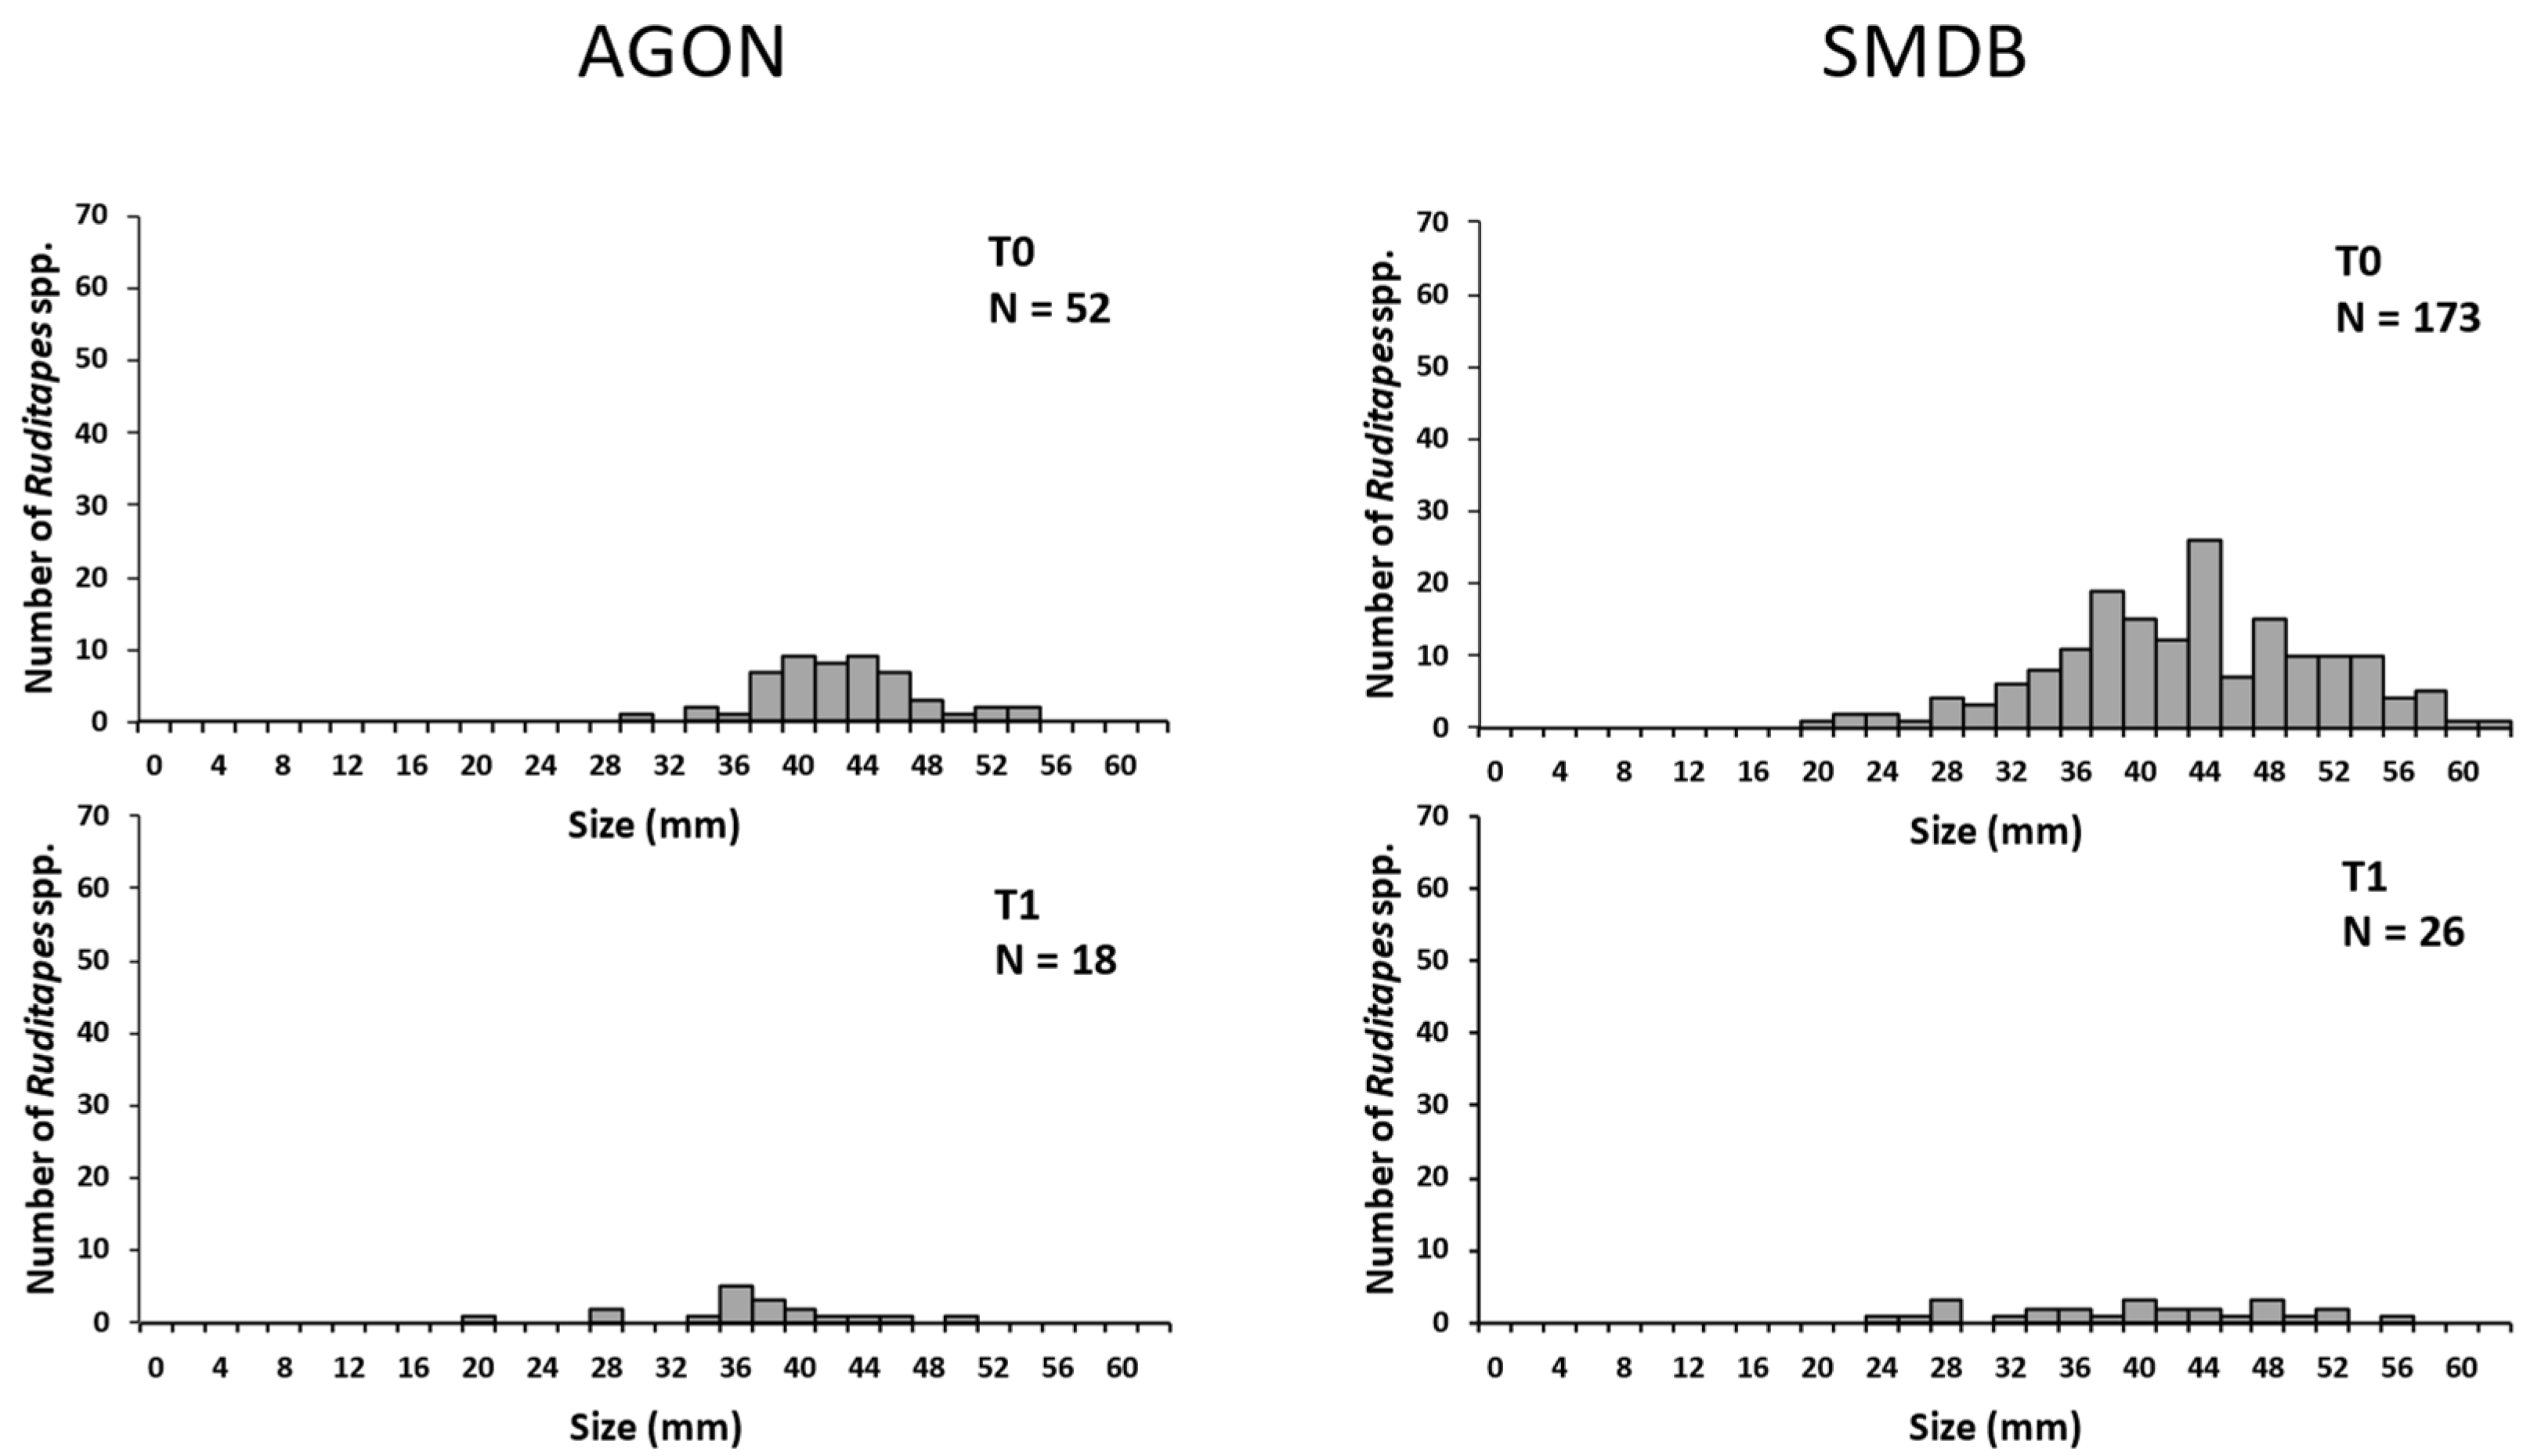
The size of clams was between a minimum of 14.33 mm at BS and a maximum of 57.65 mm at S (Figure 5). At BS, the clam size ranges from 14.33 to 50.88 mm (mean size = 34.63 ± 6.41 mm) at T0, while it ranges from 18.25 to 49.18 mm at T1 (mean size = 34.40 ± 6.46 mm) and 18.17 to 50.58 mm (mean size = 34.3 ± 6.57 mm) at T2. At this latter site, the clam sizes were very similar from one date to another, but lower than those observed at the three other sites. In the deep gravelly habitat of BDG, the clam size ranged between 21.68 and 51.21 mm (mean size = 38.97 ± 6.80 mm) at T0, from 20.51 to 51.41 mm (mean size = 39.85 ± 8.27 mm) at T1 and from 24.35 to 47.58 mm (mean size = 39.21 ± 39.21 ± 4.19 mm) at T2. Similarly, at the BS site, the mean size was very similar from one date to another. At the A site, the size varied from 28.02 to 51.68 mm (mean size = 41.75 ± 4.96 mm) at T0 and from 19.26 to 49.15 mm (mean size = 35.80 ± 6.93 mm) at T1, while at the S site, it ranged from 18.20 to 57.65 mm (mean size = 41.71 ± 8.29 mm) at T0 and from 23.10 to 55.54 mm (mean size = 39.11 ± 8.85 mm) at T1. At the A site, the mean size of the clams was smaller at T1 than at T0.
For the four sites at T0 and T1, the mean clam length was significantly lower at T1 than at T0. The mean sizes were significantly lower at BS than at the S, BDG and A sites (Table 2). There was a significant interaction between these two factors (Table 2). For the two common sites (T0, T1 and T2), there was no significant effect between the dates (Table 2). The average size was smaller at BS than at BDG (Table 2).

3.1.3. 2018 Sampling

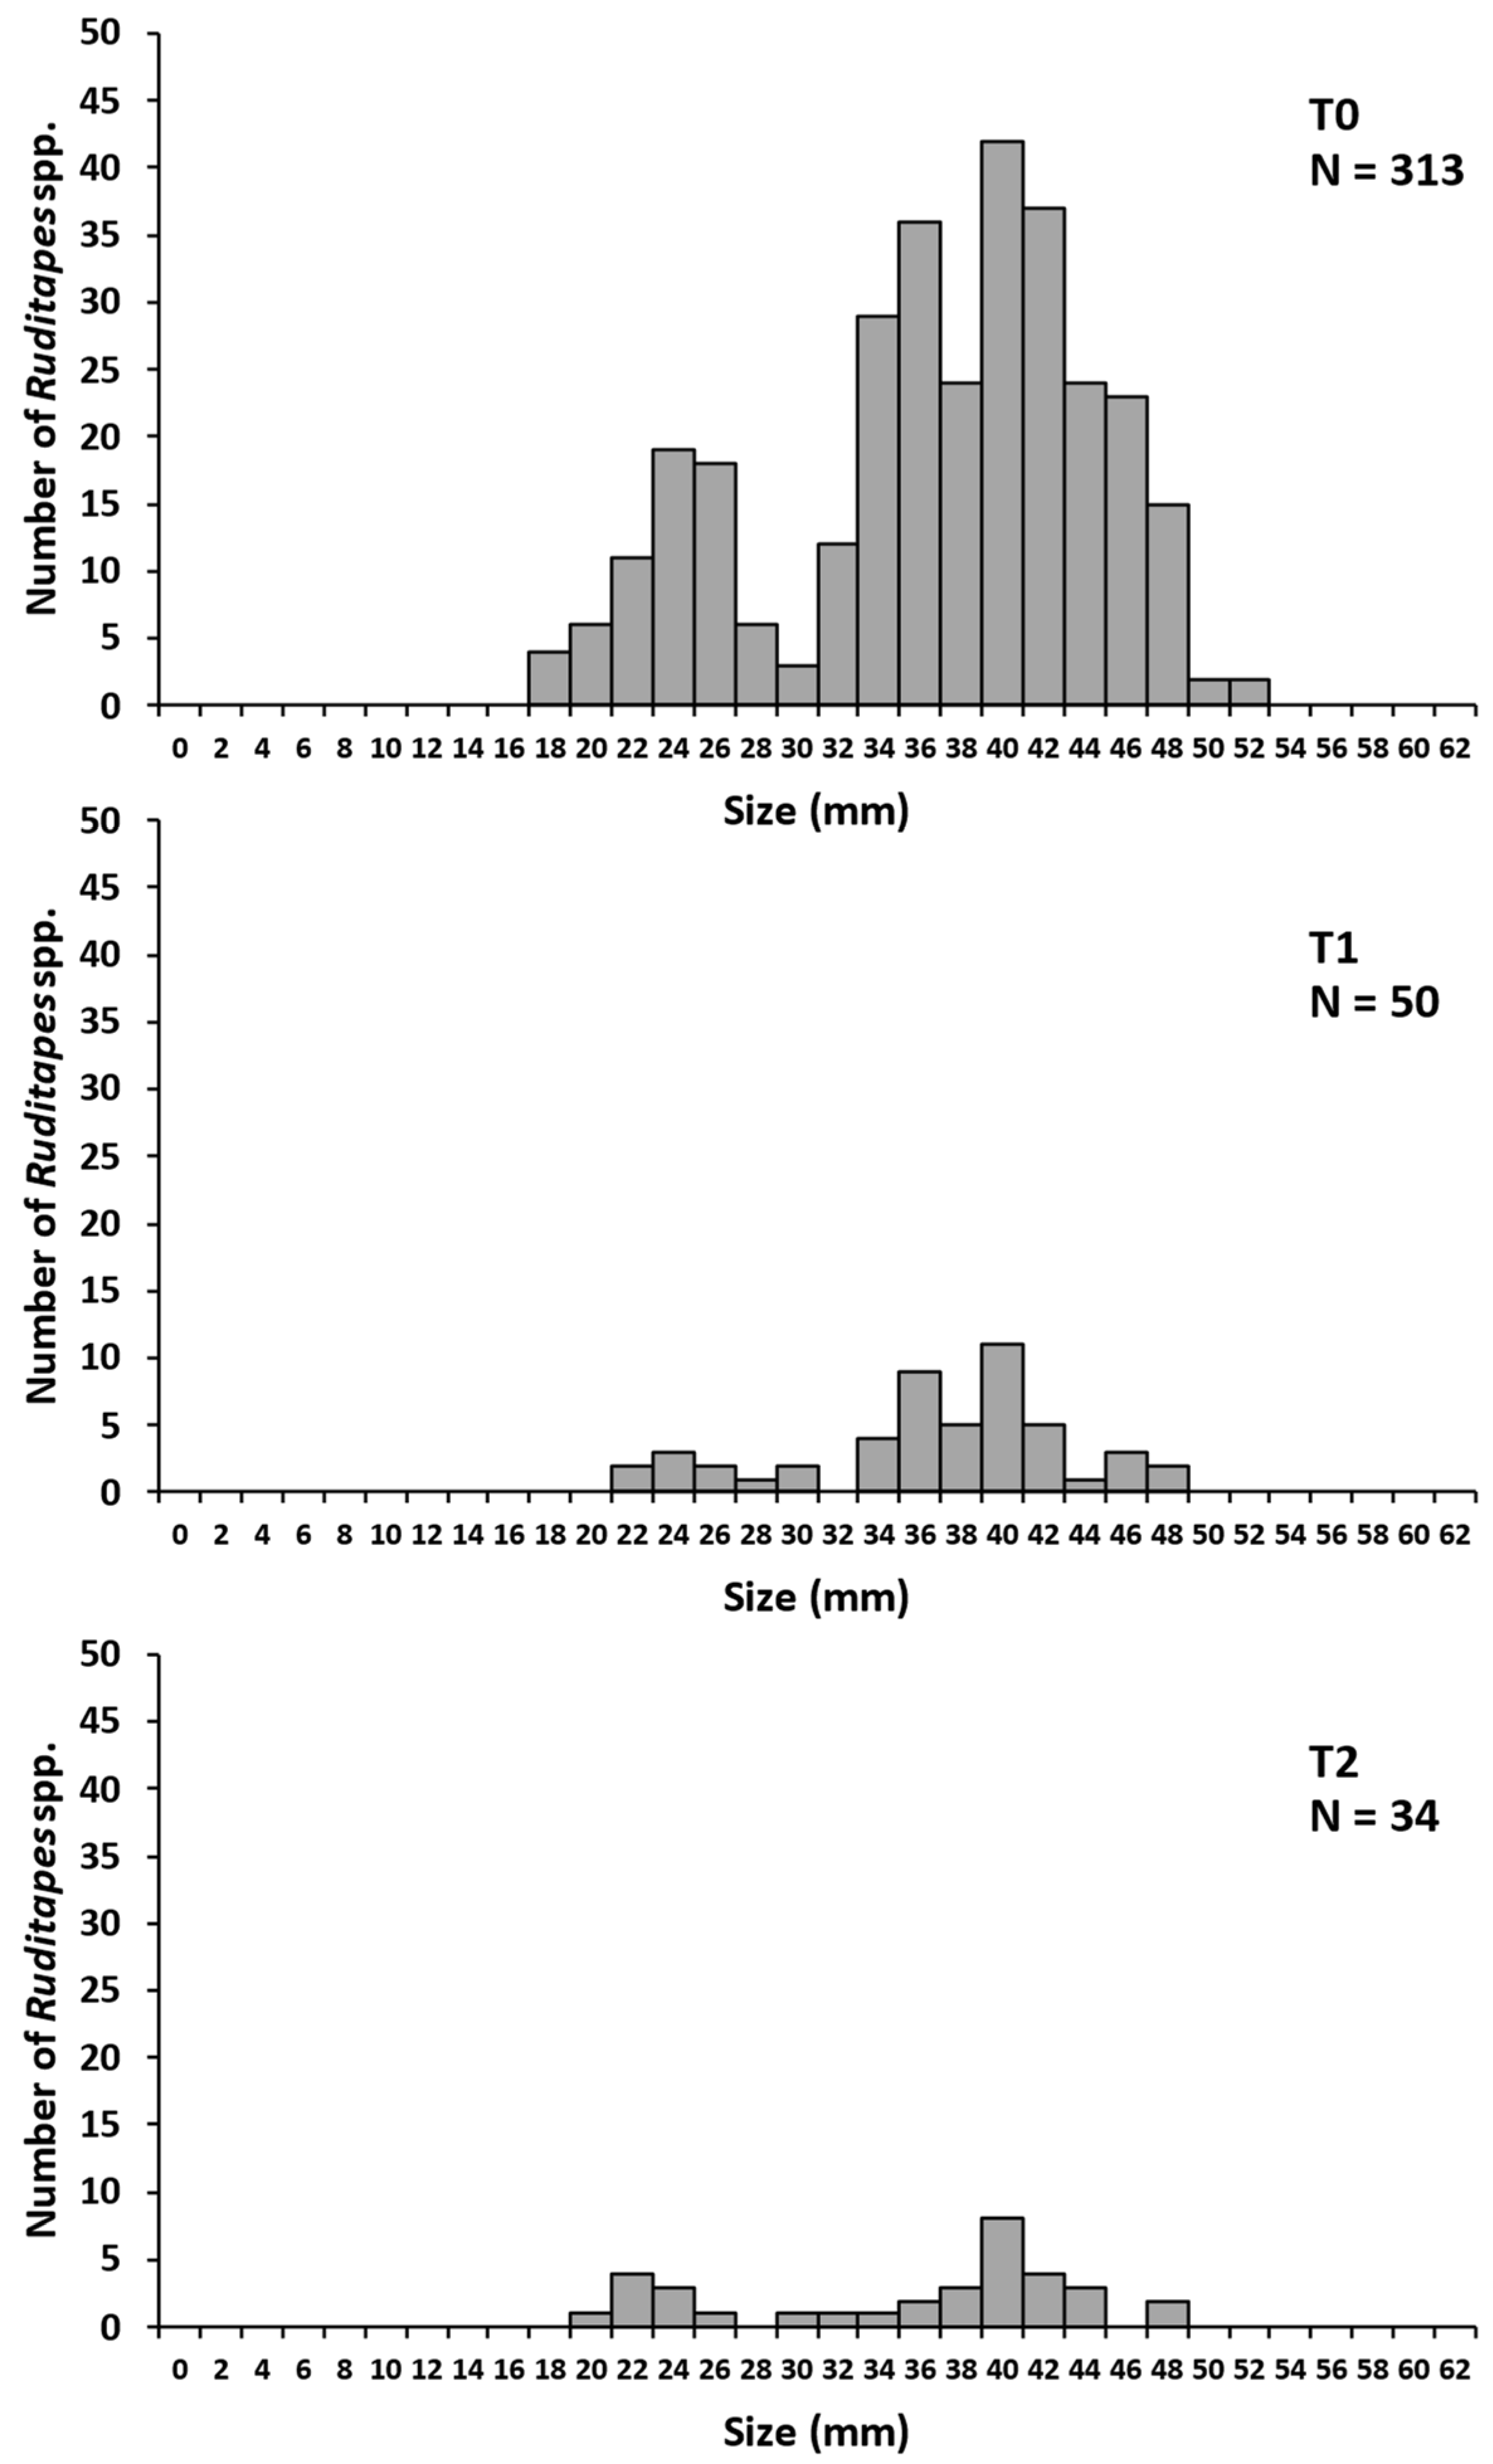
Again, the 2018 sampling was performed to assess the displacement of adult clams at the site BS before (T0) and after raking (T1 and T2). On 18 January 2018 (T0), the number of Ruditapes collected in the 25 quadrats of BS varied from 6 to 22 ind·m−2 for a total number of 313 clams corresponding to a mean abundance of 12.5 ± 4.8 ind·m−2. One month later, on 27 February (T1), 50 Ruditapes were collected from the 25 quadrats (0 to 6 per quadrat), yielding a mean abundance of 2.1 ± 1.9 ind m−2. On 28 March (T2), the number of clams collected was 35 (from 0 to 4 per quadrat), yielding a mean abundance of 1.4 ± 1.1 ind·m−2 (Table 4). The ratio between the abundances observed at the two dates (T1/T0) varied from 0 to 50%, being lower than the T2/T1 ratio (0 to 200.0%) reflecting a colonization of quadrats without clams at T1 (Table 4). The abundance was significantly different between the three dates (ANOVA2,72 = 109.42; p < 0.001) and significantly lower in T0 than in T1 and T2 (Tukey test).
The size of the clams harvested during the three sampling campaigns varied from 16.37 to 51.18 mm (mean size = 35.63 ± 7.82 mm) on 18 January, from 21.92 to 46.53 mm (mean size = 35.66 ± 6.74 mm) on 27 February and from 19.62 to 46.65 mm (mean size = 34.42 ± 8.45 mm) on 28 March. The structure of size classes was similar at the three sampling dates (Figure 6).

3.2. Mark–Recaptures

3.2.1. 2017 Recaptures

The 2017 recapture method was used to assess the displacement of marked clams. At the BS site on 8 June 2017 after 14 days, 83 live marked clams and 1 dead marked clam were found near the circle (at least 20 cm away from the circle). A total of six live marked clams and three dead marked clams were found at distances greater than 20 cm from the circle. However, a total of 89 out of the 100 live marked clams (89%) and only 4 dead marked clams out of 31 (13%) were collected after 13 days.
Figure 7 shows the location of the clams found at a distance > 20 cm: live clams were shown in blue and dead clams in orange. The clams were located preferentially along a North-Easterly axis, probably in relation to the South-Easterly storm on four successive days from 5 to 8 June 2017 (Supplementary Materials).
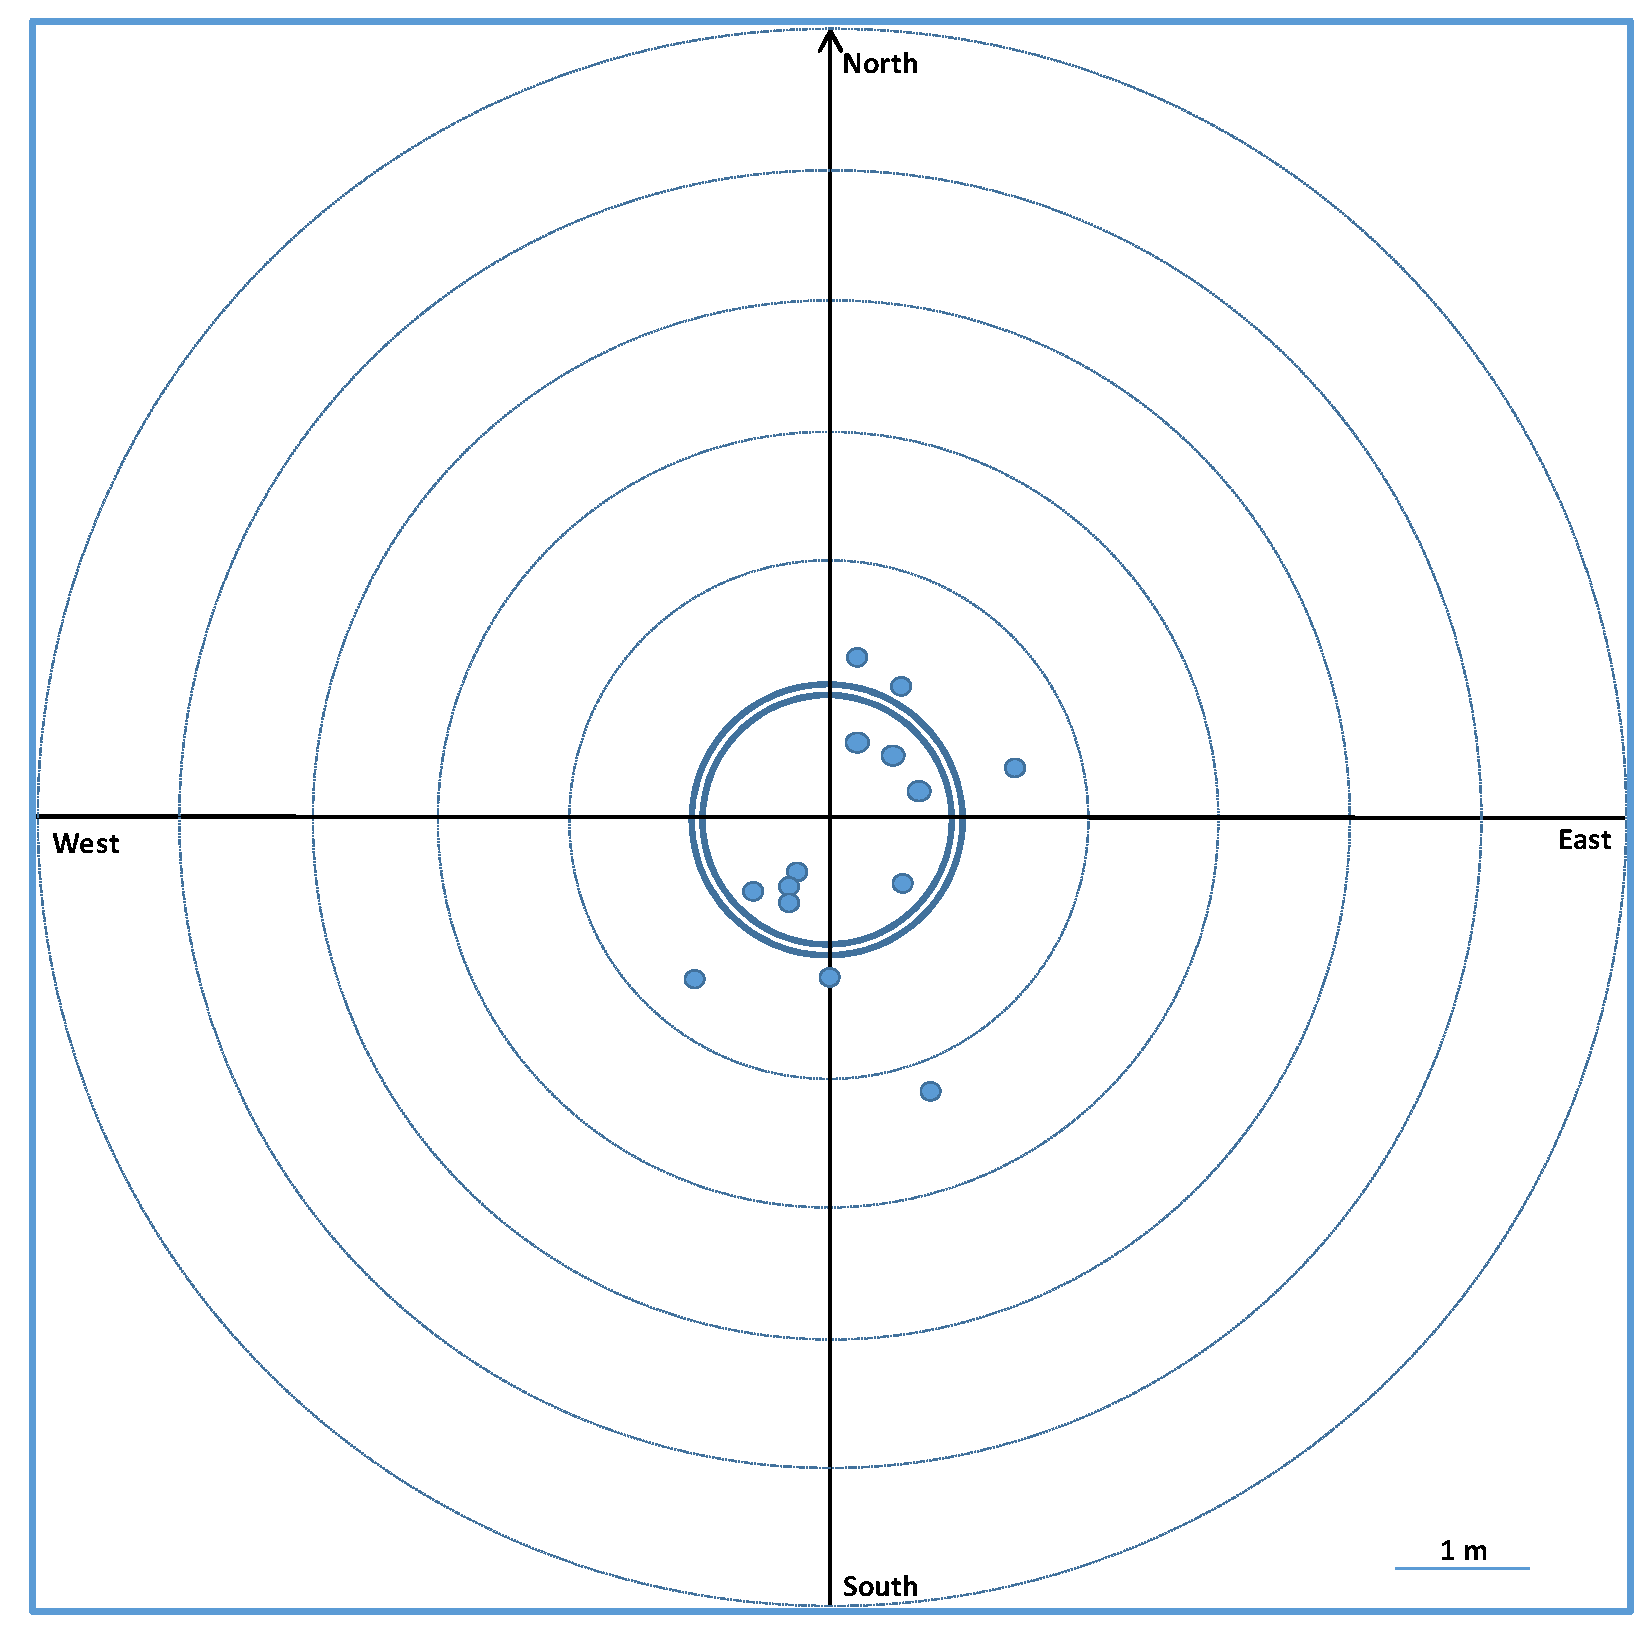
At the BS site on 7 August 2017, 81 live marked clams were found near the circle (at least 20 cm from the circle) and 15 at a distance of between 0.5 and 2.2 m from the circle without any preferential direction of transport. Four clams out of the one hundred live marked clams were not found after searching 20 m from the centre of the circle with a metal detector (Figure 8). From 14 June to 7 August 2017, there were only four days with wind > 20 m·s−1, without storm (Supplementary Materials).
At the A site, after 14 days on 8 June 2017 (first experiment), 94 live marked clams (94%) and 12 dead marked clams (39%) were found near the circle (at least 20 cm from the circle). One live marked clam and one dead marked clam were found at a distance of 0.5 m from the circle without any preferential direction of transport.
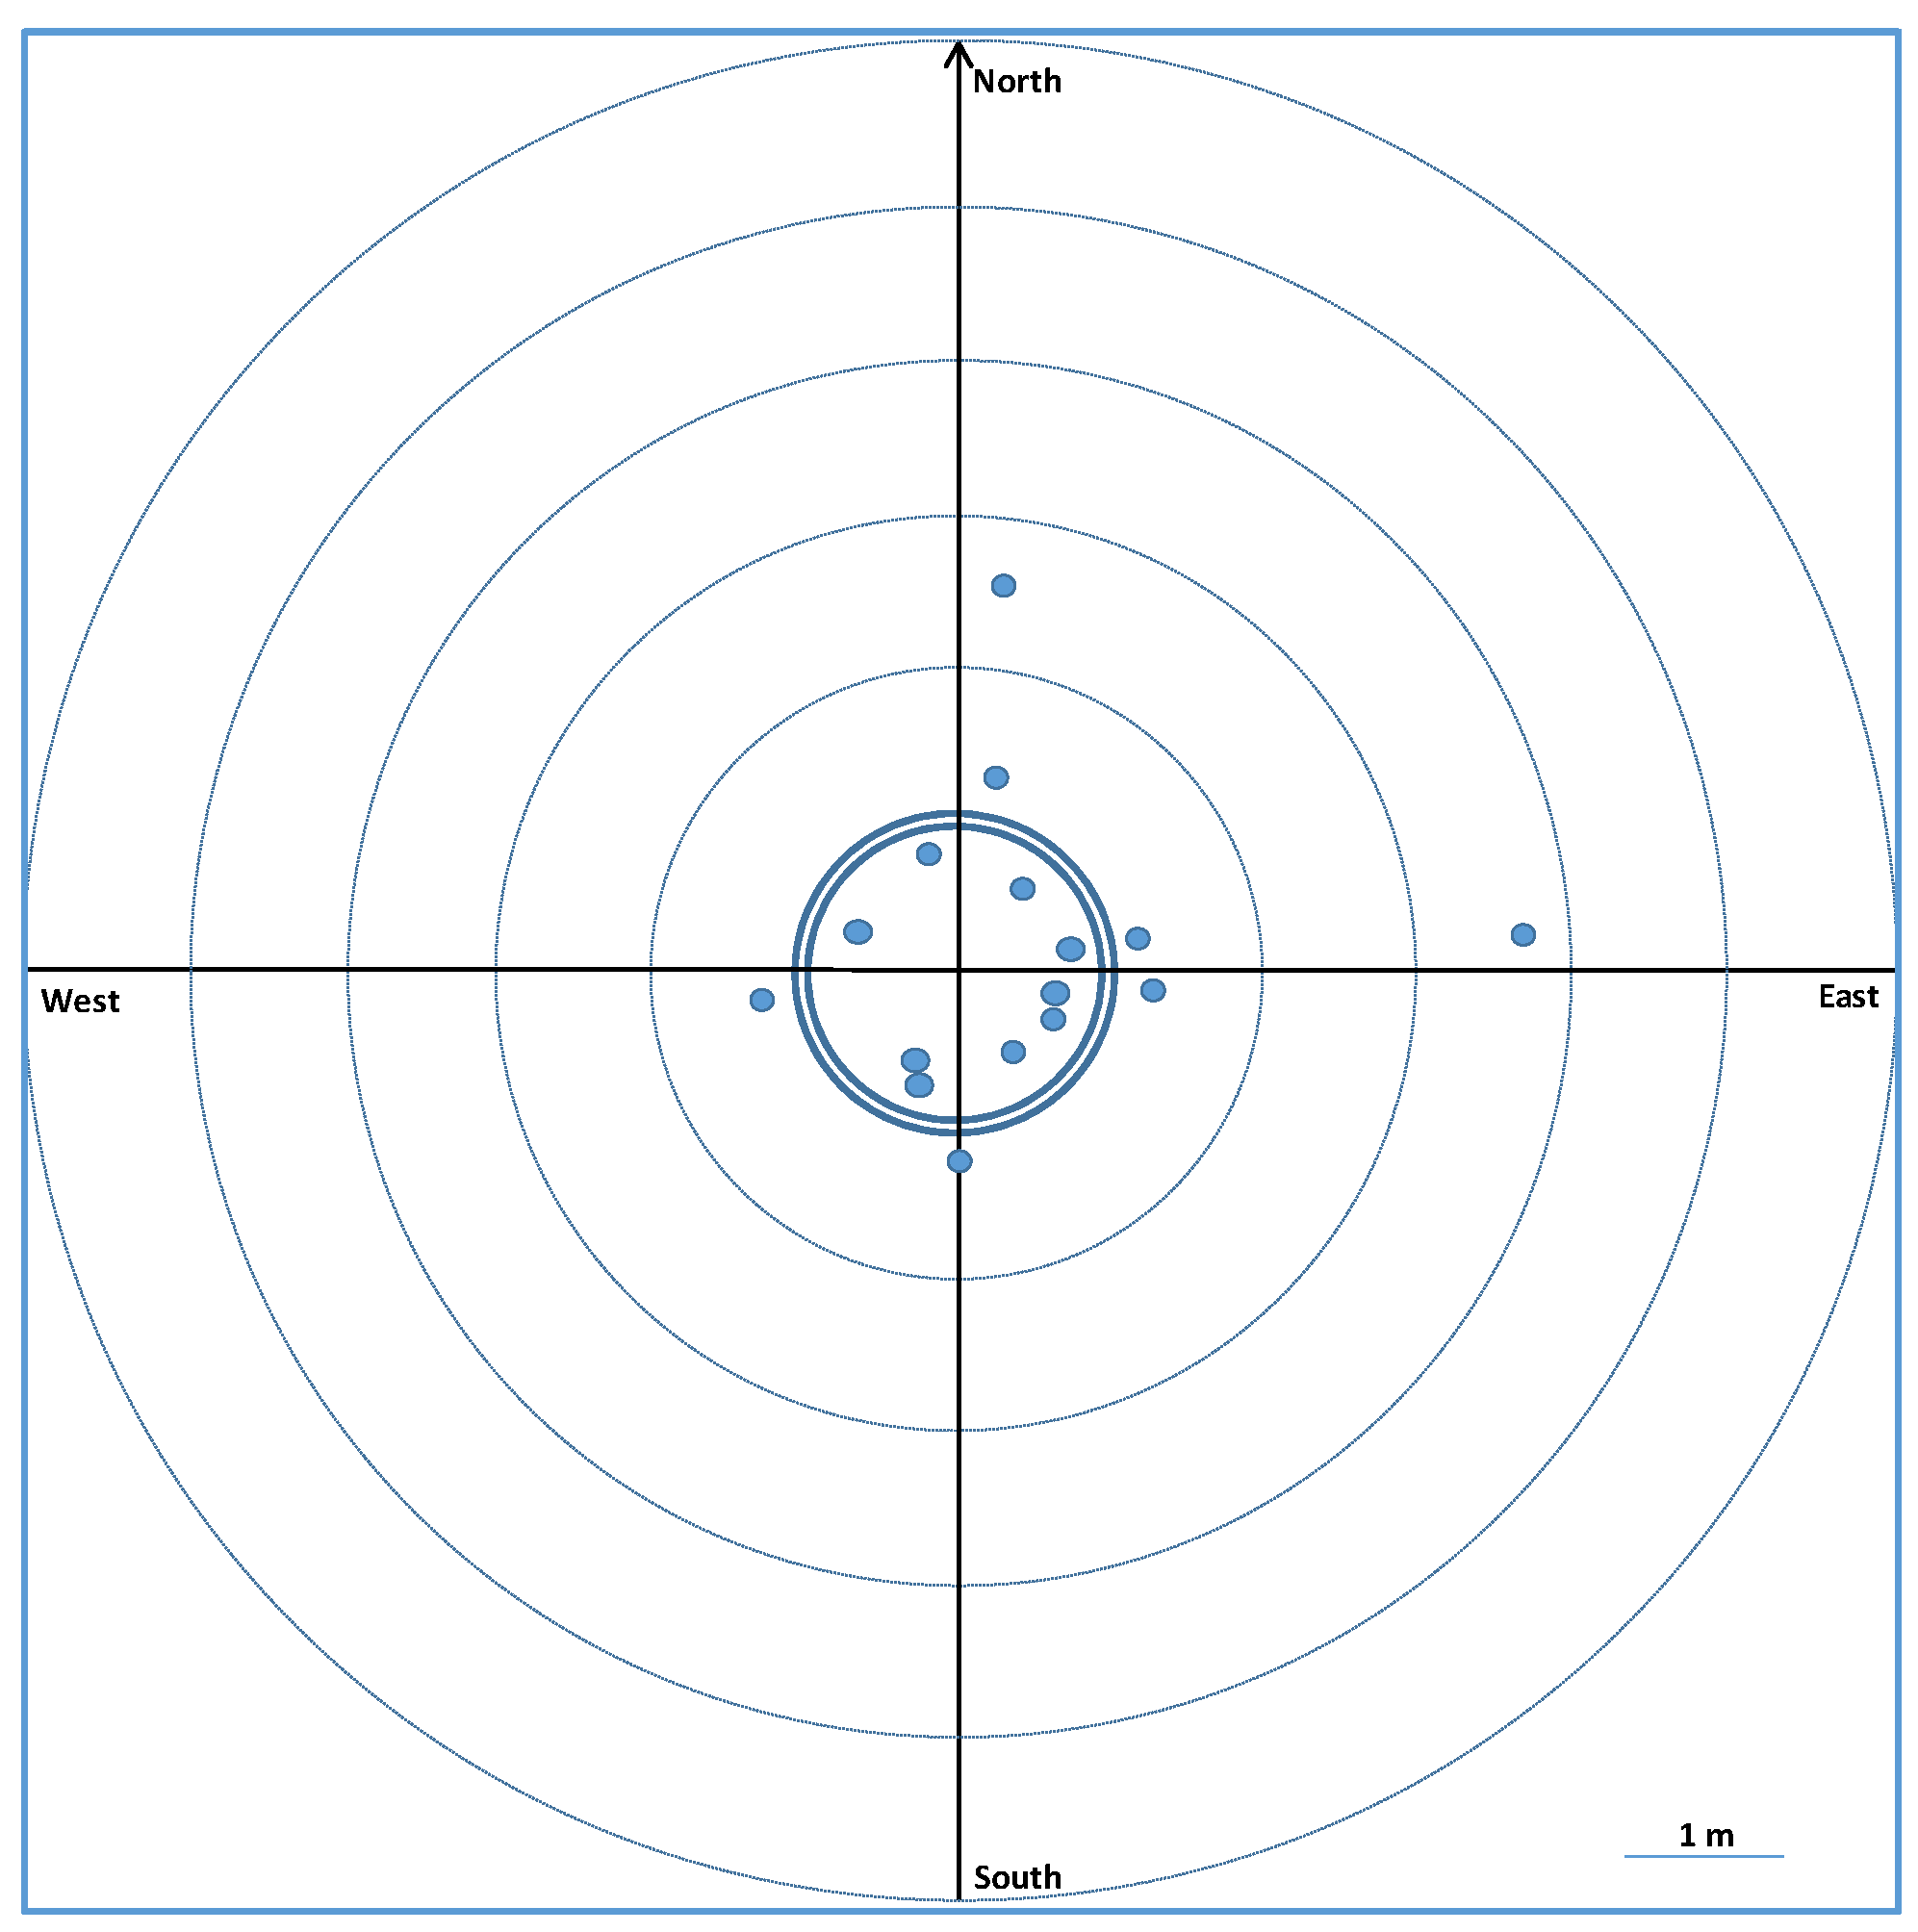
At the A site (Figure 9), on 7 August 2017 after 54 days, a total of 95 live marked clams were found: 79 on the circle, 15 at a distance ≤ 2 m from the centre of the circle and 1 dead clam 12 m from the centre of the circle, without any preferential transport direction and in the absence of strong winds (Supplementary Materials).
In summary, the 2017 samplings illustrated clam displacement, even though about 80% of the clams placed on a circle stayed in the same place one to two months after the beginning of the experiment. Thus, about 20% of the clams showed displacements. Most of the displacements were over moderate distances, of less than 2 m, but some of the marked clams that could not be found may have been displaced beyond the zone prospected by the metal detector, i.e., to distances of more than 20 m.

3.2.2. 2018 Recaptures

Moreover, in 2018, the displacement of marked clams was studied at the BS site. No marked clams were found within the 9 × 9 m quadrat. After more than two months, 336 (86%) of the 392 marked clams were found at the same place in spite of strong winds during this period (Supplementary Materials). Only eight Ruditapes (2%) were found some metres away from their original emplacement, while 47 (12%) of the marked clams could not be found despite searching up to 20 m from the implantation site. Only one dead clam was found.

4. Discussion

4.1. General Patterns of Ruditapes spp. on the Western Coast of Cotentin

For 2014, the mean abundance is 2.2 ind·m−2 in the sand habitat, 6.6 ind·m−2 in the deep gravelly habitat and 10.5 ind·m−2 in the gravelly habitat. For 2016, the mean abundance of clams is 10 ind·m2 at BS, 2.4 ind·m2 at BDG, 1.7 ind·m2 at the A site and 5.8 ind·m−2 at the S site. In January 2018, the mean abundance at the BS site can be estimated at 12.5 ind·m−2. For the same zone, but for a large part of the western coast of Cotentin, the abundance has been estimated at 1.5 ind·m−2 based on the random raking of 596 square metres [20]. Taking into account only the 177 quadrats with clams, the mean abundance is 5.1 ind·m−2. Thus, the mean abundance per square metre along the western coast of Cotentin is low, between 2.0 and 12.5 ind·m−2. This density is of the same order of magnitude as that reported for the Mont-Saint-Michel Bay (2.3 ind·m−2), but lower than values obtained along the French Atlantic coast with densities reaching 70 ind·m−2 in Arcachon Bay [15]. During a 2018 sampling campaign in the Berre Lagoon (Mediterranean French coast), ref. [34] estimated that the mean Ruditapes philippinarum density was 33.6 ind·m−2. Few hotspots could be recorded in this lagoon with density > 250 ind·m−2; moreover, the clam density remained low at the scale of the entire lagoon, at around 15–30 ind·m−2 or nil (57% of the stations out of the 238 sampled stations).
Nevertheless, our winter sampling period occurred outside the summer period of recruitment which happened during the summer in the English Channel (J.C. Dauvin, personal observation). So, the smallest individuals were 14 mm in length, while most of the individuals had a length > 20 mm).
Most of the harvested Ruditapes are R. philippinarum; as an illustration, on 18 January 2018, out of 313 clams collected at BSMMS, only 6 were R. decussatus (1.9%), a percentage of the same order of magnitude (2–13%) as for the Ruditapes harvested at all the sites on the western coast of Cotentin [15,20]. It is possible that, as in other areas such as the Tagus Estuary (Portugal) where the introduced R. philippinarum has become invasive, there has been a major decrease in the abundance of the native R. decussatus coinciding with a large increase in the abundance of the Manila clam [19]. Nevertheless, in the case of the Bay of Santander (North of Spain), Ref. [35] showed that the increased density of Manila clam did not affect the growth or mortality of the native clam. They also showed that the predation by crabs played an essential role in regulating the populations of both species, limiting their density increase.

4.2. Main Lessons from the Quadrat Raking Method in 2014, 2016 and 2018

Apart from one quadrat at the BS site, the numbers of clams harvested during the 2014 raking campaigns at T1 remain lower than those recorded at T0 (Table 1 and Table 3). If we assume that all the clams were harvested during the first raking (at T0), the number of clams transported in one month from the previously raked quadrats can be estimated at 0.6 to 5.0 ind·m−2. The number of transported clams appears higher in DG sediments than in the other sediment types, especially the G habitat (Table 1). There is an enrichment in abundance of 8 to 150% between sampling dates (from T0 to T1), with a mean of 57.3 ± 57.6%.
In 2016, the number of clams transported appeared higher at both B sites (from 23 to 183%) compared with the two other sites, especially at the S site, where the enrichment between the first and second dates remained moderate (12.7 to 18.5%, Table 3). The ratio between the second and third dates at both B sites remains of the same order of magnitude compared with the first two dates. The number of clams transported in one month in the raking quadrats is estimated at 0.1 to 6.5 ind·m−2. These values remain similar to those recorded in 2014.
In 2018 at the BS site, the displacement varied from 0 to 6 clams per m2 between the first and second dates (Table 4) and from 0 to 4 clams per m2 between the second and third dates. The ratio between two dates varies from 0 to 67%, which is lower than the values recorded in 2014 and 2016 for the same habitat.
Moreover, the mean size distribution and mean size of the clams remain similar from one date to another and over the different years of raking. This implies that the displacement of Ruditapes clams affects all the individuals of the local population from the smallest to the largest.

4.3. Natural Transport of Clams and Intertidal Sediment Transport

Sedimentary movements of infauna organisms are known to occur in the intertidal zone along the western coast of the Cotentin, where considerable sediment transit during the tidal cycle might be amplified during storms [29,30]. Thus, sediment transport has been reported as an important factor in enhancing clam displacement in high-energy hydrodynamic environments [4,7,14,36,37,38,39].
By studying the winter distribution patterns of molluscs at five intertidal soft-sediment areas in northwest Europe (Wadden Sea, Netherlands; The Wash, UK; Mont-Saint Michel Bay, Aiguillon Bay and Marennes-Oléron Bay, France), Ref. [39] showed that the distribution patterns of bivalves are dominantly site-specific. Colonization by adult bivalves takes place by crawling or burrowing through the substrate or swimming in the water column, and is mainly responsible for the establishment of small patches [14].
Passive transport of M. arenaria, mainly due to wind-generated waves, has been observed using a sediment trap in a sand site near Halifax harbour (Halifax, NS, Canada); Ref. [3] estimated that the average transport was limited (<10 ind·m−1 d−1), but can exceed 100 ind·m−1 d−1 with a maximum of 800 ind·m−1 d−1. In this latter study, three main periods of transport are identified: a summer period with minimal transport, a plateau when the winds increase for a long duration and an autumn/early winter with the highest winds (>10 m s−1) associated with maximum bedload transport.
It has also been demonstrated that Atlantic storms can move adult individuals of Spisula solidissima (Dillwyn, 1817) outside their subtidal sand dune substrate [38]. Therefore, the disturbance and movement of sediment could influence the distribution of benthic species. Refs. [39,40,41,42] found that it is difficult for macrofauna to become established in a highly mobile habitat. After a storm, thousands of dead bivalves can be washed up onto beaches in the coastal regions around Japan, and the survival of bivalves is strongly dependent on accidental and/or drastic changes in the surface elevation of sand layers [3]. Such accumulations of live and dead bivalves occur regularly along the French coast of the English Channel, particularly along the Calvados and Opal coasts (J.C. Dauvin, personal observations). This demonstrates the intensity of displacement of bivalves after exceptional wind events.
The transport of adult surfclams in relation to sediment movement is well documented, mainly for the genera Spisula and Donax. As regards Donax serra Röding, 1798, a mobile soft-bottom species occurring in great abundance (2000–4000 ind·m−2) on exposed sandy beaches in the eastern Cape area of South Africa, [32] have estimated longshore movement rates ranging from 0.19 to 0.80 m day−1. Net rates of longshore movement are not correlated with clam size. On the south coast of Portugal, Spisula solida (Linnaeus, 1758) is distributed mostly between 3 and 12 m water depth, and their distribution appears to be mainly influenced seasonally during winter by cross-shore sediment dynamics [43]. In the northern Bay of Biscay, Ref. [44] have observed Spisula solida living in subtidal sand dunes (5–25 m depth); it is present in very high densities (200–700 ind·m−2) in small patches (1–2 km2) forming a single cohort, as observed along the south coast of Portugal [43].
Along the western coast of Cotentin, it is difficult to identify a relationship between the observed displacement of clams, tidal conditions and wind speed (Supplementary Materials). The absence of any significant link between physical environmental factors and clam displacement is probably due to one main cause. The long-time interval between successive rakings in 2014, 2016 and 2018—as well as during the experiments in 2017 and 2018—means that it is impossible to establish any link between the variables. The timescale of our observations is incompatible with the short events corresponding to the displacement and burrowing of clams (at an hourly scale) and the available meteorological data. A daily survey would be better adapted to test clam displacement associated with tidal and meteorological factors.

4.4. Remarks on the Sampling and Experimental Design

In 2014 and 2016, the raking was carried out over a large surface area (10 m2) and to a depth of 15 cm in a sandy–gravelly substrate with gravel representing a large proportion of the sediment that showed no changes before and after raking (72% at BS, 87% at BG and 92% at BDG [15]. However, it was impossible to sieve 1.5 m3 of sediment for each replicate (three replicates at each site) at all the sites. Therefore, we can assume that two sources of bias might be introduced by this sampling strategy: (1) the clams were harvested visually, and the smallest might have escaped notice during the harvesting; and (2) large individuals, mainly the European clam R. decussatus, could have been buried too deeply to be harvested during the first raking campaign. This latter species has longer syphons and can live deeper in the sediment than the Manila clam R. philippinarum. In 2018, the sampling area was reduced to 1 m2 and the sediment was sieved on a 5 mm mesh to allow a more effective sampling of the clams. The 2018 sampling allowed us to test the second bias hypothesis: some European clams were not harvested during the first raking campaign and were near the surface one to two months later during the following campaign. On 18 January 2018, a total of 313 clams were collected including 6 European clams. However, on 27 February and 28 March, no R. decussatus were sampled, even though sampling to a depth of 15 cm should allow collection of all the deeper clams in the gravelly sediment.

4.5. Mark–Recapture Method

In the present research, we used external tags in inox metal on the surface of the shell to observe the displacement of clams. Several methods have been used such as shell engraving, paints and dyes, glue-on shellfish tags, self-adhesive tags, coded wire tags anchored within the external ligaments of the bivalve, and nylon rivet tags anchored within the respiratory pores [40]. The main problem with external tagging methods is a decline in tag legibility over time and low tag recovery rates due to the abrasion of tags by sediments, particularly during long-term studies [40]. Metallic tags seem to be more efficient and have been used by [32] to track net changes in the positions of intertidal juvenile and adult Donax serra clams (37–67 mm shell length) in a South African dynamic system, with aluminum tags glued to the shells over a 3-month period during the austral fall and winter and their detection with a metal detector. As with [32], the use of aluminum and stainless metal washers on Ruditapes shells is suitable for tracking clam displacement with a metal detector. Moreover, the painting of shells helps in the detection of clams at the end of the experiment such as in 2018; the paint and numbering remains visible after 70 days. This methodology could be used for experiments on other adult bivalves in the future.
For 2017, only 12 dead marked clams out of 31 (39%) were collected 54 days after the beginning of the experiment, while the number of live clams was higher. In fact, live clams could be buried actively in the sediment while dead clams could rise to the surface due to the effect of tidal currents. In this way, dead clams could be transported more than 20 m, which corresponds to the distance prospected by the metal detector. The study of [45] showed that, in the intertidal zone of the Kouchibouguac National Park, New Brunswick, Canada, Mya arenaria clams reburrowed more rapidly after human disturbance.

4.6. Perspectives for Future Experiments

Our results show that clam displacement takes place, but the density of displaced individuals remains moderate, often lower than 5 ind·m−2 with a mean value of 2 ind·m−2 in one month. Nevertheless, these results should be compared with densities reported along the western coast of Cotentin, where densities are between 5 and 10 ind·m−2. We could assume that between 10 and 20% of clams show a displacement in one month, but the distance moved remains often less than 1 m. Faced with the difficulties of low abundance but extensive colonization of the intertidal zone by adult clams, it will be interesting in future research to focus on the displacement of juveniles (<10 mm) which are more sensitive to sediment transport than adults. Experiments should be carried out over successive short surveys (one day) at the end of the summer and the beginning of autumn (September–October) in areas where the field recruitment is known to be significant. Another alternative would be to design experiments on juveniles from hatcheries, which would make it possible to multiply the different scenarios at all seasons and under all tidal conditions.

5. Conclusions

Our study illustrates Ruditapes spp. clam displacements on the intertidal sites along the western coast of Cotentin. This area is characterized by low abundances of clams and by high hydrodynamics due to strong tidal currents. Successive rakings showed that clams were harvested again after a first or a second raking on the same quadrat. We have estimated that clam displacements vary from 0 to 6.5 ind·m−2. In some cases, the number of clams recorded after the first raking doubles in the second harvesting, but the ratio between the two rakings is nearly 50%. This means that the initial abundance has been enriched by about 50% in one month. Moreover, the mean abundance of displaced clams for all the 2014, 2016 and 2018 observations is 1.8 ind·m−2, which should be compared with the mean clam density along the western coast of Cotentin between 2.0 and 12.5 ind·m−2.
These displacements were confirmed with experiments using clams marked with an inox metal washer and detected with a Minelab Sovereign GT multi-frequency metal detector. During the 2017 and 2018 experiments, about 20% of clams showed a moderated displacement of less than 2 m.
Moreover, it is difficult to identify a relationship between the observed displacement of clams, tidal conditions and wind speed, probably due to the long time interval between successive rakings. A daily survey should be better adapted to test clam displacement associated with tidal and meteorological factors in the future. Natural and hatchery juveniles at several periods of the year could be improved to establish a link between these displacements and current tides and meteorological events.

Supplementary Materials

The following supporting information can be downloaded at https://www.mdpi.com/article/10.3390/jmse12091488/s1, Table S1. Tide coefficient during the clam sampling and experiments from 2014 to 2018. Table S2. Speed and direction of the wind measured at Gouville-sur-Mer: FFM, mean speed of wind in m·s−1; FXI, instantaneous maximum speed of wind in m·s−1; and DXI: direction of the instantaneous maximum speed of wind in ° (from 1 to 360°).

Author Contributions

Conceptualization: J.-C.D. and O.B.; Methodology: J.-C.D., O.B. and J.-P.P.; Statistical analysis: J.-P.P.; Figures: O.B. and J.-P.P.; Validation, J.-C.D., O.B. and J.-P.P.; Investigation, J.-C.D., O.B. and J.-P.P. Writing—original draft, J.-C.D.; Writing—review & editing, J.-C.D., O.B. and J.-P.P.; Supervision, O.B. and J.-C.D.; Project administration, O.B.; Funding acquisition, O.B. All authors have read and agreed to the published version of the manuscript.

Funding

This study was carried out in part in the Framework of 3POC programme (Pêche à Pied à la Palourde sur la côte Ouest du Cotentin) supported by the Normandy Region.

Institutional Review Board Statement

Not applicable.

Informed Consent Statement

Not applicable.

Data Availability Statement

Data are contained within the article and Supplementary Materials.

Acknowledgments

The structures associated to the 3POC programme are the SMEL (Synergie Mer Et Littoral), the GEMEL (Groupe d’Etudes des Milieux Estuariens et Littoraux) Normandie, the ‘Comité Régional des Pêches Maritimes Basse-Normandie’ and the laboratory UMR CNRS and Caen Normandy University ‘Morphodynamique Continentale et Côtière’. The authors thank Alexandrine Baffreau, Florian Bargat, Claire Delecrin, Marine Martinez, Elise Plantive, Vincent Lefbevre and Avril Associations for their help during the sampling, O. Cantat for his help in obtaining the meteoritical data at Gouville-sur-Mer from Météo-France, and M. Carpenter for the English revision. The authors thank the three reviewers of the first version of the typescript for their very useful suggestions to improve the final version of this paper.

Conflicts of Interest

The authors declare no conflicts of interest.

References

  1. Baker, P.; Mann, R. The post-larval phase of bivalve mollusks: A review of functional ecology and new records of post larval drifting of Chesapeake Bay bivalves. Bull. Mar. Sci. 1997, 61, 409–430. [Google Scholar]
  2. Beukema, J.J.; de Vlas, D. Tidal-current transport of thread-drifting post larval juveniles of the bivalve Macoma balthica from the Wadden Sea to the North Sea. Mar. Ecol. Prog. Ser. 1989, 52, 193–200. [Google Scholar] [CrossRef]
  3. Emerson, C.W. A method for the measurement of bedload sediment transport and passive faunal transport on intertidal sandflats. Estuaries 1991, 14, 361–371. [Google Scholar] [CrossRef]
  4. Emerson, C.W.; Grant, J. The control of soft-shell clam (Mya arenaria) recruitment on intertidal sandflats by bedload sediment transport. Limnol. Oceanogr. 1991, 36, 1288–l300. [Google Scholar] [CrossRef]
  5. Bouma, H.; Duiker, J.M.C.; de Vries, P.P.; Herman, P.M.J.; Wolf, W.J. Spatial pattern of early recruitment of Macoma balthica (L.) and Cerastoderma edule (L.) in relation to sediment dynamics on a highly dynamic intertidal sandflat. J. Sea Res. 2001, 45, 79–93. [Google Scholar] [CrossRef]
  6. Hunt, H.L. Transport of juvenile clams: Effects of species and sediment grain size. J. Exp. Mar. Biol. Ecol. 2004, 312, 271–284. [Google Scholar] [CrossRef]
  7. Hunt, H.L. Effects of sediment source and flow regime on clam and sediment transport. Mar. Ecol. Prog. Ser. 2005, 296, 143–153. [Google Scholar] [CrossRef]
  8. St-Onge, P.; Miron, G. Effects of current speed, shell length and type of sediment on the erosion and transport of juvenile softshell clams (Mya arenaria). J. Exp. Mar. Biol. Ecol. 2007, 349, 12–26. [Google Scholar] [CrossRef]
  9. St-Onge, P.; Miron, G.; Moreau, G. Burrowing behaviour of the softshell clams (Mya arenaria) following erosion and transport. J. Exp. Mar. Biol. Ecol. 2007, 340, 103–111. [Google Scholar] [CrossRef]
  10. Jennings, L.B.; Hunt, H.L. Distances of dispersal of juvenile bivalves (Mya arenaria (Linnaeus), Mercenaria mercenaria (Linnaeus), and Gemma gemma (Totten). J. Exp. Mar. Biol. Ecol. 2009, 376, 76–84. [Google Scholar] [CrossRef]
  11. Turner, S.J.; Grant, J.; Pridmore, R.D.; Hewitt, J.E.; Wilkinson, M.R.; Hume, T.M.; Morrisey, D.J. Bedload and water-column transport and colonization processes by post-settlement benthic macrofauna: Does infaunal density matter? J. Exp. Mar. Biol. Ecol. 1997, 216, 51–75. [Google Scholar] [CrossRef]
  12. Norkko, A.; Cummings, V.J.; Thrush, S.F.; Hewitt, J.E.; Hume, T. Local dispersal of juvenile bivalves: Implications for sandflat ecology. Mar. Ecol. Prog. Ser. 2001, 212, 131–144. [Google Scholar] [CrossRef]
  13. Lundquist, C.J.; Pilditch, C.A.; Cummings, V.J. Behaviour controls post-settlement dispersal by the juvenile bivalves Austrovenus stutchburyi and Macomona liliana. J. Exp. Mar. Biol. Ecol. 2004, 306, 51–74. [Google Scholar] [CrossRef]
  14. Lundquist, C.J.; Thrush, S.F.; Hewitt, J.E.; Halliday, J.; MacDonald, I.; Cummings, V.J. Spatial variability in recolonisation potential; influence of organism behaviour and hydrodynamics on the distribution of macrofaunal colonists. Mar. Ecol. Prog. Ser. 2006, 324, 67–81. [Google Scholar] [CrossRef]
  15. Beck, F.; Pezy, J.P.; Baffreau, A.; Dauvin, J.C. Effects of clam rake harvesting on the intertidal Ruditapes habitat of the English Channel. ICES J. Mar. Sci. 2015, 72, 2663–2673. [Google Scholar] [CrossRef]
  16. Dang, C.; de Montaudouin, X.; Gam, M.; Paroissin, C.; Bru, N.; Caill-Milly, N. The Manila clam population in Arcachon Bay (SW France): Can it be kept sustainable? J. Sea Res. 2010, 63, 108–118. [Google Scholar] [CrossRef]
  17. Benniger, P.G.; Boldina, I. Fine-scale spatial distribution of the temperate bivalve Tapes (=Ruditapes) philippinarum (Adams and Reeve) on fished and unfished intertidal mudflats. J. Exp. Mar. Biol. Ecol. 2014, 457, 128–134. [Google Scholar] [CrossRef]
  18. de Montaudouin, X.; Arzul, I.; Caill-Milly, N.; Khayati, A.; Labrousse, J.M.; Lafitte, C.; Paillard, C.; Soudant, P.; Goulletquer, P. Asari clam (Ruditapes philippinarum) in France: History of an exotic species 1972-2015. Bull. Fish. Res. Agency Japan 2016, 42, 35–42. [Google Scholar]
  19. Moura, P.; Garaulet, L.L.; Vasconcelos, P.; Chainho, P.; Costa, J.L.; Gaspar, M.B. Age and growth of a highly successful invasive species: The Manila clam Ruditapes philippinarum (Adams & Reeve, 1850) in the Tagus Estuary (Portugal). Aquat. Inv. 2017, 12, 133–146. [Google Scholar]
  20. Basuyaux, O.; Beck, F.; Pezy, J.P.; Baffreau, B.; Joncourt, Y.; Tetard, X.; Dauvin, J.C. Evaluation of Ruditapes spp. clam stock on the western coast of Cotentin (English Channel). J. Mar. Biol. Oceanogr. 2018, 7, 2. [Google Scholar] [CrossRef]
  21. Grant, J.; Turner, S.J.; Legendre, P.; Hume, T.; Bell, R.G. Patterns of sediment reworking and transport over small spatial scales on an intertidal sandflat, Manukau Harbour, New Zealand. J. Exp. Mar. Biol. Ecol. 1997, 216, 33–50. [Google Scholar] [CrossRef]
  22. Kakino, J. Dispersal of Japanese littleneck clam Ruditapes philippinarum (Adams and Reeve) in relation to changes of bottom level due to wave action on Banzu tidal flats, Tokyo Bay. Fish. Engineer. 2000, 37, 115–128. [Google Scholar]
  23. Toba, M.; Ito, M.; Kobayashi, Y. Bedload transport of newly-settled juveniles of the Manila clam Ruditapes philippinarum observed in situ at Banzu Tidal Flat, Tokyo Bay. J. Shellfish Res. 2011, 30, 777–789. [Google Scholar] [CrossRef]
  24. Günther, C.P. Dispersal of intertidal invertebrates: A strategy to react to disturbances of different scales? Neth. J. Sea Res. 1992, 30, 45–56. [Google Scholar] [CrossRef]
  25. Hooker, S.H. Preliminary evidence for post-settlement movement of juvenile and adult pipi, Paphies australis (Gmelin, 1790) (bivalvia: Mesodesmatidae). Mar. Fresh. Behav. Physiol. 1995, 27, 37–47. [Google Scholar] [CrossRef]
  26. Olivier, F.; Vallet, C.; Dauvin, J.C.; Retière, C. Drifting in post-larvae and juveniles in an Abra alba (Wood) community of the eastern part of the Bay of Seine (English Channel). J. Exp. Mar. Biol. Ecol. 1996, 199, 89–109. [Google Scholar] [CrossRef]
  27. Olivier, F.; Retière, C. The role of physical-biological coupling in the benthic boundary layer under megatidal conditions: The case of the dominant species of the Abra alba community in the eastern Baie de Seine (English Channel). Estuaries 1998, 21, 571–584. [Google Scholar] [CrossRef]
  28. Montreuil, A.L.; Levoy, F.; Bretel, P.; Anthony, E.J. Morphological diversity and complex sediment recirculation on the ebb delta of a macrotidal inlet (Normandy, France): A multiple LiDAR dataset approach. Geomorphology 2014, 219, 114–125. [Google Scholar] [CrossRef]
  29. Levoy, F.; Monfort, O.; Larsonneur, C. Transports solides sur les plages macrotidales: Traçage fluorescent et application à la côte ouest du Cotentin (France). Oceanol. Acta 1997, 20, 811–822. [Google Scholar]
  30. Levoy, F.; Monfort, O.; Larsonneur, C. Hydrodynamic variability on megatidal beaches, Normandy, France. Cont. Shelf Res. 2001, 21, 563–586. [Google Scholar] [CrossRef]
  31. Levoy, F.; Anthony, E.J.; Monfort, O.; Robin, N.; Bretel, P. Formation and migration of transverse bars along a tidal sandy coast deduced from multi-temporal Lidar datasets. Mar. Geol. 2013, 342, 39–52. [Google Scholar] [CrossRef]
  32. Dugan, J.E.; McLachlan, A. An assessment of longshore movement in Donax serra Röding (Bivalvia: Donacidae) on an exposed sandy beach. J. Exp. Mar. Biol. Ecol. 1999, 234, 111–124. [Google Scholar] [CrossRef]
  33. Potvin, C. ANOVA: Experiments in controlled environments. In Design and Analysis of Ecological Experiments; Scheiner, S.M., Gurevitch, J., Eds.; Oxford University Press: Oxford, UK, 1993; pp. 46–68. [Google Scholar]
  34. Mahé, M.; Delanghe, D.; Grisel, R.; Poggiale, J.C.; Mayot, N. Distribution of Manila clam, Ruditapes philippinarum, into Berre Lagoon according to the environmental condition. Vie Milieu 2020, 70, 269–277. [Google Scholar]
  35. Bidegain, G.; Juanes, J.A. Does expansion of the introduced Manila clam Ruditapes philippinarum cause competitive displacement of the European native clam Ruditapes decussatus? J. Exp. Mar. Biol. Ecol. 2013, 445, 44–52. [Google Scholar] [CrossRef]
  36. Commito, J.A.; Thrush, S.F.; Pridmore, R.D.; Hewitt, J.E.; Cummings, V.J. Dispersal dynamics in a wind-driven benthic system. Limnol. Oceanogr. 1995, 40, 1513–1518. [Google Scholar] [CrossRef]
  37. Gotoh, H.; Sakai, T. Bivalve habitat bases on sediment-transport mechanics. In Proceedings of the Coastal Engineering 1996, Orlando, FL, USA, 2–6 September 1996; pp. 4300–4313. [Google Scholar]
  38. Cargnelli, L.M.; Griesbach, S.J.; Packer, D.B.; Weissberger, E. Essential Fish Habitat Source Document: Atlantic Surf Clam, Spisula Solidissima, Life History and Habitat Characteristics; NOAA Technical Memorandum NMFS-NE; National Oceanic and Atmospheric Administration: Washington, DC, USA, 1999; Volume 142, 22p. [Google Scholar]
  39. Bocher, P.; Piersma, T.; Dekinga, A.; Kraan, C.; Yates, M.G.; Guyot, T.; Fomer, E.O.; Radenac, G. Site- and species distribution patterns of molluscs at five intertidal soft-bottom areas in northwest Europe during a single winter. Mar. Biol. 2007, 151, 577–594. [Google Scholar] [CrossRef]
  40. Evans, O.; Hick, P.; Whittington, R.J. Comparison of two external tagging methods used for the identification of individual adult Pacific oysters Crassotrea gigas. J. Shell. Res. 2016, 35, 837–840. [Google Scholar] [CrossRef]
  41. Dernie, K.M.; Kaiser, M.J.; Richardson, E.A.; Warwick, R.M. Recovery of soft sediment communities and habitats following physical disturbance. J. Exp. Mar. Biol. Ecol. 2003, 285–286, 415–434. [Google Scholar] [CrossRef]
  42. Dernie, K.M.; Kaiser, M.J.; Warwick, R.M. Recovery rates of benthic communities following physical disturbance. J. Anim. Ecol. 2003, 72, 1043–1056. [Google Scholar] [CrossRef]
  43. Dolbeth, M.; Viegas, I.; Martinho, F.; Marques, J.C.; Pardal, M.A. Population structure and species dynamics of Spisula solida, Diogenes pugilator and Branchiostoma lanceolatum along a temporal spatial gradient in the south coast of Portugal. Estuar. Coast. Shelf Sci. 2006, 66, 168–176. [Google Scholar] [CrossRef]
  44. Berthou, P.; Glémarec, M. Distribution Temporelle et Spatiale des Cohortes de Spisula ovalis (Sowerby) dans le Nord du Golfe de Gascogne: Reflet d’une Compétition Inter-Cohortes? International Council for the Exploration of the Sea. Shellfish Committee C.M. 1988/K:35, 16p. Available online: https://www.google.com/url?sa=t&source=web&rct=j&opi=89978449&url=https://www.ices.dk/sites/pub/CM%2520Doccuments/1988/K/1988_K35.pdf&ved=2ahUKEwjj0Pr-vIWIAxVAs1YBHf1XJoEQFnoECBgQAQ&usg=AOvVaw3OI1u_yv-z45o4BgqjCL62 (accessed on 1 March 2024).
  45. Ledoux, T.; Clements, J.C.; Gallant, D.; Sonier, R.; Miron, G. Burrowing behaviour of soft-shell clams (Mya arenaria) following human disturbance. J. Exp. Mar. Biol. Ecol. 2023, 565, 151916. [Google Scholar] [CrossRef]
Figure 1. General map of the English Channel and locations of the three sites (Blainville-sur-Mer, Agon-Coutainville and Saint-Martin-de-Bréhal).
Jmse 12 01488 g001
Figure 2. (a) Sampling strategy for the three sediment types at Blainville-sur-Mer in 2014 in sandy habitats (BSa, BSb, BSc), gravelly habitats (BGa, BGb, BGc) and deep gravelly habitats (BDGa, BDGb, BDGc). (b) Sampling strategy in 2016 for the four sediment types at Blainville-sur-Mer in sandy habitats and gravelly habitats, as well as at Agon-Coutainville (Aa, Ab, Ac) and Saint-Martin-de-Bréhal (Sa, Sb, Sc). (c) Design of the 2018 experiment with locations of the 25 raking quadrats and the positions of the four batches of marked clams (in black, yellow, red and blue) at the Blainville-sur-Mer sandy habitat.
Jmse 12 01488 g002aJmse 12 01488 g002b
Figure 3. Photos of live clams (on right) and dead clams (on left) marked with paint before placement on a circle of 1 m radius (photo).
Jmse 12 01488 g003
Figure 4. Size of Ruditapes spp. clams harvested from 10 m2 at T0 and T1 at the three Blainville-sur-Mer sites in 2014. Size classes are expressed in mm. N: number of measured clams.
Jmse 12 01488 g004
Figure 5. Size of Ruditapes spp. clams harvested from 10 m2 at T0 and T1 at the four Blainville-sur-Mer (BLSMS and BLSMG), Agon-Coutainville (AGON) and Saint-Martin-de-Bréhal (SMDB) sites, and at T2 in the stations of both sites at Blainville-sur-Mer in 2016. Size classes are expressed in mm. N: number of measured clams.
Jmse 12 01488 g005aJmse 12 01488 g005b
Figure 6. Size of Ruditapes spp. clams harvested in the 25 quadrats of 1 m2 at T0, T1 and T2 at the Blainville-sur-Mer sand site (BS). Size classes are expressed in mm. N: number of measured clams.
Jmse 12 01488 g006
Figure 7. Position of clams found at a distance > 20 cm: live clams in blue and dead clams in orange at BS after a period of 13 days in 2017. The clams initially located on the double blue circle of 1 m radius are not represented.
Jmse 12 01488 g007
Figure 8. Position of clams found at a distance > 20 cm: live clams in blue and dead clams in orange at BS after a period of 54 days in 2017. The clams located initially on the double blue circle of 1 m radius are not represented.
Jmse 12 01488 g008
Figure 9. Position of clams found at a distance > 20 cm: live clams in blue and dead clams in orange at the A site after a period of 54 days in 2017. The clams located initially on the double blue circle of 1 m radius are not represented.
Jmse 12 01488 g009
Table 1. Number of Ruditapes spp. clams harvested in 2014 from the 10 m2 surface raking at T0 and T1 in the nine stations of the three Blainville-sur-Mer sites. Mean abundance per m2 with standard deviation.
Sites/StationsT0T1Ratio T1/T0 in %
BS a46150.0
BS b433376.7
BS c201575.0
Mean22.3 ± 19.618.0 ± 13.7
BG a1331813.5
BG b9388.6
BG c882225.0
Mean105 ± 24.616 ± 7.2
BDG a92854.3
BDG b612282.0
BDG c461430.4
Mean66.3 ± 23.414.7 ± 7.0
Table 2. Results of the ANOVA tests for the 2014 and 2016 samplings. * p < 0.05, ** p < 0.01 and *** p < 0.001.
Variables FactorsDfFpTukey Test
2014 samplingDate134.24650.00007813 ***T0 > T1
Sediment type27.92050.006412 **BG > BS
Date: Sediment type28.77220.004490 **
2016 rake sampling
T0-T1 for BS, S, BDG, A
Clam abundanceDate118.18510.0005931 ***T0 > T1
Sediment type313.17540.0001368 ***BS > S, BDG, A
Date: Sediment type32.20580.1270535
2016 rake sampling T0-T1-T2 for BS and BDGDate25.18850.0237838 *T0 > T1; T2
Sediment type125.60660.0002797 ***BS > BDG
Date: Sediment type21.36710.2918395
2016 rake sampling
T0-T1 for BS, S, BDG, A
Clam sizeDate18.12390.004482 **T0 > T1
Sediment type339.6583<0.001 ***S < BDG; A < BS
Date: Sediment type33.08100.026802 *
2016 rake sampling T0-T1-T2 for BS and BDGDate22.15470.1167
Sediment type139.4281<0.001 ***BDG > BS
Date: Sediment type21.10890.3305
Table 3. Number of Ruditapes spp. clams harvested in the 10 m2 at T0 and T1 in the stations of the four Blainville-sur-Mer (BS), Agon (A) and Saint-Martin-de-Bréhal (S) sites, and at T2 in the stations of both sites at Blainville-sur-Mer in 2016.
Sites/StationsT0T1Ratio T1/T0 in %T2Ratio T2/T1in %
BS a5160117.665108.3
BS b1223528.749140.0
BS c1274233.03276.2
100 ± 50.245.7 ± 12.9 48.7 ± 16.5
BDG a16637.53 50.0
BDG b511183.3327.3
BDG c521223.1650.0
24.3 ± 24.69.7 ± 3.2 4.0 ± 1.7
A a2314.3
A b191473.7
A c10330.0
17.3 ± 6.66.0 ± 7.0
S a651218.5
S b47612.8
S c63812.7
58.3 ± 9.98.7 ± 3.03.0
Table 4. Number of Ruditapes spp. clams harvested in the 25 quadrats of 1 m2 at T0 (18 January), T1 (27 February) and T2 (28 March) at the BS site in 2018.
QuadratT0T1Ratio T1/T0 in %T2Ratio T2/T1 in %
1-122313.700
1-211218.2150.0
1-31218.300
1-47228.6150.
1-513646.2466.7
2-116318.8266.7
2-28225.0150.0
2-31317.72200.0
2-412433.3125.0
2-512650.000
3-16233.32100.0
3-2600.03-
3-3600.00-
3-4800.02-
3-512325.0133.3
4-11200.01-
4-220315.0133.3
4-312547.1360.0
4-41200.00-
4-52000.01-
5-115213.32100.0
5-22100.02-
5-317423.620.5
5-49111.12200.0
5-51100.00-
Total3135016.03468.0
Mean12.5 ± 4.82.1 ± 1.9 1.4 ± 1.1
Disclaimer/Publisher’s Note: The statements, opinions and data contained in all publications are solely those of the individual author(s) and contributor(s) and not of MDPI and/or the editor(s). MDPI and/or the editor(s) disclaim responsibility for any injury to people or property resulting from any ideas, methods, instructions or products referred to in the content.