Abstract
Water entry slamming is a complicated issue in marine engineering, characterized by significant impact loads and complex flow. This paper establishes a 3D numerical model of flat plate water entry slamming based on smoothed particle hydrodynamics (SPH), and the dynamics and flow field evolution are analyzed during water entry. The results indicate that SPH effectively captures the key dynamic characteristics of flat plate water entry. The experimental data validate the model, and the SPH particles reproduce the phenomena of jet formation, cavity development, and fluid splashing. The observed pressure is maximum at the center of the flat plate, and the maximum pressure and vertical force of the flat plate exhibit a quadratic relationship with the water entry velocity. The flow field evolution from initial jet formation at the time of slamming to droplet splashing shows obvious stages. As the water entry depth of the flat plate increases, the growth rates of the cavity width and splash height gradually slow under fluid viscosity and drag. The water entry velocity has the greatest influence on droplet splashing, whereas its influence on the jet separation point and the position of the free liquid surface is less significant.
1. Introduction
Water entry slamming of structures is a common problem in ships and marine engineering, as it has a significant impact on the hull dynamics during navigation and the safety of offshore operations, especially in processes such as the lifting of subsea equipment like anti-sink plates with a flat bottom through the splash zone [1,2]. When the marine structure touches the water surface and penetrates it, there is a violent interaction between the structure and the water, so the bottom of the structure is susceptible to a significant transient slamming load, which seriously threatens the safety of the subsea equipment. This phenomenon is particularly significant in marine engineering, and understanding the dynamics of water entry slamming can greatly influence the design and safety of marine structures. Additionally, when a structure impacts the water, the deformation of the free surface leads to flow separation, which in turn results in significant fluid splashing and causes structural movement. For offshore lifting operations, for example, the movement of the structure may lead to collisions between the structure and the crane vessel. Hence, it is crucial to study the influence of structures entering water and to analyze the mechanisms behind feature formation and their development.
Water entry slamming of structures has been studied internationally with great interest in recent years, and this research encompasses theoretical, experimental, and numerical methods. Over the past few decades, various theories for predicting hydrodynamic impact loads have been proposed [3,4,5]. For the sake of computational convenience, these theoretical methods often involve simplified models, primarily two-dimensional models. Researchers have also carried out experiments on water entry slamming. Studies have been conducted on the impact loads and splash evolution of wedge water entry [6] and flow field evolution involving cavities, jets, and splashes with different initial conditions in water entry slamming of cylinders [7,8,9] and spheres [10,11]. The problem of flat-bottomed, structured water entry has also been widely studied. Huera-Huarte et al. [12] carried out a series of experiments to study the slamming forces experienced by flat plates during free surface impacts, characterizing the loads during the initial water entry phase. Mai et al. [13] conducted vertical water entry slamming experiments on a square flat plate and analyzed the impact load characteristics of the plate during water entry. Talioua et al. [14] experimentally investigated the impact loads of rigid circular plates with different diameters during water entry. They found that the impact load of a flat plate during water entry is greater than that of wedge-shaped structures. The slamming force curve of the flat plate is steeper, and the energy is more concentrated, making it more likely to cause damage to the plate structure during instantaneous slamming.
Advances in computer technology and hydrodynamics have led to the use of numerical techniques derived from the Navier–Stokes equations for analyzing the water entry slamming of structures. These techniques can be divided into two main types: Eulerian and Lagrangian methods. Within the Eulerian framework, turbulence models based on Reynolds-averaged Navier–Stokes (RANS) equations have rapidly developed, and the volume of fluid (VOF) method for free surface capturing has been widely used. Consequently, grid-based numerical methods have been extensively applied to simulating water entry slamming of structures [15,16]. Yuan et al. [17] explored the formation of impact cavities and the dynamics of a cylinder during its vertical entry into water, analyzing different flow conditions and entry speeds through numerical simulations. Wu et al. [18] numerically analyzed the characteristics of the water entry of an airdropped underwater glider using the finite volume method (FVM) and found that the wing significantly enhances the impact loading of the glider, and the degree of enhancement is affected by the entry attitude. Qi et al. [19] used the finite volume method (FVM) to numerically examine how varying current velocities affect the impact cavity and flow behavior of a cylinder during water entry. Their findings reveal that the presence of current disrupts the symmetric development of these cavities. Additionally, the lattice Boltzmann method (LBM) has been applied to studying water entry impacts on structures. Xiao et al. [20] proposed a coupled method that integrates the immersed boundary LBM with a single-phase free surface model to simulate water entry slamming and validated it through experiments with cylinders and wedges. However, these traditional grid-based numerical methods often face challenges such as grid distortion due to complex mesh calculations when simulating water entry problems, and they also struggle with simulations involving large structural movements and significant free surface deformations. Compared with the Eulerian mesh method, the Lagrangian meshless methods offer a distinct advantage in handling significant deformations and free surface fragmentation.
Smoothed particle hydrodynamics (SPH) is an advanced Lagrangian meshless method that has gradually expanded from its initial application in astrophysics to fields such as continuum mechanics and free surface flows. Currently, SPH is widely used in various applications, including free surface flows, multiphase flows, incompressible flows, and porous media flows. Over the past 40 years, numerous improvements have been made to the traditional SPH method, resulting in a range of advanced SPH algorithms, including weakly compressible SPH (WCSPH), incompressible SPH (ISPH), and Riemann SPH. SPH has a great advantage in simulating free surface flows such as waves and splashes and enables the simulation of different physical phenomena such as water entry, violent wave impacts on structures, and turbulence [21,22,23,24,25,26]. Therefore, SPH is more suitable for simulating water entry, and in recent years, researchers have used it to investigate various characteristics and laws of water entry slamming. Chen et al. [27] numerically examined the water entry of a wedge and a bow, respectively, by employing an enhanced solid boundary approach that integrates the dummy particle boundary with the normal flux method. Zhang et al. [28] investigated the kinematics and dynamics of 3D water entry in a circular cylinder with a GPU-accelerated SPH method. Lyu et al. [29] established a fully 3D WCSPH model to study a free-falling lifeboat entering water at different angles. Fang et al. [30] analyzed the water entry slamming of a flat plate and LNG tank insulation panels using Riemann SPH. Zhao et al. [31] analyzed the fluid field evolution and structural dynamics for water entry of a bow-flare ship body section under different ocean current velocities. Wang et al. [32] investigated the motions and force of a free-falling sphere entering water using SPH, and the numerical results agreed well with the experimental data. In summary, although researchers have extensively studied water entry slamming on structures, existing research primarily focuses on impact loads on structures, with less attention given to flow separation and flow field evolution. Therefore, this paper establishes a three-dimensional numerical model of water entry slamming for a flat plate based on WCSPH, analyzing the impact load and flow field evolution.
2. Numerical Methods
This paper primarily investigates the hydrodynamics of water entry slamming by marine structures, involving complex free surface flow characteristics such as fluid cavities, jets, and splashes formed by the structure impacts. Therefore, this study uses the open-source code DualSPHysics based on WCSPH to simulate the vertical water entry slamming of a flat plate [33]. This section introduces the SPH method used here, including the fundamental formulation of SPH, and discusses the implementation of the boundary conditions.
2.1. SPH Formulation
In SPH, a set of particles is used to discretize a continuum. When used to simulate fluid dynamics, the discretized Navier–Stokes equations are integrated locally at the position of each particle on the basis of the physical characteristics of the surrounding particles. The set of neighboring particles is defined using a distance-based function that is circular (two-dimensional) or spherical (three-dimensional), with a related smoothing length typically represented by h. The function of the kernel approximation can be expressed as
where W stands for the smoothing kernel function, h signifies the smoothing length, and r represents the position vector of the SPH particle.
The quality of an SPH model is heavily influenced by the choice of the smoothing kernel function. This kernel is defined based on the dimensionless distance between particles, q = r/h, where r represents the distance between particles a and b. The parameter h (smoothing length) dictates the extent of the region around particle a that includes neighboring particles. Therefore, for all cases, this paper uses the Wendland fourth-order kernel function for smooth interpolation within an influence domain of 2h [34]. This paper primarily investigates the hydrodynamic characteristics of flat plate water entry, disregarding heat conduction effects. Therefore, the governing equations based on the SPH kernel approximation are
where Γ denotes the viscous dissipative terms and g represents gravitational acceleration. The artificial viscosity term proposed by Monaghan has become commonly used for fluid simulation using SPH theory owing to its simplicity [35]. An artificial diffusive term, derived from Neumann–Richtmeyer artificial viscosity, is incorporated into the momentum equation to minimize oscillations and stabilize the SPH scheme [36]. In the SPH notation, Equation (2) can be expressed as
where Pk and ρk are the pressure and density corresponding to particle k (as evaluated at a or b). The viscosity term, Πab, is given by
where and with and being the particle position and velocity, respectively, , is the numerical speed of sound, , and is the artificial viscosity coefficient.
In the SPH method used here, the fluid is treated as weakly compressible, and an equation of state (EOS) is used to determine fluid pressure using particle density [37]. The equation of state is
where γ is a constant with a typical value of 7 for water; is the reference density, here taken as the density of water, which is 1000 kg/m3; and is the numerical speed of sound defined as [38]. In the water entry problem, the choice of numerical sound speed is crucial. For the plate water entry slamming problem, referring to the suggestions by Marrone et al. [39] and the discussion by Fang et al. [30], for all the simulations in this paper, the sound speed of water satisfying Ma = Uimpact/cwater = 0.017 is adopted. Therefore, the sound velocity coefficient was determined to be 60 in this paper, as shown in Table 1.

Table 1.
SPH parameter setup for the simulation of flat plate water entry.
Time integration is performed using the symplectic position Verlet integrator [40]. The symplectic position Verlet integrator is an explicit time integration method that is ideal for Lagrangian schemes because it is time-reversible and symmetric in the absence of diffusive terms, maintaining geometric properties. With explicit time integration, the time step depends on the Courant–Friedrichs–Lewy (CFL) condition, the forcing terms, and the viscous diffusion term. A variable time step Δt is calculated using the following formula [37]:
where is the magnitude of particle acceleration. The variable time step is chosen as the minimum of and , and is bounded by the Courant number CCFL, which is usually in the range of 0.1 to 0.2.
2.2. Boundary Conditions
In SPH simulations, the dynamic boundary condition (DBC) is crucial. Boundary particles are treated similarly to fluid particles within the governing equations, yet they remain stationary or follow a predetermined motion, such as in the case of moving components like gates or wave-makers. As a fluid particle approaches a boundary and the distance to the boundary particles drops below 2 h, a density increase occurs in the boundary particles, leading to a rise in pressure. This pressure increase induces a repulsive force on the fluid particle due to the pressure term in the momentum equation. DBCs excel at discretizing complex 3D geometries into boundary particles, making them valuable in various engineering applications. Nevertheless, DBCs present challenges, such as excessive dissipation, unrealistic density and pressure evolution in stationary boundary particles, and the development of disproportionately large boundary layers.
The paper introduces a modified dynamic boundary condition (mDBC). In this method, boundary particles are placed similarly to the original DBC, with the boundary interface positioned half a particle spacing from the nearest boundary particles. Each boundary particle creates a ghost node across the boundary interface and into the fluid. For flat surfaces, this ghost node is mirrored along the boundary normal direction into the fluid, and its fluid properties are computed using an adjusted SPH sum of neighboring fluid particles. In corner regions where multiple boundary normals intersect, mirroring along a single normal is impractical. Instead, ghost nodes are mirrored through the corner interface formed by the intersecting boundary lines into the fluid region. Fluid properties at these ghost nodes are also determined via an adjusted SPH sum and then reflected back to the boundary particles. This technique enhances the accuracy and smoothness of the pressure field, effectively reducing the size of the boundary layer [41].
3. Results and Discussion
3.1. Model Validations
To validate the accuracy and applicability of the modeling method in this work, we reproduce a case of vertical water entry slamming by a flat plate by comparing the numerical results with the experimental findings of Ma et al. [13].
3.1.1. Numerical Models
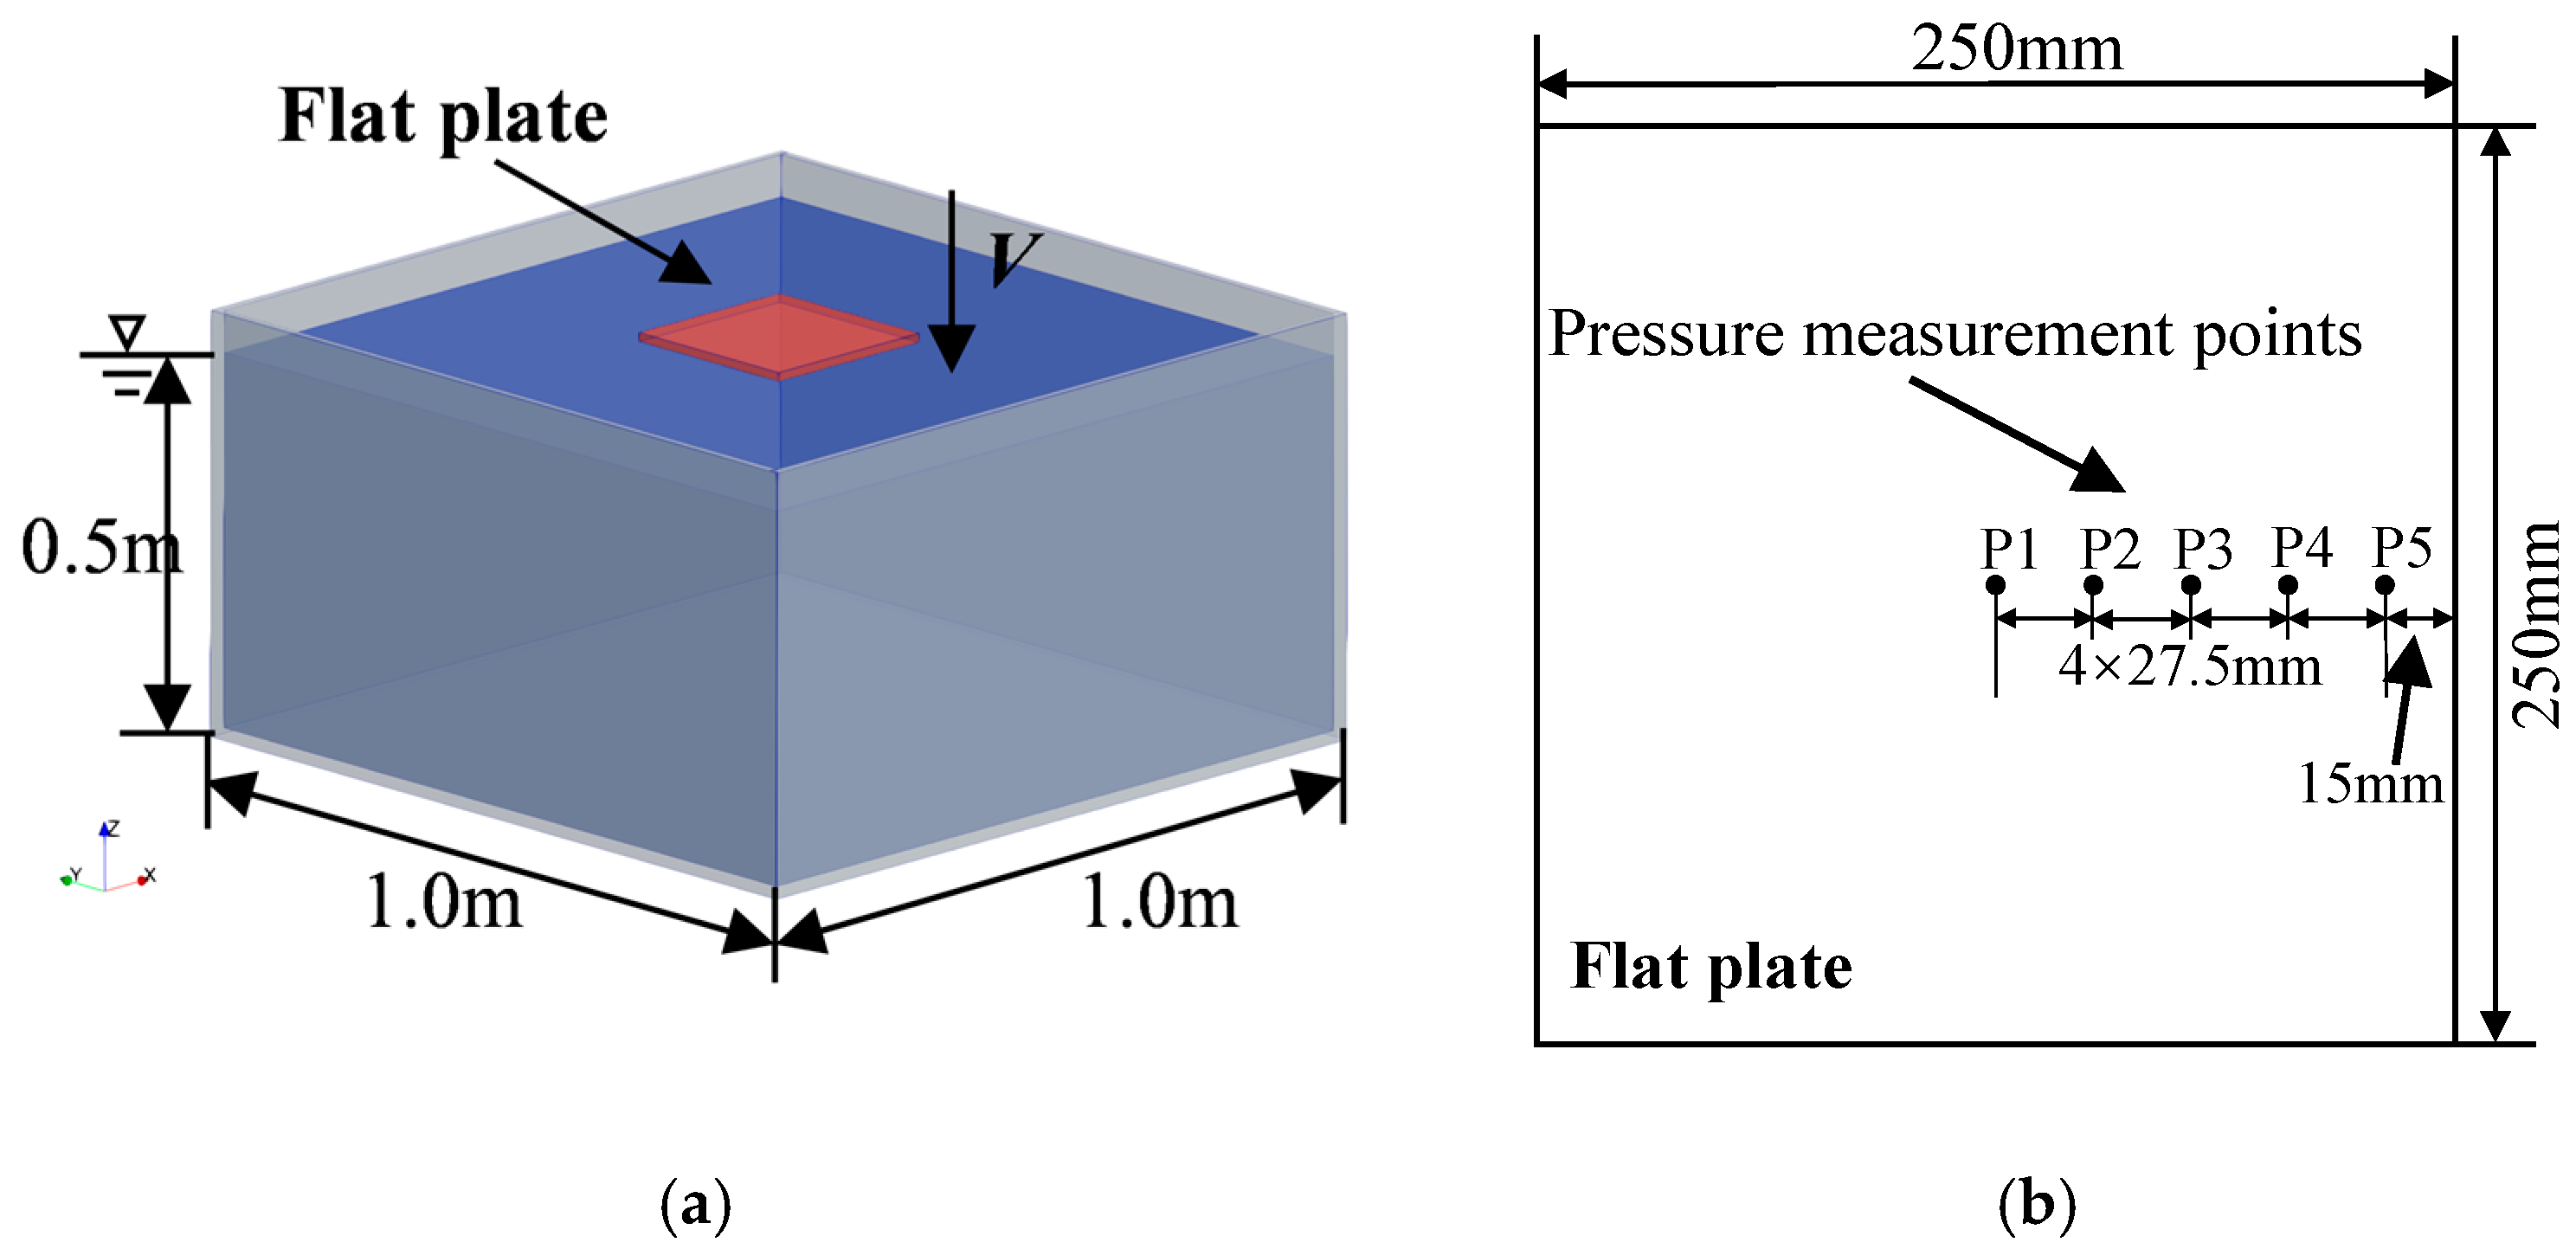
Here, the numerical setup and parameters used in our study are presented. The flat plate model in our research is based on the experiment by Ma et al. [13]. The experiment was conducted at Plymouth University’s 35 m long by 15.5 m wide ocean basin, with a water depth of 1 m. In the experiment, the falling block consisted of a rigid flat slamming plate connected to two driver plates, with a total mass of 32 kg. The dimensions of the flat plate model were 0.25 m × 0.25 m in length and width with a thickness of 0.012 m, and the water entry slamming speed was from 4 m/s to 7 m/s. A three-dimensional numerical model was adopted, as shown in Figure 1a. The length, width, and depth of the water domain were set to L = 1.0 m, W = 1.0 m, and H = 0.5 m, respectively. Because the focus of this research was on the hydrodynamic characteristics of a flat plate slamming a water surface, the flat plate was released from a fixed height of 0.014 m above the still water surface to save simulation time. Therefore, the initial velocity of the flat plate was calculated from its release height and water entry slamming velocity in the numerical simulation. Figure 1b displays the pressure measurement points along the symmetry axis of the flat plate. Because of the symmetry of the flat plate, five pressure measurement points were chosen equidistantly along the symmetry axis of the flat plate. Point P1 was at the center of the flat plate, and additional measurement points (P2, P3, P4, and P5) were set every 27.5 mm to the right of P1, as shown in Figure 1b. Point P5 was 110 mm from the plate center (P1) and 15 mm from the right edge of the plate. In addition, the SPH parameter setup is shown in Table 1.

Figure 1.
Sketch of the calculation domain: (a) Three-dimensional sketch of the SPH model for water entry of a flat plate; (b) Pressure measurement points of the flat plate.
3.1.2. Effect of Particle Resolution
Table 2 presents the maximum pressures and maximum vertical forces of the flat plate at four different particle resolutions (for initial particle spacings dp = 0.005 m, 0.0046 m, 0.004 m, and 0.0036 m). As the resolution increases, the numerical results gradually converge. When dp = 0.004 m, the relative errors of both pressure and vertical force are less than 5%. Therefore, taking both numerical accuracy and computational efficiency into account, this study selected an initial particle spacing of dp = 0.004 m.
Table 2.
Influence of initial particle resolution.
3.1.3. Validations of Numerical Results
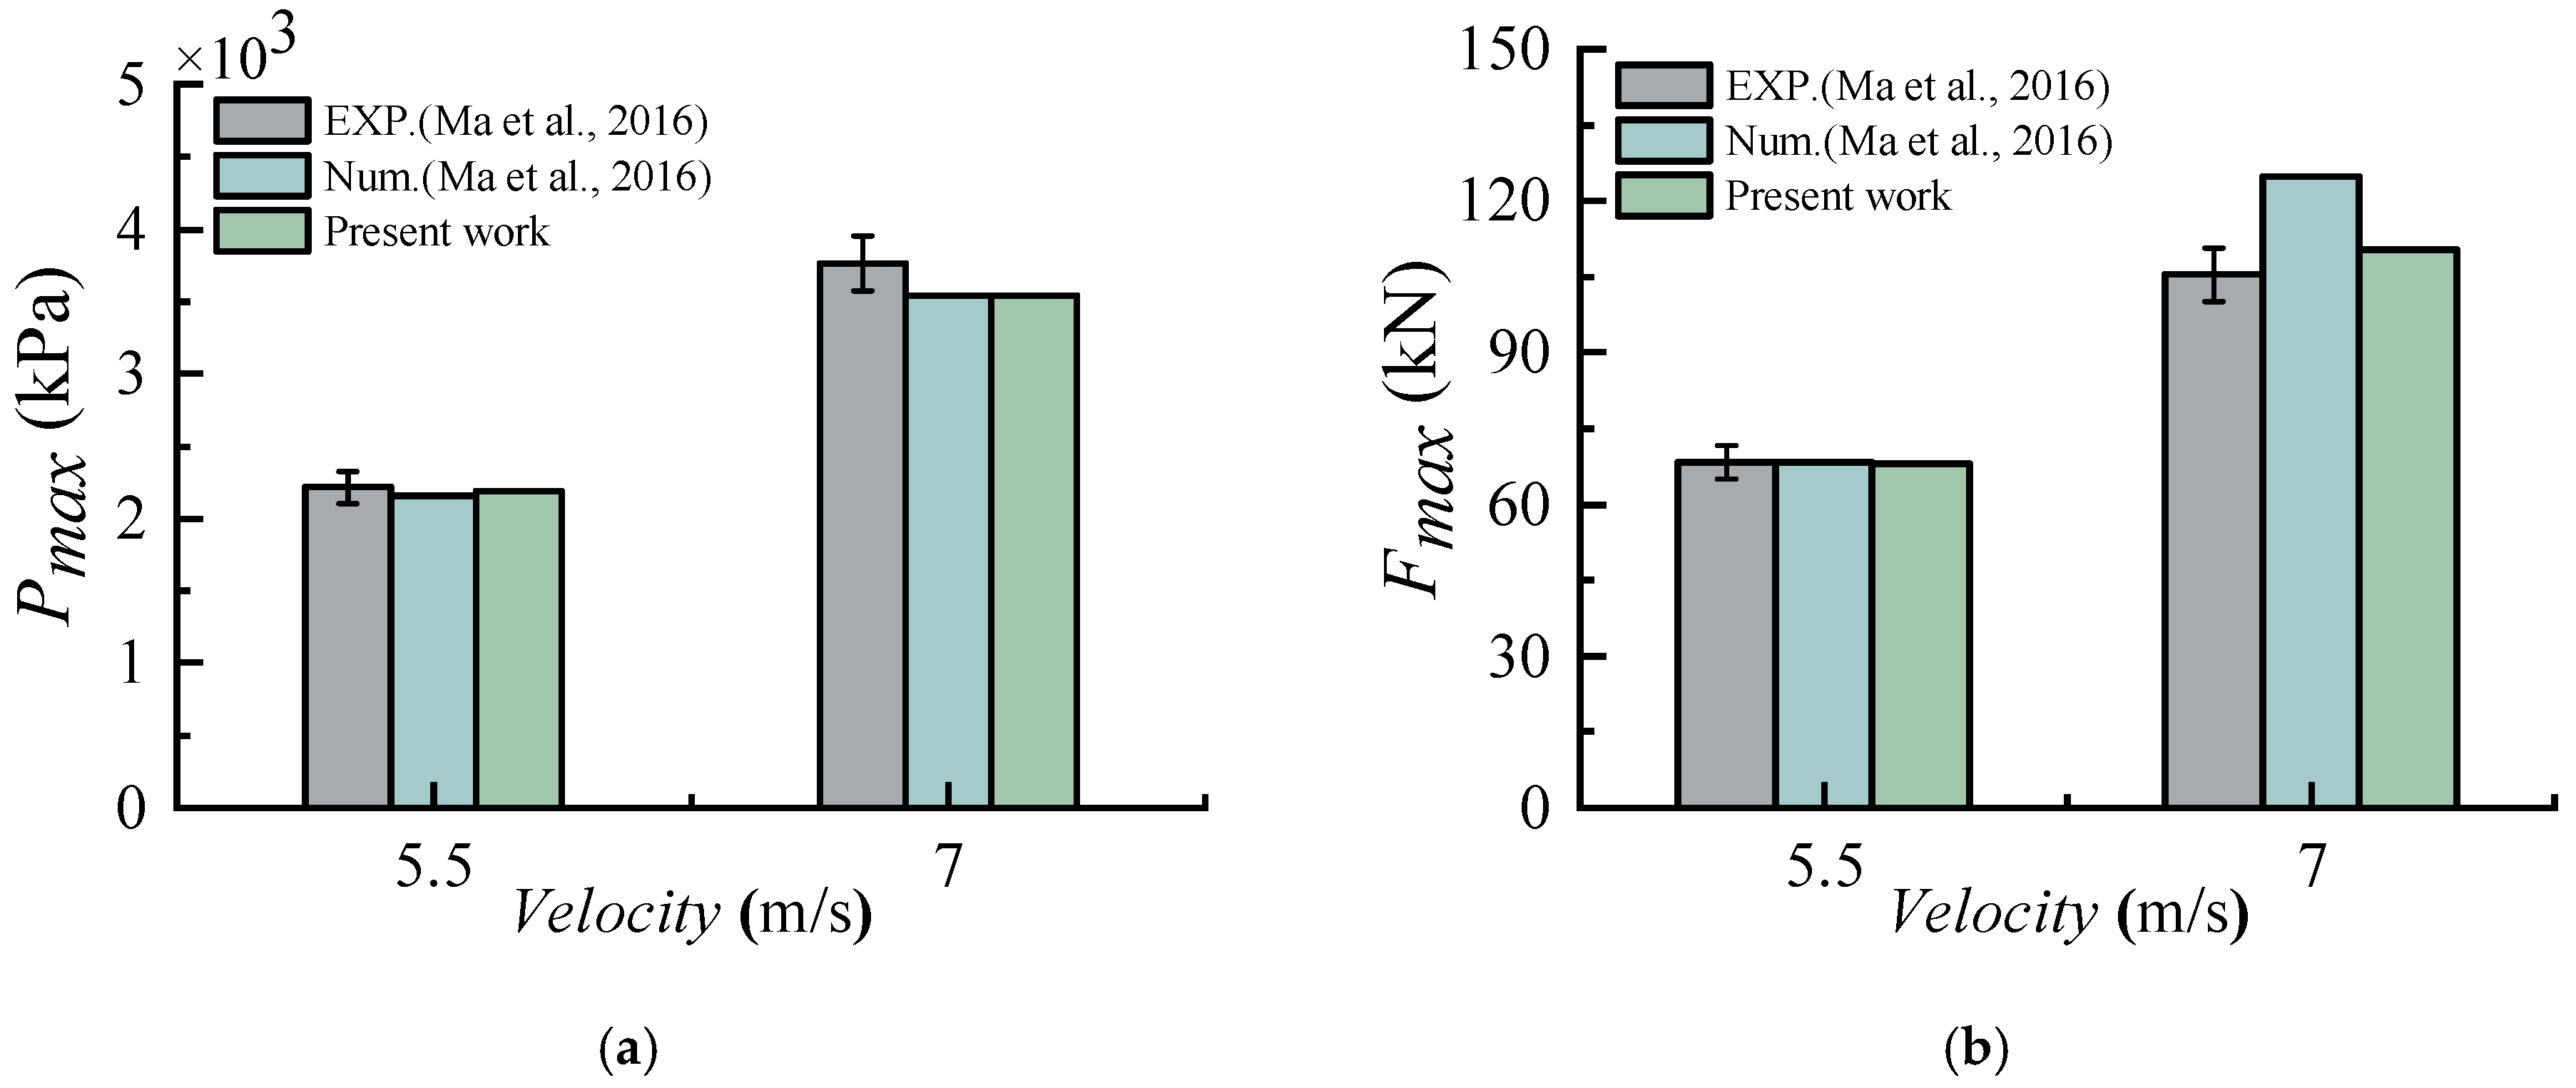
Two water entry velocities, 5.5 m/s and 7.0 m/s, were chosen to validate the numerical model. The numerical results are highly consistent with the experimental values for both the maximum pressure and the maximum vertical force, as shown in Figure 2. When the water entry velocity is 5.5 m/s, the numerical results for both parameters deviate from the experimental values by less than 5%. Therefore, the meshless numerical model based on SPH developed in this study demonstrates high accuracy in predicting the water entry slamming of a flat plate, making it suitable for the subsequent research presented in this paper.
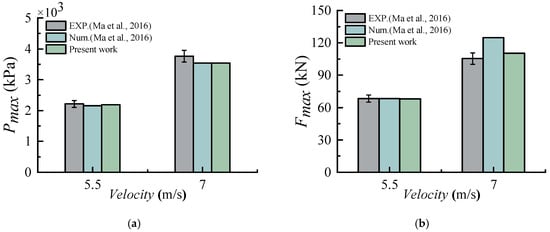
Figure 2.
Comparison of numerical results and experimental values at V=5.5 m/s and 7 m/s: (a) maximum pressure; (b) maximum vertical force [13].
3.2. Slamming Dynamics
This section presents a comparative analysis of the slamming dynamics of the flat plate at various water entry velocities ranging from 2.2 to 6.6 m/s. The flat plate was only allowed to move vertically, and the pressure and vertical force experienced by the plate at each water entry velocity were analyzed.
3.2.1. Pressure Distribution
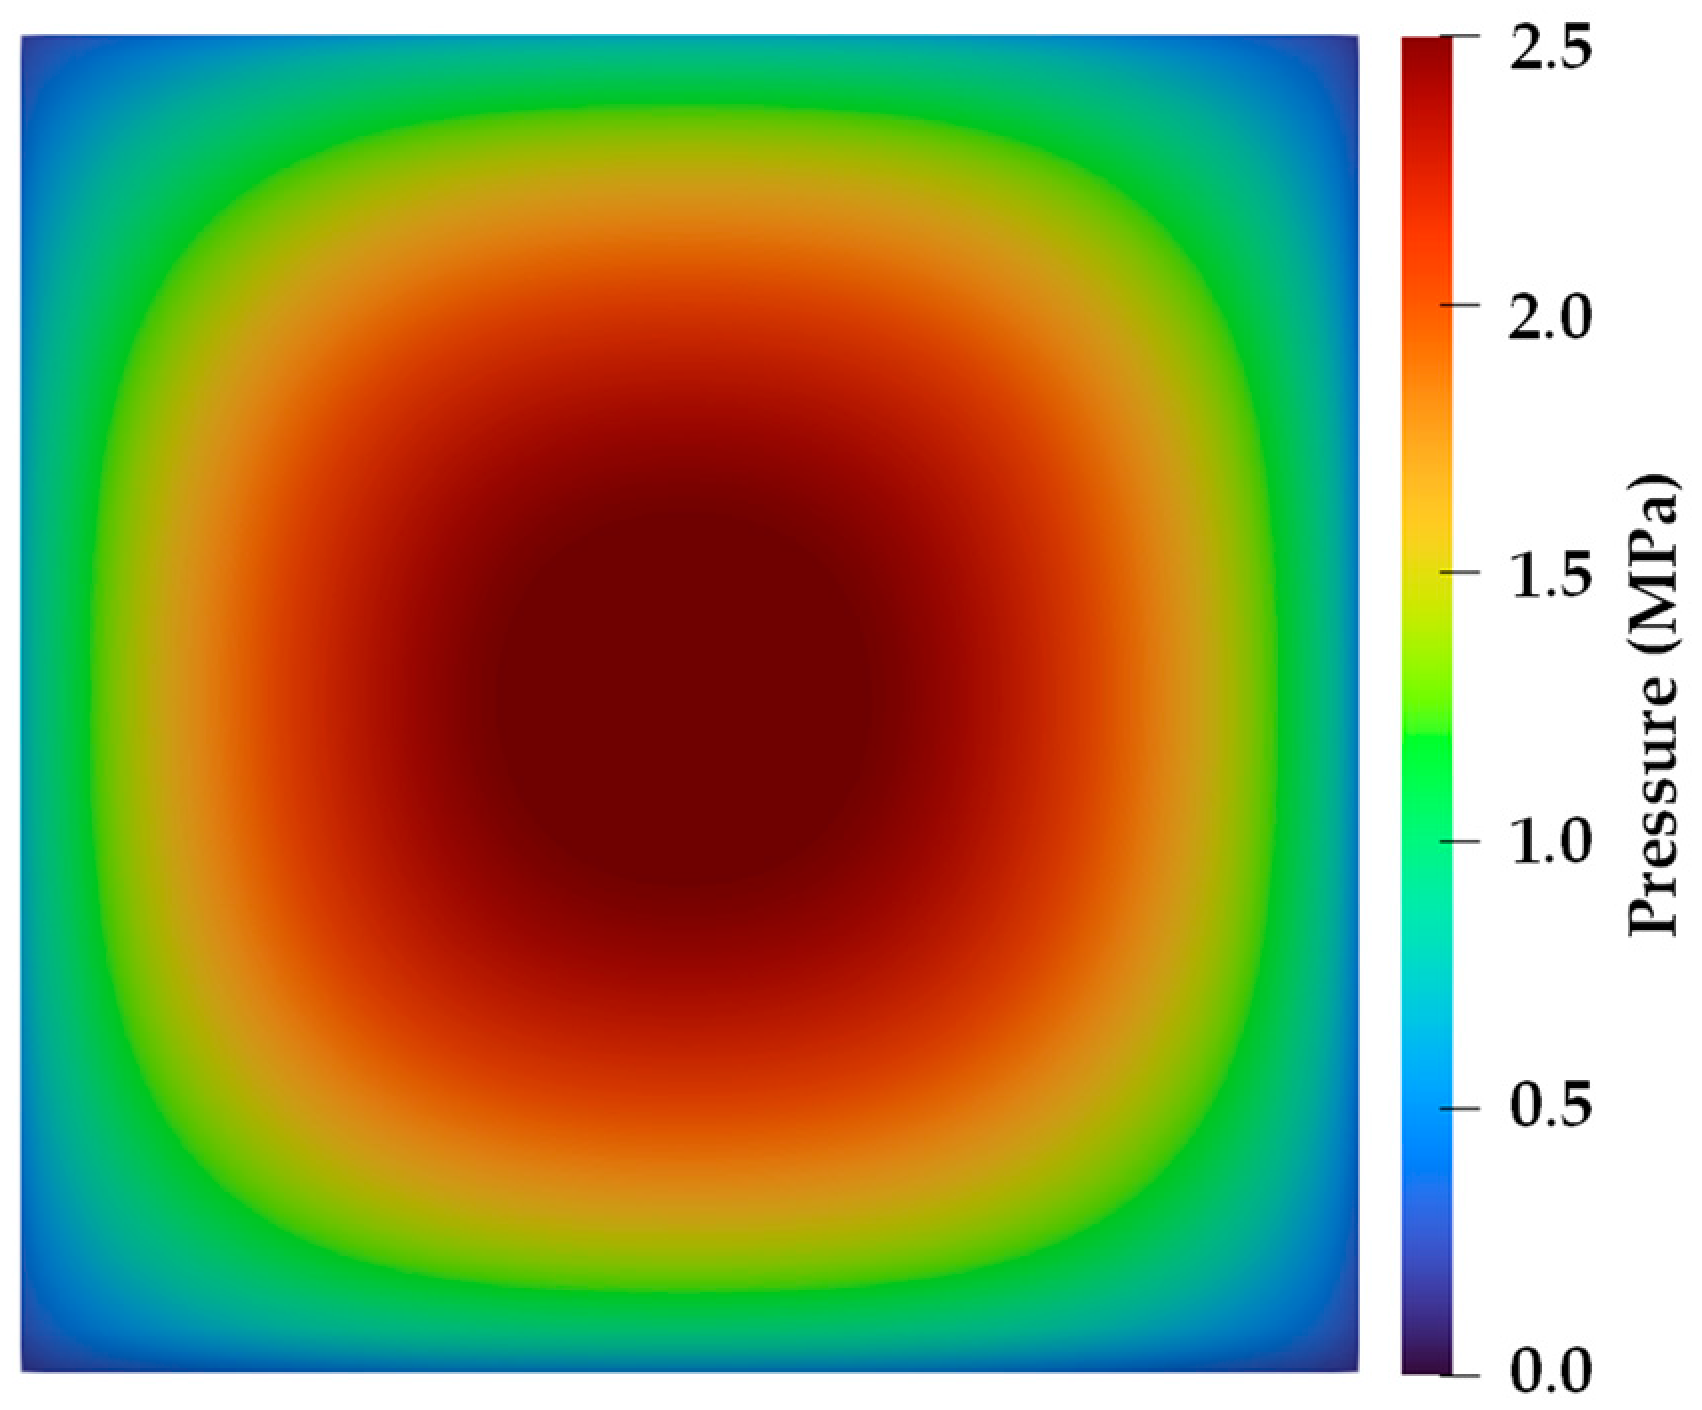
Figure 3 shows the cloud map of the pressure distribution on the flat plate at V = 5.5 m/s. The cloud map corresponds to the moment of maximum pressure during the water entry, which is at t = 0.56 ms, as shown in Figure 4b. As shown in Figure 3, the pressure values are symmetrically distributed in a circular pattern centered in the middle of the plate. The maximum pressure occurs at the center of the plate (the stagnation point), while the minimum pressures are at the four corners and edges of the plate. The pressure gradually decreases along the diameter of the circle towards the edges of the plate.
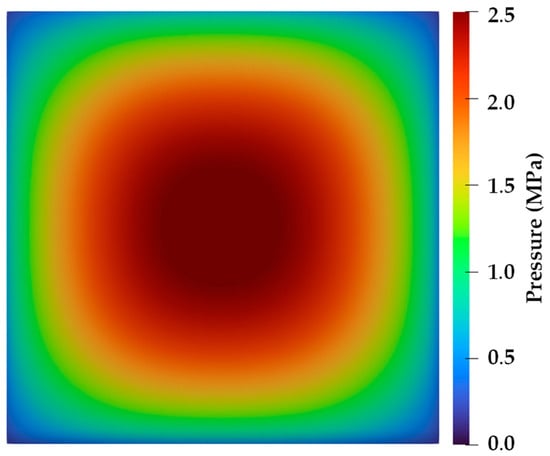
Figure 3.
Cloud map of the pressure distribution on the flat plate at V = 5.5 m/s.
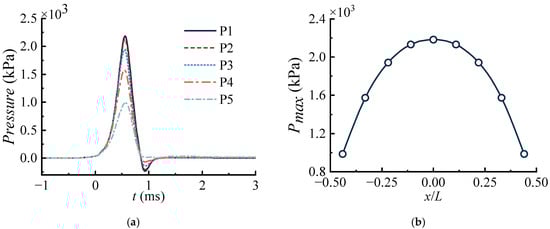
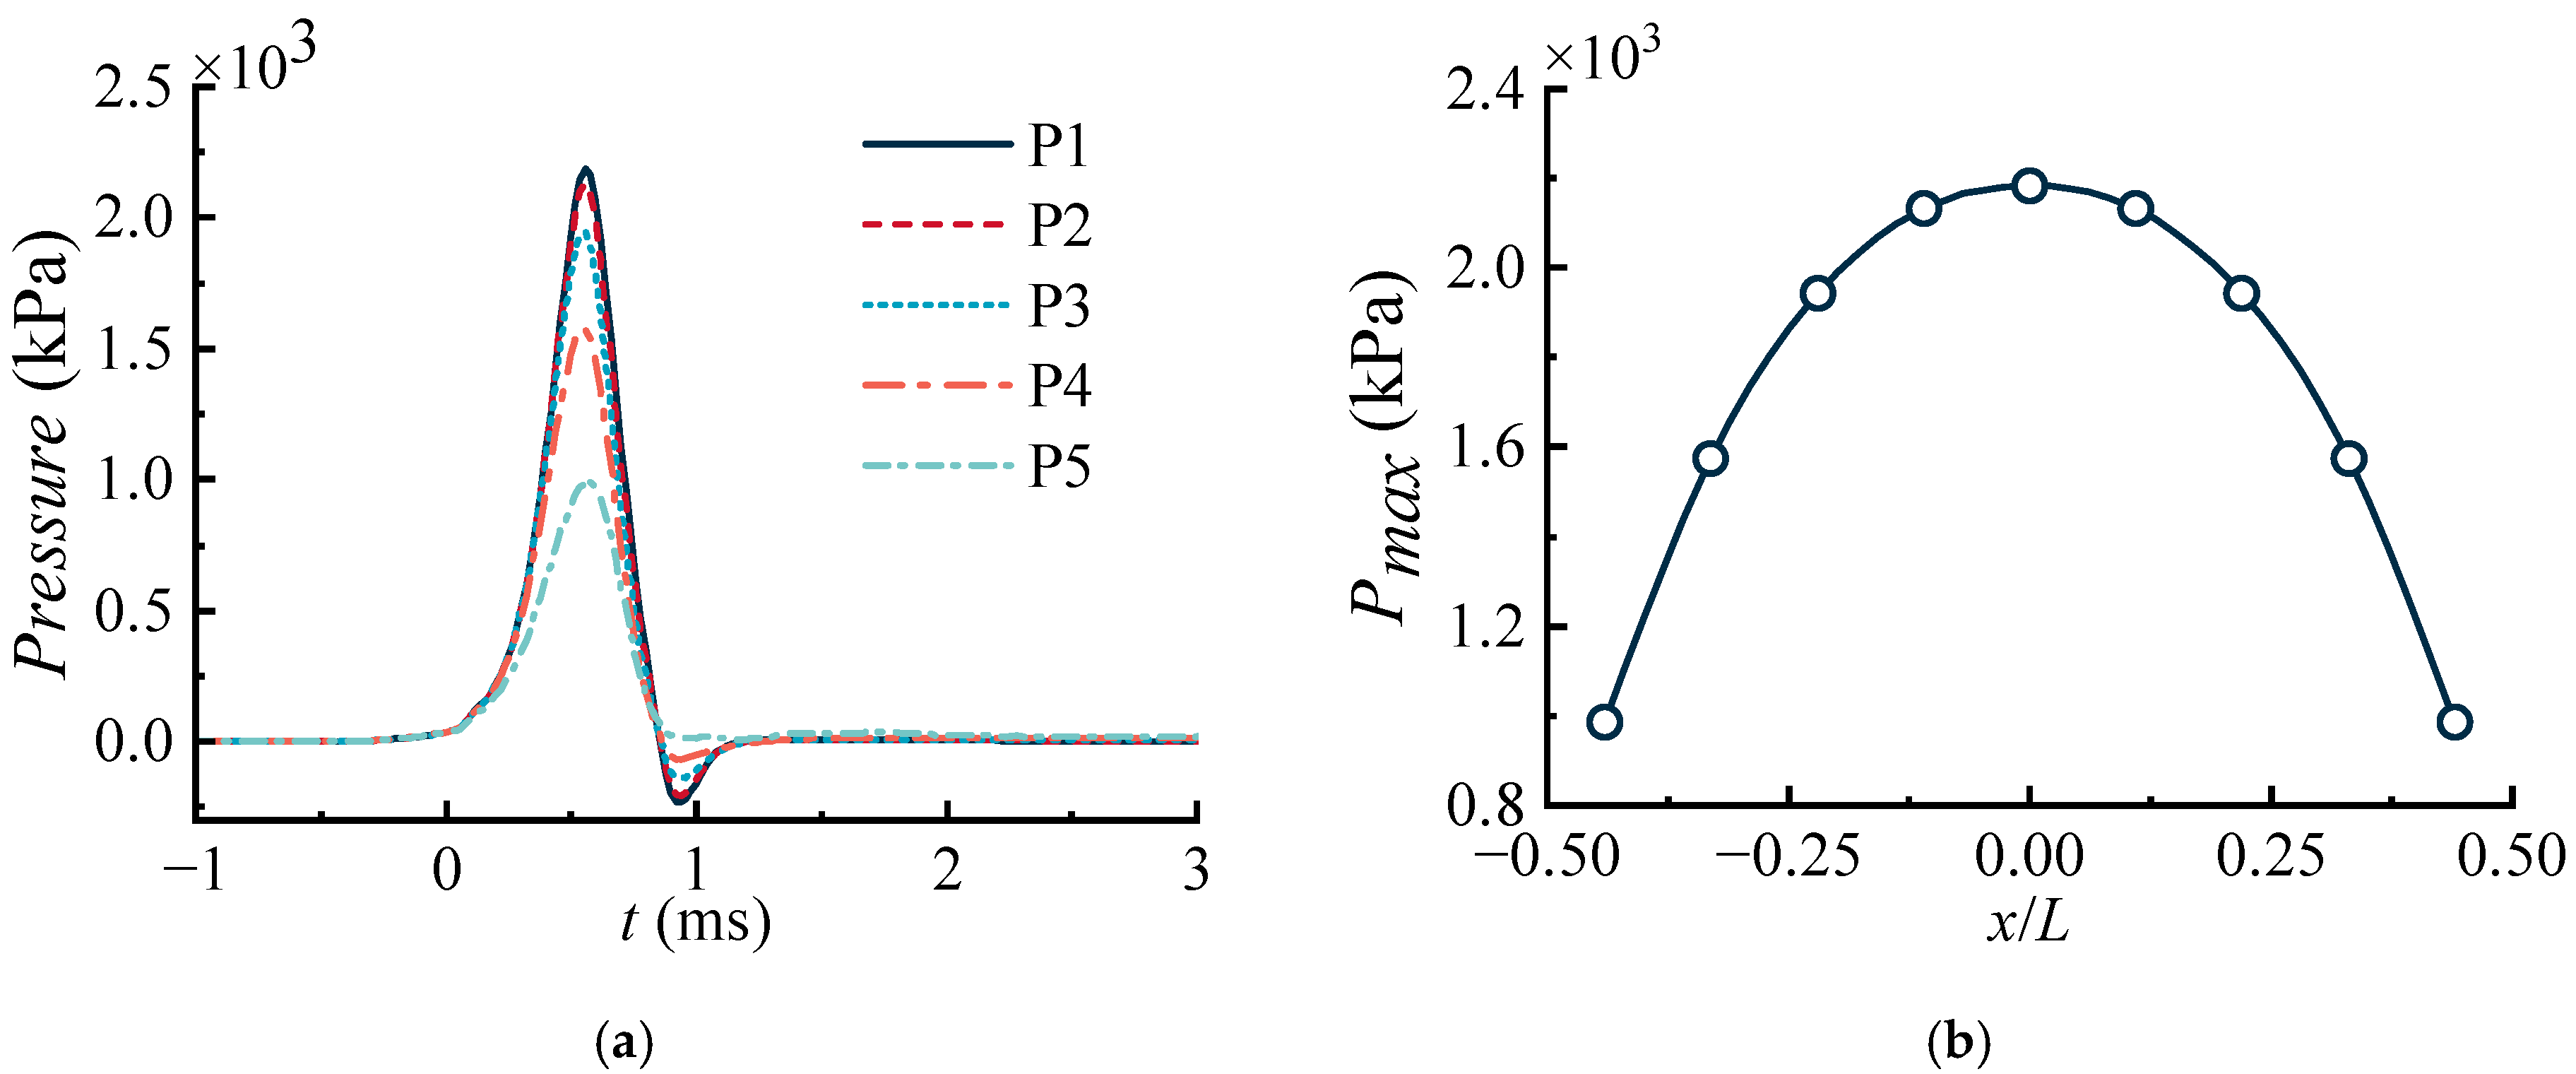
Figure 4.
Pressure at different measurement points for V = 5.5 m/s: (a) pressure time histories; (b) maximum pressure.
Therefore, to obtain accurate pressure values, five points were marked (as shown in Figure 1b), and the pressures were recorded at those points during the water entry. The time–history curves of the pressure at the measured points are presented in Figure 4a. For ease of comparison, the time origin (t = 0 ms) is set when the flat plate just impacts the water surface. Figure 4b illustrates the relationship between the maximum pressure Pmax at the measurement point and the position of the measurement point along the axial direction of the flat plate, where the horizontal axis is the axial position of the measurement point relative to the plate length (x/L), and the vertical axis is the maximum pressure at the measurement point. The maximum pressure in Figure 4b has a quadratic relationship with the measurement point’s position along the symmetry axis of the flat plate. The parabolic distribution of the maximum pressure has its vertex at the center of the flat plate, at which position Pmax is highest.
3.2.2. Analysis of Response Extreme Value
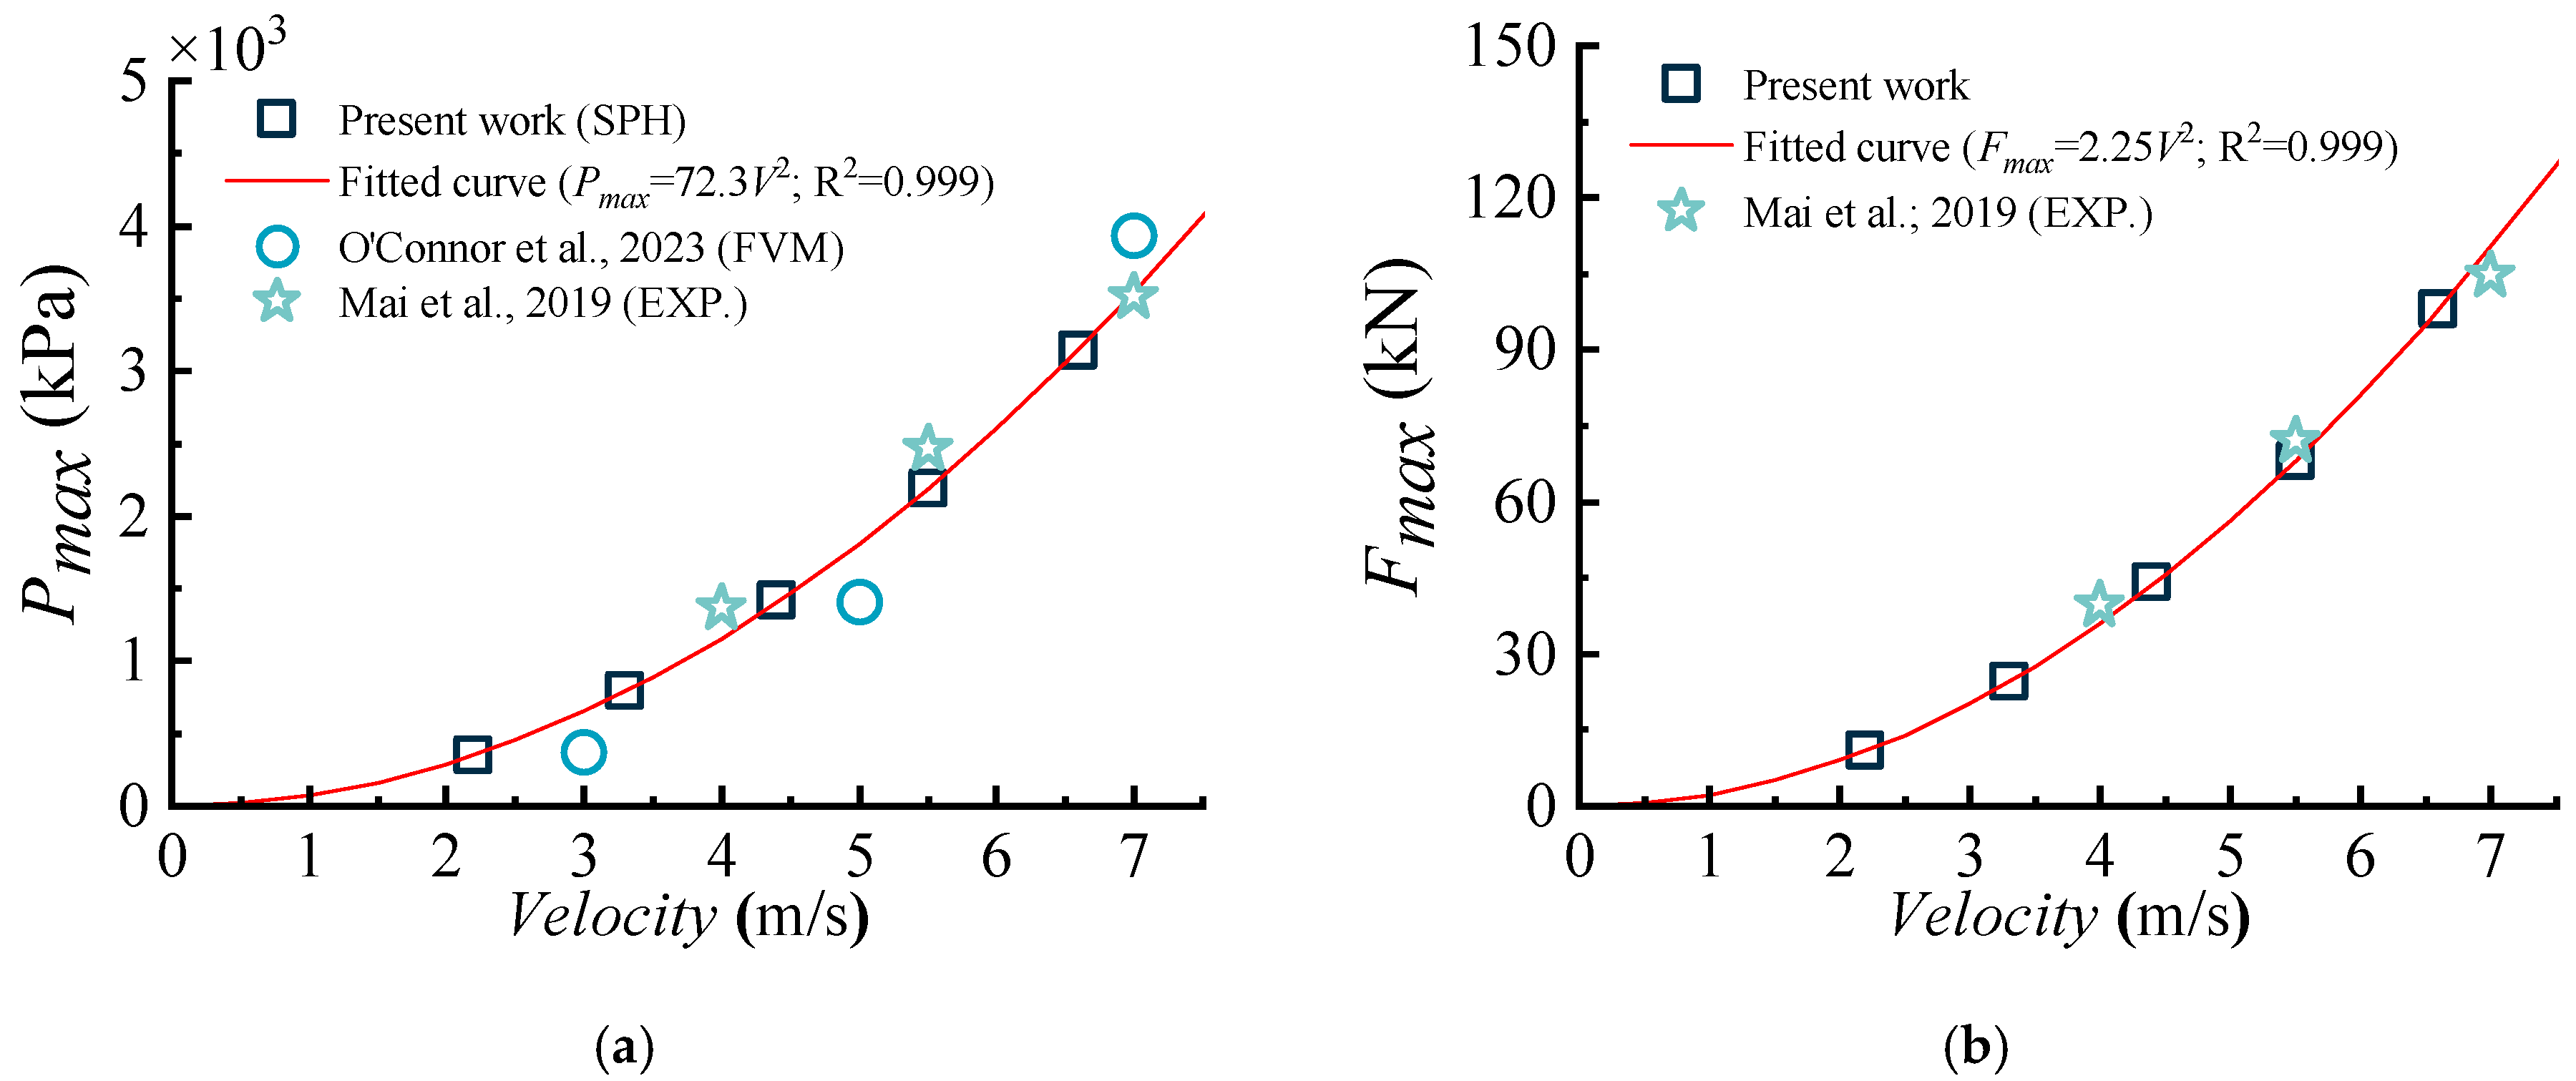
In water entry slamming problems, the slamming force experienced by the structure and the impact pressure on the contact surface with the still water are critical considerations, especially the maximum pressure and vertical force, because these two parameters generally describe the intensity of the slamming event. Figure 5 displays the maximum pressure and maximum vertical force of the flat plate at various water entry velocities. As the water entry velocity of the flat plate increases, both the maximum pressure Pmax and the maximum vertical force Fmax gradually rise. Figure 5a presents the fitted curve of the maximum pressures. The fitting result shows that the maximum pressure has a nonlinear relationship with the water entry velocity. The maximum pressure grows quadratically with increasing water entry velocity, according to the relationship Pmax = 72.3V2 (kPa). Figure 5a compares the results of this study with the experimental data of Mai et al. [42] and the numerical simulations of O’Connor et al. [43]. The scatter plots of both the experimental and numerical data are distributed around the fitted curve of maximum pressure, indicating high agreement with the findings of this study. This further indicates the reliability and accuracy of the SPH numerical method used in this study. Similarly, Figure 5b presents the maximum vertical force and its fitted curve along with the experimental data of Mai et al. [42] for comparison. The maximum vertical force grows nonlinearly with the water entry velocity, following the power function Fmax = 2.25V2 (kN). The experimental data of Mai et al. [42] are presented as scatter plots in Figure 5b. All the scatter points fall on the fitted curve, demonstrating high consistency and further indicating the accuracy of the numerical calculations and curve fitting in this study. From this analysis, it can be concluded that when a flat plate impacts a still water surface perpendicularly with a certain initial velocity, the water entry velocity has a nonlinear effect. The relationship between both the maximum pressure and the maximum vertical force of the flat plate and the water entry velocity can be summarized as a unified power function:
where and are empirical coefficients for pressure and vertical force, respectively.
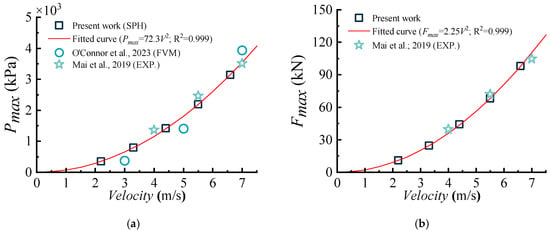
Figure 5.
Maximum pressure (a) and maximum vertical force (b) of the flat plate at various water entry velocities [42,43].
3.2.3. Analysis of the Slamming Coefficient
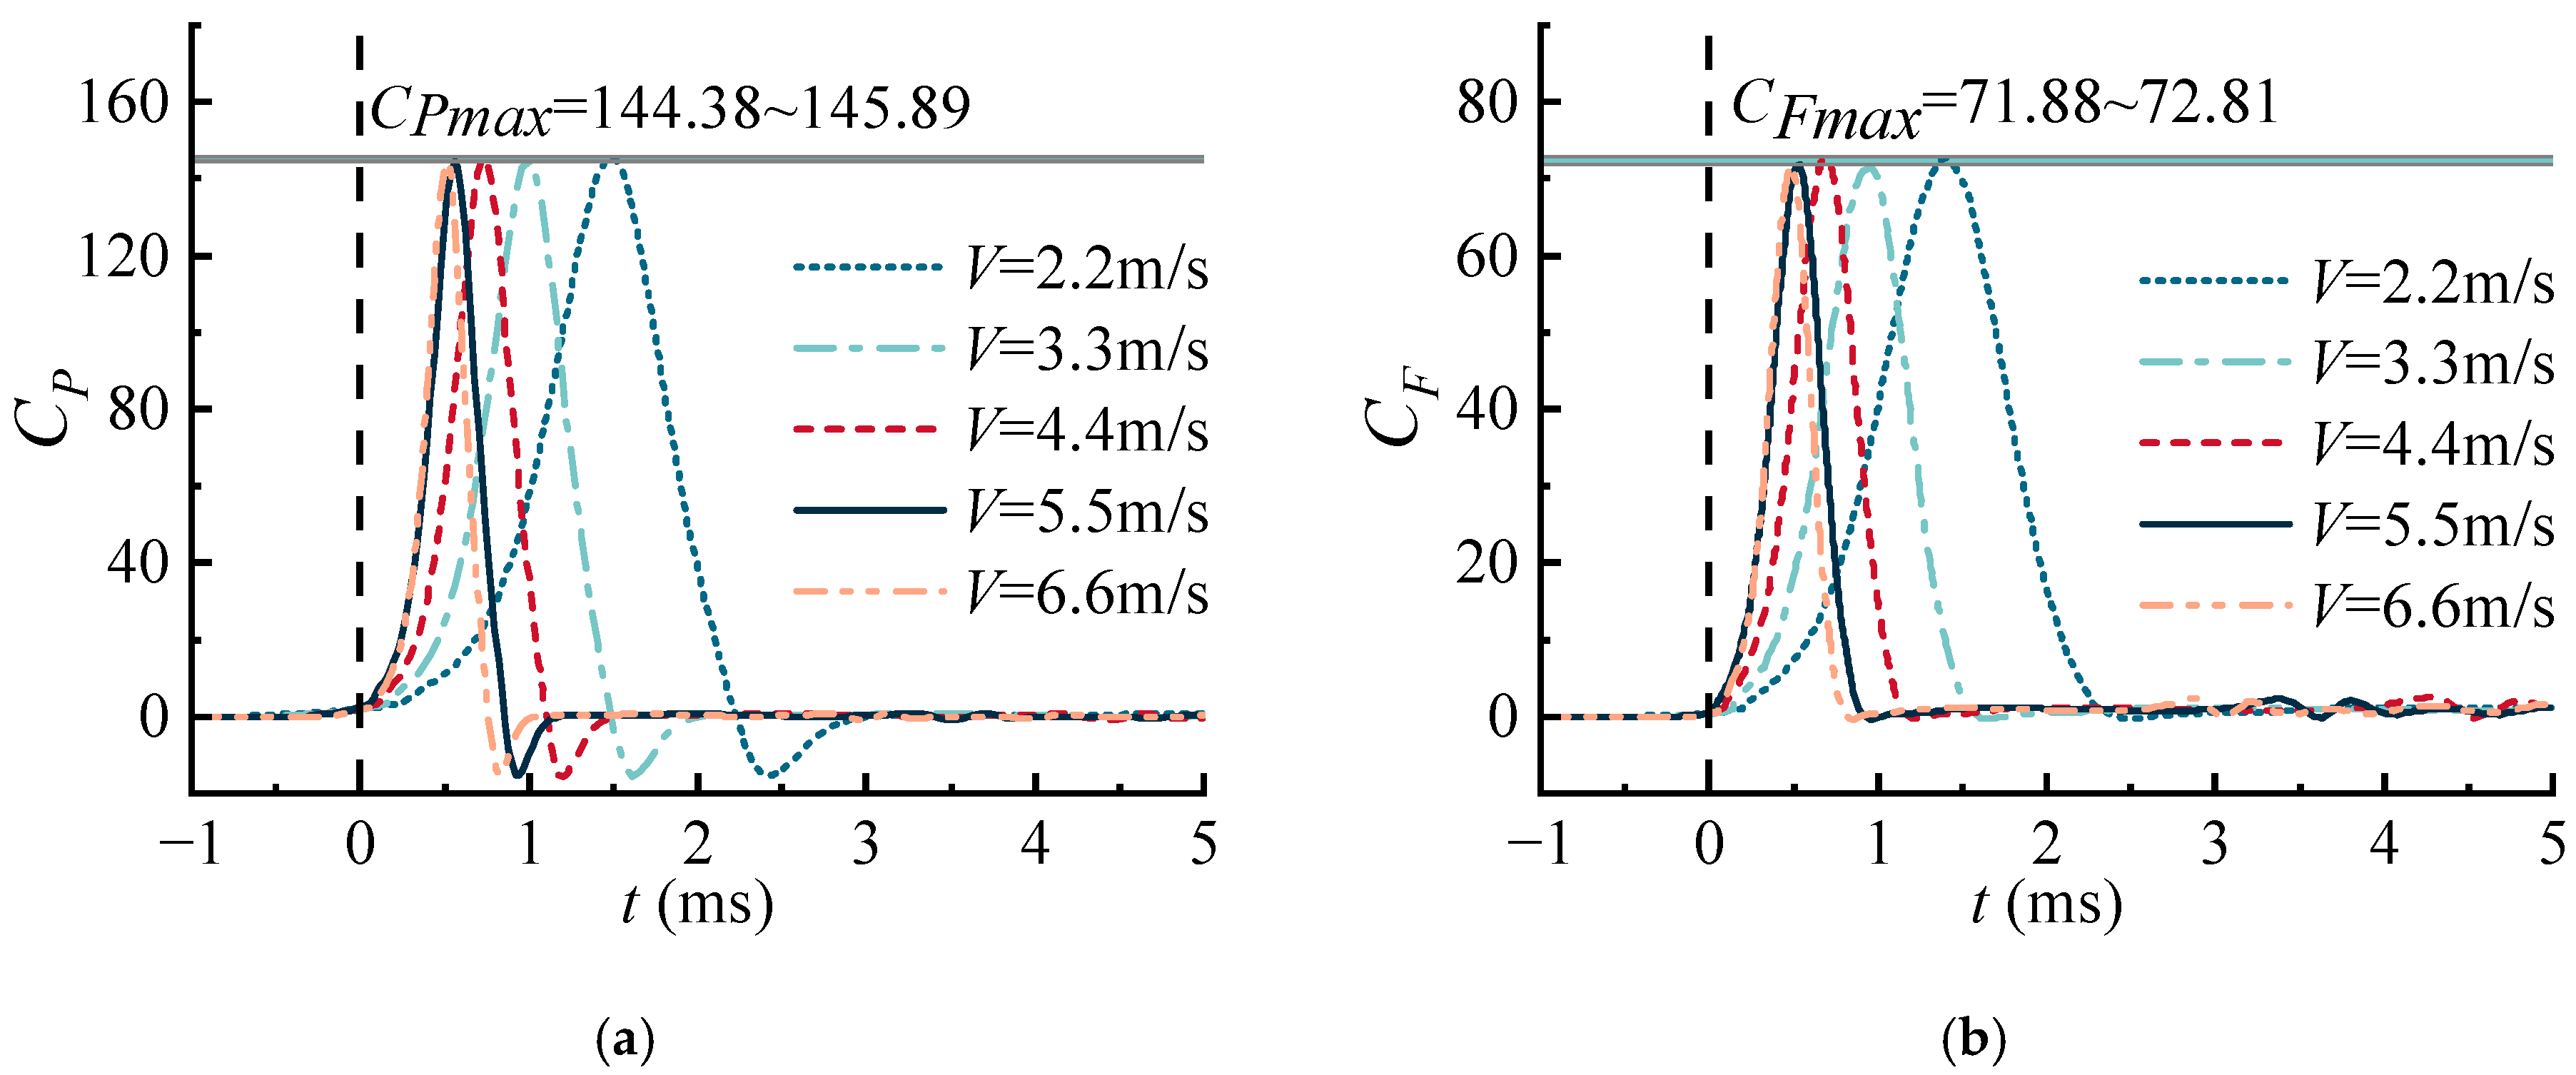
Figure 6 shows the changes in pressure coefficient CP and vertical force coefficient CF as time passes during the water entry. The raw data were processed by setting time t = 0 ms when the flat plate just impacts the water surface for easy comparison. The pressure coefficient CP and vertical force coefficient CF are calculated using
where P and F are the pressure and vertical force, respectively; ρ is the density of water; S is the projected area of the flat plate; and V is the water entry velocity.
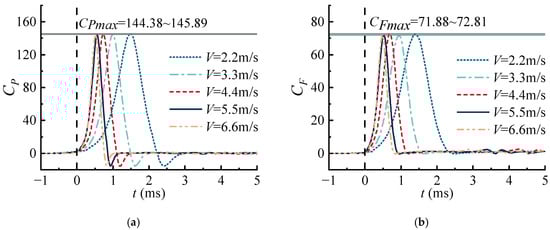
Figure 6.
Time histories of the pressure coefficient (a) and vertical force coefficient (b) for the flat plate at various water entry velocities (The vertical dotted line is a reference line).
In Figure 6, sharp slamming is apparent when the flat plate free-falls and impacts the still water surface with a certain initial velocity. When the flat plate impacts the water surface, CP and CF rapidly increase from 0 to approximately 145 and 72, respectively, within 2 ms, and then quickly drop almost to zero within the next 2 ms. As the water entry velocity increases, the time required for this process gradually decreases, and the time–history curves of CP and CF become sharper.
Figure 6a displays the pressure coefficient at the center of the flat plate for the different water entry velocities. The maximum pressure coefficients (CPmax) are nearly equal for all water entry velocities and range from 144.38 to 145.89. Although there is some variation in the maximum pressure coefficient at different water entry velocities, this variation is relatively minor, with a maximum discrepancy of approximately 1.5% at water entry velocities of 6.6 m/s and 4.4 m/s. Figure 6b presents the vertical force coefficient of the flat plate for the different water entry velocities, and it exhibits the same characteristics as CPmax; the maximum vertical coefficients (CFmax) are nearly equal for all water entry velocities. The maximum vertical force coefficient ranges from 71.88 to 72.81. The largest variation in the maximum vertical force coefficient is approximately 1.3%, which is at water entry velocities of 5.5 m/s and 4.4 m/s. The water entry velocity therefore has a negligible or minimal effect on CPmax and CFmax for the flat plate.
3.3. Water Surface Evolution during Water Entry
In this section, the water surface evolution due to the flat plate impacting still water is discussed for water entry at various velocities. The cavities, jets, and fluid splashes will be analyzed in detail.
3.3.1. Water Surface Evolution
Figure 7 shows three-dimensional SPH particle snapshots of the flat plate slamming the water surface at various times with a water entry velocity of 5.5 m/s. The particle color bar represents the water flow velocity upon impact. Only the symmetric half of the three-dimensional fluid particles is displayed to enhance the visibility of the cavity, jet, and splash development during water entry. The figure shows that the SPH particles provide a reasonable approximation of the water surface evolution during the water entry of the flat plate. Figure 7a shows the initial time when the flat plate impacts the water surface. The fluid particles are compressed by the flat plate and accelerate to escape. As the depth of the flat plate increases during water entry, fluid particles continuously escape from the bottom of the flat plate, gradually forming a jet and cavity at the plate edges, as shown in Figure 7b. As the depth of the plate continues increasing during water entry, the water surface further evolves, the water splashing begins, the impact jet splits and breaks at the tip to form smaller fluid particle clusters, and the radius of the fluid cavity continues to increase, as shown in Figure 7c–f.
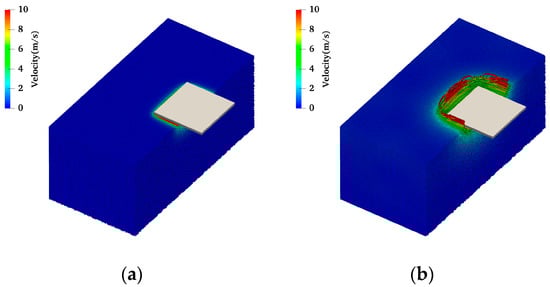

Figure 7.
Three-dimensional snapshots of the water entry of the flat plate at various times at V = 5.5 m/s: (a) t = 0.52 ms; (b) t = 5.03 ms; (c) t = 10.03 ms; (d) t = 15.03 ms; (e) t = 20.03 ms; (f) t = 25.03 ms.
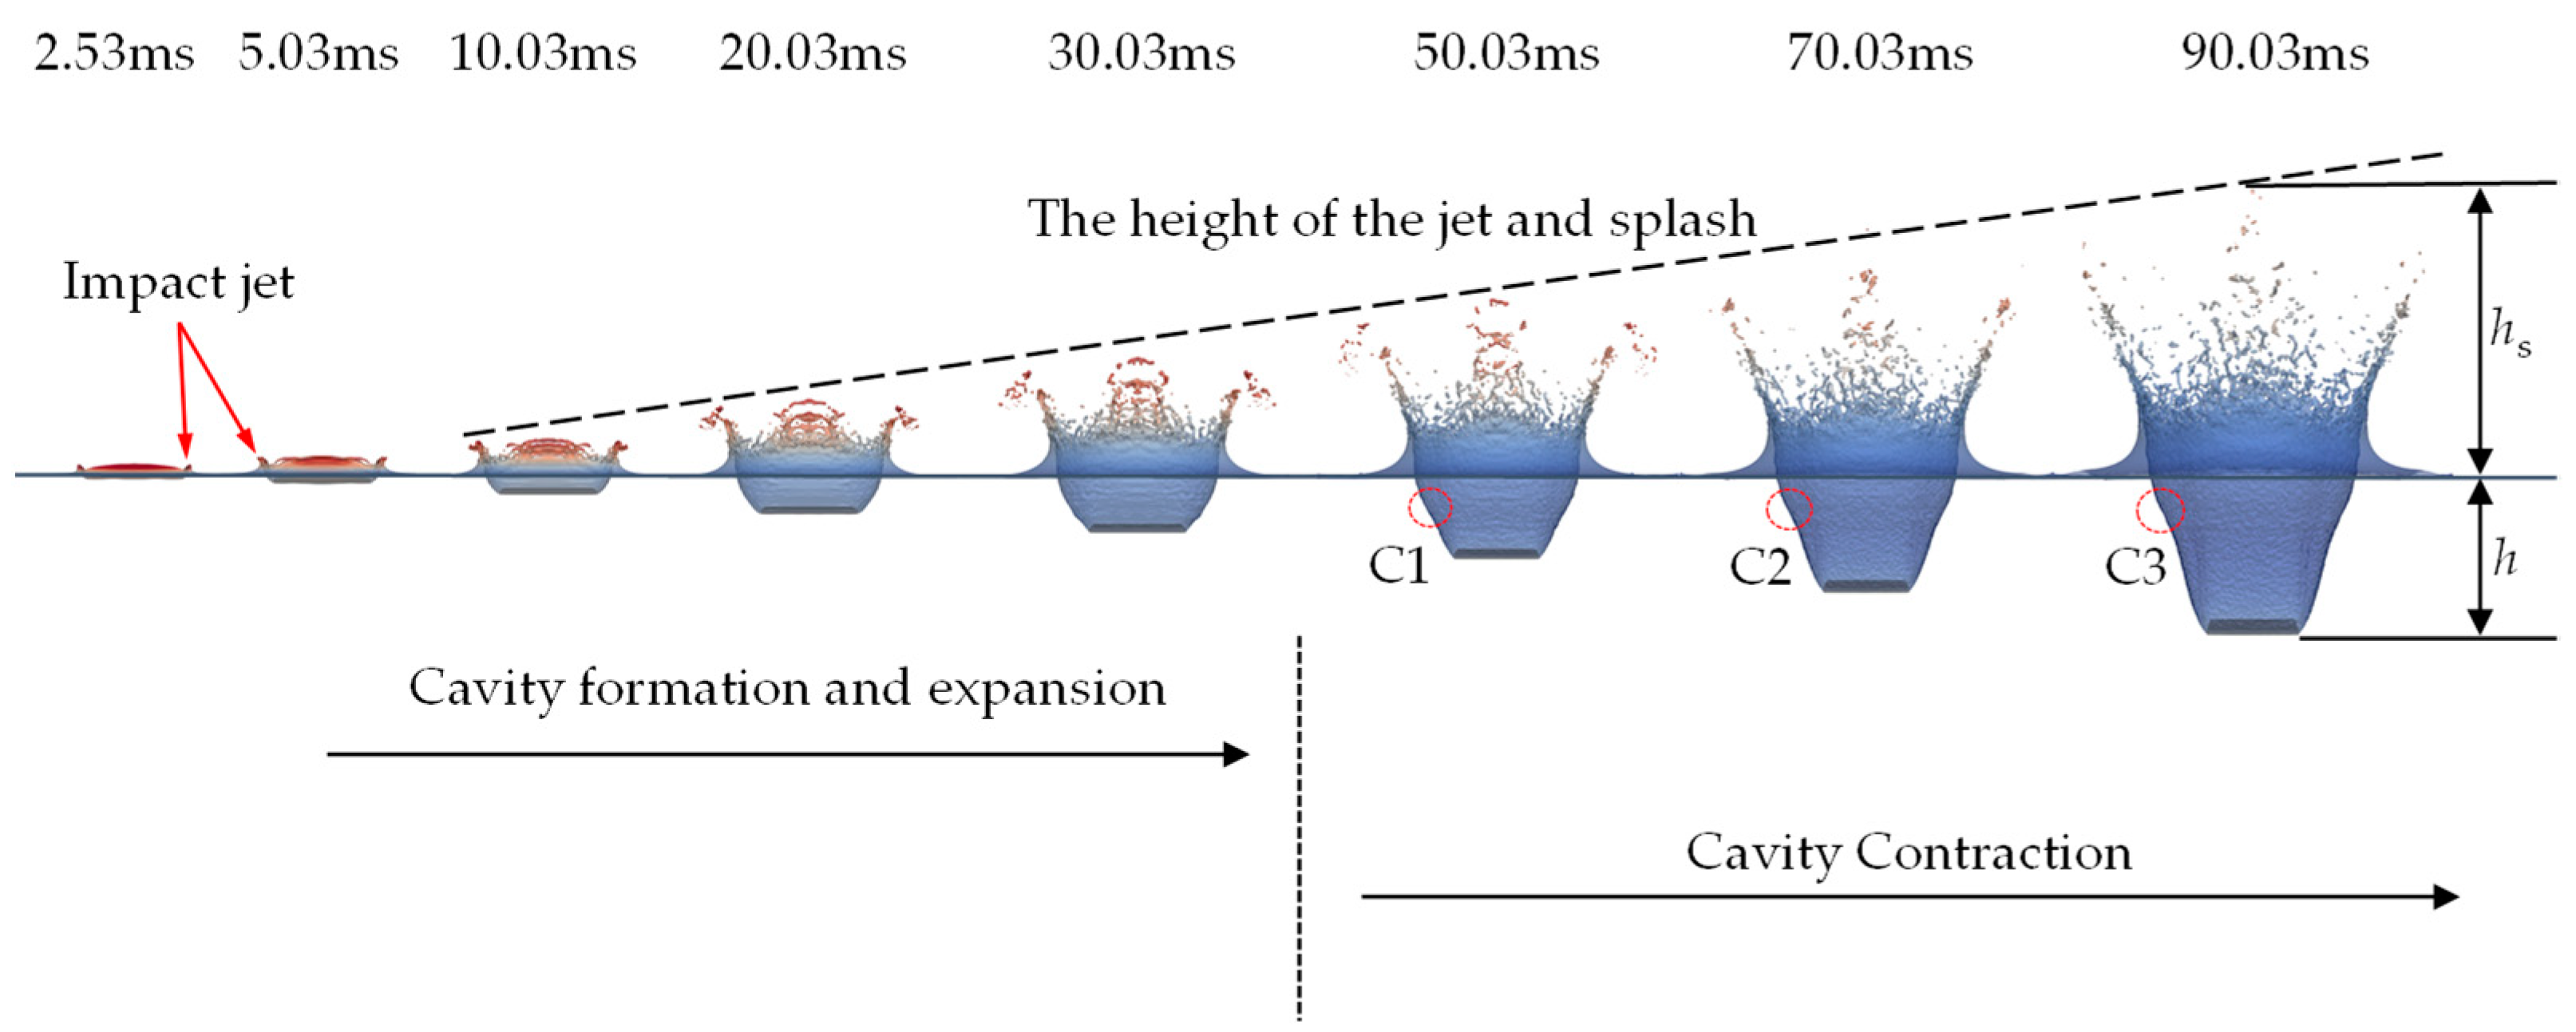
Figure 8 shows the evolution of the water surface as the flat plate slams into the water and falls to a depth below the water surface. At 2.53 ms and 5.03 ms, the flat plate has just completed the water surface impact with a velocity of 5.5 m/s, passed through the free surface, and become completely submerged. The slamming force causes the formation of an impact jet and a fluid cavity. Then, the jet and cavity continue developing as the flat plate moves downward. At 10.03 ms, the jet tip starts breaking under the influence of fluid gravity and fluid viscosity, while the size of the fluid cavity continues to increase. At 20.03 ms and 30.03 ms, water splashing is observed. As the water entry develops, the water jet, fluid cavity, and water splash continuously evolve. The height of the jet and splash (hs) gradually increases, as shown by the upper slanted dashed line in Figure 8, and the breakup of the jet tip gradually progresses from large water droplets into smaller droplets. Two stages of the fluid cavity are labeled in Figure 8. The first stage is cavity formation and expansion, and the second stage is cavity contraction. At 50.03 ms, the cavity has already started contracting, as shown by the red circle (C1, C2, C3) in Figure 8. Afterward, the cavity continues to contract inward and becomes slender as the fall depth h of the flat plate under the water surface gradually increases.
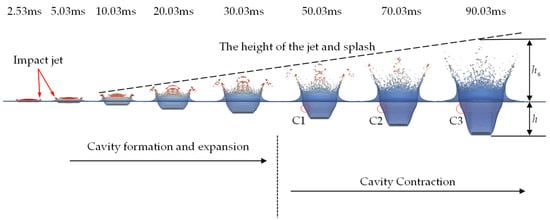
Figure 8.
Schematic of the water surface evolution as the flat plate slams into the water.
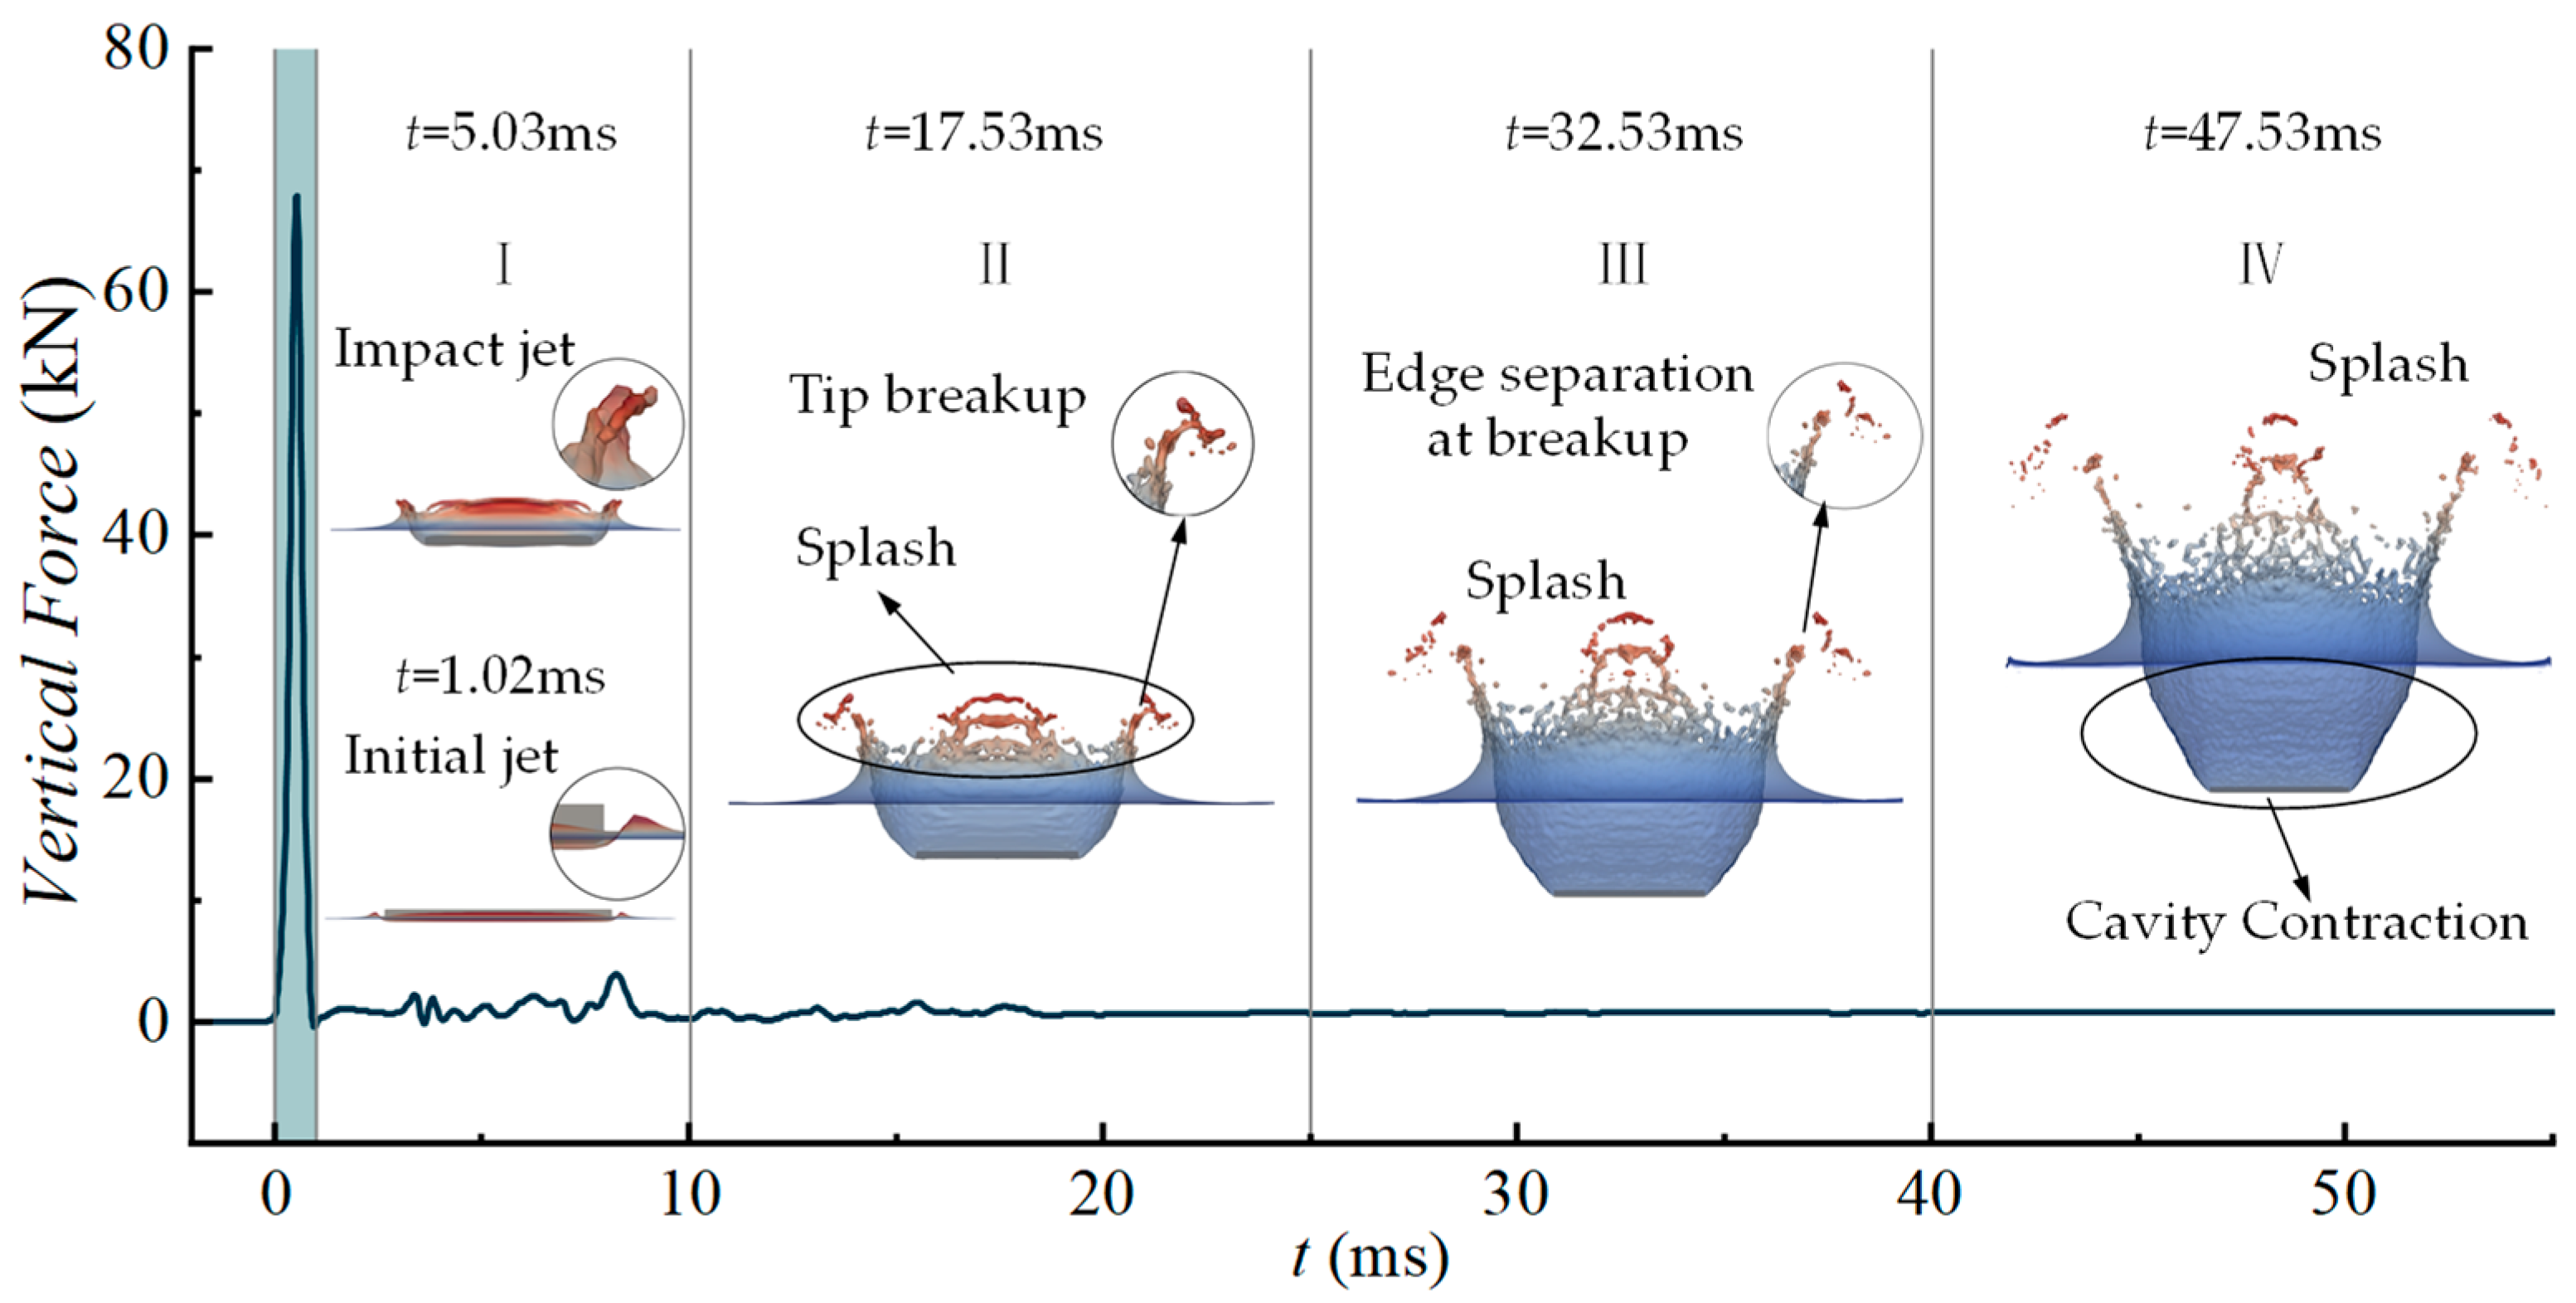
Figure 9 displays the four stages of the flat plate water entry according to the characteristics of the water surface evolution, which is analyzed together with the vertical force. The time range from 0 to 10.03 ms is Stage I, the initial slamming stage. At this stage, the impact jet and fluid cavity are formed by the flat plate impacting the water. The water surface evolution is illustrated at 1.02 ms and 5.03 ms, where the formation and growth of the impact jet and fluid cavity can be observed. The jet and cavity shapes become more pronounced as the water entry progresses. Additionally, the vertical force on the flat plate is highly variable at Stage I. The vertical force is at its maximum at the initial moment of this stage, indicating the maximum slamming force when the flat plate first impacts the water surface, as shown in the shaded area of Figure 9. The time range from 10.03 to 25.03 ms is Stage II, in which the jet tip breaks into droplets and the splash begins to form. In Stage II, the vertical force transitions from being volatile to becoming smoother. The time from 25.03 to 40.03 ms is defined as Stage III and is distinguished by edge separation at the jet breakup and splash development. In this stage, the jet tip breaks further and forms smaller droplets, the splash becomes clearer, and the vertical force gradually becomes more stable. Finally, the time after 40.03 ms is defined as Stage IV, which is the stage of cavity contraction and splash development. In this stage, the fluid cavity starts contracting inward, all tips of the jet break and become very tiny droplets, and the splash continues developing. The vertical force curve is smooth and stable.
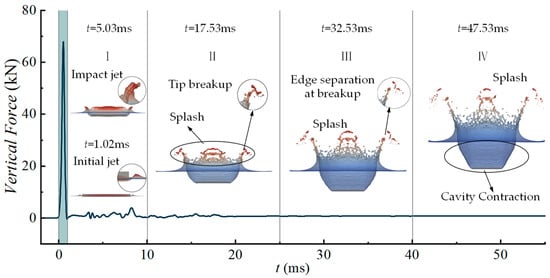
Figure 9.
Snapshots of the water entry of the plate at several stages for V = 5.5 m/s.
It is important to note that, despite the fact that this study focuses on large-scale dynamics, surface tension plays a crucial role at some point in later stages, particularly in jet atomization. Since surface tension effects are not precisely modeled in this study, the results in this section are rather qualitative.
3.3.2. Analysis of Evolutionary Parameters
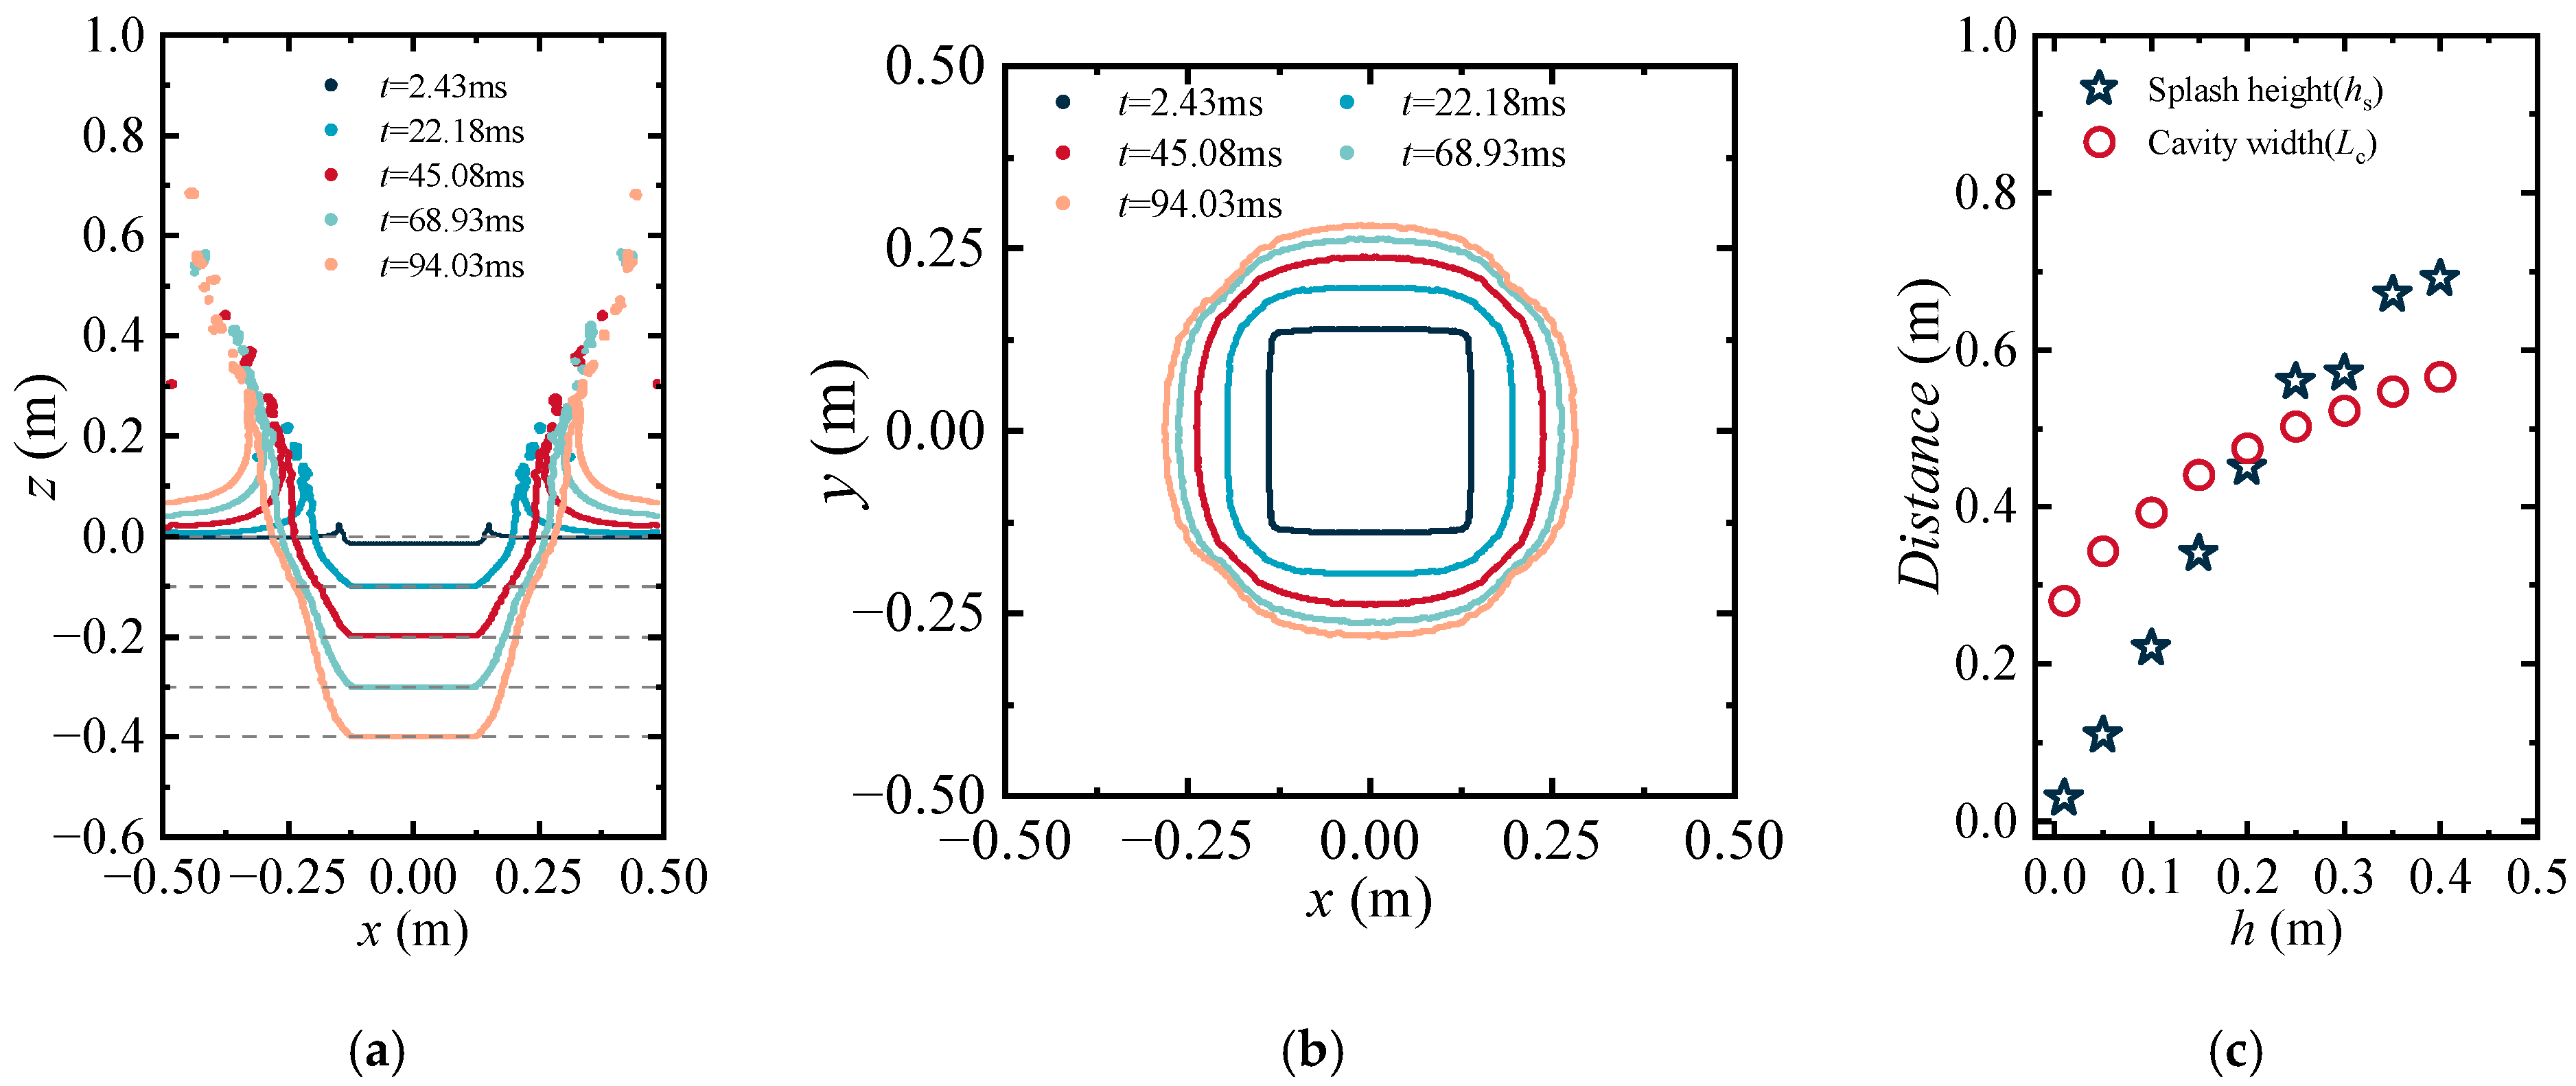
To gain a deeper understanding of the flow field evolution of flat plate water entry slamming, we analyze the fluid cavity width and splash height at different entry depths, as illustrated in Figure 10. Figure 10a shows the cross-sectional diagrams of the water surface shape along the symmetry axis of the flat plate at various entry depths, while Figure 10b presents the corresponding cross-sectional diagrams of the water surface shape viewed from the top. These figures show the variations in water surface shape, cavity width, and splash height with increasing entry depth.
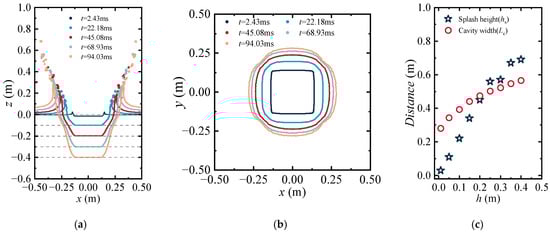
Figure 10.
Quantitative analysis of cavity width and splash height during water entry: (a) front cross-sectional snapshots of the water surface shape along the symmetry axis of the flat plate; (b) top cross-sectional snapshots of the water surface shape; (c) scatter plot of cavity width and splash height.
The horizontal dashed lines in Figure 10a represent different entry depths (h = 0.01 m, 0.1 m, 0.2 m, 0.3 m, and 0.4 m), corresponding to the entry times given in the legend. At the maximum entry depth used in this study, h = 0.4 m, the maximum cavity width is 0.57 m, and the maximum splash height is 0.69 m, as shown in Figure 10c.
As analyzed previously in Figure 8 and Figure 9, the jet, cavity, and splash formed by the flat plate impact evolve progressively with increasing entry depth. During the initial stage of the impact, the water is continuously compressed under the impact force of the flat plate, forming a high-speed jet. The cavity width and splash height rapidly increase, as indicated by the hollow circles and star-shaped scatter points in Figure 10c for entry depths less than 2 m. Subsequently, under the influence of water viscosity and drag, the flat plate decelerates significantly after impacting the water surface, descending at a speed lower than the initial impact speed. During this process, the flat plate undergoes a brief period of force equilibrium adjustment. Once the flat plate reaches a new force equilibrium, its deceleration continues, reducing its compressive effect on the water, and the growths in cavity width and splash height slow down, as shown by the scatter points in Figure 10c.
Additionally, Figure 10a,b reveal that the cavity contraction discussed in the analysis of Figure 8 and Figure 9 begins at the four corners of the flat plate. Figure 3 shows that the pressure at the plate corners is the lowest, and the pushing of the plate corners on the water is the weakest, resulting in slower water flow. Consequently, the cavity initially contracts inward from these points.
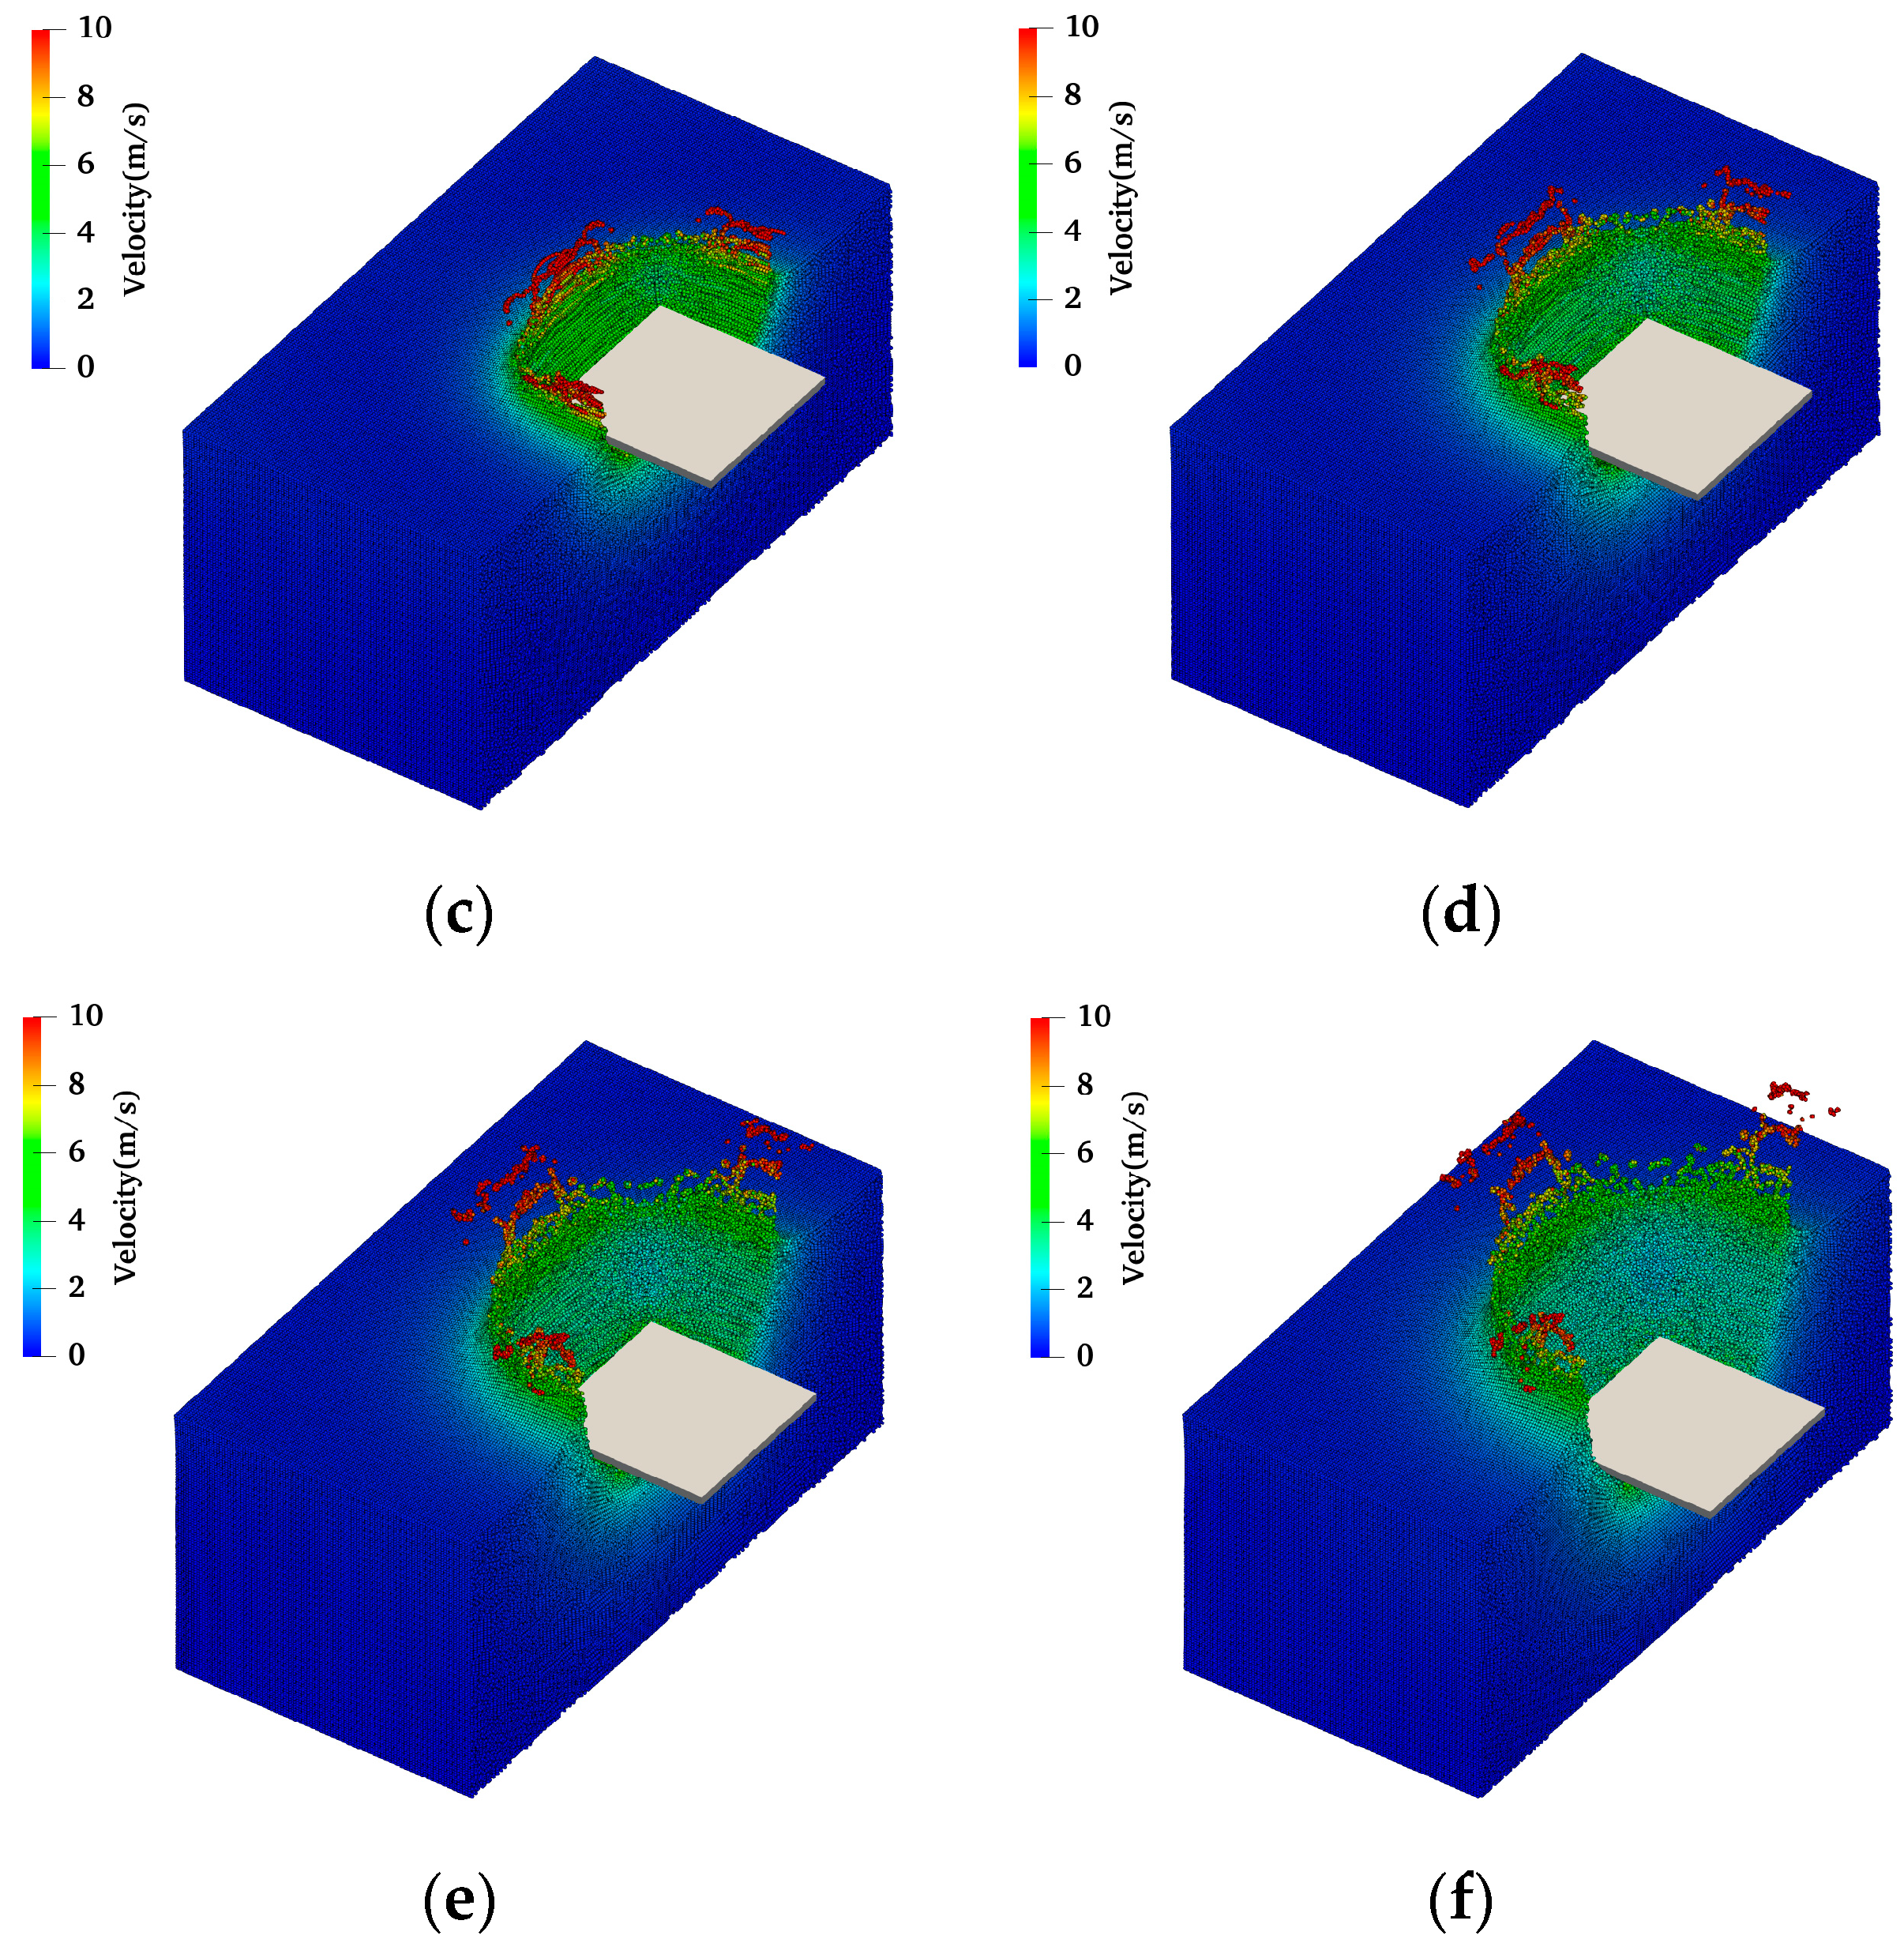
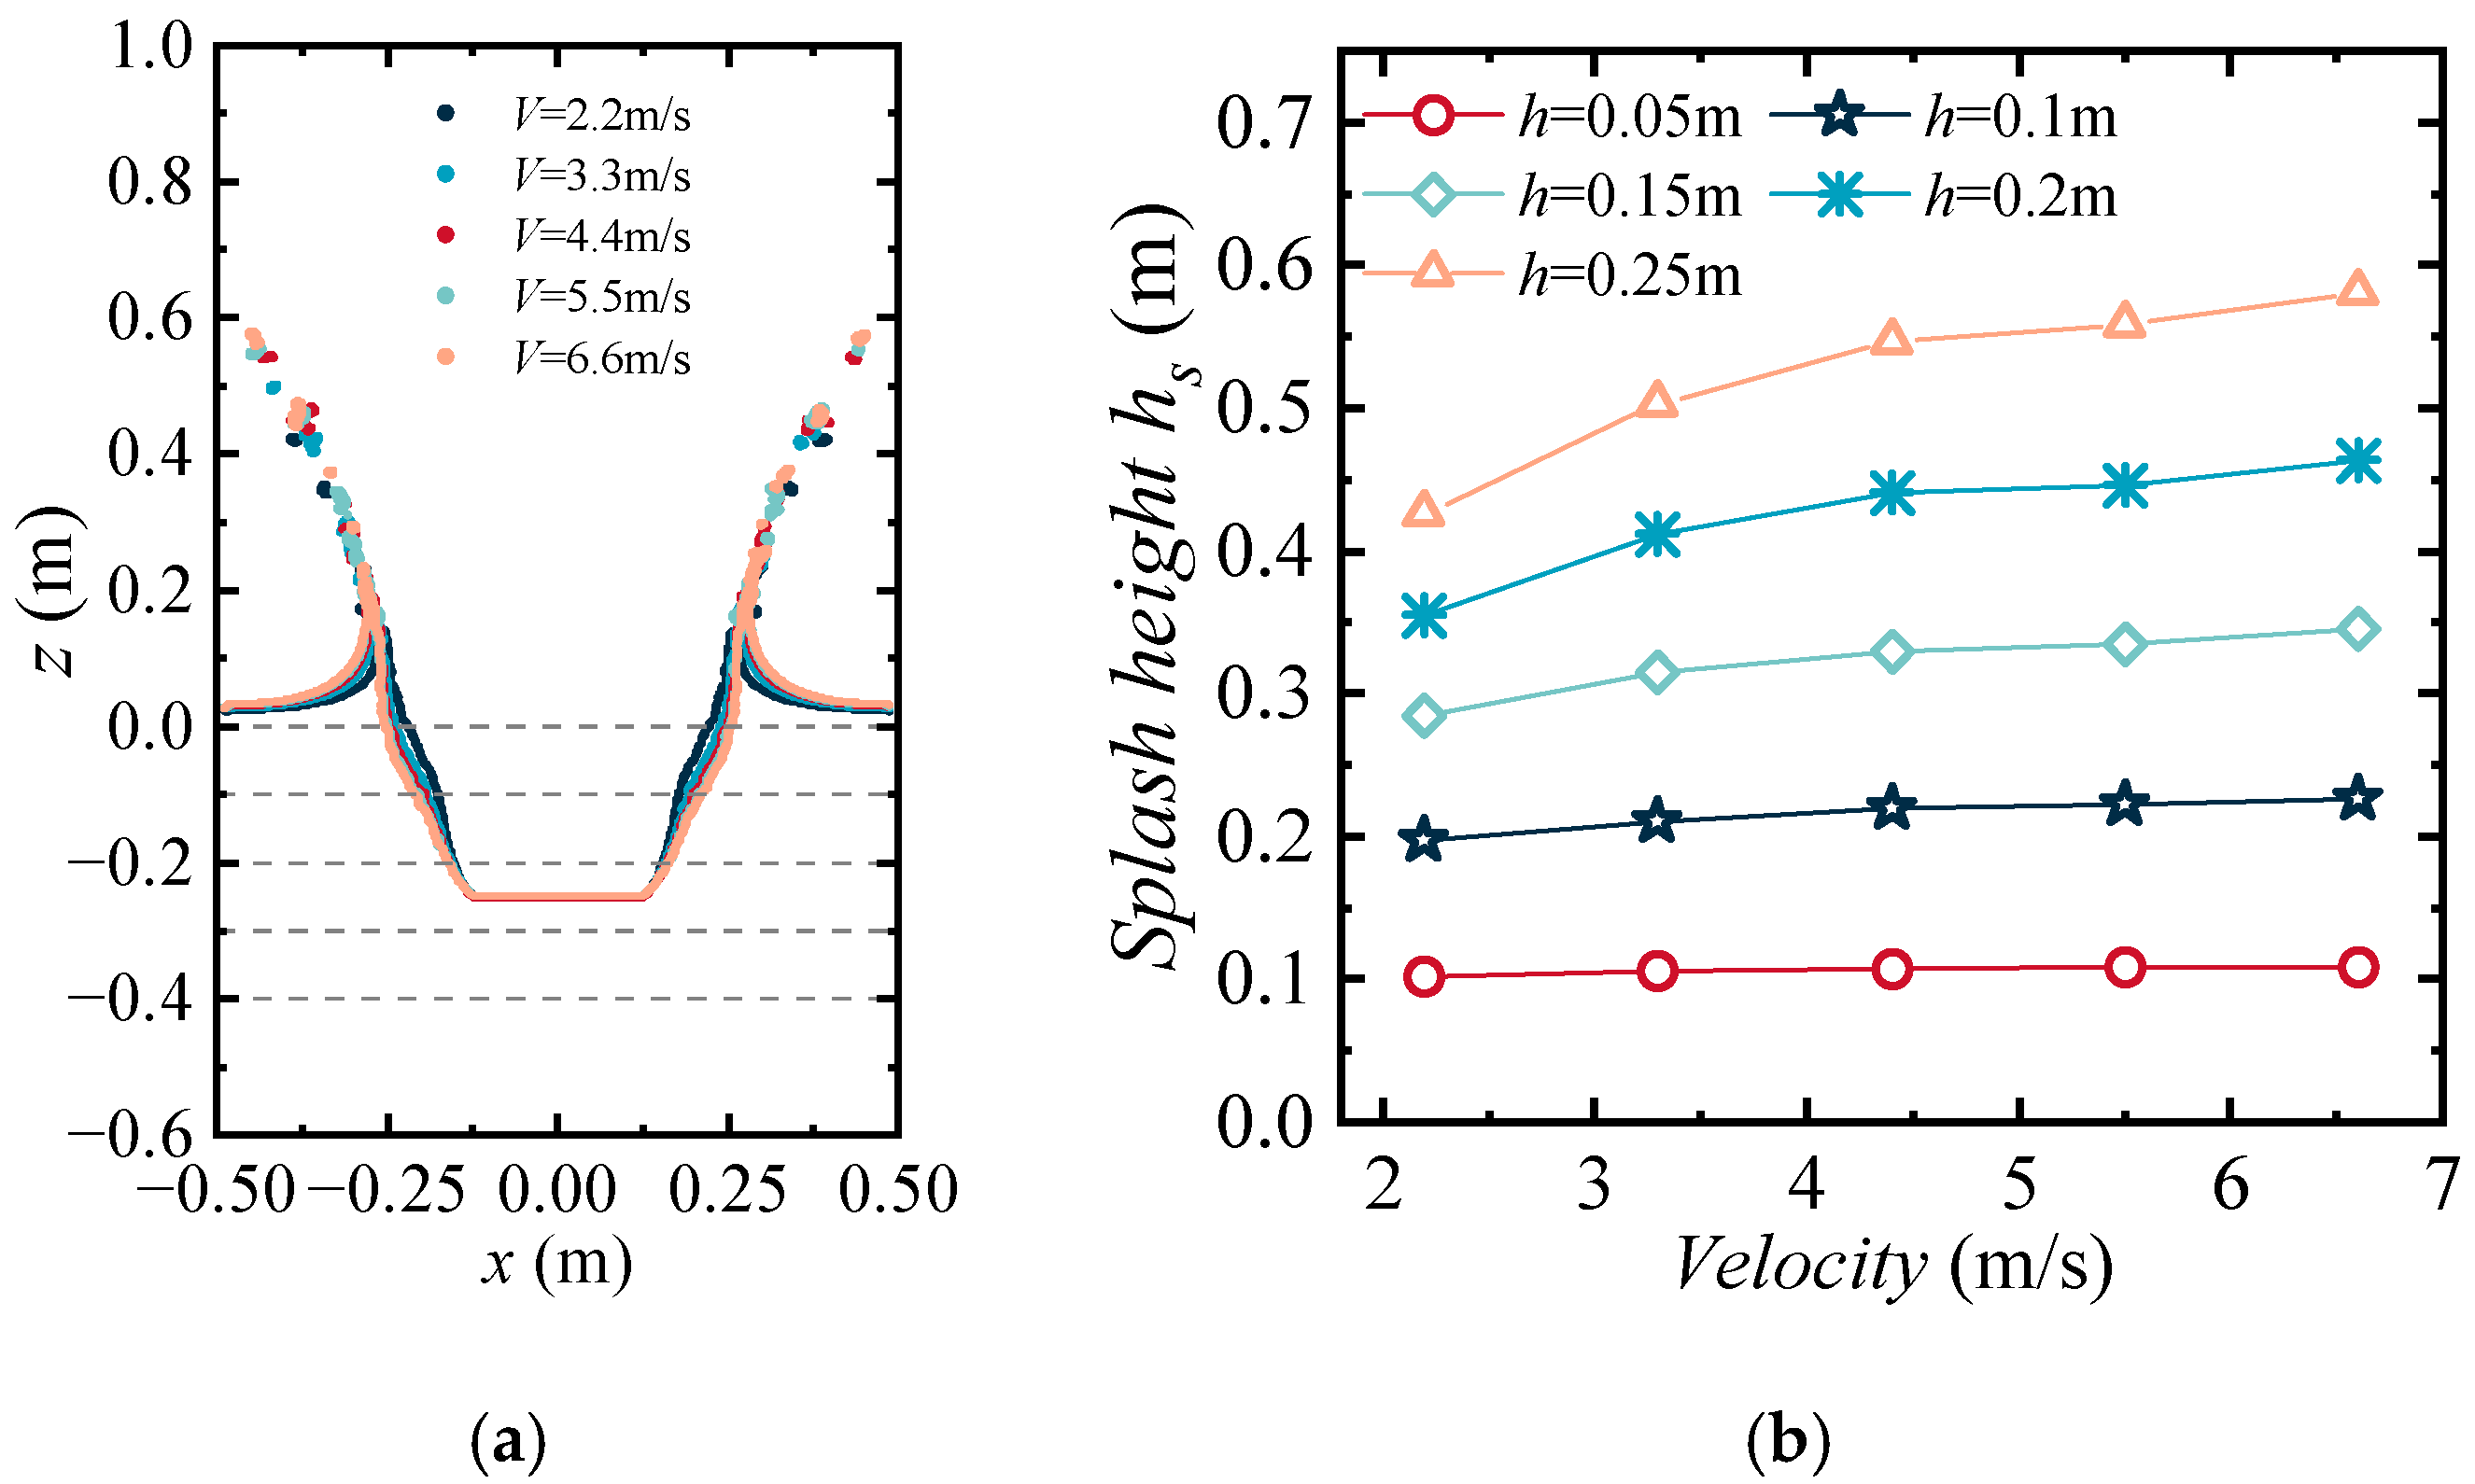
The cavity and splash are statistically analyzed at various velocities in Figure 11. Figure 11a presents cross-sectional snapshots of the cavity at a depth of 0.25 m below the initial free surface for each velocity, and Figure 11b shows the maximum splash heights for different velocities at various depths. In Figure 11b, the splash height hs is measured from the initial free surface, and the legend h refers to different depth values below the initial free surface after the plate enters the water. In Figure 11, the cavity shapes at different water entry velocities are generally consistent, and the cavity size is positively correlated with the water entry velocity. The maximum splash height at different water entry velocities is roughly the same when the plate’s entry depth is small, but as the entry depth increases, the maximum splash height has a nonlinear positive correlation with the water entry velocity, as shown in Figure 11b.
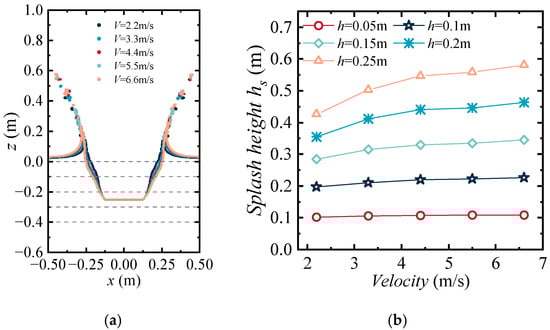
Figure 11.
Statistical analysis of cavities and splashes at various water entry velocities: (a) cross-sectional snapshots of the cavity (The dotted line is a reference line); (b) maximum splash heights.
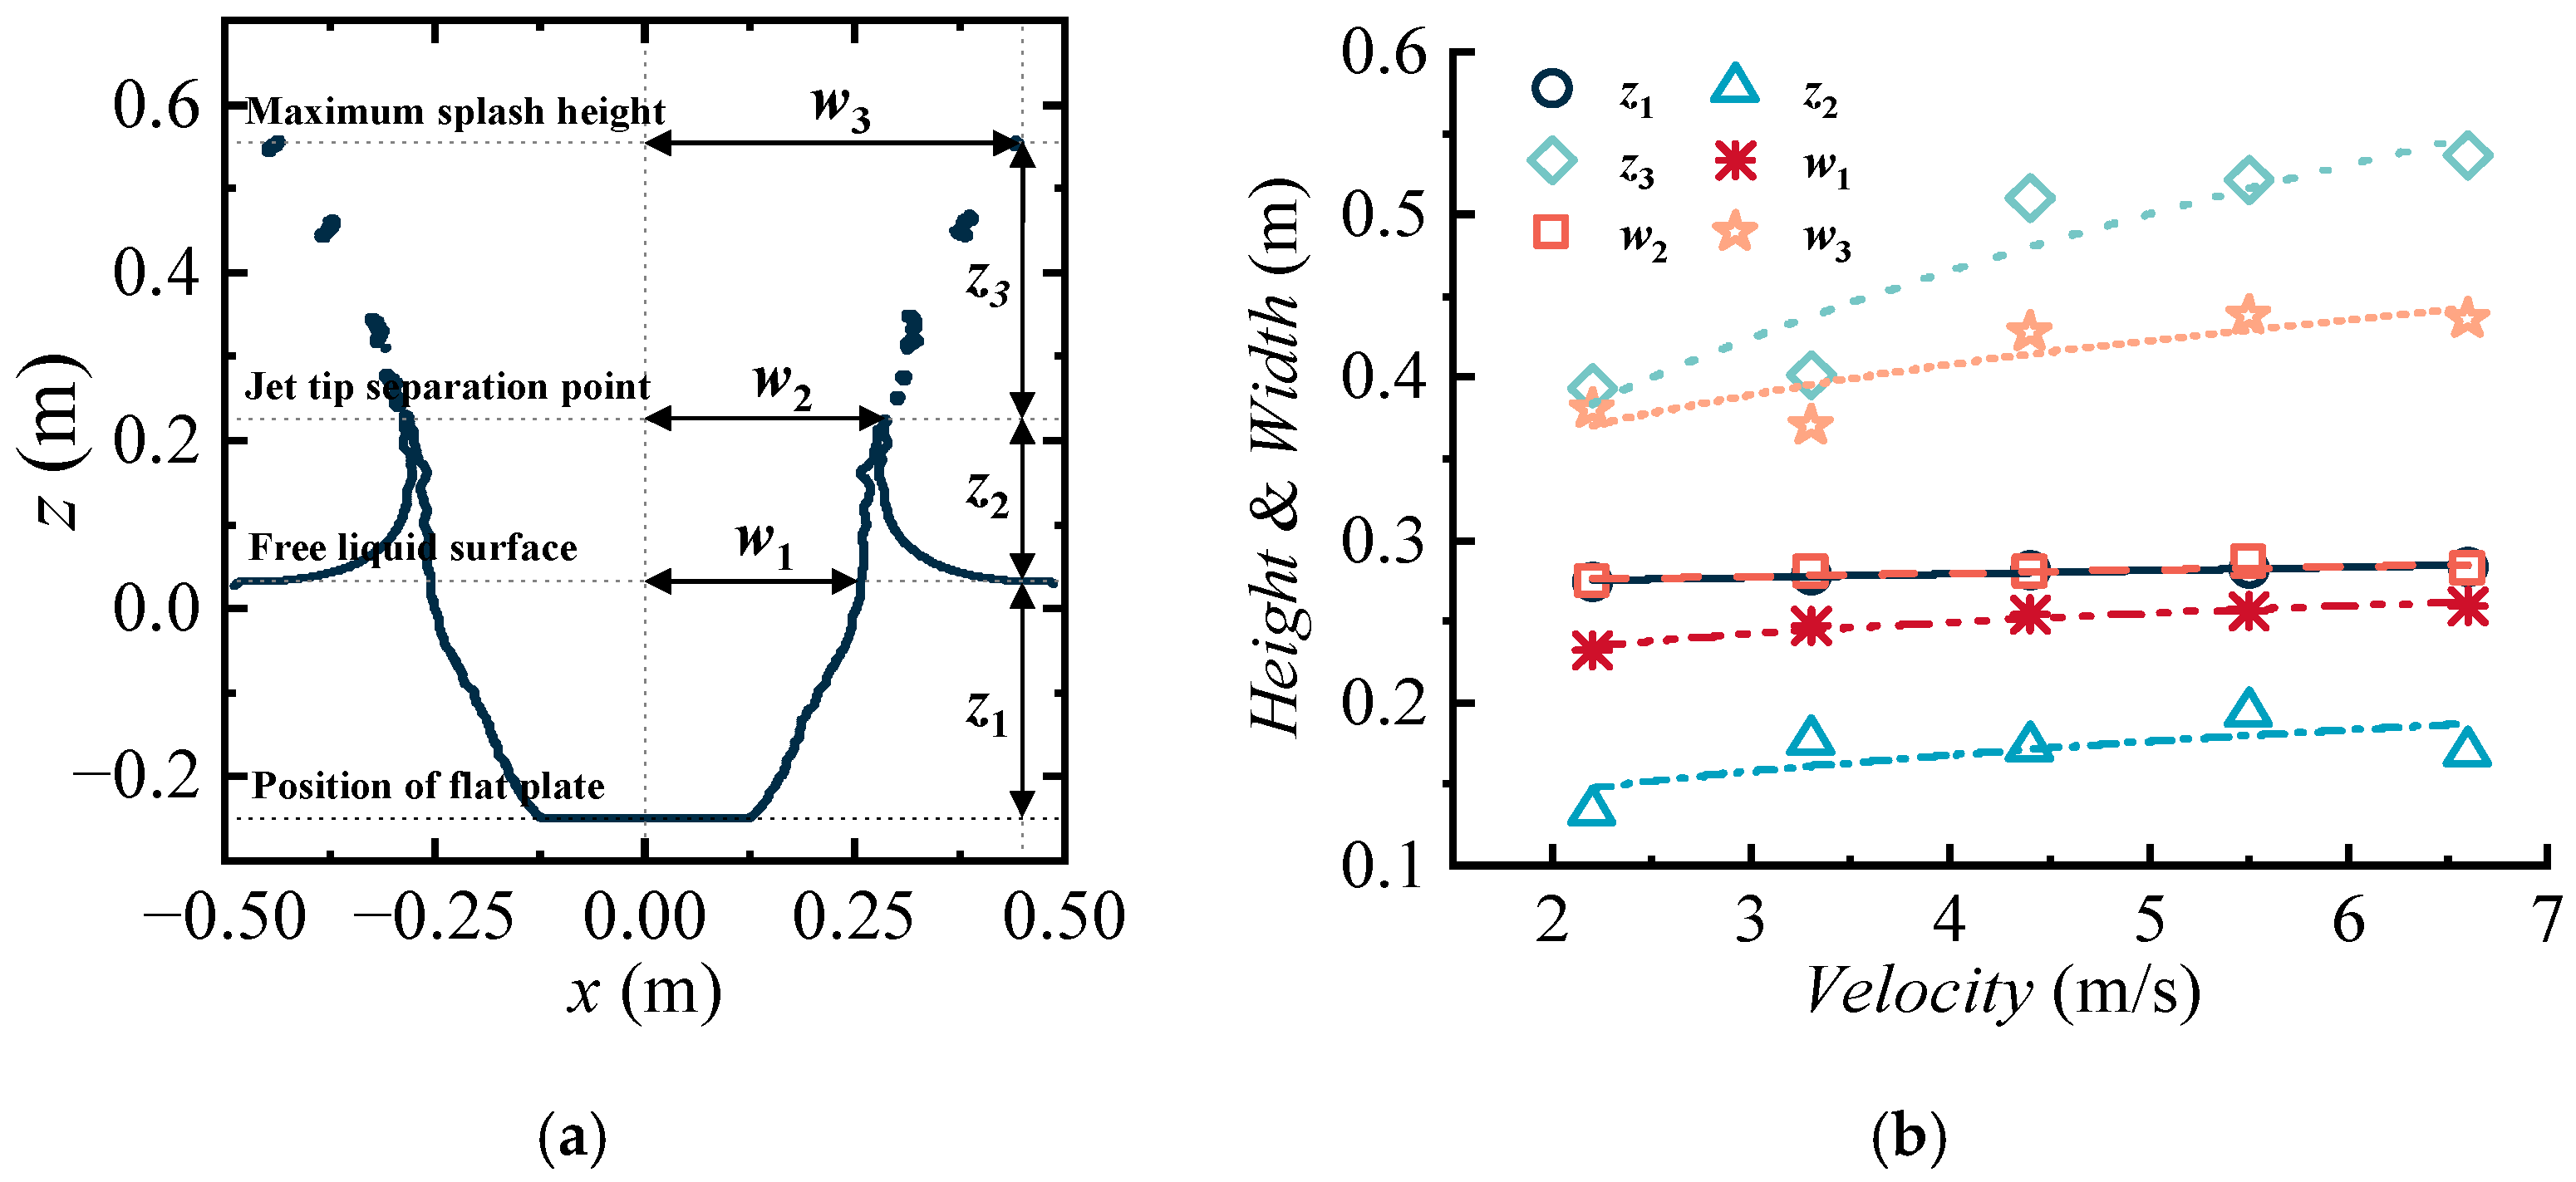
To further understand the impact flow evolution of the plate entering the water, we analyze the liquid surface and splash height, as well as the cavity width, in different regions at various water entry velocities, as shown in Figure 12. Figure 12a shows the positions and definitions of each data measurement point: z1 is the vertical height of the plate from the free liquid surface, z2 is the vertical height of the jet tip separation point from the free liquid surface, and z3 is the vertical distance from the maximum splash height of the droplets to the jet separation point. These three heights are measured at the transverse coordinate x = 0.45 m. w1 is the horizontal width of the cavity from the center at the free liquid surface, w2 is the horizontal width of the cavity from the center at the jet separation point, and w3 is the horizontal width of the cavity from the center at the maximum droplet splash height. Figure 12b shows the scatter plot and trend lines of z1 to z3 and w1 to w3 at different water entry velocities. From the figure, it is seen that z1 and w2 are only related to the position of the plate after entering the water. Their values are almost unchanged, and z1 and w2 are approximately equal, with values of approximately 0.28 m across the five water entry velocities. z2 and w1 are positively correlated with the water entry velocity, but the growth is relatively slow. z3 and w3 exhibit an obvious nonlinear positive correlation with the water entry velocity; their values increase significantly with velocity at lower speeds, but this trend gradually slows as the velocity increases. Therefore, the impact speed of the plate entering the water has the greatest influence on the droplet splash after jet separation, and its influence on the cavity at the free liquid surface and the jet separation point is secondary.
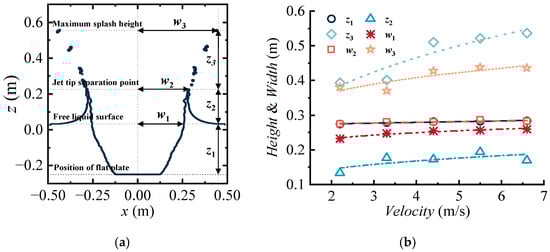
Figure 12.
Flow evolution at different positions. (a) Positions and definitions of each data measurement point; (b) Comparison of various parameters at different water entry velocities.
4. Conclusions
This paper has established a three-dimensional numerical model for the water entry slamming of a flat plate based on WCSPH. The impact load and flow evolution of the flat plate entering the water were analyzed. First, the accuracy of the numerical model was validated through comparison with experimental data. Then, the vertical slamming force and pressure variations of the flat plate were analyzed at different water entry velocities. Finally, the flow field evolution of the jet, cavity, and splash during the water entry slamming of the flat plate were discussed. The main conclusions of this paper are as follows:
- (1)
- SPH effectively captures the key dynamic characteristics of a flat plate entering water. In the numerical model established in this paper, SPH particles effectively simulate jet formation, cavity development, and fluid splash behavior during the water entry of the flat plate, clearly reproducing the phenomena of jet tip separation and droplet breakup. The maximum pressures and maximum vertical forces of the flat plate at two water entry velocities agree well with the experimental data, with an error margin of 5%.
- (2)
- The pressure of the flat plate surface is highest at the center and gradually decreases towards the edges, with the lowest pressure at the edges, especially at the four corners of the flat plate. The maximum pressure and vertical force of the plate have a second-order nonlinear relationship with the water entry velocity. However, the dimensionless maximum pressure coefficient and vertical force coefficient do not change with the water entry velocity; their values remain consistent across different velocities.
- (3)
- The flow evolution of the flat plate entering the water exhibits distinct stages. Stage I involves the initial formation of the jet and cavity when the flat plate impacts the water surface. Stage II sees further development of the cavity and jet, accompanied by jet tip separation. Stage III involves the continued development of jet tip separation, leading to fragmentation of the jet tip and the gradual formation of splashing droplets. Stage IV continues the development of jet tip separation and droplet fragmentation while the cavity begins to contract inward.
- (4)
- The cavity width and splash height during the water entry slamming of the flat plate grow nonlinearly with the entry depth of the plate in the water. The growth rates of the cavity width and splash height gradually diminish as depth increases. The water entry velocity has the greatest influence on droplet splashing, with the horizontal cavity width from the center at the maximum splashing droplet height and the vertical height from the free liquid surface showing pronounced nonlinear growth with water entry velocity. However, the water entry velocity has a minor influence on the positions of the jet separation point and the free liquid surface. The cavity width from the center at the jet separation point is essentially consistent with the vertical distance of the flat plate from the free liquid surface at its position in the water.
Future research will focus on the complexities of oblique water entry slamming, examining how different entry angles affect pressure distribution, cavity formation, and splashing behavior. Additionally, we will explore the slamming of complex structures in marine environments, such as ocean currents, regular waves, and irregular waves, and delve into multi-body coupling issues to enhance the safety and efficiency of marine structure design.
Author Contributions
Conceptualization and writing—review and editing, Y.Z.; methodology and writing—original draft preparation, Z.L.; formal analysis, R.G.; software, Y.S.; validation, N.S. All authors have read and agreed to the published version of the manuscript.
Funding
This research was funded by the National Natural Science Foundation of China (Grant No. 52371274) and the Research Project on Civilian Ships by the Ministry of Industry and Information Technology (No. CBZ01N23-01).
Institutional Review Board Statement
Not applicable.
Informed Consent Statement
Not applicable.
Data Availability Statement
Data are contained within the article.
Conflicts of Interest
The authors declare no conflicts of interest.
References
- Bilandi, R.N.; Mancini, S.; Vitiello, L.; Miranda, S.; De Carlini, M. A Validation of Symmetric 2D + T Model Based on Single-Stepped Planing Hull Towing Tank Tests. J. Mar. Sci. Eng. 2018, 6, 136. [Google Scholar] [CrossRef]
- Chillemi, M.; Raffaele, M.; Sfravara, F. A Review of Advanced Air Lubrication Strategies for Resistance Reduction in the Naval Sector. Appl. Sci. 2024, 14, 5888. [Google Scholar] [CrossRef]
- Fairlie-Clarke, A.C.; Tveitnes, T. Momentum and gravity effects during the constant velocity water entry of wedge-shaped sections. Ocean Eng. 2008, 35, 706–716. [Google Scholar] [CrossRef]
- Zhang, X.; Shi, Y.; Pan, G. Modified analytical model for water entry of two-dimensional elastic cylinders based on continuum theory. Ocean Eng. 2021, 240, 110010. [Google Scholar] [CrossRef]
- Tavakoli, S.; Mikkola, T.; Hirdaris, S. A fluid–solid momentum exchange method for the prediction of hydroelastic responses of flexible water entry problems. J. Fluid Mech. 2023, 965, A19. [Google Scholar] [CrossRef]
- Vincent, L.; Xiao, T.; Yohann, D.; Jung, S.; Kanso, E. Dynamics of water entry. J. Fluid Mech. 2018, 846, 508–535. [Google Scholar] [CrossRef]
- Shi, Y.; Xiao, P.; Zhao, H.; Pan, G. Experimental Research on the Influences of Head Shape and Surface Properties on the Water Entry Cavity. J. Mar. Sci. Eng. 2022, 10, 1411. [Google Scholar] [CrossRef]
- Liu, H.; Zhou, B.; Yu, J.; Liu, K.; Han, X.; Zhang, G. Experimental investigation on the multiphase flow characteristics of oblique water entry of the hollow cylinders. Ocean Eng. 2023, 272, 113902. [Google Scholar] [CrossRef]
- Wang, Y.; Wang, F.; Yin, J.; Wei, Y.; Wang, C. Experimental study on synchronous high-speed vertical water entry of cylinders. Phys. Fluids 2024, 36, 057115. [Google Scholar] [CrossRef]
- Speirs, N.B.; Mansoor, M.M.; Belden, J.; Truscott, T.T. Water entry of spheres with various contact angles. J. Fluid Mech. 2019, 862, R3. [Google Scholar] [CrossRef]
- Yi, L.; Li, S.; Jiang, H.; Lohse, D.; Sun, C.; Mathai, V. Water entry of spheres into a rotating liquid. J. Fluid Mech. 2021, 912, 1–10. [Google Scholar] [CrossRef]
- Huera-Huarte, F.; Jeon, D.; Gharib, M. Experimental investigation of water slamming loads on panels. Ocean Eng. 2011, 38, 1347–1355. [Google Scholar] [CrossRef]
- Ma, Z.H.; Causon, D.M.; Qian, L.; Mingham, C.G.; Mai, T.; Greaves, D.; Raby, A. Pure and aerated water entry of a flat plate. Phys. Fluids 2016, 28, 016104. [Google Scholar] [CrossRef]
- Talioua, A.; Berkane, B.; Martin, M.B.; Perret, G.; Pinon, G. Flat plate pressure impact on a still water surface: The effect of surrounding ambient pressure and plate size. Ocean Eng. 2022, 263, 111926. [Google Scholar] [CrossRef]
- Chen, Z.; Jiao, J.; Wang, S.; Guedes Soares, C. CFD-FEM simulation of water entry of a wedged grillage structure into Stokes waves. Ocean Eng. 2023, 275, 114159. [Google Scholar] [CrossRef]
- Kleefsman, K.M.T.; Fekken, G.; Veldman, A.E.P.; Iwanowski, B.; Buchner, B. A Volume-of-Fluid based simulation method for wave impact problems. J. Comput. Phys. 2005, 206, 363–393. [Google Scholar] [CrossRef]
- Yuan, H.-T.; Sun, J.-Y.; Sun, S.-L.; Zhang, Z.-F.; Ren, H.-L. Vertical water entry of a cylinder considering wind and linearly sheared flow effect: A numerical investigation. Phys. Fluids 2024, 36, 032114. [Google Scholar] [CrossRef]
- Wu, X.; Wu, L.; Yu, P.; Chang, X. Investigation of the Impact Load Characteristics during Water Entry of Airdropped Underwater Gliders. J. Mar. Sci. Eng. 2024, 12, 808. [Google Scholar] [CrossRef]
- Qi, C.; Lyu, X.; Wang, X.; Ye, H.; Shi, H.; Wan, Z. Experimental and numerical studies on vertical water entry of a cylinder under the influence of current. Phys. Fluids 2024, 36, 033322. [Google Scholar] [CrossRef]
- Xiao, Y.; Zhang, G.; Hui, D.; Yan, H.; Feng, S.; Wang, S. Numerical simulation for water entry and exit of rigid bodies based on the immersed boundary-lattice Boltzmann method. J. Fluids Struct. 2022, 109, 103486. [Google Scholar] [CrossRef]
- Zhang, F.; Zhang, L.; Xie, Y.; Wang, Z.; Shang, S. Smoothed Particle Hydrodynamics Simulation of a Mariculture Platform under Waves. Water 2021, 13, 2847. [Google Scholar] [CrossRef]
- Chen, J.; Bai, X.; Wang, J.; Chen, G.; Zhang, T. Research on Sea Spray Distribution of Marine Vessels Based on SPH-FEM Coupling Numerical Simulation Method. Water 2022, 14, 3834. [Google Scholar] [CrossRef]
- Cai, X.; Wu, W.; Han, W.; Li, W.; Zhang, J.; Jiao, Y. Study on Water Entry of a 3D Torpedo Based on the Improved Smoothed Particle Hydrodynamics Method. Appl. Sci. 2024, 14, 4441. [Google Scholar] [CrossRef]
- Hammani, I.; Marrone, S.; Colagrossi, A.; Oger, G.; Le Touzé, D. Detailed study on the extension of the δ-SPH model to multi-phase flow. Comput. Methods Appl. Mech. Eng. Technol. 2020, 368, 113189. [Google Scholar] [CrossRef]
- Zhao, Z.-X.; Hong, Y.; Gong, Z.-X.; Liu, H. Numerical analysis of cavity deformation of oblique water entry using a multi-resolution two-phase SPH method. Ocean Eng. 2023, 269, 113456. [Google Scholar] [CrossRef]
- Zhao, Z.-X.; Bilotta, G.; Yuan, Q.-E.; Gong, Z.-X.; Liu, H. Multi-GPU multi-resolution SPH framework towards massive hydrodynamics simulations and its applications in high-speed water entry. J. Comput. Phys. 2023, 490, 112339. [Google Scholar] [CrossRef]
- Chen, C.; Zhang, A.-M.; Chen, J.-Q.; Shen, Y.-M. SPH simulations of water entry problems using an improved boundary treatment. Ocean Eng. 2021, 238, 109679. [Google Scholar] [CrossRef]
- Zhang, H.; Zhang, Z.; He, F.; Liu, M. Numerical investigation on the water entry of a 3D circular cylinder based on a GPU-accelerated SPH method. Eur. J. Mech. B Fluids 2022, 94, 1–16. [Google Scholar] [CrossRef]
- Lyu, H.-G.; Sun, P.-N.; Miao, J.-M.; Zhang, A.-M. 3D multi-resolution SPH modeling of the water entry dynamics of free-fall lifeboats. Ocean Eng. 2022, 257, 111648. [Google Scholar] [CrossRef]
- Fang, X.-L.; Ming, F.-R.; Wang, P.-P.; Meng, Z.-F.; Zhang, A.-M. Application of multiphase Riemann-SPH in analysis of air-cushion effect and slamming load in water entry. Ocean Eng. 2022, 248, 110789. [Google Scholar] [CrossRef]
- Zhao, K.; Yang, S.-F.; Ming, F.-R. Numerical analysis of water entry under ocean currents with smoothed particle hydrodynamics method. Phys. Fluids 2023, 35, 062103. [Google Scholar]
- Wang, S.; González-Cao, J.; Islam, H.; Gómez-Gesteira, M.; Guedes Soares, C. Uncertainty estimation of mesh-free and mesh-based simulations of the dynamics of floaters. Ocean Eng. 2022, 256, 111386. [Google Scholar] [CrossRef]
- Domínguez, J.M.; Fourtakas, G.; Altomare, C.; Canelas, R.B.; Tafuni, A.; García-Feal, O.; Martínez-Estévez, I.; Mokos, A.; Vacondio, R.; Crespo, A.J. DualSPHysics: From fluid dynamics to multiphysics problems. Comput. Part. Mech. 2022, 9, 867–895. [Google Scholar] [CrossRef]
- Wendland, H. Piecewise polynomial, positive definite and compactly supported radial functions of minimal degree. Adv. Comput. Math. 1995, 4, 389–396. [Google Scholar] [CrossRef]
- Monaghan, J.J. Smoothed particle hydrodynamics. Annu. Rev. Astron. Astrophys. 1992, 30, 543–574. [Google Scholar] [CrossRef]
- Monaghan, J.J.; Gingold, R.A. Shock simulation by the particle method SPH. J. Comput. Phys. 1983, 52, 374–389. [Google Scholar] [CrossRef]
- Monaghan, J.J.; Kos, A. Solitary waves on a Cretan beach. J. Waterw. Port Coast. Ocean. Eng. 1999, 125, 145–155. [Google Scholar] [CrossRef]
- Batchelor, G.K. An Introduction to Fluid Dynamics; Cambridge University Press: Cambridge, UK, 2000. [Google Scholar]
- Marrone, S.; Colagrossi, A.; Chiron, L.; De Leffe, M.; Le Touzé, D. High-speed water impacts of flat plates in different ditching configuration through a Riemann-ALE SPH model. J. Hydrodyn. 2018, 30, 38–48. [Google Scholar] [CrossRef]
- Leimkuhler, B.; Matthews, C. Molecular Dynamics: With Deterministic and Stochastic Numerical Methods; Springer International Publishing: Berlin/Heidelberg, Germany, 2015. [Google Scholar]
- Crespo, A.J.C. DualSPHysics. Available online: https://github.com/DualSPHysics/DualSPHysics/wiki (accessed on 12 July 2024).
- Mai, T.; Mai, C.; Raby, A.; Greaves, D.M. Aeration effects on water-structure impacts: Part 1. drop plate impacts. Ocean Eng. 2019, 193, 106600. [Google Scholar] [CrossRef]
- O’Connor, C.; Mohajernasab, S.; Abdussamie, N. Numerical investigation into water entry problems of a flat plate with air pockets. J. Ocean. Eng. Sci. 2023, 8, 386–400. [Google Scholar] [CrossRef]

Disclaimer/Publisher’s Note: The statements, opinions and data contained in all publications are solely those of the individual author(s) and contributor(s) and not of MDPI and/or the editor(s). MDPI and/or the editor(s) disclaim responsibility for any injury to people or property resulting from any ideas, methods, instructions or products referred to in the content. |
© 2024 by the authors. Licensee MDPI, Basel, Switzerland. This article is an open access article distributed under the terms and conditions of the Creative Commons Attribution (CC BY) license (https://creativecommons.org/licenses/by/4.0/).