Article

Genetic Variability and Population Genetic Structure of Marbled Flounder Pseudopleuronectes yokohamae in Korea and Japan Inferred from mtDNA Control Region Sequences

1
Department of Marine Biology and Aquaculture, The Institute of Marine Industry, Gyeongsang National University, Tongyeong 650-160, Republic of Korea
2
Department of Fisheries Biology and Aquatic Environment, Bangabandhu Sheikh Mujibur Rahman Agricultural University, Gazipur 1706, Bangladesh
*
Author to whom correspondence should be addressed.
J. Mar. Sci. Eng. 2024, 12(9), 1506; https://doi.org/10.3390/jmse12091506
Submission received: 25 June 2024 / Revised: 21 August 2024 / Accepted: 25 August 2024 / Published: 1 September 2024
(This article belongs to the Section Marine Biology)

Abstract

:
The marbled flounder (Pseudopleuronectes yokohamae) is a demersal flatfish species, widely distributed in the northwestern Pacific region. In the present study, the mitochondrial DNA (mtDNA) control region was used to determine the genetic diversity and population genetic structure of this species. We obtained a 380 bp segment of the mtDNA control region after the alignment of 78 individual sequences from P. yokohamae collected from two locations in Korea (Biungdo and Mukho) and one location in Japan (Tohoku) and 103 individual sequences from a previous study (Yokjido and Namhae). The overall haplotype diversity and nucleotide diversity were 0.983 ± 0.003 and 0.016 ± 0.008, respectively. The genealogical relationships of the mtDNA control region did not exhibit any specific genealogical association according to sampling location. The pairwise FST value indicated that the Biungdo (west coast of Korea) and Tohoku (Japan) populations showed genetically differentiated structures (but the Tohoku and Mukho populations did not). However, there was no discernible difference between the Mukho population from Korea’s eastern coast and the Yokjido and Namhae populations from the southern coast. The biological characteristics of P. yokohamae and oceanographic barriers may have contributed to producing genetically distinct populations.

1. Introduction

In marine systems, there are no obvious physical barriers that can obstruct the dispersal of organisms [1], which causes a lack of differentiation among populations. However, several factors, such as ocean currents, bathymetry, differences in temperature, and habitat ecology, may contribute to the production of structured populations in marine systems [2,3]. Conversely, historical demography can affect the current genetic diversity and population structure [4]. The Pleistocene glacial and interglacial cycle caused drastic alterations in areas and the configuration of the marginal seas of the northwestern Pacific [5], which likely produced genetically differentiated or panmictic populations in marine fish species [6,7].
Marbled flounder (Pseudopleuronectes yokohamae), a member of the Pleuronectidae family, is an economically significant fish species in Korea and Japan. It is found across the Yellow, Bohai, and northern parts of the East China Seas, as well as near the southern portion of Hokkaido Island, Japan [8,9]. Marbled flounder produce demersal adhesive eggs in shallow water less than 20 m in depth, which may be intended to prevent their eggs from being moved to the offshore water by currents [10]. On the other hand, dispersion of the pelagic larval stage occurs for a short period [11]. Mark and recapture data indicate that the migration capability of adult marbled flounders is limited to a distance of 70 km [12]. Although spawning in marbled flounder occurs during the winter season, the spawning months have been found to vary according to the geographical location in Korea, occurring on the southern coast of Korea, from December to January [13] and on the eastern coast, from December to February [14]. The reproductive behavior, adult migration capability, and discrepancies in the spawning period of P. yokohamae suggest that genetic differentiation may exist between populations.
The determination of population genetic structure is very important for developing fishery management policies, because failed or inappropriate ascertainment of a population may result in local overfishing and severe population reduction [15]. A previous study of five populations of P. yokohamae from the southern coast of Korea observed no structured populations [16]. Another study by Tsukagoshi [17] using the mtDNA control region, which was confined to Japan, found structured populations of P. yokohamae. Very recently, a study used the mtDNA control region and other mtDNA markers to determine the genetic diversity status based on a single population in Japan [18]. Due to biogeographic patterns and oceanographic barriers produced by different current systems, the coastal area of Korea, including the east and the west coast, and Japan form divergent habitats for fish, which presumably produce structured populations. Previous studies in this region identified genetically differentiated fish populations [7,19]. Therefore, considering the different biological behavior and oceanographic factors affecting fish populations, P. yokohamae samples from a broad geographical area including the east and west coasts of Korea and Japan were used in the present study to observe P. yokohamae genetic differentiation in these regions.
Mitochondrial DNA (mtDNA) is widely used for detecting genetic diversity and population genetic structure and phylogenetic and evolutionary history because of its unique characters such as maternal inheritance, haploid nature, and non-recombination characteristics [20]. Compared with other regions of the mtDNA, the control region sequence has high variation due to a high substitution rate that is about dozen times higher, which makes it an extremely suitable marker for studying genetic diversity and population structure [21]. In spite of many molecular advances, the mtDNA control region alone is still used as a potential marker for genetic diversity, population structure, and phylogenetic studies, as reported for Pagellus bogarevio and Paralichthys olivaceus [22,23], due to its unique characteristics. Although a number of studies have been conducted on P. yokohamae based on the mtDNA control region, those studies were confined to a limited area, i.e., a small area of either Korea or Japan. In this study, we tried to cover a broad geographical area of Korea and Japan including new locations. In this study, samples from locations on the west, south, and east coasts of Korea and one location in Japan were collected to examine the genetic diversity and population structure differentiation of P. yokohamae using the mtDNA control region sequence.

2. Materials and Methods

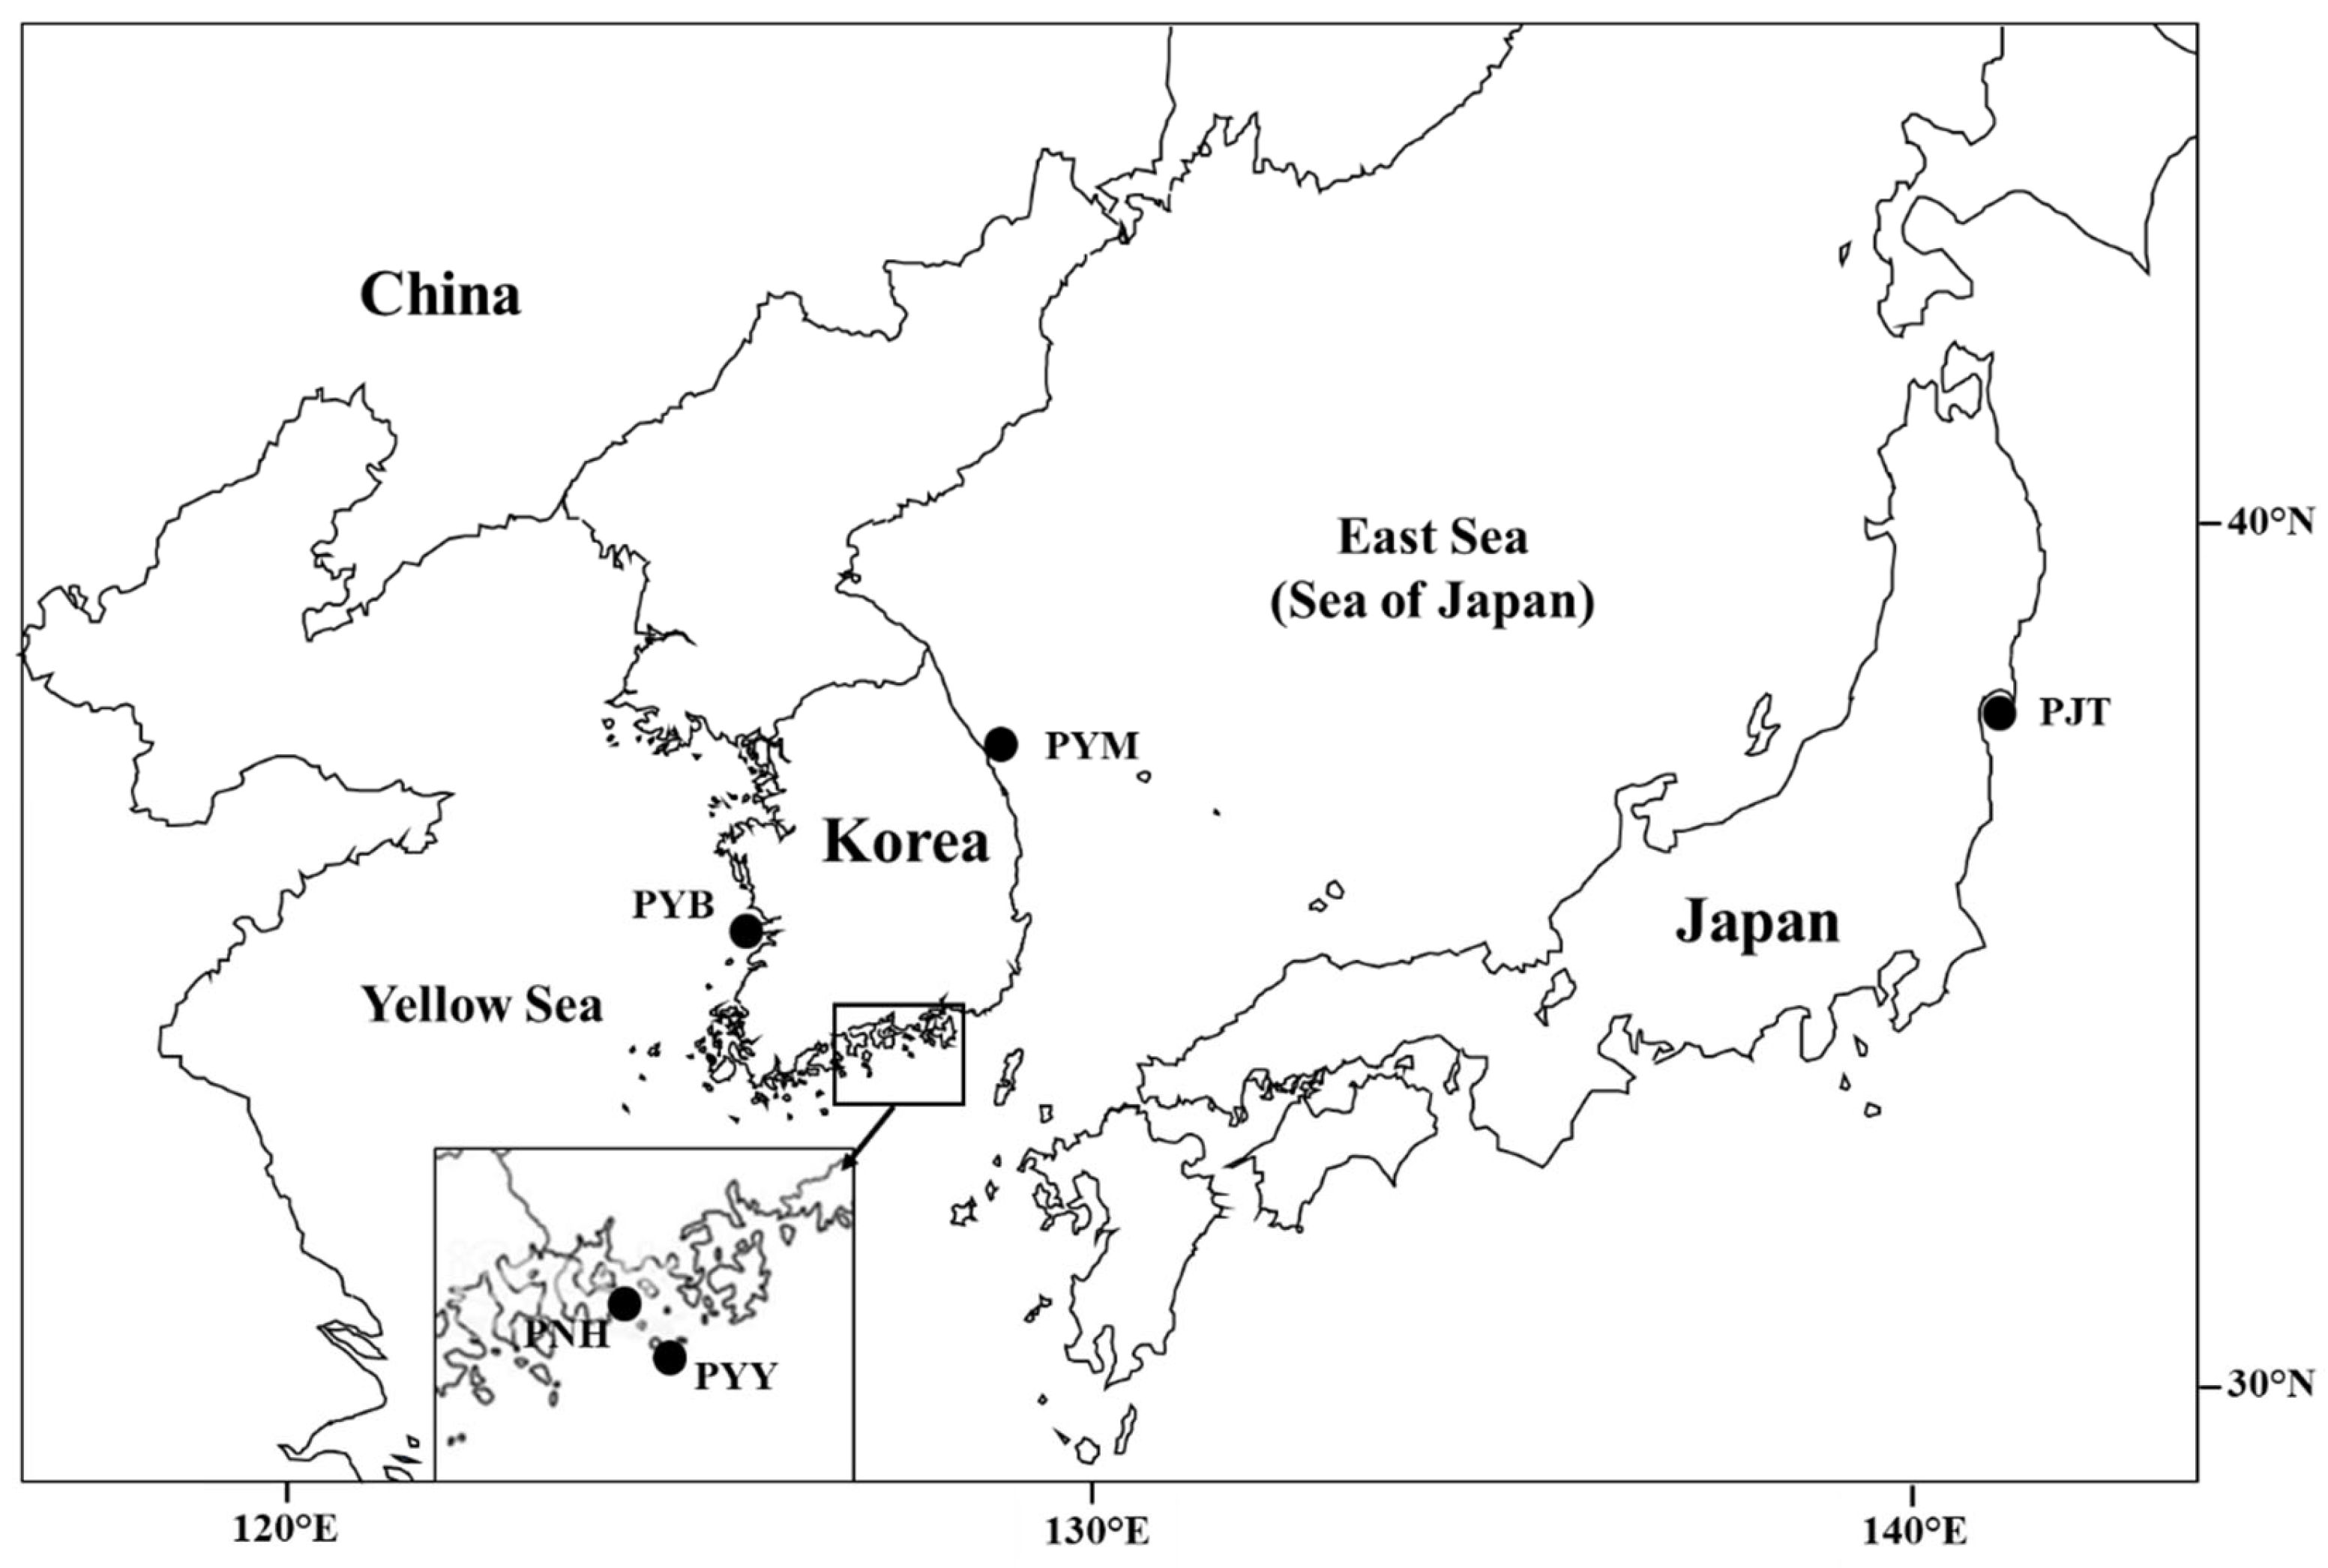
2.1. Sample Collection

A total of 78 P. yokohamae individuals were collected from two locations along the western (Biungdo (PYB)) and eastern coasts (Mukho (PYM)) of Korea and one location in Japan (Tohoku (PJT)) between 2012 and 2016. In addition, a total of 103 published sequences from two locations on the southern coast of Korea, i.e., Yokjido (PYY) and Namhae (PNH), were obtained from Lee et al. [16] (Figure 1, Table 1). All the individuals used in this study were mostly collected during the spawning season. The fish samples were collected directly from fishermen in the respective locations. Muscle tissue was removed from each individual and stored in 99% ethanol, and the rest of the samples was preserved in the laboratory at −80 °C. No additional sequences were obtained from GenBank because of the unavailability of sequences from our locations of interest and because some sequences were deposited without geographic references. In some cases, only haplotypes were deposited, without associated frequencies.

2.2. DNA Extraction and Sequencing

Genomic DNA was extracted from the muscle tissue by proteinase K and the Wizard genomic DNA purification kit (Promega, Madison, WI, USA) following the protocol of the manufacturer. The control region of mtDNA was amplified using the universal forward and reverse primer pair L15996Po (5′-TCCTACCCCTAACTCCCAAAGC-3′) and H16495Po (5′-GAAGTAGGAACCAAATGCCA-3′) [16]. Polymerase chain reaction was accomplished in a 15 μL volume containing template DNA 0.6 μL, 10× Ex Taq DNA polymerase buffer 1.5 μL (Takara, Otsu, Japan), 5 μM primers 1.5 μL, 2.5 mM deoxyribonucleotide triphosphate (dNTP) 1.5 μL, Ex Taq DNA polymerase 0.1 μL (Takara), and sterilized water. PCR amplification was performed under the following conditions: 30 cycles with denaturation for 15 s at 94 °C, annealing for 15 s at 50 °C, extension for 30 s at 72 °C. The amplified products were checked by 1.5% agarose gel electrophoresis. To remove the residual single-stranded primers and the excess dNTPs, a mixture of 0.5 μL of ExoSAP-IT (United States Biochemical Corporation, Cleveland, OH, USA) and 1.5 μL of sterilized water was used for 30 min at 37 °C and another 15 min at 80 °C. Then, sequencing was performed on an ABI 3730XL DNA analyzer (Applied Biosystems Inc., Waltham, MA, USA) using the ABI BigDye Terminator Cycle Sequencing Ready Reaction Kit v3.1 (Applied Biosystems Inc., USA) and the purified product as template DNA.

2.3. Genetic Diversity and Population Genetic Analyses

All sequences were edited and aligned by ClustalW [24] in Bioedit software ver. 7.2.3 [25]. As Tsukagoshi et al. [17] suggested that P. yokohamae and P. schrenki hybridize, and some P. yokohamae sequences were clustered with P. schrenki in the neighbor-joining (NJ) tree, we checked all data through GenBank. In addition, we constructed an NJ [26] tree using the sequence of P. schrenki deposited by Tsukagoshi et al. [17] with MEGA 5.05 [27] to exclude sequences belonging to the P. schrenki clade. The number of haplotypes, polymorphic sites, transitions, and transversions, as well as haplotype diversity and nucleotide diversity were estimated using ARLEQUIN version 3.5 [28]. The fixation index FST was used to determine pairwise genetic variation between populations and their structure by ARLEQUIN. The significance of each pairwise comparison was tested by 1000 permutations. Variance distribution was determined by analysis of molecular variance (AMOVA) programmed in Arlequin 3.5. In this study, AMOVA was conducted by different grouping methods. First, five populations were considered as a single pool to observe the significance of the partitioning of genetic variance among all populations. Second, three groups were formed, defining PYB from the west coast of Korea, PYY, PNH, and PYM from the south coast and east coast of Korea, and PJT from Japan as separate groups. The neighbor-joining method [26] was used to examine the genetic links between haplotypes through the use of MEGA 5.05 [27]. The genetic distances between haplotype sequences for phylogenetic reconstruction were generated using Kimura’s two-parameter model in MEGA 5.05. The accuracy of the neighbor-joining tree was evaluated using 1000 bootstrap replicates. In the final tree, bootstrap support above 50 was showed for the major branches. P. americanus and Glyptocephalus stelleri were used as an outgroup. To observe the phylogenetic relationship, a maximum likelihood-based phylogenetic tree was also constructed in MEGA 5.05. The minimum spanning tree was reconstructed by ARLEQUIN and the HapStar v.0.7 software program [29]. The demographic history of P. yokohamae was determined using ARLEQUIN’s neutrality tests and mismatch analysis. Tajima’s D [30] and Fu’s FS tests [31] were used as neutrality tests in order to determine any deviations from neutrality. Mismatch distributions, which represent the frequency distribution of pairwise differences between sequences [32], were also determined to investigate the historical demographic expansion. Unimodal distribution is evidence of population expansion, whereas multimodal distribution is evidence of a stable population. Harpending’s raggedness index (Hri) and the sum of squared differences (SSD) were employed under the rapid expansion model to assess the fit between the observed and the expected distribution. Using the formula t = τ/2u, the time since population expansion (t) was computed, where τ is the period since the expansion (expressed in units of mutational time), and u is the mutation rate of each individual gene per generation. Among the taxonomic group of marine fishes, the molecular clock of the control region seems to differ. In some bony fishes, the evolution rate of the control region is faster than that of protein-coding mtDNA, whereas in some cases, these sequences seem to mutate at the same rate [reviewed in [33]]. The mutation rate has not been estimated for P. yokohamae species. In this study, we adopted the divergence rate of 3–13%/MY used for other flatfishes [34] to estimate the expansion time of this species.

3. Results

3.1. Genetic Diversity

A 380 bp fragment of the mtDNA control region was obtained after the alignment of 181 individual sequences of P. yokohamae. All the sequences detected were of P. yokohamae species, i.e., no haplotypes from other species because of hybridization were observed. The comparison of the 181 sequences revealed 70 polymorphic sites with 60 transitions and 10 transversions. The nucleotide composition of the sequences was AT-rich (A = 35.71%, T = 28.20%, C = 20.46%, G = 15.62%). There was a total of 81 haplotypes, among which 45 (55%) were unique, occurring only in one individual. The most frequently occurring haplotype was found in about 6% (11/81) of the individuals and was shared by all locations. All haplotypes were deposited in NCBI, with the accession numbers MT708340-MT708353, MT708390-MT708393, MT708396-MT708412, MT708414-MT708434, MT708436, MT708438, MT708440-MT708443, MT708448-MT708452, and MT708454-MT708467. Haplotype diversity was very high in all locations, ranging from 0.986 ± 0.025 (Mukho) to 0.944 ± 0.017 (Biungdo). Nucleotide diversity ranged from 0.017 ± 0.009 (Mukho and Tohoku) to 0.014 ± 0.007 (Namhae). The overall haplotype diversity and nucleotide diversity were 0.983 ± 0.003 and 0.016 ± 0.008, respectively (Table 2). The distribution of all haplotypes in the different locations is presented in Table 3.

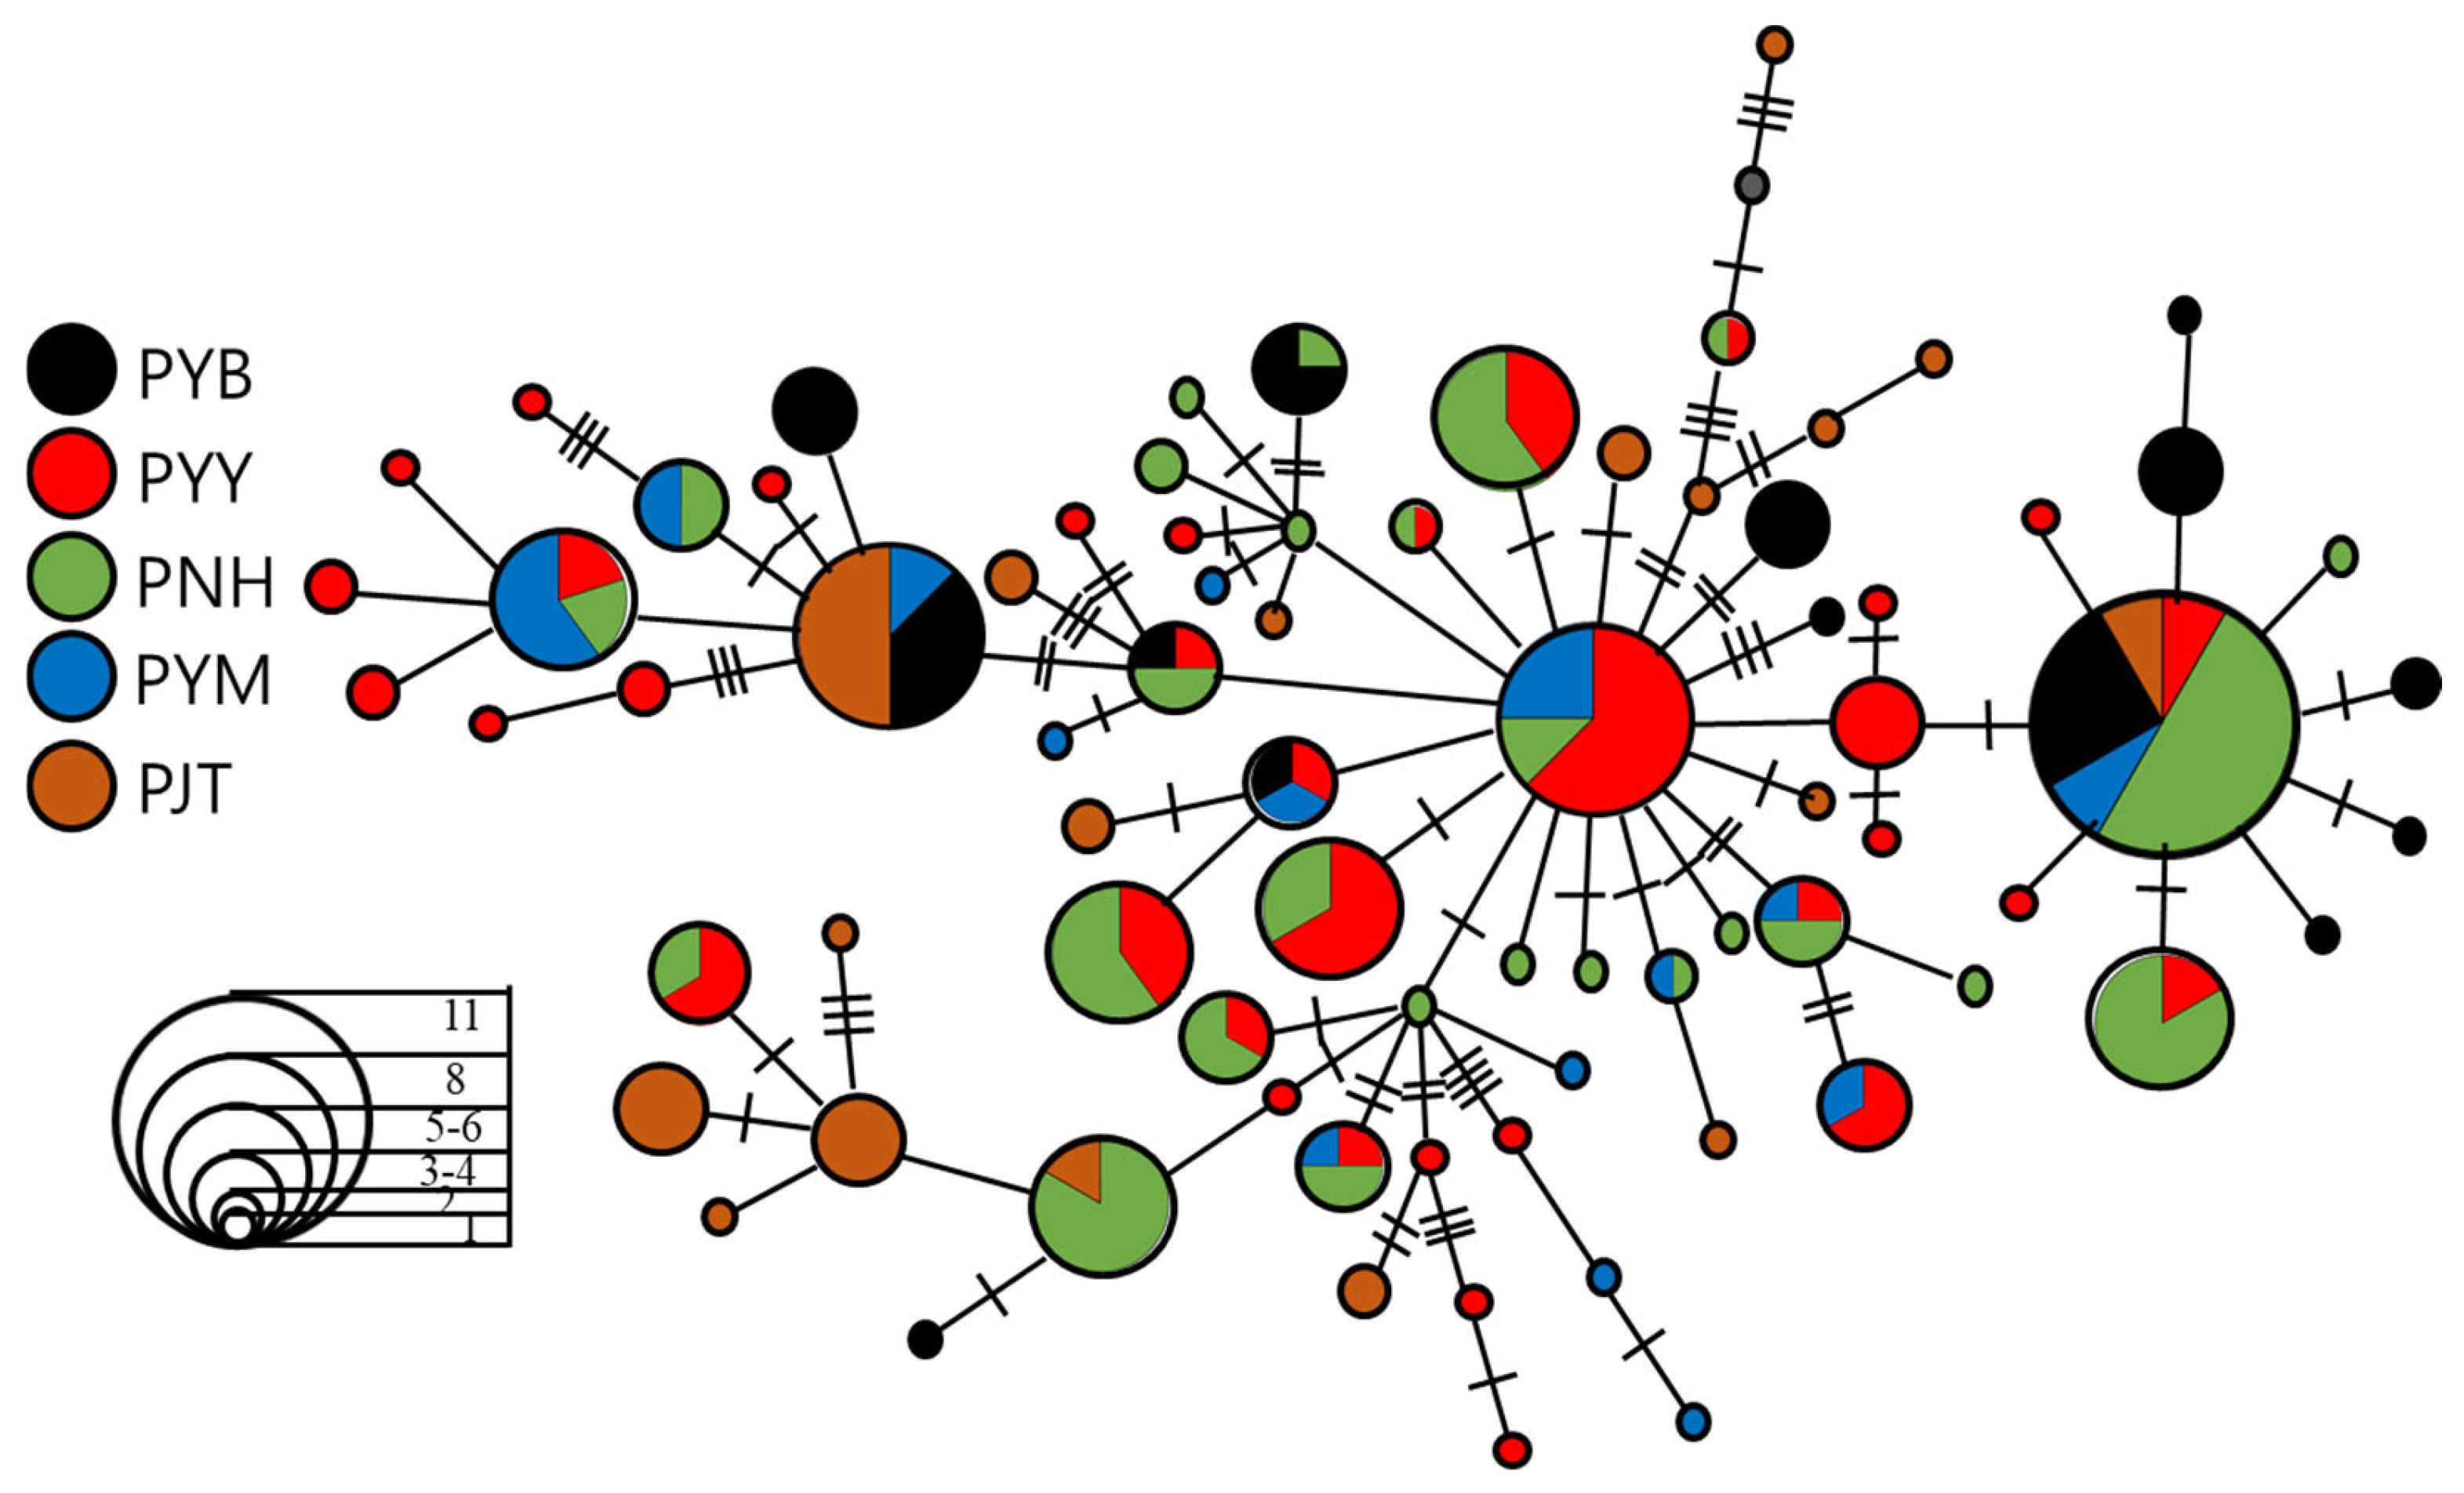
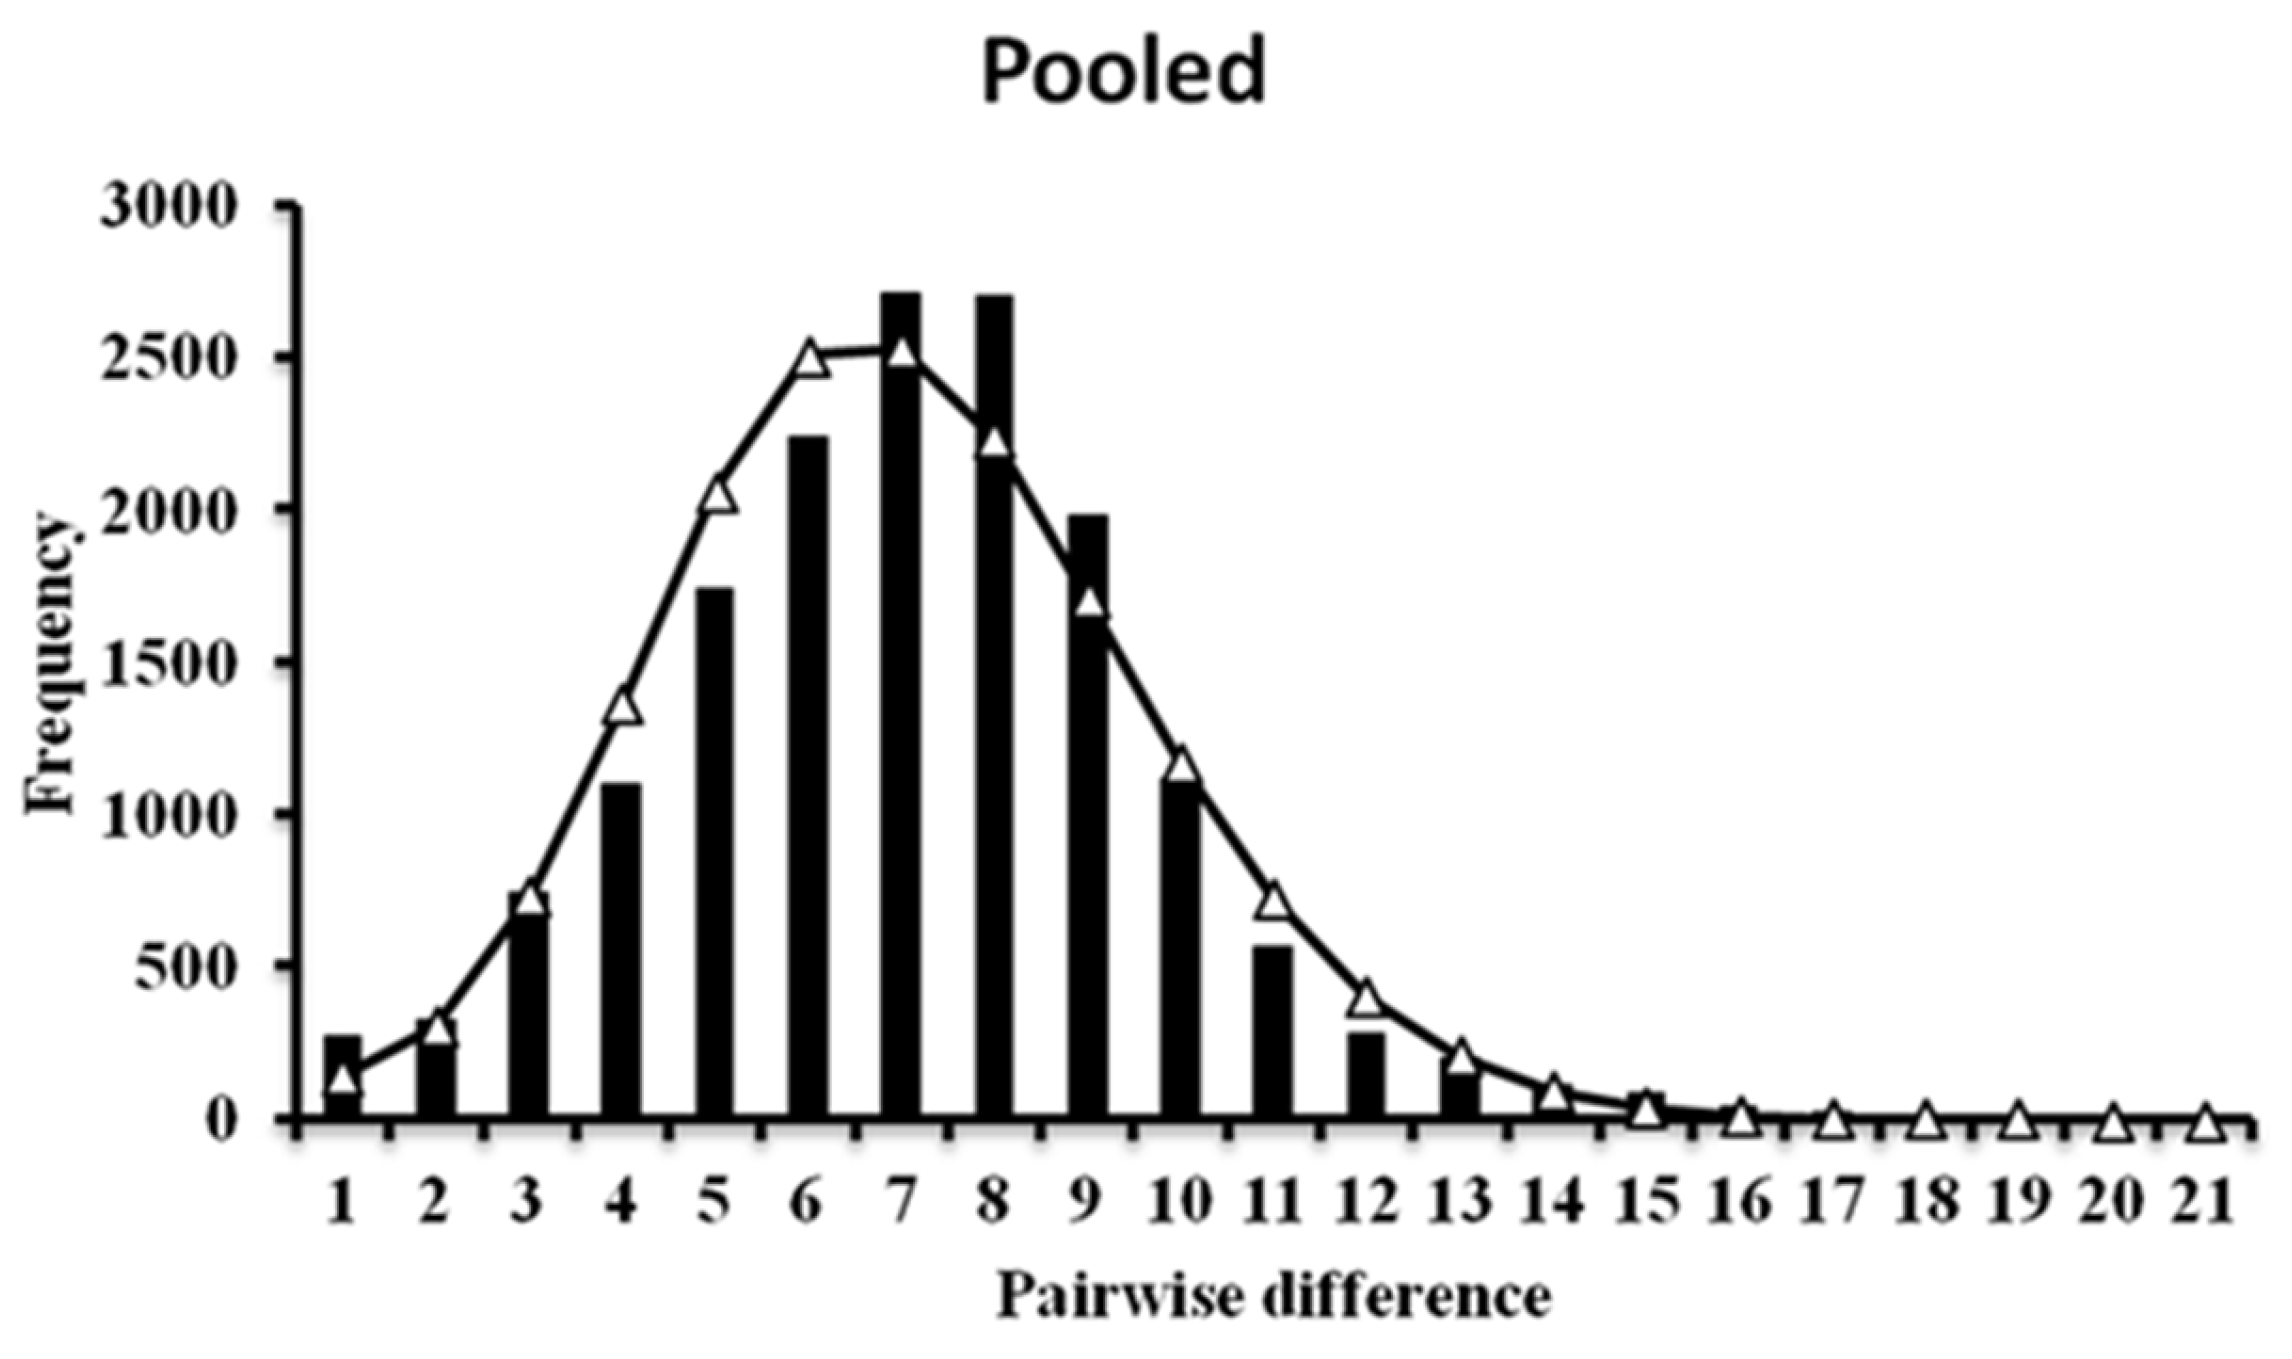
3.2. Demographic History and Population Structure

The phylogenetic analysis did not show any significant geographical association according to sampling location. The haplotypes from all locations were distributed throughout the phylogenetic tree. The results of the phylogenetic analysis with the neighbor-joining and maximum likelihood method are represented in Figure 2a,b. The minimum spanning tree appeared as a star-like structure, with many unique haplotypes connected with some common haplotypes (Figure 3). The mismatch distribution of the pooled samples showed a unimodal distribution (Figure 4). Tajima’s D value was negative for all locations but significant for the pooled samples, whereas Fu’s FS value was negative and significant for all locations and pooled samples, indicating location expansion. The low and insignificant value of the raggedness index and the sum of squared deviations corroborated this result. The mismatch analysis and neutrality test results for the five locations and pooled samples are presented in Table 4. According to the tau (τ) value and the divergence rate mentioned above, the expansion of this species is assumed to have occurred from 134,000 years to 581,000 years ago.
Pairwise FST comparison suggested that the results for Biungdo (west coast) locations in Korea were significantly different from those for all the other locations. The results for Tohoku locations in Japan were also significantly different from those for all the other locations, except Mukho. On the other hand, there was no significant difference between the Namhae, Yokjido, and Mukho results (Table 5). AMOVA analysis indicated significant genetic difference among the locations in one-group analysis. In the case of three-group analysis with AMOVA, no significant difference was observed among locations within groups (Table 6).

4. Discussion

4.1. Genetic Diversity and Demographic History

Genetic diversity is essential for a fish population to adapt to the changing environment. The survival of individuals in new environments increases with a high genetic diversity, facilitating the continuation of populations for many generations [35]. The overall sequence diversity of the mtDNA control region of P. yokohamae was high (h = 0.983 ± 0.003, π = 0.016 ± 0.008). Previous studies on P. yokohamae using the mtDNA control region also showed a high level of genetic diversity (Lee et al. [16], h = 0.918–0.983, π = 0.015–0.024, Tsukagoshi et al. [17], h = 0.9866, π = 0.039090, and Yamamoto et al. [18], h = 0.960 ± 0.0067, π = 0.01760 ± 0.00926). A similarly high level of genetic diversity was exhibited in studies on mtDNA control regions by other flatfishes such as Paralichthys olivaceus (h = 1.000, π = 0.043 [36]), Glyptocephalus stelleri (h = 0.99, π = 0.014 [34]), and Pleuronectes herzensteini (h = 0.989 to 1.000, π = 0.015 to 0.022 [37]). Grant and Bowen [38] suggested that such high genetic diversity levels in species may be associated with an extended evolutionary history in a large population. Pleuronectid species, such as plaices, flounders, and sole, usually have large populations with wide distributions [39]. Therefore, the results of the present study suggest that P. yokohamae has undergone a long evolutionary process and has maintained a large effective population size. Both mismatch distribution analysis and neutrality test also corroborate the historical population expansion of this species. The phylogenetic tree analysis showed a shallow topology for this species, indicating population expansion. There were some small clades in both the NJ and the ML trees with high bootstrap support but without any obvious geographical association. The minimum spanning tree exhibited a star-like structure with many unique haplotypes, which also indicated population expansion. A recent work by Yamamoto [18] showed a contrasting demographic history by haplotype network, where the hypervariable region of mtDNA exhibited a diffuse pattern with a loop structure, suggesting a constant population size over time. In our study, also the NJ tree and the maximum likelihood tree did not show any strong genealogical branch associated with location, suggesting a recent population expansion. The population-wise parameters also corroborated a recent population expansion. Two previous studies by Lee et al. [16] and Tsukagoshi et al. [17] also indicated a population expansion. The estimated expansion time of P. yokohamae is concordant with the time of the late Pleistocene period expansion. At that time, the climate was dominated by a repeated occurrence of glacial and interglacial cycles at an interval of 100,000 years [40], which caused the rise and fall of the sea level. Due to a fall of the sea level to about 120–140 m below the present value, large areas of marginal seas of the northwestern Pacific such as the Bohai Sea, the Yellow Sea, and the East China Sea were exposed [5,41]. At the same time, the coast of Korea emerged, and the East Sea (Japan Sea) was detached from the surrounding seas [42]. Drastic changes affect the habitat and spawning ground of P. yokohamae, which usually spawns at less than 20 m in depth. Therefore, P. yokohamae seems to have undergone contraction, during the glacial period, to refugia and expansion to the formerly inhabited coastal areas during the interglacial period. Demographic expansion was also observed for flatfish and other species such as Glyptocephalus stelleri [34], Engraulis japonicus, and Engraulis australis [43].

4.2. Population Genetic Structure

In marine systems, population genetic structure is influenced by many factors such as the presence or absence of physical barriers, the capability of ocean currents to disperse eggs, larvae, and juveniles, different oceanographic factors, spawning characteristics, and movement in adult stages [38,44,45]. A significant difference was observed among the populations of P. yokohamae by pairwise comparisons. AMOVA analysis also showed significant variance among populations by one-group analysis and among groups by three-group analysis, indicating restriction of gene flow. Restriction of gene flow was further indicated by the existence of many unique haplotypes (PYY54, PYB30, PYB18, PYB32, PJT28, PJT24) with high frequency. On the other hand, for some of the haplotypes, a higher frequency of occurrence (PYM17, PNH42, PYB20, PJT12, PNH53) in a particular population also indicated restriction of gene flow. In a previous study, Lee et al. [16] found no significant genetic differentiation of the five populations of P. yokohamae on the southern coast of Korea. On the other hand, a previous study by Tsukagoshi et al. [17] based on mtDNA control regions found significant genetic differences among P. yokohamae populations in different locations in Japan. Using microsatellite markers, a significant genetic difference was noted by Minegishi et al. [46] between populations on the east and west sides of the Japanese Boso Peninsula. Sato et al. [47] also found significant genetic divergence between locations within the Tokyo Bay and outside it (Choshi). The genetic divergence of populations may be caused by several circumstances. According to Dou [48,49], in the Bohai Sea, P. yokohamae spawns and feeds in the nearshore coastal area and remains in the middle of the Bohai Sea and Bohai strait for overwintering. While a small portion of P. yokohamae may move to the Yellow Sea for overwintering, they return to the Bohai Sea for spawning in the next year. On the other hand, according to Dagang et al. [50], P. yokohamae never migrates for overwintering and stays in the nearshore water. It has also been observed that P. yokohamae’s yolk-sac and yolk-less larvae spread vertically from mid-water to the near-bottom layer, mostly by compensatory drift from the offshore spawning ground to the inshore nursery area [51]. P. yokohamae was found to have limited migration capability by a tagging experiment, indicating that this species might stay around the spawning ground [12]. Therefore, the genetic differentiation among populations observed in this study may be due to the site fidelity and larval characteristics of this species. However, there are very little data about the site fidelity of this species in Korea and Japan, and further study is required.
Unlike other flatfish species, P. yokohamae produce demersal adhesive eggs in shallow coastal areas, which prevents their dispersal as well as connectivity during the embryonic stage. According to Lee et al. [52], the survival of P. yokohamae larvae and juveniles is highly sensitive to temperature changes. Nakagami et al. [51] also reported that local hydrodynamic forces mostly influence the marbled flounder larvae’s distribution. Gwak and Nakayama [7] observed that the demersal fish Gadus microcephalus, which also produces adhesive eggs, exhibited genetically distinct populations in the west, south, and east coasts of Korea and suggested that water temperature, ocean currents, and spawning site fidelity were possible causes for the structured populations. Suda et al. [53] also observed two genetically differentiated groups of Gadus macrocephalus in the eastern and western parts of Japan due to temperature differences.
The low salinity and low temperature of the West Korea Cold Current affect Korea’s west coast, while the Tsushima Warm Current’s high salinity and high temperature have a significant impact on the country’s south coast [54,55]. When the West Korea Cold Current moves southward, a strong front is created with the Tsushima Warm Current [56,57] due to the differences in salinity and temperature. On the other hand, during winter, a distinct difference in water temperature between the west and south coasts of Korea and Tohoku in Japan has been reported [53]. During winter, the water temperature of the south coast ranges from about 10 to 16 °C, whereas on the west coast of Korea and in Tohoku in Japan, the temperature ranges are about 4–10 °C and 3–9 °C, respectively. In addition, Tohoku is influenced by the cold water of Oyashio Current [58]. Therefore, the genetic isolation of populations may be caused by restriction of movement due to temperature differences and adaptation to different environments, particularly diverse water temperatures, which may limit gene flow among populations.
Although the eastern coast of Korea and the southern coast of Korea may have different environments due to many factors such as the North Korea Cold Current, the Tsushima Current, salinity, and temperature, the Namhae, Yokjido, and Mukho populations did not show significant differences. Pairwise comparisons (FST) provided very low values and statistically insignificant results, indicating a genetic connection among the populations. The examined populations in this region may have adapted well to this environment. Statistically, no significant differences among populations over a large geographic area in this region were also observed by Suda et al. [53] and Gwak et al. [7]. Eastern Korea’s shoreline is largely straight with few islands. Different currents, such the Tsushima Warm Current and the East Korea Current, have a significant influence on Korea’s southern and eastern coasts. These currents may lead to genetic mixing among populations through larval dispersal. However, the number of Mukho individuals was comparatively low, which could influence the results of the present study. Furthermore, mtDNA analysis usually uses limited gene loci and sometimes fails to accurately differentiate populations. In addition, hypervariability and homoplasy may be exhibited by the mtDNA control region, which thus may fail to accurately reflect the overall population structure [59]. Therefore, more individual samples from the east coast of Korea and more powerful markers such as microsatellite markers, which use highly polymorphic loci, can be used to identify the local marine populations and assist in developing a more appropriate management policy for this important species.
The present study revealed that all populations of P. yokohamae possess high genetic diversity, and genetically differentiated populations (especially, the west coast population, the south and east coast populations, and Japan population as three separate groups) were observed for this species. The formation of these structured populations may be related to spawning site fidelity and oceanographic barriers. It is crucial to know how organisms interact with their environments and separate populations to predict their future distribution trends and to conduct efficient management [35]. The structured populations found in this study should be monitored separately to establish appropriate management policies for maintaining their sustainable production. For this commercially important species, different management strategies should be designed, such as the following: (i) banning bottom trawling during the spawning season; (ii) setting a minimum catch size by bottom trawling; (iii) regulating the mesh size of the trawl net. In addition, the stock status should be monitor on a regular basis to ensure the maximum sustainable yield as well as fishery sustainability. Hatchery-produced juveniles from the parent stock of the corresponding site can also be released to enhance the stock size. The maintenance of genetic diversity in the juveniles should be taken into consideration during their release. In that case, a large parent stock from the corresponding area should be maintained in the hatchery. Regularly monitoring the genetic diversity of the wild population of this species should help to avoid negative effects.

Author Contributions

Conceptualization, W.-S.G.; methodology, W.-S.G.; software, W.-S.G.; vali-dation, W.-S.G.; formal analysis, W.-S.G.; investigation, W.-S.G.; resources, W.-S.G.; data curation, W.-S.G. and A.R.; writing—original draft preparation, A.R.; writing—review and editing, W.-S.G. and A.R.; visualization, W.-S.G. and A.R.; supervision, W.-S.G.; project administration, W.-S.G.; funding acquisition, W.-S.G. All authors have read and agreed to the published version of the manuscript.

Funding

This research was supported by a Korea Institute of Marine Science and Technology Promotion (KIMST) grant funded by the Ministry of Oceans and Fisheries (KIMST RS-2021-KS211500, Korea–Arctic Ocean Warming and Response of Ecosystem, KOPRI, and RS-2023-00256330, Development of risk managing technology tackling ocean and fisheries crisis around Korean Peninsula by Kuroshio Current).

Institutional Review Board Statement

Not applicable.

Informed Consent Statement

Not applicable.

Data Availability Statement

The data presented in this study are available on request from the corresponding author due to privacy.

Acknowledgments

We acknowledge Kouji Nakayama for his great support in collecting samples from Japan and for revising the manuscript with valuable suggestions.

Conflicts of Interest

The authors declare no conflicts of interests.

References

  1. Ward, R.D.; Woodwark, M.; Skibinski, D.O.F. A comparison of genetic diversity levels in marine, freshwater, and anadromous fishes. J. Fish Biol. 1994, 44, 213–232. [Google Scholar] [CrossRef]
  2. Gaylord, B.; Gaines, S.D. Temperature or transport? Range limits in marine species mediated solely by flow. Am. Nat. 2000, 155, 769–789. [Google Scholar] [CrossRef] [PubMed]
  3. Schuller, M. Evidence for a role of bathymetry and emergence in speciation in the genus Glycera (Glyceridae, Polychaeta) from the deep Eastern Weddell Sea. Polar. Biol. 2011, 34, 549–564. [Google Scholar] [CrossRef]
  4. Marko, P.B.; Hart, M.W. The complex analytical landscape of gene flow inference. Am. Nat. 2011, 26, 448–456. [Google Scholar] [CrossRef] [PubMed]
  5. Wang, P.X. Response of Western Pacific marginal seas to glacial cycles: Aleoceangraphic and sedimentological features. Mar. Geol. 1999, 156, 5–39. [Google Scholar] [CrossRef]
  6. Nohara, K.; Takeuchi, H.; Tsuzaki, T.; Suzuki, N.; Tominaga, O.; Seikai, T. Genetic variability and stock structure of red tilefish Branchiostegus japonicus inferred from mitochondrial DNA sequence analysis. Fish. Sci. 2010, 76, 75–81. [Google Scholar] [CrossRef]
  7. Gwak, W.S.; Lee, Y.D.; Nakayama, K. Population structure and sequence divergence in the mitochondrial DNA control region of gizzard shad Konosirus punctatus in Korea and Japan. Ichthyol. Res. 2014, 62, 379–385. [Google Scholar] [CrossRef]
  8. Joh, M.; Takatsu, T.; Nakaya, M.; Higashitani, T.; Takahashi, T. Otolith microstructure and daily increment validation of marbled sole (Pseudopleuronectes yokohamae). Mar. Biol. 2005, 147, 59–69. [Google Scholar] [CrossRef]
  9. NFRDI (National Fisheries Research and Development Institute). Commercial Fishes of the Coastal & Offshore Waters in Korea; Yemunsa: Busan, Republic of Korea, 2004; 333p. [Google Scholar]
  10. Pearcy, W.G. Distribution and origin of demersal eggs within the order Pleuronectiformes. J. Cons. Int. Explor. Mer. 1962, 27, 233–235. [Google Scholar] [CrossRef]
  11. Joh, M.; Nakaya, M.; Yoshida, N.; Takatsu, T. Interannual growth differences and growth- selective survival in larvae and juveniles of marbled sole Pseudopleuronectes yokohamae. Mar. Ecol. Prog. Ser. 2013, 494, 267–279. [Google Scholar] [CrossRef]
  12. Jusan, K. Results of Mark-Recapture Experiments for Flatfish Species around Coastal Areas of Aomori Prefecture, Japan; Japan Fisheries Agency: Tokyo, Japan, 1988; pp. 4–12. (In Japanese) [Google Scholar]
  13. Joo, H.W.; Gwak, W.S. Estimation of early growth and spawning period of marbled flounder (Pseudopleuronectes yokohamae) in the water off Namhae of Korea as indicated from daily growth increments in otoliths. Korean Soc. Oceanogr. 2014, 19, 35–40. [Google Scholar]
  14. Kim, S.R.; Cha, H.K.; Lee, J.B.; Lee, H.W.; Yang, J.H.; Baek, H.J.; Kim, S.T. Maturity and spawning of the marbled flounder Pseudopleuronectes yokohamae off the coast of Pohang, East Sea. Korean J. Fish. Aquat. Sci. 2016, 49, 367–375. [Google Scholar] [CrossRef]
  15. Waples, R.S. Separating wheat from the chaff: Patterns of genetic differentiation in high gene flow species. J. Hered. 1998, 89, 438–450. [Google Scholar] [CrossRef]
  16. Lee, S.J.; Lee, S.G.; Gwak, W.S. Population genetic structure and genetic variability of the marbled sole Pleuronectes yokohamae on the coast of Gyeongsangnam-do, Korea. Anim. Cells. Syst. 2012, 16, 498–505. [Google Scholar] [CrossRef]
  17. Tsukagoshi, H.; Takeda, K.; Kariya, T.; Ozaki, T.; Takatsu, T.; Abe, S. Genetic variation and population structure of marbled sole Pleuronectes yokohamae and cresthead flounder P. schrenki in Japan inferred from mitochondrial DNA analysis. Biochem. Syst. Ecol. 2015, 58, 274–280. [Google Scholar] [CrossRef]
  18. Yamamoto, Y.; Takanashi, A.; Yokosawa, Y.; Ikeda, M. Implication of homoplasy in hypervariable region (HVR) of mitochondrial DNA in a population of marbled flounder Pseudopleuronectes yokohamae: Consideration for conductingpopulation genetic analyses using the HVR. Fish. Sci. 2024, 1–12. [Google Scholar] [CrossRef]
  19. An, H.S.; Lee, J.W.; Park, J.Y.; Jung, H.T. Genetic structure of the Korean black scraper Thamnaconus modestus inferred from microsatellite marker analysis. Mol. Biol. Rep. 2013, 40, 3445–3456. [Google Scholar] [CrossRef]
  20. Avise, J.C. The history and preview of phytogeography: A personal reflection. Mol. Ecol. 1998, 7, 371–379. [Google Scholar] [CrossRef]
  21. Cann, R.L.; Brown, W.M.; Wilson, A.C. Polymorphic sites and the mechanism of evolution in human mitochondrial DNA. Genetics 1984, 106, 479–499. [Google Scholar] [CrossRef]
  22. Robalo, J.I.; Farias, I.; Francisco, S.M.; Avellaneda, K.; Castilho, R.; Figueiredo, I. Genetic population structure of Blackspot seabream (Pagellus bogarevio) contribution of mtDNA control region to fisheries management. Mitochondrial DNA Part A 2021, 32, 115–119. [Google Scholar] [CrossRef]
  23. Sun, C.H.; Yang, F.; Huang, Q.; Zeng, X.S.; Zhang, Y.N.; Li, S.; Yu, J.F.; Zhang, Q. Genetic population structure and demographic history of the endemic fish Paralichthys olivaceus of the Northwest Pacific Ocean. Echol. Evol. 2022, 12, e9506. [Google Scholar] [CrossRef] [PubMed]
  24. Thompson, J.D.; Higgins, D.G.; Gibson, T.J. CLUSTAL W: Improving the sensitivity of progressive multiple sequence alignment through sequence weighting, position-specific gap penalties and weight matrix choice. Nucleic Acids Res. 1994, 22, 4673–4680. [Google Scholar] [CrossRef] [PubMed]
  25. Hall, T.A. BioEdit: A user-friendly biological sequence alignment editor and analysis program for Windows 95/98/NT. Nucleic Acids Symp. Ser. 1999, 41, 95–98. [Google Scholar]
  26. Saitou, N.; Nei, M. The neighbour-joining method: A new method for reconstructing phylogenetic trees. Mol. Biol. Evol. 1987, 4, 406–425. [Google Scholar] [CrossRef]
  27. Tamura, K.; Peterson, D.; Peterson, N.; Stecher, G.; Nei, M.; Kumar, S. MEGA5: Molecular evolutionary genetics analysis using maximum likelihood, evolutionary distance, and maximum parsimony. Methods Mol. Biol. Evol. 2011, 28, 2731–2739. [Google Scholar] [CrossRef]
  28. Excoffier, L.; Lischer, H.E.L. Arlequin suite ver 3.5: A new series of programs to perform population genetics analyses under Linux and Windows. Mol. Ecol. Resour. 2010, 10, 564–567. [Google Scholar] [CrossRef]
  29. Teacher, A.G.F.; Griffiths, D.J. Hapstar: Automated haplotype network layout and visualization. Mol. Ecol. Resour. 2011, 11, 151–153. [Google Scholar] [CrossRef]
  30. Tajima, F. Statistical method for testing the neutral mutation hypothesis by DNA polymorphism. Genetics 1989, 123, 585–595. [Google Scholar] [CrossRef]
  31. Fu, Y.X. Statistical tests of neutrality of mutations against population growth, hitchhiking and background selection. Genetics 1997, 147, 915–925. [Google Scholar] [CrossRef]
  32. Rogers, A.R.; Harpending, H. Population growth makes waves in the distribution of pairwise genetic difference. Mol. Biol. Evol. 1992, 9, 552–569. [Google Scholar] [CrossRef]
  33. Bowen, B.W.; Muss, A.; Rocha, L.A.; Grant, W.S. Shallow mtDNA coalescence in Atlantic pygmy angelfishes (genus Centropyge) indicates a recent invasion from the Indian Ocean. J. Hered. 2006, 97, 1–12. [Google Scholar] [CrossRef]
  34. Xiao, Y.; Gao, T.; Zhang, Y.; Yanagimoto, T. Demographic history and population structureof Blackfin Flounder (Glyptocephalus stelleri) in Japan revealed by mitochondrial control region sequences. Biochem. Genet. 2010, 48, 402–417. [Google Scholar] [CrossRef]
  35. Sun, P.; Tang, B.J. Low mtDNA variation and shallow population structure of the Chinese pomfret Pampus chinensis along the China coast. J. Fish Biol. 2018, 92, 214–228. [Google Scholar] [CrossRef]
  36. Fujii, T.; Nishida, M. High sequence variability in the mitochondrial DNA control region of the Japanese flounder Paralichthys olivaceus. Fish. Sci. 1997, 63, 906–910. [Google Scholar] [CrossRef]
  37. Kim, S.G.; Morishima, K.; Arai, K. Genetic structure of wild brown sole inferred from mitochondrial DNA analysis. Anim. Cells Syst. 2010, 14, 197–206. [Google Scholar] [CrossRef]
  38. Grant, W.S.; Bowen, B.W. Shallow population histories in deep evolutionary lineages of marine fishes: Insights from sardines and anchovies and lessons for conservation. J. Hered. 1998, 89, 415–426. [Google Scholar] [CrossRef]
  39. Nielsen, E.E.; Hansen, J.H.; Larsen, P.F.; Bekkevold, D. Population genomics of marine fishes: Identifying adaptive variation in space and time. Mol. Ecol. 2009, 18, 3128–3150. [Google Scholar] [CrossRef]
  40. Imbrie, J.; Boyle, E.A.; Clemens, S.C.; Duvy, A.; Howard, W.R.; Kukla, G.; Kutzbach, J.; Martinson, D.G.; McIntyre, A.; Mix, A.C.; et al. On the structure and origin of major glaciation cycles, 1. Linear responses to Milankovitch forcing. Paleoceanography 1992, 7, 701–738. [Google Scholar] [CrossRef]
  41. Xu, X.; Oda, M. Surface-water evolution of the eastern East China Sea during the last 36,000 years. Mar. Geol. 1999, 156, 285–304. [Google Scholar] [CrossRef]
  42. Oba, T. Paleoenvironment of the Sea of Japan since the last glaciations. Chiku 1983, 5, 37–46. [Google Scholar]
  43. Liu, J.X.; Gao, T.X.; Zhuang, Z.M.; Jin, X.S.; Yokogawa, K.; Zhang, Y.P. Late Pleistocene divergence and subsequent population expansion of two closely related fish species, Japanese anchovy (Engraulis japonicus) and Australian anchovy (Engraulis australis). Mol. Phylogenet. Evol. 2006, 40, 712–723. [Google Scholar] [CrossRef] [PubMed]
  44. Hewitt, G.M. The genetic legacy of the Quaternary ice ages. Nature 2000, 405, 907–913. [Google Scholar] [CrossRef] [PubMed]
  45. Palumbi, S.R. Genetic divergence, Reproductive isolation, and marine speciation. Annu. Rev. Ecol. Syst. 1994, 25, 547–572. [Google Scholar] [CrossRef]
  46. Minegishi, Y.; Ikeda, M.; Kurita, Y.; Togashi, H.; Nakane, Y.; Kijima, A. Evaluation of the Tsunami impact on the genetic diversity of the marbled flounder Pseudopleuronectes yokohamae in Sendai Bay, Miyagi, Japan. Bull. Jpn. Fish. Res. Edu. Agen. 2017, 45, 69–73. [Google Scholar]
  47. Sato, M.; Kitanishia, S.; Ishiid, M.; Hamaguchia, M.; Kikuchie, K.; Hori, M. Genetic structure and demographic connectivity of marbled flounder (Pseudopleuronectes yokohamae) populations of Tokyo Bay. J. Sea Res. 2018, 142, 79–90. [Google Scholar] [CrossRef]
  48. Dou, S. Biology and ecology of flatfish in the Bohai Sea of China. Ph.D. Thesis, Chinese Academy of Sciences, Qingdao, China, 1994; pp. 1–139. [Google Scholar]
  49. Dou, S. Life history cycles of flatfish species in the bohai sea, China. Neth. J. Sea Res. 1995, 34, 195–210. [Google Scholar] [CrossRef]
  50. Dagang, C.; Changan, L.; Dou, S. The biology of flatfish (pleuronectinae) in the coastal waters of China. Neth. J. Sea Res. 1992, 29, 25–33. [Google Scholar] [CrossRef]
  51. Nakagami, M.; Takatsu, T.; Nakaya, M.; Takahashi, T. Spatial and temporal distribution of larval and juvenile marbled sole Pleuronectes yokohamae in Hakodate Bay. Bull. Jpn. Soc. Fish. Oceanogr. 2001, 65, 85–93, (In Japanese with English abstract). [Google Scholar]
  52. Lee, J.H.; Kodama, K.; Oyama, M.; Shiraishi, H.; Horiguchi, T. Effect of water temperature on survival of early-life stages of marbled flounder Pseudopleuronectes yokohamae in Tokyo Bay, Japan. Mar. Environ. Res. 2016, 128, 107–113. [Google Scholar] [CrossRef]
  53. Suda, A.; Nagata, N.; Sato, A.; Narimatsu, Y.; Nadiatul, H.H.; Kawata, M. Genetic variation and local differences in Pacific cod Gadus macrocephalus around Japan. J. Fish Biol. 2017, 90, 61–79. [Google Scholar] [CrossRef]
  54. Yun, J.Y.; Magaard, L.; Kim, K.; Shin, C.W.; Kim, C.; Byun, S.K. Spatial and temporal variability of the North Korean cold water leading to the near-bottom cold water intrusion in Korea Strait. Progr. Oceanogr. 2004, 60, 99–131. [Google Scholar] [CrossRef]
  55. Chen, C.T.A. Chemical and physical fronts in the Bohai, Yellow and East China seas. J. Mar. Syst. 2009, 78, 394–410. [Google Scholar] [CrossRef]
  56. Fang, Y.; Zhang, H.Q.; Fang, H.G. A numerical study on the path and origin of Yellow Sea warm current. Yellow Sea 1997, 3, 18–26. [Google Scholar]
  57. Kim, W.J.; Kim, K.K.; Han, H.S.; Nam, B.H.; Kim, Y.O.; Kong, H.J.; Noh, J.K.; Yoon, M. Population structure of the olive flounder (Paralichthys olivaceus) in Korea inferred from microsatellite marker analysis. J. Fish Biol. 2010, 76, 1958–1971. [Google Scholar] [CrossRef] [PubMed]
  58. Itaki, T.; Minoshima, K.; Hodaka, K. Radiolarian flux at an IMAGES site at the western margin of the subarctic Pacific and its seasonal relationship to the Oyashio Cold and Tsugaru Warm currents. Mar. Geol. 2008, 255, 131–148. [Google Scholar] [CrossRef]
  59. Verma, R.; Singh, M.; Kumar, S. Unraveling the limits of mitochondrial control region to estimate the fine scale population genetic differentiation in anadromous fish Tenualosa ilisha. Scientifica 2016, 2016, 2035240. [Google Scholar] [CrossRef]
Figure 1. Map showing sample (P. yokohamae) localities. PYB: Biungdo; PYY: Yokjido; PNH: Namhae; PYM: Mukho; PJT: Tohoku.
Jmse 12 01506 g001
Figure 2. Construction of the phylogenetic tree for haplotypes of the control region. (a) Neighbor-joining-based tree; (b) maximum likelihood-based phylogenetic tree. Bootstrap supports not less than 50% in 1000 replicates are shown. Bar represents genetic distance. The geographical distribution of each haplotype is shown by letters. PA: P. americanus and GS: Glyptocephalus stelleri outgroups of P. yokohamae.
Jmse 12 01506 g002
Figure 3. Minimum spanning tree based on mtDNA control region haplotypes of P. yokohamae. The circle size indicates the occurrence of each haplotype. One mutational step is represented by each short line and perpendicular line joining haplotypes. Circles with abbreviated symbols represent populations.
Jmse 12 01506 g003
Figure 4. Mismatch distribution for all populations. The bars show the observed distribution, whereas the solid line shows the expected distribution according to the sudden expansion model based on control region haplotypes.
Jmse 12 01506 g004
Table 1. Sampling locations for P. yokohamae mtDNA control region analysis included in this study, along with nation, sample number, and sampling date.
CountryCoastSampling Site (Abbr.)nDate of CollectionSource
KoreaWestBiungdo (PYB)32April 2016Present study
SouthYokjido (PYY)52February 2010, February 2011Lee et al. (2012) [16]
Namhae (PNH)51January 2011, February 2011, March 2011Lee et al. (2012) [16]
EastMukho (PYM)17February 2012Present study
Japan Tohoku (PJT)29February 2014Present study
Abbr: abbreviation; n: number of individuals.
Table 2. Descriptive data of genetic diversity for mtDNA control region sequences.
Locationnts + tvSNh (SD)π (SD)
PYB3220 + 525150.944 ± 0.0170.015 ± 0.008
PYY5242 + 345360.980 ± 0.0080.016 ± 0.008
PNH5135 + 338270.964 ± 0.0100.014 ± 0.007
PYM1726 + 329150.986 ± 0.0250.017 ± 0.009
PJT2934 + 337180.961 ± 0.0180.017 ± 0.009
All18160 + 1070810.983 ± 0.0030.016 ± 0.008
n: Number of individuals; ts: number of transitions; tv: number of transversions; S: number of substitutions; N: number of haplotypes; h: haplotype diversity; π: nucleotide diversity; SD: standard deviation.
Table 3. Frequency distribution of COI sequence haplotypes of P. yokohamae in the different locations examined.
LocationHaplotype
PYY01PYY02PYY48PYM17PYY05PYM16PNH52PNH43PNH35PYM13PYY12PNH19PNH29
PYB0000000000000
PYY1125112412121
PNH0001023210012
PYM0002010001000
PJT0000000000000
PYB11PNH48PYB28PYY24PNH42PYY54PYY27PYB26PYY30PYY31PYY33PYY41PYY35
PYB1040000100000
PYY1211131111121
PNH2310500000000
PYM0000000100000
PJT0000000000000
PYY37PYY38PYY39PYY43PYY44PNH53PNH51PYY47PYY51PYB20PNH01PJT12PNH08
PYB0000000003000
PYY1111111111000
PNH0000031005151
PYM0000000001000
PJT0000000001010
PNH12PNH13PYB27PYM03PNH22PYM10PNH39PNH40PNH47PYM20PYM02PYM04PYM06
PYB0000000000000
PYY0000000000000
PNH1112111121000
PYM0002010001111
PJT0000000000000
PYM08PJT29PYM22PYM29PYB05PYB10PYB30PYB18PYB19PYB21PYB32PYB24PYB31
PYB0400003321311
PYY0000000000000
PNH0000000000000
PYM1111110000000
PJT0400000000000
PJT09PJT28PJT08PJT20PJT24PJT10PJT21PJT15PJT16PJT17PJT18PJT23PJT26
PYB0000000000000
PYY0000000000000
PNH0000000000000
PYM0000000000000
PJT2322312111111
PJT27PJT31PJT32
PYB000
PYY000
PNH000
PYM000
PJT111
Table 4. Tajima’s D, Fu’s FS, and mismatch distribution statistics for each P. yokohamae population.
Population Expansion ParametersMismatch Distribution Parameters
LocationTajima’s DFu’s FSτSSDHri
PYB−0.484−2.398 *7.1930.0110.020
PYY−1.255−24.751 *6.8750.0050.016
PNH−1.256−12.561 *5.7420.0030.017
PYM−0.966−6.999 *3.9800.0470.029
PJT−0.857−4.917 *7.0150.0050.017
All−1.423 *−24.901 *6.4140.0010.410
τ: Time since expansion expressed in units of mutational time; SSD: sum of squared deviations; Hri: Harpending’s raggedness index; * indicates significant value (p < 0.05).
Table 5. Pairwise FST (below the diagonal) and corresponding p values (above the diagonal) for the examined populations of P. yokohamae.
LocationPYBPYYPNHPYMPJT
PYB 0.0060.0000.0120.002
PYY0.038 0.1020.4800.001
PNH0.0690.009 0.1130.000
PYM0.066−0.0020.018 0.093
PJT0.0750.0380.0660.024
Significance level, p < 0.05; bold indicates significant values.
Table 6. Analysis of the molecular variance (AMOVA) results from the five populations of P. yokohamae for the mtDNA control region sequence.
ComparisonsSource of VariationSum of Squares% VariationFixation Indicesp
One-group
(PYB, PYY, PNH, PYM, PJT)
Among populations28.6984.600.0490.000
Within populations521.99295.40
Total550.691100
Three-group
(PYB) (PYY, PNH, PYM) (PJT)
Among groups20.9994.710.0110.00
Among populations Within groups7.6990.770.0540.10
Within populations521.99294.520.0470.00
Disclaimer/Publisher’s Note: The statements, opinions and data contained in all publications are solely those of the individual author(s) and contributor(s) and not of MDPI and/or the editor(s). MDPI and/or the editor(s) disclaim responsibility for any injury to people or property resulting from any ideas, methods, instructions or products referred to in the content.

