Article

Arctic Wind, Sea Ice, and the Corresponding Characteristic Relationship

by
Kaishan Wang
1,2,†,
Yuchen Guo
2,3,†,
Di Wu
1,2,*,
Chongwei Zheng
1,2,4,* and
Kai Wu
1,2
1
Dalian Naval Academy, Dalian 116018, China
2
Marine Resources and Environment Research Group on the Maritime Silk Road, Dalian 116018, China
3
Qingdao Innovation and Development Center, Harbin Engineering University, Qingdao 266000, China
4
Southern Marine Science and Engineering Guangdong Laboratory (Zhuhai), Zhuhai 519000, China
*
Authors to whom correspondence should be addressed.
These authors contributed equally to this work.
J. Mar. Sci. Eng. 2024, 12(9), 1511; https://doi.org/10.3390/jmse12091511
Submission received: 30 July 2024 / Revised: 28 August 2024 / Accepted: 29 August 2024 / Published: 2 September 2024
(This article belongs to the Section Ocean and Global Climate)

Abstract

:
In efforts to fulfill the objectives of taking part in pragmatic cooperation in the Arctic, constructing the “Silk Road on Ice”, and ensuring ships’ safety and risk assessment in the Arctic, the two biggest hazards, which concern ships’ navigation in the Arctic, are wind and sea ice. Sea ice can result in a ship being besieged or crashing into an iceberg, endangering both human and property safety. Meanwhile, light winds can assist ships in breaking free of a sea-ice siege, whereas strong winds can hinder ships’ navigation. In this work, we first calculated the spatial and temporal characteristics of a number of indicators, including Arctic wind speed, sea-ice density, the frequency of different wind directions, the frequency of a sea-ice density of less than 20%, the frequency of strong winds of force six or above, etc. Using the ERA5 wind field and the SSMI/S sea-ice data, and applying statistical techniques, we then conducted a joint analysis to determine the correlation coefficients between the frequencies of various wind directions, the frequency of strong winds and its impact on the density of sea ice, the frequency of a sea-ice concentration (SIC) of less than 20%, and the correlation coefficient between winds and sea-ice density. In doing so, we determined importance of factoring the wind’s contribution into sea-ice analysis.

1. Introduction

The Arctic has gained value recently because of its abundant resources and extremely lucrative shipping lanes. In addition to potentially altering global shipping patterns, the full opening of Arctic shipping lanes could also greatly strengthen the region’s strategic position and alter the geopolitical environment. China’s Arctic policy was formalized in January 2018 with the publication of a white paper by the State Council [1]. This implies that China will prioritize the development of Arctic shipping routes going forward. Currently, countries are paying special attention to navigation in the Arctic region because of global warming; in this regard, the opening and use of Arctic shipping routes has become a focal issue that is the cause of extensive and high concern at the international level. China is a significant participant in Arctic affairs despite not being geographically a part of the Arctic nations. As such, it has developed pertinent policies, and relevant academics have undertaken research on the region.
The Arctic is one of the areas most vulnerable to climate change, with temperatures there rising twice as quickly as the global average [2]. The polar regions also serve as a “magnifying glass” for the signals of climatic anomalies [3,4,5]. Fang et al. [6] combined climate model simulations with the NOAA dataset and the Atlantic Multidecadal Oscillation (AMO) index to ascertain the effects of AMO and greenhouse gases on Arctic amplification, highlighting a notable downward trend in Arctic amplification under persistently high AMO modulation. The proposal for Large Arctic Amplification [7] is typically associated with sea-ice loss [5,8], which shows an increasing trend with a notable yearly decline in sea ice, particularly from June to November. Some researchers have theorized that rising global temperatures and stronger anticyclones in the Arctic are to blame for the melting of sea ice. Changes in ocean heat fluxes compared to the previous ones also exacerbate the accelerated melting of Arctic sea ice. Prolonged heat input due to intense Arctic insolation intensity and polar day phenomena, and global warming due to the greenhouse effect and ozone layer deterioration, have further exacerbated the rate of Arctic sea-ice melting. Zou and Yi [9] investigated the correlation between sea-surface temperatures, sea-level pressures, and decreasing sea-ice concentrations by reanalyzing data. Candlish [10] used reanalyzed datasets to investigate the sea-ice density in the Canadian Archipelago region of NW Canada, using the reanalysis dataset to analyze the correlation between the sea-ice density, sea-surface temperature, and wind field, and pointed out that thermodynamic forcing has the main influence on sea-ice melting in the NW Canadian Archipelago, while dynamic forcing due to the wind field is the second most important factor. Ohshima et al. [11] analyzed the correlation between sea-ice density, temperature, and salinity by means of the measured data from the Xue Long, and pointed out that, in the region of internal aggregation of sea ice, the sea-ice density is negatively correlated with temperature and positively correlated with salinity, while in the ice edge region, the sea-ice density is negatively correlated with temperature and positively correlated with salinity. Shen et al. [12] used in-analysis data and observation data to study the ablation factors of sea-ice density and sea-ice thickness in the Northwest Passage, and pointed out that surface thermodynamic factors have a greater influence on sea ice in summer and fall than the other seasons, and that the correlation between the sea-surface temperature and sea ice is greater than that between the surface air temperature and sea ice.
These processes of Arctic amplification bring heat and moisture into the lower troposphere, making it wetter and warmer, which in turn increases longwave radiation above the sea ice and speeds up sea-ice melting [13,14,15,16]. Strong winds disturb the sea-ice surface, increasing the sea-ice–air heat flux and hastening sea-ice melting. Winter-generated cyclones also prevent additional sea-ice production [17]. Interestingly, some researchers have suggested that polar storms and an increase in near-surface winds are caused by the melting of sea ice [18,19]. In order to minimize sea-surface roughness for their study, DuVivier et al. [20] employed the second version of the Earth model system. They noted that while the trend of the Arctic near-surface winds is influenced by the melting of sea ice, the near-surface winds themselves are not the primary cause of the Arctic sea-ice loss. Stronger storms are generated in the Arctic Ocean and lower atmospheric stability results with the melting of Arctic sea ice. Additionally, the variability of storms and sea-ice loss interact. First, as a result of climate variability, there is an increase in the formation of Arctic storms. Additionally, as a result of the melting sea ice, the near-surface friction coefficient decreases and the near-surface wind speed rises. Furthermore, the exchange of heat between the atmosphere and the ocean is intensified, and strong winds carry warm, humid air to the sea ice, pushing it from the middle of the Arctic Ocean to lower latitudes in the Beaufort Sea [13], aggravating the melting process. Storm production is aggravated and atmospheric stability is disrupted by melting sea ice. Sea-ice loss contributes to climate change in the Arctic by feeding back into the atmosphere [8]. Sea-ice loss and Arctic amplification [21] attenuate the latitudinal winds (u) at middle and high latitudes. Mid-latitudes in the Northern Hemisphere experience colder weather and more frequent cold snaps as a result of stronger meridional winds (v) caused by weakened latitudinal winds (u) [22,23,24]. The Intergovernmental Panel on Climate Change (IPCC) of the United Nations has projected that by the middle of the twenty-first century, sea ice in Arctic waters will completely vanish in the summer, making it feasible to navigate the region all year round. Although the development of Arctic shipping channels and natural resources benefits from the melting of Arctic sea ice, it irreversibly harms Arctic ecology, global ocean and atmospheric circulation, weather patterns, and climate variability [25,26,27,28,29]. It also has certain effects on China as a nation and the coasts of its neighbors [30,31,32].
Based on ERA5 data, this study proposes indicators such as the frequencies of different wind directions, the frequency of strong winds of force six or higher, and the frequency of a sea-ice concentration less than 20% in order to study the corresponding characteristic relationship that exists between Arctic sea ice and wind. Pearson’s correlation coefficient and the contribution-degree calculation method were used to study this relationship between Arctic sea ice and wind.

2. Data and Methods

2.1. Data

The u and v components, which were derived from the ERA5 data from ECMWF, make up the wind speed data at a 10 m height. Whereas positive values of the v component indicate southerly winds and negative values indicate northerly winds, positive values of the u component indicate westerly winds (coming from the west) and negative values indicate easterlies. Because wind observations vary on smaller spatial and temporal scales and are influenced by local topography, vegetation, and buildings—all of which are only averaged and represented in the ECMWF Integrated Forecasting System (IFS)—care should be used when comparing this parameter with observations [33]. Hourly 10 m wind field data from 1940 to the present, with a spatial resolution of 0.25° × 0.25°, are provided by the ERA5 reanalysis data. In accordance with the internationally recommended norms for meteorological observations, six-hourly wind field data were chosen for 81 years, from 1940 to 2020, in this study. These data essentially depict the variation in wind speeds within a day.
The sea-ice data came from the ERA5 sea-ice data from ECMWF. The measure is also known as sea-ice concentration, sea-ice (area) fraction, and, in a broader sense, sea-ice cover. These data came from three sources: the HadISST2 dataset was used before 1979, the OSI SAF (409a) dataset was used from 1979 to August 2007, and the OSI SAF oper dataset has been used since September 2007 [33]. In this dataset, sea ice is defined as frozen seawater floating on the ocean’s surface; it does not include ice that has formed on land, such as ice shelves that are anchored on land and protrude from the ocean’s surface, nor does it include glaciers, icebergs, and ice caps. The sea-ice data have a spatial resolution of 0.25° × 0.25° and cover the period from 1940 to the present. The sea-ice data used in this study were six-hourly data collected every six hours for 81 years, from 1940 to 2020. This corresponds to the period of time in which the wind speeds at the 10 m altitude have been recorded. Our results accurately depict the changes in Arctic sea ice at this resolution because sea ice is heavily influenced by the seasons and does not change significantly in a single day.
Academics from around the world are favoring ERA5 more and more for analysis and simulation because it is the most accurate reanalysis product currently on the market and best replicates real observations in a variety of fields [33,34,35,36,37,38,39,40]. Even though ERA5 data underestimate extreme wind speeds and are imprecise in areas with significant elevation change, they are still the recommended option.

2.2. Methods

The distributions of Arctic wind fields and SIC for were determined statistically using 81 years of wind field and SIC data, as both multi-year and seasonal averages. According to this study, areas with SIC below 20% are more vulnerable to wind field ablation. This paper proposes using indicators such as the frequencies of different wind directions, the frequency of SIC less than 20%, and the frequency of strong winds in order to further analyze the correlation between the Arctic wind field and SIC. These indicators further reveal the influence of the Arctic wind field on the SIC from the perspectives of different wind directions and the frequency of strong winds of force six or above. The following is the calculation formula:
W D O w e s t = t w e s t T u × 100 %
W D O e a s t = t e a s t T u × 100 %
W D O s o u t h = t s o u t h T v × 100 %
W D O n o r t h = t n o r t h T v × 100 %
Equations (1)–(4) are the calculation methods for the frequencies of different wind directions, in which W D O w e s t , W D O e a s t , W D O s o u t h , and W D O n o r t h are the frequencies of westerly, easterly, southerly, and northerly winds, respectively. t w e s t , t e a s t , t s o u t h , and t n o r t h are the frequencies of occurrence of westerly, easterly, southerly and northerly winds, respectively, where westerly winds were measured by the frequency of occurrence of positive values in the u-component, easterly winds by the frequency of occurrence of negative values in the u-component, southerly winds by the frequency of occurrence of positive values in the v-component, and northerly winds by the frequency of occurrence of negative values in the v-component. T u represents all the times when the u-component is positive, and southerly winds are indicated by all the times when the v-component is negative.
The number of hours with wind speeds of 10.8 m/s or higher divided by the total number of hours yields the frequency of high winds of force 6 or higher. This calculation is similar to that used to determine the frequencies of occurrence of wind directions. A similar formula is used to determine the frequency of Arctic SIC less than 20%: divide the total number of hours to be obtained by the number of hours with SIC less than 20%. The following is the formula:
W O 10.8 = t 10.8 T × 100 %
S I C 20 = t 20 T × 100 %
In Equation (5), W O 10.8 refers to the frequency of gale force 6 or above, S I C 20 refers to the frequency of SIC less than 20%, t 10.8 refers to the number of occurrences exceeding 10.8 m/s (Beaufort force 6), t 20 refers to the number of occurrences with SIC less than 20%, and the total number of occurrences is T .
The distribution of SIC at different wind times was screened against the distribution of sea ice under different wind directions, and the correlation coefficients between the frequencies of different wind directions and SIC were calculated using the Pearson correlation coefficient.
The contribution of the seasons was calculated by adopting the calculation method proposed by Reguero et al. [41], which distinguishes between different seasons for data such as the frequencies of different wind directions, frequency of strong winds, and frequency of SIC less than 20%.
S I C 20 ( t ) μ S I C 20 σ S I C 20 = β W D O W D O ( t ) μ W D O σ W D O
S I C 20 ( t ) μ S I C 20 σ S I C 20 = β W O 10.8 W O 10.8 ( t ) μ W O 10.8 σ W O 10.8
where S I C 20 ( t ) is the monthly average time series of SIC less than 20%, and W D O ( t ) is the monthly average time series of the frequencies of different wind directions, divided into four directions: east, south, north, and west. W O 10.8 ( t ) is the monthly average time series of the frequency of winds with speeds of force 6 or above. μ and σ are the expectation and standard deviation of the time series, and β W D O and β W O 10.8 are the coefficients of two linear regressions. The contribution of different wind directions can be expressed as β W D O σ W D O , and the contribution of winds of force 6 or higher to an Arctic SIC of less than 20% can be expressed as β W O 10.8 σ W O 10.8 .

3. Frequency Distribution of SIC and Strong Winds above Force Six

To determine the distribution of wind speed, frequency of wind of force six or higher, frequency of wind of force eight or higher, and SIC, the wind speed data in the Arctic region were regionally averaged. Figure 1 illustrates how wind speed varies in the Arctic. According to Figure 1, there is a noticeable upward trend in wind speed in the Arctic region, with a rate of increase of 0.005 m/s·yr−1. The wind speed distribution is as follows: between 1950 and 1978, it ranges from 6.2 to 6.5 m/s; after 1979, it increases significantly, peaking at 6.58 m/s in 1982 and 6.63 m/s in 1992. Additionally, there has been a noticeable increase in the frequency of strong winds; in the Arctic region, strong winds with a force of six or higher occur frequently, demonstrating a rise of roughly 0.03%·yr−1, fluctuating between 9% and 11% prior to 1980, and with a notable uptick following 1981, when the total level attained 11% to 14%. Wind speeds in the Arctic region show an increasing trend from year to year, but at a slower rate of growth. In contrast, the frequency of wind gusts of force eight or higher has a slower trend and essentially stays static.
More noteworthy is the shift in Arctic SIC, which fell by −0.17%·yr−1 from 64~68% in 1950 to 54% after 2010. There are several causes for the significant decrease in Arctic sea-ice concentration (SIC), including the primary effect of global warming on the melting of Arctic sea ice and a possible relationship between changes in SIC and increases in Arctic wind speed.
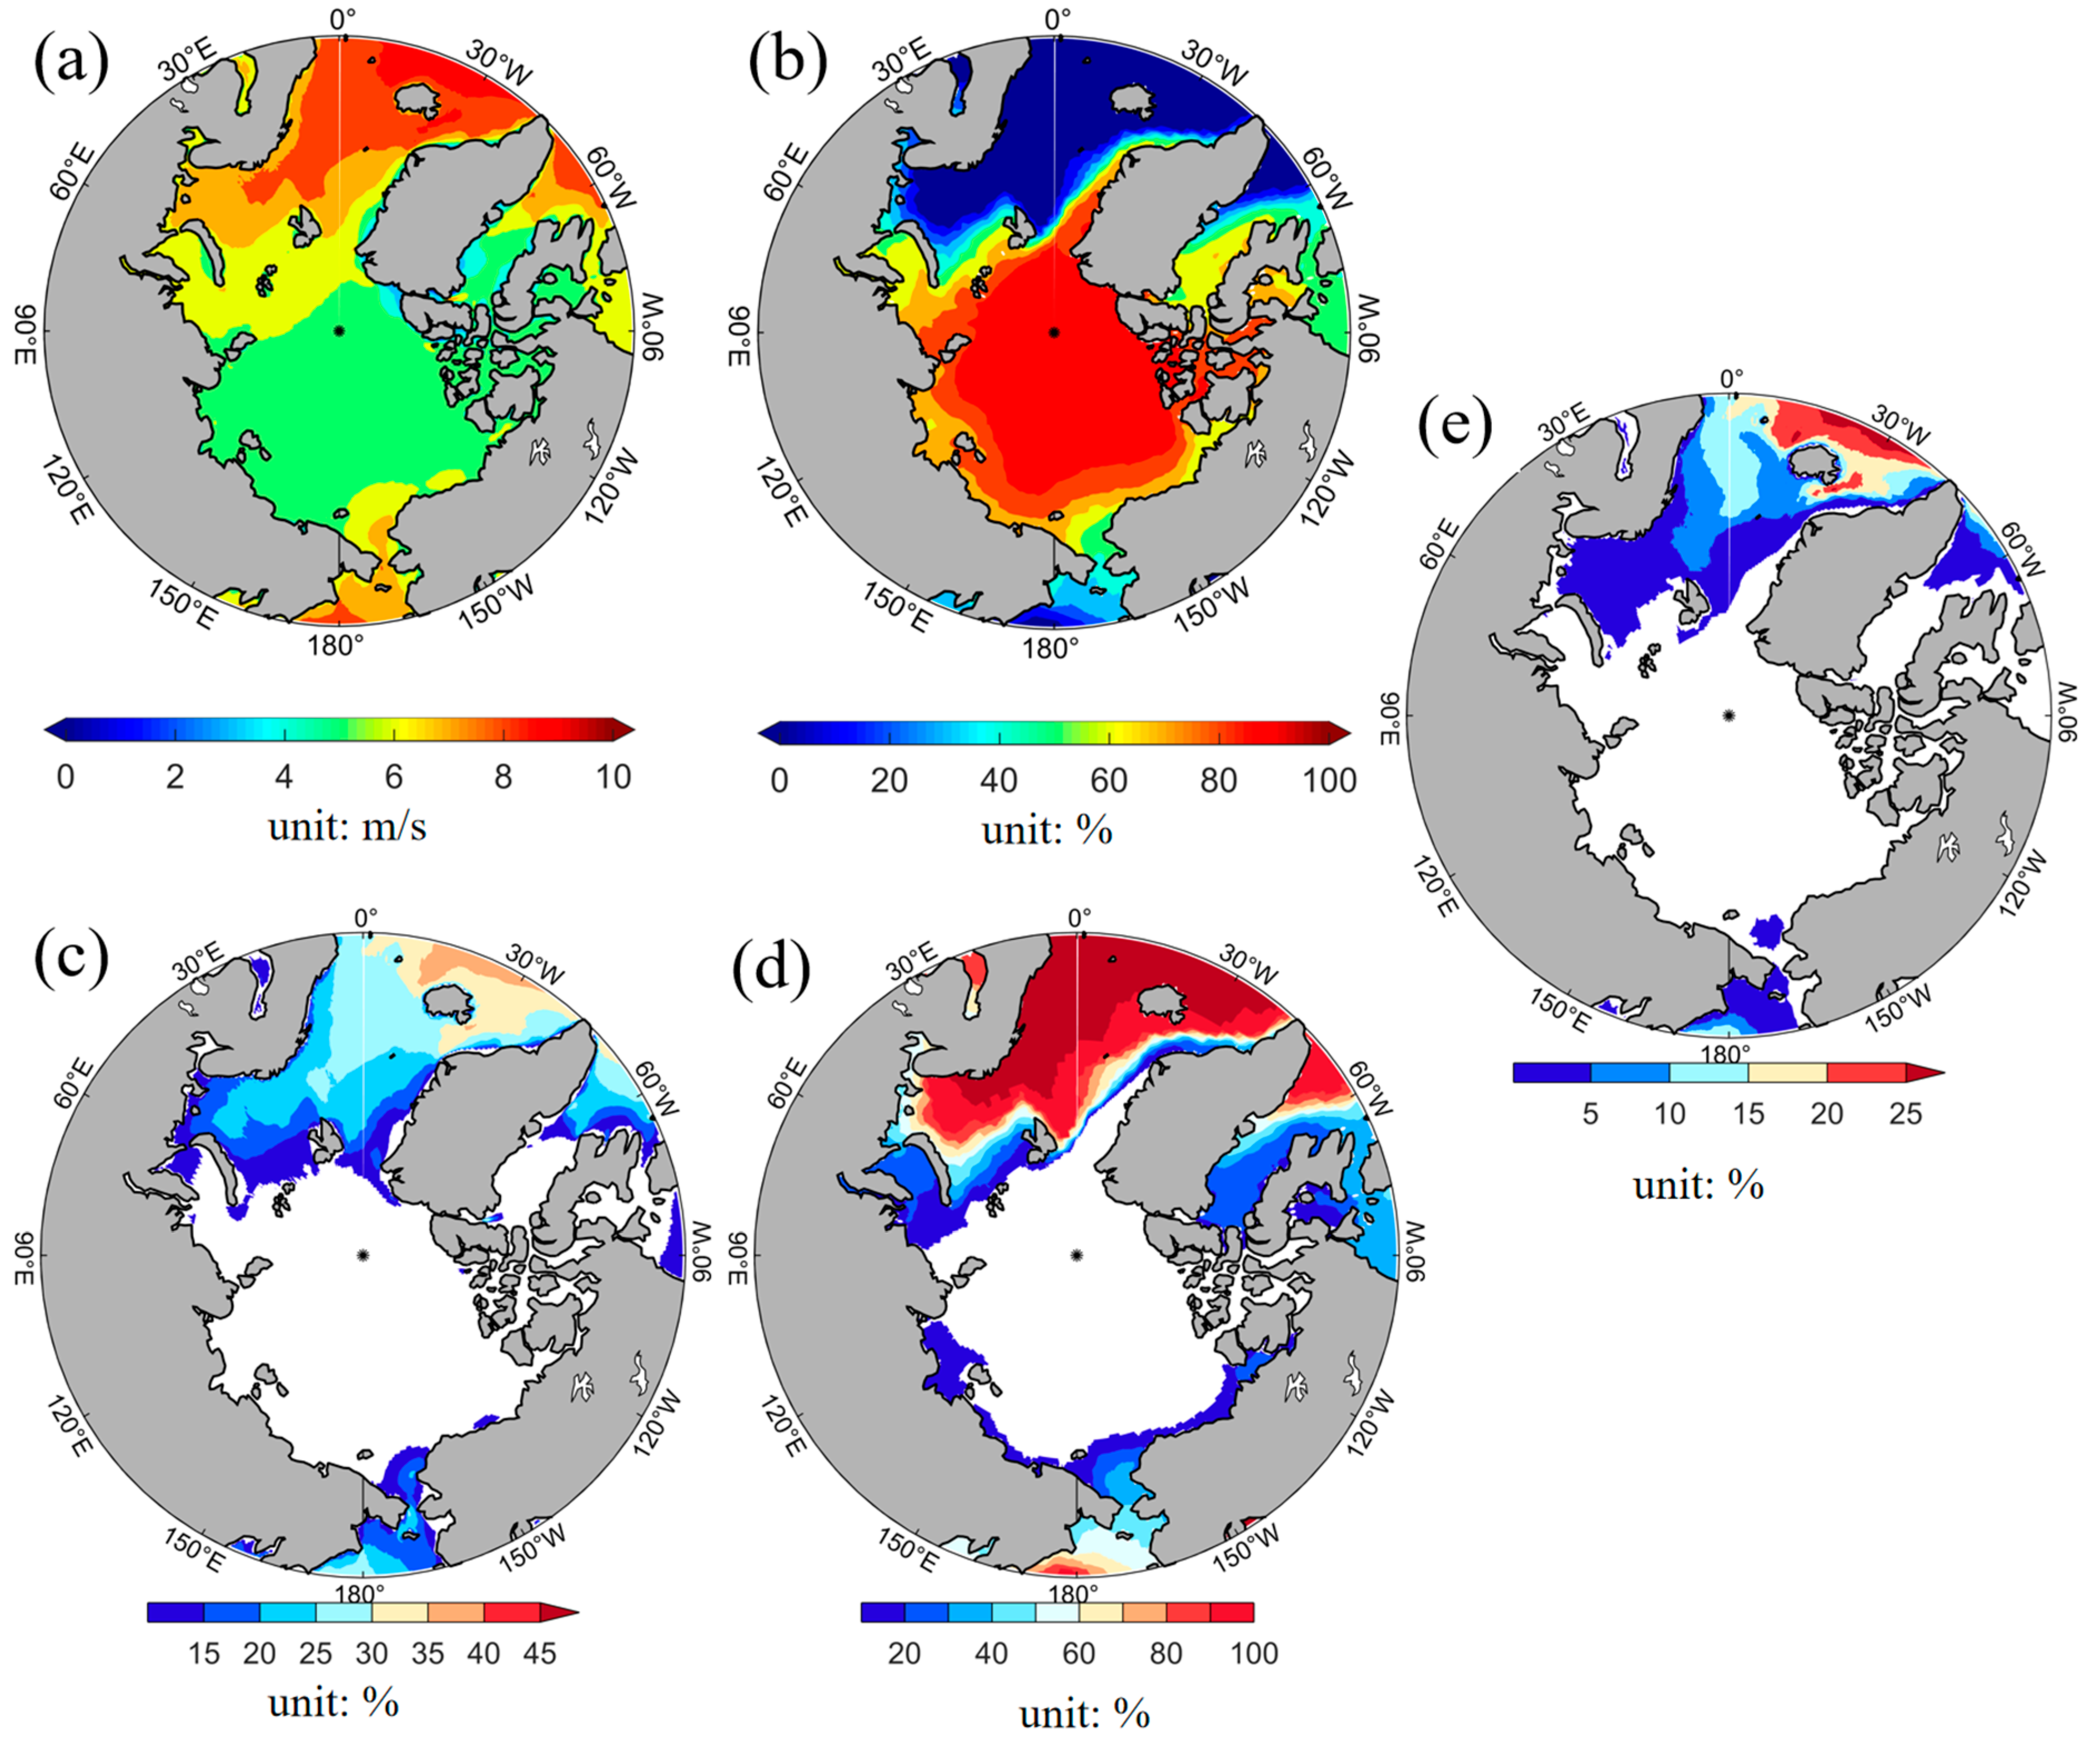
In regions with SIC less than 20%, strong winds play a more significant role in promoting ablation. This study examined the frequency distribution of strong winds of force six or higher and Arctic SIC less than 20% (see Figure 2). We found that strong winds significantly enhance the melting of Arctic sea ice. The distribution of the multi-year mean wind speeds in the Arctic is depicted in Figure 2a. The distribution of the SIC over a long time span in the Arctic is depicted in Figure 2b. The distribution frequency of strong winds in the Arctic with force six or higher is depicted in Figure 2c. The area of SIC in the Arctic that is less than 20% is shown in Figure 2d, and Figure 2e gives the frequency of distribution of winds of force six or more and SIC less than 20% (satisfied at the same time). From Figure 2a, it can be inferred that the average wind speed in the Arctic Sea is approximately 5 m/s. The North Atlantic Ocean, south of Iceland, the Norwegian Sea (7~8 m/s), the vicinity of Novaya Zemlya (6~7 m/s), the Chukchi Sea (6~7 m/s), and the Bering Sea (8 m/s) are the areas with strong winds. The distribution of SIC under multi-year averaging is shown in Figure 2b. The SIC is essentially more than 80% for the entire Arctic sea ice to the Bering Strait side of the accumulation of serious mass, in the Novaya Zemlya–Greenland Island line to the side of the Bering Strait, including the East Siberian Sea (60~80%), the Laptev Sea (70%), the Kara Sea (60%), the Greenland Sea (70~80%), Baffin Bay (60%), the Beaufort Sea (70~80%), and the Northern Canadian Archipelago (80%), where the SIC is above 60%. The North Atlantic, Norwegian Sea, Barents Sea, and Bering Sea regions generally have less sea ice than other regions, and these regions also have relatively strong winds. This suggests that surface winds accelerate sea-ice melting, and that sea-ice melting contributes to surface winds.
With a perennial SIC of less than 20%, the sea ice in the North Atlantic between New Zealand and Greenland, the Norwegian Sea, the Barents Sea, and the Greenland Sea is less affected by the seasons and more significantly impacted by winds. The vicinities of the Chukchi Sea (50%) and the Bering Sea (0~30%) are also home to areas with a smaller distribution of SIC under the multi-year average.
It can be inferred that the North Atlantic Ocean south of Iceland experiences the highest frequency of winds of force six or above (Figure 2c), accounting for over 30% of all winds in the region, and that strong winds can occur more frequently than 25% of the time in the Norwegian Sea. It is important to note that the sea area between the Greenland and New Land line and the Bering Strait, which includes the northern Canadian Archipelago, the Kara and Laptev seas, the East Siberian Sea, the Chukchi and Beaufort seas, Baffin Bay, and the East Siberian Sea, has comparatively low frequencies of strong winds, less than 10%.
The frequency of Arctic SIC less than 20% is distributed as shown in Figure 2d. There are areas between 20% and 40% near Novaya Zemlya, the Laptev Sea, the Chukchi Sea, the Bering Sea, and Baffin Bay, where the SIC is primarily affected by the seasons. The Arctic SIC less than 20% is primarily distributed in the North Atlantic Ocean, the Norwegian Sea, and the Barents Sea. The probability of SIC less than 20% can reach more than 90%, indicating that the perennial SIC is often low.
By contrasting the frequency of Arctic SIC less than 20% with the frequency of strong Arctic winds, as shown in Figure 2a,b, it was possible to determine that the SIC is below 20% and the winds are relatively strong in the North Atlantic, Norwegian Sea, Barents Sea, and Bering Sea.
Currently, there is a positive correlation between strong wind and the rate at which sea ice melts in the above-sea area, as the melting of sea ice increases wind strength in the same area. Strong wind-prone regions highly overlap with regions of Arctic sea-ice densities less than 20%, suggesting a strong positive correlation between the frequency of strong Arctic winds and Arctic sea-ice densities less than 20%, exacerbating Arctic sea-ice melting or blowing larger areas of sea ice apart. The ablation rate of sea ice less than 20% exceeds that of other sea-ice densities, and it is hypothesized that strong Arctic winds have a certain ablation effect on sea ice. Bhargava and Echenique [42] pointed out that there is a significant negative correlation between sea-ice concentration and sea-surface temperature (SST), and Dyck et al. [43] pointed out that SST is the main driver of sea-ice thickness variations in East Siberian waters, and that winds and sea-surface temperature are the main factors for sea-ice density anomalies, while in the Barents Sea, sea-ice anomalies are influenced by air and sea-surface temperature as well as ocean currents.
The best location for the wind speed and SIC to produce optimal ablation conditions is close to Iceland, where ablation can reach 15–25%. Meanwhile, there are areas with frequency distributions of 10–15% in the Norwegian Sea, southern Bering Sea, and southern part of the Gulf of Baffin, and an area of 5% in the Barents Sea, southern Bering Sea, and southern Greenland Sea.

4. Sea Ice and Wind Field Correlation Analysis

4.1. Correlation between Sea Ice and Different Incoming Winds

4.1.1. SIC Distribution under Different Incoming Winds

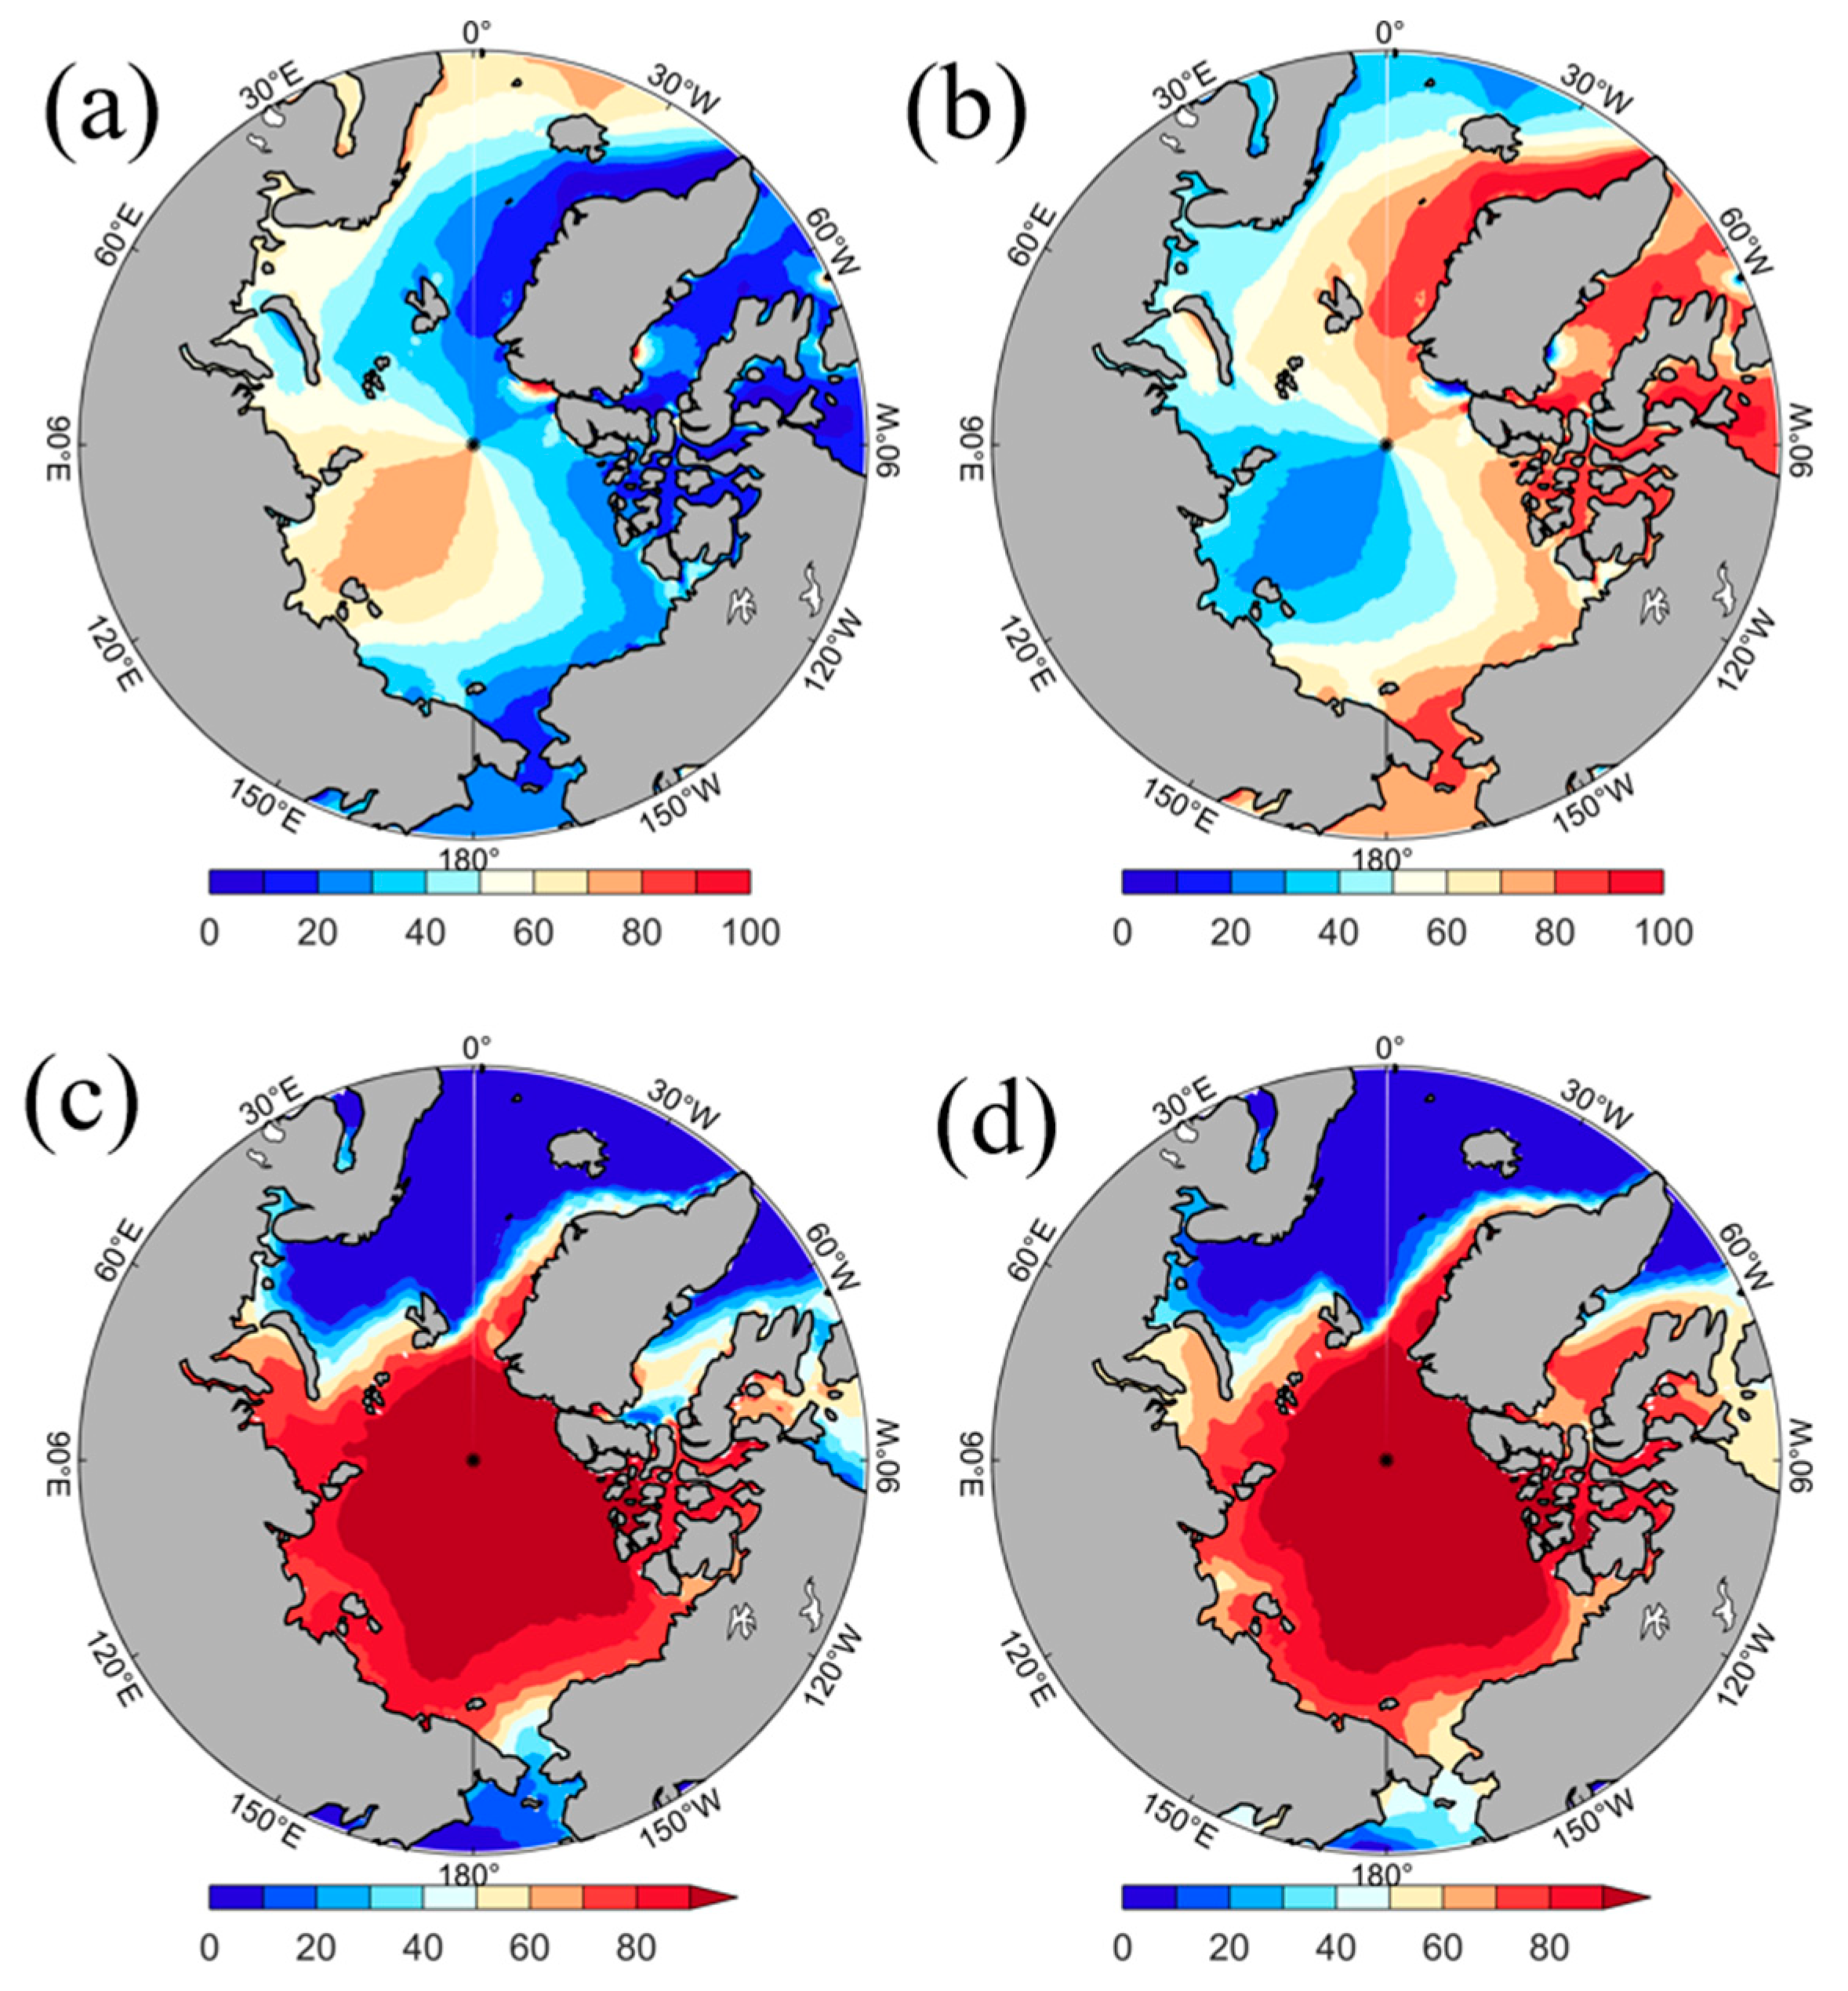
The frequencies of different wind directions in the Arctic were counted according to the four directions of east–west and south–north, and the temporal layers of SIC were also counted and averaged to obtain the average distribution of SIC under different wind directions. This was carried out in order to investigate the correlation between different wind directions in the Arctic and the Arctic sea ice. The frequencies of various wind directions in the Arctic and the associated SIC distribution are depicted in Figure 3 and Figure 4, respectively. Figure 3a,c show the frequency of westerly winds and the SIC distribution when westerly winds occur. It can be seen that the most frequently occurring westerly winds in the Arctic are distributed in the northern archipelago of Canada (70~80%), the Greenland Sea near the island side (80~100%), Baffin Island and the surrounding area (70~90%), the sea area from the North Pole to the northern archipelago of Canada (60~80%), and the Norwegian Sea (60~80%).
The corresponding SIC distribution is basically the same as that under the multi-year average, and the areas with significant differences are mainly the SIC enhancement along the East Siberian Sea coast, the reduction at Cape Hope, and the enhancement in Baffin Bay. The SIC under the multi-year average is 70% along the East Siberian Sea coast, while the SIC enhancement under westerly conditions is about 80%. Cape Hope has an SIC of 50–60% under multi-year averages, whereas under westerly conditions, the SIC is 30–40%, suggesting that there is less sea-ice distribution there when westerly winds are prevalent. In Baffin Bay, the SIC is about 60% under the multi-year average, while under westerly conditions, it becomes more than 70%, and the frequency of westerly winds is related to the season, which in turn determines the distribution of SIC.
Figure 3b,d show the frequency of easterly winds in the Arctic and the distribution of SIC when easterly winds occur. The regions where easterly winds prevail throughout the year are distributed in the Denmark Strait (80–100%), Svalbard (70–90%), the northern part of the island of Novaya Zemlya (60–80%), the Chukchi Sea (70–90%), the East Siberian Sea (60–80%), the Beaufort Sea (70–90%), the Bering Sea (70–90%), and the Strait between Greenland and the Northern Canadian Archipelago (70–80%). Statistical SIC during the occurrence of easterly winds (Figure 3d), the areas with differences from the SIC during prevailing westerly winds are mainly located in Cape Hope, the Bering Strait, and Baffin Bay in Alaska. The SIC at Point Hope ranges from 20 to 50% during prevailing westerly winds, whereas during prevailing easterly winds, the SIC here becomes 50 to 60%. The SIC in the Bering Strait is less than 20% in prevailing westerly winds and becomes about 40 to 50% in prevailing easterly winds; sea ice increases. The SIC in Baffin Bay is over 70% during westerly winds; meanwhile, it is 40–60% during easterly winds, and sea ice dissipates.
Figure 4 shows the distribution of Arctic SIC during prevailing southerly and northerly winds. Figure 4a,c show the frequency of prevailing southerly winds and their corresponding SIC distributions, and it can be concluded that the areas of prevailing southerly winds in the Arctic are mainly distributed in the eastern hemisphere, specifically in the sea area south of Iceland (70~80%), the coast of the Norwegian Sea (60~70%), the coast of the Barents Sea (50~60%), the sea area between the Laptev Sea and the Arctic (60~80%), and the sea area north and west of Greenland (80%). The SIC under prevailing southerly winds is basically the same as the year-round SIC distribution, and the areas with significant differences are distributed on the eastern coast of Greenland, Baffin Bay, and the area around Baffin Island, where the SIC around Greenland has changed from about 80% of the multi-year average to 60% to 80%, the sea ice in Baffin Bay has changed from about 60% of the multi-year average to 20% to 60%, the sea ice around Baffin Island has changed from 50% of the multi-year average to 20% to 50%, and the sea ice around Baffin Island has changed from the multi-year average of 50% to 20% to 50%, due to prevailing southerly winds bringing in humid air, leading to accelerated melting of Arctic sea ice. Weak sea-ice areas are mainly distributed in the North Atlantic Ocean, the Norwegian Sea, the Barents Sea, the Bering Sea, the Chukchi Sea, Baffin Bay, and other places. Figure 4b,d show the distribution of SIC during prevailing northerly winds, and the regions of prevailing northerly winds are mainly distributed in the western hemisphere, specifically in the sea around Greenland (80–100%), Baffin Bay (80%), the Northern Canadian Archipelago (80%), the Beaufort Sea (60–70%), the Bering Strait (70–90%), and the Kara Sea (60–80%). The areas with significant changes in sea ice between prevailing northerly and southerly winds are located in the Bering Strait, Baffin Bay, Hudson Bay, Kara Sea, and Laptev Sea, where the 50% SIC contour in the Bering Strait shrinks from the original area to the south from 30–40% to 50–60% during prevailing southerly winds, with an increase in sea ice. Sea ice increases significantly in Baffin Bay, changing from 40–60% during prevailing southerly winds to 60–80%. Sea ice increases in the southern 70 to 80% of Baffin Island, and the Hudson Bay SIC changes from 20–40% to 50–60% during prevailing southerly winds. Under the influence of prevailing northerly winds, sea ice in the Kara and Laptev Seas shows a decreasing trend from 60–80% to 50–70% during southerly winds, and from 80% to 50–60% in the Laptev Sea alone.

4.1.2. Correlation under Different Incoming Winds and SIC

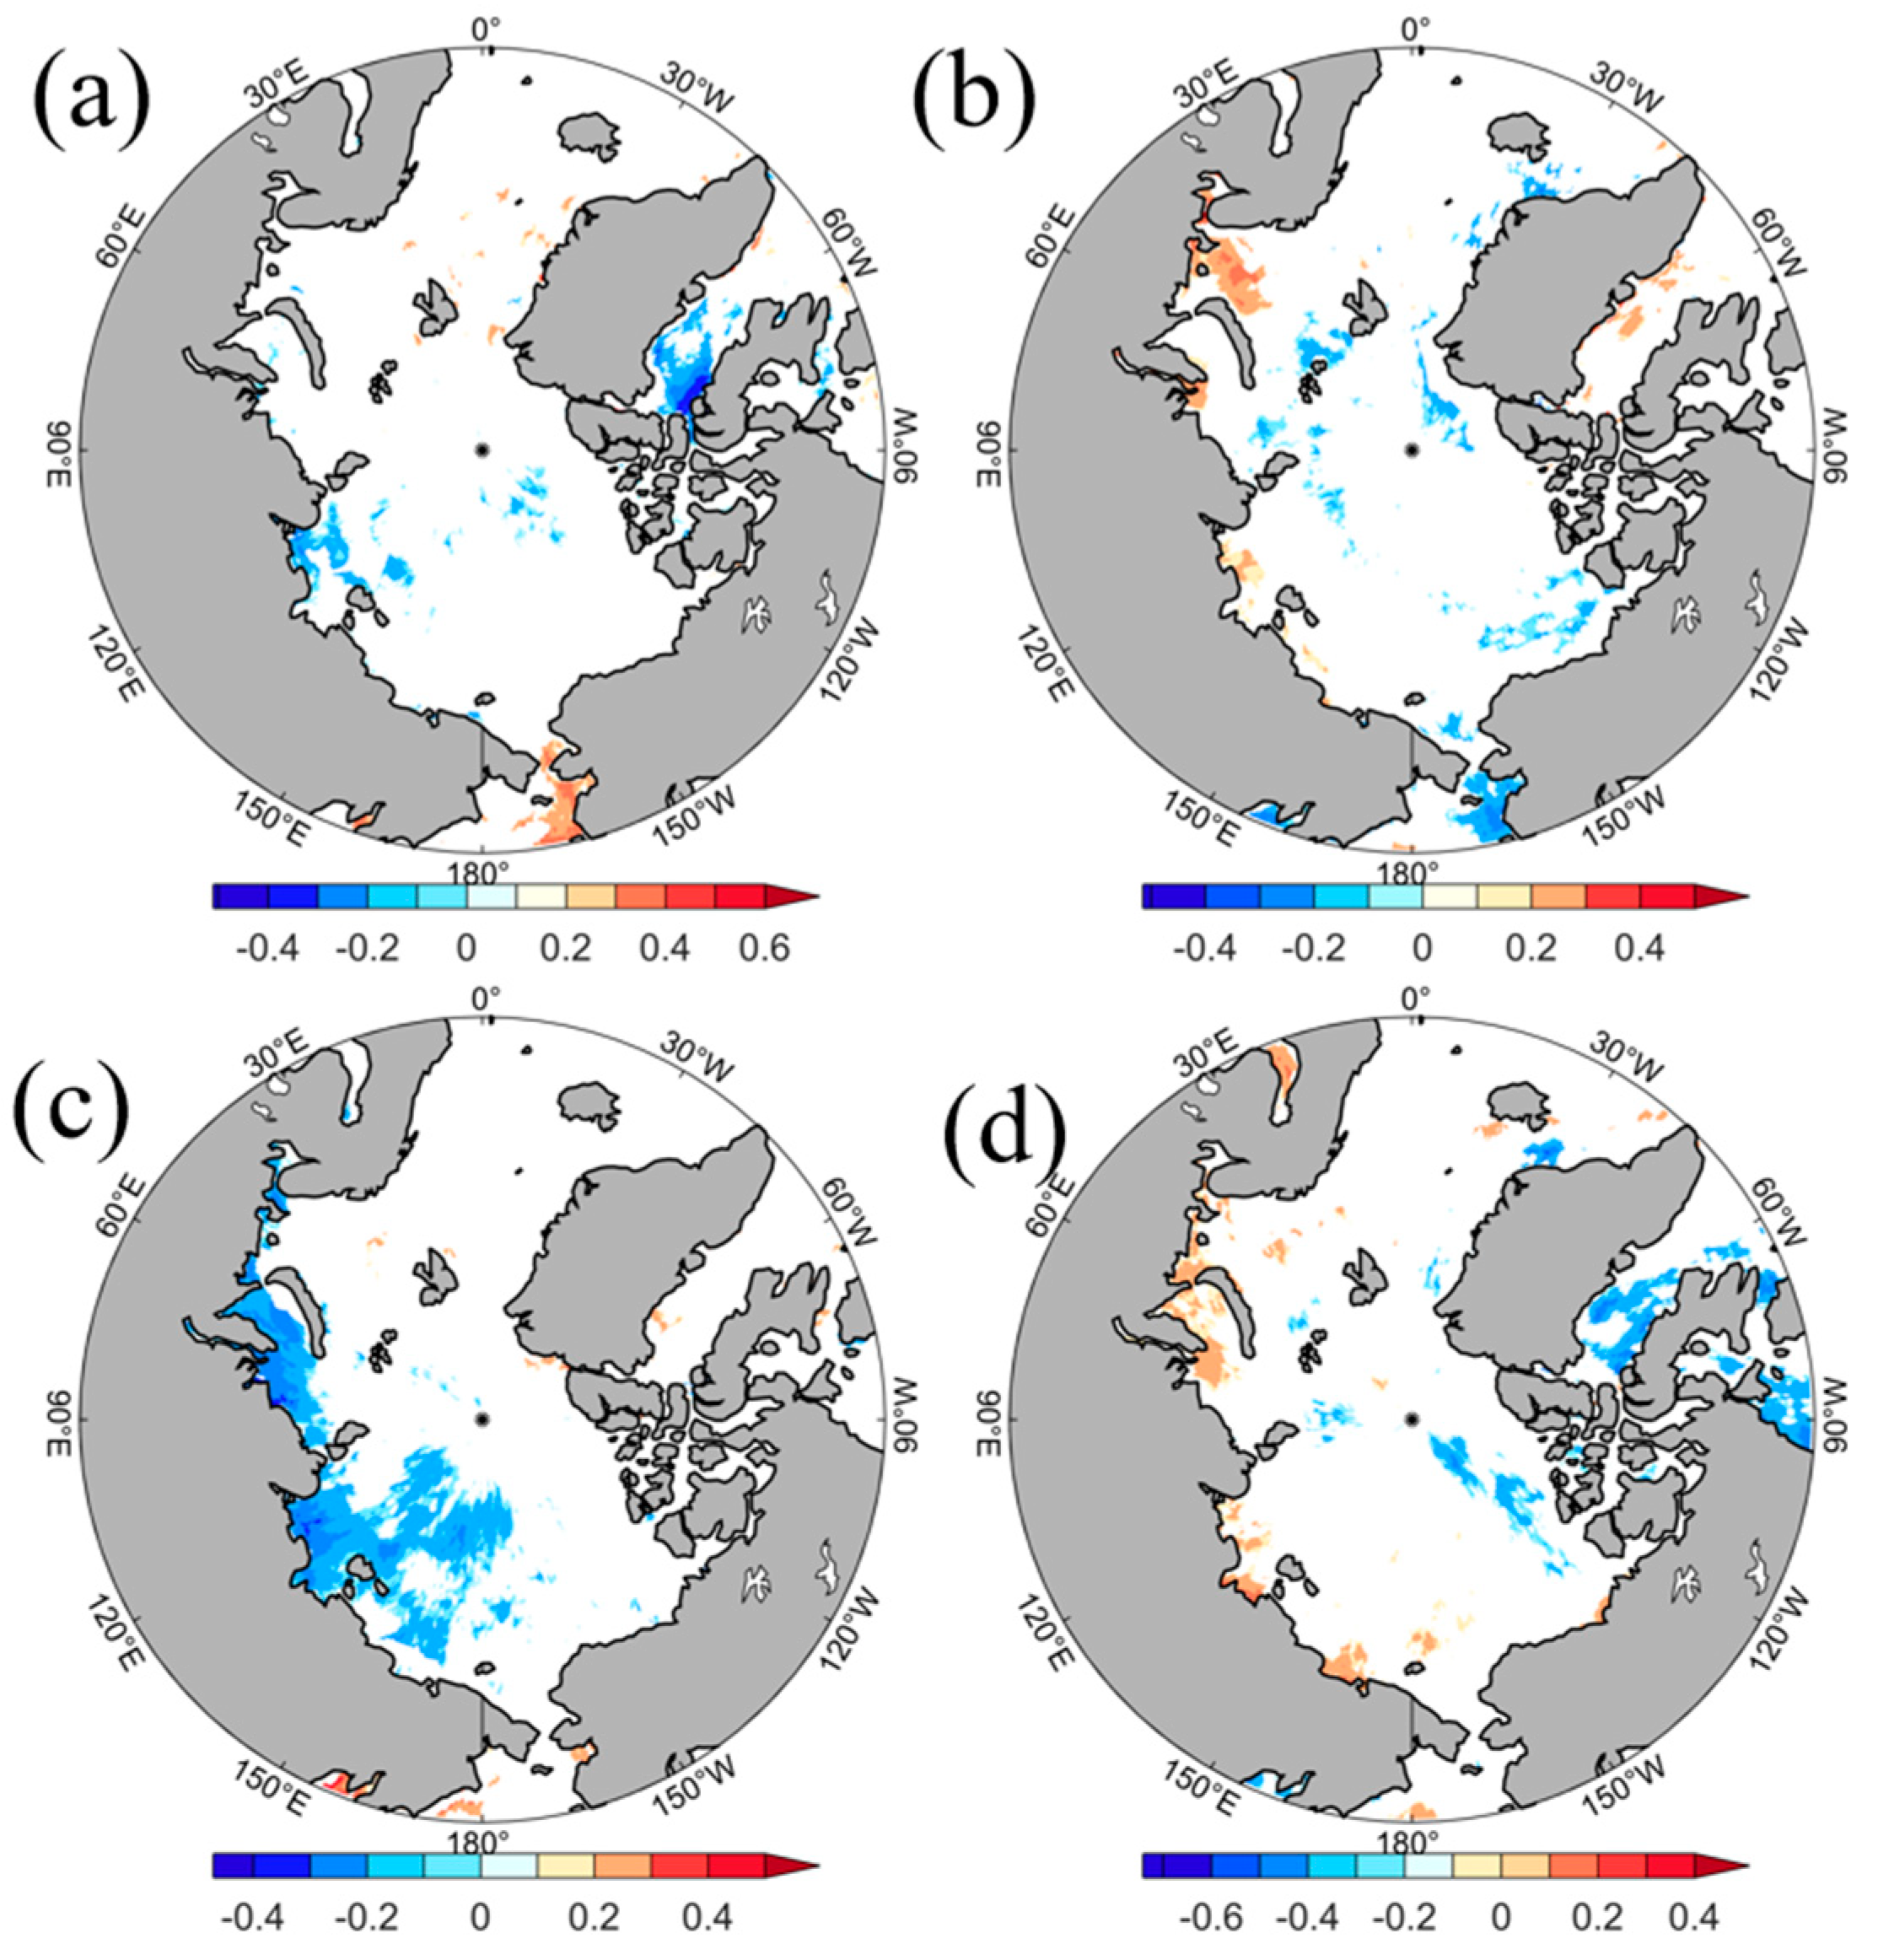
Based on the correspondence between different wind frequencies and sea ice, the correlation coefficients between different wind frequencies and their corresponding SIC were calculated using Pearson’s correlation coefficient to analyze the correlations between different wind frequencies and SIC. The correlation coefficients between the frequency of prevailing westerly winds and the SIC (Figure 5a) showed that significant regions are mainly distributed in Baffin Bay, the Bering Strait, and the Laptev Sea. The SIC in Baffin Bay and the Laptev Sea shows a significant negative correlation between prevailing westerly winds and the SIC (in Baffin Bay, reaching −0.4, and in the Laptev Sea, reaching −0.2), indicating that prevailing westerly winds have a significant ablation effect on the SIC, and that the humid air currents carried by westerly winds contribute to ablation of the sea ice in Baffin Bay and the Laptev Sea. In the Bering Strait, the frequency of prevailing westerly winds shows a positive correlation with SIC, and the westerly winds promote the generation of sea ice. The correlation between the frequency of prevailing easterly winds (Figure 5b) and SIC in the Arctic is negative (−0.2~−0.4) in the Bering Sea, the Beaufort Sea, the Svalbard Islands, and the vicinity of Greenland, and positive (0.2~0.3) in the Barents Sea, the Gulf of Ob, the Laptev Sea, and Baffin Bay, where cold air currents brought by easterly winds contribute to sea-ice generation. The frequency of prevailing southerly winds (Figure 5c) shows a significant negative correlation with the Arctic eastern hemisphere sea, which can reach about −0.2~−0.4, and is mainly distributed in the Kara Sea, the Laptev Sea, and the East Siberian Sea. The frequency of prevailing northerly winds (Figure 5d) is positively correlated with the Arctic SIC in the eastern hemisphere and negatively correlated in the western hemisphere. The positive correlation is found in the Barents, Kara, Laptev, and East Siberian seas, with a correlation coefficient of 0.2, while the negative correlation is found in Baffin Bay and Hudson Bay, with a correlation coefficient of −0.4.

4.2. Contribution of Different Incoming Winds and Strong Winds to Sea Ice

4.2.1. Seasonal Contribution of Different Wind Frequencies to Frequencies of SIC Less Than 20%

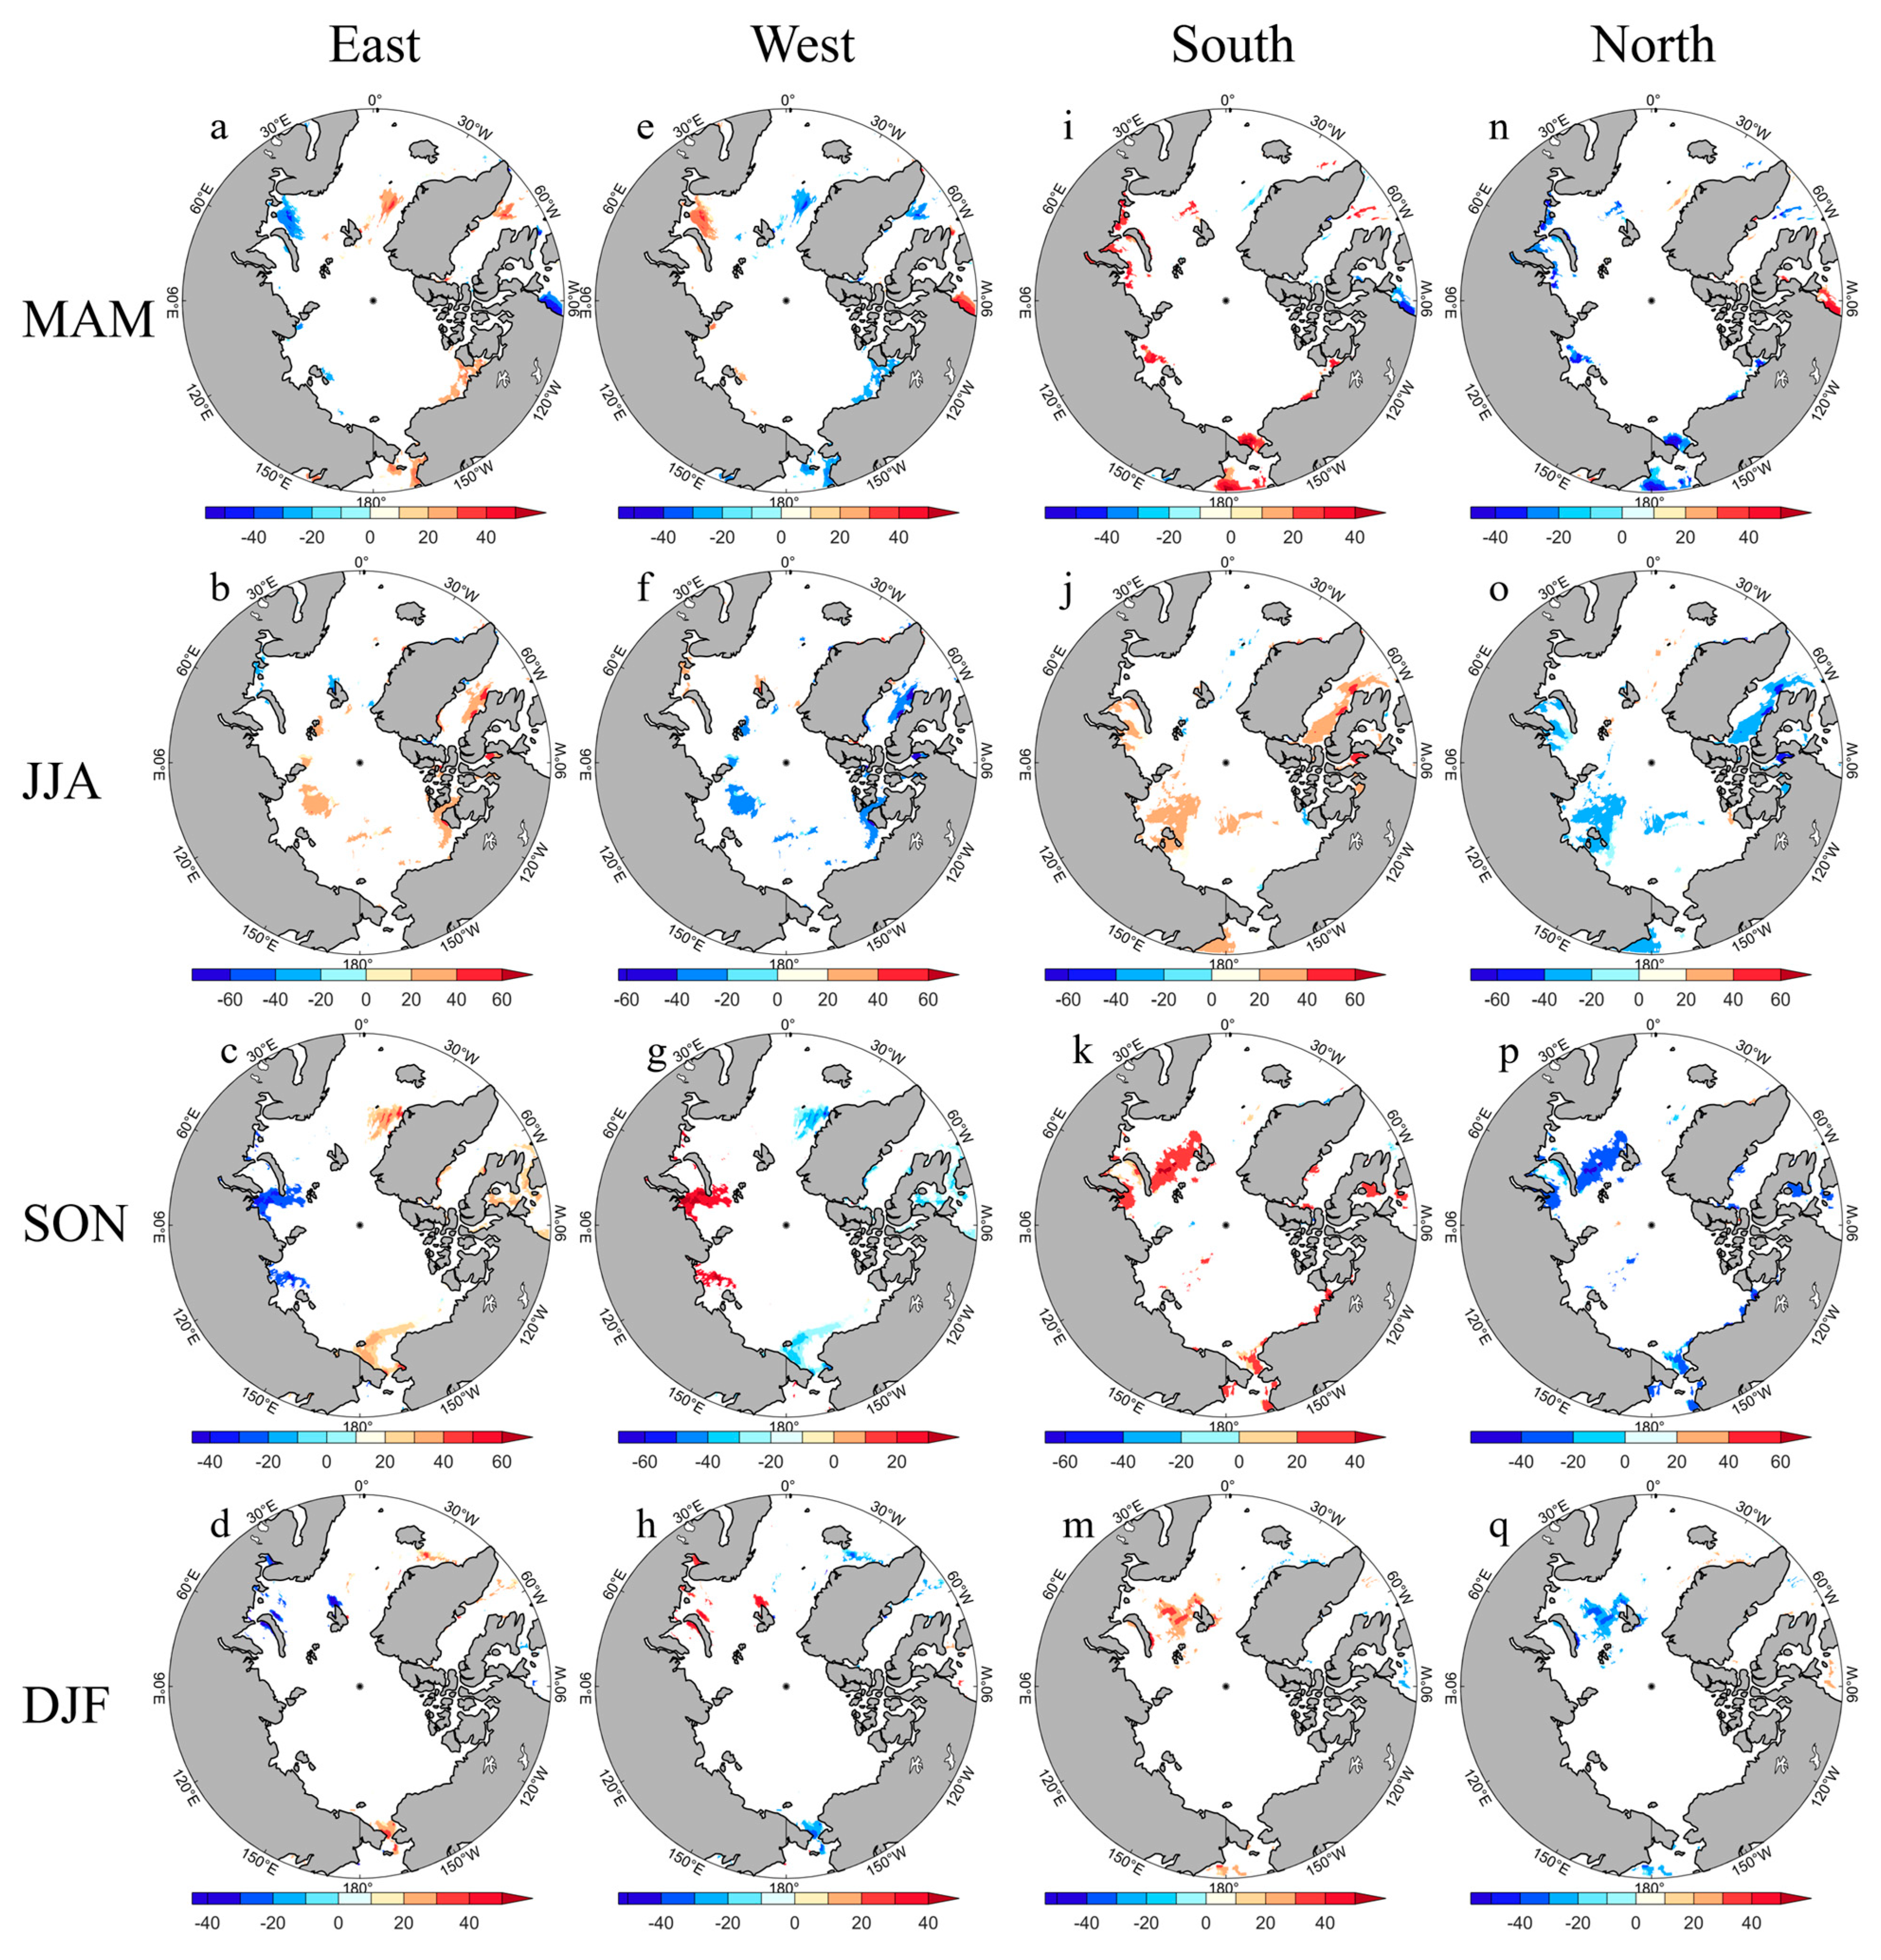
Seasonal differences in Arctic sea-ice variability are more significant, and further analysis was carried out of the effects of different wind directions on Arctic SIC. In this study, the frequency of occurrence of SIC less than 20% was selected as the main index to evaluate the risk of Arctic sea-ice navigation. When the SIC is less than 20%, there is essentially no risk to navigation, but at the same time, strong winds have a stronger ablation effect on sea ice with a SIC less than 20%. In order to further analyze the effects of different wind directions on the Arctic SIC, this study analyzed the statistical frequencies of occurrence of different wind directions with the frequency of Arctic SIC less than 20%, and it determined the contribution of the frequencies of occurrence of different wind directions to the frequency of Arctic SIC less than 20% in different seasons (as shown in Figure 6).
Easterly winds contribute to the frequency of Arctic SIC less than 20% as a whole, and in the MAM months, easterly winds contribute in the Bering Sea (20~30%), the Beaufort Sea (20~30%), and Greenland (20~40%), and inhibit in the Barents Sea (−20~−40%) and Hudson Bay (−30~−40%), which is detrimental to the Arctic sea ice. During the months of JJA, easterly winds contribute to the melting of Arctic sea ice in the Laptev Sea (20~40%), the Northern Canadian Archipelago (20~60%), and Baffin Bay (20~60%), while they inhibit the melting of Arctic sea ice in the Barents Sea (−20~−40%) and the Svalbard Archipelago (−20~−40%). In the SON months, easterly winds contribute in Chukchi Sea (20~50%),the Greenland Sea (30~50%), and Hudson Bay (20~40%), and inhibit in the Kara Sea (−20~−40%) and the Laptev Sea (−20~−40%). Under the months of DJF, the areas where the easterly winds make a positive contribution are distributed in the region of the Bering Strait (20~40%) and in the Denmark Strait (20~40%). Since the sum of easterly and westerly wind frequencies at the same location is 100%, the contribution of westerly winds to Arctic SIC less than 20% under different seasons is opposite to the frequency of easterly winds, and it better illustrates that the contributions of different wind directions to the SIC vary according to the directions of the winds.
The prevailing southerly winds in the Arctic bring warm and humid air currents, accelerating the melting of sea ice, thus widening the distribution of Arctic SIC less than 20%. As shown in Figure 6i–k,m, the frequency of southerly winds mainly contributes positively to the frequency of Arctic SIC less than 20%, and in the months of MAM, the positive contribution is mainly distributed in the Barents Sea, the Kara Sea, the Laptev Sea, the Chukchi Sea, the Bering Sea, and the Beaufort Sea, with the contributions in the above regions largely in the range of 30% to 40%. It is worth noting that during prevailing southerly winds, there is a suppressed area in Hudson Bay with a contribution of up to −40%. In the months of JJA, the positive contributions are distributed in the Kara Sea, the Laptev Sea, the Bering Sea, the Northern Canadian Archipelago, and Baffin Bay, of which the most significant positive contributions are found in Baffin Bay and the Gulf of Boothia in the Northern Canadian Archipelago, which can reach 40–60%, with the rest of the areas in the range of 20–40%. In the months of SON, the positive contribution is distributed in the Barents Sea, the Kara Sea, the Chukchi Sea, the Bering Sea, and around Baffin Island, reaching 20–40%, while in the months of DJF, the positive contribution is mainly distributed in the Barents Sea, reaching 30–40%. The frequency of prevailing northerly winds suppresses the frequency of sea ice less than 20%, in contrast to the contribution of southerly winds, because the northerly winds bring cold air currents, which are not favorable to the melting of sea ice.

4.2.2. Contribution of Strong Winds above Force Six to the Frequencies of SIC Less Than 20%

To investigate the effect of strong winds on Arctic SIC, the contribution of the statistical frequency of high winds of force six or higher to the frequency of SIC less than 20% was calculated, and Figure 7 was obtained. During the MAM season, the frequency of strong winds contributes mainly to the frequency of SIC less than 20%, and the positive contribution is distributed in the Barents Sea (30~60%), the Kara Sea (30~50%), the East Siberian Sea (30~40%), Greenland Sea (30~50%), and Baffin Bay (30~50%). The positive contribution implies that the frequency of strong Arctic winds contributes to the occurrence of Arctic SIC < 20%, and SIC < 20% is more likely to be ablated under the influence of strong winds, so that strong Arctic winds in the above regions contribute to Arctic ablation. Inhibition exists in the Norwegian Sea, the Beaufort Sea, and at the Elizabeth Islands in the Northern Canadian Archipelago, and the inhibition contribution can reach −30~−40%. During the JJA season, strong winds contribute positively to Arctic sea ice thoroughly. During the SON season, the contribution of strong winds to the Arctic sea ice is positive in all regions, from New Zealand to Svalbard and Greenland, with significant contributions in the Kara, Chukchi, and Beaufort seas near New Zealand, which are positive and up to 40% to 60%, and even in the center of the region, of up to 60% or more. Negative contribution areas exist only near Iceland, with negative contributions as high as −40%. In the DJF season, significant positive contribution areas are mainly distributed near New Earth Island (40–60%), the Greenland Sea (20–50%), Baffin Bay (20–40%), the Laptev Sea (20–40%), and the Bering Sea (20–50%). Negative contributions are distributed in the Beaufort Sea (−20% to −40%). Strong Arctic winds, averaged over the year, also contribute mainly to sea-ice ablation, with significant positive contributions in the Barents, Kara, Laptev, Chukchi, Beaufort, and Bering seas, as well as in the Greenland Sea. The regions with larger values are the Barents Sea and the Kara Sea, where the contribution can reach 40–80%, while all other regions are between 20 and 60%. Negative contributions are mainly scattered in the North Atlantic region, with contributions ranging from −20% to −40%.

5. Discussion

The correlation of Arctic winds with SIC and determination of the winds’ influence is a complex process, and many scholars have different opinions. It has been suggested that the melting of Arctic sea ice affects Arctic wind speeds, and that lower SIC affects heat exchange between the ocean and the atmosphere, enhances the wind speed [44], and accelerates the enhancement of Arctic cyclonic activity, thus affecting changes in Arctic sea-surface wind speeds. Changes in SIC change surface roughness, which results in changes in surface wind speeds. Other scholars [45,46] have suggested that the increase in Arctic surface wind speeds affects the melting of sea ice, and that the increase in wind speeds brings more intense warm and humid air, which accelerates the drift of sea ice and affects the melting of sea ice in the Arctic. The effects of wind fields on sea ice are regional and diverse, and there are also significant seasonal differences [47]. During summer cyclone-prone periods, strong low pressure and wind stresses lead to increased sea-ice movement, further dispersion of sea ice, increased net radiation into the water column, and increased sea-surface temperatures, leading to a decrease in sea-ice concentration and area [48]. Large ice floes lead to break-up under the action of Arctic winds and waves. On the one hand, the ocean is exposed to enhanced solar radiation and the seawater warms up. On the other hand, the wind speed accelerates the heat flux at the surface of the sea ice, leading to a faster rate of sea-ice melting. This is the reason why the melting rate of sea ice with less than 20% sea-ice density is faster compared to other sea-ice rates.
When Arctic sea ice decreases, often triggering the AO to enter a negative phase, the polar vortex over the Arctic is weakened, which may lead to more intense mid-latitude cyclonic activity. This increased cyclonic activity may cause more cold air to move southward, which can affect wind speeds in the Arctic. Cyclones in the North Atlantic and the Bering Strait transport warm and moist air to the high-latitude regions through vertical motion, changing the dynamic and thermal conditions in the Arctic, which firstly manifests itself by affecting the wind speeds in the Arctic region, and in turn, this affects the changes in the Arctic SIC. This also proves that the SIC often lags behind the wind changes in the Arctic. The Arctic is dominated by northwesterly winds in winter and northerly winds in spring, so that the contribution to SIC less than 20% at the frequency of prevailing northerly and westerly winds is mainly negative, i.e., prevailing westerly and northerly winds promote the generation of sea ice. Since sea ice lags behind changes in the wind field, the contribution of the wind field to Arctic sea ice is more significant and more convincing, with northwesterly winds in the winter and northerly winds in the spring mainly acting as a suppressor in areas with less than 20% sea-ice density (Figure 6), and thus northwesterly and northerly winds contribute to the generation of sea ice. It has been noted that the ocean’s topography and bottom roughness influence sea-ice density [49]. Varied terrain impacts wind patterns, which in turn affects sea-ice movement and accumulation. For instance, when winds encounter unique topographies like Greenland’s coastline, reduced speeds foster ice buildup there. This contrast is even more evident between Siberian mountains and plains. Warm, humid North Atlantic air deeply penetrates plain regions like the Barents Sea, leading to less dense sea ice year-round. Meanwhile, the Siberian mountains, shielded by their height, experience minimal changes in sea ice, mainly tied to seasonal shifts.

6. Conclusions

In this study, the relationship between Arctic SIC and wind speed was analyzed by calculating a series of indicators such as the Arctic wind speed, SIC, frequencies of different wind directions, frequency of SIC less than 20%, and frequency of strong winds, and the relationship between the Arctic sea-ice wind speed and SIC was analyzed using several methods such as control analysis, correlation analysis, and a calculation of contribution. The main conclusions are as follows:
(1) The overall wind speed in the Arctic region shows an increasing trend, and the SIC decreases year by year. The frequency of strong winds in the Arctic above forces six and eight is small, while the increase in the frequency above force six is large.
(2) Strong Arctic winds are found in the Barents Sea, the Norwegian Sea, the Greenland Sea, the North Atlantic Ocean, and the Bering Sea, and the SIC of the above regions is low; the frequency of winds of force six or higher and the frequency of SIC of less than 20% are also low in the above regions. The frequency of winds of force six or higher and SIC less than 20% is most significant in the region south of Iceland, followed by the Norwegian Sea and the Greenland Sea, and then by the Barents Sea and the Bering Sea.
(3) The regions with the largest differences in SIC corresponding to prevailing east–west winds are located at Cape Hope, in the Bering Sea, and in Baffin Bay. When westerly winds are prevailing, the SIC of Cape Hope is 20% to 50%, that of the Bering Strait is less than 20%, and that of Baffin Bay is more than 70%. With prevailing easterly winds, the SIC of Cape Hope becomes 50–60%, that of the Bering Strait becomes about 40 to 50%, and that of Baffin Bay becomes 40 to 60%. The areas with significant changes in sea ice between prevailing northerly and southerly winds are located in the Bering Strait, Baffin Bay, Hudson Bay, the Kara Sea, and the Laptev Sea. During prevailing southerly winds, the SIC is 30–40% in the Bering Strait, 40–60% in Baffin Bay, 20–40% in Hudson Bay, 60–80% in the Kara Sea, and 80% in the Laptev Sea. With prevailing northerly winds, the SIC is 50–60% at the Bering Strait and 60–80% at Baffin Bay; there is 70–80% increased sea ice in the southern part of Baffin Island, 50–60% in Hudson Bay, 50–70% in the Kara Sea, and 50–60% in the Laptev Sea.
(4) The frequency of prevailing westerly winds shows a significant negative correlation in Baffin Bay, the Bering Strait, and the Laptev Sea, reaching −0.4 and −0.2. The frequency of prevailing easterly winds shows a negative correlation in the Bering Sea, the Beaufort Sea, the Svalbard Archipelago, and the vicinity of Greenland, while it shows a positive correlation in the Barents Sea, the Gulf of Ob, the Laptev Sea, and Baffin Bay. The frequency of prevailing southerly winds shows a significant negative correlation with the Arctic Eastern Hemisphere, which can reach about −0.2 to −0.4. The frequency of prevailing northerly winds is positively correlated with the Arctic SIC in the eastern hemisphere and significantly negatively correlated with the western hemisphere.
(5) The easterly winds under the MAM months play a facilitating role in the Bering Sea (20~30%), the Beaufort Sea (20~30%), and Greenland (20~40%), and a suppressing role in the Barents Sea (−20~−40%) and Hudson Bay (−30~−40%). The easterly winds under the JJA months play a facilitating role in the Laptev Sea (20~40%), the Northern Canadian Islands (20~60%), and Baffin Bay (20~60%), and they are inhibitory in the Barents Sea (−20~−40%) and Svalbard (−20~−40%). During the months of SON, easterly winds make a positive contribution in the Chukchi Sea (20~50%), the Greenland Sea (30~50%), and Hudson Bay (20~40%). The positive contribution in the DJF months is in the Bering Strait region (20–40%) and the Denmark Strait (20–40%). In the months of MAM, the positive contribution of the southerly wind is mainly distributed in the Barents Sea, the Kara Sea, the Laptev Sea, the Chukchi Sea, the Bering Sea, and the Beaufort Sea. In the months of JJA, the positive contribution is distributed in the Kara Sea, the Laptev Sea, the Bering Sea, the northern Canadian Archipelago, and Baffin Bay. In the months of SON, the positive contribution is distributed in the Barents Sea, the Kara Sea, the Chukchi Sea, the Bering Sea, and the vicinity of Baffin Island. During the months of DJF, the positive contribution area is mainly distributed in the Barents Sea region.
(6) Strong winds’ frequency plays a positive contributing role in the MAM season region, distributed in the Barents Sea, the Kara Sea, the East Siberian Sea, the Greenland Sea, and Baffin Bay. Inhibition exists in the Norwegian Sea, the Beaufort Sea, and at the Elizabeth Islands in the Northern Canadian Archipelago. During the JJA season, strong winds contribute positively to the overall Arctic sea ice. During the SON season, strong winds contribute positively to the Arctic sea ice up to the Neotropical Island–Svalbard Island–Greenland. During the DJF season, the significant positive contributing regions are mainly distributed in the vicinity of the Neotropical Island, the Greenland Sea, Baffin Bay, the Laptev Sea, and the Bering Sea. Strong Arctic winds, averaged over the year, also contribute mainly positively to sea-ice ablation.

Author Contributions

Conceptualization, D.W. and C.Z.; Methodology, K.W. (Kaishan Wang) and Y.G.; Software, K.W. (Kaishan Wang); Validation, Y.G.; Data curation, Y.G.; Writing—original draft, K.W. (Kaishan Wang) and K.W. (Kai Wu); Writing—review & editing, K.W. (Kai Wu); Visualization, K.W. (Kaishan Wang); Supervision, D.W. and C.Z.; Project administration, D.W. and C.Z. All authors have read and agreed to the published version of the manuscript.

Funding

This research was funded by the project “Doctoralization for Master Education” of the Marine Resources and Environment Research Group on the Maritime Silk Road, and by the open fund project of Shandong Provincial Key Laboratory of Ocean Engineering, Ocean University of China, grant number kloe201901.

Institutional Review Board Statement

Not applicable.

Informed Consent Statement

Not applicable.

Data Availability Statement

The data used in this study are from the ECMWF’s ERA5 wind reanalysis dataset.

Acknowledgments

The authors would also like to thank the ECMWF and British Antarctic Survey for providing the wind data.

Conflicts of Interest

The authors have no conflicts of interest to declare that are relevant to the content of this article. All authors certify that they have no affiliations with or involvement in any organization or entity with any financial interest or non-financial interest in the subject matter or materials discussed in this manuscript.

References

  1. China’s Arctic Policy. Available online: https://www.gov.cn/zhengce/2018-01/26/content_5260891.htm (accessed on 14 July 2024).
  2. Rantanen, M.; Karpechko, A.Y.; Lipponen, A.; Nordling, K.; Hyvärinen, O.; Ruosteenoja, K.; Vihma, T.; Laaksonen, A. The Arctic Has Warmed Nearly Four Times Faster than the Globe since 1979. Commun. Earth Environ. 2022, 3, 168. [Google Scholar] [CrossRef]
  3. Jiang, S.; Hu, H.; Perrie, W.; Zhang, N.; Bai, H.; Zhao, Y. Different Climatic Effects of the Arctic and Antarctic Ice Covers on Land Surface Temperature in the Northern Hemisphere: Application of Liang-Kleeman Information Flow Method and CAM4.0. Clim. Dyn. 2022, 58, 1237–1255. [Google Scholar] [CrossRef]
  4. Serreze, M.C.; Francis, J.A. The Arctic Amplification Debate. Clim. Change 2006, 76, 241–264. [Google Scholar] [CrossRef]
  5. Dai, A.; Luo, D.; Song, M.; Liu, J. Arctic Amplification Is Caused by Sea-Ice Loss under Increasing CO2. Nat. Commun. 2019, 10, 121. [Google Scholar] [CrossRef]
  6. Fang, M.; Li, X.; Chen, H.W.; Chen, D. Arctic Amplification Modulated by Atlantic Multidecadal Oscillation and Greenhouse Forcing on Multidecadal to Century Scales. Nat. Commun. 2022, 13, 1865. [Google Scholar] [CrossRef]
  7. Chen, X.; Dai, A. Response of Meridional Wind to Greenhouse Gas Forcing, Arctic Sea-Ice Loss, and Arctic Amplification. J. Clim. 2022, 35, 7275–7297. [Google Scholar] [CrossRef]
  8. Jenkins, M.; Dai, A. The Impact of Sea-Ice Loss on Arctic Climate Feedbacks and Their Role for Arctic Amplification. Geophys. Res. Lett. 2021, 48, e2021GL094599. [Google Scholar] [CrossRef]
  9. Sijia, Z.; Lidaling, Y. Computer Simulation of the Influence on Sea Ice Concentration Caused by Sea Surface Temperature and Sea Level Pressure. In Proceedings of the 2012 International Conference on Computing, Measurement, Control and Sensor Network, Taiyuan, China, 7–9 July 2012; pp. 261–264. [Google Scholar]
  10. Candlish, L.M.; Iacozza, J.; Lukovich, J.V.; Horton, B.; Barber, D.G. Sea Ice Climatology in the Canadian Western Arctic: Thermodynamic versus Dynamic Controls. Int. J. Climatol. 2015, 35, 1867–1880. [Google Scholar] [CrossRef]
  11. Ohshima, K.I.; Yoshida, K.; Shimoda, H.; Wakatsuchi, M.; Endoh, T.; Fukuchi, M. Relationship between the Upper Ocean and Sea Ice during the Antarctic Melting Season. J. Geophys. Res.-Ocean. 1998, 103, 7601–7615. [Google Scholar] [CrossRef]
  12. Shen, X.-Y.; Zhang, Y.; Chen, C.-S.; Hu, S.; Xu, D.-Y.; Shao, W.-Z.; Chang, L.; Feng, G.-P. Arctic Sea Ice Variation in the Northwest Passage in 1979-2017 and Its Response to Surface Thermodynamics Factors. Adv. Clim. Change Res. 2021, 12, 563–580. [Google Scholar] [CrossRef]
  13. Ding, Q.; Schweiger, A.; Baxter, I. Nudging Observed Winds in the Arctic to Quantify Associated Sea Ice Loss from 1979 to 2020. J. Clim. 2022, 35, 6797–6813. [Google Scholar] [CrossRef]
  14. Mallett, R.D.C.; Stroeve, J.C.; Cornish, S.B.; Crawford, A.D.; Lukovich, J.V.; Serreze, M.C.; Barrett, A.P.; Meier, W.N.; Heorton, H.D.B.S.; Tsamados, M. Record Winter Winds in 2020/21 Drove Exceptional Arctic Sea Ice Transport. Commun. Earth Environ. 2021, 2, 149. [Google Scholar] [CrossRef]
  15. Ding, Q.; Schweiger, A.; L’Heureux, M.; Battisti, D.S.; Po-Chedley, S.; Johnson, N.C.; Blanchard-Wrigglesworth, E.; Harnos, K.; Zhang, Q.; Eastman, R.; et al. Influence of High-Latitude Atmospheric Circulation Changes on Summertime Arctic Sea Ice. Nat. Clim. Change 2017, 7, 289–295. [Google Scholar] [CrossRef]
  16. Wernli, H.; Papritz, L. Role of Polar Anticyclones and Mid-Latitude Cyclones for Arctic Summertime Sea-Ice Melting. Nat. Geosci. 2018, 11, 108–113. [Google Scholar] [CrossRef]
  17. Graham, R.; Itkin, P.; Meyer, A.; Sundfjord, A.; Spreen, G.; Smedsrud, L.; Liston, G.; Cheng, B.; Cohen, L.; Divine, D.; et al. Winter Storms Accelerate the Demise of Sea Ice in the Atlantic Sector of the Arctic Ocean. Sci. Rep. 2019, 9, 9222. [Google Scholar] [CrossRef]
  18. Duvivier, A.; Holland, M.; Vavrus, S.; Landrum, L.; Shields, C.; Thaker, R. Arctic Sea Ice Loss Drives Increasing Arctic Wind Speeds with Combined Impact on Surface Roughness and Boundary Layer Stability. Res. Sq. 2022. [Google Scholar] [CrossRef]
  19. Crawford, A.; Lukovich, J.; McCrystall, M.; Stroeve, J.C.; Barber, D. Reduced Sea Ice Enhances Intensification of Winter Storms over the Arctic Ocean. J. Clim. 2022, 35, 3353–3370. [Google Scholar] [CrossRef]
  20. DuVivier, A.; Vavrus, S.; Holland, M.; Landrum, L.; Shields, C.; Thaker, R. Investigating Future Arctic Sea Ice Loss and Near-Surface Wind Speed Changes Related to Surface Roughness Using the Community Earth System Model. J. Geophys. Res. Atmos. 2023, 128, e2023JD038824. [Google Scholar] [CrossRef]
  21. Dai, A.; Song, M. Little Influence of Arctic Amplification on Mid-Latitude Climate. Nat. Clim. Change 2020, 10, 231–237. [Google Scholar] [CrossRef]
  22. Francis, J.A.; Vavrus, S.J. Evidence Linking Arctic Amplification to Extreme Weather in Mid-latitudes. Geophys. Res. Lett. 2012, 39, GL051000. [Google Scholar] [CrossRef]
  23. Francis, J.A.; Vavrus, S.J. Evidence for a Wavier Jet Stream in Response to Rapid Arctic Warming. Environ. Res. Lett. 2015, 10, 014005. [Google Scholar] [CrossRef]
  24. Liu, J.; Curry, J.A.; Wang, H.; Song, M.; Horton, R.M. Impact of Declining Arctic Sea Ice on Winter Snowfall. Proc. Natl. Acad. Sci. USA 2012, 109, 4074–4079. [Google Scholar] [CrossRef]
  25. Vihma, T. Effects of Arctic Sea Ice Decline on Weather and Climate: A Review. Surv. Geophys. 2014, 35, 1175–1214. [Google Scholar] [CrossRef]
  26. Screen, J.A. Far-Flung Effects of Arctic Warming. Nat. Geosci. 2017, 10, 253–254. [Google Scholar] [CrossRef]
  27. Rahmstorf, S.; Box, J.E.; Feulner, G.; Mann, M.E.; Robinson, A.; Rutherford, S.; Schaffernicht, E.J. Exceptional Twentieth-Century Slowdown in Atlantic Ocean Overturning Circulation. Nat. Clim. Chang. 2015, 5, 475–480. [Google Scholar] [CrossRef]
  28. Sévellec, F.; Fedorov, A.V.; Liu, W. Arctic Sea-Ice Decline Weakens the Atlantic Meridional Overturning Circulation. Nat. Clim. Chang. 2017, 7, 604–610. [Google Scholar] [CrossRef]
  29. Strawa, A.W.; Latshaw, G.; Farkas, S.; Russell, P.; Zornetzer, S. Arctic Ice Loss Threatens National Security: A Path Forward. Orbis 2020, 64, 622–636. [Google Scholar] [CrossRef]
  30. Tao, W.; Zheng, L.; Hao, Y.; Liu, G. An Extreme Gale Event in East China under the Arctic Potential Vorticity Anomaly through the Northeast China Cold Vortex. Adv. Atmos. Sci. 2023, 40, 2169–2182. [Google Scholar] [CrossRef]
  31. Qian, D.; Huang, Y.; Li, H.; Zhou, B.; Yin, Z.; Wang, H. Decadal Variations in the Summer Precipitation Over Eastern China Associated With Spring Arctic Sea Ice. J. Geophys. Res. Atmos. 2023, 128, e2023JD039231. [Google Scholar] [CrossRef]
  32. Liu, X.; Zhu, Z.; Lu, R.; Miao, Z.; Li, W.; Hsu, P. Unprecedented July Rainfall in North China in 2021: Combined Effect of Atlantic Warming and Arctic Sea-Ice Loss. J. Geophys. Res. Atmos. 2023, 128, e2022JD038068. [Google Scholar] [CrossRef]
  33. Hersbach, H.; Bell, B.; Berrisford, P.; Hirahara, S.; Horányi, A.; Muñoz-Sabater, J.; Nicolas, J.; Peubey, C.; Radu, R.; Schepers, D.; et al. The ERA5 Global Reanalysis. Q. J. R. Meteorol. Soc. 2020, 146, 1999–2049. [Google Scholar] [CrossRef]
  34. Çalışır, E.; Soran, M.; Akpinar, A. Quality of the ERA5 and CFSR Winds and Their Contribution to Wave Modelling Performance in a Semi-Closed Sea. J. Oper. Oceanogr. 2021, 16, 106–130. [Google Scholar] [CrossRef]
  35. Dai, A. The Diurnal Cycle from Observations and ERA5 in Surface Pressure, Temperature, Humidity, and Winds. Clim. Dyn. 2023, 61, 2965–2990. [Google Scholar] [CrossRef]
  36. Johannsen, F.; Ermida, S.; Martins, J.P.A.; Trigo, I.F.; Nogueira, M.; Dutra, E. Cold Bias of ERA5 Summertime Daily Maximum Land Surface Temperature over Iberian Peninsula. Remote Sens. 2019, 11, 2570. [Google Scholar] [CrossRef]
  37. Deng, X.; He, D.; Zhang, G.; Zhu, S.; Dai, R.; Jin, X.; Fu, W.; Shen, W.; Chen, J.; Fan, Y.; et al. Comparison of Horizontal Wind Observed by Wind Profiler Radars with ERA5 Reanalysis Data in Anhui, China. Theor. Appl. Climatol. 2022, 150, 1745–1760. [Google Scholar] [CrossRef]
  38. Serra, Y.; Rutledge, S.; Chudler, K.; Zhang, C. Rainfall and Convection in ERA5 and MERRA-2 over the Northern Equatorial Western Pacific during PISTON. J. Clim. 2022, 36, 845–863. [Google Scholar] [CrossRef]
  39. Jiang, Y.; Han, S.; Shi, C.; Gao, T.; Zhen, H.; Liu, X. Evaluation of HRCLDAS and ERA5 Datasets for Near-Surface Wind over Hainan Island and South China Sea. Atmosphere 2021, 12, 766. [Google Scholar] [CrossRef]
  40. Liudmyla, G.; Khrystiuk, B.; Shpyg, V.; Pishniak, D. Estimation of Tendencies, Homogeneity and Stationarity of Air Temperature at the Ukrainian Antarctic Akademik Vernadsky Station during 1951—2020. Geofiz. Zhurnal 2022, 44, 183–194. [Google Scholar] [CrossRef]
  41. Reguero, B.G.; Losada, I.J.; Mendez, F. A Global Wave Power Resource and Its Seasonal, Interannual and Long-Term Variability. Appl. Energy 2015, 148, 366–380. [Google Scholar] [CrossRef]
  42. Bhargava, A.; Echenique, J.A. An Econometric Analysis of Sea Surface Temperatures, Sea Ice Concentrations and Ocean Surface Current Velocities. J. Mar. Sci. Eng. 2022, 10, 1854. [Google Scholar] [CrossRef]
  43. Dyck, S.; Tremblay, L.B.; de Vernal, A. Arctic Sea-Ice Cover from the Early Holocene: The Role of Atmospheric Circulation Patterns. Quat. Sci. Rev. 2010, 29, 3457–3467. [Google Scholar] [CrossRef]
  44. Jakobson, L.; Vihma, T.; Jakobson, E. Relationships between Sea Ice Concentration and Wind Speed over the Arctic Ocean during 1979–2015. J. Clim. 2019, 32, 7783–7796. [Google Scholar] [CrossRef]
  45. Hughes, M.; Cassano, J.J. The Climatological Distribution of Extreme Arctic Winds and Implications for Ocean and Sea Ice Processes. J. Geophys. Res. Atmos. 2015, 120, 7358–7377. [Google Scholar] [CrossRef]
  46. Maeda, K.; Kimura, N.; Yamaguchi, H. Temporal and Spatial Change in the Relationship between Sea-Ice Motion and Wind in the Arctic. Polar Res. 2020, 39, 1–10. [Google Scholar] [CrossRef]
  47. Chen, P.; Zhao, J. Impacts of Surface Wind on Regional and Integrated Changes of Sea Ice in the Arctic. Period. Ocean. Univ. China 2017, 47, 1–12. [Google Scholar] [CrossRef]
  48. Li, H.; Zhu, Q.; Ke, C.-Q.; Wang, D.; Shen, X. Influence of Summer Great Cyclones on Sea Ice Concentration and Area in the Arctic Ocean. Clim. Res. 2021, 84, 113–131. [Google Scholar] [CrossRef]
  49. Sasaki, Y.N.; Minobe, S. Seasonally Dependent Interannual Variability of Sea Ice in the Bering Sea and Its Relation to Atmospheric Fluctuations. J. Geophys. Res. Ocean. 2005, 110, C05011. [Google Scholar] [CrossRef]
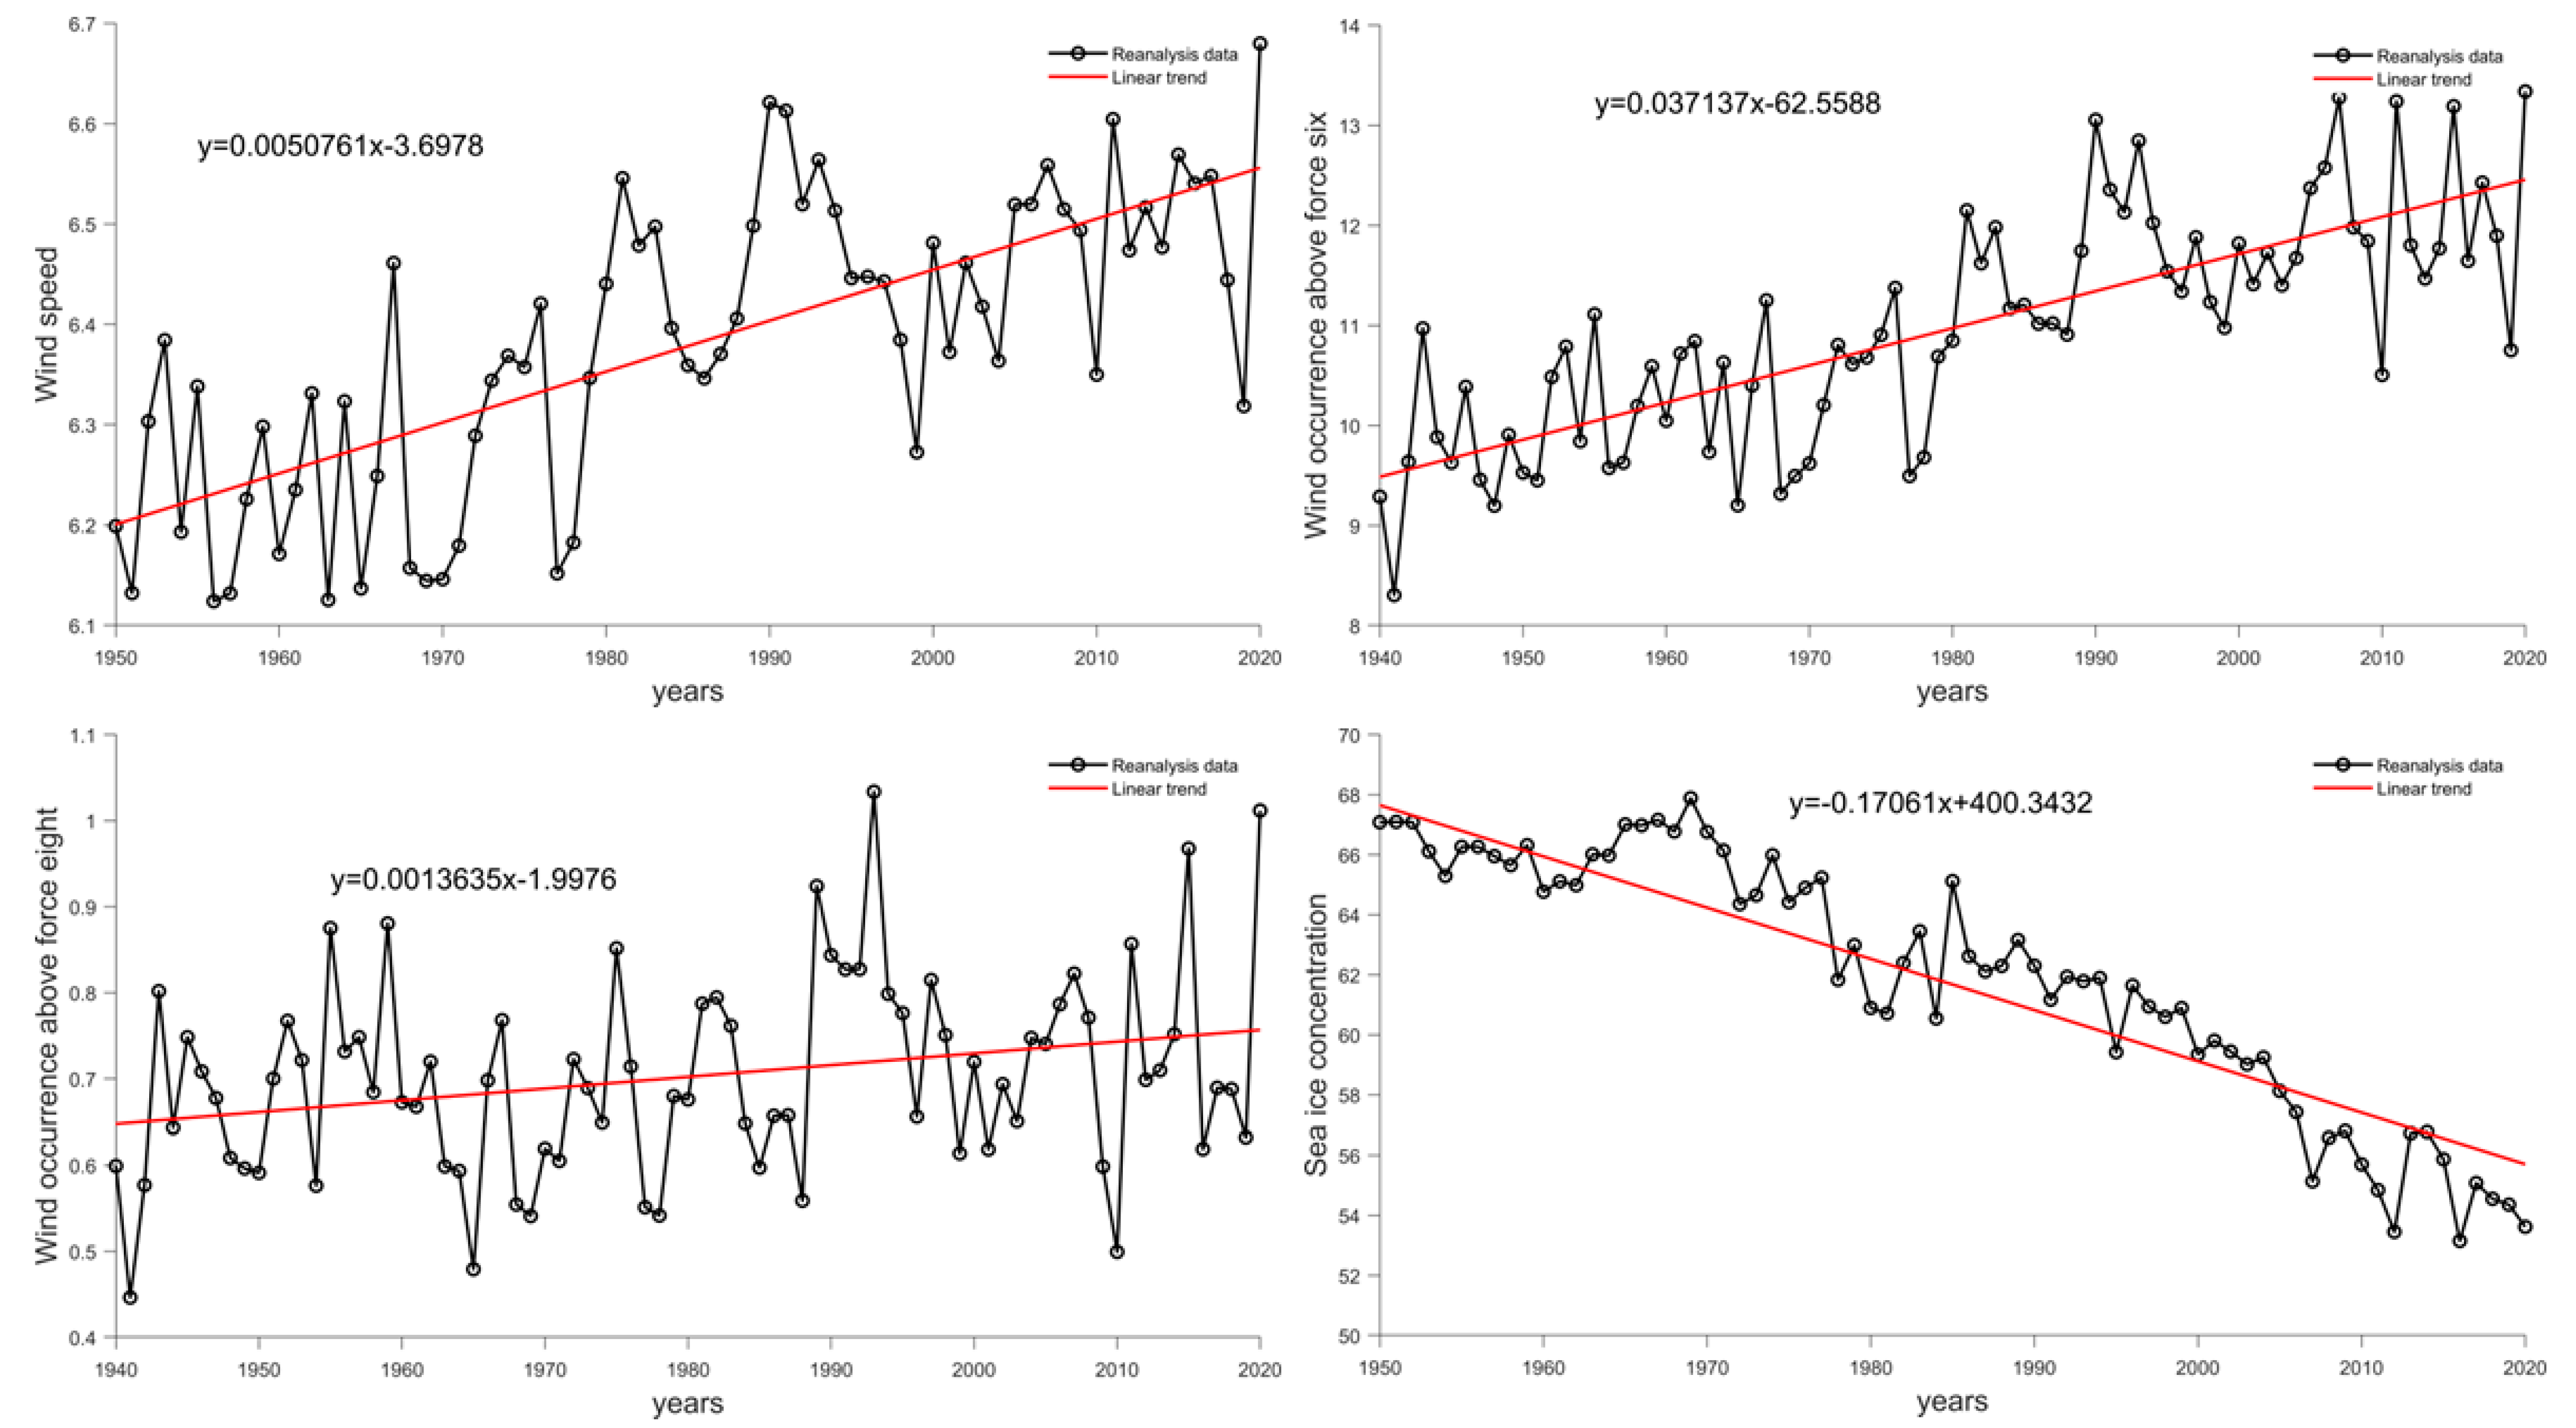
Figure 1. Annual distribution of Arctic wind speed (unit: m/s), frequency of strong winds above force 6 (unit: %), frequency of strong winds above force 8 (unit: %), and SIC (unit: %).
Jmse 12 01511 g001
Figure 2. Arctic sea ice and wind distribution. (a) Average Arctic wind speed throughout the year. (b) Average Arctic SIC throughout the year. (c) Frequency of winds above force six. (d) Frequency of SIC less than 20%. (e) Frequency of distribution of winds of force six or more and SIC less than 20%, satisfied at the same time.
Jmse 12 01511 g002
Figure 3. u-component prevailing wind direction and its SIC. (a,c) Prevailing westerly wind frequency and its SIC, respectively. (b,d) Prevailing easterly wind frequency and its SIC, respectively.
Jmse 12 01511 g003
Figure 4. v-component prevailing wind direction and its SIC. (a,c) Prevailing southerly wind frequency and its SIC, respectively. (b,d) Prevailing northerly wind frequency and its SIC, respectively.
Jmse 12 01511 g004
Figure 5. Correlation coefficients between prevailing westerly (a), easterly (b), southerly (c), and northerly (d) winds and SIC.
Jmse 12 01511 g005
Figure 6. Contribution of different wind frequencies to the frequency of SIC less than 20%. (ad) Easterly wind contributions to the frequency of SIC less than 20% under the MAM, JJA, SON, and DJF seasons, respectively; (eh) westerly wind contributions; (ik,m) southerly wind contributions; (nq) northerly wind contributions.
Jmse 12 01511 g006
Figure 7. Contribution of the frequency of strong winds above force six to the frequency of SIC less than 20%. (ae): MAM, JJA, SON, DJF, and the yearly average, respectively.
Jmse 12 01511 g007
Disclaimer/Publisher’s Note: The statements, opinions and data contained in all publications are solely those of the individual author(s) and contributor(s) and not of MDPI and/or the editor(s). MDPI and/or the editor(s) disclaim responsibility for any injury to people or property resulting from any ideas, methods, instructions or products referred to in the content.