Insights into the Global Characteristics of Shipping Exhaust Emissions at Berth


Abstract
1. Introduction
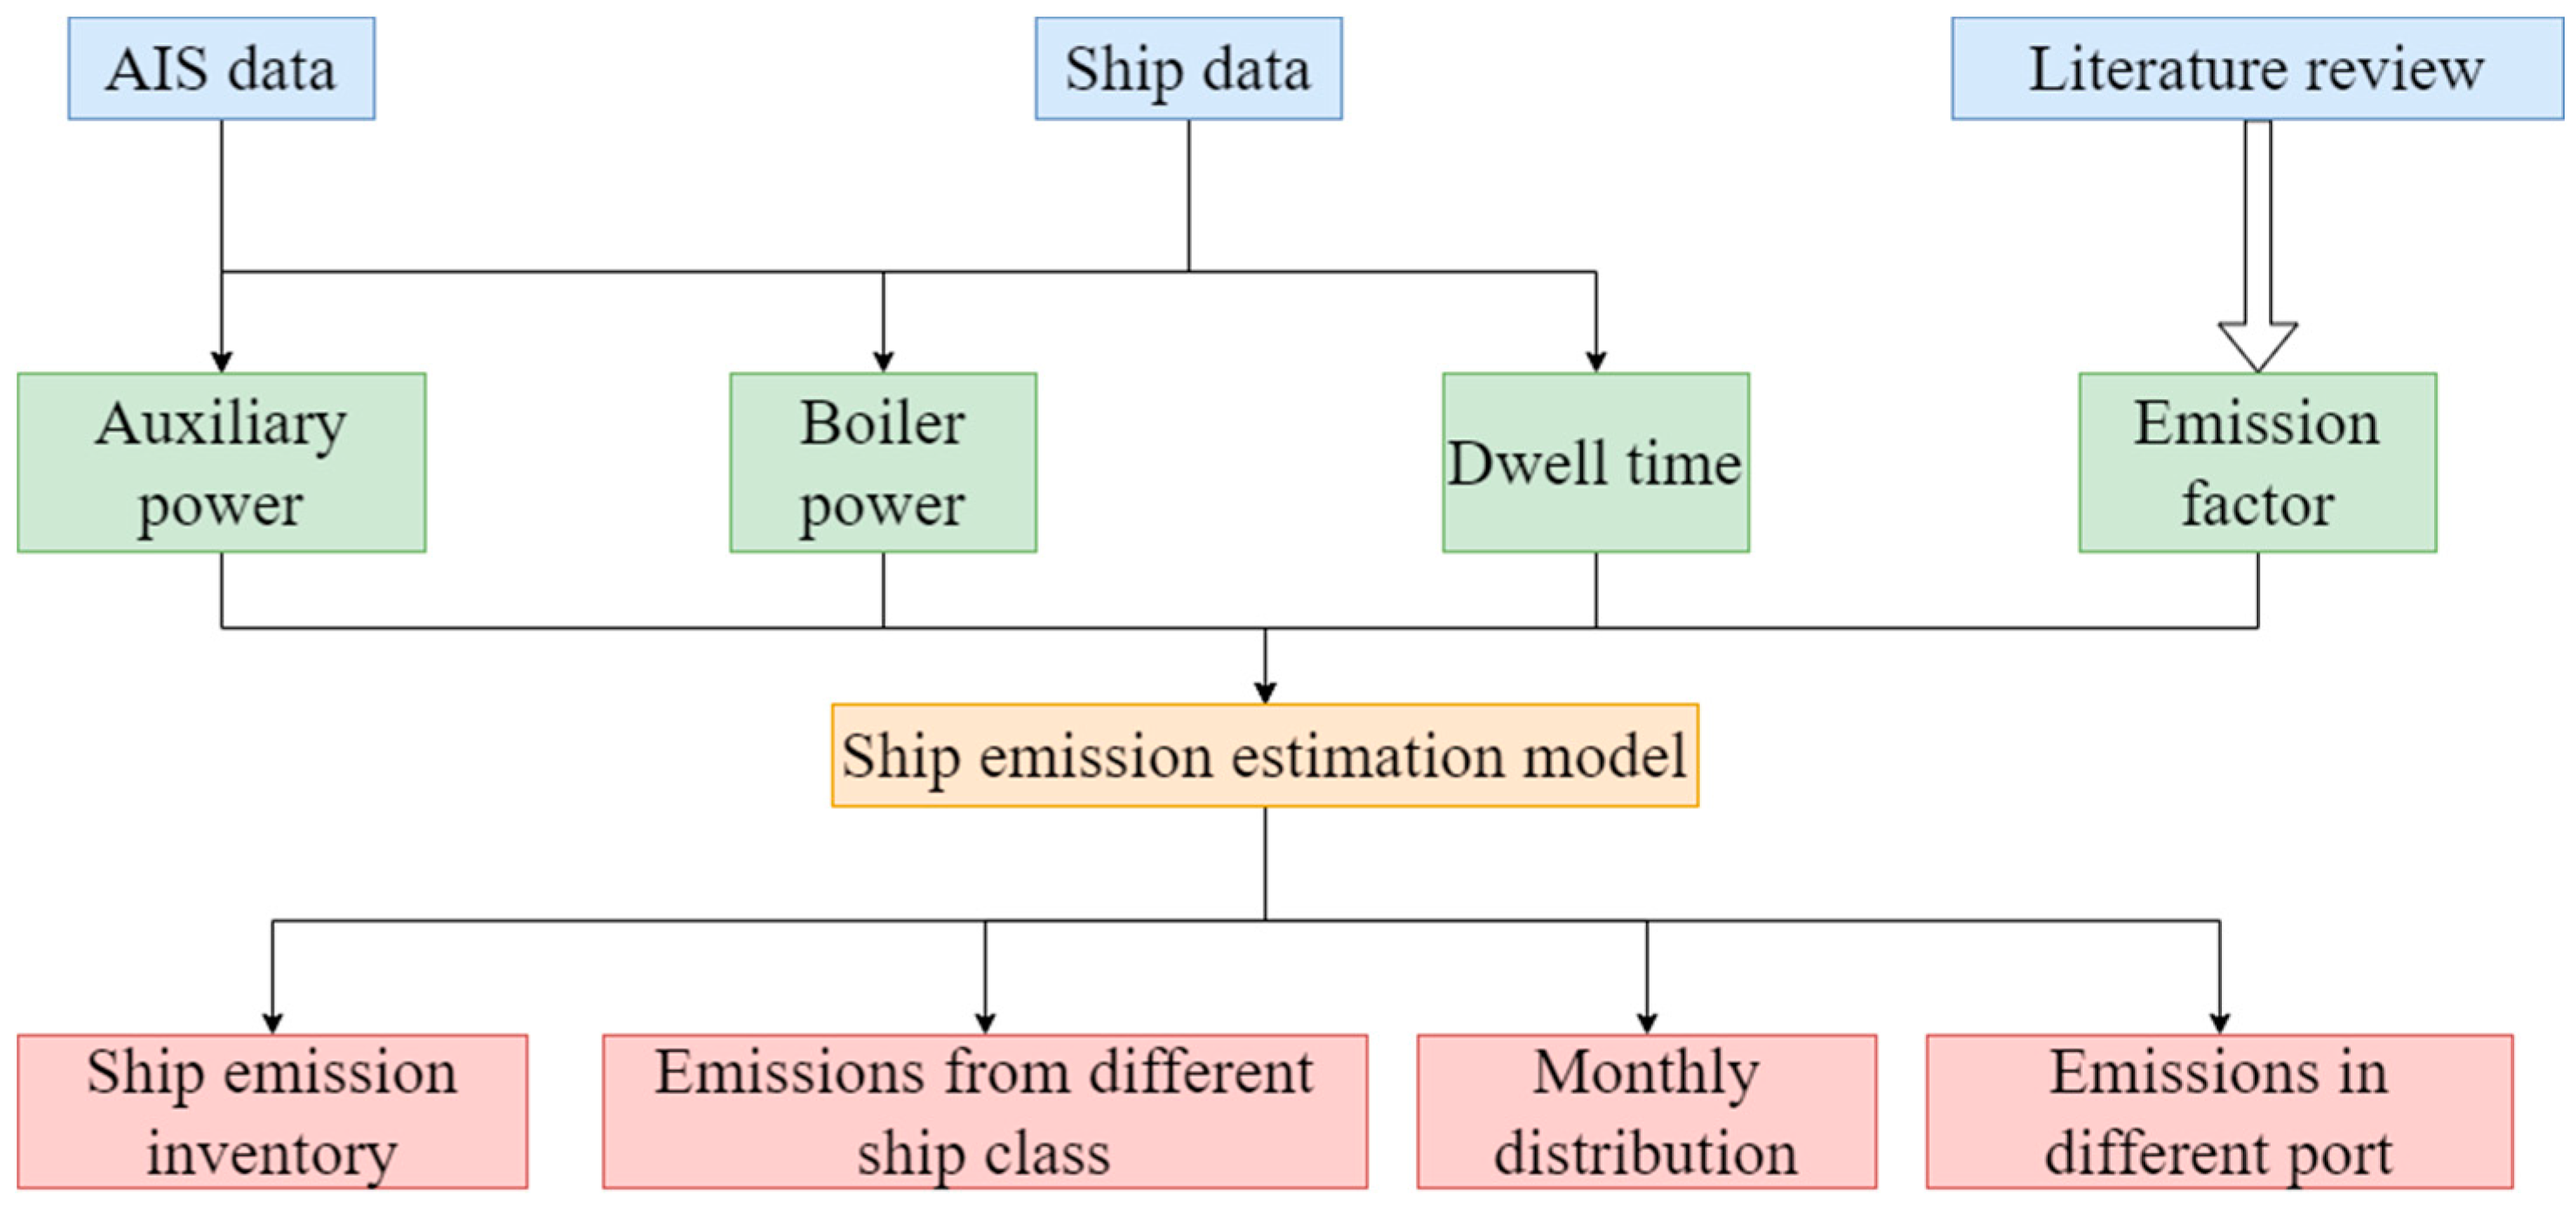
2. Methodology
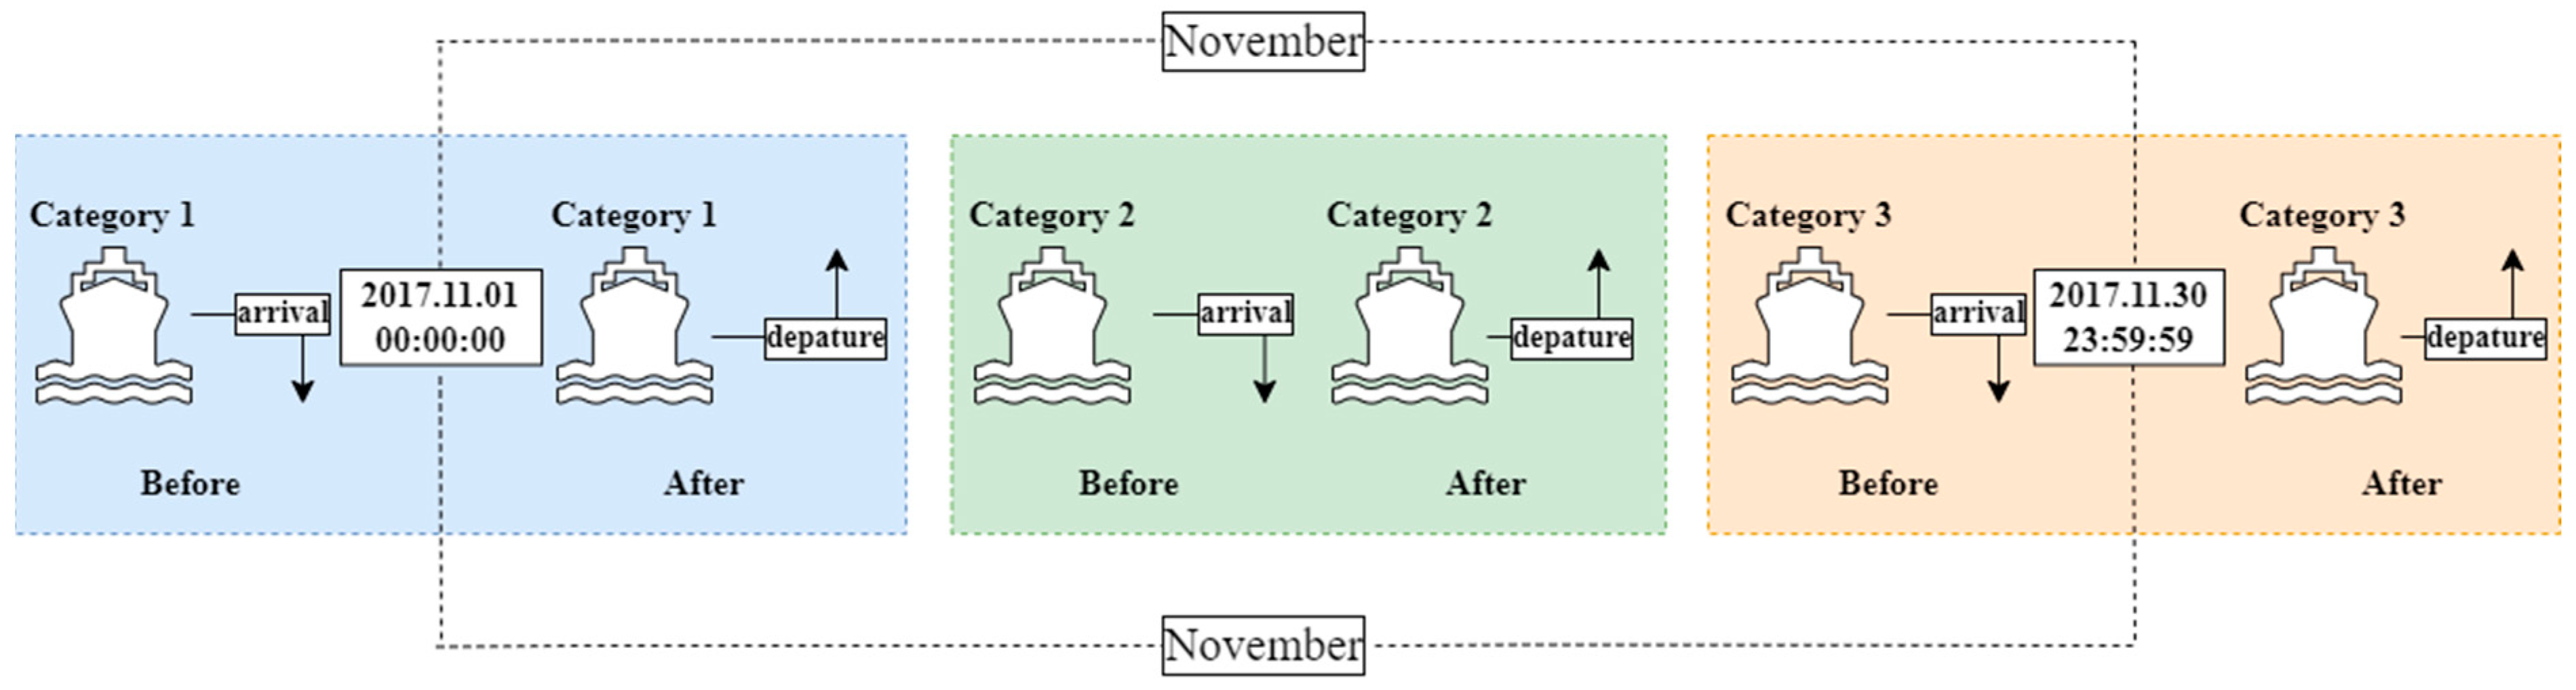
2.1. Data Processing
2.2. Emission Factor
3. Results and Discussion
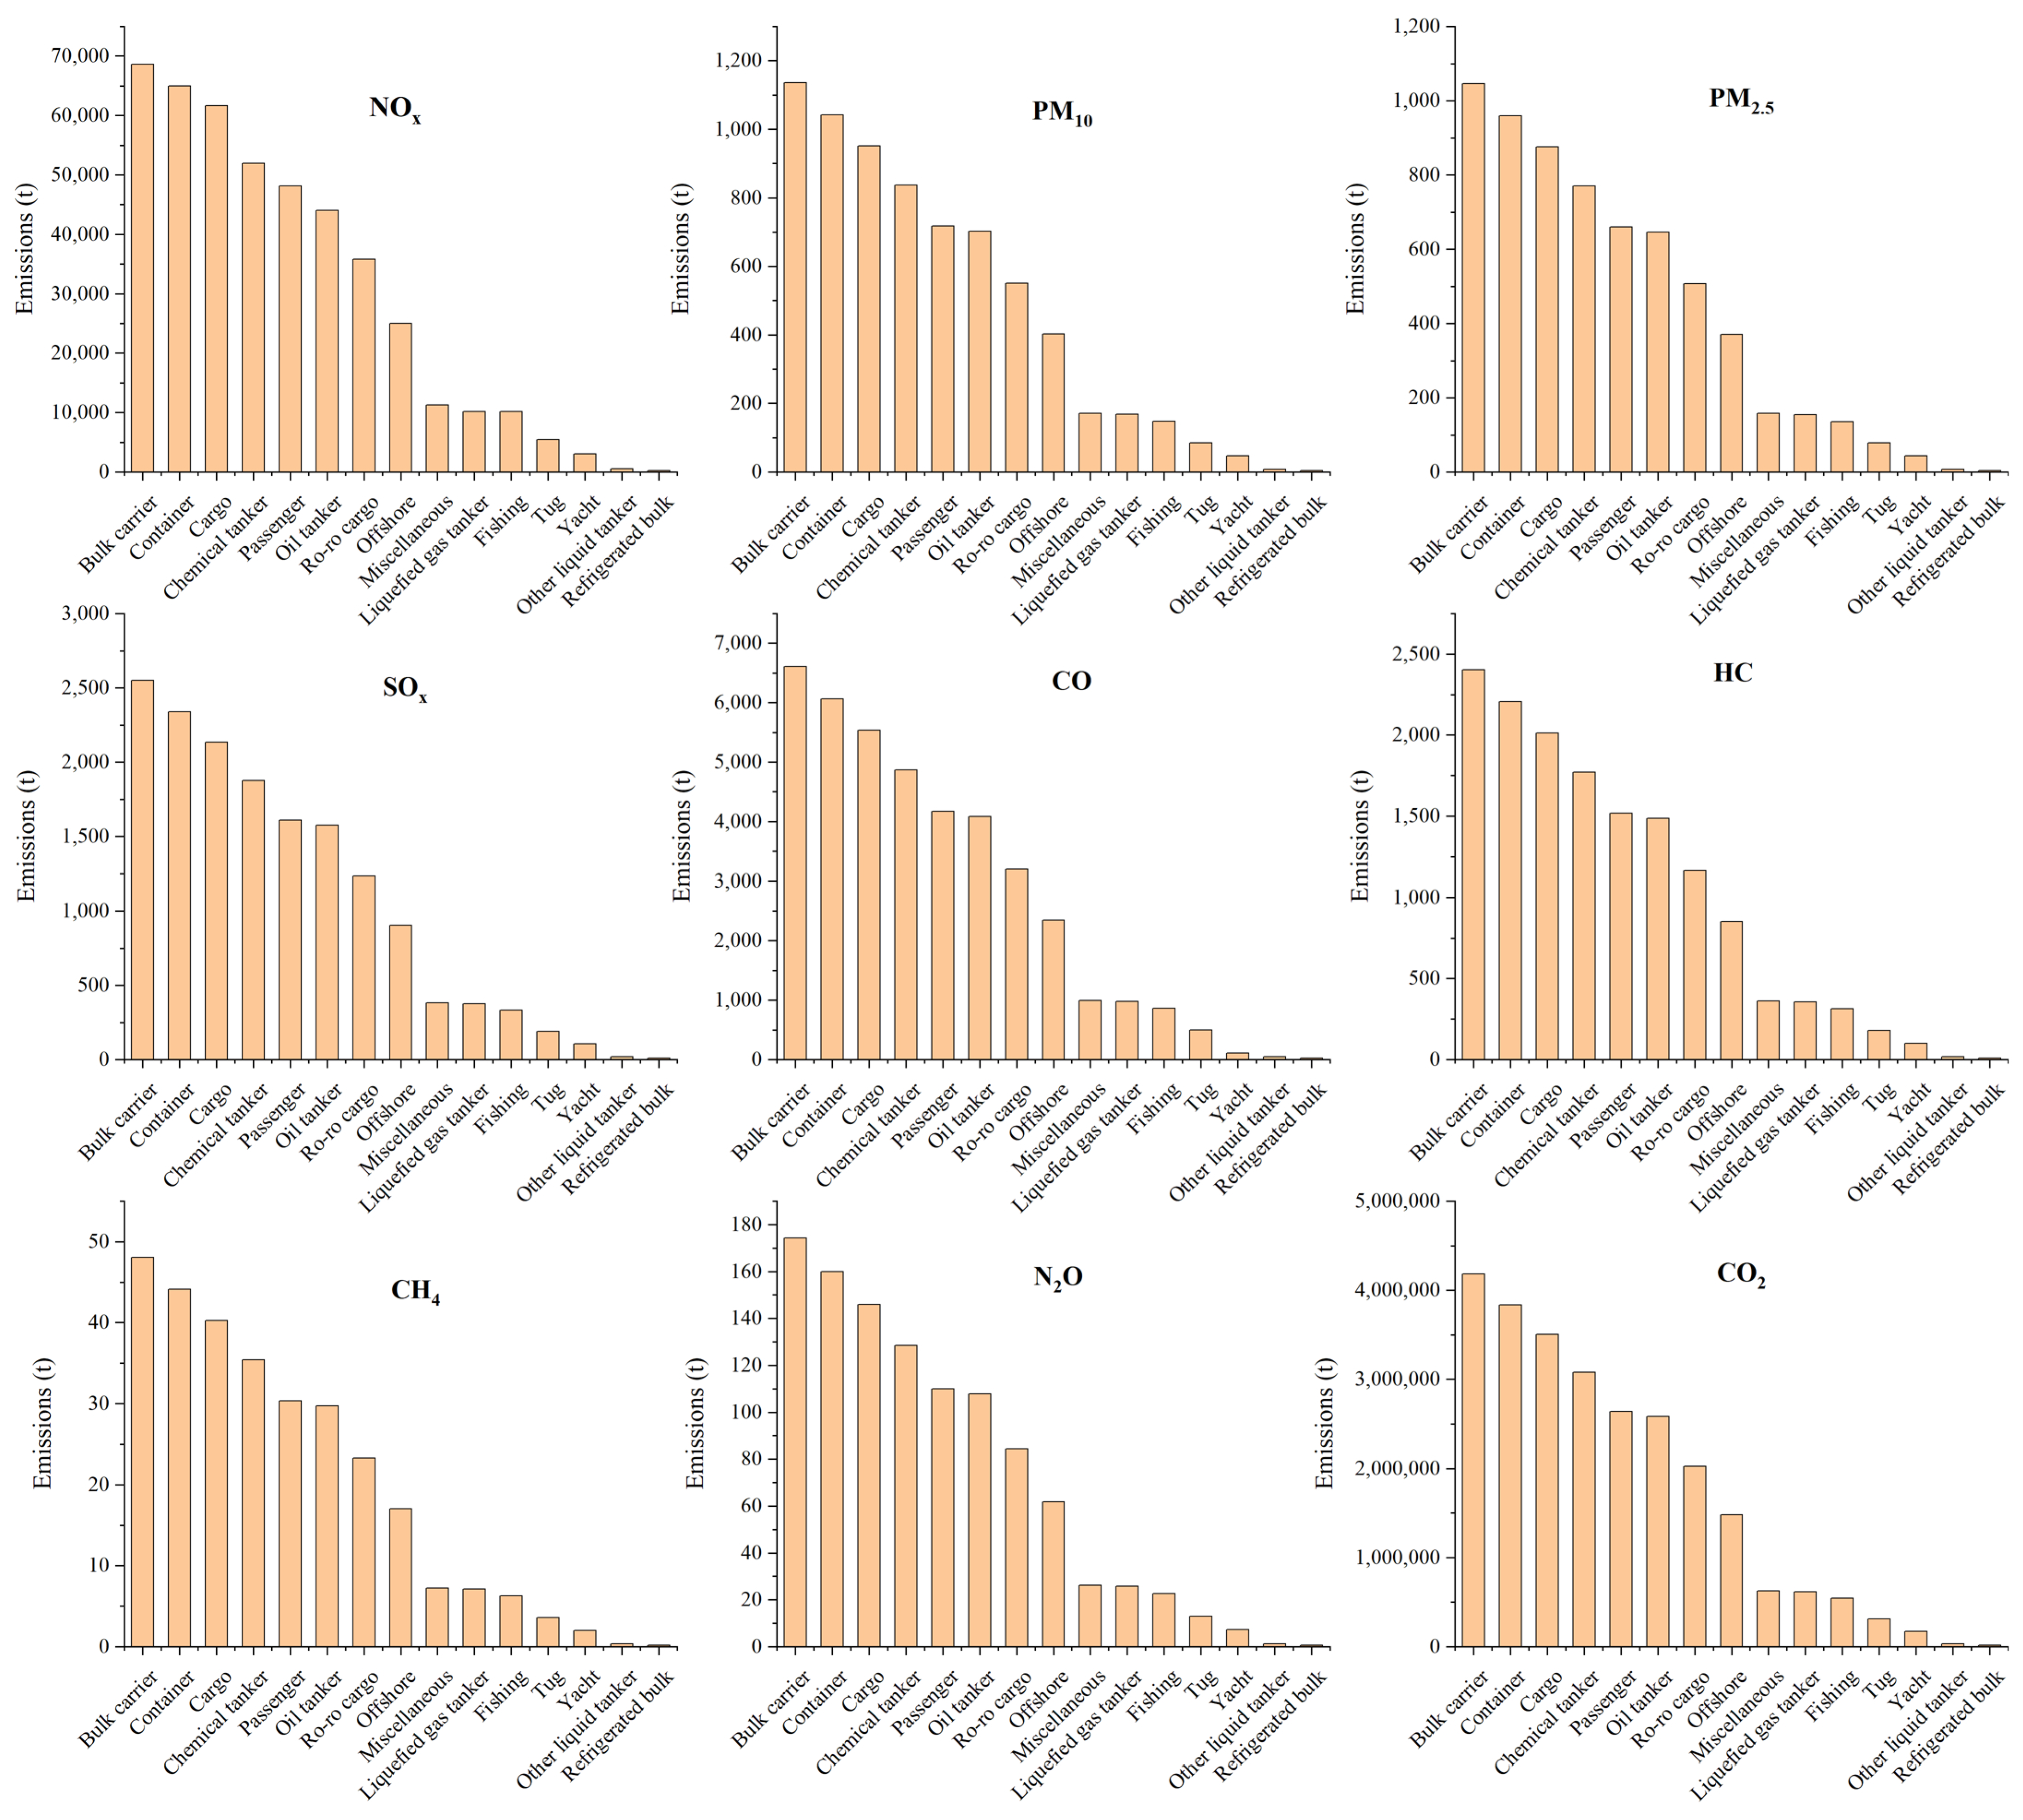
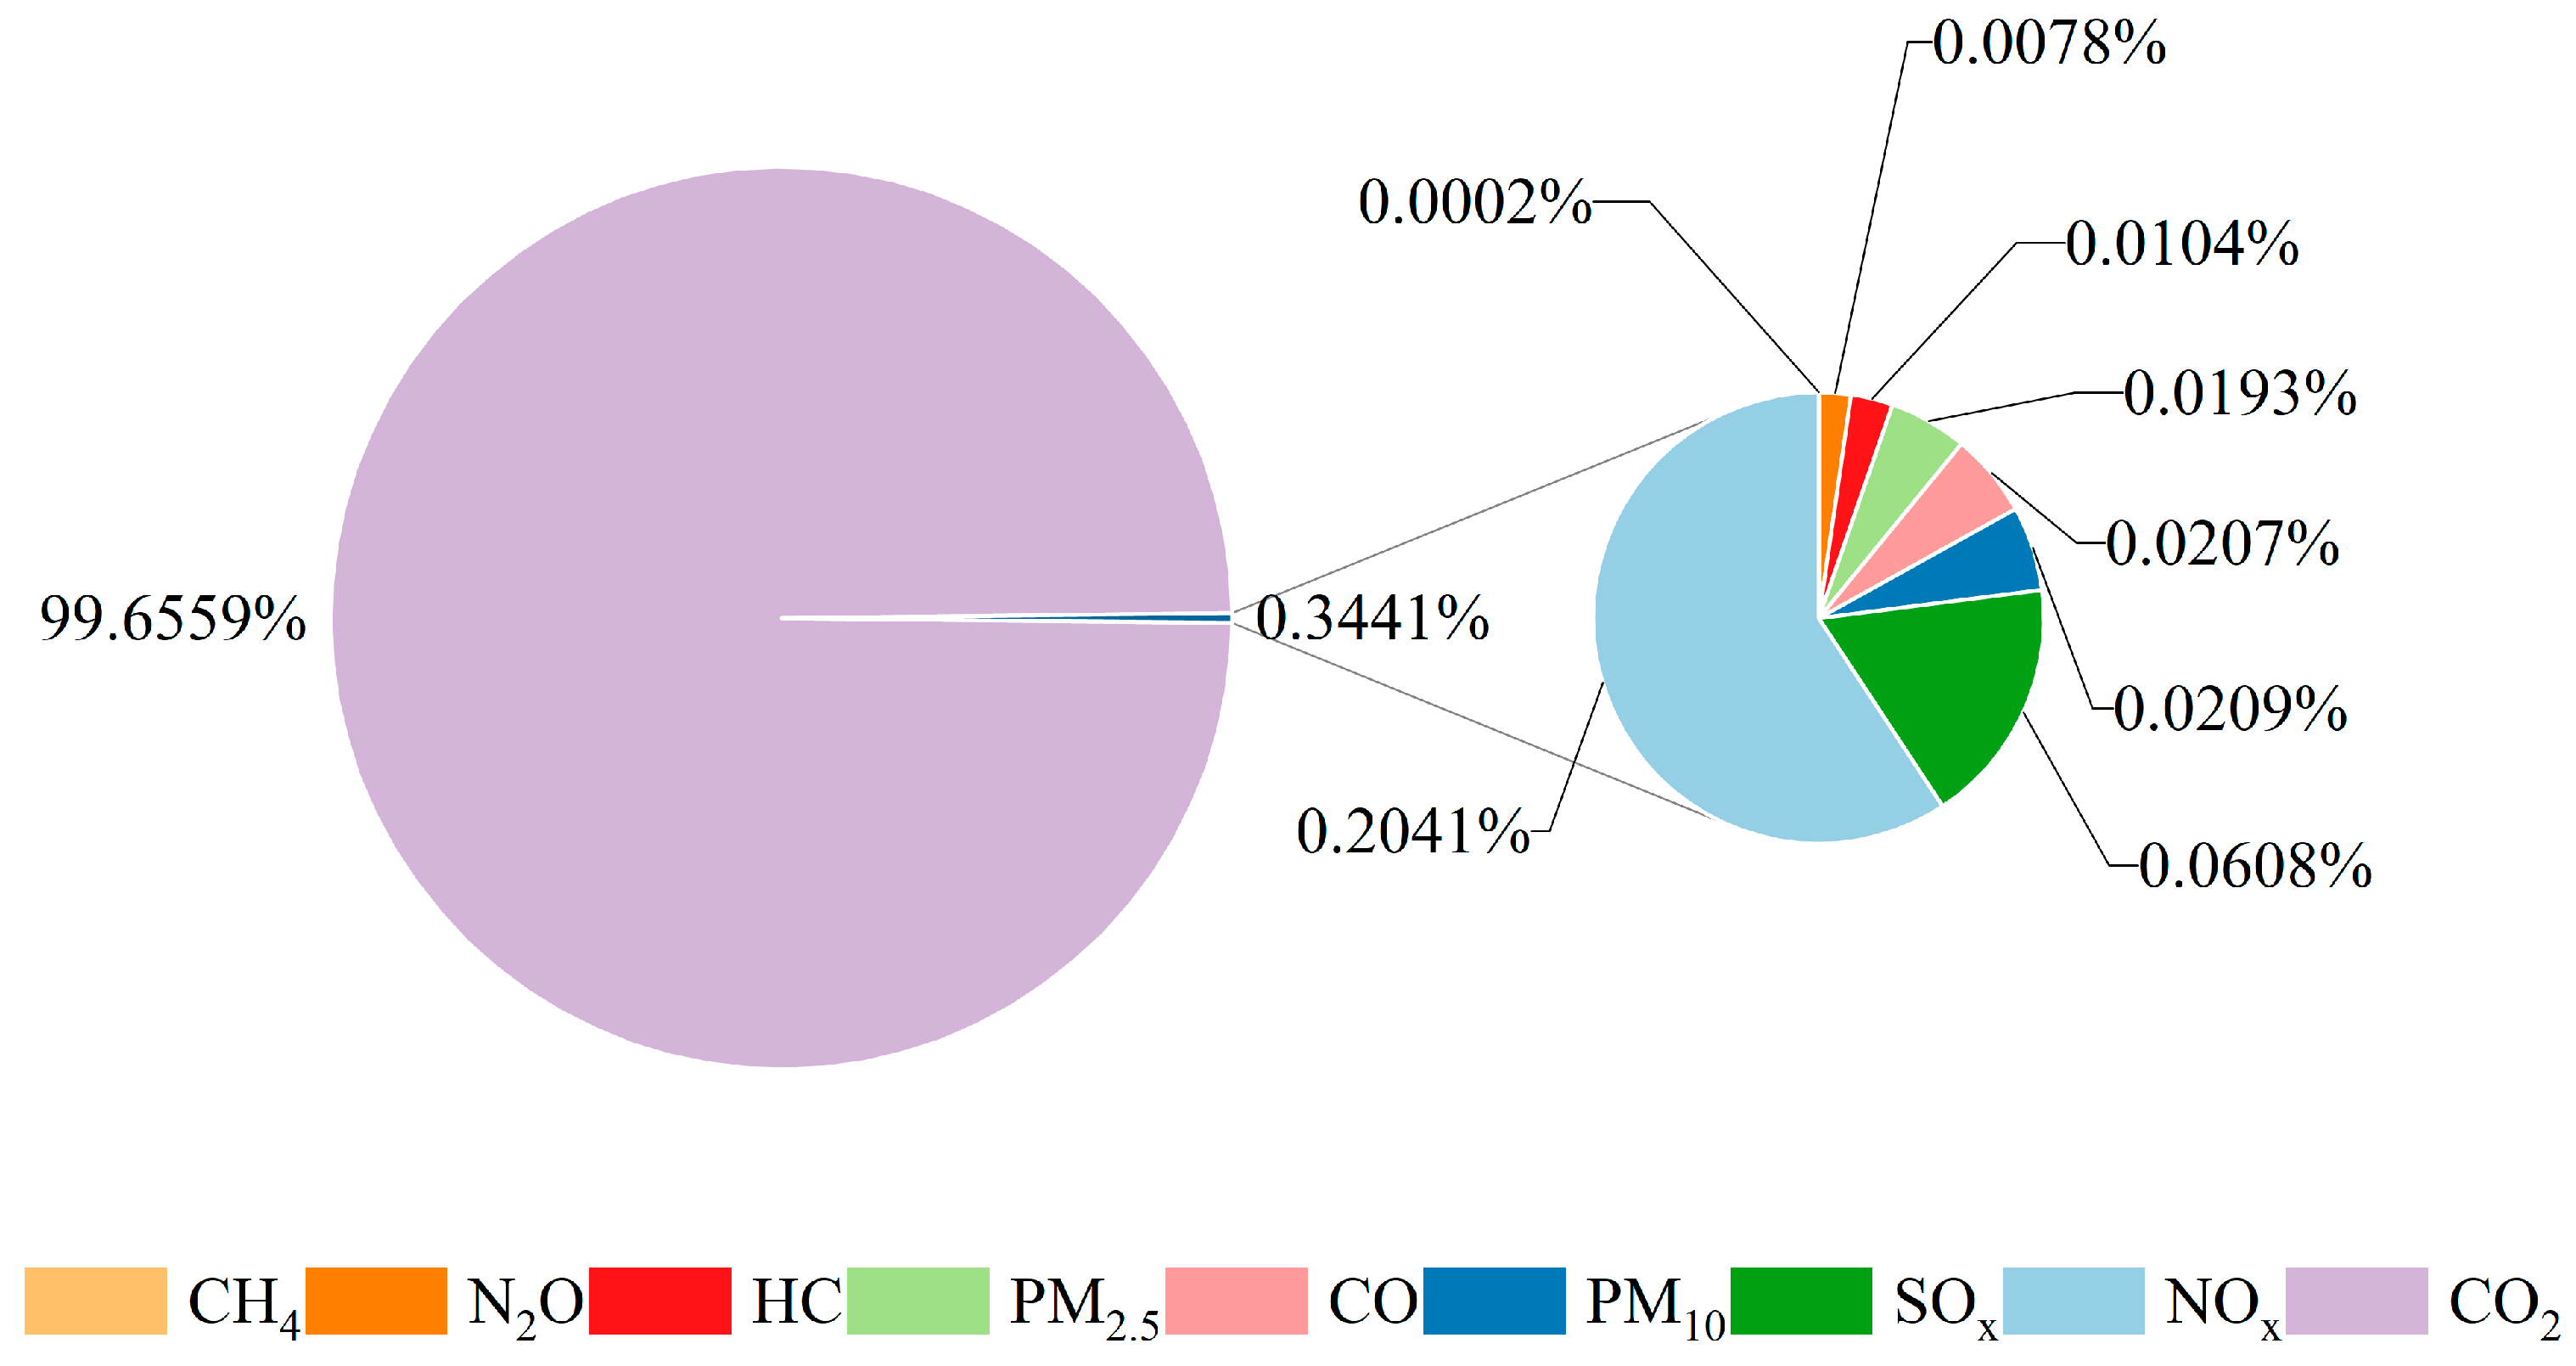
3.1. Volume of Ship Emissions
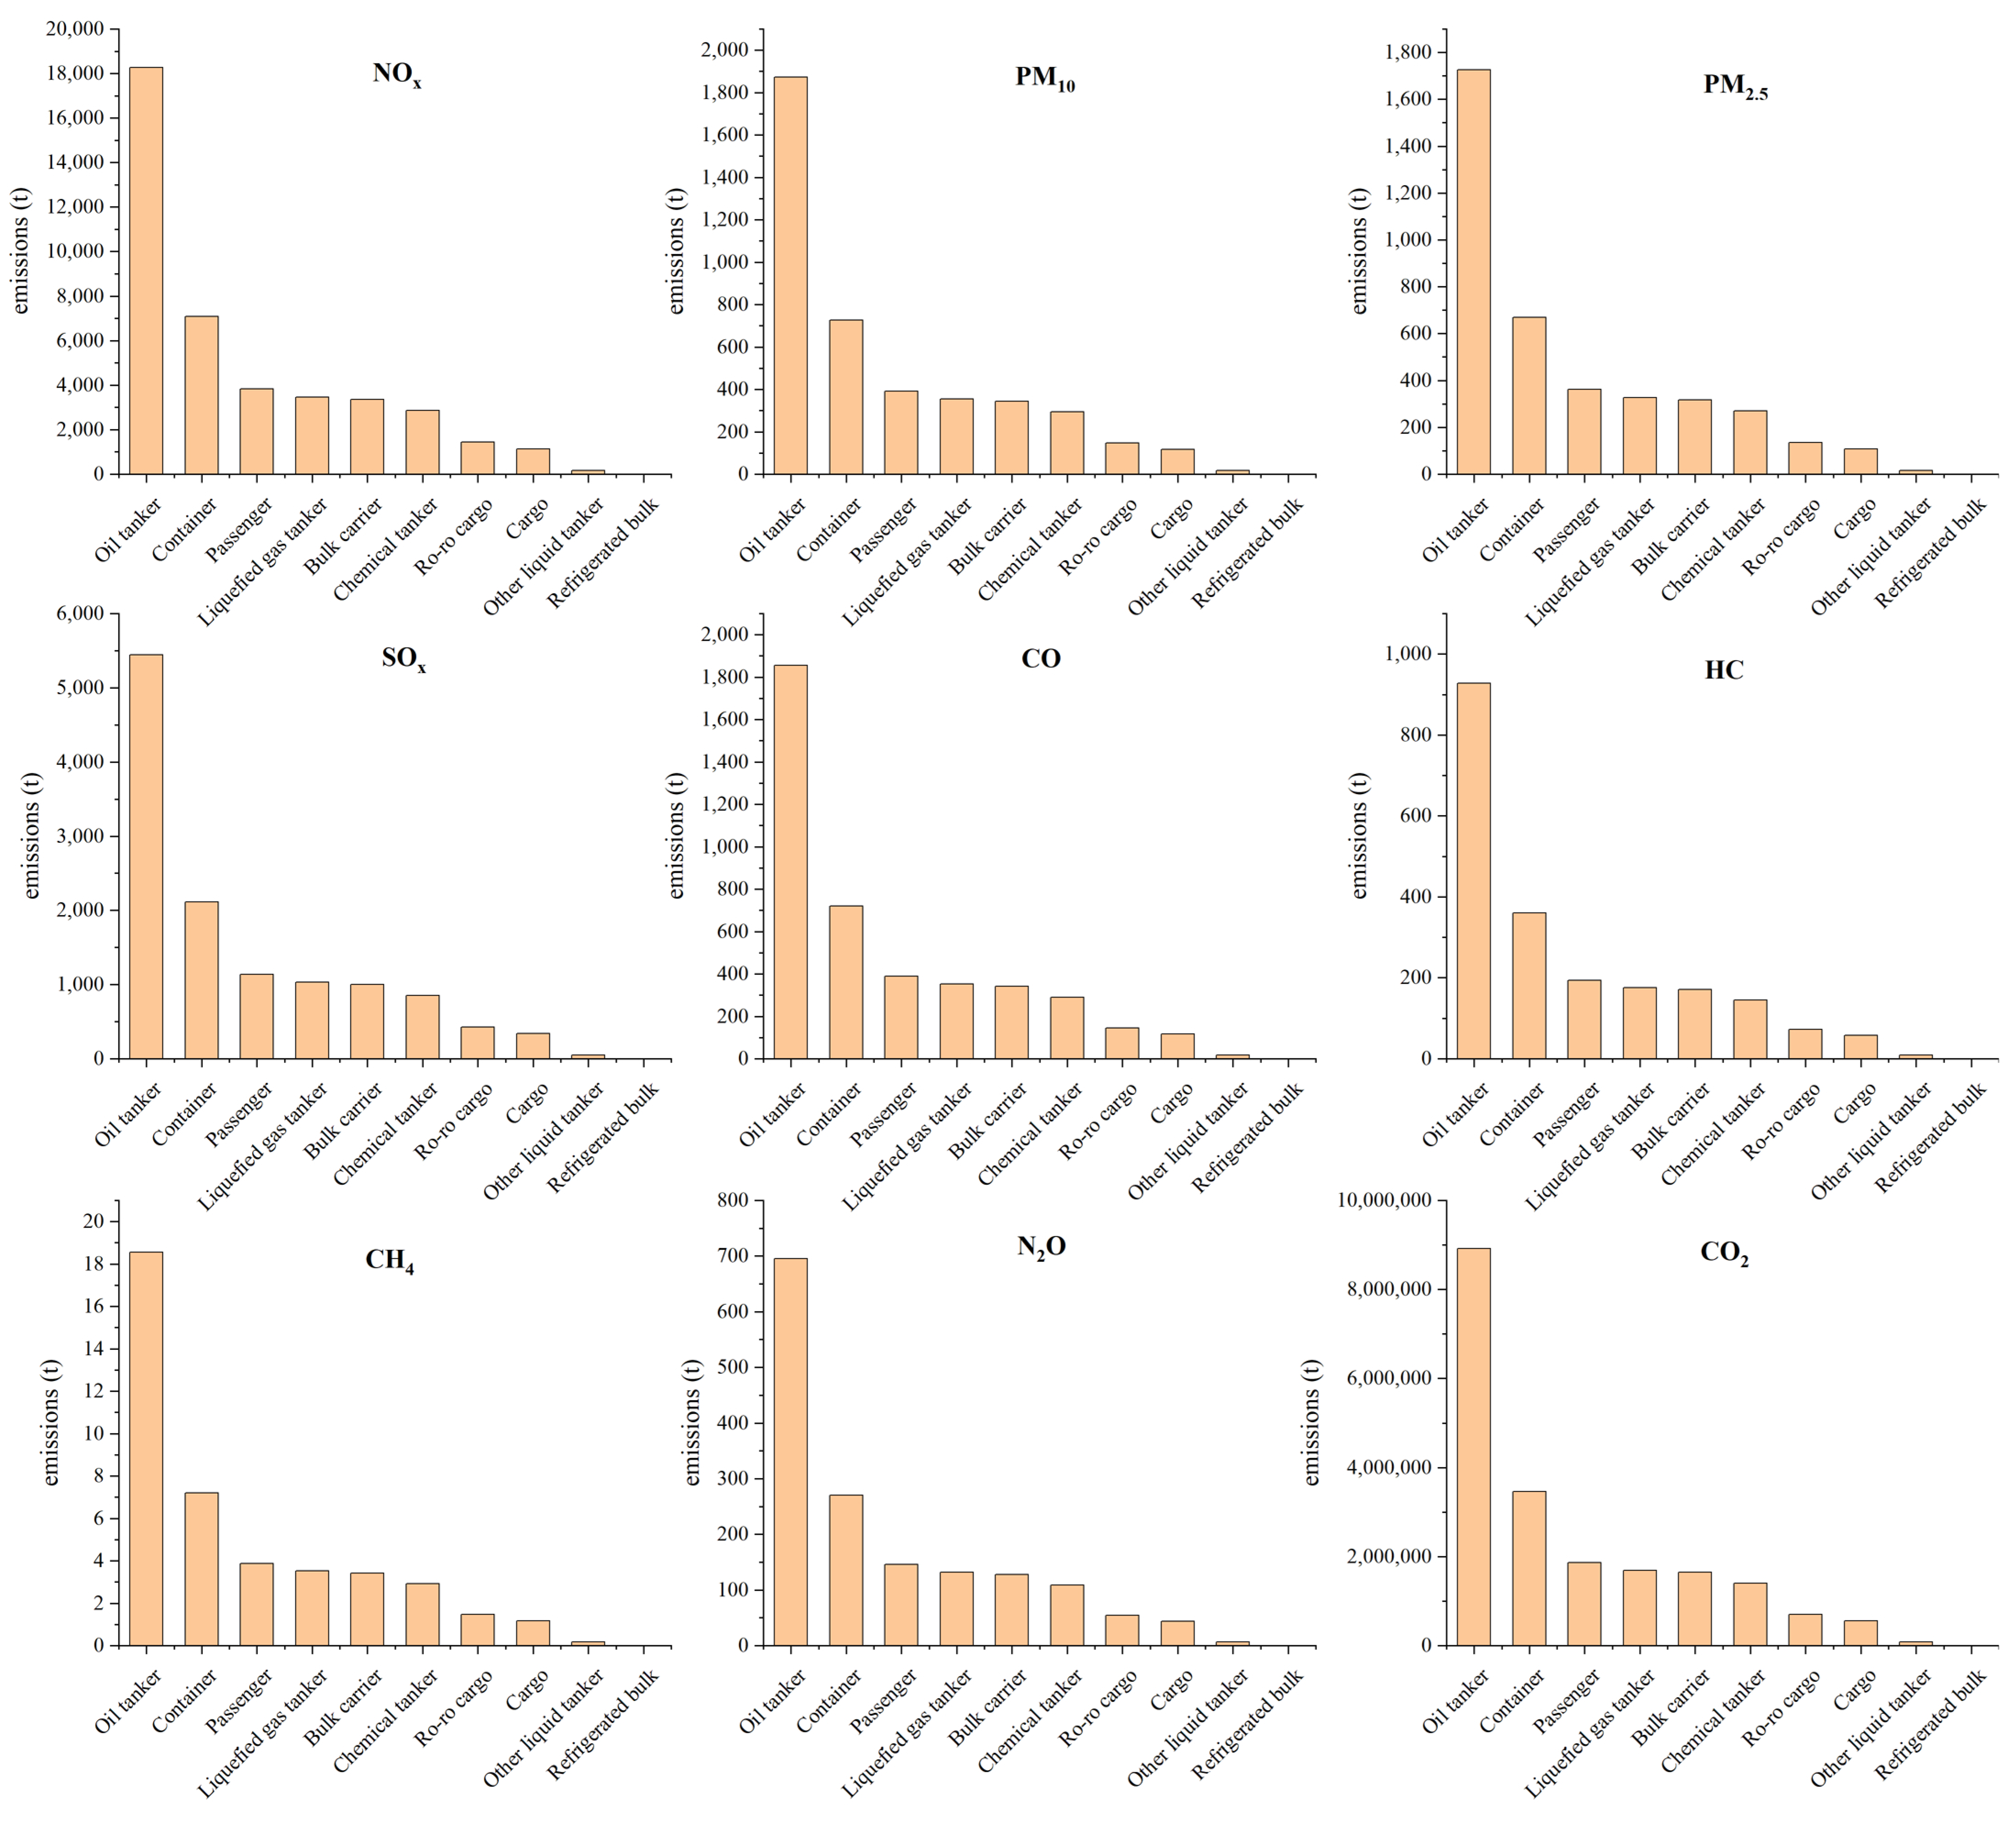
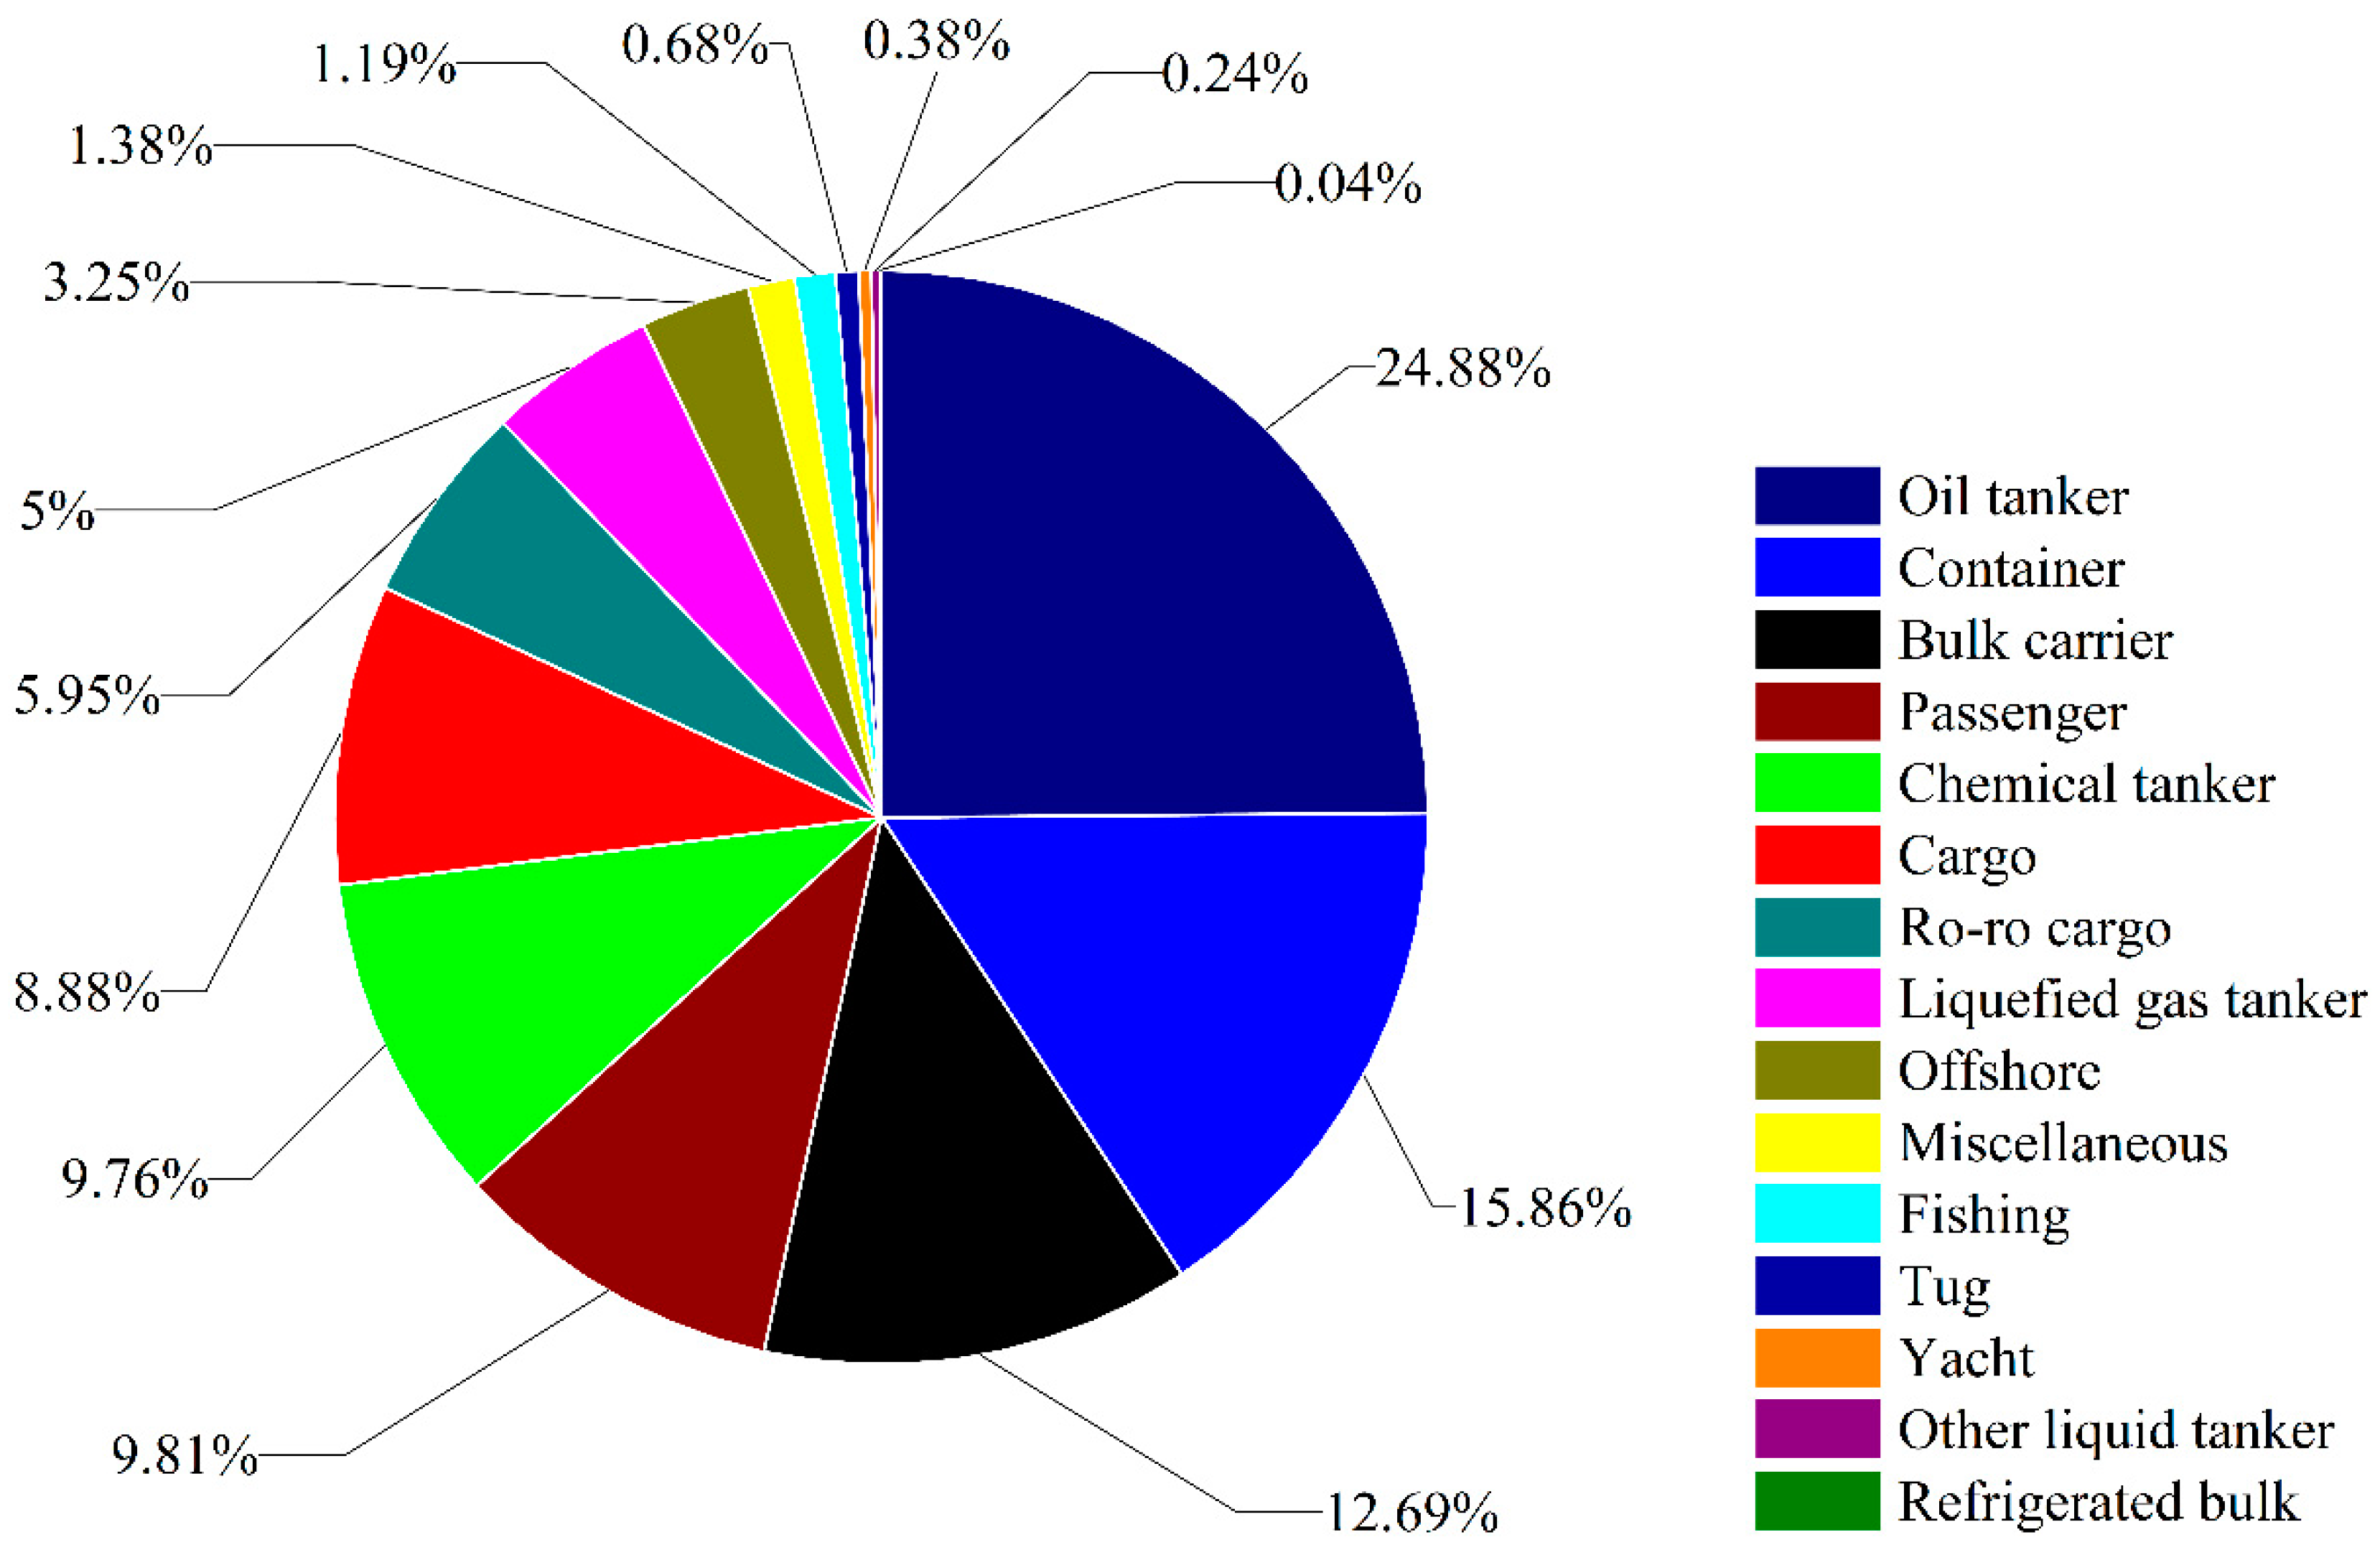
3.2. Emissions from Different Ship Categories
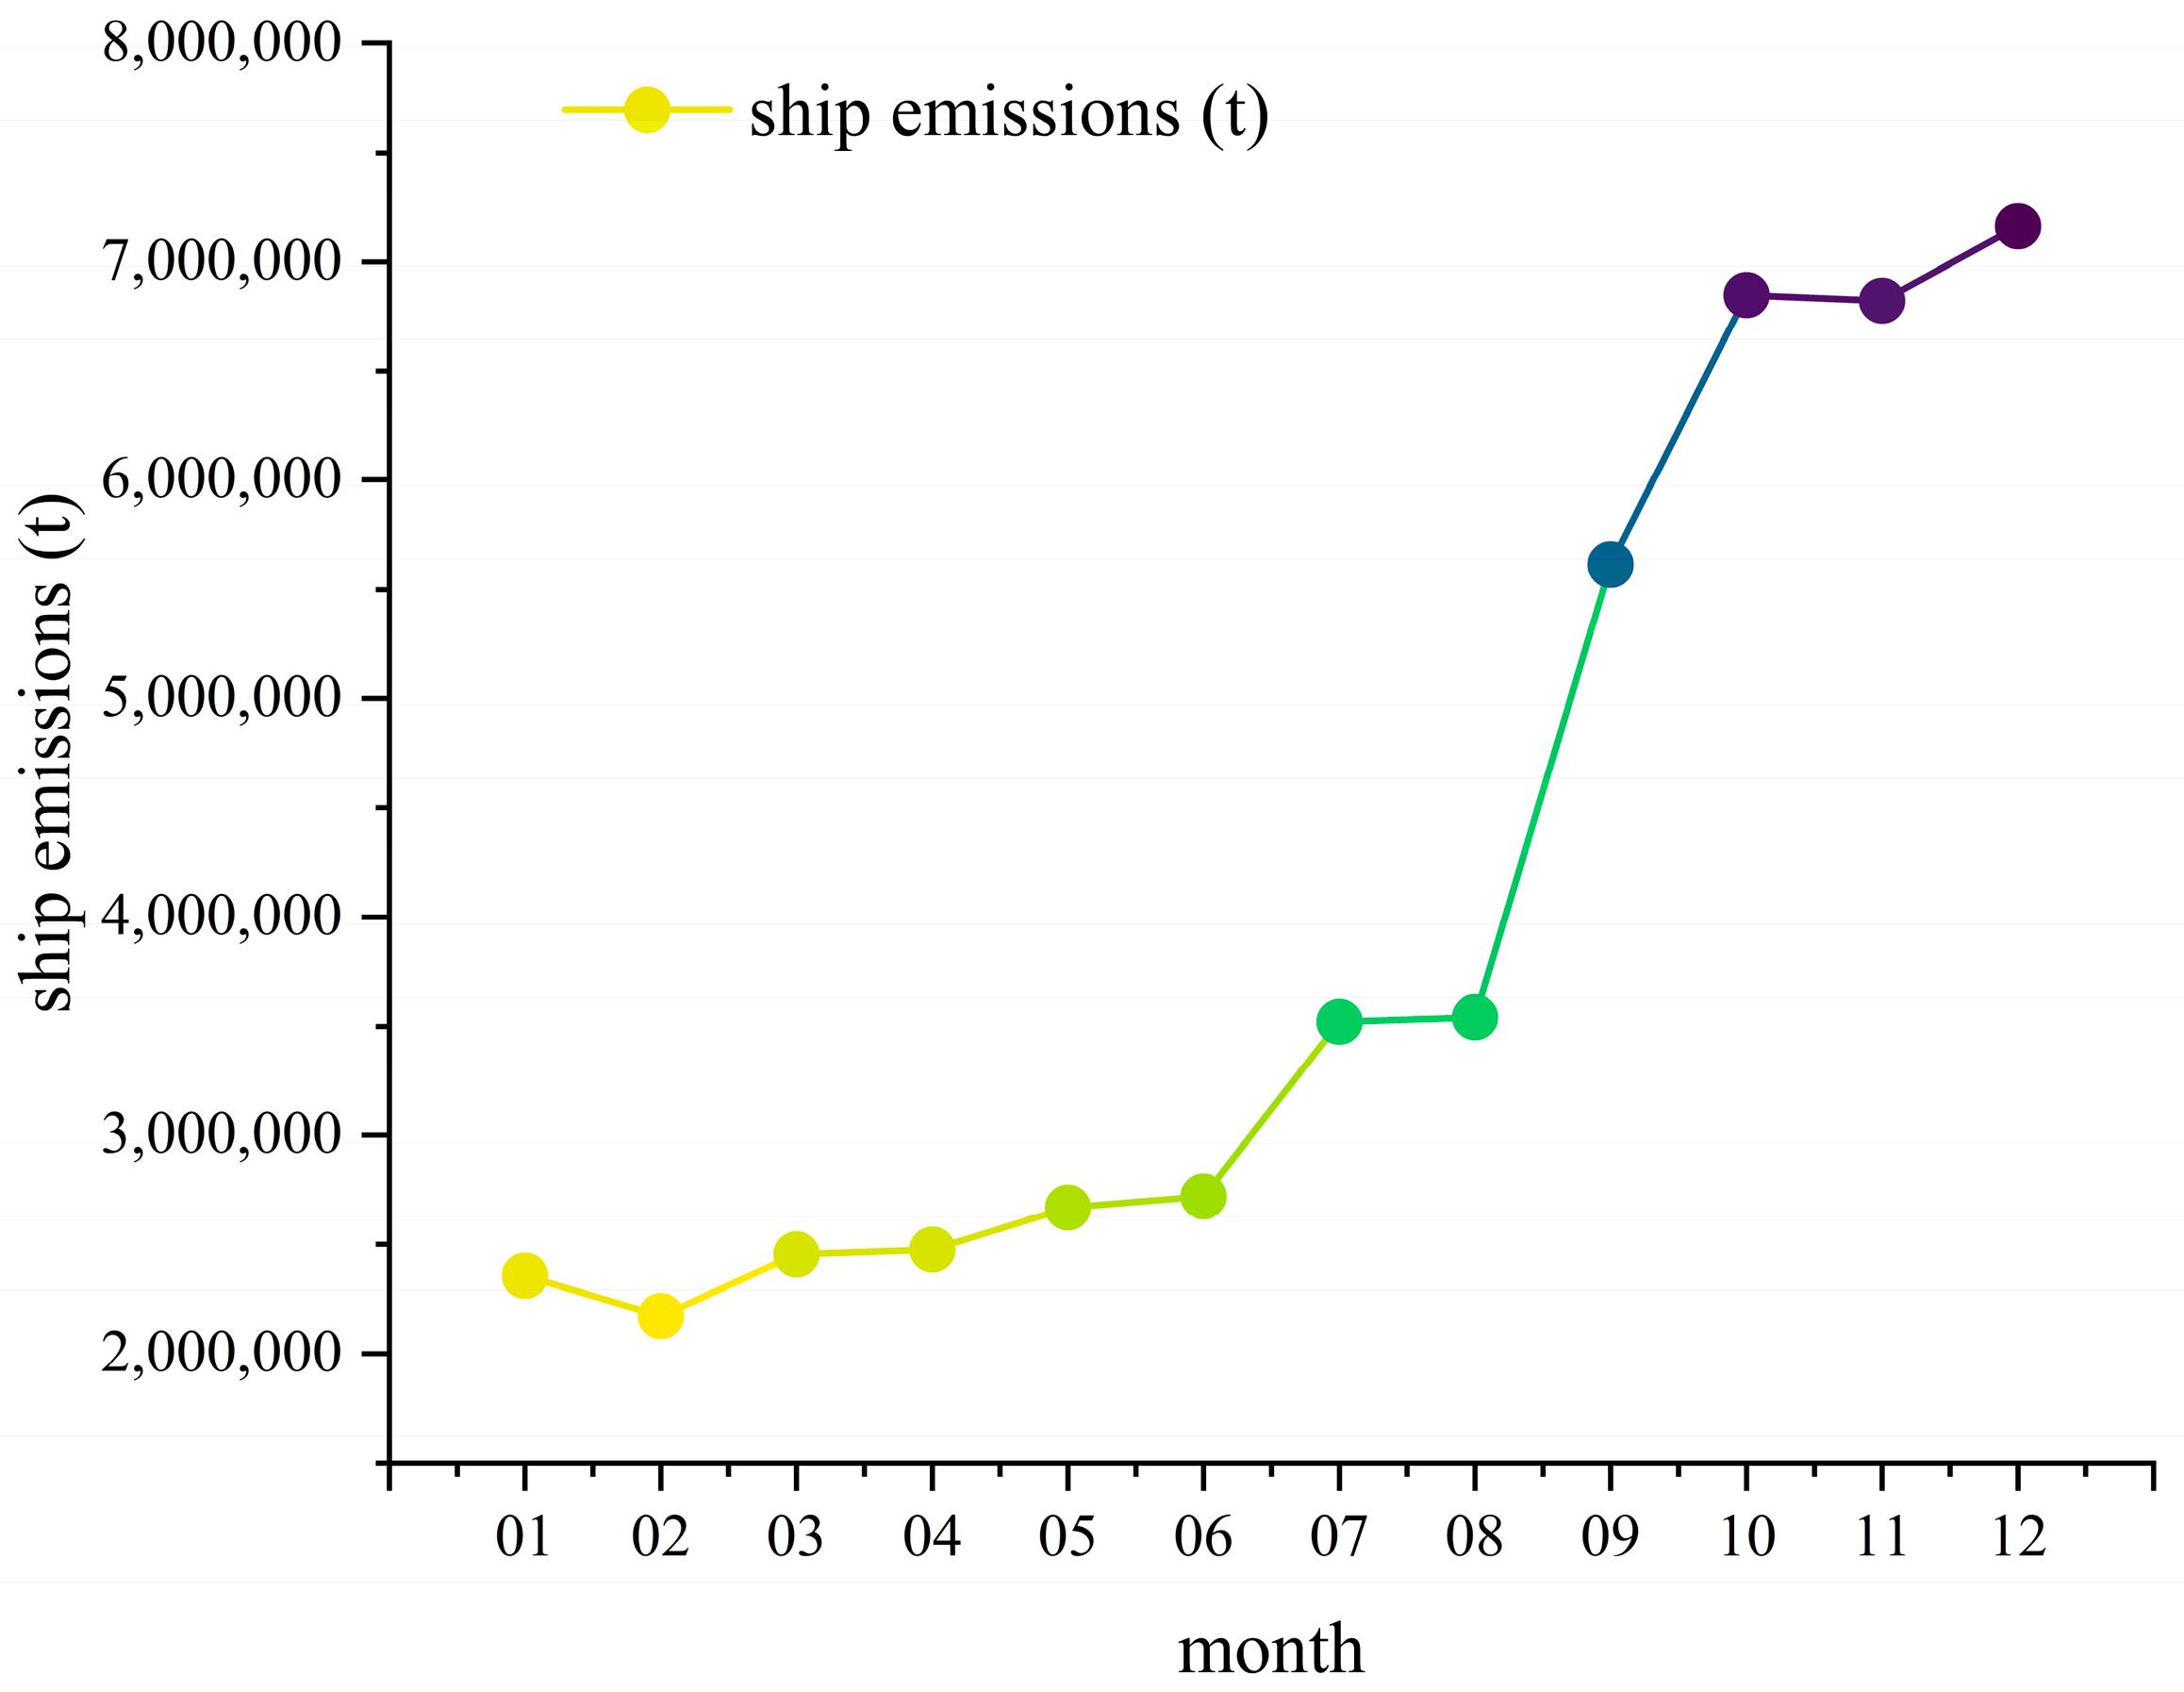
3.3. Monthly Distribution Characteristics of Ship Emissions
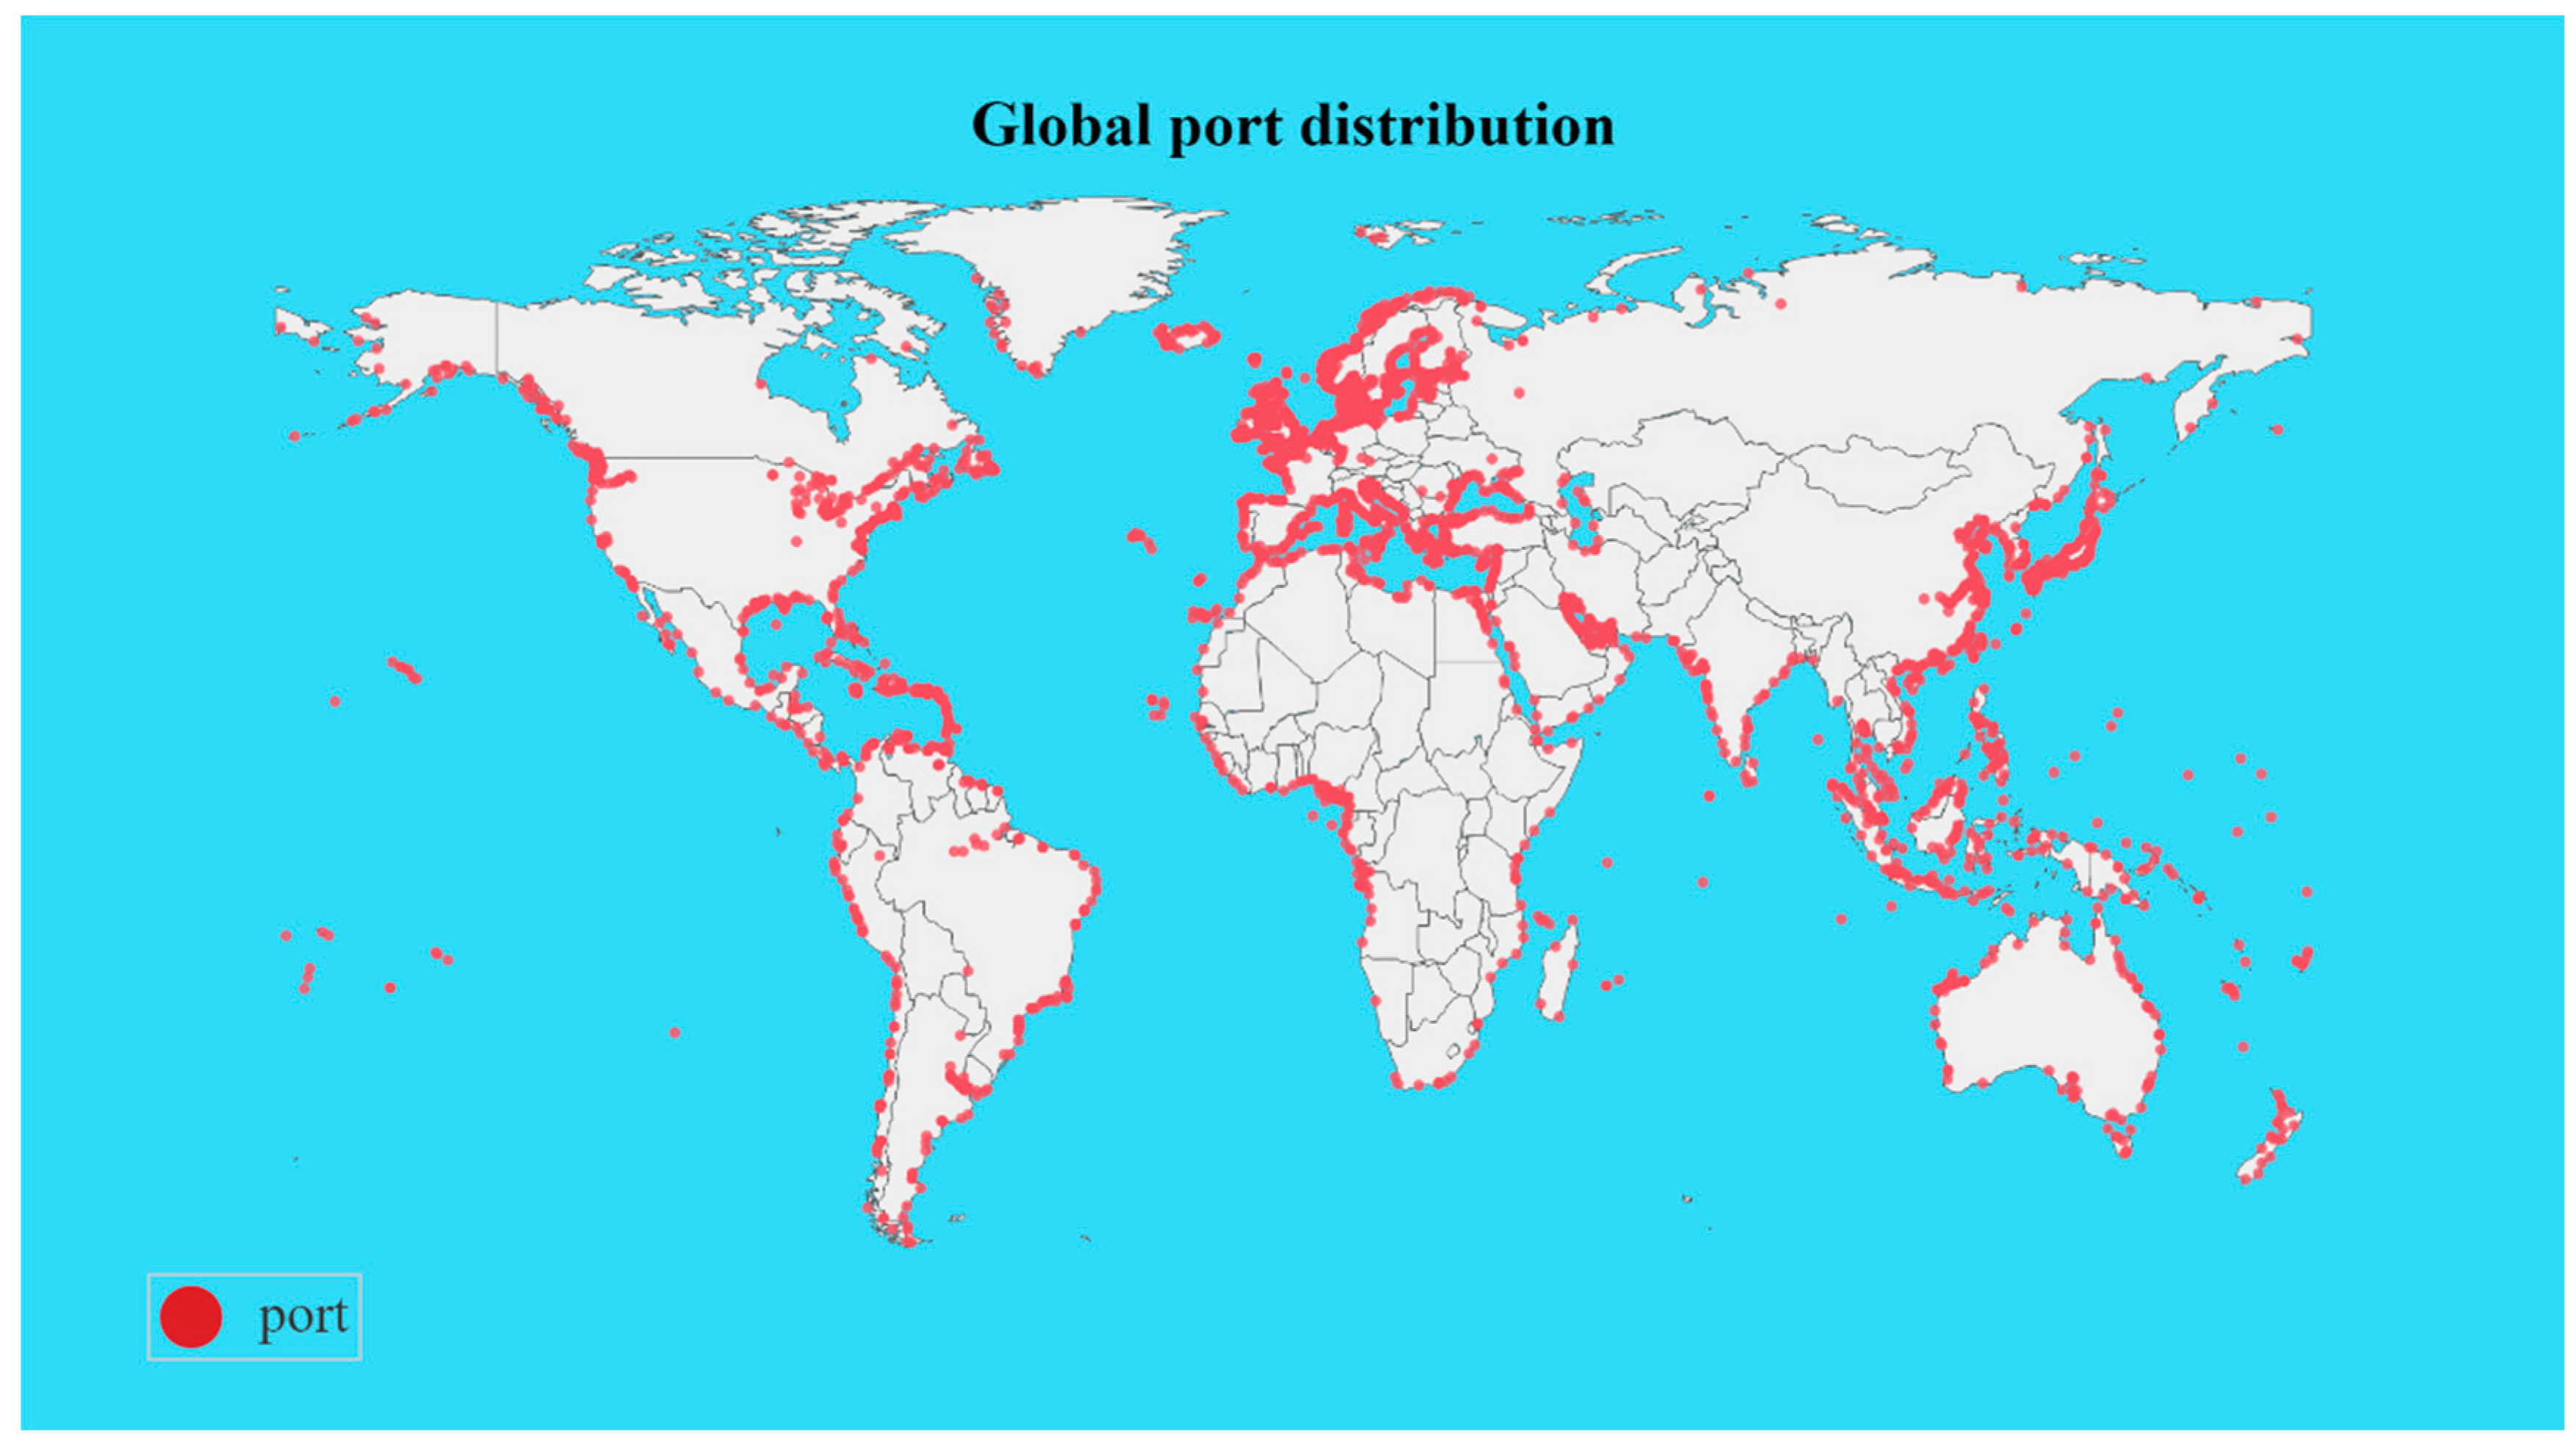
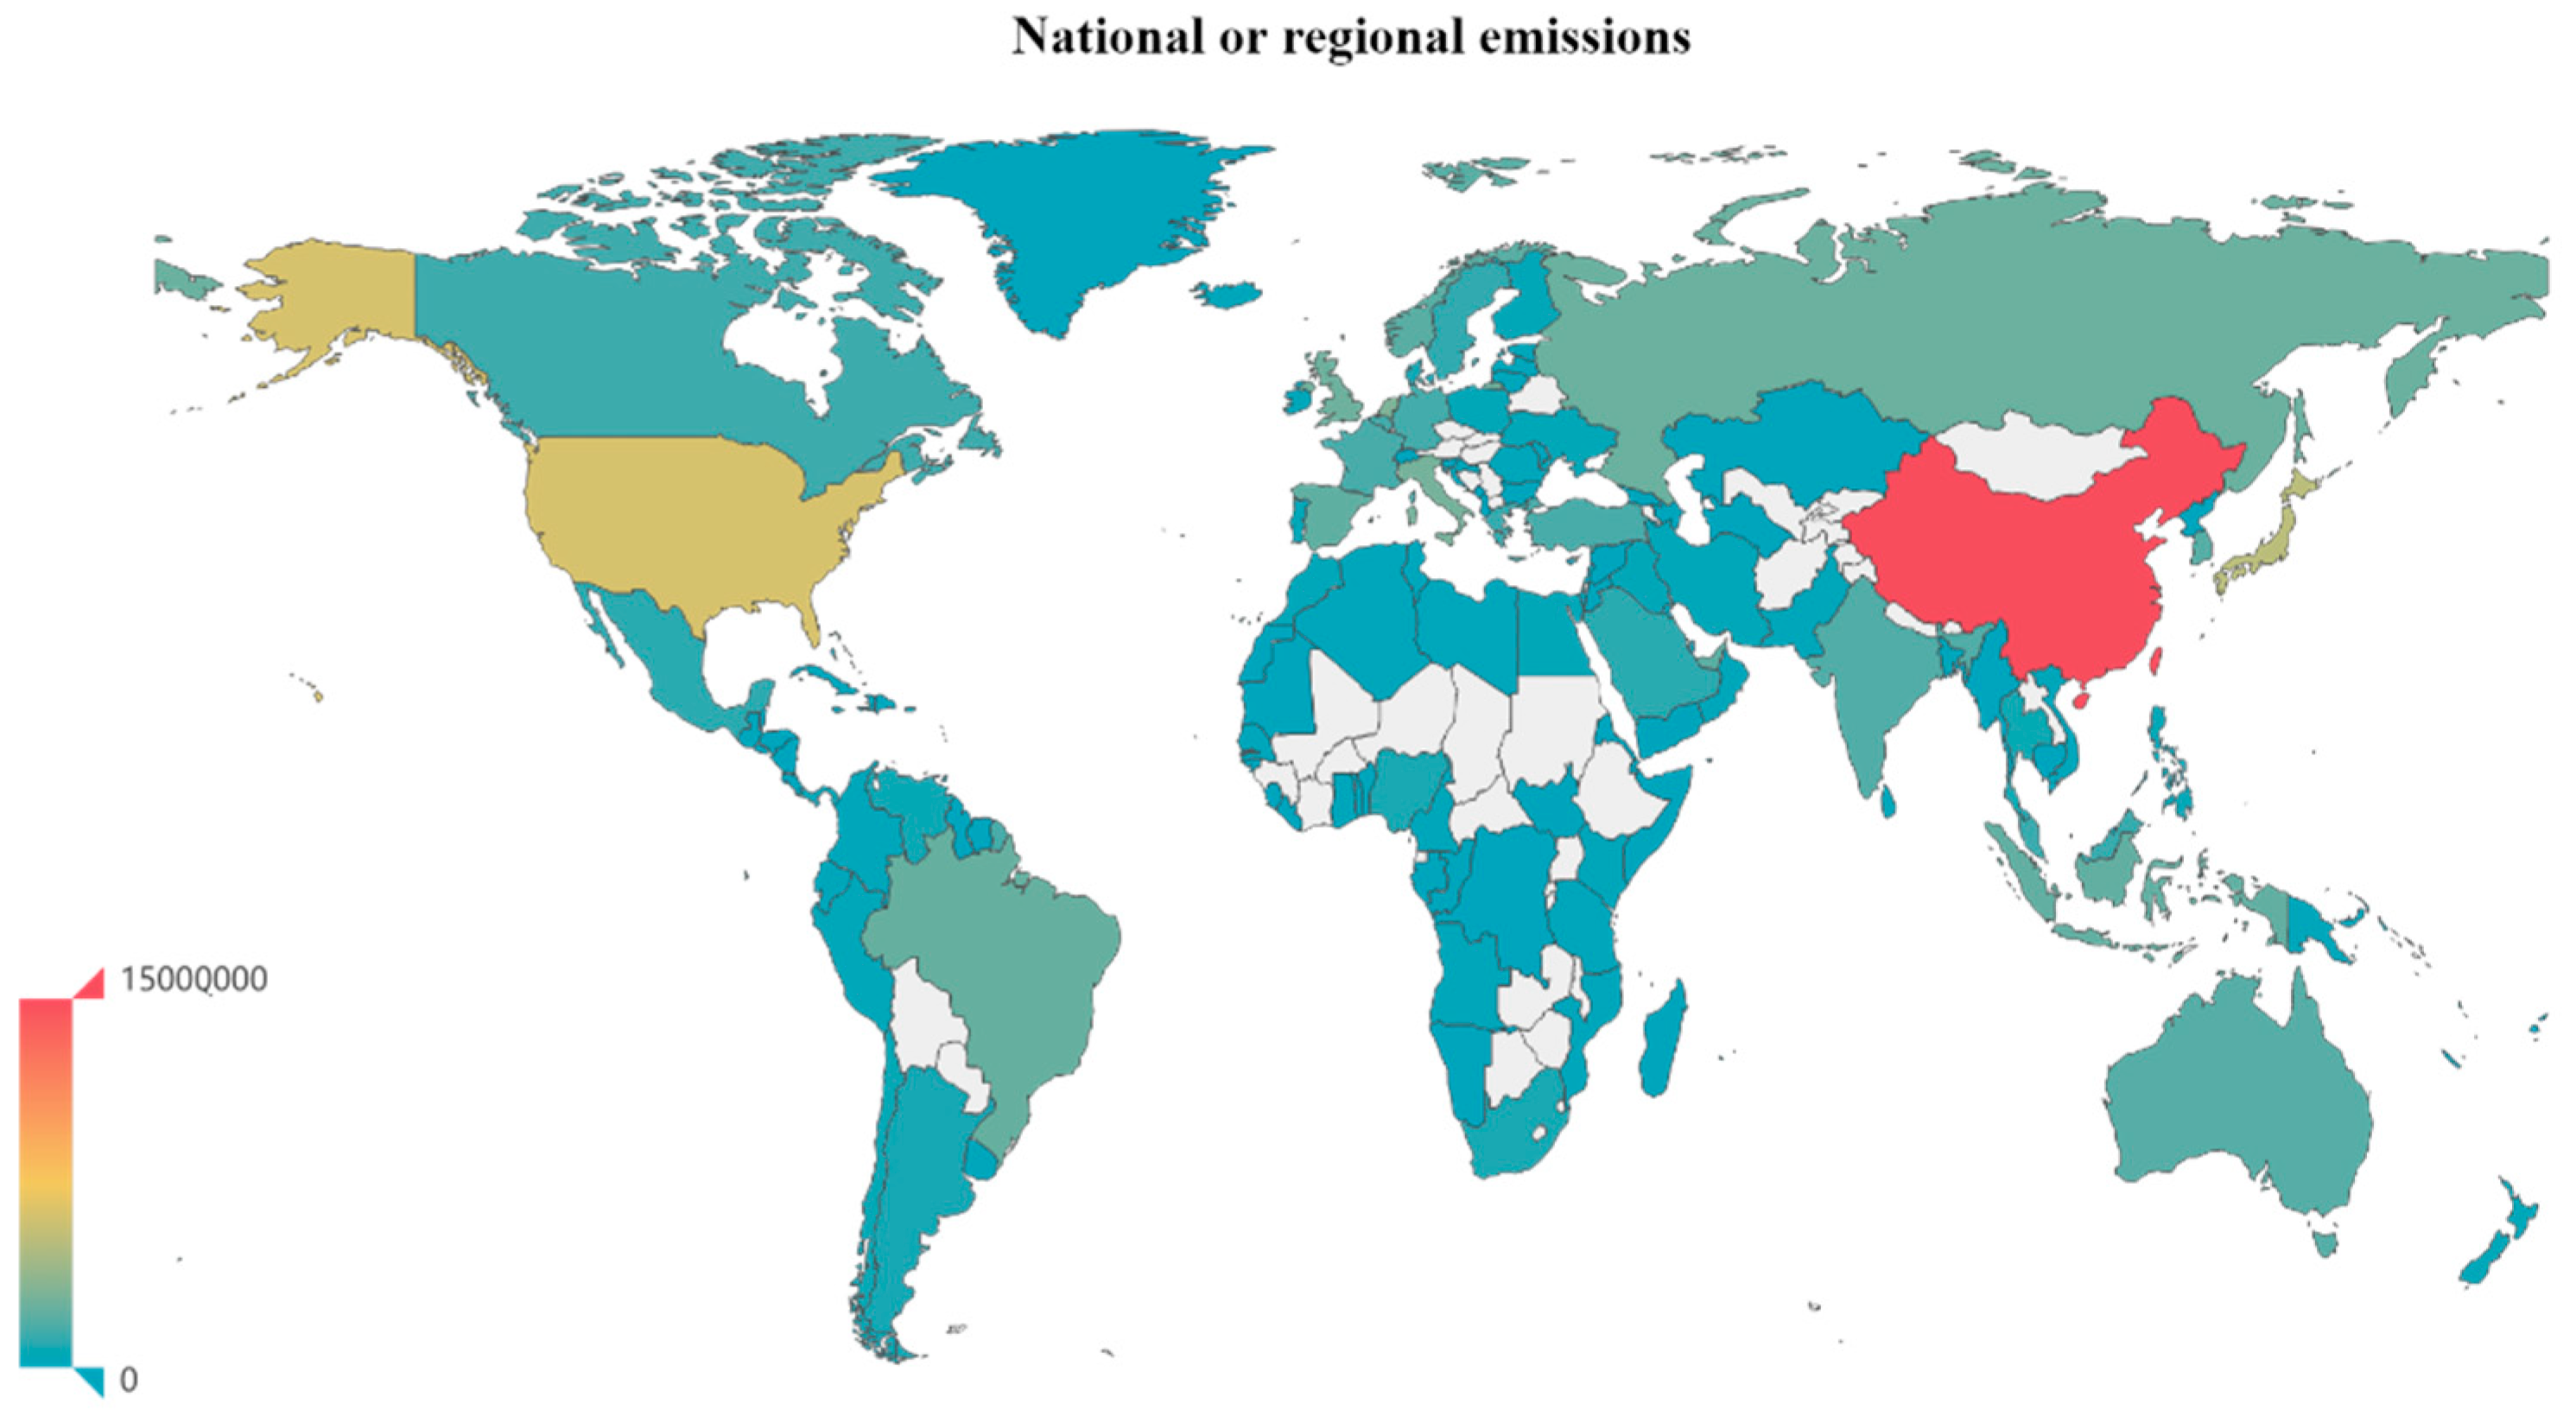
3.4. Emissions from Ports in Different Countries or Regions of the World
4. Conclusions
Supplementary Materials
Author Contributions
Funding
Institutional Review Board Statement
Informed Consent Statement
Data Availability Statement
Conflicts of Interest
References
- Sirimanne, S.N.; Juan, W.; Asariotis, R.; Assaf, M.; Ayala, G.; Benamara, H.; Youssef, F. Review of Maritime Transport 2019; International Maritime Organization: London, UK, 2019. [Google Scholar]
- Tichavska, M.; Tovar, B. Port-city exhaust emission model: An application to cruise and ferry operations in Las Palmas Port. Transp. Res. Part A Policy Pract. 2015, 78, 347–360. [Google Scholar] [CrossRef]
- Christodoulou, A.; Gonzalez-Aregall, M.; Linde, T.; Vierth, I.; Cullinane, K. Targeting the reduction of shipping emissions to air. Marit. Bus. Rev. 2019, 4, 16–30. [Google Scholar] [CrossRef]
- Cullinane, K.; Tseng, P.H.; Wilmsmeier, G. Estimation of container ship emissions at berth in Taiwan. Int. J. Sustain. Transp. 2016, 10, 466–474. [Google Scholar] [CrossRef]
- Tai, H.-H.; Chang, Y.-H. Reducing pollutant emissions from vessel maneuvering in port areas. Marit. Econ. Logist. 2022, 24, 651–671. [Google Scholar] [CrossRef]
- Faber, J.; Hanayama, S.; Zhang, S.; Pereda, P.; Comer, B.; Hauerhof, E.; Yuan, H. Fourth IMO GHG Study; International Maritime Organization: London, UK, 2020. [Google Scholar]
- Kalli, J.; Jalkanen, J.-P.; Johansson, L.; Repka, S. Atmospheric emissions of European SECA shipping: Long-term projections. WMU J. Marit. Aff. 2013, 12, 129–145. [Google Scholar] [CrossRef]
- Serra, P.; Fancello, G. Toward the IMO’s GHG Goals: A Critical Overview of the Perspectives and Challenges of the Main Options for Decarbonizing International Shipping. Sustainability 2020, 12, 3220. [Google Scholar] [CrossRef]
- Budiyanto, M.; Huzaifi, M.; Sirait, S. Estimating CO2 Emissions in a Container Port based on Modality Movement in the Terminal Area. Int. J. Technol. 2019, 10, 1618. [Google Scholar] [CrossRef]
- Zheng, C.; Hoffmann, M.R.; Mauzerall, D.L.; Gan, J.; Song, L. Expanding our horizons on the Earth’s sustainable future. Sustain. Horiz. 2021, 1, 100001. [Google Scholar] [CrossRef]
- Corbett, J.J.; Winebrake, J.J.; Green, E.H.; Kasibhatla, P.; Eyring, V.; Lauer, A. Mortality from Ship Emissions: A Global Assessment. Environ. Sci. Technol. 2007, 41, 8512–8518. [Google Scholar] [CrossRef]
- Liu, H.; Fu, M.; Jin, X.; Shang, Y.; Shindell, D.; Faluvegi, G.; Shindell, C.; He, K. Health and climate impacts of ocean-going vessels in East Asia. Nat. Clim. Chang. 2016, 6, 1037–1041. [Google Scholar] [CrossRef]
- Liu, Z.; Lu, X.; Feng, J.; Fan, Q.; Zhang, Y.; Yang, X. Influence of Ship Emissions on Urban Air Quality: A Comprehensive Study Using Highly Time-Resolved Online Measurements and Numerical Simulation in Shanghai. Environ. Sci. Technol. 2017, 51, 202–211. [Google Scholar] [CrossRef] [PubMed]
- Fan, Q.; Zhang, Y.; Ma, W.; Ma, H.; Feng, J.; Yu, Q.; Yang, X.; Ng, S.K.W.; Fu, Q.; Chen, L. Spatial and Seasonal Dynamics of Ship Emissions over the Yangtze River Delta and East China Sea and Their Potential Environmental Influence. Environ. Sci. Technol. 2016, 50, 1322–1329. [Google Scholar] [CrossRef] [PubMed]
- Feng, J.; Zhang, Y.; Li, S.; Mao, J.; Patton, A.P.; Zhou, Y.; Ma, W.; Liu, C.; Kan, H.; Huang, C.; et al. The influence of spatiality on shipping emissions, air quality and potential human exposure in the Yangtze River Delta/Shanghai, China. Atmos. Chem. Phys. 2019, 19, 6167–6183. [Google Scholar] [CrossRef]
- Deniz, C.; Kilic, A.; Cıvkaroglu, G. Estimation of shipping emissions in Candarli Gulf, Turkey. Environ. Monit. Assess. 2010, 171, 219–228. [Google Scholar] [CrossRef]
- Tzannatos, E. Ship emissions and their externalities for the port of Piraeus—Greece. Atmos. Environ. 2010, 44, 400–407. [Google Scholar] [CrossRef]
- Ng, S.K.W.; Loh, C.; Lin, C.; Booth, V.; Chan, J.W.M.; Yip, A.C.K.; Li, Y.; Lau, A.K.H. Policy change driven by an AIS-assisted marine emission inventory in Hong Kong and the Pearl River Delta. Atmos. Environ. 2013, 76, 102–112. [Google Scholar] [CrossRef]
- Kiliç, A.; Deniz, C. Inventory of shipping emissions in Izmit Gulf, Turkey. Environ. Prog. Sustain. Energy 2010, 29, 221–232. [Google Scholar] [CrossRef]
- Song, S. Ship emissions inventory, social cost and eco-efficiency in Shanghai Yangshan port. Atmos. Environ. 2014, 82, 288–297. [Google Scholar] [CrossRef]
- Chen, D.; Wang, X.; Nelson, P.; Li, Y.; Zhao, N.; Zhao, Y.; Lang, J.; Zhou, Y.; Guo, X. Ship emission inventory and its impact on the PM2.5 air pollution in Qingdao Port, North China. Atmos. Environ. 2017, 166, 351–361. [Google Scholar] [CrossRef]
- Lee, H.; Pham, H.T.; Chen, M.W.; Choo, S. Bottom-Up Approach Ship Emission Inventory in Port of Incheon Based on VTS Data. J. Adv. Transp. 2021, 2021, 5568777. [Google Scholar] [CrossRef]
- Li, C.; Yuan, Z.; Ou, J.; Fan, X.; Ye, S.; Xiao, T.; Shi, Y.; Huang, Z.; Ng, S.K.W.; Zhong, Z.; et al. An AIS-based high-resolution ship emission inventory and its uncertainty in Pearl River Delta region, China. Sci. Total Environ. 2016, 573, 1–10. [Google Scholar] [CrossRef] [PubMed]
- Goldsworthy, B.; Enshaei, H.; Jayasinghe, S. Comparison of large-scale ship exhaust emissions across multiple resolutions: From annual to hourly data. Atmos. Environ. 2019, 214, 116829. [Google Scholar] [CrossRef]
- Goldsworthy, L.; Goldsworthy, B. Modeling of ship engine exhaust emissions in ports and extensive coastal waters based on terrestrial AIS data—An Australian case study. Environ. Model. Softw. 2015, 63, 45–60. [Google Scholar] [CrossRef]
- Jalkanen, J.P.; Brink, A.; Kalli, J.; Pettersson, H.; Kukkonen, J.; Stipa, T. A modeling system for the exhaust emissions of marine traffic and its application in the Baltic Sea area. Atmos. Chem. Phys. 2009, 9, 9209–9223. [Google Scholar] [CrossRef]
- Jalkanen, J.P.; Johansson, L.; Kukkonen, J.; Brink, A.; Kalli, J.; Stipa, T. Extension of an assessment model of ship traffic exhaust emissions for particulate matter and carbon monoxide. Atmos. Chem. Phys. 2012, 12, 2641–2659. [Google Scholar] [CrossRef]
- Johansson, L.; Jalkanen, J.P.; Kukkonen, J. Global assessment of shipping emissions in 2015 on a high spatial and temporal resolution. Atmos. Environ. 2017, 167, 403–415. [Google Scholar] [CrossRef]
- Peng, X.; Wen, Y.; Wu, L.; Xiao, C.; Zhou, C.; Han, D. A sampling method for calculating regional ship emission inventories. Transp. Res. Part D Transp. Environ. 2020, 89, 102617. [Google Scholar] [CrossRef]
- Wan, Z.; Zhang, Q.; Xu, Z.P.; Chen, J.H.; Wang, Q. Impact of emission control areas on atmospheric pollutant emissions from major ocean-going ships entering the Shanghai Port, China. Mar. Pollut. Bull. 2019, 142, 525–532. [Google Scholar] [CrossRef]
- Weng, J.X.; Shi, K.; Gan, X.F.; Li, G.R.; Huang, Z. Ship emission estimation with high spatial-temporal resolution in the Yangtze River estuary using AIS data. J. Clean. Prod. 2020, 248, 119297. [Google Scholar] [CrossRef]
- Dalsoren, S.B.; Eide, M.S.; Endresen, O.; Mjelde, A.; Gravir, G.; Isaksen, I.S.A. Update on emissions and environmental impacts from the international fleet of ships: The contribution from major ship types and ports. Atmos. Chem. Phys. 2009, 9, 2171–2194. [Google Scholar] [CrossRef]
- Miola, A.; Ciuffo, B. Estimating air emissions from ships: Meta-analysis of modelling approaches and available data sources. Atmos. Environ. 2011, 45, 2242–2251. [Google Scholar] [CrossRef]
- Corbett, J.J.; Fischbeck, P.S.; Pandis, S.N. Global nitrogen and sulfur inventories for oceangoing ships. J. Geophys. Res.-Atmos. 1999, 104, 3457–3470. [Google Scholar] [CrossRef]
- Endresen, O.; Sorgard, E.; Behrens, H.L.; Brett, P.O.; Isaksen, I.S.A. A historical reconstruction of ships’ fuel consumption and emissions. J. Geophys. Res.-Atmos. 2007, 112, D12301. [Google Scholar] [CrossRef]
- Jin, T.-S.; Yin, X.-G.; Xu, J.; Yang, L.; Ge, W.-H.; Ju, M.-T. Air pollutants emission inventory from commercial ships of Tianjin Harbor. Mar. Environ. Sci. 2009, 28. [Google Scholar] [CrossRef]
- Eyring, V.; Isaksen, I.S.A.; Berntsen, T.; Collins, W.J.; Corbett, J.J.; Endresen, O.; Grainger, R.G.; Moldanova, J.; Schlager, H.; Stevenson, D.S. Transport impacts on atmosphere and climate: Shipping. Atmos. Environ. 2010, 44, 4735–4771. [Google Scholar] [CrossRef]
- Yang, L.; Zhang, Q.; Zhang, Y.; Lv, Z.; Wang, Y.; Wu, L.; Feng, X.; Mao, H. An AIS-based emission inventory and the impact on air quality in Tianjin port based on localized emission factors. Sci. Total Environ. 2021, 783, 146869. [Google Scholar] [CrossRef] [PubMed]
- Yang, J.; Yin, P.L.; Ye, S.Q.; Wang, S.S.; Zheng, J.Y.; Ou, J.M. Marine Emission Inventory and Its Temporal and Spatial Characteristics in the City of Shenzhen. Huan Jing Ke Xue 2015, 36, 1217–1226. [Google Scholar]
- Winther, M.; Christensen, J.H.; Plejdrup, M.S.; Ravn, E.S.; Eriksson, Ó.F.; Kristensen, H.O. Emission inventories for ships in the arctic based on satellite sampled AIS data. Atmos. Environ. 2014, 91, 1–14. [Google Scholar] [CrossRef]
- Mao, J.; Zhang, Y.; Yu, F.; Chen, J.; Sun, J.; Wang, S.; Zou, Z.; Zhou, J.; Yu, Q.; Ma, W.; et al. Simulating the impacts of ship emissions on coastal air quality: Importance of a high-resolution emission inventory relative to cruise- and land-based observations. Sci. Total Environ. 2020, 728, 138454. [Google Scholar] [CrossRef]
- Zhang, Y.; Fung, J.C.H.; Chan, J.W.M.; Lau, A.K.H. The significance of incorporating unidentified vessels into AIS-based ship emission inventory. Atmos. Environ. 2019, 203, 102–113. [Google Scholar] [CrossRef]
- Chen, D.; Zhao, Y.; Nelson, P.; Li, Y.; Wang, X.; Zhou, Y.; Lang, J.; Guo, X. Estimating ship emissions based on AIS data for port of Tianjin, China. Atmos. Environ. 2016, 145, 10–18. [Google Scholar] [CrossRef]
- Starcrest Consulting Group, LLC. Port of Los Angeles Inventory of Air Emissions—2021. Available online: https://kentico.portoflosangeles.org/getmedia/f26839cd-54cd-4da9-92b7-a34094ee75a8/2021_air_emissions_inventory (accessed on 7 August 2024).
- IHS. StatCode 5 Shiptype Coding System. Available online: https://www.poseidonprinciples.org/finance/wp-content/uploads/2020/06/StatCode-5-Shiptype-Coding-System.pdf (accessed on 25 August 2024).
- EMSA. The 2021 World Merchant Fleet Statistics from Equasis; EMSA: Lisbon, Portugal, 2022. [Google Scholar]
- Schwarzkopf, D.; Petrik, R.; Matthias, V.; Quante, M.; Majamäki, E.; Jalkanen, J.-P. A ship emission modeling system with scenario capabilities. Atmos. Environ. X 2021, 12, 100132. [Google Scholar] [CrossRef]
- Smith, T.; Jalkanen, J.-P.; Anderson, B.A.; Corbett, J.J.; Faber, J.; Hanayama, S.; O’Keeffe, E.; Parker, S.; Johansson, L.; Aldous, L.; et al. Third IMO Greenhouse Gas Study 2014; International Maritime Organization: London, UK, 2015. [Google Scholar]
- Styhre, L.; Winnes, H.; Black, J.; Lee, J.; Le-Griffin, H. Greenhouse gas emissions from ships in ports Case studies in four continents. Transp. Res. Part D Transp. Environ. 2017, 54, 212–224. [Google Scholar] [CrossRef]
- Goldsworthy, B.; Goldsworthy, L. Assigning machinery power values for estimating ship exhaust emissions: Comparison of auxiliary power schemes. Sci. Total Environ. 2019, 657, 963–977. [Google Scholar] [CrossRef] [PubMed]
- Buhaug, Ø.; Corbett, J.J.; Endresen, Ø.; Eyring, V.; Faber, J.; Hanayama, S.; Lee, D.S.; Lee, D.; Lindstad, H.; Markowska, A.Z. Second Imo Ghg Study 2009; International Maritime Organization (IMO): London, UK, 2009; Volume 20. [Google Scholar]
- Starcrest Consulting Group, LLC. Port of Los Angeles Inventory of Air Emissions—2013. Available online: https://kentico.portoflosangeles.org/getmedia/9b47cda9-e282-458e-9a80-36b17e79c47c/2013_Air_Emissions_Inventory_Full_Report (accessed on 7 August 2024).
- USEPA. Ports Emissions Inventory Guidance: Methodologies for Estimating Port-Related and Goods Movement Mobile Source Emissions; USEPA: Washington, DC, USA, 2022. [Google Scholar]
- Winnes, H.; Styhre, L.; Fridell, E. Reducing GHG emissions from ships in port areas. Res. Transp. Bus. Manag. 2015, 17, 73–82. [Google Scholar] [CrossRef]


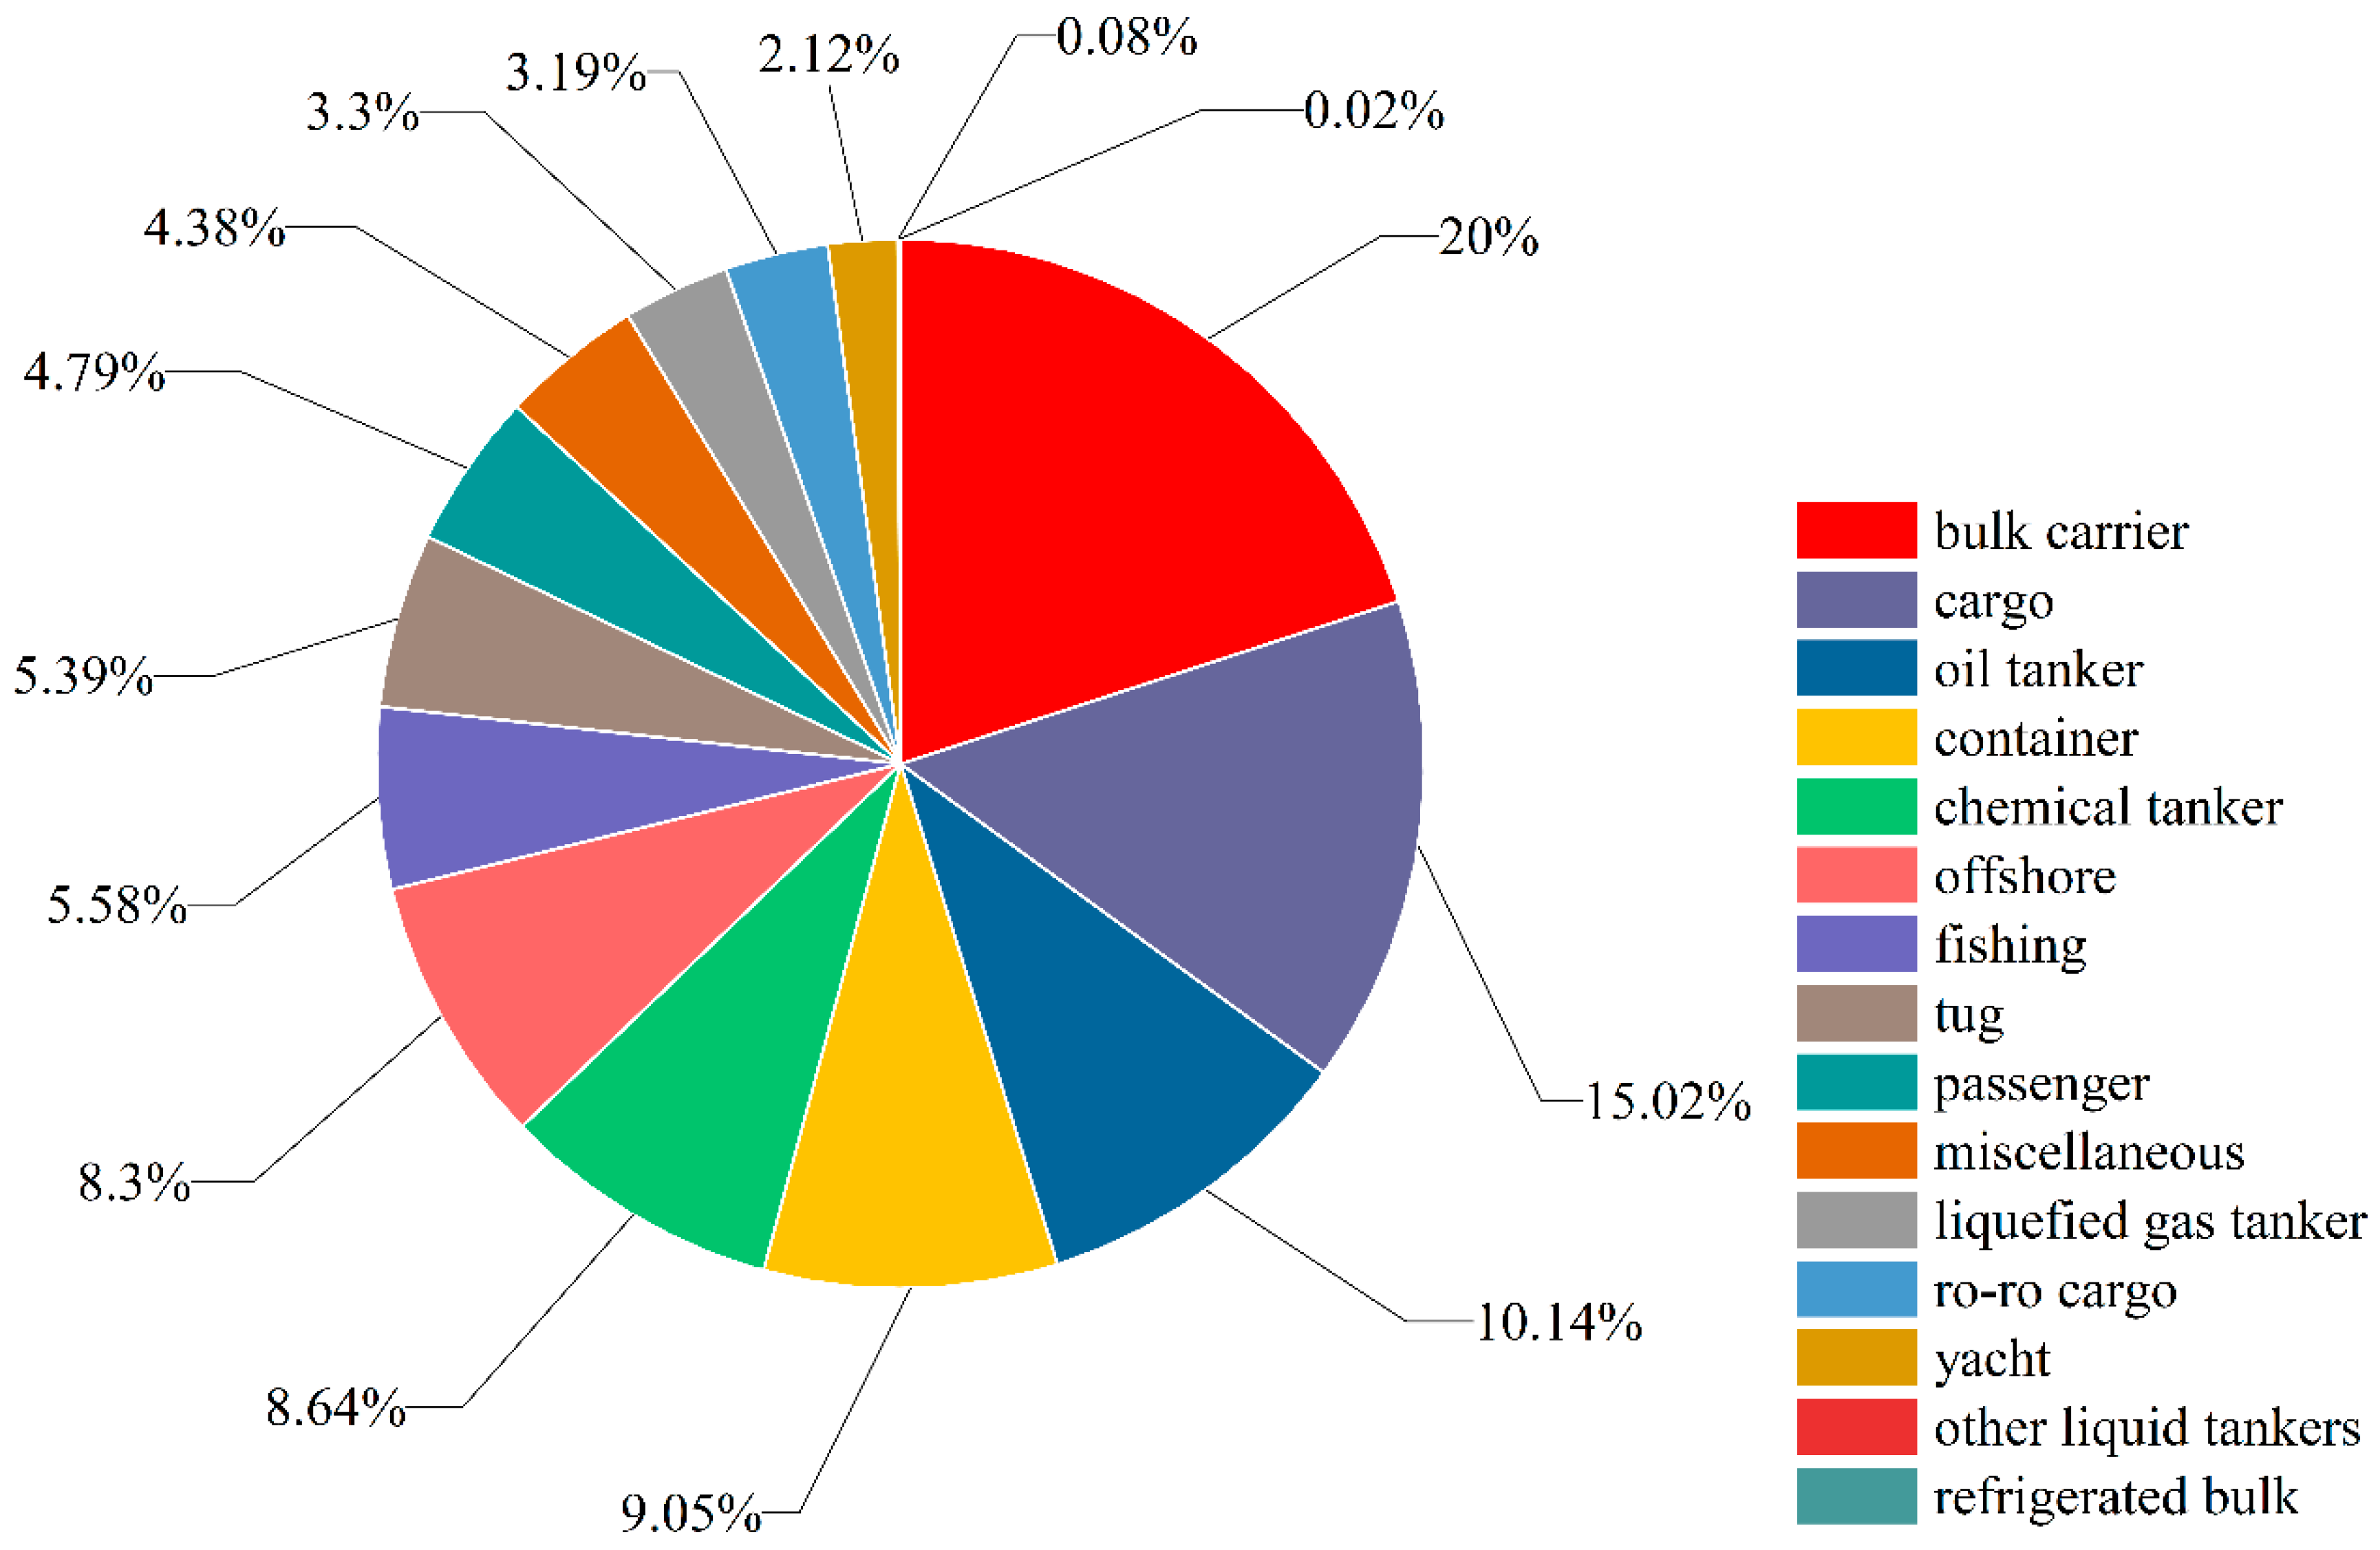
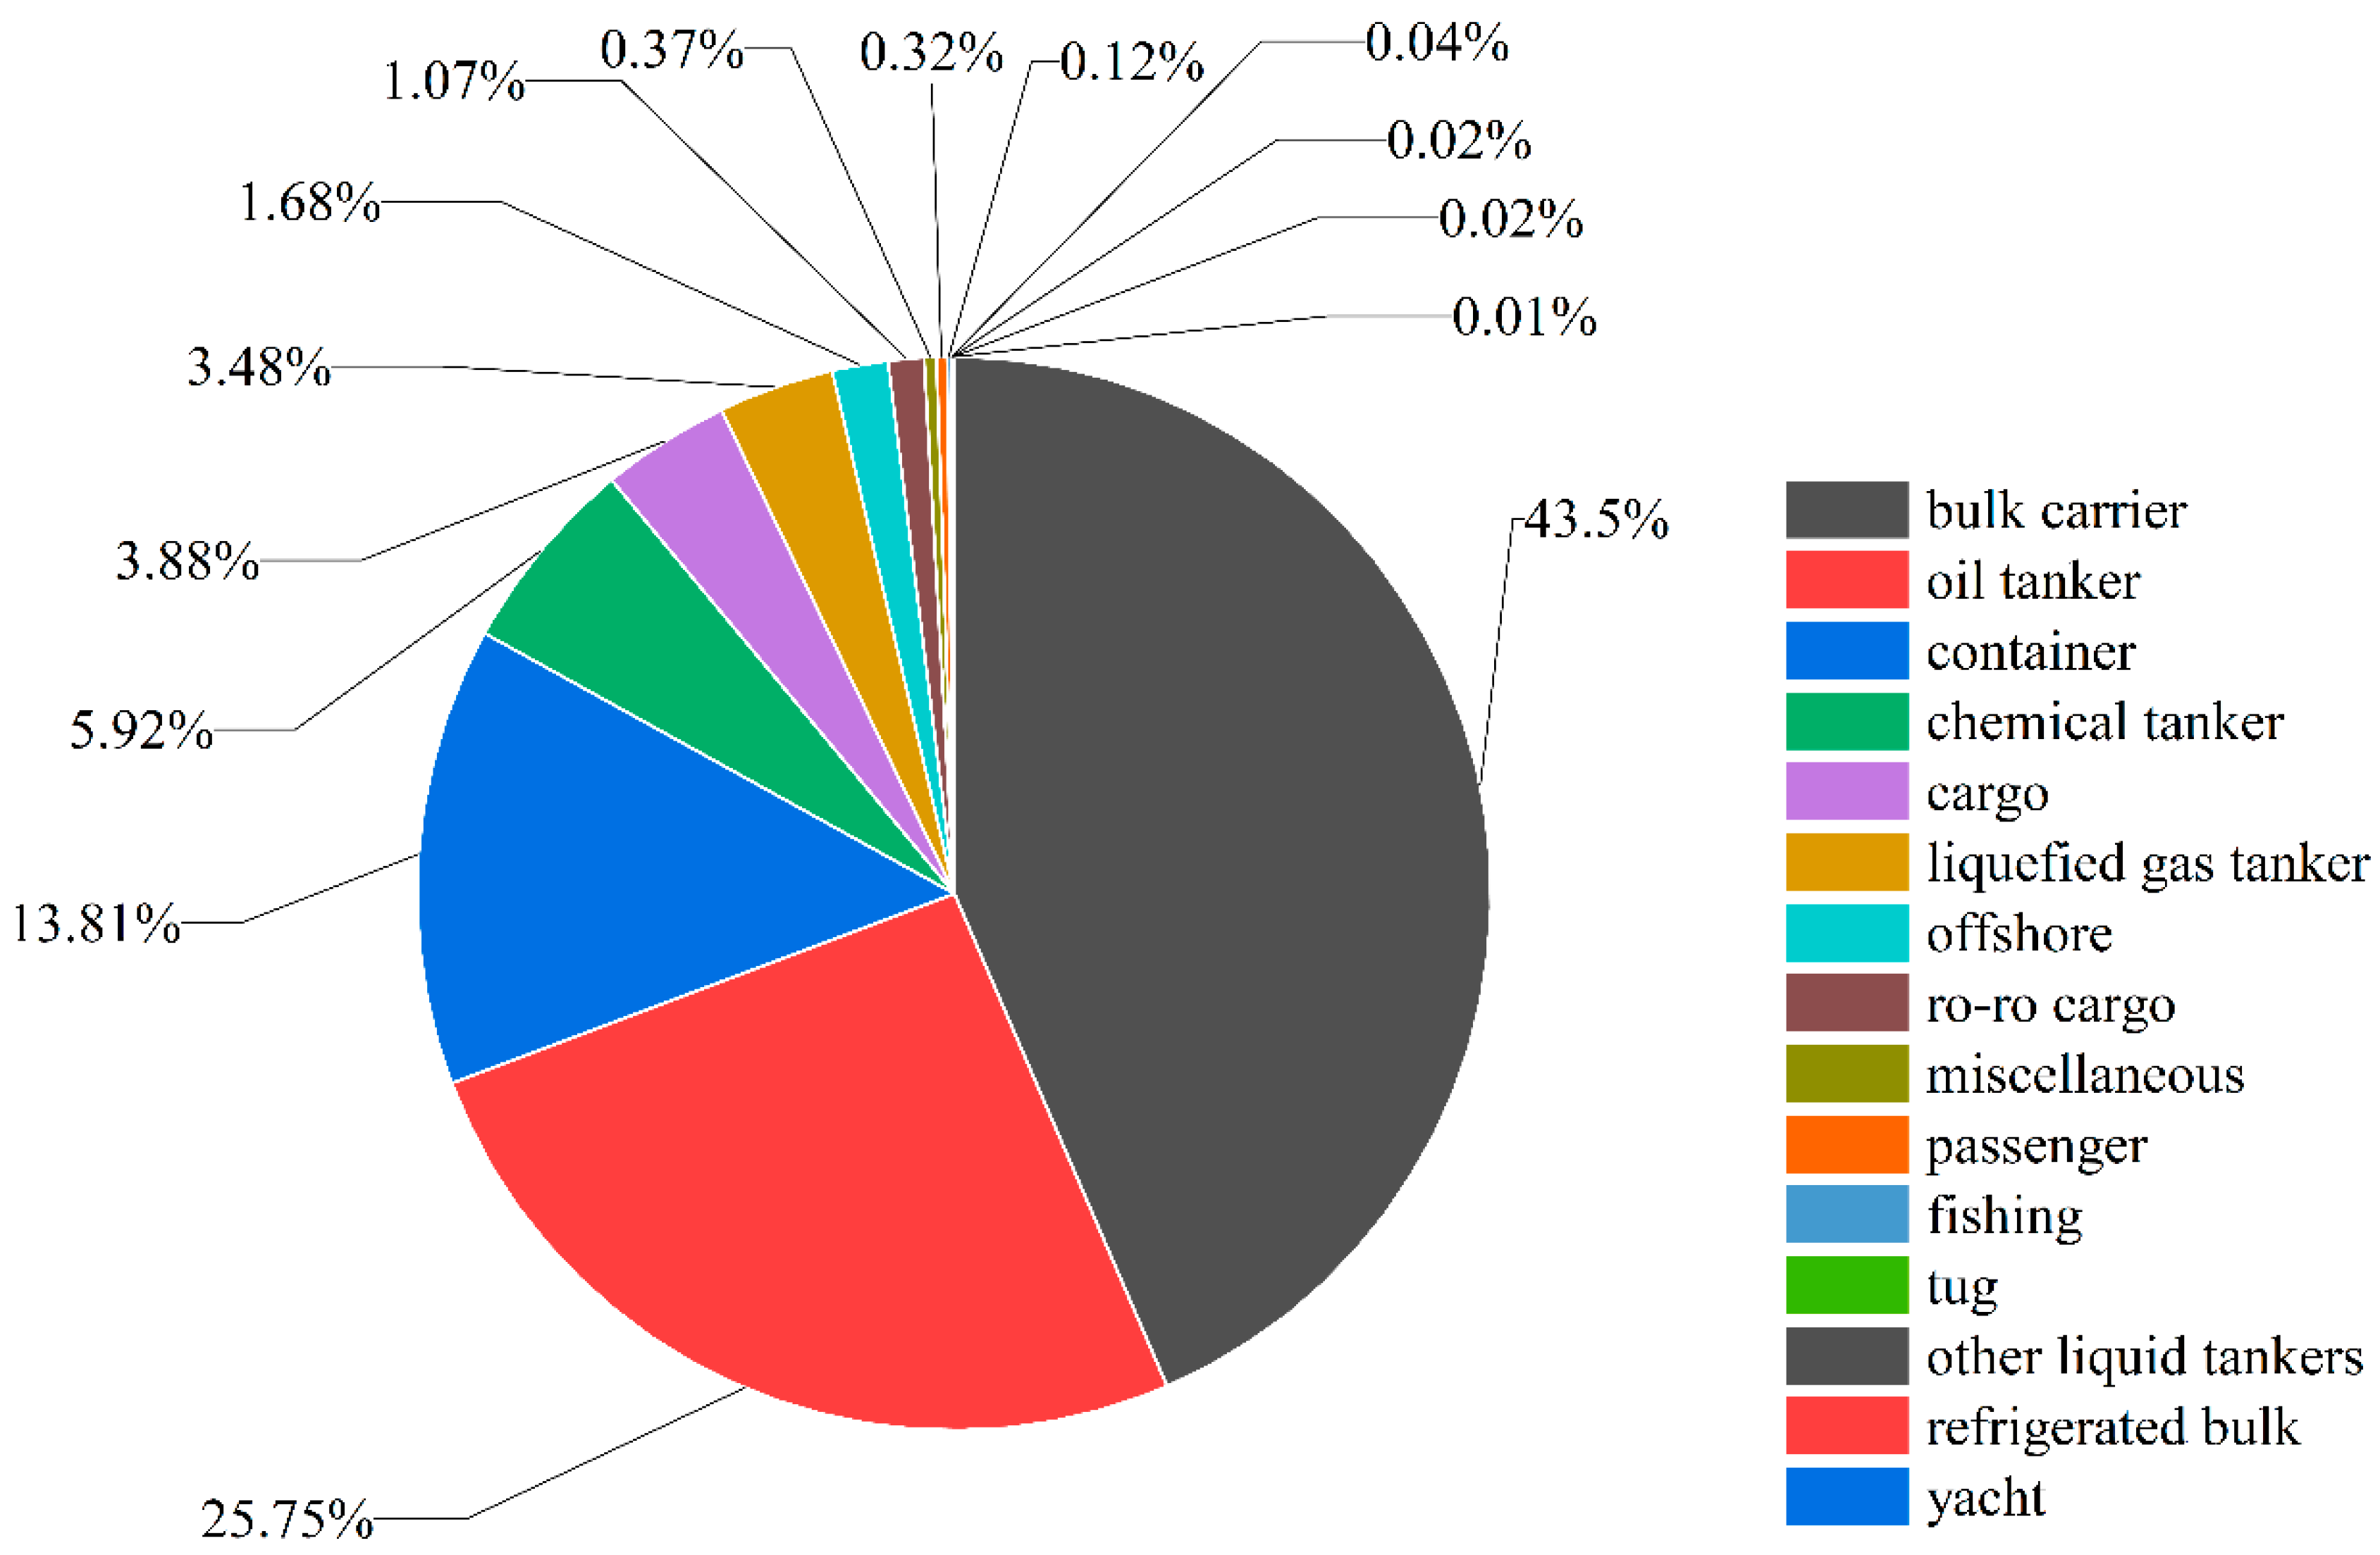
| Ship Category | Count | % | DWT | % |
|---|---|---|---|---|
| Bulk carrier | 10,234 | 20.02% | 7.57 × 10⁸ | 43.50% |
| Oil tanker | 5188 | 10.15% | 4.48 × 10⁸ | 25.75% |
| Container | 4631 | 9.06% | 2.41 × 10⁸ | 13.81% |
| Chemical tanker | 4419 | 8.64% | 1.03 × 10⁸ | 5.92% |
| Cargo | 7685 | 15.03% | 6.75 × 10⁷ | 3.88% |
| Liquefied gas tanker | 1689 | 3.30% | 6.06 × 10⁷ | 3.48% |
| Offshore | 4248 | 8.31% | 2.93 × 10⁷ | 1.68% |
| Ro-ro cargo | 1632 | 3.19% | 1.87 × 10⁷ | 1.07% |
| Miscellaneous | 2243 | 4.39% | 6.47 × 10⁶ | 0.37% |
| Passenger | 2451 | 4.79% | 5.49 × 10⁶ | 0.32% |
| Fishing | 2855 | 5.58% | 2.09 × 10⁶ | 0.12% |
| Tug | 2760 | 5.40% | 7.79 × 10⁵ | 0.04% |
| Other liquid tankers | 40 | 0.08% | 3.45 × 10⁵ | 0.02% |
| Refrigerated bulk | 10 | 0.02% | 2.97 × 10⁵ | 0.02% |
| Yacht | 1084 | 2.12% | 1.79 × 10⁵ | 0.01% |
| Tier | Year of Construction | During the Study Time Period | |
|---|---|---|---|
| Vessel Count | Percentage | ||
| Tier 0 | Pre-2000 | 15,548 | 30.39% |
| Tier I | 2001–2010 | 19,702 | 38.50% |
| Tier II | 2011–2015 | 12,231 | 23.90% |
| Tier III | 2016–+ | 3688 | 7.21% |
| Total | All | 51,169 | 100% |
| Emission Factor | Pollutants | Tier | Auxiliary Engine | Auxiliary Boiler |
|---|---|---|---|---|
| Pollutant emission factor | NOx | Tier0 | 13.8 | 1.97 |
| Tier1 | 12.2 | 1.97 | ||
| Tier2 | 10.5 | 1.97 | ||
| Tier3 | 2.6 | 1.97 | ||
| PM10 | 0.189 | 0.202 | ||
| PM2.5 | 0.174 | 0.186 | ||
| SOx | 0.424 | 0.587 | ||
| CO | 1.1 | 0.2 | ||
| HC | 0.4 | 0.1 | ||
| GHG emission factor | CH4 | 0.008 | 0.002 | |
| N2O | 0.029 | 0.075 | ||
| CO2 | 696 | 962 | ||
| Continents | The Number of Nations or Regions | The Number of Ports |
|---|---|---|
| Asia | 38 | 1095 |
| Europe | 36 | 1424 |
| North America | 39 | 649 |
| South America | 13 | 285 |
| Africa | 41 | 266 |
| Oceania | 21 | 192 |
| Antarctica | 1 | 1 |
| Total | 189 | 3912 |
| Port | Emissions (t) | Percentage |
|---|---|---|
| Singapore | 1,586,504 | 3.41% |
| Rotterdam | 949,312 | 2.04% |
| Antwerp | 525,457 | 1.13% |
| Houston | 451,970 | 0.97% |
| Ningbo | 369,104 | 0.79% |
| Tianjin | 335,465 | 0.72% |
| Guangzhou | 323,253 | 0.69% |
| Kaohsiung | 283,109 | 0.61% |
| Shanghai | 273,988 | 0.59% |
| Qingdao | 267,974 | 0.58% |
| Continents | Number of Countries | Total Emissions (t) | Proportion |
|---|---|---|---|
| Asia | 38 | 21,165,597 | 45.52% |
| Europe | 36 | 12,771,986 | 27.47% |
| North American | 39 | 5,458,200 | 11.74% |
| South American | 13 | 2,922,005 | 6.28% |
| Africa | 41 | 2,838,800 | 6.10% |
| Oceania | 21 | 1,345,437 | 2.89% |
| Antarctica | 1 | 18 | 0.00% |
| Total | 189 | 46,502,043 | 100.00% |
Disclaimer/Publisher’s Note: The statements, opinions and data contained in all publications are solely those of the individual author(s) and contributor(s) and not of MDPI and/or the editor(s). MDPI and/or the editor(s) disclaim responsibility for any injury to people or property resulting from any ideas, methods, instructions or products referred to in the content. |
© 2024 by the authors. Licensee MDPI, Basel, Switzerland. This article is an open access article distributed under the terms and conditions of the Creative Commons Attribution (CC BY) license (https://creativecommons.org/licenses/by/4.0/).
Share and Cite
Sha, M.; Zhai, J.; Wan, Z.; Wu, Z.; Jin, Y.; Zhu, E. Insights into the Global Characteristics of Shipping Exhaust Emissions at Berth. J. Mar. Sci. Eng. 2024, 12, 1527. https://doi.org/10.3390/jmse12091527
Sha M, Zhai J, Wan Z, Wu Z, Jin Y, Zhu E. Insights into the Global Characteristics of Shipping Exhaust Emissions at Berth. Journal of Marine Science and Engineering. 2024; 12(9):1527. https://doi.org/10.3390/jmse12091527
Chicago/Turabian StyleSha, Mei, Jiayu Zhai, Zheng Wan, Zhongdai Wu, Yan Jin, and Enyan Zhu. 2024. "Insights into the Global Characteristics of Shipping Exhaust Emissions at Berth" Journal of Marine Science and Engineering 12, no. 9: 1527. https://doi.org/10.3390/jmse12091527
APA StyleSha, M., Zhai, J., Wan, Z., Wu, Z., Jin, Y., & Zhu, E. (2024). Insights into the Global Characteristics of Shipping Exhaust Emissions at Berth. Journal of Marine Science and Engineering, 12(9), 1527. https://doi.org/10.3390/jmse12091527