Article

Paleogeomorphology Restoration of Post-Rift Basin: Volcanic Activity and Differential Subsidence Influence in Xihu Sag, East China Sea

1
Key Laboratory of Tectonics and Petroleum Resources, China University of Geosciences, Ministry of Education, Wuhan 430074, China
2
Wuxi Branch, Petroleum Exploration and Production Research Institute, SINOPEC, Wuxi 214126, China
3
Key Laboratory of Geoscience Big Data and Deep Resource of Zhejiang Province, School of Earth Sciences, Zhejiang University, Hangzhou 310058, China
4
China National Offshore Oil Corporation Limited-Shanghai, Shanghai 200030, China
*
Authors to whom correspondence should be addressed.
J. Mar. Sci. Eng. 2024, 12(9), 1542; https://doi.org/10.3390/jmse12091542
Submission received: 23 June 2024 / Revised: 29 July 2024 / Accepted: 28 August 2024 / Published: 4 September 2024

Abstract

:
In post-rift basins, the thickness center, fine-grained deposit center, and subsidence center rarely converge. Clearing the three centers with the thickest center is difficult. In the Huangyan district of Xihu Sag, the East China Sea Shelf Basin, an Oligocene post-rift basin beneath major potential igneous provinces, has inconsistent thickness and composition. Analysis of core samples, drilling, and 3D seismic data corroborated this finding. This means that the formation thickness center does not match the lithology center, which indicates water depth. Gravity and magnetic measurements in the studied region show that significant magmatic activity is responsible for the difference between the center of thickness and the fine-grained deposit. Thermal sinking must be restored to fix this. Therefore, we propose (1) recreating the early Oligocene residual geomorphology in Huangyan using 3D seismic data. (2) Software computing quantitative subsidence. (3) Paleogeomorphology is verified by normal and trace element paleowater depths. (4) Reconstruct the paleogeomorphology and analyze how volcanic activity affected them and the three centers in the basin formed after tectonic plates separated. A shallow water delta and thermal subsidence show that magmatic activity is persistent in the north. With less thermal subsidence and deeper water, the southern area features a shallow lake sedimentary system. The thickness and fine-grained deposition centers were in the north and south, respectively. Geophysical and geological methods were used to reproduce the post-rift paleogeomorphology shaped by magmatic processes.

1. Introduction

An essential aspect is the examination of sedimentary facies and sedimentary processes by restoring paleogeomorphology in post-rift basins. Paleogeomorphology is the main factor influencing the formation and distribution of sand bodies. This has been underscored by multiple investigations [1,2,3,4,5]. Paleogeomorphology is commonly attributed to tectonic activity, differential compaction, and weathering erosion [6,7,8,9,10].
Since the 1950s, numerous restoration techniques have emerged, which can be classified into three fundamental categories: (1) the method of restoring ancient geomorphology involves analyzing stratigraphic thickness using the residual thickness method and the impression method [11]. (2) Applying sedimentology principles—specifically, qualitatively reconstructing ancient geomorphology based on changes in sedimentary facies—allows for the restoration of ancient geomorphology. (3) Three-dimensional seismic data were used to learn about the ancient landscape, and seismic profiles and slices were used to learn about the pattern [8,12,13,14]. The residual thickness method has become a popular approach for restoring ancient geomorphology in recent years [15,16].
The reconstruction of paleogeomorphology is closely related to oil and gas exploration. The concentrations of oil and gas reservoirs associated with ancient geomorphology include paleouplifts, paleoslopes, and unconformable belts [5,17,18]. Consequently, the current emphasis in paleogeomorphology restoration is on reconstructing paleogeomorphic characteristics at the periphery of basins or in source areas. However, there is a dearth of studies on restoring paleogeomorphology at the center of sedimentary basins. Typically, the residual thickness approach meets the issue of reconstructing paleogeomorphology in sedimentary areas of post-rift basins.
The formation of the East China Sea Shelf Basin was simultaneously influenced by the tectonic activities of the Eurasian Plate, the Pacific Plate, and the Indian Ocean Plate, resulting in intense magmatic activity during the basin’s formation process. During periods of active volcanism, differential thermal subsidence renders the residual thickness method less accurate when attempting to determine the actual paleogeomorphology of the post-rift basin [19].
There are two types of basin subsidence mechanisms: tectonic subsidence and non-tectonic subsidence. The non-structural mechanism of basin subsidence refers to basement subsidence caused by the gravitational load of water, deposits, and lithosphere. Tectonic subsidence refers to the active subsidence of the basement caused by tectonic driving forces such as lithospheric extension and thinning, fault activity, or thermal cooling. The mechanism of thermal subsidence is controlled by changes in lithospheric temperature [20,21].
Post-rift basins frequently contain numerous centers where fine-grained deposits accumulate and areas where subsidence occurs. Depositional sites in certain robust rift basins frequently coincide with areas of increased thickness. The ideal post-rift basin coincides with the center of fine-grained deposits, subsidence, and thickness [19,22].
A fine-grained deposit is composed of sediments that have a particle size smaller than 62 micrometers in diameter, specifically clay-sized and silt-sized particles [23,24]. This research examines the concept of a fine-grained deposit center, which corresponds in the study area to an area of greater water depth and where the mudstone and fine-grained sandstone are concentrated distribution. A coarse-grained deposit center refers to a specific area with shallow water depth in the study area and a highly concentrated distribution of medium- to coarse-grained sandstones. During the formation of the basin, the subsidence center refers to the specific area where deposition occurs at the highest rate [25]. This deposition rate is influenced by tectonic activity. The thickness center is the specific point within a sedimentary deposit where the thickness reaches its maximum value. The genesis and position of the fine-grained deposit center and thickness center are strongly influenced by the subsidence center. A thickness center that coincides with the center of the fine-grained deposit suggests an advantageous location for the development of hydrocarbon source rocks. On the other hand, if the thickness center is aligned with the center of the coarse-grained deposit, this indicates an advantageous position for the formation of reservoir rocks.
In empirical investigations, due to the influence of volcanic activity, it has been observed that the precise locations of the fine-grained deposit center, the subsidence center, and the thickness center do not align perfectly in the Huangyan district of Xihu Sag in the East China Sea Shelf Basin. Conventional methods mentioned above cannot completely restore true paleogeomorphology. The objective of this study is to address the challenge of restoring the paleogeomorphology and determining effective fine-grained deposit centers in post-rift basins while considering three-center separation conditions.

2. Regional Geological Conditions

2.1. Tectonic Events and Volcanic Background

The East China Sea Shelf Basin is located in the tectonic region at the edge of the western Pacific Plate, situated at the convergence zone of the Eurasian Plate and the Pacific Plate (Figure 1a). Covering an area of over 280,000 square kilometers, it has Cenozoic sedimentary thicknesses exceeding 10,000 m, with Oligocene sedimentary thicknesses ranging from 1000 to 2000 m. The Xihu Sag is situated in the middle of the East China Sea shelf basin (Figure 1b) [26]. It is situated west of the Diaoyu Islands uplift fold belt, west of the reef uplift, and south of the Hupi reef uplift. The region can be geologically categorized into three tectonic units from west to east: the west slope belt, the central depression belt, and the east rift terrace belt (Figure 1c).
The Xihu Sag is a basin formed during the Cenozoic period due to the stretching of the Earth’s crust. It is located on top of pre-Mesozoic igneous rocks. During the Paleogene period, two significant tectonic movements occurred in this basin: the Jilong movement and the Yuquan movement [28]. The uplift movement during the early Paleogene occurred 65 million years ago (Figure 1b), and it formed the fundamental basin layout [29]. The collision of the Indian plate and the Eurasian plate resulted in an east–west-oriented stretching force along the boundary of the Eurasian plate, leading to the formation of a sequence of northeast-to-north–northeast-oriented fault systems. The Xihu Sag transitioned into the syn-rift stage following the Jilong movement [30]. The Yuquan movement took place during the late Eocene, 32 million years ago, as stated by Yang et al. in 2010 [31]. This movement resulted in the subduction of the Pacific plate from north–northwest to northwest direction, causing a decrease in tensile tension and transitioning the basin into the post-rift stage [30]. Meanwhile, due to the uplift of the Xihu Sag, the Diaoyu Island fold belt was closed, the seawater retreated, and the basin developed a continental lake sedimentary system [10,26,27].
During the late Yanshan migration to the Himalayan orogeny, there were large volcanic eruptions and intrusions in the area [32]. Exploratory drilling indicated the presence of substantial deposits of granites, volcanic lavas, and associated clastic materials during the Mesozoic era [33]. The findings of these investigations on the dating of igneous rocks indicate that they predominantly originated from the Late Jurassic to Cretaceous, specifically between 160 and 70 million years ago (Figure 1d).
During the Oligocene, the Xihu Sag served as a post-rift basin in an extensional tectonic setting, with sedimentary strata exhibiting stability. The research area (Figure 1c) is located within the central depression belt in the northeast region. Specifically, it is situated in a sink area. The target stratum consists of sedimentary strata between the seismic horizon T30 and SB31.2, which formed during the post-rift stage, as shown in Figure 1d. The ages of T30 and SB31.2 are 33.5 Ma and 31.2 Ma. Volcanism is clearly evident in the northern portion of the research area, as indicated by the analysis of drilling, gravity, and magnetic inversion data [34].
The Bouguer gravity anomaly illustrates the uneven distribution of density within the Earth’s crust (Figure 2a). The lower Bouguer gravity values observed in the northern region than the surrounding areas suggest a greater thickness of underlying strata in the north. This finding aligns with the drilling results reported by Oldenburg (1974) [35] and Mancinelli et al. (2021) [36].
Magnetic anomaly interpretation can be used to differentiate between igneous rock basements and sedimentary/metamorphic rock basements on a regional scale because of the considerably greater magnetic susceptibility of igneous rocks compared to that of sedimentary and metamorphic rocks [37,38,39,40]. The magnetic polarization anomaly map reveals that the research area corresponds to the igneous basement (Figure 2b,c). The northern anomaly of the Huangyan district exhibits a greater magnitude than the southern anomaly, and the igneous rocks in the north possess a greater composition.
Figure 2. (a) Bouguer gravity anomaly in the East China Sea shelf basin. Modified from Han [41]. (b) Superposition diagram of aeromagnetic anomaly in Xihu Sag. Modified from Jiang et al. (2020) [10] (c) Superposition diagram of an aeromagnetic anomaly in Huangyan district.
Jmse 12 01542 g002

2.2. Sedimentary and Drilling Background

In the southern region of the research area, the thickness of the Oligocene strata thickness is approximately 1000 m, whereas in the northern region, the drilling strata are more than 1600 m thick. Figure 3a displays the data of lithology and Gamma Ray log that spans from the northern to southern regions. Exploratory drilling revealed that the sedimentary strata in the northern region (wells A1–A2) have a considerable thickness, with sandstone being the predominant lithology. The sandstone exhibits a coarse grain size, predominantly consisting of medium-thick to medium-to-coarse sandstone (Figure 3a). The sedimentary formations in the southern section (wells A3–A5) are relatively thin. The predominant lithology consists primarily of mudstone, with a moderately fine-grained sandstone component. The sandstone consists mostly of fine-grained sandstone and siltstone (Figure 3a). The mudstone color in the northern area predominantly exhibited shades of reddish brown, brownish yellow, and light grey. Conversely, the mudstone color in the southern area was primarily characterized by greenish–gray and blackish–gray hues, which were notably thick and consistent (Figure 3b). The depositional environment indicated that the northern region exhibited features of high-energy shallow water with exposed oxidation, whereas the southern region had the characteristics of deep water with reduction.
There is an inconsistency between the sedimentary information gained from drilling and the sedimentary information obtained from the stratigraphic thickness in the Xihu Sag. Essentially, the post-rift does not contain a fine-grained deposit center or a thickness center at the same location. The differential distribution of deep igneous rocks just corresponds to the north–south position of the phenomenon that the three centers do not coincide in the study area, and the genesis of Large Igneous Provinces can also explain this relationship. The genetic models of Large Igneous Provinces are explained by Common Mantle Models [42,43,44,45,46]. If the mantle plume fails to penetrate the lithosphere and remains buried inside it for a prolonged duration, localized surface manifestations of early dome-related rifting occur. This further affects the process of deposition of the overlying strata [47,48,49]. For the noncoincidence of fine-grained deposit centers and thickness centers, we start from the igneous rock background and focus on differential subsidence to restore the paleogeomorphology of the post-rift basin.

3. Materials and Methods

3.1. Materials

This study utilized the most current full-coverage 3D seismic data to analyze the Oligocene sedimentary formations in the Huangyan district. A comprehensive investigation was undertaken to validate the sedimentary background by merging the lithological compositions of quantities of wells in the research area. Furthermore, the paleowater depth of each well was determined by analyzing the elemental composition of the entire sequence of the two wells. The rationale for restoring paleogeomorphology is substantiated by the sedimentary context and paleowater depth conditions. China National Offshore Oil Corporation (CNOOC) Shanghai Branch (Shanghai, China) provides both 3D seismic data and drilling data. The synthetic seismic records exhibited an excellent relationship between the wells and the seismic data [50], and the dependability of these data was confirmed during the actual oilfield production process. Intuitive topographic maps were created with Schlumberger’s Petrel 2019 software for terrain analysis, utilizing two-way reflections on residual thickness maps and seismic contour maps. The determination of tectonic and non-tectonic subsidence was dependent on the use of Extension Basin Modeling (EBM) software.

3.2. Restoration Method for Paleogeomorphology

Deep magmatic activity results in differential thermal subsidence, which has significant effects on the geomorphological patterns. Reconstructing the differential subsidence caused by magmatic activity is an essential step in understanding the paleogeomorphology of the studied area. The specific steps are as follows:
(1)
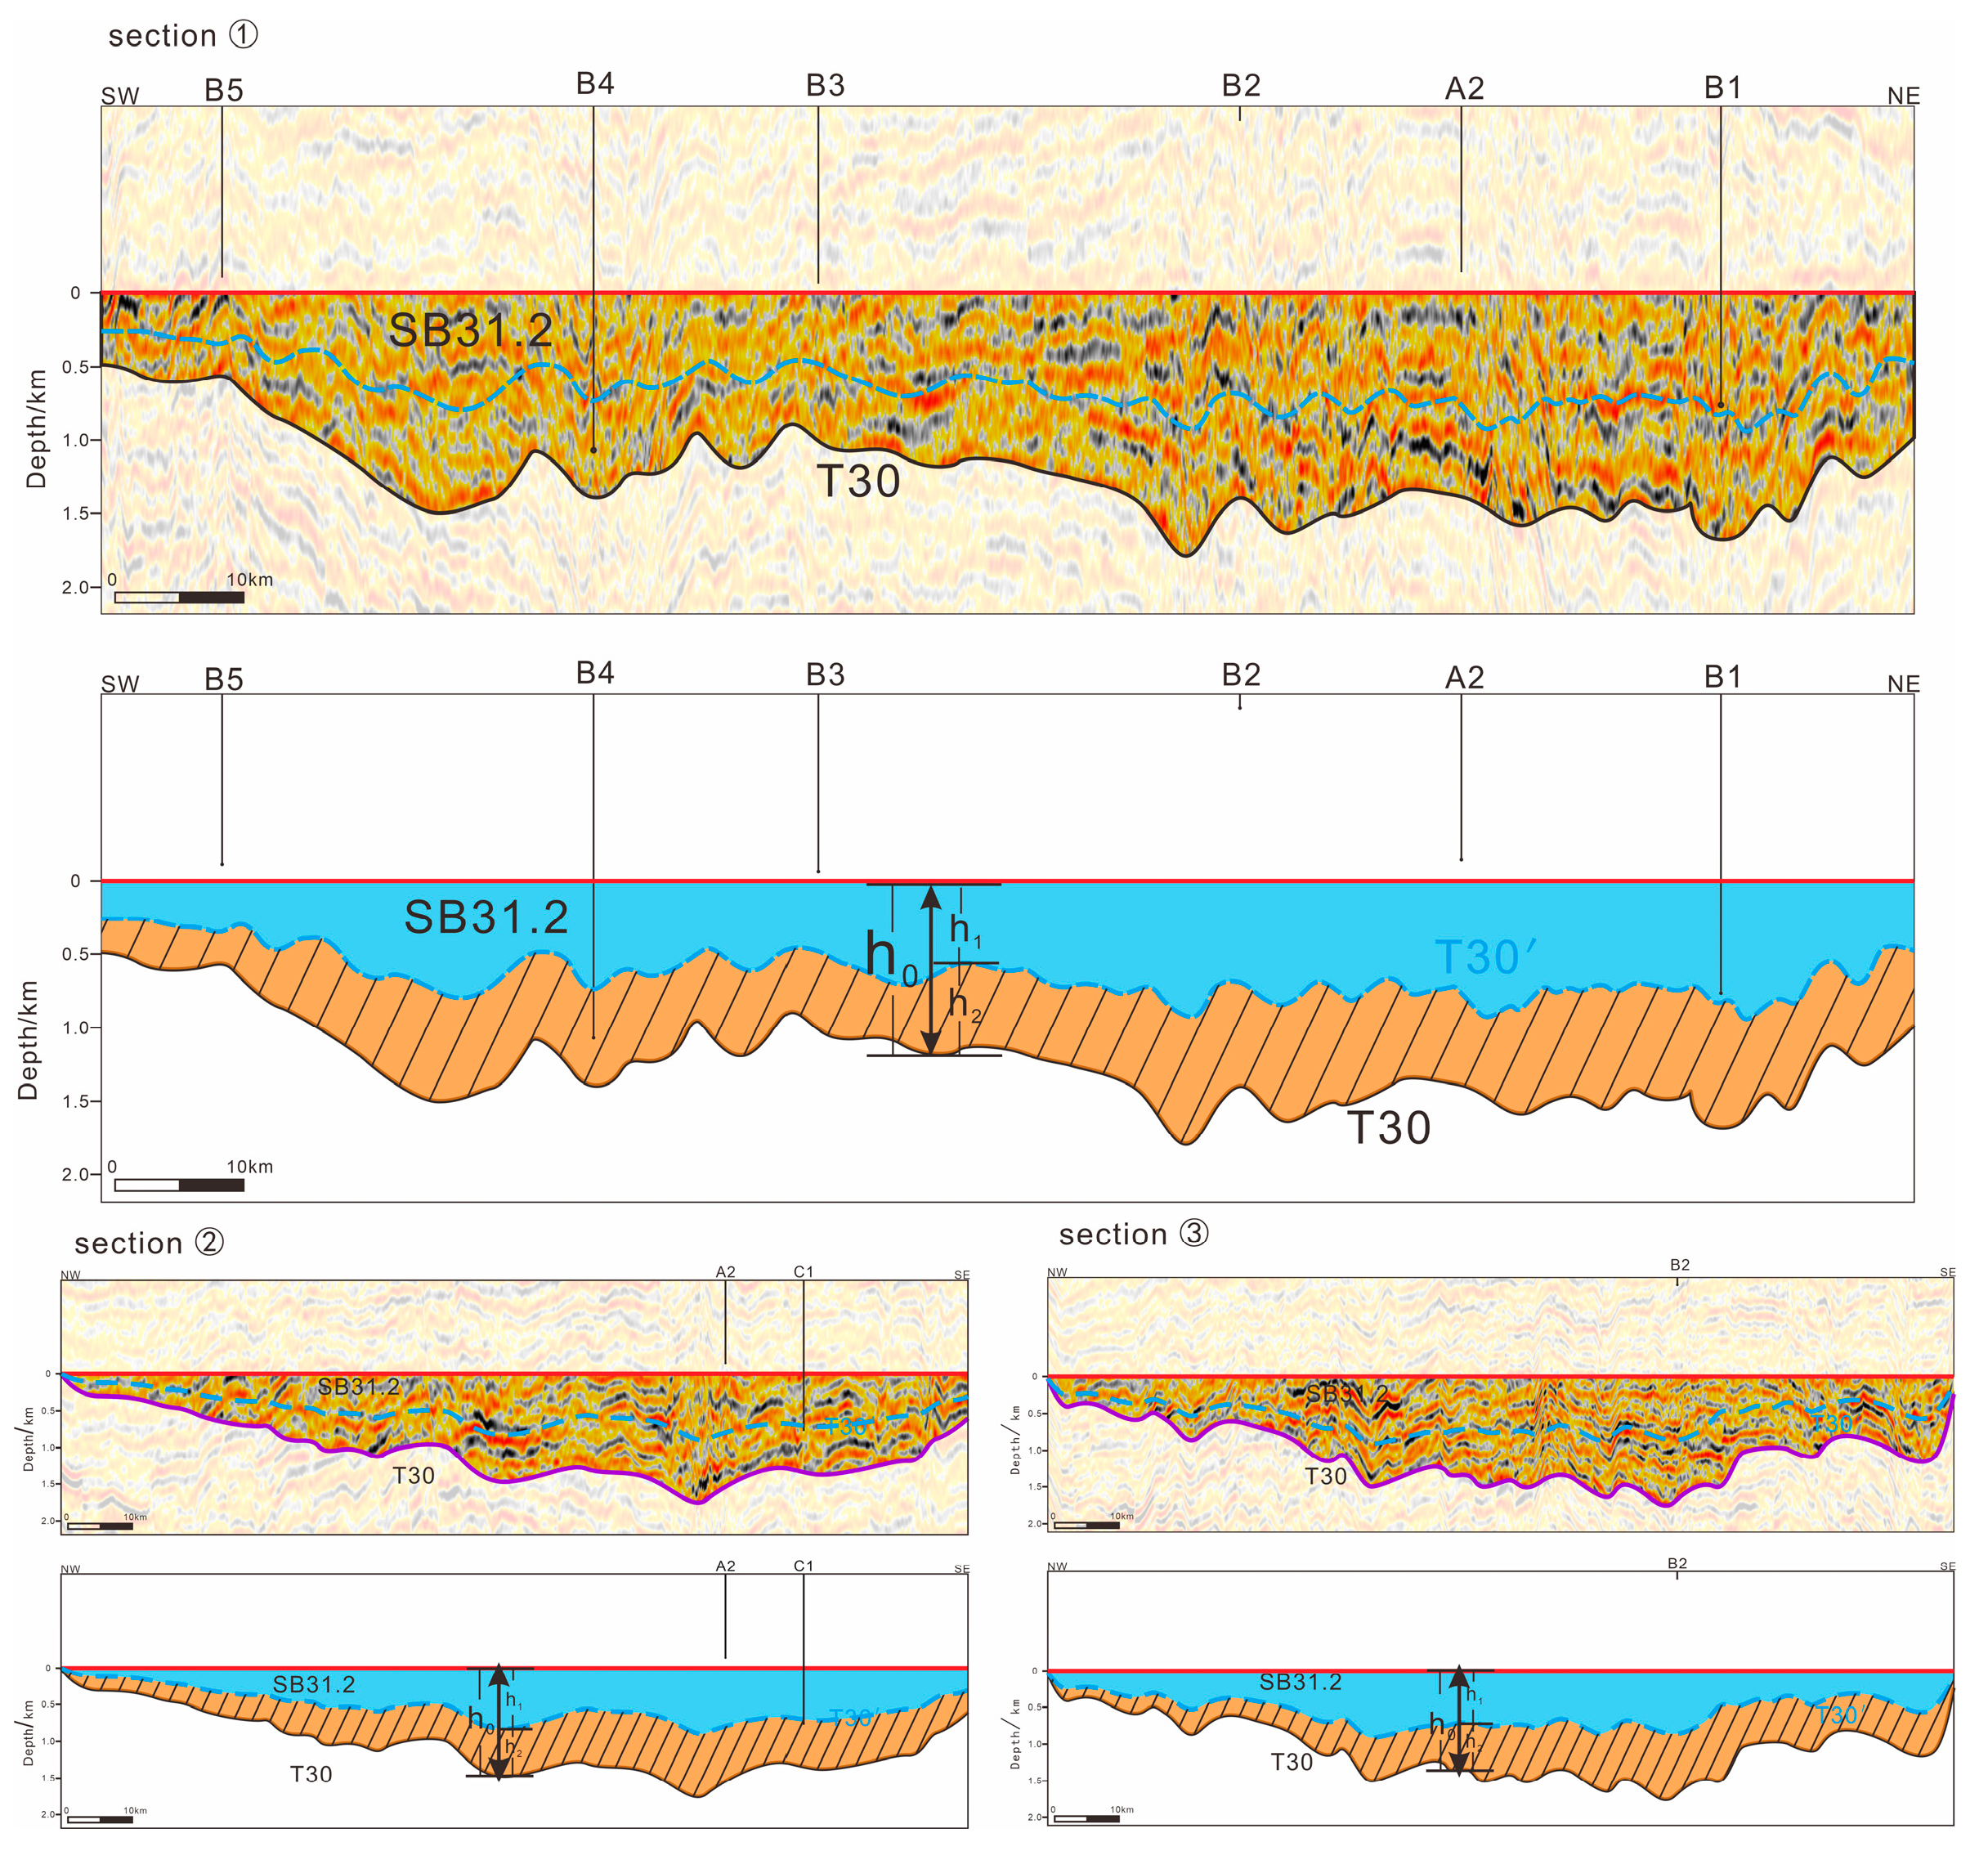
Utilizing the analysis of the T30 and SB31.2 seismic horizons to determine the residual thickness and, subsequently, to finalize the restoration of the residual paleogeomorphology.
(2)
Achieve precise measurements of tectonic subsidence and load subsidence in the target strata by utilizing lithological parameters, fully recovering differential subsidence, and reconstructing paleogeomorphology.

3.2.1. Restoration of Residual Paleogeomorphology

The residual thickness approach for studying paleogeomorphology is based on the premise that the original sedimentary thickness of the strata being investigated remains relatively constant prior to denudation. In this method, a marker layer underneath the strata is chosen as the isochronous datum plane. The residual thickness between the datum plane and the top interface of ancient geomorphology is utilized to describe the morphology of the ancient landforms that are being restored. The T30 interface, which spans the whole region, marks the lower boundary between the Oligocene era and the interface between the syn-rift and post-rift phases (see Figure 4a). This formation is consistently distributed and serves as a prominent interface that can be easily identified during drilling and tracked in seismic profiles. Extensive drilling data indicate significant changes in the logging facies, sedimentary features, lithofacies, and sedimentary facies above and below the T30 interface. The logging curves at the upper and lower boundaries of the T30 interface exhibit distinct and abrupt variations. The gamma-ray (GR) value below the T30 interface (as shown in Figure 4a) is significantly greater than the GR value above the T30 interface. The Eocene strata (Figure 4a) mostly consist of coal deposits in a bay environment and a tidal flat environment influenced by tidal action. The lithology of these deposits is predominantly fine sandstone, siltstone, and dark gray mudstone, with the presence of coal seams. The T30 interface is primarily composed of coarse clastic deposits, including thick, massive glutenite and coarse sandstone seen in composite channels.
Using the latest 3D seismic data of Xihu Sag, a seismic interpretation of the T30 and SB31.2 interfaces was completed. The residual geomorphology is determined by subtracting the interface SB31.2 from seismic interface T30. A larger thickness indicates a comparatively low potential area, whereas a smaller thickness indicates a relatively high potential area. By examining the remaining paleogeomorphology (Figure 4b), it has been determined that the thickness center is located in the A2–B2 well area. The fine-grained deposit center is expected to be dispersed within the A2–B2 well area, while the A3–A4 well area is classified as a sloped area.

3.2.2. Recovery of Differential Subsidence

By analyzing the subsidence history, it is possible to thoroughly investigate the structural characteristics and formation processes of the basin within the three-dimensional space of the sedimentary system. The precise procedure is depicted in Figure 5. We have utilized Extension Basin Modeling (EBM) software to conduct subsidence history analysis on 11 wells (Figure 1c) within the study area. The dominant sedimentary facies in the study area during the early Oligocene epoch were mostly continental fluvial-delta facies and shallow lake facies. Currently, water depth and sediment do not significantly influence the deposition process.
The EBM software back-stripping approach was used to quantitatively calculate the settling volume. This involved systematically removing the younger strata to reveal the underlying older strata. The porosity, recovered strata thickness, loading subsidence, and tectonic subsidence were computed based on Equations (1)–(4) [51].
ϕ = ϕ m e c z
where ϕ is the porosity at depth Z, ϕ m is the surface porosity, and C is the compacting coefficient.
Z 2 1 Z 1 1 = Z 2 Z 1 + ϕ m C ( e C Z 2 e C Z 1 ) + ϕ m C ( e C Z 1 1 e C Z 2 1 )
where Z 2 1 and Z 1 1 are the new depths recovered, and Z 2 and Z 1 are the bottom and top depths of the target strata, respectively.
S = ( ρ a ρ w ρ a ρ s ) H
where S is the loading subsidence, ρ a , ρ w , and ρ s are the densities of mantle, water, and sediments, respectively, which are 3.33 g/cm3, 1.00 g/cm3, and 2.33 g/cm3, respectively; H is the strata thickness after compaction correction.
D T = ( ρ m ρ s ¯ ρ m ρ w H ρ w ρ m ρ w Δ S L ) + ( W d Δ S L )
where D T is the tectonic subsidence, H is the sediment thickness after compaction correction (unit: m), ρ s ¯ is the average density of sediments (g/cm3), S L is the ancient sea level (unit: m), and W d is the ancient water depth (unit: m). Δ S L is a positive and negative value when the sea level rises and falls, respectively.
By utilizing Equations (1)–(4), it is imperative to ascertain the correlation between porosity and the depth as well as the age of the top-bottom contact of the strata. Based on the seismic profile, the thickness of the deposited strata corresponding to total subsidence, load subsidence, and tectonic subsidence may be identified as h0, h1, and h2 accordingly (Figure 6). Tectonic subsidence in post-rift basins is commonly estimated to be thermal subsidence. Thus, we successfully calculated the subsidence of a single well by performing back stripping. We integrated the subsidence data from all individual wells in the study area onto a flat base map, and a contour map illustrating the subsidence caused by the load was created. This will allow for a quantitative reconstruction of the original topography during this period.

4. Results and Verification

EBM software is used to compute the tectonic subsidence, load subsidence, and their respective proportions under the constraints of key wells. We utilized the alteration and degree of sinking to reinstate the initial geomorphological structure (Figure 7a) of the typical post-rift basin. The vertical displacement of the northern region is between 444 m and 732 m due to the load, whereas the tectonic displacement in the same region ranges from 504 m to 1038 m (Figure 6). The vertical sinking of the ground in the southern region ranges from 113 m to 420 m. The A2-B2 area experiences the most downward movement due to tectonics, with a maximum subsidence of 611 m (Figure 6). We utilize an entire sequence of normal, trace, and rare earth elements to accurately determine the paleowater depth (Table 1) and validate the reconstructed paleogeomorphology.
In Figure 7, the warm color indicates thinner layers, which suggest higher structural positions, while cooler colors, ranging to blue, indicate thicker layers, which suggest lower structural positions. By integrating prior drilling and lithology data, it is evident that the northern area features thin layers characterized by large grain sizes and primarily reddish–brown oxidized mudstone colors. The lithological assemblage primarily consists of medium-coarse sandstones and is classified as part of the slope region in terms of geomorphology. Conversely, the southern section contains large layers of mudstones with fine grain sizes and mostly gray-green reducing colors. The lithological composition consists mostly of mudstone, alternating with fine sandstone and is classified as part of the sag area in terms of geomorphology. The A3–A4 well area in the Huangyan district is identified as the primary location with the largest formation thickness based on the analysis of the reconstructed paleogeomorphology. This area serves as the main center for the deposition of fine-grained sediments.
Cobalt (Co) has been shown to be a reliable quantitative technique for reconstructing ancient water depths in sedimentary basins and has been extensively utilized [52,53,54]. This technique utilizes the fluctuations in the abundance of Co in sediment samples and applies empirical equations to recreate the historical water depths of the Oligocene Huangyan region. The specific method is as follows:
V S = V 0 × N C o S C o t × T C o   ;   h = 3.05 × 10 5 V s 1.5
where Vs represents the sedimentation rate of a sample during deposition; V0 represents the normal lake deposition rate (9.56 mm/a); NCo represents the abundance of normal lake sediments (20 ppm); SCo represents the abundance of samples; t represents element (la) in samples to the average abundance in terrigenous clastic rocks (38.99 ppm); and TCo represents the abundance of drills in terrigenous clastic rocks (4.68 ppm).
The paleowater depth, as shown in Table 1, reveals a disparity in water depth between the southern and northern regions, with the southern region experiencing a depth of 9 m and the marginal slope region experiencing a depth of only 6.8 m. Based on geomorphologic trends, the water depth is shallower in the north. The paleowater depth findings are consistent with the mudstone colors and lithological compositions in both the northern and southern regions. The restoration of the paleowater depth provides additional confirmation of the accuracy of the reconstructed paleogeomorphology.

5. Discussion

5.1. The Advantages and Application of This Method

Compared to traditional approaches, this method combines the advantages of the residual stratum thickness method and the back-stripping method (Table 2). It allows for accurate calculation of the geomorphology and subsidence in sedimentary areas without the need to restore the geomorphology and erosion volume of the source area. Taking into account the geological conditions of the study area, this approach not only restored the early Oligocene paleogeomorphology in the study area but also clarified the location of the fine-grained deposit center, thickness center, and subsidence center.
This approach reduces uncertainty in restoring eroded regions and is only applicable to 3D seismic data and drilling data. The operation steps are clearly defined, and the system has a high level of operability. The recovery of basin paleogeomorphology in the post-rift is helpful for explaining the inconsistency of the three centers and can also provide methods and ideas for identifying hydrocarbon generation centers and lithologic traps to some extent. Lithologic trap exploration is also one of the focuses and centers of oil and gas exploration.
In the research area of Xihu Sag, the typical approach for reconstructing the Oligocene paleogeomorphology involves primarily relying on residual geomorphology as a representation of the paleogeomorphology. This is commonly performed as the initial step in the restoration process. In the context of a prospective large igneous province, utilizing gravity, magnetic, and seismic methods to quantitatively assess tectonic subsidence and thermal subsidence can provide a more accurate representation of the paleogeomorphology during periods of post-rift. However, the application of this method is also restricted by the igneous background, which means considerable differential thermal subsidence in the post-rift.
Conventional approaches prioritize the characterization of the paleogeomorphological pattern that remains uneroded. Figure 4b depicts residues of ancient geomorphological features. Typically, when analyzing the residual paleogeomorphology (Figure 4b) in the post-rift basin, the area around well A3 has the largest stratum thickness. This suggests that the centers of fine-grained deposits, subsidence, and thickness are aligned at this location. However, the subsidence center is influenced by many non-structural processes, such as compaction and magma, resulting in a partial misalignment between the fine-grained deposit center and the subsidence center. To put it differently, this uncomplicated recovery procedure lacks dependability. In contrast to the conventional approach, we utilized a quantitative strategy to address the issues of tectonic subsidence and non-tectonic subsidence (Figure 5 and Figure 6) by considering differential subsidence. This approach effectively resolved the problem of discrepancies between the centers of fine-grained deposits and the center of sinking in the post-rift. According to Figure 6, it is evident that the fine-grained deposit center should be located to the south of Well A3. The drilling findings further support the validity of this result.
Our results further elucidate the rationale behind the noncoincidence of the three centers of the sedimentary basin in the post-rift. The subsidence center and the thickness center coincide in this study area.

5.2. Inspiration for Dynamic Geomorphological Evolution

From the previous study, the following information may be derived: During the rift stage in the Xihu Sag (Figure 8a), the upwelling of deep material and the stretching of the asthenosphere, which is unable to penetrate the crust quickly and is temporarily trapped beneath it, led to the thinning of the crust and the intrusion of magma into the lower layers, causing significant thermal anomalies [48]. The thermal anomalies steadily decreased after the rifting, leading to a continual cooling of the lithosphere and causing significant thermal subsidence (Figure 8b). The study area exhibits unusually high positive magnetic anomalies, weakening of the Earth’s crust, and low Bouguer gravity anomaly values in well regions A2 to B2. These observations suggest the occurrence of significant volcanic intrusion activity in the northern region (Figure 2). This action caused significant thermal subsidence in the area, leading to the accumulation of exceptionally thick strata. Moreover, areas experiencing substantial thermal subsidence will progressively impose a greater gravitational burden on the layers above. The increased gravitational force will induce additional flexural subsidence of the layers, leading to an increase in thickness. A direct and evident positive relationship exists between the subsidence of thermal anomalies and the sinking caused by gravity. Hence, there is an inconsistency between the residual geomorphic centers interpreted based on seismic data and the environments revealed by lithology from drilled wells in this area.
The southern part of the study area is mostly characterized by normal tectonic subsidence and load subsidence. When there is a low-lying structure (Figure 6), a thin layer of sediment, consisting mostly of mudstone, forms. This indicates a relatively deep-water environment (Figure 8b).

6. Conclusions

This study aimed to implement the geomorphic restoration approach in Xihu Sag, taking into account the presence of possible Large Igneous Provinces. The residual thickness method and differential subsidence recovery were utilized to quantitatively recreate the paleogeomorphology of the Huangyan district in the Xihu Sag during the Oligocene era. The main conclusions can be summarized as follows:
The Oligocene paleogeomorphology of the Huangyan district during the post-rift period was restored by eliminating differential subsidence. The northern region, with a larger thickness of strata and coarse-grained lithology, characterized by the widespread distribution of reddish–brown mudstones, represents the thickness center. In contrast, the southern region, characterized by thinner layers and a lithology composed of fine-grained sediments, is considered the primary location for the deposition of fine-grained sediments due to the extensive and frequent distribution of gray–green mudstones.
In the northern region, the stratigraphy is 40% thicker than that in the southern part. Additionally, both the tectonic subsidence and the load subsidence are much higher in the north, with increases of 40–50% compared to the south. The paleowater depth in the southern region is higher than that in the northern region.
Intense volcanic activity causes the Earth’s crust to become thinner, which in turn affects the process of differential thermal subsidence of the layers above. This results in a situation where the center of the fine-grained deposits is not coincident with the center of thickness.
Paleogeomorphology restoration in the center of the post-rift basin can help us to clarify the fine-grained center of the sedimentary basin and provide a theoretical basis and support for finding favorable hydrocarbon generation centers and structural highs.

Author Contributions

Validation, H.Z.; Formal analysis, L.Q. and D.X.; Resources, L.Q. and D.X.; Data curation, L.Q. and D.X.; Writing—original draft, X.Y.; Writing—review & editing, Q.L. and Z.L.; Supervision, L.Q. and D.X. All authors have read and agreed to the published version of the manuscript.

Funding

This study was supported by the National Natural Science Foundation of China (NSFC) programs (No. 41902112) and the Science and Technology Special Project of CNOOC (CCL2019TJT0NST1714).

Institutional Review Board Statement

Not applicable.

Informed Consent Statement

Informed consent was obtained from all subjects involved in the study.

Data Availability Statement

Data are contained within the article.

Acknowledgments

The Shanghai Branch of the China National Offshore Oil Corporation is thanked for providing the data used in this study and giving permission to publish the results.

Conflicts of Interest

Authors Lanzhi Qin and Donghao Xu were employed by the company China National Offshore Oil Corporation Shanghai Branch (Shanghai, China). The remaining authors declare that the research was conducted in the absence of any commercial or financial relationships that could be construed as a potential conflict of interest.

References

  1. Guidish, T.M. Basin evaluation using burial history calculations: An overview. AAPG Bull. 1985, 69, 92–104. [Google Scholar]
  2. Katz, B.J.; Pheifer, R.N.; Schunk, D.J. Interpretation of Discontinuous Vitrinite Reflectance Profiles. AAPG Bull. 1988, 72, 926–931. [Google Scholar]
  3. Wang, H.; Huang, C.Y.; Zhao, S.E.; Yan, D.T.; Bai, Y.F.; Xiang, X.M.; Chen, S.; Xia, C.Y.; Liao, J.H. Paleogeomorphy, provenance system and sedimentary system of the Dongying formation in the Qikou sag. Min. Sci. Technol. 2009, 19, 800–806. [Google Scholar] [CrossRef]
  4. Fu, J.H.; Li, S.X.; Xu, L.M.; Niu, X.B. Paleo-sedimentary environmental restoration and its significance of Chang 7 Member of Triassic Yanchang Formation in Ordos Basin, NW China. Pet. Explor. Dev. 2018, 45, 998–1008. [Google Scholar] [CrossRef]
  5. Zhao, Q.; Zhu, H.T.; Zhang, X.D.; Liu, Q.H.; Li, M. Geomorphologic reconstruction of an uplift in a continental basin with a source-to-sink balance: An example from the Huizhou-Lufeng uplift, Pearl River Mouth Basin, South China Sea. Mar. Pet. Geol. 2021, 128, 104984. [Google Scholar] [CrossRef]
  6. Deng, H.W.; Wang, H.L.; Wang, D.Z. Control of paleomorphology to stratigraphic sequence in continental rift basins: Take lower tertiary of western slope in Bozhong depression as an example. Oil Gas Geol. 2001, 22, 293–296. [Google Scholar]
  7. Wu, X.S.; Fan, T.L. The relationship between palaeotopography and reservoir prediction in sequence stratigraphic research. Acta Geosci. Sin. 2002, 23, 259–262. [Google Scholar]
  8. Chen, S.G.; Ren, J.Y.; Wu, F.; Cui, C.; Zhang, J.L. Palaeogeomorphic recovery and its application in shabei area, central bohai depression. Spec. Oil Gas Reserv. 2015, 22, 52–55. [Google Scholar]
  9. Xian, B.; Wang, Z.; Ma, L.; Chao, C.; Pu, Q.; Jing, A.; Wang, J. Paleo-drainage system and integrated paleo-geomorphology restoration in depositional and erosional areas: Guantao Formation in east liaodong area, bohai bay basin, China. Earth Sci. 2017, 42, 1922–1935. [Google Scholar]
  10. Jiang, Y.M.; Zou, W.; Liu, J.S.; Tang, X.J.; He, J.X. Genetic mechanism of inversion anticline structure at the end of Miocene in Xihu Sag, East China Sea: A new understanding of basement structure difference. J. Earth Sci. 2020, 45, 968–979. [Google Scholar]
  11. Liu, H.; Tang, Y.; Tan, X.; He, B.; Tang, S.; Zhou, Y.; Lin, B. Paleogeomorphological reconstruction and geological implications of the weathered-crust karst on the top of the Middle Triassic Leikoupo Formation in the Longgang area, Sichuan Basin, China. Energy Explor. 2017, 36, 727–742. [Google Scholar] [CrossRef]
  12. Liu, J.E.; Jian, X.L.; Kang, B.; Su, M.; Du, X.B. Paleogeomorphology of the middle part of 3rd member of Shahejie formation and their effects on depositional systems, Dongying delta, Dongying depression. Petrol. Pet. Geol. Recovery Effic. 2014, 21, 20–23. [Google Scholar]
  13. Zeng, Z.W.; Yang, X.H.; Shu, Y.; Chen, S.H.; Wu, J.; Wang, W.; Xia, C.C. Structure palaeogeomorphology characteristics and sand bodies distribution regularities of paleogene Wenchang Formation in enping sag: Under the conditions of lack of drilling data to predict and evaluate the reservoir sand bodies. Geoscience 2015, 29, 804–815. [Google Scholar]
  14. Wang, C.J.; Huang, X.B.; Guo, T.; Xie, J.; Guo, R.; Yao, C. High precision paleotopography restoration technology and its application: Taking the second member of dongying strata in the South of liaoxi uplift as an example. Geoscience 2017, 31, 1214–1221+1240. [Google Scholar]
  15. Seraj, M.; Faghih, A.; Motamedi, H.; Soleimany, B. Major Tectonic Lineaments Influencing the Oilfields of the Zagros Fold-Thrust Belt, SW Iran: Insights from Integration of Surface and Subsurface Data. J. Earth Sci. 2020, 31, 596–610. [Google Scholar] [CrossRef]
  16. Chen, W.D.; Chen, Y.C.; Xu, F.B.; Li, S.L.; Li, Y.J.; Zeng, L.Y.; Tan, Q.; Kang, N. Stratigraphic division and correlation and karst paleogeomorphology restoration of the Middle Permian Maokou Formation in the eastern Sichuan Basin. Nat. Gas Ind. 2021, 41, 27–36. [Google Scholar]
  17. Zhang, Y.F.; Wang, Z.Y.; Qu, H.Z.; Luo, C.S.; Li, Y. Sedimentary microtopography in sequence stratigraphic framework of Upper Ordovician and its control over penecontemporaneous karstification, No. I slope break, Tazhong, Tarim block. J. Cent. South Univ. 2014, 21, 735–744. [Google Scholar] [CrossRef]
  18. He, W.J.; Zheng, M.L.; Fei, L.Y.; Wu, A.C.; Yang, T.Y.; Ding, J. Ancient landform restoration of marginal sedimentary area in the continental depression basin: A case study of the Triassic Baikouquan Formation in Mahu area of Junggar Basin. J. Paleogeogr. 2019, 21, 803–816. [Google Scholar]
  19. Liu, J.S.; Xu, H.Z.; Jiang, Y.M.; Wang, J.; He, X.J. Mesozoic and Cenozoic basin structure and tectonic evolution in the East China Sea basin. Acta Geol. Sin. 2020, 94, 675–691. [Google Scholar]
  20. Lee, E.Y.; Novotny, J.; Wagreich, M. Subsidence Analysis and Visualization: For Sedimentary Basin Analysis and Modelling; Springer: Berlin/Heidelberg, Germany, 2018. [Google Scholar]
  21. Kim, Y.; Huh, M.; Lee, E.Y. Numerical modelling to evaluate sedimentation effects on heat flow and subsidence during continental rifting. Geosciences 2020, 10, 451. [Google Scholar] [CrossRef]
  22. Tapponnier, P.; Peltzer, G.; Armijo, R. On the mechanics of the collision between India and Asia. Geol. Soc. Publ. 1986, 19, 113–157. [Google Scholar] [CrossRef]
  23. Schieber, J.; Zimmerle, W. The history and promise of shale research. In Shales and Mudstones; Schieber, J., Zimmerle, W., Sethi, P., Eds.; I. Basin Studies, Sedimentology and Paleontology; Schweizerbart’sche Verlagsbuchhandlung: Stuttgart, Germany, 1998; Volume 1. [Google Scholar]
  24. Aplin, A.C.; Macquaker, J.H.S. Mudstone diversity: Origin and implications for source, seal, and reservoir properties in petroleum systems. AAPG Bull. 2011, 95, 2031–2059. [Google Scholar] [CrossRef]
  25. Lemgruber-Traby, A.; Espurt, N.; Souque, C.; Henry, P.; Calderon, Y.; Baby, P.; Brusset, S. Thermal structure and source rock maturity of the North Peruvian forearc system: Insights from a subduction-sedimentation integrated petroleum system modeling. Mar. Pet. Geol. 2020, 122, 46–64. [Google Scholar] [CrossRef]
  26. Jia, R.Y.; Liu, Q.H.; Zhu, H.T.; Qin, L.Z.; Xu, D.H.; Li, Z.Y.; Sun, Z.H. Quantitative Pickup of High Frequency Sequence-Time Units under Restriction of Milankovitch Sedimentary Rate in Continental Shallow Lake Basin: A Case Study of Huagang Formation in Huangyan Area, Xihu Sag. J. Earth Sci. 2022, 47, 4020–4032. [Google Scholar]
  27. Yang, F.; Yu, H.; Zhang, Q.; Li, Q. Correlations between shortening rate, uplift rate, and inversion rate in central inversion zone of Xihu depression, East China Sea basin. J. Earth Sci. 2009, 20, 699–708. [Google Scholar] [CrossRef]
  28. Jiang, M.; Chen, D.; Chang, X.; Shu, L.; Wang, F. Controlling effect of tectonic-paleogeomorphology on deposition in the south of lufeng sag, pearl river mouth basin. Adv. Geo-Energy Res. 2022, 6, 363–374. [Google Scholar] [CrossRef]
  29. Zhao, Z.G.; Wang, P.; Qi, P.; Guo, R. Regional Background and Tectonic Evolution of East China Sea Basin. Earth Sci. 2016, 41, 546–554. [Google Scholar]
  30. Guo, Z. Evolutionary Important Geological Phenomena and Its Dynamics Background in East China Sea Shelf Basin. Ph. D. Thesis, Northwest University, Kirkland, WA, USA, 2015. [Google Scholar]
  31. Yang, W.D.; Cui, Z.K.; Zhang, Y.B. Geology and Minerals in the East China Sea. China Ocean Press: Beijing, China, 2010. [Google Scholar]
  32. Li, B.F.; Jiao, X.H.; Liu, B.H. Discussion on Seismic Reflection Characteristics of Igneous Rock in Diaoyu Island Uplift, East China Sea. Oil Geophys. Prospect. 1995, 30, 150–154. [Google Scholar]
  33. Tang, X.J.; Jiang, Y.M.; Zhang, S.L. Tectonic environment of volcanic rocks in the Pinghu Slope Belt and its petroleum geological significance. Geol. Sci. Technol. Inf. 2018, 37, 27–36. [Google Scholar]
  34. Geological Survey of Japan and Coordinating Committee for Coastal and Offshore Geoscience Programmes in East and Southeast Asia (CCOP). Magnetic Anomaly Map of East Asia 1:4,000,000 CD-ROM Version; Digital Geoscience Map 2 (P-1); Geological Survey of Japan: Tsukuba, Japan, 1996. [Google Scholar]
  35. Oldenburg, D.W. The Inversion and interpretation of gravity anomalies. Geophysics 1974, 39, 526–536. [Google Scholar] [CrossRef]
  36. Mancinelli, P.; Scisciani, V.; Patruno, S.; Minelli, G. Gravity modeling reveals a Messinian foredeep depocenter beneath the intermontane Fucino Basin (Central Apennines). Tectonophysics 2021, 821, 229144. [Google Scholar] [CrossRef]
  37. Baranov, V. A New Method for Interpretation of Aeromagnetic Maps: Pseudo-Gravimetric Anomalies. Geophysics 1957, 22, 359–382. [Google Scholar] [CrossRef]
  38. Books, K.G. Remanent Magnetism as a Contributor to Some Aeromagnetic Anomalies. Geophysics 1962, 27, 359–375. [Google Scholar] [CrossRef]
  39. Hermance, J.F.; Neumann, G.A. Magnetic variations in the reconnaissance of sedimentary basins: Field procedure and generalized inversion of short-period data from the Rio Grande rift. Geophysics 1990, 55, 1567–1576. [Google Scholar] [CrossRef]
  40. Davy, B.; Stagpoole, V.; Yu, D.B. Subsurface structure of the Canterbury region interpreted from gravity and aeromagnetic data. N. Z. J. Geol. 2012, 55, 185–191. [Google Scholar] [CrossRef]
  41. Han, B. Geophysical Field and Deep Tectonic Features of East China Sea. Ph. D. Thesis, Institute of Oceanology, University of Chinese Academy of Sciences, Qingdao, China, 2008. [Google Scholar]
  42. Richards, M.A.; Duncan, R.A.; Courillot, V.E. Flood basalts and hot spot tracks: Plume heads and tails. Science 1989, 246, 103–107. [Google Scholar] [CrossRef] [PubMed]
  43. Coffin, M.F.; Eldholm, M. Large Igneous Provinces: JOI/USSAC Workshop Report. Technical Report 114; University of Texas at Austin Institute for Geophysics: Austin, TX, USA, 1991; 79p. [Google Scholar]
  44. Bryan, S.; Ernst, R.E. Revised definition of Large Igneous Provinces (LIPs). Earth-Sci. Rev. 2008, 86, 175–202. [Google Scholar] [CrossRef]
  45. Campbell, I.H.; Griffiths, R.W. Implications of mantle plume structure for the evolution of food basalis. Earth Planet. Sci. Lett. 1990, 99, 79–93. [Google Scholar] [CrossRef]
  46. Campbell, I.H. Large Igneous Provinces and the Mantle Plume Hypothesis. Elements 2005, 1, 265–269. [Google Scholar] [CrossRef]
  47. Mckenzie, D.A.N.; Bickle, M.J. The volume and composition of melt generated by extension of the lithosphere. J. Petrol. 1988, 29, 625–679. [Google Scholar] [CrossRef]
  48. Xu, Y.G.; He, B.; Huang, X. Identification of mantle plumes in the Emeishan Large Igneous Province. Epis. J. Int. Geosci. 2007, 30, 32–42. [Google Scholar] [CrossRef] [PubMed]
  49. Sclater, J.G.; Christie, P.A. Continental stretching: An explanation of the post-mid-Cretaceous subsidence of the central North Sea basin. J. Geophys. Res. Solid Earth 1980, 85, 3711–3739. [Google Scholar] [CrossRef]
  50. Yan, W.T. Analysis of Sedimentary Facies on Huangyan Formation of Oligocene in Xihu Sag of East China Sea Shelf Basin; Ocean University of China: Qingdao, China, 2007. [Google Scholar]
  51. Chen, S.; Zhao, R.; Chen, C.G.; Wang, H.; Ma, J.H.; Gong, T.H.; Yu, Z.H. Tectono-sedimentary evolution of the Paleogene Qikou Sag, Bohai Bay Basin, NE China. Mar. Pet. Geol. 2023, 148, 106057. [Google Scholar] [CrossRef]
  52. Wu, Z.P.; Zhou, Y.Q. Using the characteristic elements from meteoritic must in strata to calculate sedimentation rate. Acta Sedimentol. Sin. 2000, 18, 395–399. [Google Scholar]
  53. Zhang, C.L.; Gao, A.L.; Liu, Z.; Huang, J.; Yang, Y.J.; Zhang, Y. Study of Character on Sedimentary Water and Palaeoclimate for Chang7 Oil Layer in Ordos Basin. Nat. Gas Geosci. 2011, 22, 582–587. [Google Scholar]
  54. Oostingh, K.F.; Jourdan, F.; Matchan, E.L.; Phillips, D. 40Ar/39Ar geochronology reveals rapid change from plume-assisted to stress-dependent volcanism in the Newer Volcanic Province, SE Australia. Geochem. Geophys. Geosyst. 2017, 18, 1065–1089. [Google Scholar] [CrossRef]
Figure 1. (a) The location of the East China Sea Shelf Basin. (b) The distribution of structural units in Xihu Sag. (c) The study area of the Huangyan district is located at the Xihu Sag, East China Sea shelf basin. (d) Stratigraphy, sedimentary facies, tectonic events, and stages of Xihu Sag [27,28].
Jmse 12 01542 g001
Figure 3. (a) Data of lithology and Gamma Ray log in early Oligocene of Huangyan district, Xihu Sag. The position and direction of the wells are shown in Figure 2c. (b) Late Oligocene variegated mudstone distribution frequency pie chart.
Jmse 12 01542 g003
Figure 4. (a) Drilling GR, lithology, and acoustic (AC) of well B6. (b) The geomorphology is based on subtracting the depth of SB31.2 from the depth of T30.
Jmse 12 01542 g004
Figure 5. The principle of EBM [44]. Input formation interface depth, rock physical parameters, and ancient water depth data, using the back-stripping of the method to calculate the output subsidence curve and subsidence rate.
Jmse 12 01542 g005
Figure 6. Recovery results of structural subsidence and thermal subsidence. See the black lines in Figure 1c for the location of the seismic profiles. h0 = total subsidence; h1 = load subsidence; h2 = tectonic subsidence.
Jmse 12 01542 g006
Figure 7. Paleogeomorphology after eliminating differential subsidence.
Jmse 12 01542 g007
Figure 8. Differential subsidence causes pattern diagrams. Magma intrusion led to a magnetic base and huge anomalous thermal subsidence, resulting in the deposition of extremely thick strata in the original shallow water area.
Jmse 12 01542 g008
Table 1. Elemental content and paleowater depth results of well C2 and well A6.
Well NameCo/ppmLa/ppmPaleowater Depth/m
C216.3355.3
22.533.79
A620.6249.676.8
Table 2. Characteristics of different restoration methods of paleogeomorphology.
TypeMaterialAdvantageLimitation
Residual stratum thicknessSeismic interpretationHigh accuracy for deposition areaNot suitable for denudation area
Sequence stratigraphySequence interpretation results (initial flooding surface, super-cusp extinction line on maximum flooding surface, slope broken line, fold shape)Conducive to the fine correlation of reservoirsAn ideal research idea cannot adapt to the complex research environment.
Back-stripping technologyformation thickness, compaction, porosity, ageBetter restore the geomorphological characteristics of low-lying landformRestoration results are not reliable for the denuded area
GeophysicsSeismic interpretation, synthetic seismogramHigh accuracyHighly dependent on the fineness of seismic data, it can not adapt to complex geological environments.
SedimentationGeological map, stratum thickness map, sandstone thickness map, lithofacies palaeogeographic mapSimple and basicLow accuracy
Disclaimer/Publisher’s Note: The statements, opinions and data contained in all publications are solely those of the individual author(s) and contributor(s) and not of MDPI and/or the editor(s). MDPI and/or the editor(s) disclaim responsibility for any injury to people or property resulting from any ideas, methods, instructions or products referred to in the content.

