Article

Stereo Particle Image Velocimetry Measurement of the Flow around SUBOFF Submarine under Yaw Conditions

1
Department of Hydrodynamics, China Ship Scientific Research Center, Wuxi 214082, China
2
National Key Laboratory of Hydrodynamics, China Ship Scientific Research Center, Wuxi 214082, China
*
Author to whom correspondence should be addressed.
J. Mar. Sci. Eng. 2024, 12(9), 1576; https://doi.org/10.3390/jmse12091576
Submission received: 15 August 2024 / Revised: 4 September 2024 / Accepted: 5 September 2024 / Published: 6 September 2024
(This article belongs to the Section Ocean Engineering)

Abstract

:
To gain a better understanding of the complex flow dynamics and stealth characteristics of submarines under maneuvering conditions, flow field experiments were conducted on the SUBOFF submarine model in the large low-speed wind tunnel at the China Ship Scientific Research Center (CSSRC). The three-dimensional velocity field above the hull at 6° and 9° yaw angles was captured using the stereo particle image velocimetry (SPIV) system. The experimental Reynolds numbers were selected as ReL = 0.46 × 10⁷ and ReL = 1.08 × 10⁷. The wake of the sail and the junction between the sail root and the hull were analyzed in detail, focusing on the core flow of the sail-tip vortex. The results revealed that at a larger yaw angle, the vorticity magnitude and turbulent kinetic energy (TKE) of the wake increased, and the downwash effect of the sail-tip vortex center became more pronounced. Furthermore, a higher Reynolds number resulted in an even more significant downwash of the vortex center, accompanied by a slight deviation towards the suction side. These experimental findings can contribute to the enrichment of the benchmark database for validating and improving numerical simulations of submarine wakes.

1. Introduction

When the submarine is under yaw conditions, the generated vortex structure becomes significantly more complicated, which deteriorates the wake of the submarine and leads to more intense flow vibrations. The resulting flow-induced noise becomes stronger, which seriously influences the stealth capabilities. Especially during maneuvers with large amplitudes, the flow separation near the hull surface is quite notable, and this phenomenon is difficult to accurately capture and represent solely through numerical simulations [1]. The advantages of experiments are evident, as they can not only yield more confident results for investigating the flow physics of a submarine, but also provide a benchmark prototype to validate and improve numerical simulations of submarine wakes.
A substantial body of literature has experimentally explored the flow phenomena surrounding diverse submarine configurations. The DSTO (Defence Science and Technology Organization) generic submarine model, characterized by a substantial deck, a sail, and an X-shaped rudder arrangement [2,3], has been extensively debated in the open scientific discourse as a pertinent representation of conventional submarine geometries. The Defence Science and Technology Group conducted a rigorous investigation within the DSTO low-speed wind tunnel (LSWT), focusing on the flow-field characteristics both on and around the bare and fully equipped model under straight-ahead conditions as well as during a 10° side-slip maneuver. The measurement campaign employed a multifaceted approach, encompassing thermal imaging for analyzing boundary layer transitions, flow visualization techniques utilizing wool-tuft streamers and smoke generation, surface pressure measurements through static pressure tappings, skin friction assessment utilizing the Preston tube, and detailed mapping of the boundary layer and velocity field with a PIV (particle image velocimetry) system. This comprehensive dataset serves as a pivotal benchmark prototype for validating and enhancing the accuracy of numerical simulations pertaining to submarine wakes, as evidenced by previous studies [4,5,6,7,8,9,10,11,12]. The utilization of this benchmark significantly contributes to the advancement of computational modeling and prediction capabilities for submarine hydrodynamics.
Recently, the Joubert BB2 submarine design, featuring a novel vertical sail and two horizontal hydroplanes aimed at enhancing stability and control capabilities [13,14], underwent renewed wind tunnel experimentation on both the bare and fully appended models. This investigation employed advanced techniques, including surface pressure tappings, China clay flow visualization, and a high-resolution SPIV (stereo particle image velocimetry) system [15,16,17,18], to gain deeper insights into its aerodynamic performance.
Concurrently, numerous researchers have conducted experiments on submarine-like models, contributing to a broader understanding of flow characteristics around such structures. For instance, Fu employed a PIV system to analyze the flow field surrounding a sting-mounted captive ONR (Office of Naval Research) Body-1 submarine model during steady turns [19]. Zhang, utilizing a towing PIV system in a large towing tank at the China Ship Scientific Research Center (CSSRC), investigated the influence of stern appendage juncture forms on the flow structure of a submarine-like main body [20]. DeMoss utilized hot-film sensors to measure steady skin friction on an ellipsoidal model undergoing yaw or pitch motions across various roll angles in the Virginia Tech Stability Wind Tunnel. The results of these experiments were instrumental in characterizing the nature and location of cross-flow separation on the model’s surface [21]. Huggins employed China clay flow visualization techniques and a pitot tube to study the transition and wake of a submarine model in the No. 2 Low-Speed Tunnel at DRA Farnborough, providing valuable insights into the flow physics of submarine-shaped bodies [22]. These studies, collectively, have significantly advanced the knowledge base regarding the aerodynamics and hydrodynamics of submarine designs.
The DARPA (Defense Advanced Research Projects Agency) SUBOFF (Submarine Technology Program Office) model, as a benchmark submarine design, has gained widespread popularity in establishing experimental testing standards for marine engineering. Its surrounding flow characteristics have been thoroughly examined using various traditional experimental techniques. Huang pioneered the measurement of flow around the SUBOFF in a wind tunnel setting [23]. Beigi employed five-hole pressure probes to assess the wake flow pattern at the propeller position of a SUBOFF model, exploring the influence of stern plane positioning on the wake by mounting them in three distinct longitudinal locations [24]. Khan conducted model tests at the Wind Tunnel Facility (WTF) of the Naval Science & Technological Laboratory (NSTL), India, to investigate surface pressure distributions over the SUBOFF hull form at high angles of incidence [25]. Furthermore, Khan utilized a five-hole pitot probe to perform steady velocity measurements in the stern wake of the SUBOFF model, obtaining axial, tangential, and radial velocity data across a range of angles of attack (+8° to −40°) and drift angles (0°–28°) at a Reynolds number of 1.7 × 10⁶ [26].
The China Ship Scientific Research Center (CSSRC) has a rich history of conducting extensive flow testing experiments on the SUBOFF model. Recently, Tian conducted wall shear stress measurements for a SUBOFF model in the towing tank of CSSRC, utilizing newly designed hot-film MEMS (micro-electromechanical) sensor arrays to capture wall shear stress under various drift angles [27]. Ellis conducted experimental investigations of the SUBOFF submarine hull form in the cavitation tunnel of the Australian Maritime College (AMC), validating a subset of simulated cases through measurements of flow velocity, surface pressure, and skin friction [28]. Liu, meanwhile, performed a wind tunnel experiment on a modified SUBOFF model in the cyclic low-speed wind tunnel at China Jiliang University, measuring axial velocities at the propeller disc of the submarine, both with and without a vortex control baffler, using a hot-wire anemometer system [29]. These studies have significantly contributed to the understanding of flow dynamics around submarine hulls and the development of advanced experimental techniques for marine engineering research.
The David Taylor Research Center conducted extensive studies on pressure and shear stress measurements for an axisymmetric SUBOFF body and its appendages in a wind tunnel utilizing a sophisticated pressure system. To measure shear stresses, this system was combined with obstacle blocks designed to stagnate velocity fields proximal to the model surface. A rigorous uncertainty analysis was presented, detailing the accuracy and precision of both the pressure and shear stress measurements obtained in these SUBOFF experiments [30]. Manshadi explored the impact of vortex generators on the flow field around a SUBOFF model under yaw conditions, utilizing the oil flow visualization method in a wind tunnel setting. This investigation aimed to assess the vortex generator’s effectiveness in modifying the flow dynamics [31].
Particle image velocimetry (PIV) and its advanced variants, including stereo-PIV (SPIV) and particle tracking velocimetry (PTV), have emerged as highly precise and minimally invasive techniques for quantifying spatiotemporal flow fields. Significant advancements in hardware components and image evaluation algorithms have widened their application scope across various critical fields [32]. Jiménez integrated both hot-wire anemometry and PIV techniques to comprehensively characterize the flow downstream of a SUBOFF model, covering a wide range of Reynolds numbers. This comprehensive approach provided valuable insights into the formation and dynamics of tip and junction vortices generated by the sail of the SUBOFF model [33,34,35]. Ashok utilized both hot-wire anemometry and SPIV systems to meticulously measure the flow field around an axisymmetric SUBOFF model. By varying the Reynolds numbers, pitch, and yaw angles, they compiled a comprehensive experimental database. Notably, the measured angles of attack and yaw angles were confined within 0° to 10° to mitigate potential wind tunnel interference effects [36,37,38,39,40].
Wang performed PIV measurements of the propeller wake generated by a SUBOFF model equipped with the E1658 propeller, near the free surface, in a specialized cavitation channel. These results were used to evaluate the capabilities and limitations of computational fluid dynamics (CFD) simulations in replicating experimental observations [41,42,43]. Liu’s research delved into the boundary layer flow over the forebody of the SUBOFF model, leveraging laser-induced fluorescence visualization and time-resolved 2D PIV. This multifaceted approach not only visualized large-scale flow structures during the transition process but also enabled the quantification of intermittency behavior through time-resolved planar velocity fields [44]. These studies have significantly contributed to advancing the understanding of flow dynamics around complex submarine hulls and the development of advanced experimental and numerical methodologies.
The work mentioned above can provide quite comprehensive flow structure information, characterizing the spatiotemporal flow evolution characteristics of the SUBOFF submarine model under various maneuvering conditions. Unfortunately, it rarely involves the wake generated by the junction of the sail root and the hull or the evolution of the sail-tip vortex at a relatively higher Reynolds number, which constitutes one of the main sources of induced hydrodynamic noise. Therefore, there is a significant need to conduct a systematic investigation of the flow structure around these components.
In this paper, the developed minimally invasive SPIV system is utilized to investigate the wake of the sail and the junction of the sail root and the hull under different yaw conditions. The experiments were conducted at freestream Reynolds numbers of ReL= 0.46 × 10⁷ and ReL= 1.08 × 10⁷, based on the local freestream velocity and the hull length; the latter number was higher than those in previous works involving submarine flow field experiments under yaw conditions. The yaw angles were chosen as 6° and 9°, to investigate the flow under different horizontal maneuvering conditions. The work in this paper can provide a more thorough understanding of the flow around a maneuvering fully appended SUBOFF submarine and enrich the benchmark database for the validation and improvement of numerical simulations of submarine wakes.

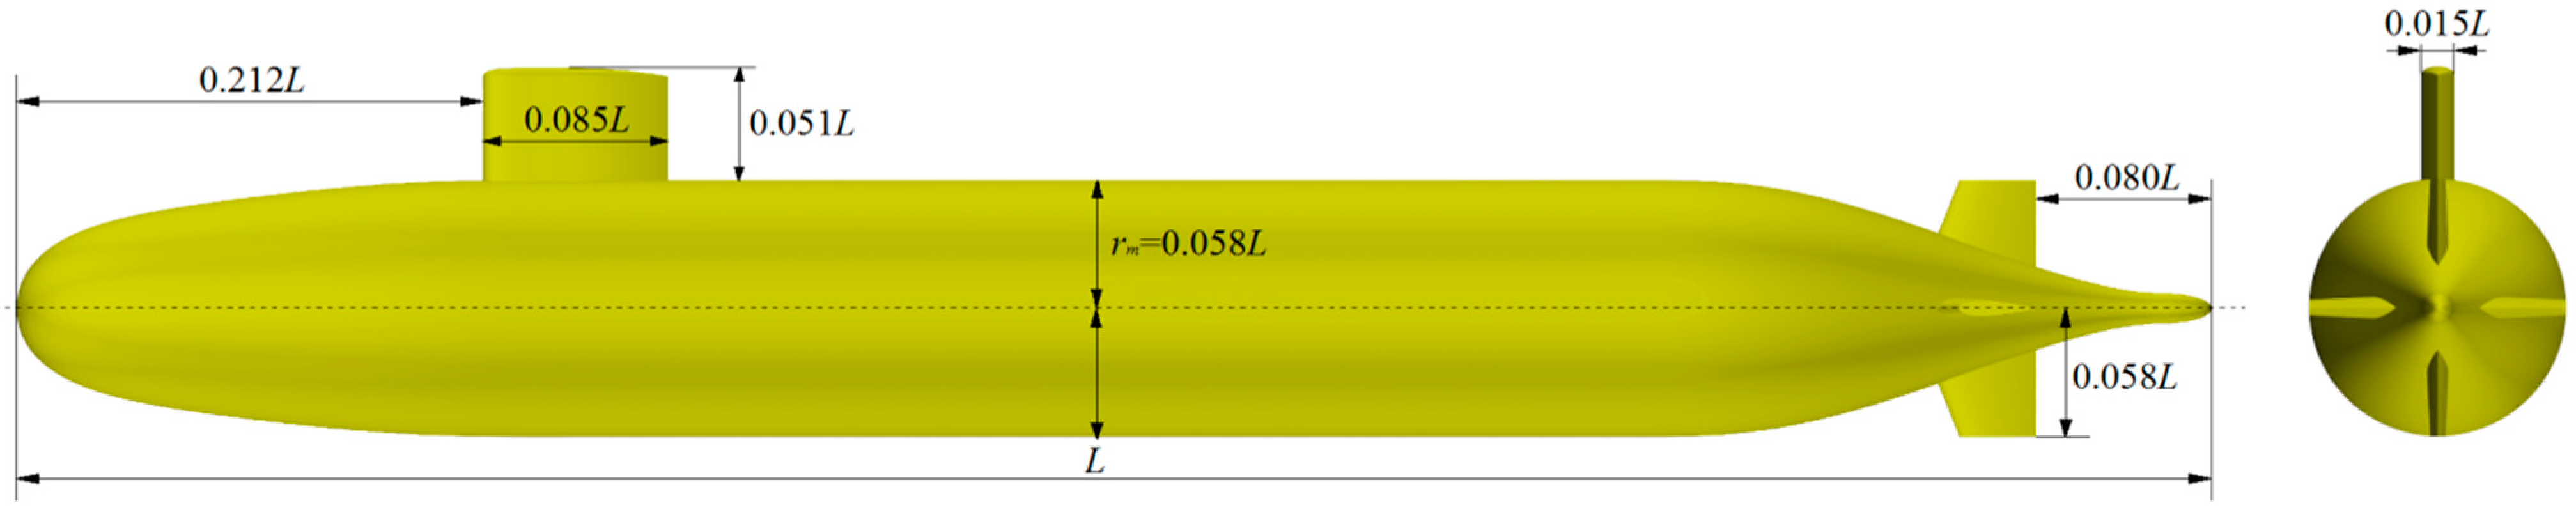
2. The SUBOFF Submarine Model

Figure 1 depicts the DARPA SUBOFF submarine model, featuring a length of L = 4.356 m, as initially introduced and comprehensively described by Groves [45]. The hull design adheres to an axisymmetric body of revolution, characterized by a radius-to-length ratio of rm/L = 0.058. The hull is segmented into distinct parts, including a forebody with a length of 0.233L, a cylindrical middle body spanning 0.512L, an afterbody extending 0.255L, and an afterbody cap with a length of 0.022L. The sail, positioned 0.212L from the bow, has a length of 0.085L and a height of 0.051L. The stern appendages consist of four identical fins arranged in a cruciform pattern, with their trailing edge situated 0.080L from the hull’s terminus. The cross-sectional profile of these stern appendages is derived from the NACA0020 airfoil geometry. This configuration represents a meticulously engineered design tailored for submarine applications.

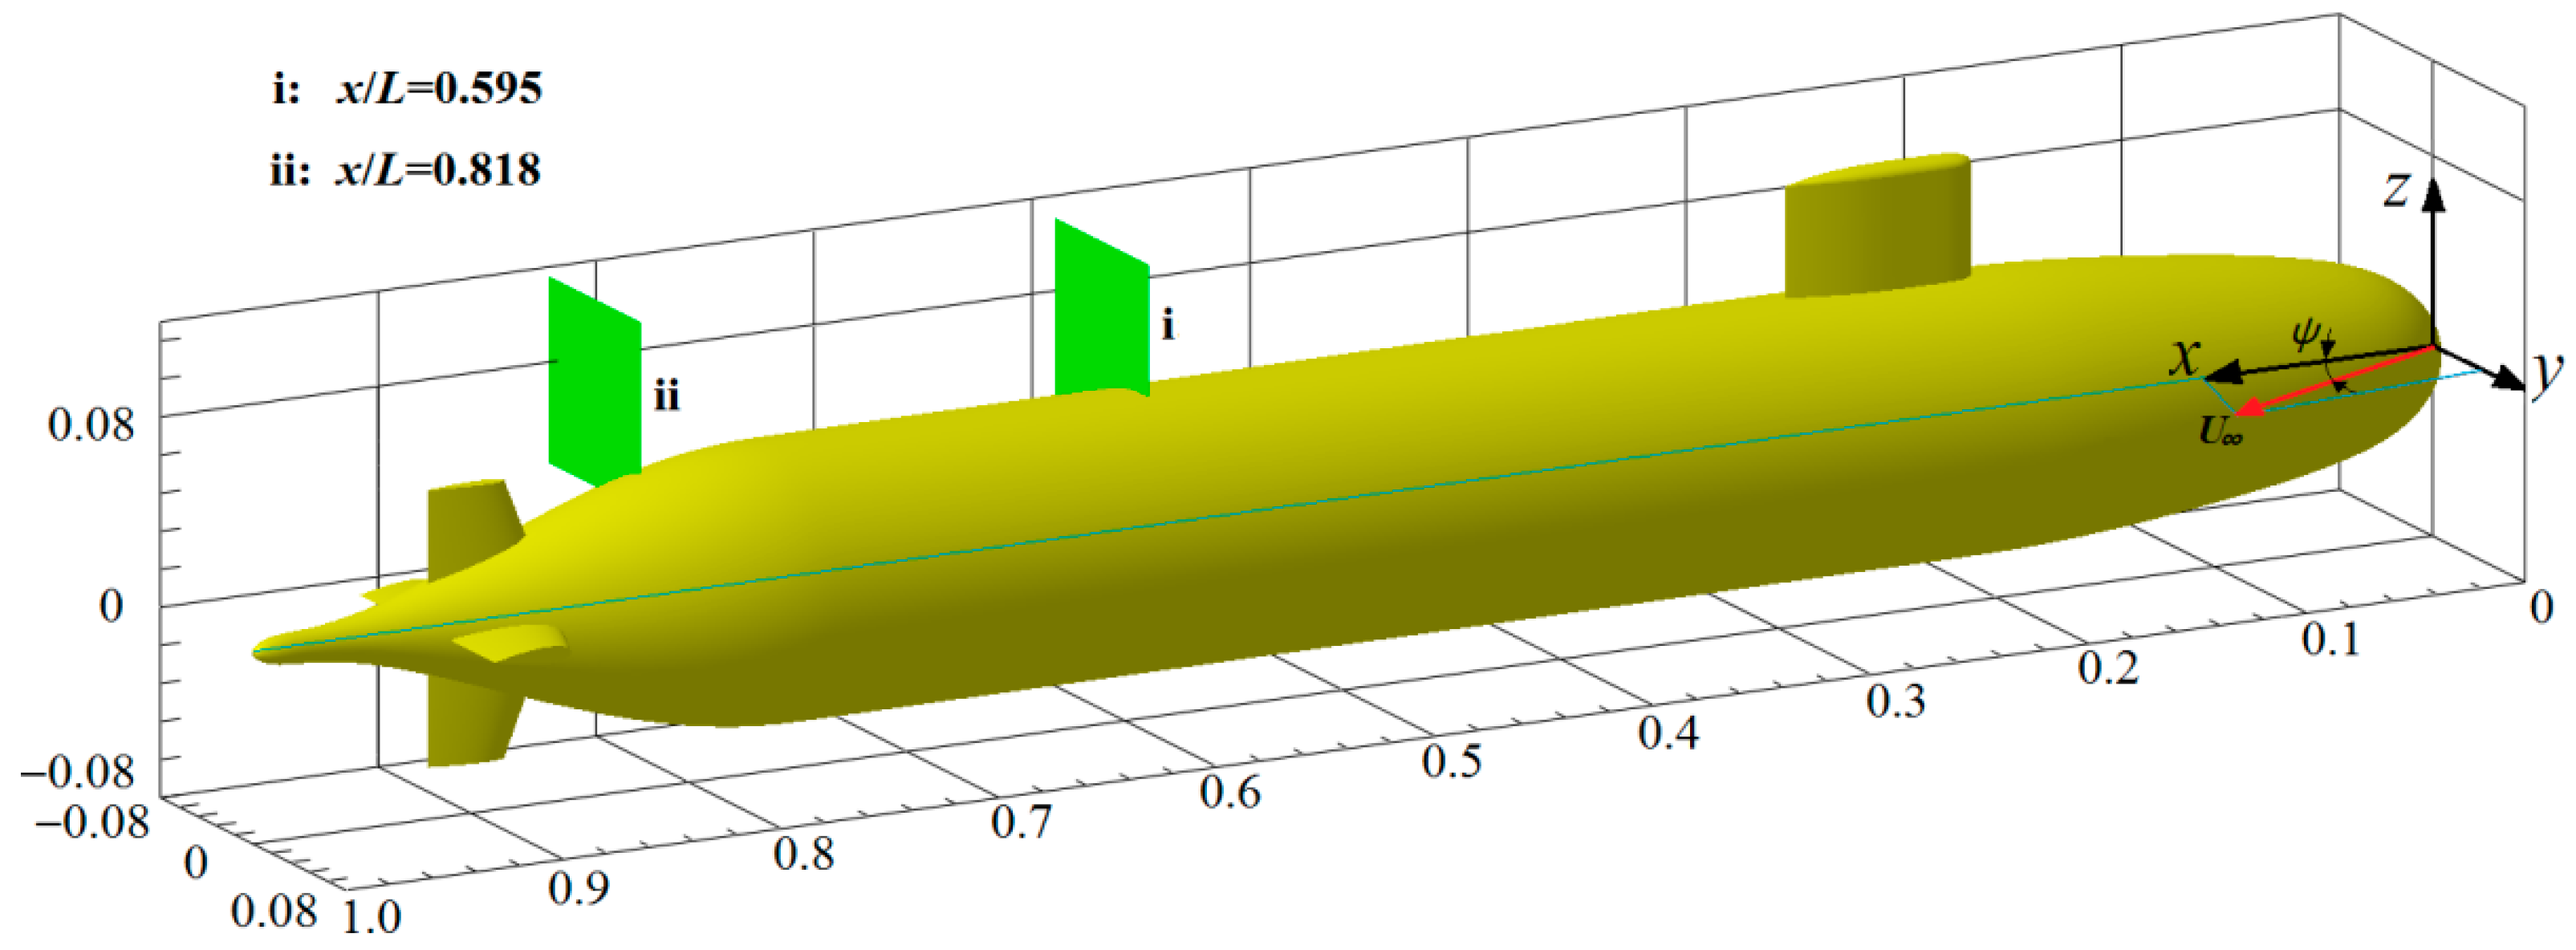
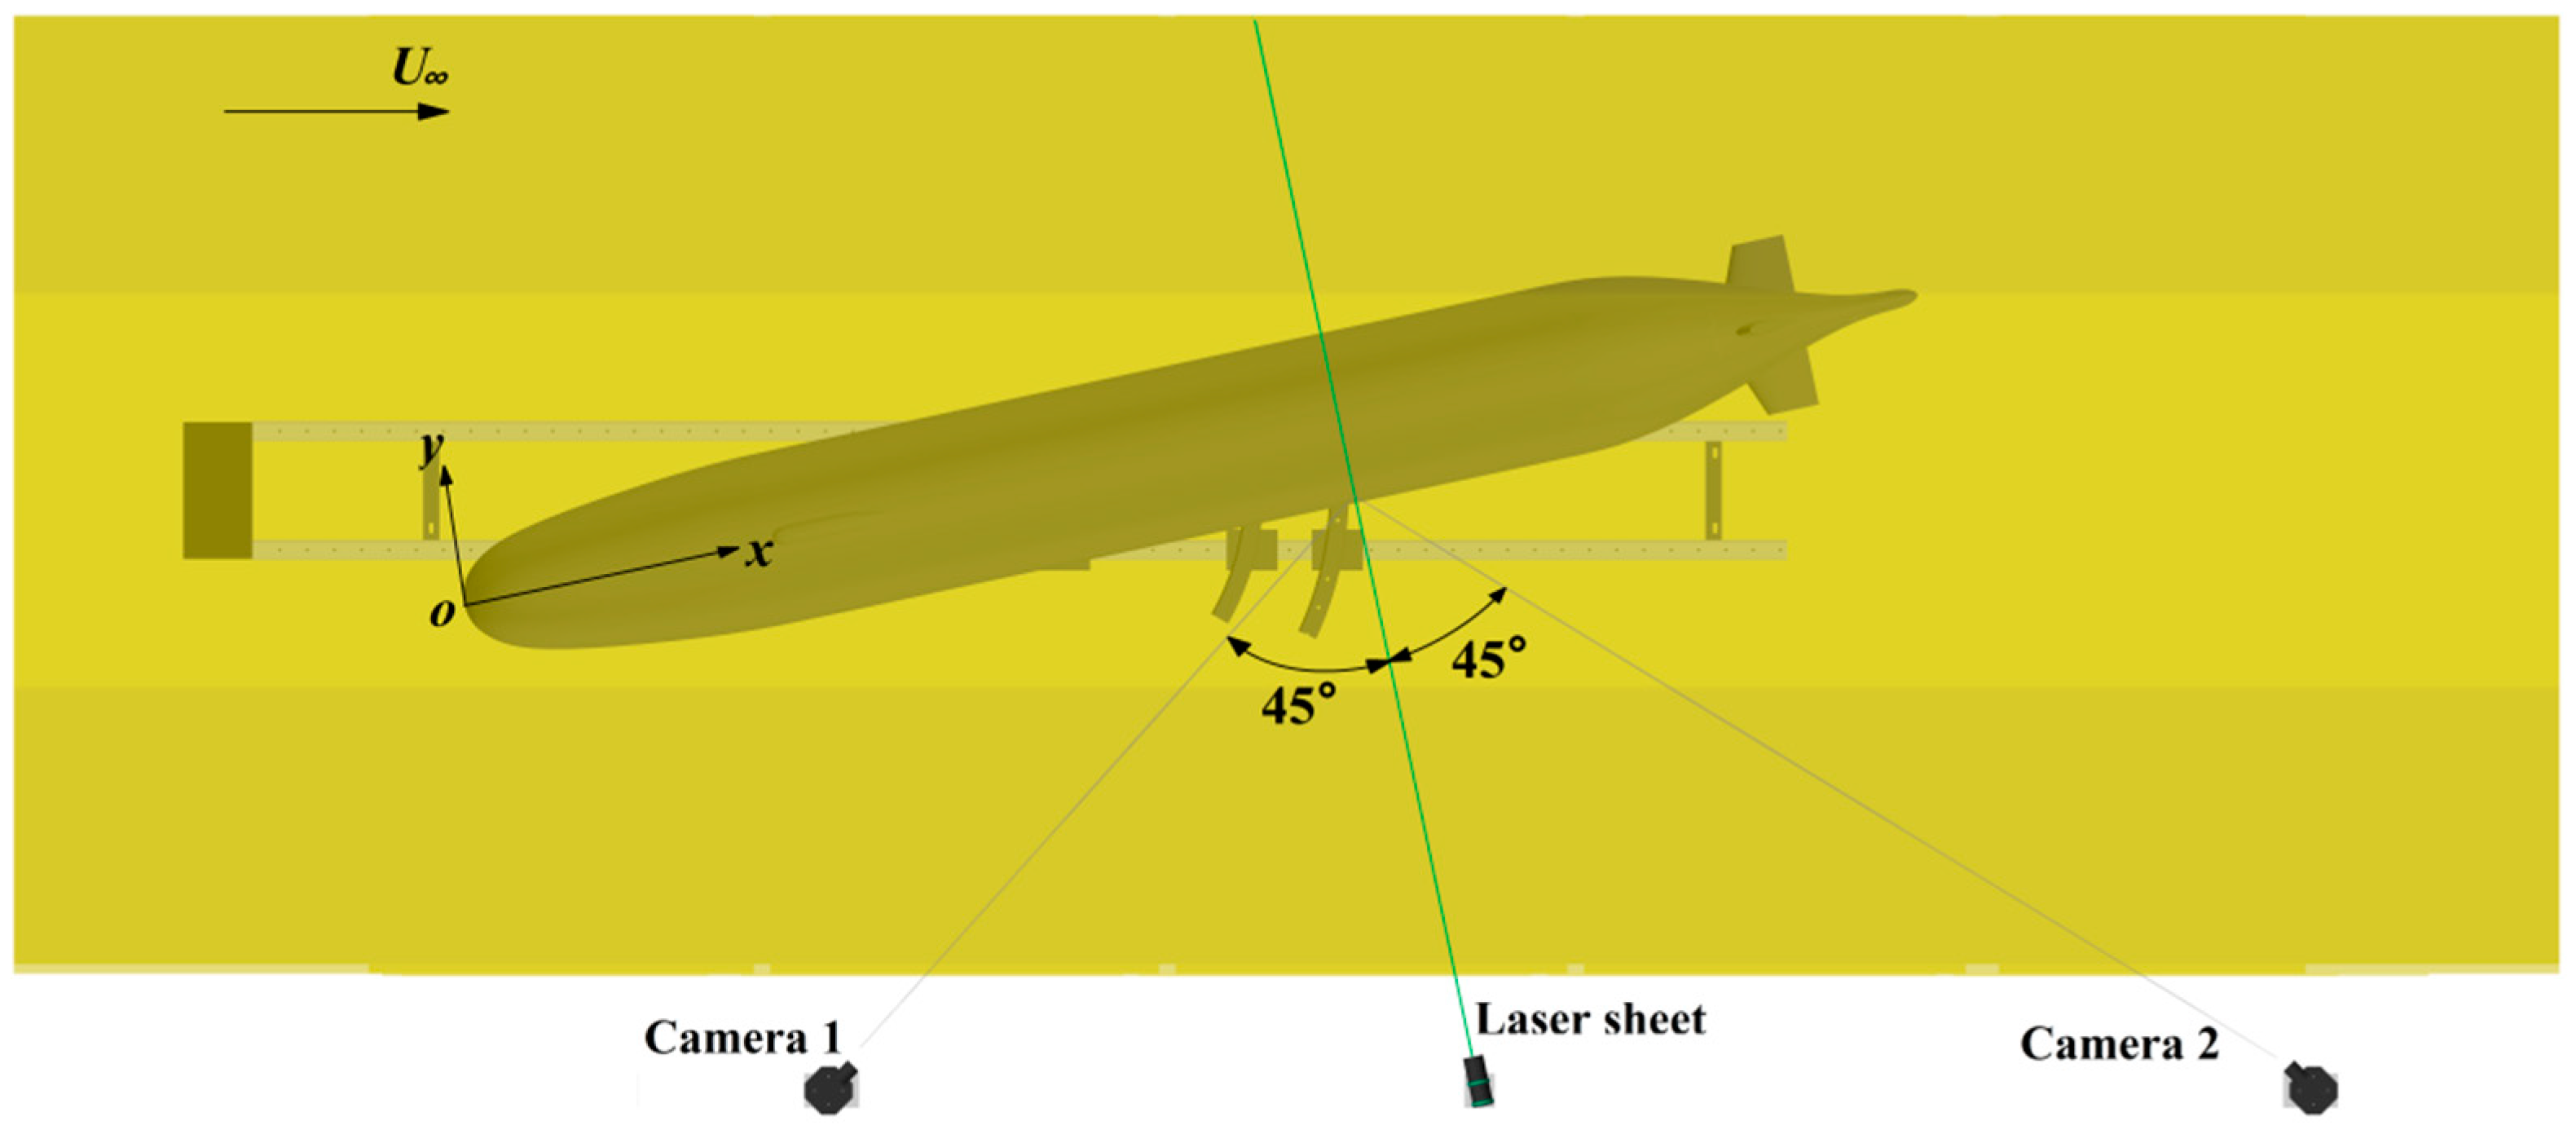
3. Measurements Planes and Coordinate System

The experimental results were calculated within a rectangular, right-handed coordinate system o-xyz, integral to the platform, with its origin o positioned at the terminal point of the bow, as illustrated in Figure 2. The x-axis is aligned parallel to the longitudinal axis of the hull, directed towards the stern. The y-axis designates the starboard direction, whereas the z-axis is oriented vertically upwards. The velocity field was captured utilizing a stereoscopic particle image velocimetry (SPIV) system at two strategic model-length locations, specifically at x/L = 0.595 and x/L = 0.818, with the normal direction of these measurement planes aligned parallel to the x-axis. The experiments were conducted under freestream conditions characterized by Reynolds numbers (ReL) based on two typical freestream velocities: U = 15 m/s and U = 35 m/s, specifically at ReL = 0.46 × 10⁷ and ReL = 1.08 × 10⁷, respectively, using the hull length as the characteristic length. To mirror the drift angles employed in conventional maneuverability tests, various yaw angles (ψ) were selected, namely ψ = 6° and ψ = 9°. This experimental setup presents an opportune platform for collaborative measurements and investigations into the flow field dynamics and maneuverability performance of the submarine, facilitating a deeper understanding of its hydrodynamic behavior under varying conditions. It is crucial to highlight that no turbulence stimulators were employed in the SPIV experiments.

4. Experimental Facilities and Measuring Techniques
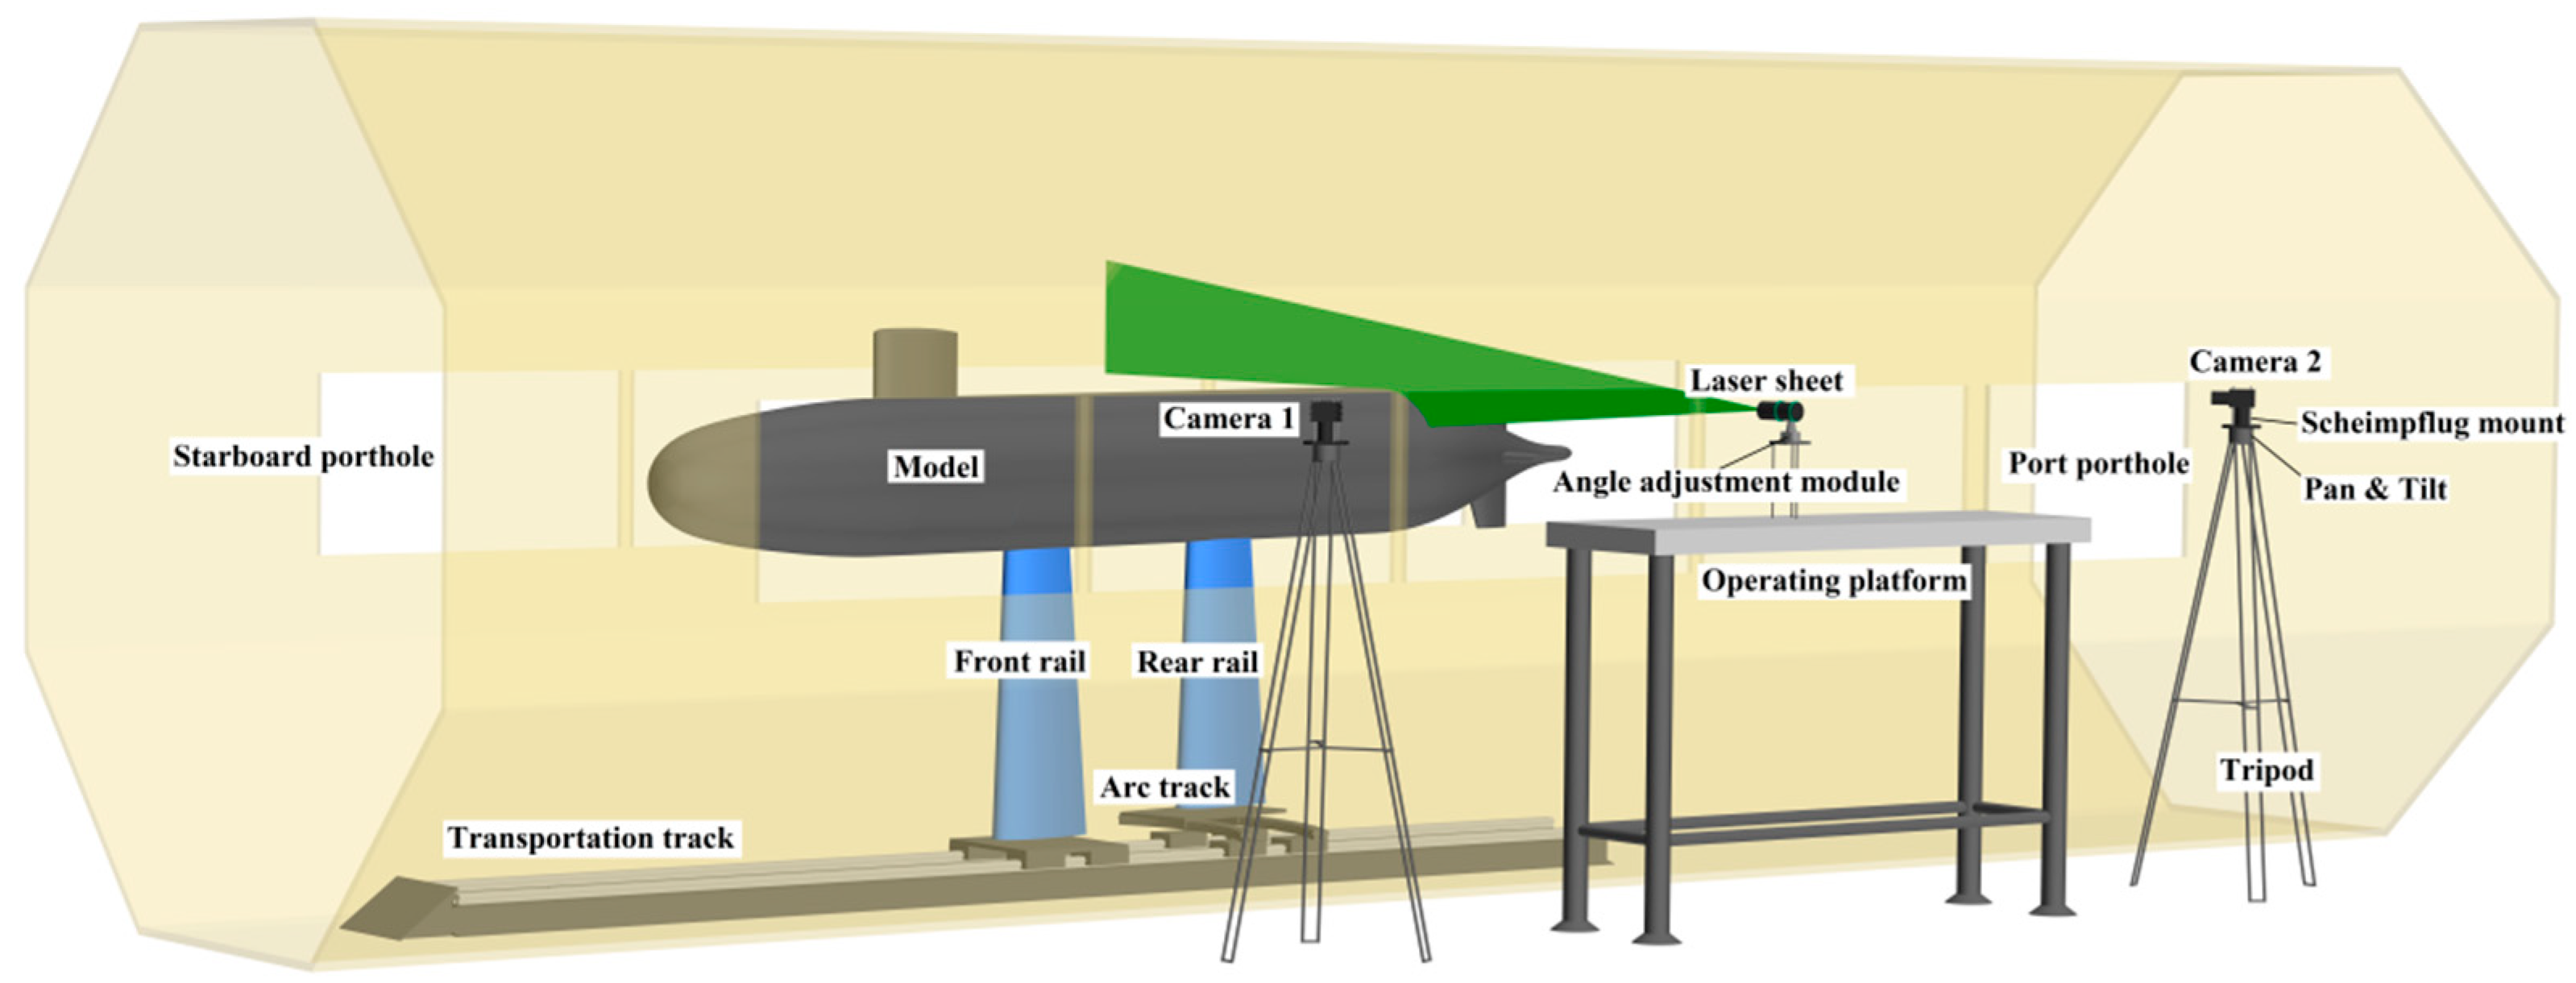
4.1. Facility

The experiments were conducted in the wind tunnel situated at the National Key Laboratory of Hydrodynamics, China Ship Scientific Research Center. This low-speed wind tunnel operates in a closed-loop mode and boasts an 8.5 m long test section featuring a prismatic cross-section with an area of 3 m × 3 m. The wind speed range is continuously adjustable, spanning from 3 m/s to 93 m/s, while maintaining a flow deflection of less than 0.1 degrees and an average free-stream turbulence intensity approximately equal to 0.1%.
To facilitate flexible and precise positioning of the submarine model in the longitudinal direction for the measurements across multiple sections, a transportation track was specifically designed and installed on the floor of the wind tunnel’s experimental section. Two rails, featuring cross-sectional profiles derived from the NACA0012 curve, were mounted on this track and functioned to support the model. The root of the rear rail was connected to the longitudinal track through a sliding curved arc track, which was centered on the root of the front rail, thereby enabling the SUBOFF model to be positioned at any desired yaw angle within a range of ±16 degrees. Figure 3 presents the diagram of the wind tunnel SPIV experimental setup.

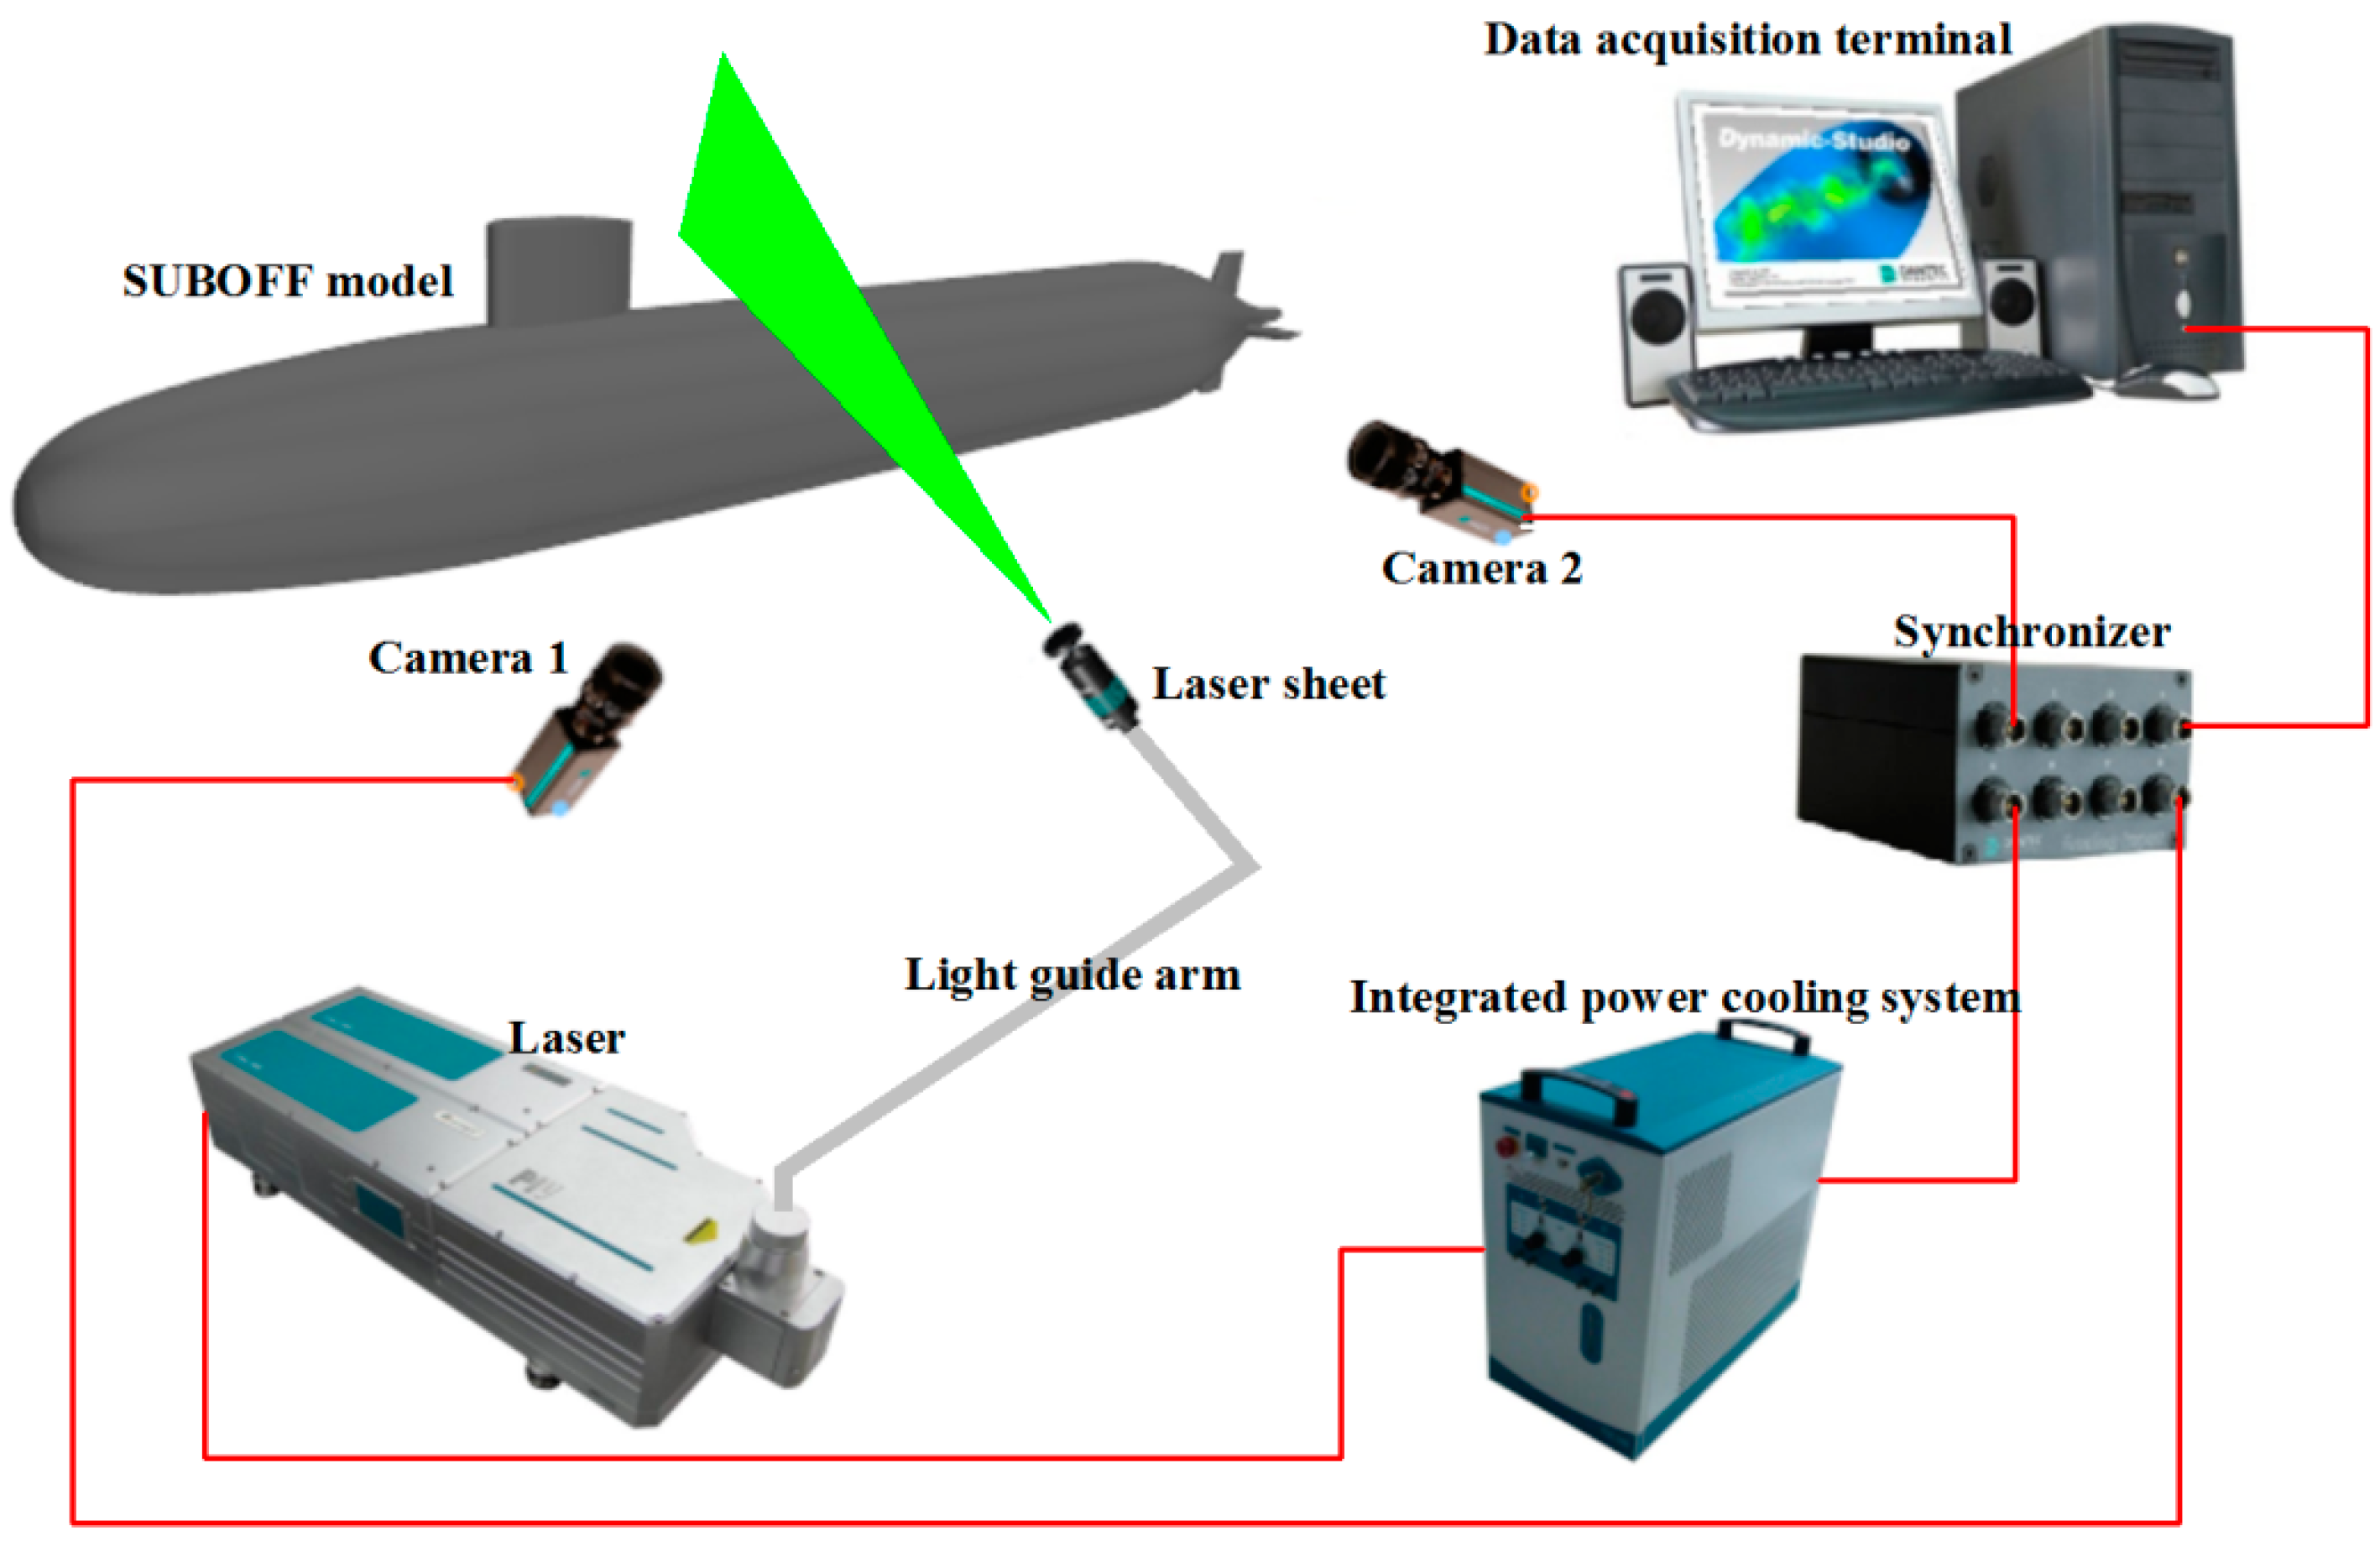
4.2. Stereo Particle Image Velocimetry System

The measurement campaign of the flow field surrounding the fully appended SUBOFF model was carried out using a stereo particle image velocimetry (SPIV) system. Figure 4 and Figure 5 show the SPIV system and experimental setup, respectively. The main components of the system are two cameras and a focused laser. Di-Ethyl-Hexyl-Sebacic (DEHS, molecular formula: CH)8(COOC8H17)2) oil droplets with a diameter of 3 μm and a density of 0.91 g/cm3 are utilized for the generation of seeding particles and are injected downstream from the measurement section by an FT700CE type liquid seeder. The fog generated spreads throughout the wind tunnel in the closed-loop operational mode, leading to a global and uniform seeding. The light sheet, used for illuminating the particles, is generated by a 380 mJ dual-cavity Vlite-380-laser (Beamtech Optronics Co., Ltd., Beijing, China) with a wavelength of 532 nm and the highest repetition rate of 15 Hz. The scattered light is captured by two FlowSense EO 6M-25 (Dantec Dynamics A/S, Copenhagen, Denmark) (2756 × 2208 pixel, 12-bit, monochrome) cameras from different perspectives at a sampling frequency of 10 Hz. The sheet light source module is located on a two-degree-of-freedom displacement platform with adjustable pitch and yaw, allowing flexible adjustment of the position of the light sheet. The cameras, placed outside the wind tunnel portholes and symmetrically arranged at a 45-degree angle on two sides of the measurement plane, are equipped with a pair of 135 mm, F2.8 Nikon lenses (Nikon Corporation, Tokyo, Japan) and mounted on Scheimpflug mounts.
Figure 6 depicts the scenario of the wind tunnel SPIV experiment. The sampling frequency is synchronized with the laser’s repetition rate at 10 Hz, achieved by an 81N20 synchronizer, and the sampling time per field of view is 216 s, enabling the experimental results to be ensemble averaged over a set of 2160 SPIV measurements. The exposure time is set to 38 μs and 16 μs for Reynolds numbers ReL = 0.46 × 10⁷ and ReL = 1.08 × 10⁷, respectively. This is calculated based on the light sheet thickness and the freestream velocity and adheres to the one-quarter rule [46]. It ensures that the particles are illuminated as effectively as possible while avoiding excessive streaking of the particle images during recording.

4.3. SPIV Data Processing

The commercial PIV software, DynamicStudio v 7.60 by Dantec Dynamics A/S, is utilized to conduct the post-processing. Adaptive PIV technology is adopted to calculate the three-component velocity on the two-dimensional measurement plane after obtaining the original particle images. The calculation of the correlation peaks is accelerated by the algorithm of the two-dimensional fast Fourier transform (FFT). The maximal size of the interrogation windows is 64 × 64 pixels, which represents the initial size in the first step of the adaptive iteration. The minimum size is 24 × 24 pixels, and a fixed overlap of 50% is used. The sizes of the interrogation windows after adaptive iterations depend on the local particle image intensity (signal-to-noise ratio not lower than 5), particle density (not lower than 8), and velocity gradients (absolute value not higher than 0.1).
A Gaussian 9-point subpixel function is used to enhance the precision of the particle displacement determination. Based on the principle that correlation peaks are not lower than 0.25, the ratio of the highest and second correlation peak is not less than 1.15, and the signal-to-noise ratio is not less than 4; miscalculated velocity vectors are eliminated and then replaced by the median of their surrounding 11 × 11 ones. Finally, based on the two-component velocity fields obtained from the two cameras and the calibration function calculated from the calibration images, the three-dimensional velocity vector field (2D-3C) on the measurement planes is reconstructed. The resulting spatial resolutions of the velocity vectors are 1.44 mm and 1.21 mm in the horizontal and vertical directions, respectively.

5. Results and Discussion

This section presents the experimental results of the velocity field, which are ensemble averaged over a batch of 2160 SPIV measurements sampled at 10 Hz. The main results are shown in dimensionless form. Comparisons of the results for two selected model-length locations (x/L = 0.595 and x/L = 0.818), two Reynolds numbers (ReL= 0.46 × 10⁷ and ReL= 1.08 × 10⁷), and two yaw angles (ψ = 6° and ψ = 9°) are provided. Drawing upon the works of Sciacchitano and Wieneke [47], as well as Lee [16], within a 0.02L radius centered on the sail-tip vortex, the assessed uncertainty for the key flow characteristic parameters that we delve into in the subsequent sections is confined to a range of no more than ±0.01.

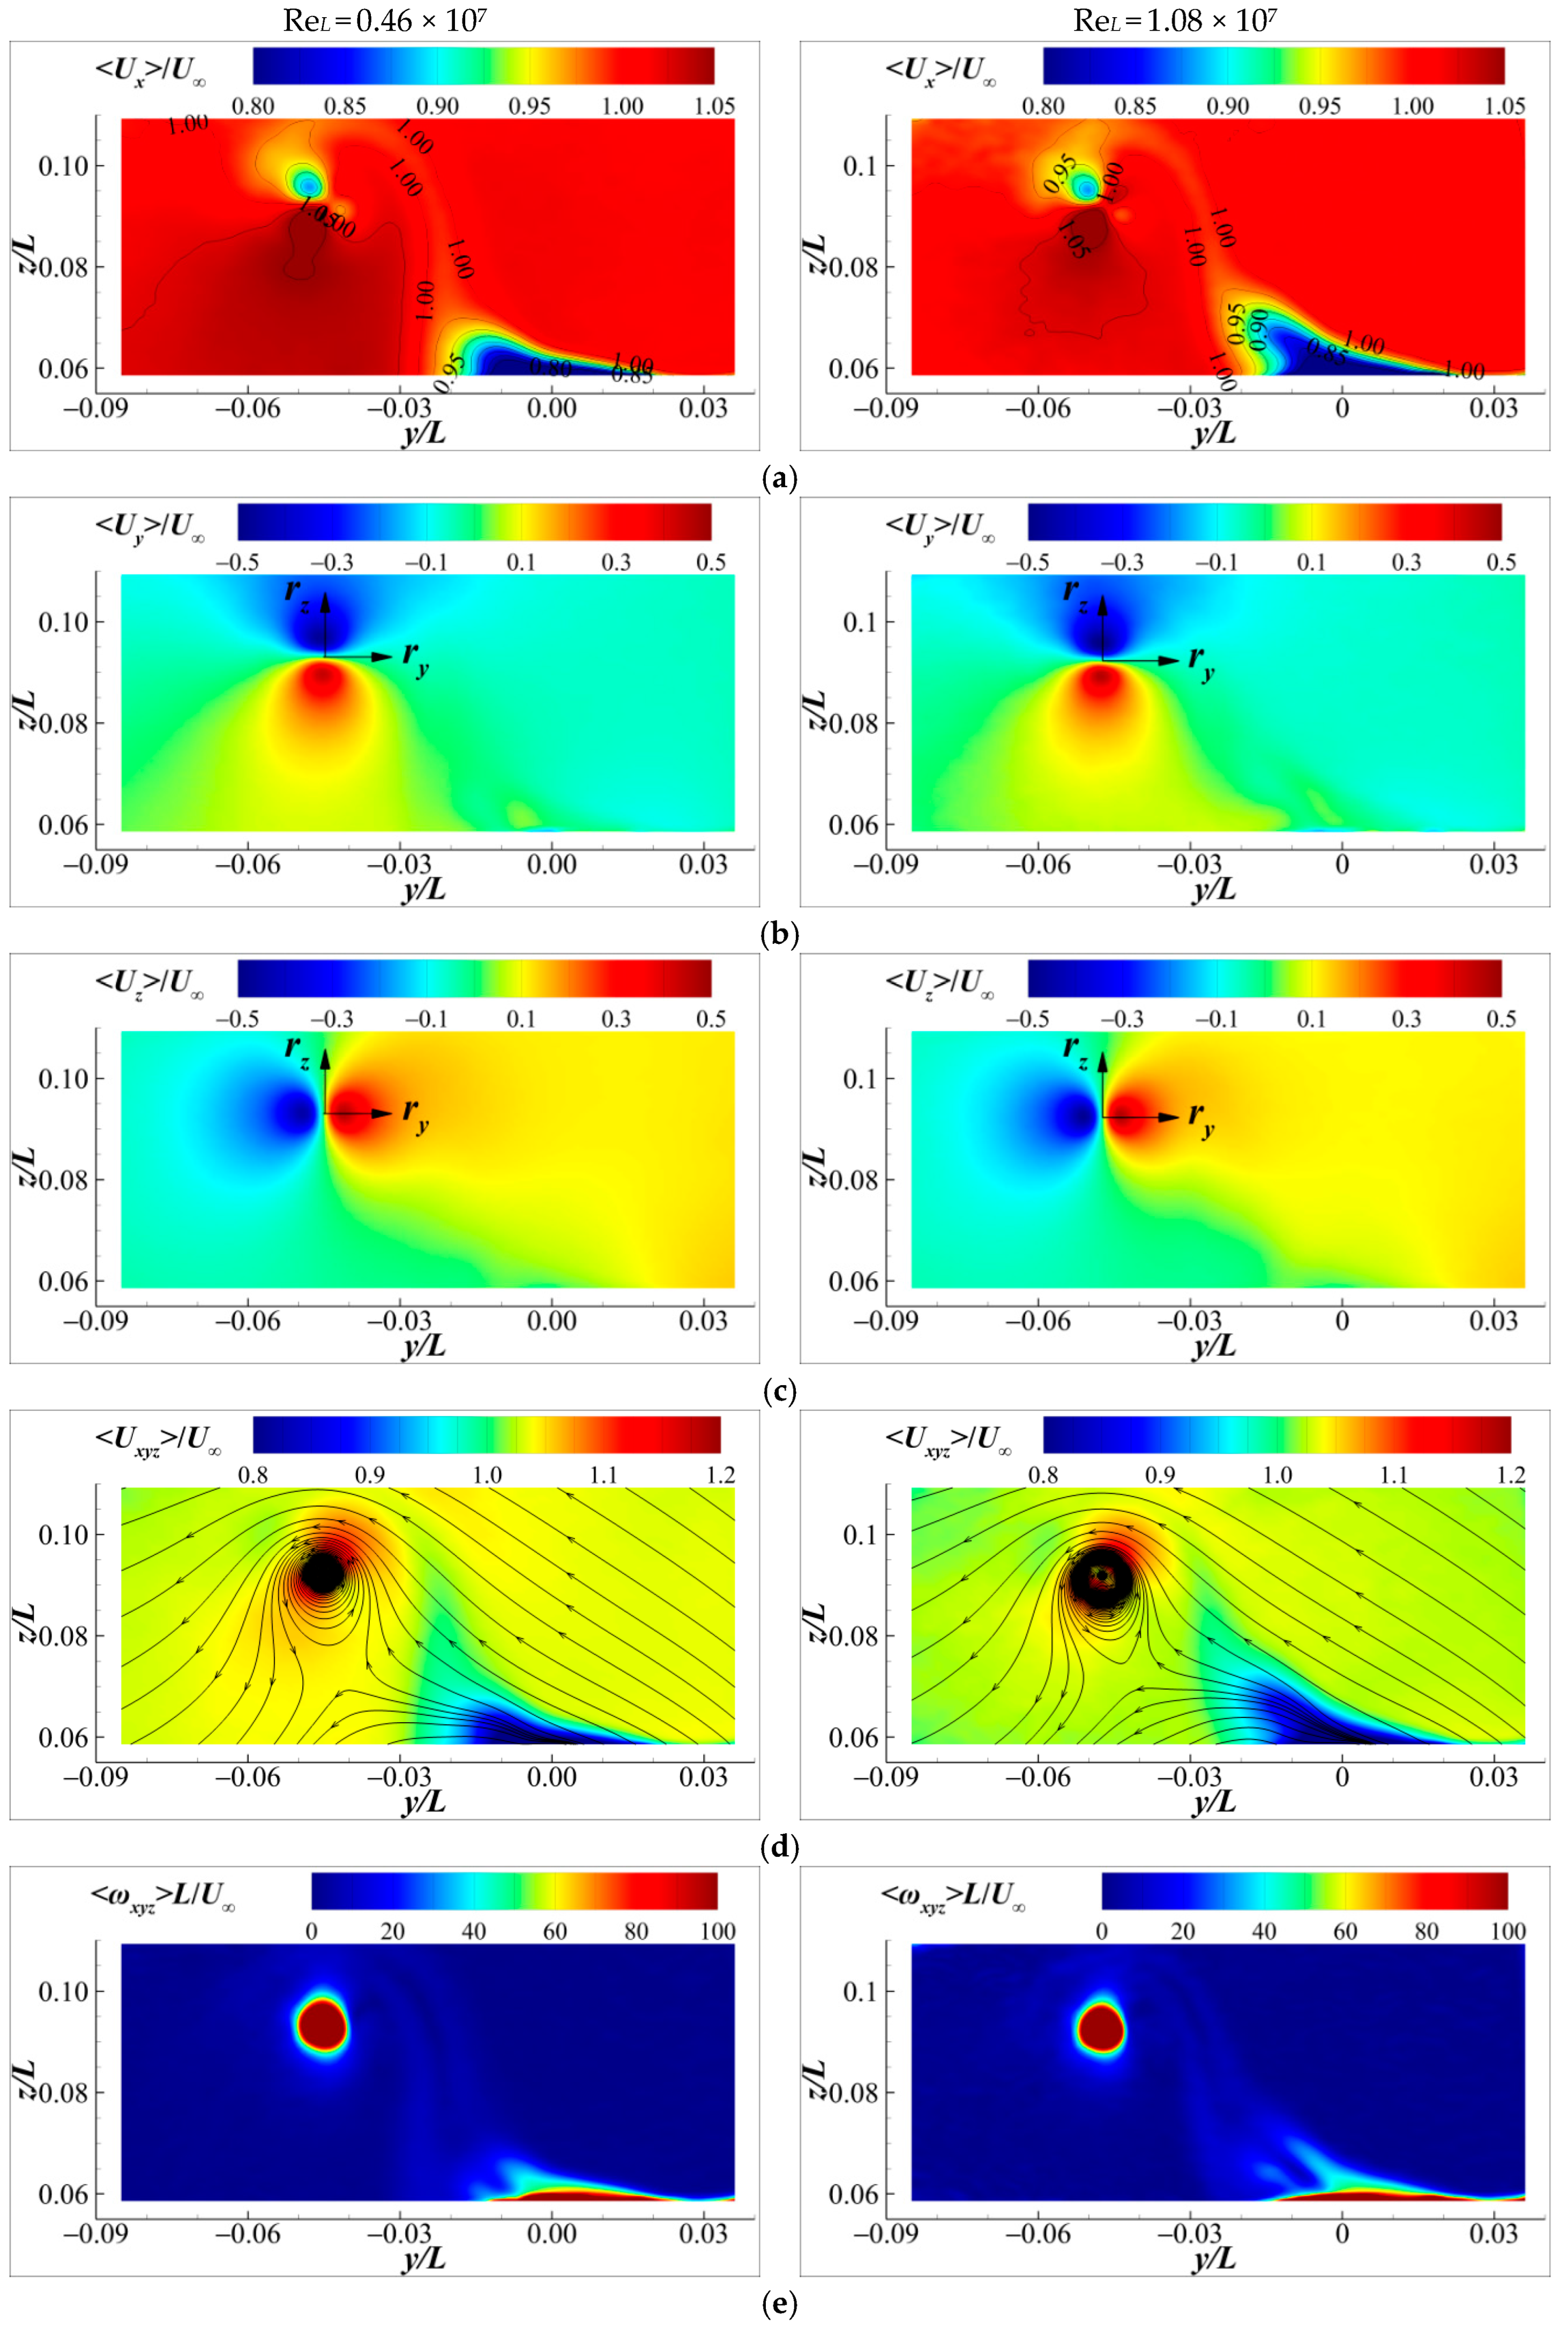
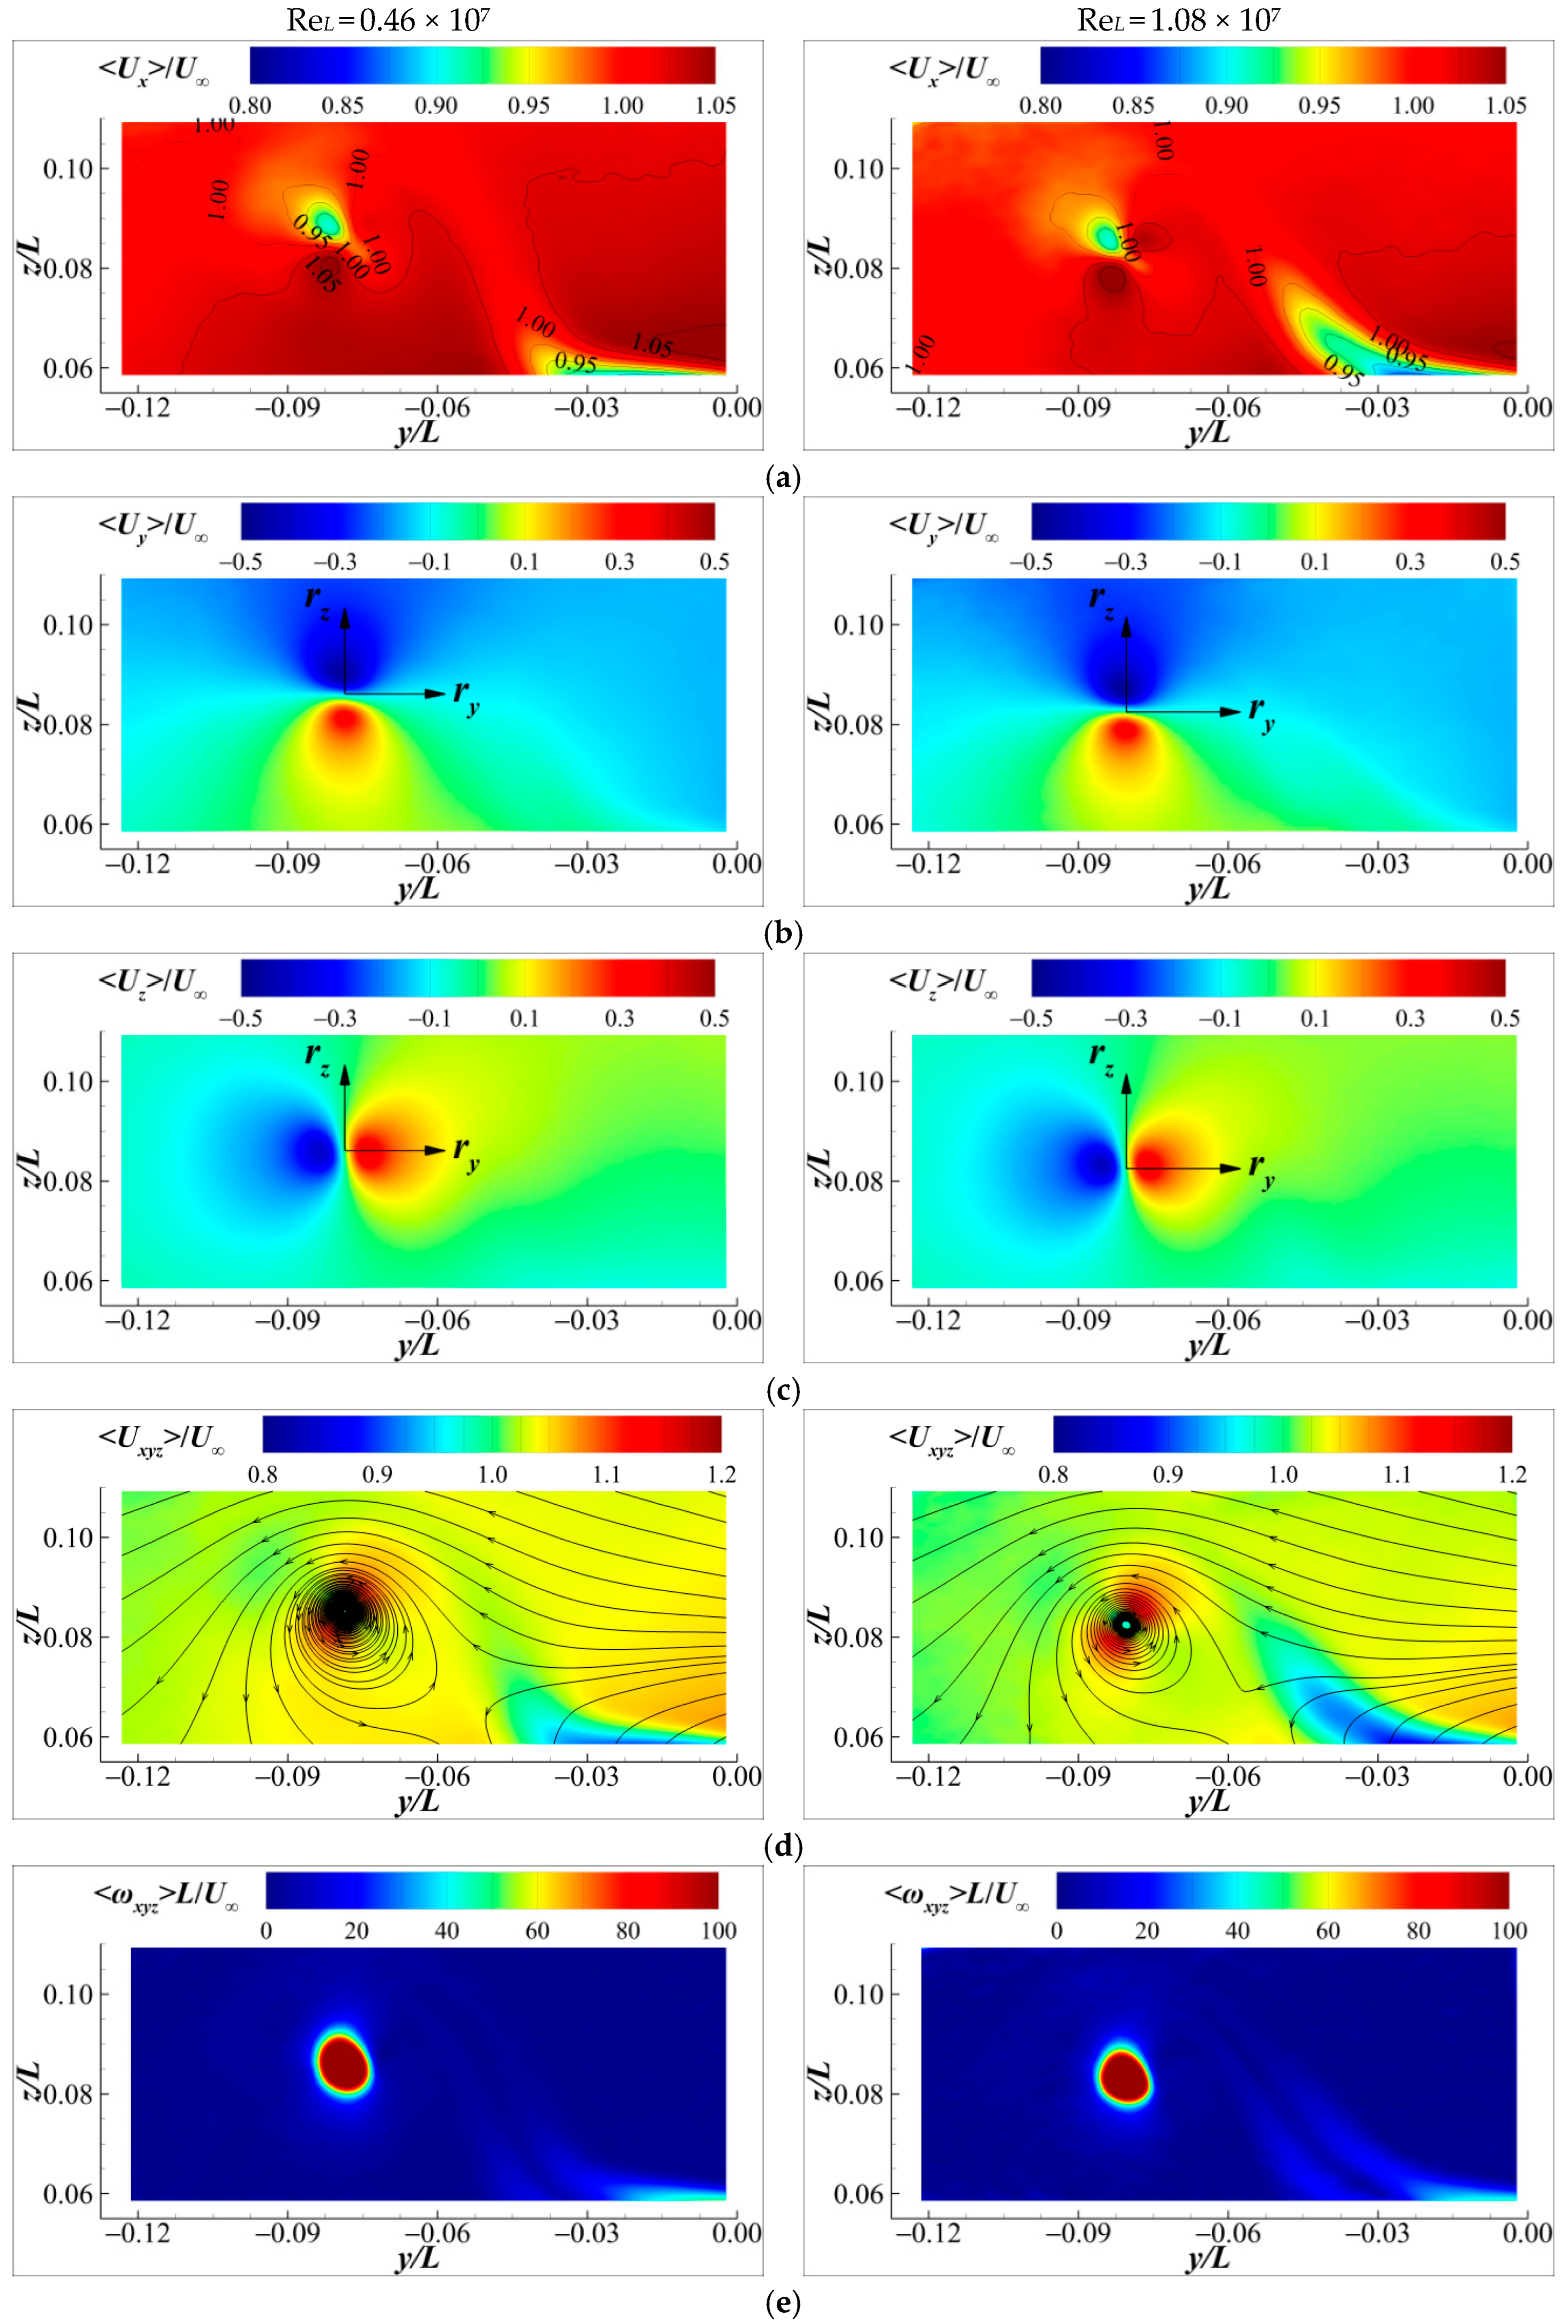
5.1. Velocity and Vorticity Fields

Figure 7, Figure 8, Figure 9 and Figure 10 provide a global presentation of the experimental results. The ensemble-averaged axial, lateral, vertical, and resultant velocities are denoted by <Ux>/U, <Uy>/U, <Uz>/U, and <Uxyz>/U, respectively. The ensemble-averaged vorticity magnitude is non-dimensionalized as <ωxyz>L/U. The wake of the sail and the junction of the sail root and the hull are visible as a region of low velocity, where the vorticity is much higher and mainly concentrated on the suction (leeward) side. Under yaw conditions, the wake originating from the top of the sail rolls up to form the sail-tip vortex, whose center exhibits a core flow with a resultant velocity slightly lower than the freestream velocity, as shown in Figure 7d, Figure 8d, Figure 9d, and Figure 10d. The coordinates (ry, rz) are defined at the sail-tip vortex center, and the specific coordinate positions in the coordinate system o-xyz are shown in Table 1 and Figure 11. The cross-stream velocity at the statistical vortex center is zero, i.e., the lateral and vertical velocities are both zero.
The lateral velocities on the upper and lower sides near the sail-tip vortex center, as well as the vertical velocities on the windward and leeward sides, exhibit an almost asymmetric distribution, as illustrated in Figure 7b,c, Figure 8b,c, Figure 9b,c, and Figure 10b,c. As shown in Figure 7e, Figure 8e, Figure 9e, and Figure 10e, A more detailed description of the flow near the sail-tip vortex center is provided below. Along the direction of flow evolution, the vorticity continuously dissipates, and the vorticity magnitude in section x/L = 0.818 is relatively lower than that in section x/L = 0.595. Further downstream, except for the sail-tip vortex center and the wake of the junction of the sail root and the hull, the vorticity originating from the sail has almost completely dissipated. The influence of the sail and hull on the axial velocity gradually decreases as the flow evolves downstream, and the velocity of the wake gradually increases along the hull axis, as shown in Figure 7a, Figure 8a, Figure 9a, and Figure 10a. However, there is almost no change in the lateral and vertical velocities. The vorticity magnitude at ψ = 9° is significantly stronger than that at ψ = 6°.
The non-dimensional velocity and vorticity fields at ReL= 0.46 × 10⁷ and ReL= 1.08 × 10⁷ are very similar, and the ensemble-averaged streamline distribution in the measurement planes is also almost identical. This indicates that the velocity and vorticity fields are insignificantly affected by the Reynolds numbers in the range from 0.46 × 10⁷ to 1.08 × 10⁷.
Table 1 and Figure 11 provide a summary of the sail-tip vortex centers, where the ensemble-averaged lateral and vertical velocities are both zero. In the yaw condition, a downwash of the sail-tip vortex center as it evolves downstream can be observed, as mentioned by Lee (2020) [16] and Chen (2023) [1]. These researchers have conducted detailed studies on this downwash process of the sail-tip vortex of submarines, utilizing PIV and large-eddy simulation (LES), respectively. As the yaw angle increases, the downwash of the sail-tip vortex center becomes more pronounced, and from ψ = 6° to ψ = 9°, the vertical coordinates of the sail-tip vortex center decrease by approximately 1.2% to 2.9%. The coordinates are also influenced by the Reynolds number, and as the Reynolds number increases, a more significant downwash of the sail-tip vortex center can also be observed. From ReL= 0.46 × 10⁷ to ReL= 1.08 × 10⁷, the relative decrease in vertical coordinates ranges from 0.5% to 1.5%. Furthermore, a higher Reynolds number corresponds to a slight deviation of the vortex center towards the suction side.

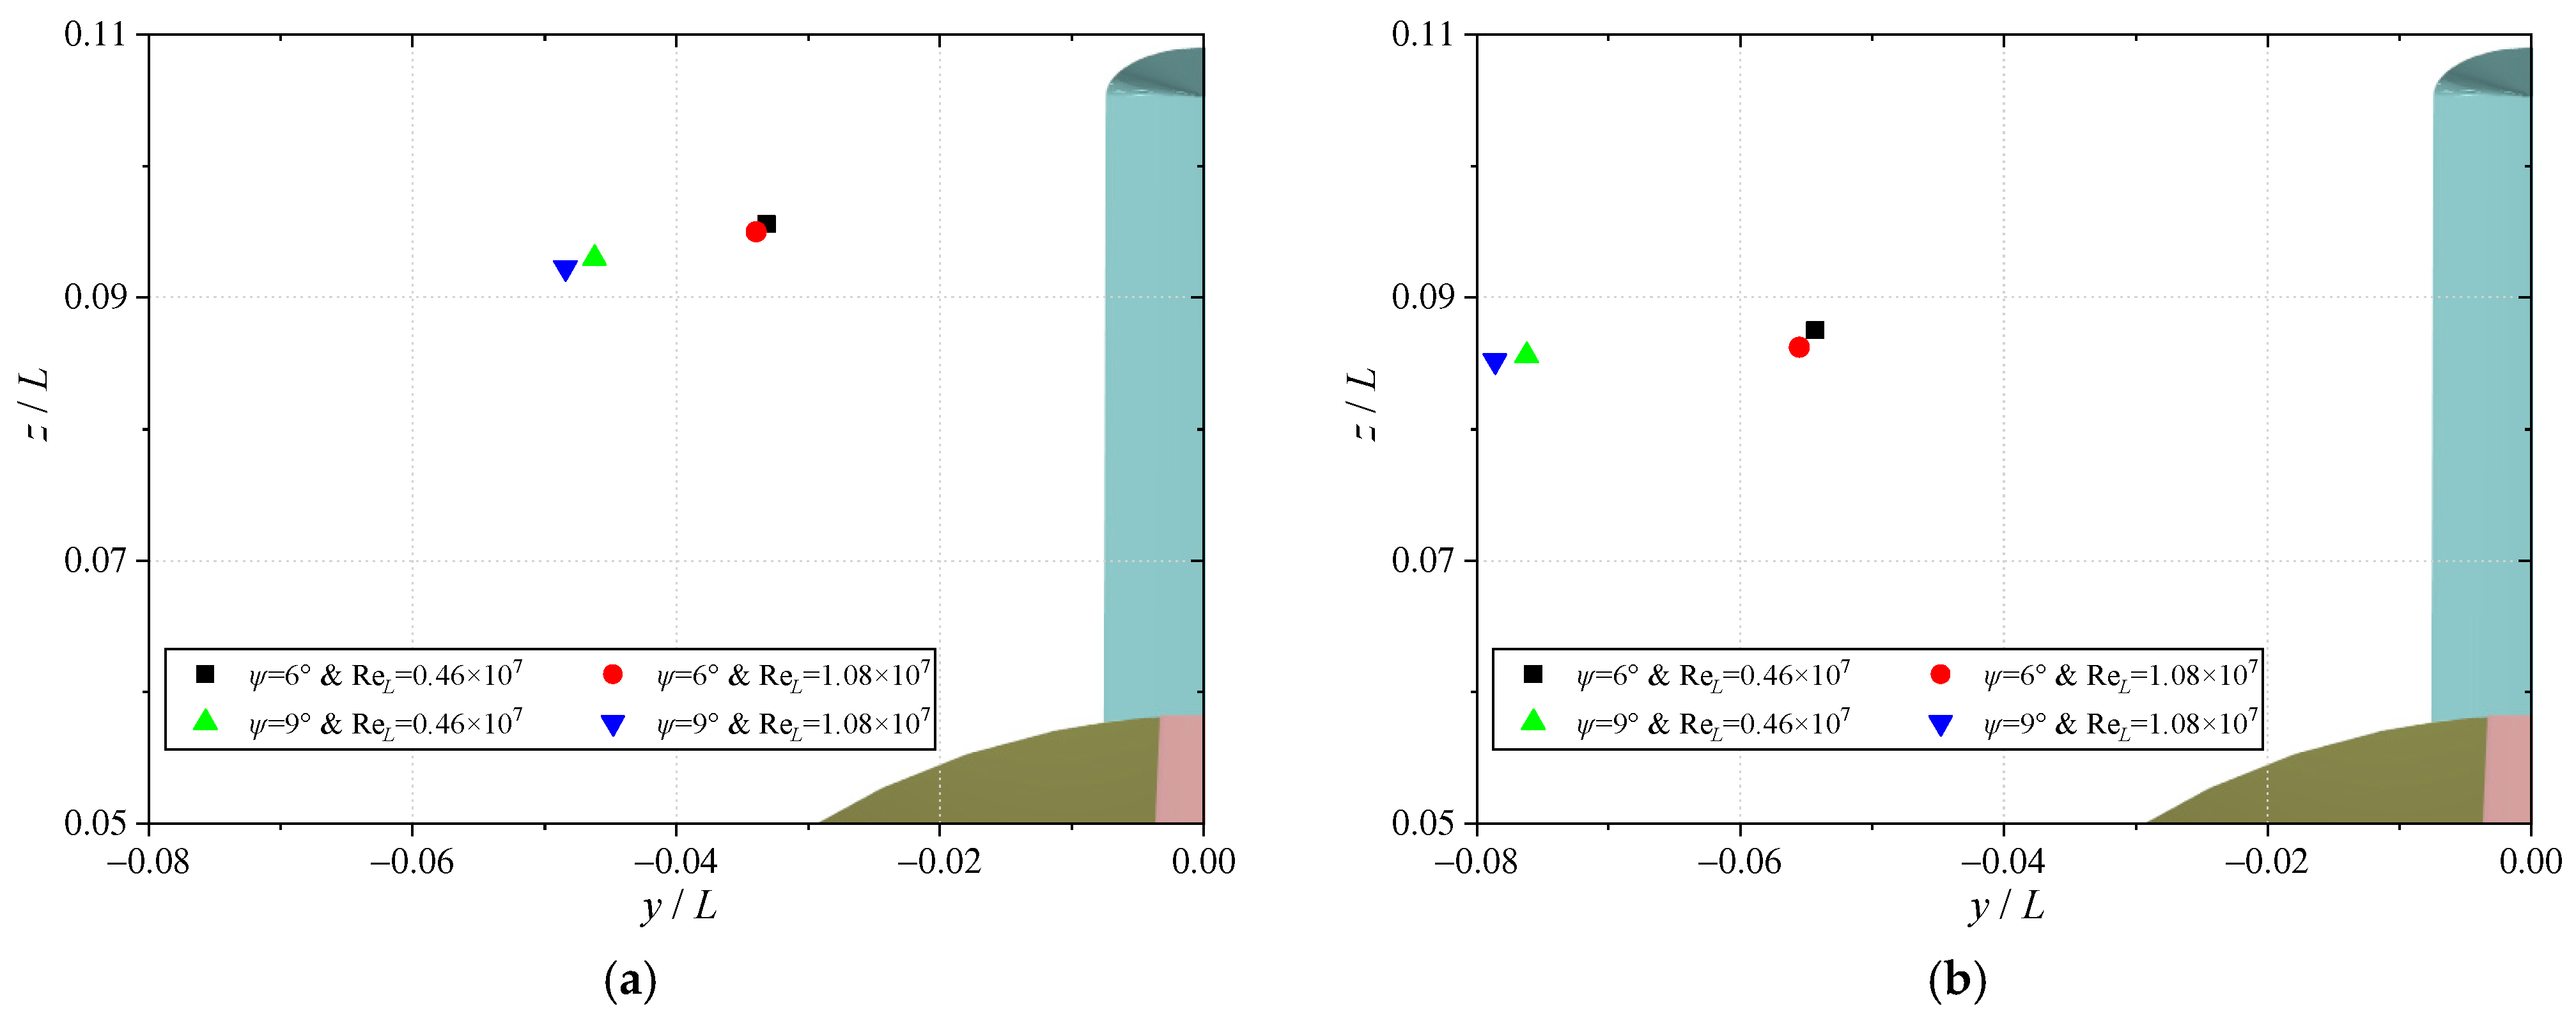
5.2. Characteristics of Sail-Tip Vortex

Given that the unsteady flow of the sail-tip vortex at higher Reynolds numbers is one of the main sources of induced submarine hydrodynamic noise, accurately capturing and elucidating the evolution characteristics of the sail wake during maneuvering conditions is of great significance for optimizing submarine hydrodynamic performance and reducing resistance and noise. In this subsection, a more detailed discussion of the flow characteristics near the sail-tip vortex is provided.
Figure 12, Figure 13, Figure 14, Figure 15 and Figure 16 provide plots of the resultant velocity (<Uxyz>), the vertical velocity (<Uz>), the normal Reynolds stresses (<uxux>, <uyuy>, and <uzuz>), the turbulence kinetic energy (TKE, k), and the vorticity magnitude (<ωxyz>); these are shown as functions of the lateral distance ry/L from the sail-tip vortex center. Figure 17 and Figure 18 provide plots of the lateral velocity (<Uy>) and TKE (k), respectively; these are shown as functions of the vertical distance rz/L from the sail-tip vortex center.
It can be seen that in yaw conditions, the ensemble-averaged resultant velocity in the sail-tip vortex center is slightly lower than the freestream velocity, and the difference between the two significantly decreases with the increase in the yaw angle. The distribution of the vertical velocity on the leeward and windward sides of the vortex center, as well as the lateral velocity on the upper and lower sides, is exhibited in an almost asymmetric form, as observed above. The vertical velocity on the windward side and the lateral velocity on the lower side of the vortex center exhibit positive values, while the opposite sides exhibit negative values. The maximum absolute positive and negative values increase with the increase in the yaw angle. The change in Reynolds number has almost no effect on the vertical velocity.
The normal Reynolds stresses and the TKE peak at the vortex center, and the peak values slightly increase with the increase in the Reynolds number, while they significantly increase with the increase in yaw angle. The lateral and vertical components of the normal Reynolds stresses show similar contributions to the TKE, and both are far greater than the axial component. The distribution of the vorticity magnitude is quite similar to that of the TKE, where vorticity is concentrated, momentum is intense, and TKE is significant.

6. Conclusions

In the paper, the developed minimally invasive SPIV system was utilized to investigate the wake of a SUBOFF submarine model at two yaw angles: ψ = 6° and ψ = 9°. The experiments were conducted at two Reynolds numbers: ReL= 0.46 × 10⁷ and ReL= 1.08 × 10⁷. The research presented in this paper offers a deeper insight into the complex flow patterns surrounding a fully appended SUBOFF submarine under maneuvering conditions, thereby enhancing the benchmark database crucial for validating and refining numerical simulations of submarine wakes. The conclusions derived from the analysis of these experimental results can be summarized as follows:
(1)
Under yaw conditions, the wake originating from the top of the sail rolls up to form the sail-tip vortex, whose center exhibits a core flow with a resultant velocity slightly lower than the freestream velocity. Along the direction of flow evolution, the vorticity continuously dissipates. Further downstream, except for the sail-tip vortex center and the wake generated at the junction of the sail root and the hull, the vorticity originating from the sail almost completely dissipates. The influence of the sail and hull on the axial velocity gradually diminishes as the flow progresses downstream, and the velocity of the wake gradually increases along the hull’s axial direction, but there is almost no change in the lateral and vertical velocities. The vorticity magnitude and turbulent kinetic energy (TKE) of the wake are stronger at a larger yaw angle, and they are insignificantly affected by the Reynolds number within the range of 0.46 × 10⁷ to 1.08 × 10⁷ or by the flow velocity.
(2)
Under yaw conditions, as the flow evolves downstream, a downwash of the sail-tip vortex center becomes evident. With the increase in the yaw angle and Reynolds number, this downwash effect becomes more pronounced. From ψ = 6° to ψ = 9°, the vertical coordinates of the sail-tip vortex center decrease by approximately 1.2% to 2.9%. Additionally, a higher Reynolds number results in a slight deviation of the vortex center towards the suction side.
(3)
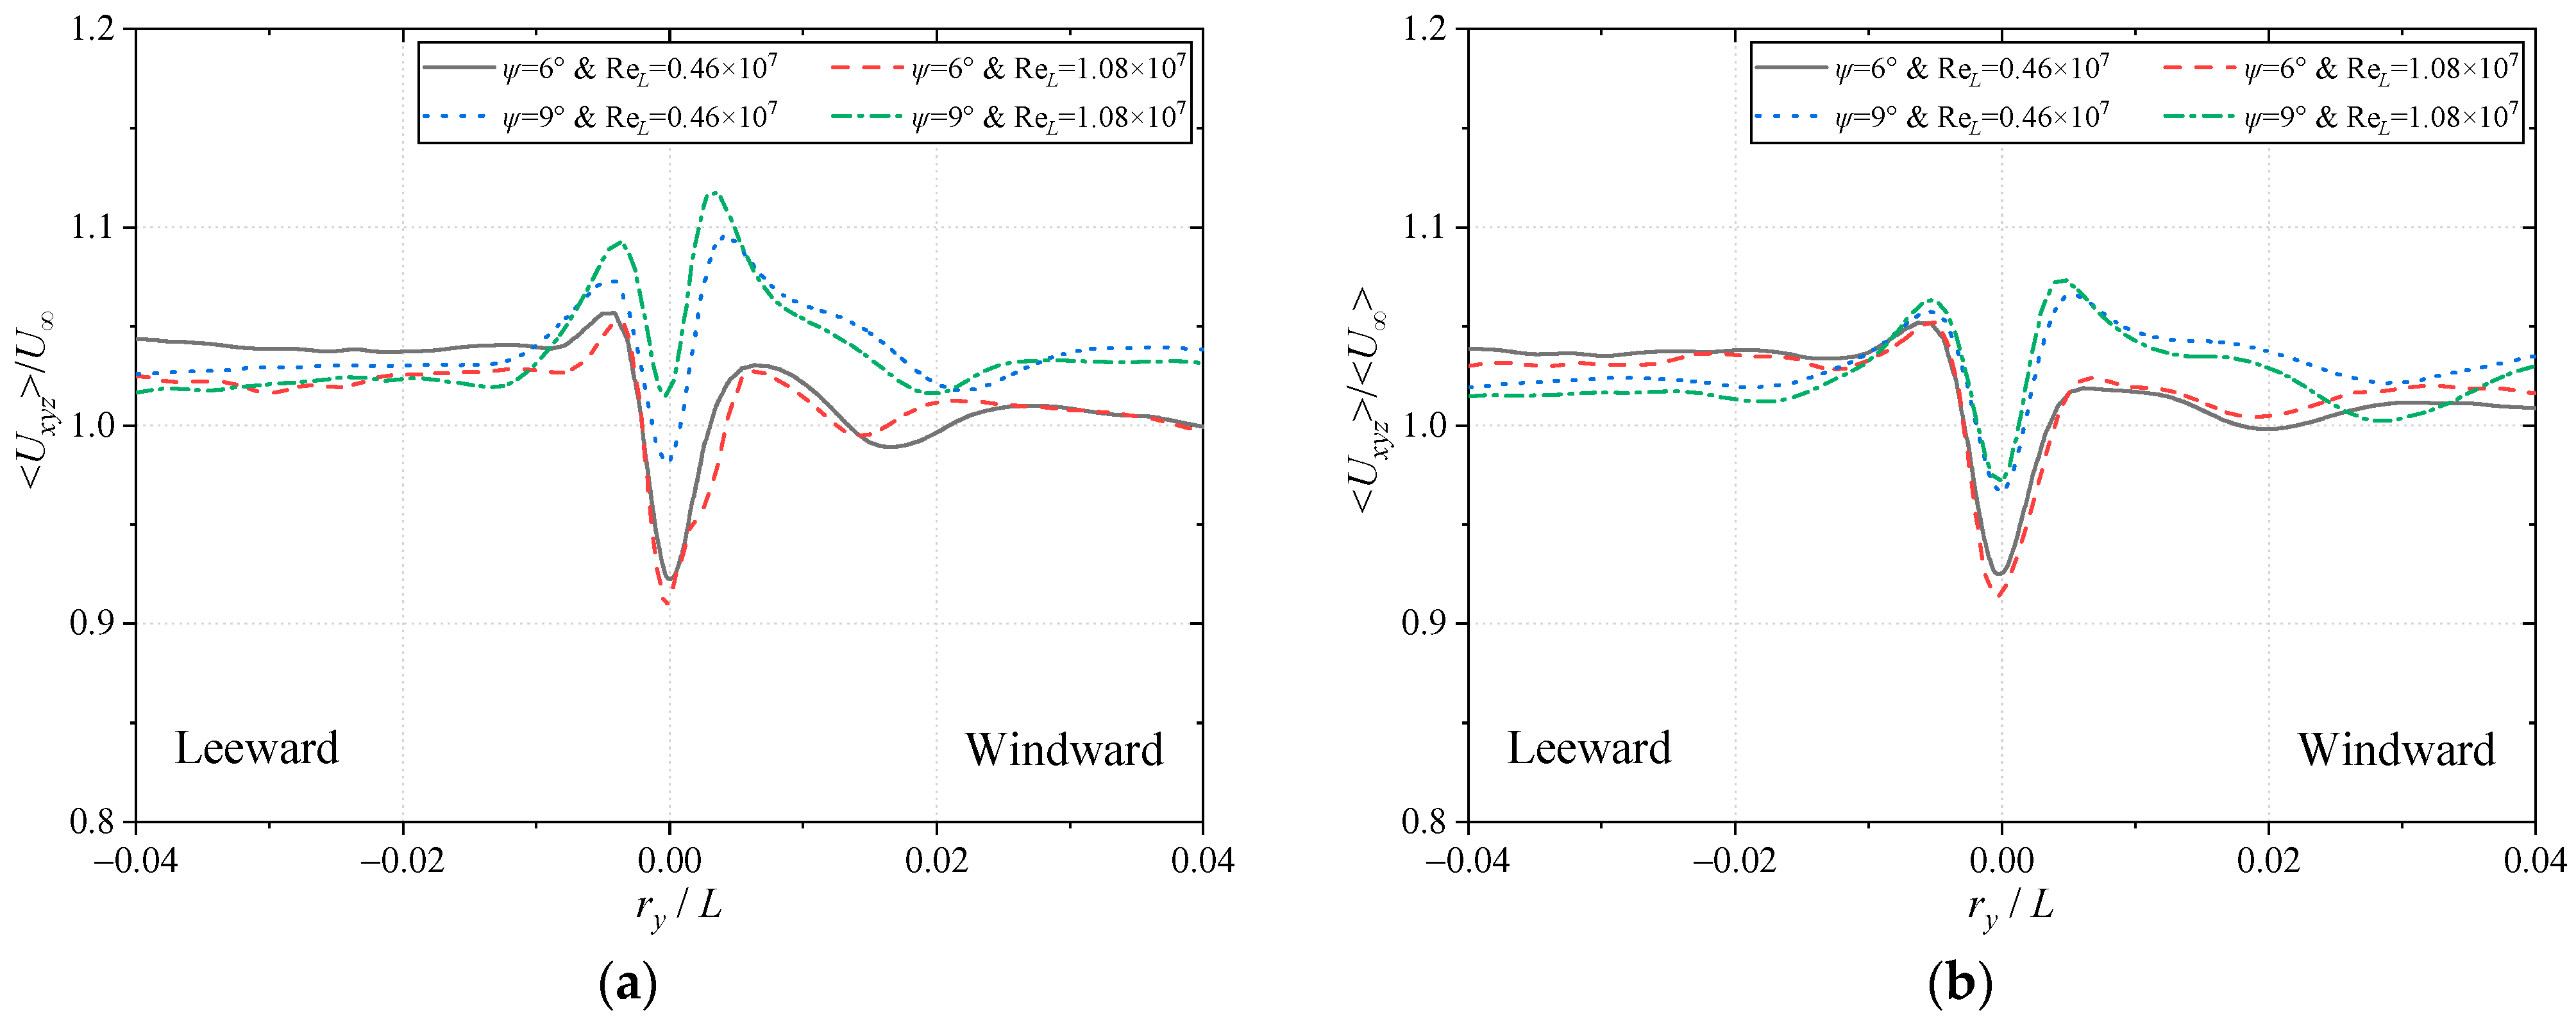
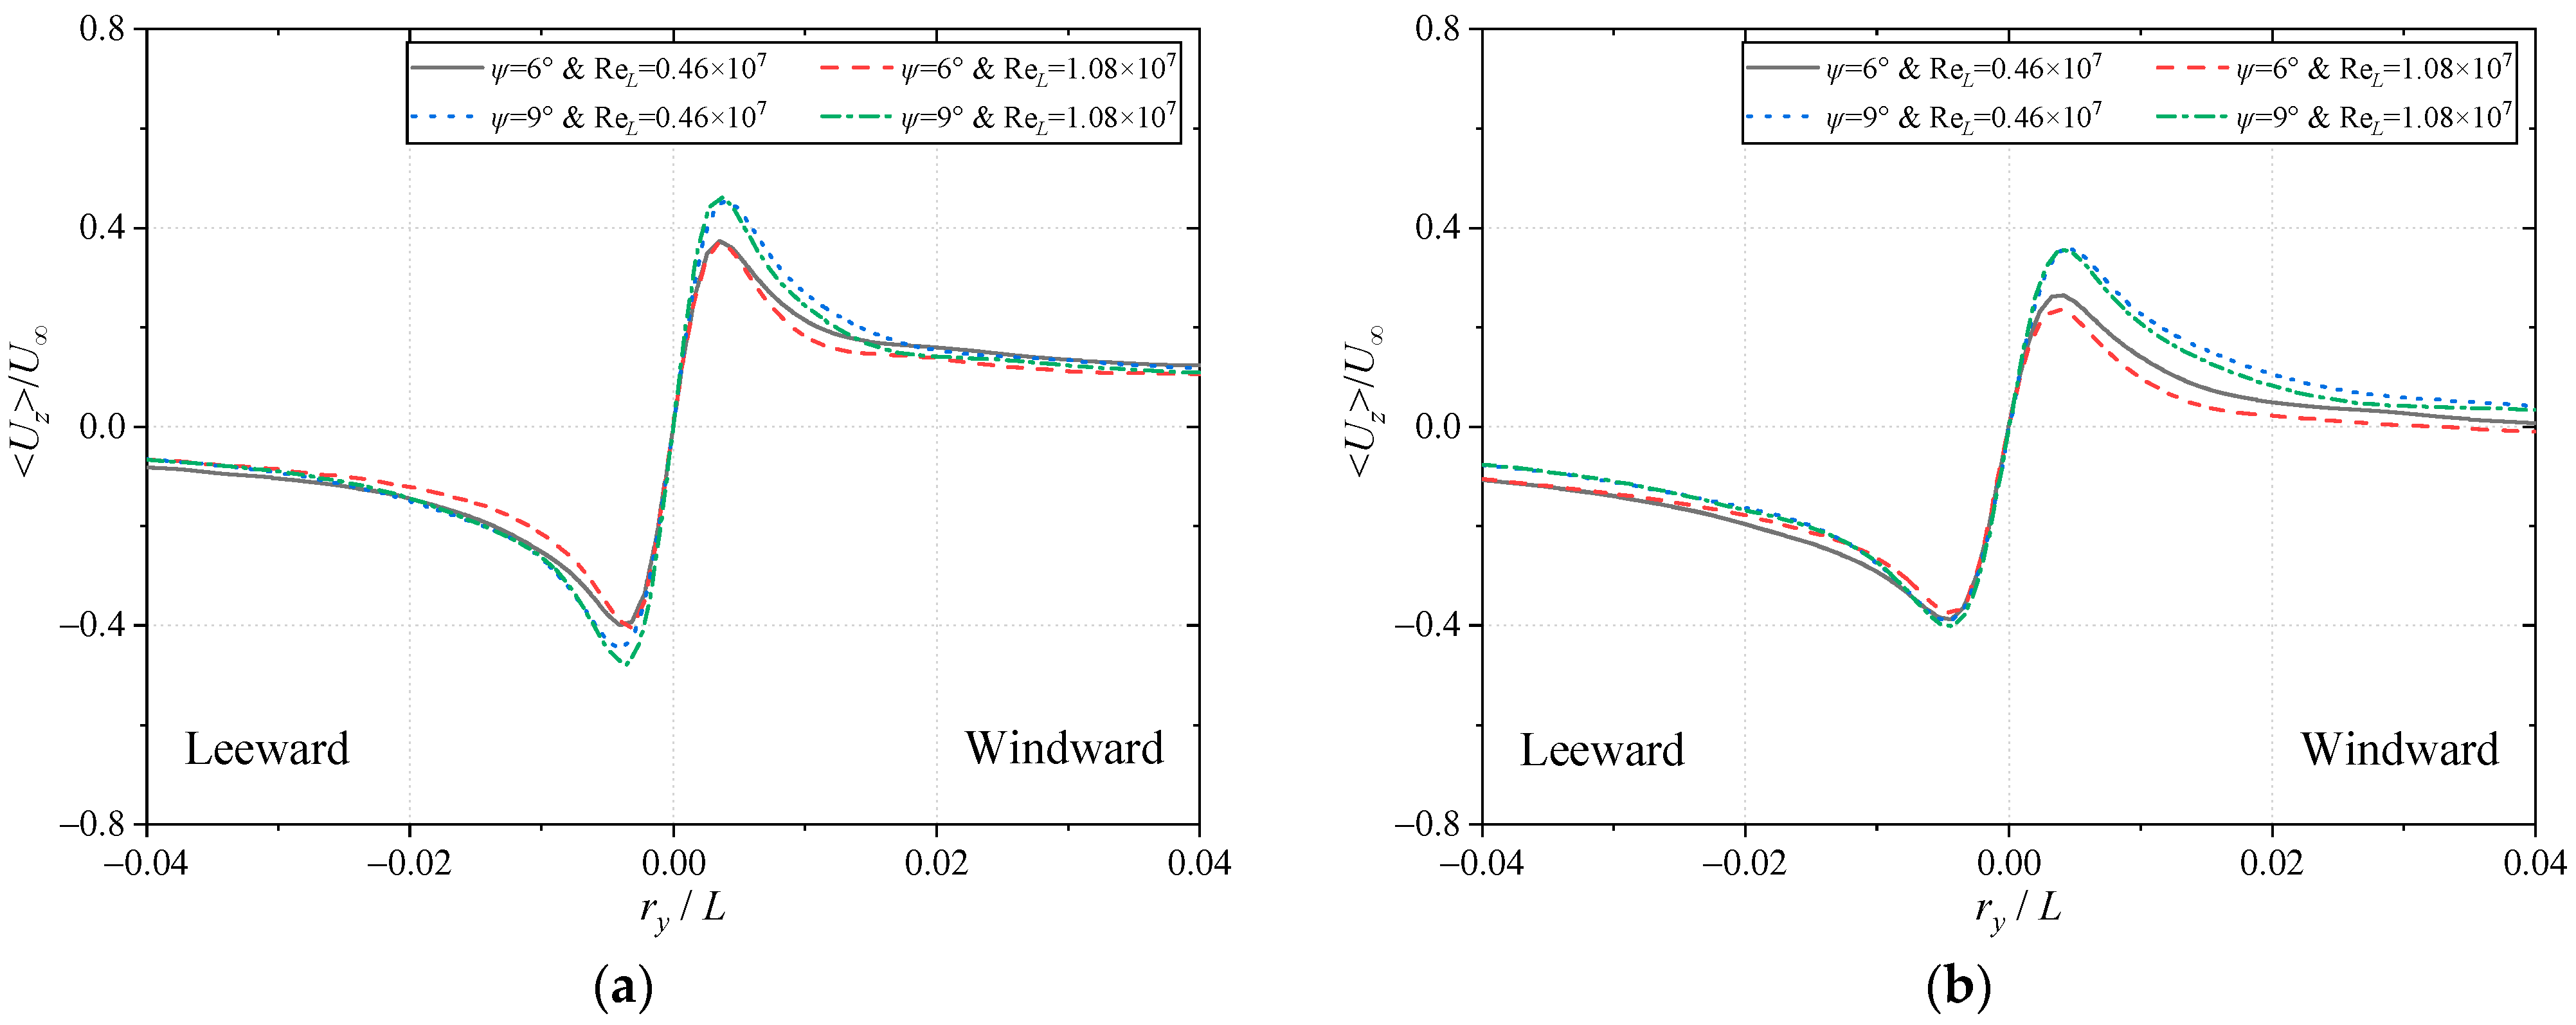
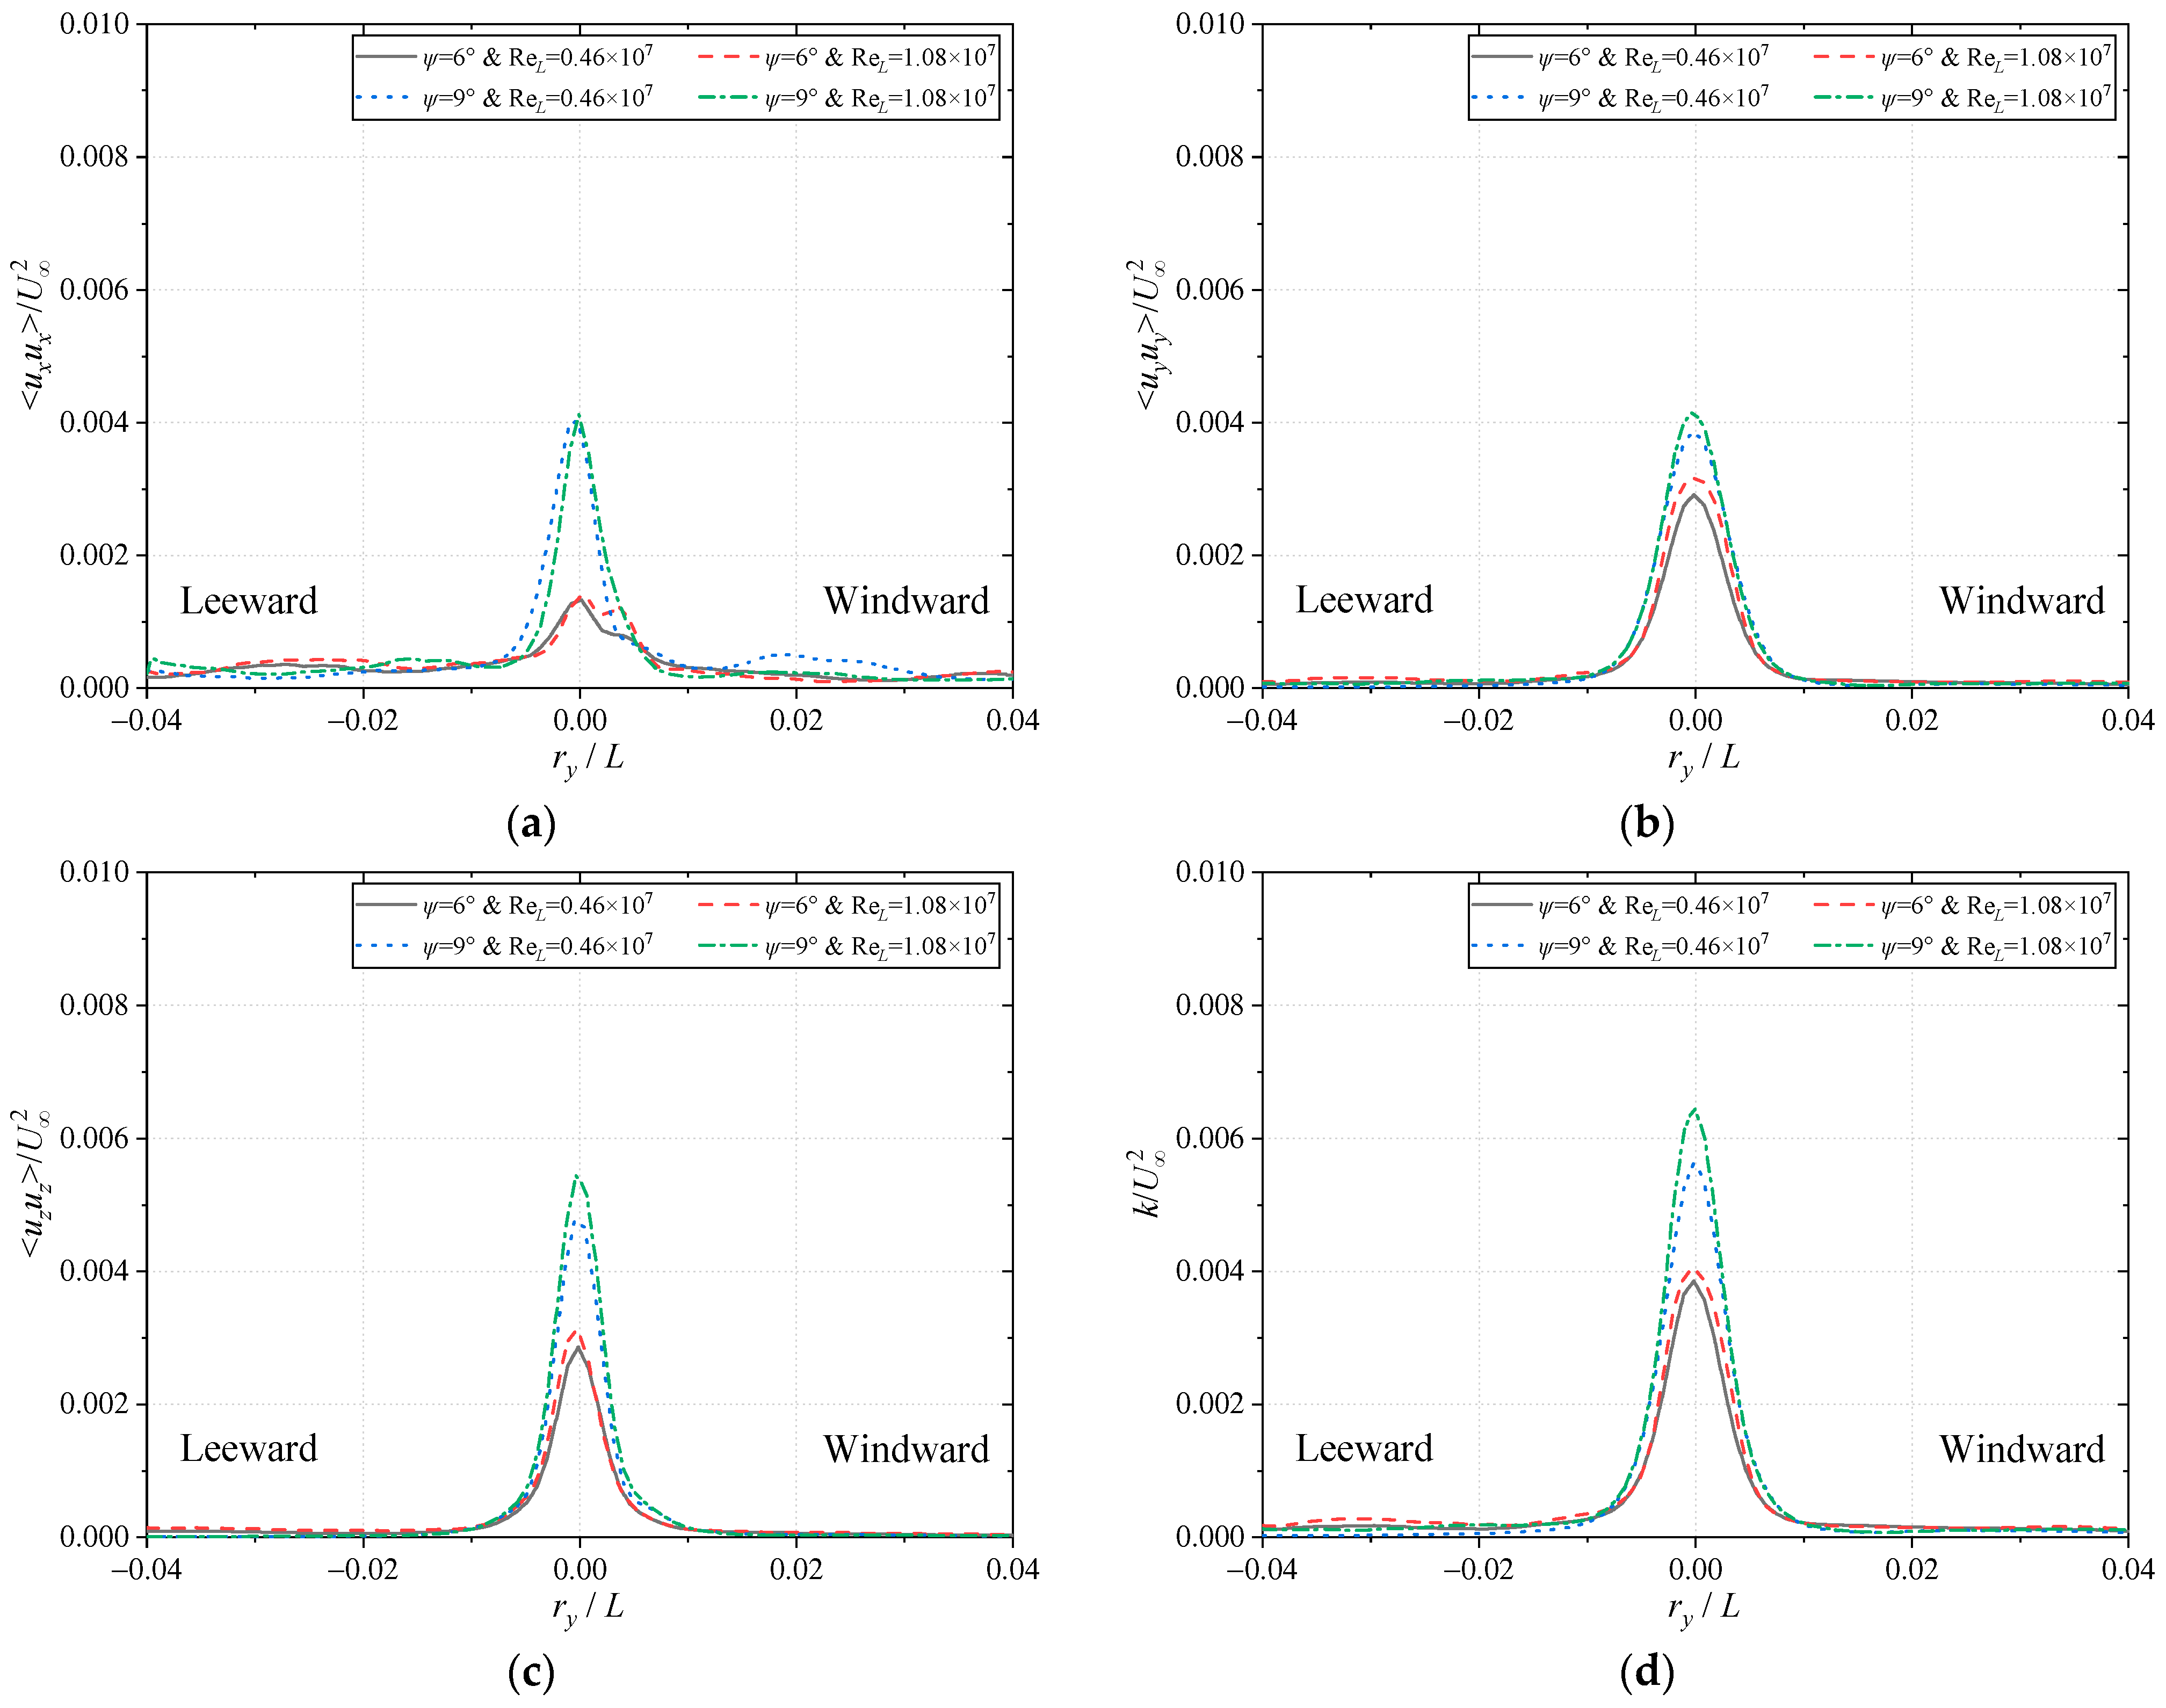
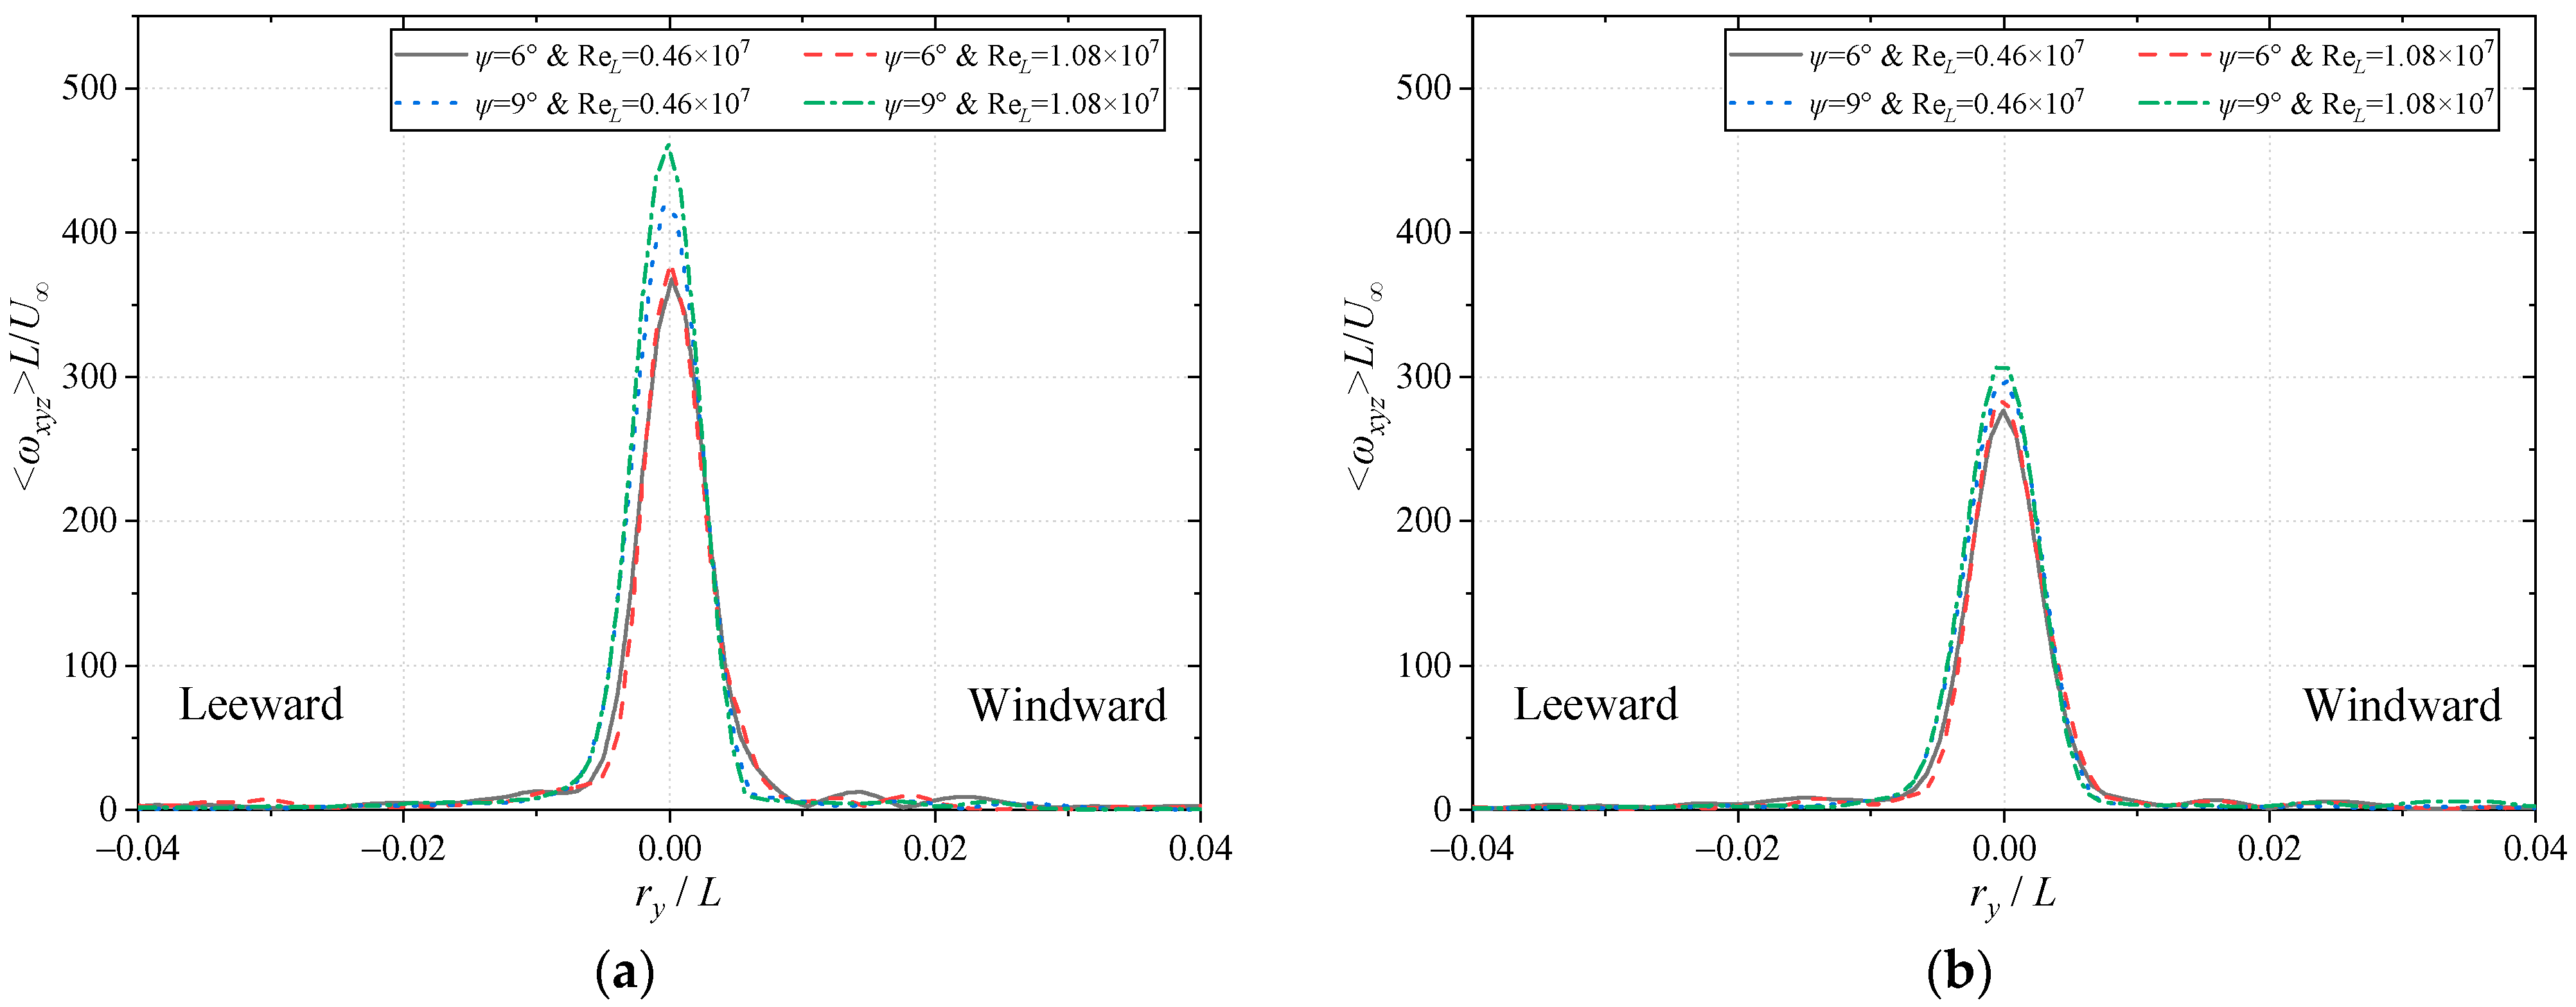
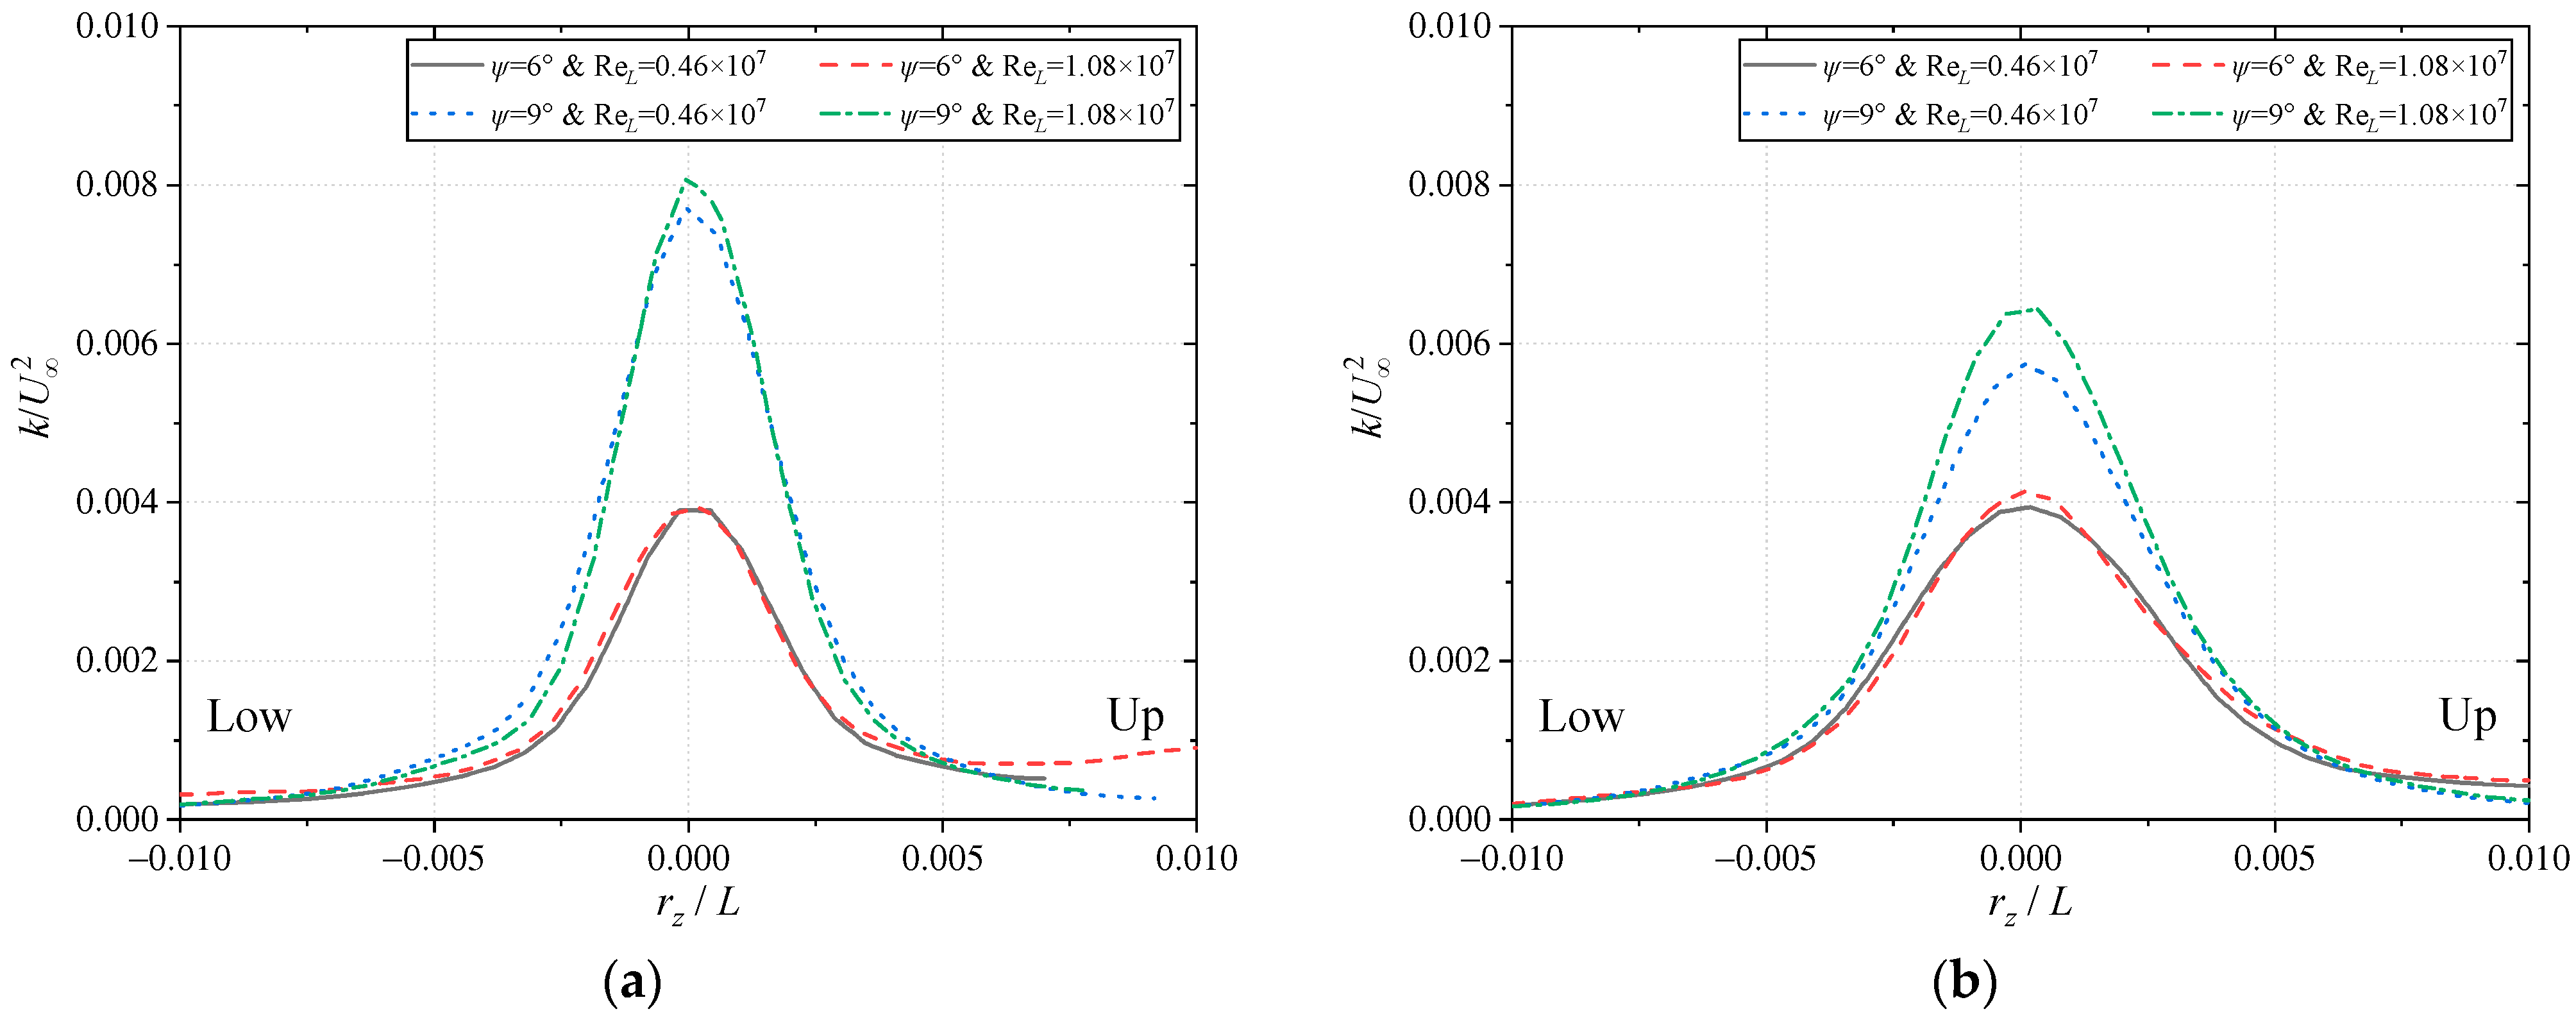
The lateral velocities on the upper and lower sides, in proximity to the sail-tip vortex center, as well as the vertical velocities on the windward and leeward sides, exhibit an almost asymmetric distribution. The maximum absolute values of both the lateral and vertical velocities near the vortex center increase with an increase in the yaw angle. The change in Reynolds number has virtually no effect on the vertical velocity. The normal Reynolds stresses and the TKE peak at the vortex center, and these peak values slightly increase with an increase in Reynolds number, while they significantly increase with an increase in yaw angle. The lateral and vertical components of the normal Reynolds stresses make similar contributions to the TKE, and both are significantly greater than the axial component. The distribution of the vorticity magnitude is quite similar to that of the TKE.
The current study exclusively utilizes the SPIV system to examine the wake signatures of the sail and its interface with the hull on the SUBOFF submarine model, while acknowledging that further characterization of the flow dynamics across broader regions surrounding the hull remains an area of future research.

Author Contributions

M.C.: conceptualization, methodology, software, writing—original draft; N.Z.: conceptualization, methodology, data curation, validation, supervision; Z.L.: methodology, visualization, investigation, validation; J.L.: methodology, writing—review and editing; L.Y.: methodology, writing—review and editing; W.Z.: methodology; X.Z.: methodology. All authors have read and agreed to the published version of the manuscript.

Funding

Support from the projects with grant numbers 50907010101 and WDZC70202010202 are acknowledged.

Institutional Review Board Statement

Not applicable.

Informed Consent Statement

Not applicable.

Data Availability Statement

The data that support the findings of this study are available from the corresponding authors upon reasonable request.

Conflicts of Interest

The authors declare that they have no known competing financial interests or personal relationships that could have appeared to influence the work reported in this paper.

References

  1. Chen, M.; Zhang, N.; Sun, H.; Zhang, X. Large Eddy Simulation of the Flow around a Generic Submarine under Straight-Ahead and 10° Yaw Conditions. J. Mar. Sci. Eng. 2023, 11, 2286. [Google Scholar] [CrossRef]
  2. Joubert, P.N. Some Aspects of Submarine Design Part 1: Hydrodynamics; Technical Report DSTO-TR-1622; Australia Defence Science and Technology Organization: Canberra, Australia, 2004. [Google Scholar]
  3. Joubert, P.N. Some Aspects of Submarine Design Part 2: Shape of a Submarine 2026; Technical Report DSTO-TR-1920; Australia Defence Science and Technology Organization: Canberra, Australia, 2006. [Google Scholar]
  4. Quick, H.; Widjaja, R.; Anderson, B.; Woodyatt, B.; Snowden, A.D.; Lam, S. Phase I Experimental Testing of a generic Submarine Model in the DSTO Low Speed Wind Tunnel; Technical Report DSTO-TN-1101; Australia Defence Science and Technology Organization: Canberra, Australia, 2012. [Google Scholar]
  5. Kumar, C.; Manovski, P.; Giacobello, M. Particle image velocimetry measurements on a generic sub-marine hull form. In Proceedings of the 18th Australasian Fluid Mechanics Conference, Launceston, TAS, Australia, 3–7 December 2012. [Google Scholar]
  6. Anderson, B.; Chapuis, M.; Erm, L.; Fureby, C.; Giacobello, M.; Henbest, S.; Jones, D.; Jones, M.; Kumar, C.; Liefvendahl, M.; et al. Experimental and computational investigation of a generic conventional submarine hull form. In Proceedings of the 29th Symposium on Naval Hydrodynamics, Gothenburg, Sweden, 26–31 August 2012. [Google Scholar]
  7. Jones, M.B.; Erm, L.P.; Valiyf, A.; Henbest, S.M. Skin-Friction Measurements on a Model Submarine; Technical Report DSTO-TR-2898; Australia Defence Science and Technology Organization: Canberra, Australia, 2013. [Google Scholar]
  8. Lee, S.K. Topology of the flow around a conventional submarine hull. In Proceedings of the 19th Australasian Fluid Mechanics Conference, Melbourne, Australia, 8–11 December 2014. [Google Scholar]
  9. Manovski, P.; Giacobello, M.; Jacquemin, P. Smoke Flow Visualization and Particle Image Velocimetry Measurements over a Generic Submarine Model; Technical Report DSTO-TR-2944; Australia Defence Science and Technology Organization: Canberra, Australia, 2014. [Google Scholar]
  10. Fureby, C.; Anderson, B.; Clarke, D.; Erm, L.; Henbest, S.; Giacobello, M.; Jones, D.; Nguyen, M.; Johansson, M.; Jones, M.; et al. Experimental and numerical study of a generic conventional submarine at 10° yaw. Ocean Eng. 2016, 116, 1–20. [Google Scholar] [CrossRef]
  11. Quick, H.; Woodyatt, B. Phase II Experimental Testing of a Generic Submarine Model in the DSTO Low Speed Wind Tunnel; Technical Report DSTO-TN-1274; Australia Defence Science and Technology Organization: Canberra, Australia, 2014. [Google Scholar]
  12. Manovski, P.; Jones, M.B.; Henbest, S.M.; Xue, Y.; Giacobello, M.; de Silva, C. Boundary layer measurements over a body of revolution using long-distance particle image velocimetry. Int. J. Heat Fluid Flow 2020, 83, 108591. [Google Scholar] [CrossRef]
  13. Bettle, M.C. Validating design methods for sizing submarine tailfns. In Proceedings of the Warship 2014: Naval Submarines and UUV’s, Bath, UK, 18–19 June 2014. [Google Scholar]
  14. Overpelt, B.; Nienhuis, B.; Anderson, B. Free running maneuvering model tests on a modern generic SSK Class submarine (BB2). In Proceedings of the Pacific International Maritime Conference, Sidney, Australia, 6–8 October 2015. [Google Scholar]
  15. Lee, S.-K. Longitudinal development of flow-separation lines on slender bodies in translation. J. Fluid Mech. 2018, 837, 627–639. [Google Scholar] [CrossRef]
  16. Lee, S.-K.; Manovski, P.; Kumar, C. Wake of a cruciform appendage on a generic submarine at 10° yaw. J. Mar. Sci. Technol. 2019, 25, 787–799. [Google Scholar] [CrossRef]
  17. Lee, S.K.; Jones, M.B. Surface-pressure pattern of separating flows over inclined slender bodies. Phys. Fluids 2020, 32, 095123. [Google Scholar] [CrossRef]
  18. Xue, Y.; Kumar, C.; Lee, S.-K.; Giacobello, M.; Manovski, P. Identification and analysis of the meandering of a fin-tip vortex using Proper Orthogonal Decomposition (POD). Int. J. Heat Fluid Flow 2020, 82, 108556. [Google Scholar] [CrossRef]
  19. Fu, T.C.; Atsavapranee, P.; Hess, D.E. PIV Measurements of the Cross-Flow Velocity Field around a Turning Submarine Model (ONR Body-1). Part 1. Eexperimental Setup; Carderock Division: Bethesda, MD, USA, 2002. [Google Scholar]
  20. Zhang, J.; Zhao, F.; Hong, F.W.; Xu, J. Towing PIV and its application on the juncture forms of stern appendage with main-body. In Proceedings of the 12th Proceedings of the SPIE, Orlando, FL, USA, 3–6 September 2003; Volume 5058, pp. 208–213.
  21. DeMoss, J.; Simpson, R. Measurements of the steady skin friction and crossflow separation location on an ellipsoidal model in yaw or pitch over a range of roll angles. In Proceedings of the 48th AIAA Aerospace Sciences Meeting Including the New Horizons Forum and Aerospace Exposition, Orlando, FL, USA, 4–7 January 2010. [Google Scholar]
  22. Huggins, A.; Packwood, A.R. Wind tunnel experiments on a fully appended laminar flow submersible for oceanographic survey. Ocean Eng. 1995, 22, 207–221. [Google Scholar] [CrossRef]
  23. Huang, T.; Liu, H.L.; Groves, N.; Forlini, T.; Blanton, J.; Gowing, S. Measurements of Flows Over an Axisymmetric Body With Various Appendages in a Wind Tunnel: The DARPA Suboff Experimental Program. In Proceedings of the 19th Symposium on Naval Hydrodynamics, Seoul, Republic of Korea, 23–28 August 1992. [Google Scholar]
  24. Beigi, S.M.; Shateri, A.; Manshadi, M.D. Experimental study of the submarine’s wake improvement by displacement of stern planes. Ships Offshore Struct. 2021, 17, 2103–2115. [Google Scholar] [CrossRef]
  25. Khan, M.K.; Korulla, M.; Nagarajan, V.; Sha, O.P. Surface pressure measurements on a generic submarine hull form at high angles of incidence. J. Mar. Sci. Technol. 2022, 27, 677–694. [Google Scholar] [CrossRef]
  26. Khan, M.K.; Korulla, M.; Nagarajan, V.; Sha, O.P. Steady velocity measurements in the stern wake of submarine hull form at high angles of incidence. Ocean Eng. 2023, 277, 114281. [Google Scholar] [CrossRef]
  27. Tian, Y.K.; Zhang, X.; Wang, X.; Sun, H.L.; Zhang, N. Measurements of wall shear stress and separation location on underwater vehicle with MEMS sensor arrays. In Proceedings of the 6th International Conference on Advanced Model Measurement Technology for the Maritime Industry, Roma, Italy, 9–11 October 2019. [Google Scholar]
  28. Ellis, C.L.; Clarke, D.B.; Butler, D.; Brandner, P. Complementary CFD study of generic submarine model tests in a cavitation tunnel. In Proceedings of the 20th Australasian Fluid Mechanics Conference, Perth, Australia, 5–8 December 2016. [Google Scholar]
  29. Liu, Z.-H.; Xiong, Y.; Wang, Z.-Z.; Wang, S.; Tu, C.-X. Numerical simulation and experimental study of the new method of horseshoe vortex control. J. Hydrodyn. 2010, 22, 572–581. [Google Scholar] [CrossRef]
  30. Gowing, S. Pressure and Shear Stress Measurement Uncertainty for DARPA SUBOFF Experiment; Departmental Report DRTC/SHD-1298-06; Ship Hydromechanics Department: Delft, The Netherlands, 1990. [Google Scholar]
  31. Manshadi, M.D.; Hejranfar, K.; Farajollahi, A.H. Effect of vortex generators on hydrodynamic behavior of an underwater axisymmetric hull at high angles of attack. J. Vis. 2017, 20, 559–579. [Google Scholar] [CrossRef]
  32. ITTC. Guideline on the Uncertainty Analysis for Particle Image Velocimetry; International Towing Tank Conference Report 7.5-01-03-03; ITTC: Vienna, Austria, 2014. [Google Scholar]
  33. Jiménez, J.M.; Hultmark, M.; Smits, A.J. The intermediate wake of a body of revolution at high Reynolds numbers. J. Fluid Mech. 2010, 659, 516–539. [Google Scholar] [CrossRef]
  34. Jiménez, J.M.; Reynolds, R.T.; Smits, A.J. The Effects of Fins on the Intermediate Wake of a Submarine Model. J. Fluids Eng. 2010, 132, 031102. [Google Scholar] [CrossRef]
  35. Jiménez, J.M.; Smits, A.J. Tip and Junction Vortices Generated by the Sail of a Yawed Submarine Model at Low Reynolds Numbers. J. Fluids Eng. 2011, 133, 034501. [Google Scholar] [CrossRef]
  36. Ashok, A.; Smits, A.J. The turbulent wake of a submarine model at varying pitch and yaw angle. In Proceedings of the 65th Annual Meeting of the APS Division of Fluid Dynamics, San Diego, CA, USA, 18–20 November 2012. [Google Scholar]
  37. Ashok, A.; Smits, A.J. The turbulent wake of a submarine model in pitch and yaw. In Proceedings of the 51st AIAA Aerospace Sciences Meeting including the New Horizons Forum and Aerospace Exposition, Grapevine, TX, USA, 7–10 January 2013. [Google Scholar]
  38. Ashok, A.; Buren, T.V.; Smits, A.J. Asymmetries in the high Reynolds number wake of a submarine model in pitch. In Proceedings of the 67th Annual Meeting of the APS Division of Fluid Dynamics, San Francisco, CA, USA, 23–25 November 2014. [Google Scholar]
  39. Ashok, A.; Buren, T.V.; Smits, A.J. The structure of the wake generated by a submarine model in yaw. Exp. Fluids 2015, 56, 123. [Google Scholar] [CrossRef]
  40. Ashok, A.; Buren, T.V.; Smits, A.J. Asymmetries in the wake of a submarine model in pitch. J. Fluid Mech. 2015, 774, 416–442. [Google Scholar] [CrossRef]
  41. Wang, L.; Martin, J.E.; Felli, M.; Carrica, P.M. Experiments and CFD for the propeller wake of a generic submarine operating near the surface. Ocean. Eng. 2020, 206, 107304. [Google Scholar] [CrossRef]
  42. Wang, L.; Carrica, P.M.; Felli, M. Experimental and CFD Study of the Streamwise Evolution of Propeller Tip Vortices. In Proceedings of the 33rd Symposium on Naval Hydrodynamics, Osaka, Japan, 18–23 October 2020. [Google Scholar]
  43. Wang, L.; Martin, J.E.; Carrica, P.M.; Felli, M.; Falchi, M. Experiments and CFD for DARPA Suboff Appended with Propeller E1658 Operating Near the Surface. In Proceedings of the Sixth International Symposium on Marine Propulsors, Rome, Italy, 26–30 May 2019. [Google Scholar]
  44. Liu, Y.Y.; Pan, C.; Liu, J.H. Intermittent behavior of a bypass transition of boundary layers over an axisymmetric body of revolution. Ocean. Eng. 2023, 286, 115689. [Google Scholar] [CrossRef]
  45. Groves, N.C.; Huang, T.T.; Chang, M.S. Geometric Characteristics of DARPA SUBOFF Models; DTRC.SHD-1298-01; David Taylor Research Center: Bethesda, MD, USA, 1989. [Google Scholar]
  46. Raffel, M.; Willert, C.E.; Wereley, S.T.; Kompenhans, J. Particle Image Velocimetry: A Practical Guide, 3rd ed.; Springer International Publishing AG: Cham, Switzerland, 2018. [Google Scholar]
  47. Sciacchitano, A.; Wieneke, B. PIV uncertainty propagation. Meas. Sci. Technol. 2016, 27, 084006. [Google Scholar] [CrossRef]
Figure 1. DARPA SUBOFF submarine model.
Jmse 12 01576 g001
Figure 2. Measurement planes and coordinate system.
Jmse 12 01576 g002
Figure 3. Diagram of the wind tunnel SPIV experimental scenario.
Jmse 12 01576 g003
Figure 4. Diagram of the SPIV system.
Jmse 12 01576 g004
Figure 5. Diagram of SPIV experimental setup.
Jmse 12 01576 g005
Figure 6. The wind tunnel SPIV experiment.
Jmse 12 01576 g006
Figure 7. Experimental results of ensemble-averaged velocities and vorticity magnitude (ψ = 6°, x/L = 0.595): (a) <Ux>/U; (b) <Uy>/U; (c) <Uz>/U; (d) <Uxyz>/U; (e) <ωxyz>L/U.
Jmse 12 01576 g007
Figure 8. Experimental results of ensemble-averaged velocities and vorticity magnitude (ψ = 6°, x/L = 0.818): (a) <Ux>/U; (b) <Uy>/U; (c) <Uz>/U; (d) <Uxyz>/U; (e) <ωxyz>L/U.
Jmse 12 01576 g008
Figure 9. Experimental results of ensemble-averaged velocities and vorticity magnitude (ψ = 9°, x/L = 0.595): (a) <Ux>/U; (b) <Uy>/U; (c) <Uz>/U; (d) <Uxyz>/U; (e) <ωxyz>L/U.
Jmse 12 01576 g009
Figure 10. Experimental results of ensemble-averaged velocities and vorticity magnitude (ψ = 9°, x/L = 0.818): (a) <Ux>/U; (b) <Uy>/U; (c) <Uz>/U; (d) <Uxyz>/U; (e) <ωxyz>L/U.
Jmse 12 01576 g010
Figure 11. Distribution of the sail-tip vortex center positions in the tail view: (a) x/L = 0.595; (b) x/L = 0.818.
Jmse 12 01576 g011
Figure 12. Distribution of the ensemble-averaged resultant velocity near the leeward and windward sides of the sail-tip vortex: (a) x/L = 0.595; (b) x/L = 0.818.
Jmse 12 01576 g012
Figure 13. Distribution of the ensemble-averaged vertical velocity near the leeward and windward sides of the sail-tip vortex: (a) x/L = 0.595; (b) x/L = 0.818.
Jmse 12 01576 g013
Figure 14. Distribution of the normal Reynolds stresses and TKE near the leeward and windward sides of the sail-tip vortex for x/L = 0.595: (a) ⟨uxux⟩; (b) ⟨uyuy⟩; (c) ⟨uzuz⟩; (d) TKE.
Jmse 12 01576 g014
Figure 15. Distribution of the normal Reynolds stresses and TKE near the leeward and windward sides of the sail-tip vortex for x/L = 0.818: (a) ⟨uxux⟩; (b) ⟨uyuy⟩; (c) ⟨uzuz⟩; (d) TKE.
Jmse 12 01576 g015
Figure 16. Distribution of the ensemble-averaged vorticity magnitude near the leeward and windward sides of the sail-tip vortex: (a) x/L = 0.595; (b) x/L = 0.818.
Jmse 12 01576 g016
Figure 17. Distribution of the ensemble-averaged lateral velocity near the upper and lower sides of the sail-tip vortex: (a) x/L = 0.595; (b) x/L = 0.818.
Jmse 12 01576 g017
Figure 18. Distribution of the TKE near the upper and lower sides of the sail-tip vortex: (a) x/L = 0.595; (b) x/L = 0.818.
Jmse 12 01576 g018
Table 1. Summary of the sail-tip vortex centers.
Measurement PlaneReLψ = 6°ψ = 9°
y/Lz/Ly/Lz/L
x/L = 0.5950.46 × 107−0.0331 0.0956 −0.0462 0.0930
1.08 × 10⁷−0.0339 0.0950 −0.0484 0.0923
x/L = 0.8180.46 × 107−0.0543 0.0875 −0.0762 0.0856
1.08 × 10⁷−0.0555 0.0862 −0.0786 0.0852
Disclaimer/Publisher’s Note: The statements, opinions and data contained in all publications are solely those of the individual author(s) and contributor(s) and not of MDPI and/or the editor(s). MDPI and/or the editor(s) disclaim responsibility for any injury to people or property resulting from any ideas, methods, instructions or products referred to in the content.

