Article

Study on the Influence of Chord Length and Frequency of Hydrofoil Device on the Discharge Characteristics of Floating Matter in Raceway Aquaculture

College of Mechanical Engineering, Zhejiang University of Technology, Hangzhou 310023, China
*
Author to whom correspondence should be addressed.
J. Mar. Sci. Eng. 2024, 12(9), 1584; https://doi.org/10.3390/jmse12091584
Submission received: 5 August 2024 / Revised: 25 August 2024 / Accepted: 5 September 2024 / Published: 8 September 2024
(This article belongs to the Section Marine Aquaculture)

Abstract

:
To investigate the influence of the chord length and frequency of an oscillating hydrofoil device on the discharge characteristics of floating particulate matter, in this study, we take raceway aquaculture as an example and systematically compare and analyze the flow field characteristics of the hydrofoil device with different chord lengths and frequencies, as well as the sewage discharge performance of the raceway based on Computational Fluid Dynamics (CFD). The results indicate that in the particulate matter discharge process of raceway aquaculture, when the chord length and motion frequency of the hydrofoil device are 0.1 W (W is the width of the raceway) and 1.0 Hz, respectively, the anti-Karman vortex streets produced by the hydrofoil device are less affected by the wall, the flow field is the most uniform, the particulate matter discharge performance is the best, and the final floating particulate matter discharge rate reaches up to 99.09%. Adjusting the chord length of the hydrofoil can effectively ameliorate flow field reflux issues, enhancing the uniformity and flow performance of the flow field. When the chord length is 0.1 W, the uniformity of the flow field is optimal. When the chord length is 0.2 W, the flow performance of the flow field is superior. Increasing the frequency enhances the flow performance of the flow field, with an average increase of 0.1 Hz in motion frequency leading to a 19.42% improvement in the average velocity at the outlet. Based on this, we recommend the use of a hydrofoil device with a chord length of 0.1 W and a motion frequency of 1.0 Hz in the raceway aquaculture system to achieve optimal particulate matter discharge performance, providing a theoretical basis and practical guidance for using hydrofoil devices to improve the efficiency of floating particulate matter treatment in raceway aquaculture environments.

1. Introduction

The In-Pond Raceway System (IPRS) [1,2] is a novel high-density aquaculture model that utilizes only 2–5% of the pond’s water area to construct aquaculture raceways, sewage collection zones, and other functional areas for aquaculture. The remaining 95–98% of the water area is dedicated to the wastewater purification of aquacultural effluent [3]. This system spatially separates aquaculture activities from water treatment, achieving efficient use of recycled water on the basis of intensive aquaculture, which can effectively enhance aquacultural efficiency. In recent years, it has been vigorously promoted and rapidly developed both domestically and internationally [4,5].
IPRS, as a novel aquaculture model that integrates traditional pond farming methods with modern recirculating aquaculture technology, has seen increasingly widespread application. However, many issues have not been thoroughly investigated [6]. The system generates a large amount of solid particulate waste during the aquaculture process, the main components of which are feed and other food residues, as well as fish excreta [7]. These solid particles produced in aquaculture can be divided into the following four particle size ranges: soluble (<0.001 μm), colloidal (0.001~1 μm), supercolloidal (1~100 μm), and settleable (>100 μm) solids [8]. Song et al. [9] found through experimental research that in intensive aquaculture environments, 50 % to 70 % of the particles is below 100 μm in size and cannot settle naturally. Some larger particulate matter can collide and break due to water flow, or partially dissolve in the water. These fine particles and solutes will form floating matter on the water’s surface. The remaining particles, with a specific gravity greater than or close to 1 and not easily soluble in water, will slowly sink in the direction of water flow, forming suspension or deposition, which leads to water pollution. If these pollution materials cannot be promptly discharged from the raceway and treated, they will decompose and produce harmful substances such as ammonia nitrogen, which directly threaten the health and growth of fish [10]. In response to this key issue, Li et al. [11] revealed the limitations of using traditional microporous aeration equipment in aquaculture raceways through experimental research. The study pointed out that within the horizontal cross-section of the raceway, water flow often causes local plug flow and reflux phenomena due to turbulence effects and centripetal forces, leading to the accumulation of pollutants in the aquaculture raceway. Wang et al. [12] numerically simulated the aquaculture system using a Dense Discrete Phase Model, supplementing the explanation of the complexity of hydrodynamics within the raceway. They discovered that the water flow inside the raceway has inherent recirculation zones, revealing that the solid particles in the waste collection area of the aquaculture raceway exhibit a “U”-shaped distribution pattern. Wu et al. [13] installed a submersible thruster using a propeller to push water in the aquaculture pool to improve the waste collection capacity of the aquaculture pool, and optimized the installation position of the thruster. They found that when adopting a diagonal layout strategy, the fluid dynamic characteristics of the aquaculture pool reached an optimal state, significantly improving the efficiency of waste accumulation and discharge, and providing useful references for optimizing the pollution removal performance of raceway aquaculture systems. Additionally, the water-pushing devices commonly used in current raceway aquaculture systems are mainly of impeller type, water wheel type, jet type, microporous aeration type, etc. [14]. Although these devices can effectively increase the dissolved oxygen content in the water, they are limited to only improving the fluidity of the surface water, and have poorer effects on enhancing the fluidity of the deep water [15].
A study [16] found that the hydrofoil device, which mimics the movement of a fishtail, has characteristics of large flow and high efficiency. The induced anti-Karman vortex street jet can significantly enhance the fluidity of the water body and improve the deep hydrodynamic conditions of the raceway [17], accelerating the migration and discharge of floating particles. Currently, research on hydrofoil devices mainly focuses on optimizing motion parameters and structural parameters. Regarding the optimization of motion parameters for hydrofoil devices, Ding et al. [18] established a two-dimensional hydrofoil motion model, revealed the water-pushing mechanism of the hydrofoil device, analyzed the relationship between hydrofoil thrust and hydrofoil frequency and motion amplitude, and clarified the correlation between thrust generation and vortex structure. Zhang [19] proposed an infinite symbol motion “∞” of pivot trajectory and found that the “∞” type motion trajectory has achieved a fourfold increase in thrust compared to the traditional heaving pitching motion mode of the hydrofoil device, and the propulsion efficiency was increased by 29.47%. Regarding the optimization of structural parameters for hydrofoil devices, Cao et al. [20] designed complex foil shapes with different leading-edge thicknesses and found that the complex foil shape could significantly improve the thrust coefficient and propulsion efficiency of the hydrofoil devices. Hua et al. [21,22] were the first to apply hydrofoil devices in small river channels and found that changing the characteristic chord length of the hydrofoil could improve the device’s thrust and pumping efficiency. Furthermore, they applied this hydrofoil device to raceway aquaculture and analyzed the effects of pumping depth and frequency on the settlement of suspended particles. They discovered that the removal efficiency of suspended particles was optimal when the device was installed 0.9 m from the bottom of the raceway. These research findings provide important references for a deeper understanding of the optimization studies of hydrofoil devices.
In this paper, we use raceway aquaculture as a case study to systematically compare and analyze the flow field characteristics of hydrofoil devices with different chord lengths and frequencies. Additionally, we examine the floating particulate waste discharge performance of the raceway through two-dimensional numerical simulation using Ansys-Fluent 2024R1 software. This study aims to provide a scientific basis and practical guidance for enhancing the efficiency of floating particulate matter treatment in the raceway aquaculture environment through the utilization of hydrofoil devices.

2. Physical Model

2.1. Aquaculture Raceway Model

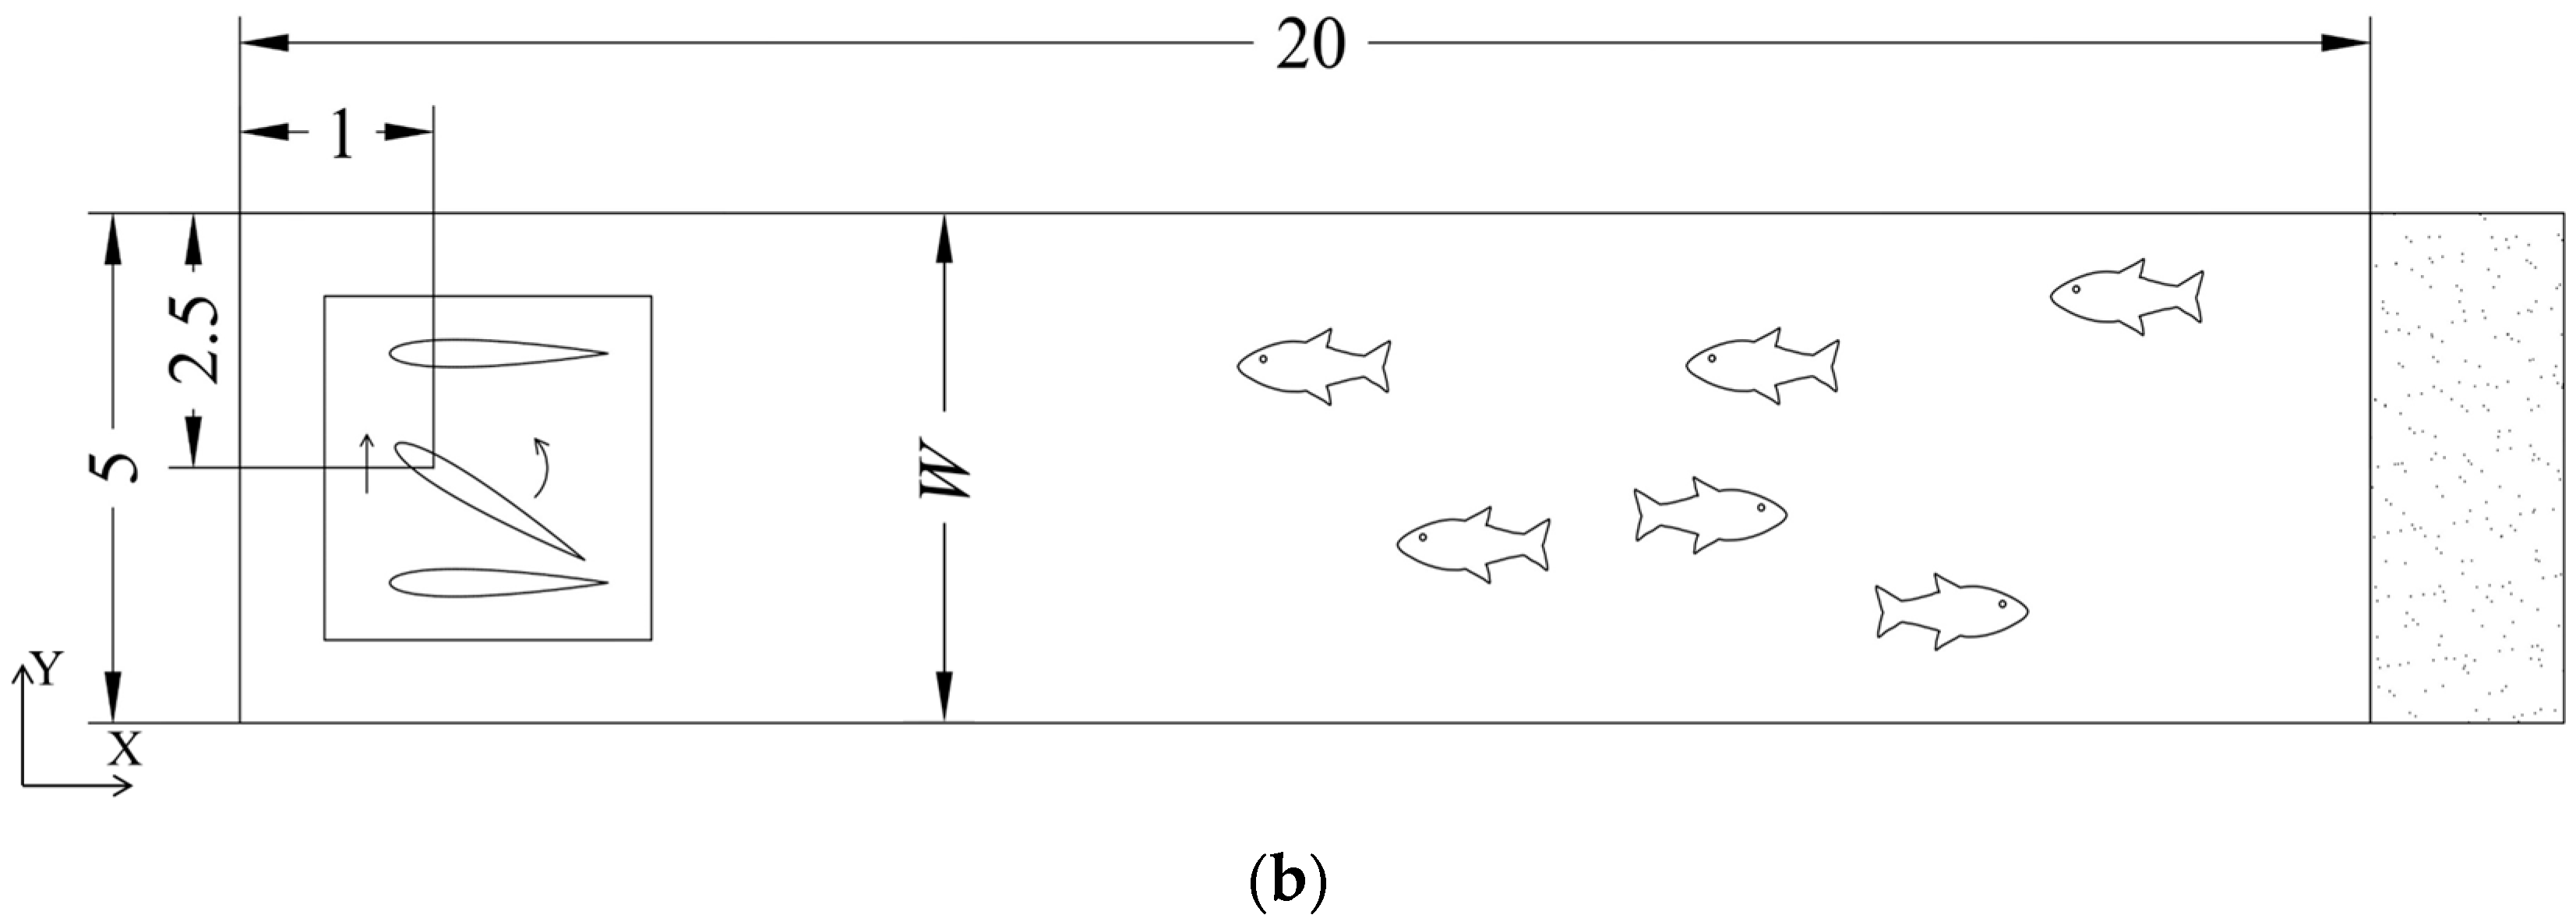
IPRS includes an aquaculture area and a wastewater purification area. The aquaculture area occupies 2–5% of the pond’s water surface, with the remaining 95–98% designated as the wastewater purification area, as shown in Figure 1a. To achieve uniform water flow characteristics, the raceways are typically designed as rectangular structures [23]. The aquaculture area consists of multiple parallel raceways, each measuring 20 m in length, 5 m in width, and 2 m in height, with a sewage collection area located at the end of the raceways, as shown in Figure 1b.
The installation position of the hydrofoil device has a non-negligible impact on the efficiency of raceway aquaculture and sewage removal performance. Along the length of the raceway (x-direction), to ensure the operating efficiency of the hydrofoil device and fully leverage its water-pushing and sewage removal functions, the center position of the device is located 1 m away from the entrance of the raceway. In the width direction of the raceway (y-direction), research by Xie et al. [24] found that when the hydrofoil is near the wall, a significant “wall effect” occurs, causing the anti-Karman vortex street generated by the device to shift. This phenomenon of vortex street deviation will inevitably lead to uneven distribution of waste, thereby affecting the sewage removal performance of the raceway. Therefore, to reduce the impact of the “wall effect” on waste discharge, we set the y-direction installation position of the device at the middle position of the raceway.

2.2. Hydrofoil Motion Model

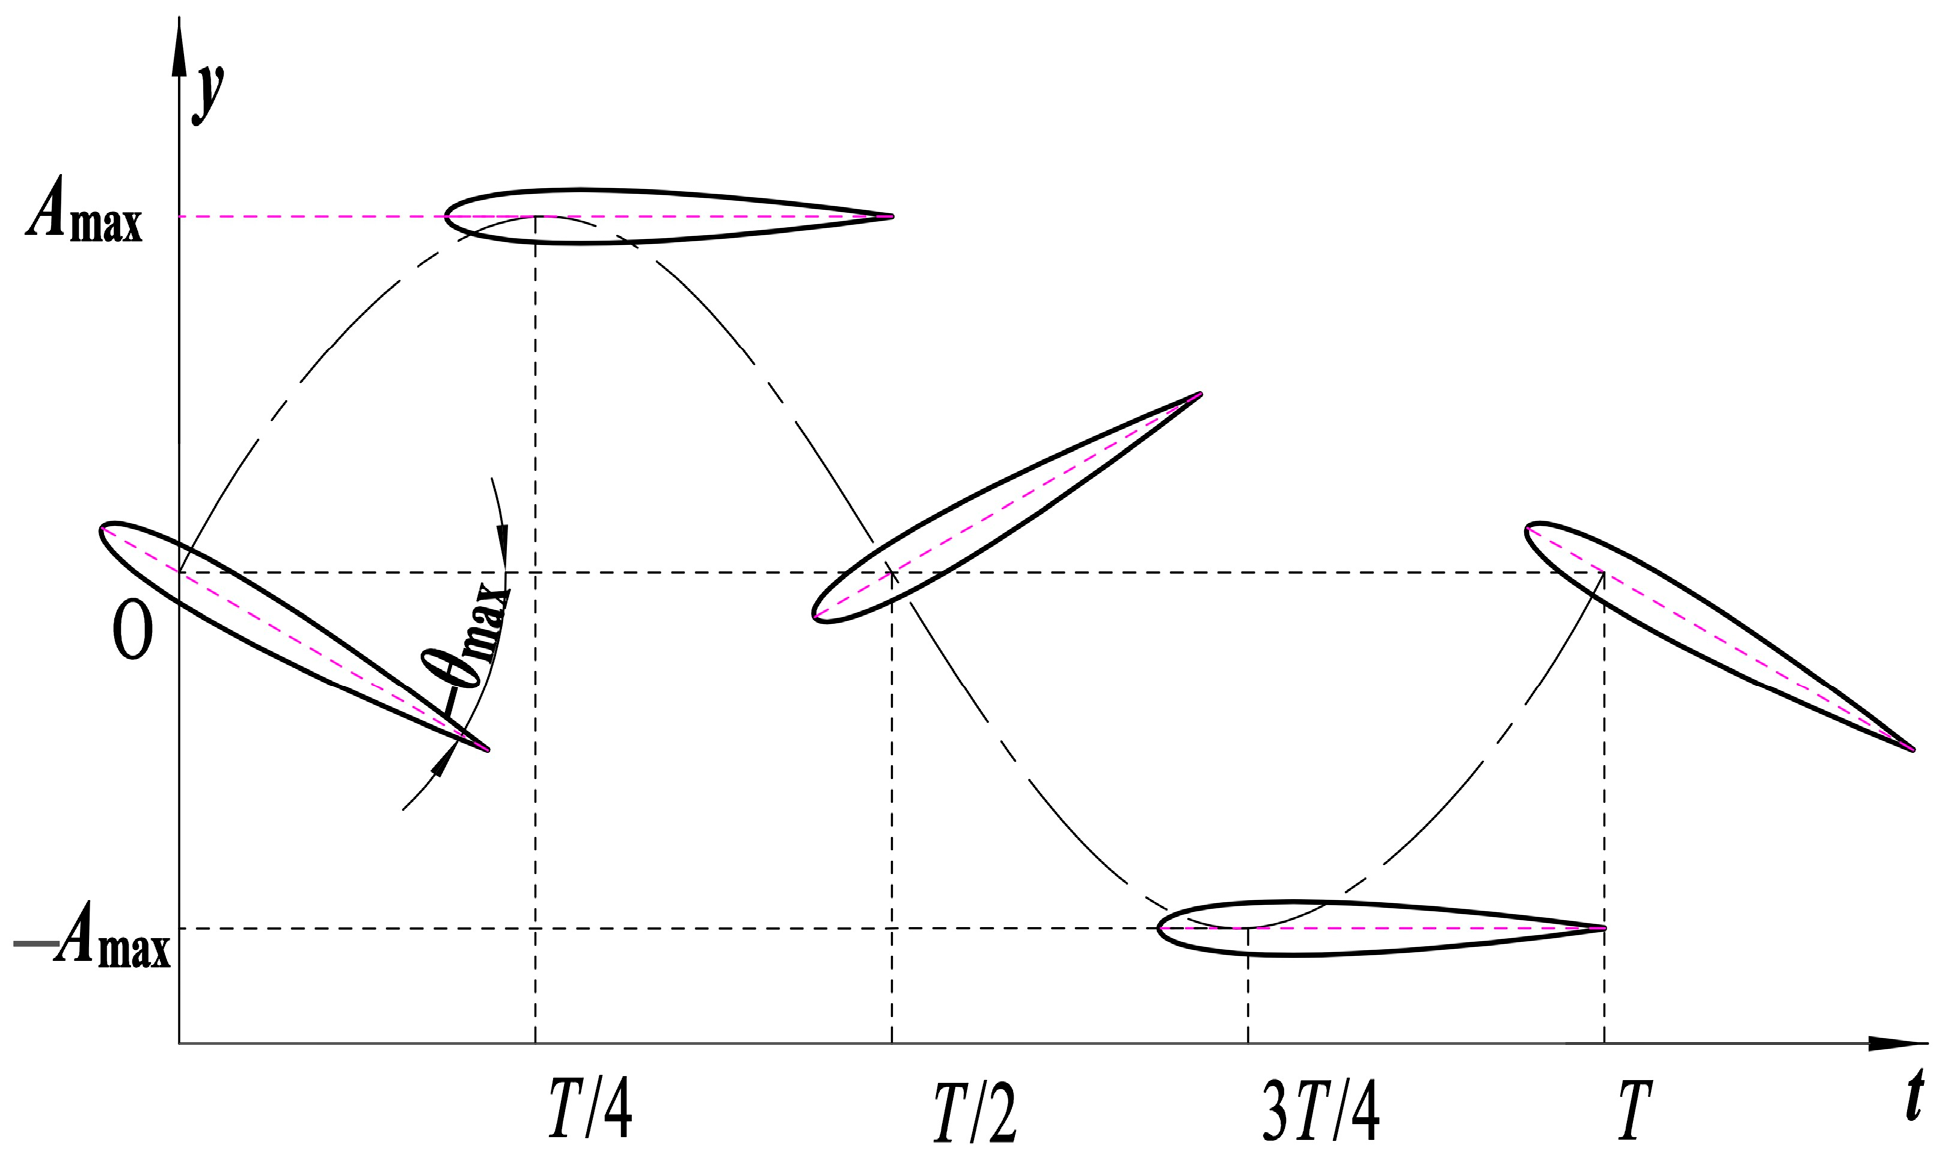
Hydrofoil, as the working component that drives the water body, has a crucial impact on the performance of the hydrofoil device. We select the symmetric airfoil NACA0012 from the NACA series developed by NASA as the working component of the hydrofoil device. The conventional sinusoidal motion form of the hydrofoil is shown in Figure 2. In the figure, Amax represents the translational motion amplitude of the hydrofoil, θmax = 30° is the rotational amplitude of the hydrofoil, and T = 1 f is the motion period of the hydrofoil.
According to research by Li et al. [25], when the distance between the hydrofoil and the wall is greater than 1.5 c, the influence of the wall on the vortex field is minimal. In this study, the equilibrium position of the hydrofoil is set at a distance of 2.5 m from the wall, with the minimum chord length c being 0.1 W = 0.5 m and the maximum being 0.3 W = 1.5 m. Therefore, to minimize the impact of the wall on the vortex field as much as possible, Amax is set to 0.5 m. Techet et al. [26] found that the thrust coefficient of the hydrofoil is maximized when the rotation amplitude is 30°. Therefore, θmax is set to 30°.
The basic motion equation of the hydrofoil is as follows:
y t = A m a x s i n ( 2 π f ) θ t = θ m a x s i n ( 2 π f + φ ) ,
where y t represents the translational displacement of the hydrofoil, θ t is the rotation angle of the hydrofoil, and φ is the phase difference between the translational motion and rotating motion, set to π / 2 . According to the literature [27], it was found that the hydrodynamic performance of the hydrofoil device is optimized when the pivot axis is located at 0.2c; therefore, we set the distance from the rotation center of the hydrofoil to the leading edge as l = 0.2 c (c is the chord length of the hydrofoil).
Regarding the setting of chord length and frequency, according to the research by Zhou et al. [28], the body length of fish significantly affects their suitable survival water flow speed. Taking tilapia as an example, the suitable water flow speed per second should not exceed 7.49 times of their body length, which corresponds to a speed of 1.15 m/s in their study. Therefore, in order to balance the water pushing performance of the hydrofoil device and maintain the flow velocity conditions suitable for fish survival, we set the chord length c of the hydrofoil device to be 0.1 W, 0.2 W, and 0.3 W, and the motion frequency f to be 0.5 Hz, 0.6 Hz, 0.7 Hz, 0.8 Hz, 0.9 Hz, and 1.0 Hz (the maximum average outlet flow rate in the subsequent simulation results is 1.042 m/s).
In the simulation of hydrofoil motion, the formula for the Reynolds number in the flow field is defined as
R e = U d ρ μ ,
The Strouhal number of the hydrofoil is defined as
S t = f d U ,
where d is the characteristic length, U is the incoming flow velocity, ρ is the density of water, μ is the dynamic viscosity coefficient of water, and f is the motion frequency of the hydrofoil.
In this paper, the chord length of the hydrofoil is selected as the characteristic length, which are 0.5 m, 1.0 m, and 1.5 m, respectively. According to the selected frequencies of 0.5 Hz, 0.6 Hz, 0.7 Hz, 0.8 Hz, 0.9 Hz, and 1.0 Hz, the incoming flow velocity is 0.357 m/s~1.042 m/s. The dynamic viscosity of water μ = 1.0050 × 10⁻³ Pa·s is chosen, and the calculated Reynolds number Re = 1.77 × 10⁵~1.36 × 10⁶, correspondingly, the Strouhal number St = 0.63~1.64 is obtained.

2.3. Performance Parameters

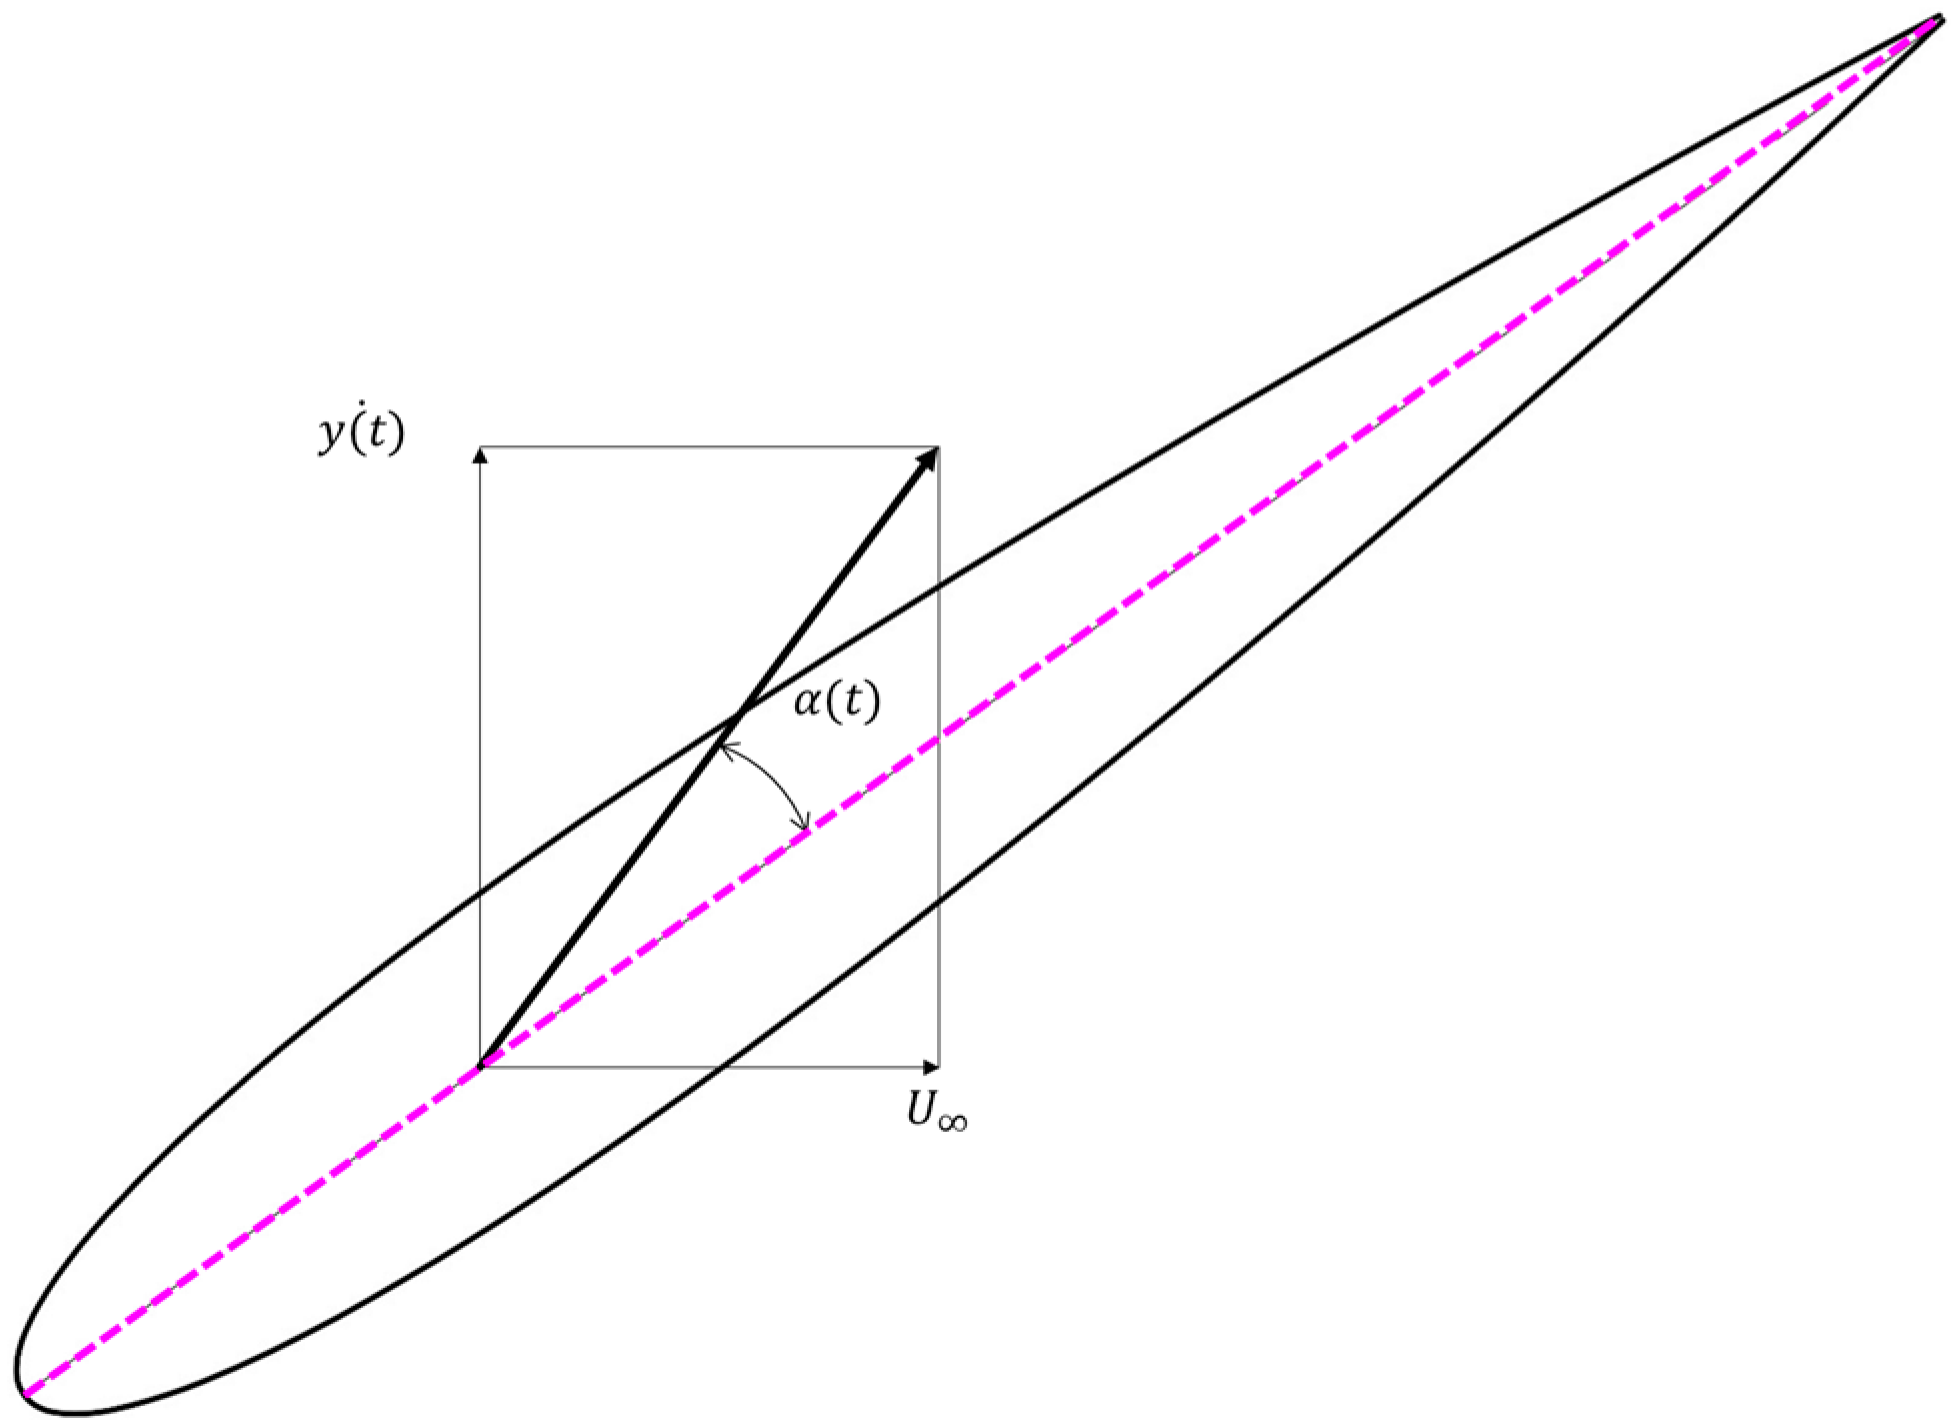
To facilitate the analysis of the reasons for different flow fields in the aquaculture raceway, the concept of angle of attack is introduced. The angle of attack refers to the angle between the longitudinal axis of the hydrofoil and the equivalent incoming flow velocity, which has a significant impact on the performance of the hydrofoil device and the formation of vortices, as shown in Figure 3.
The equivalent incoming flow velocity is defined as
V e t = U 2 + y ( t ) 2 ˙ ,
The angle of attack is defined as
α t = a r c t a n y ( t ) ˙ U θ ( t ) ,
where U represents the incoming flow velocity, we have adopted a pressure inlet at the entrance; therefore, the incoming flow velocity in this study is generated by the action of the hydrofoil. y ( t ) ˙ is the velocity in the y-direction of the hydrofoil.
The outlet flow velocity uniformity coefficient is incorporated to evaluate the uniformity of flow fields within aquaculture raceways [29].
U C 50 = V L 50 ¯ V H 50 ¯ ,
where U C 50 represents the uniformity coefficient of the flow velocity at the outlet boundary, with larger values of U C 50 indicating better flow field uniformity within the aquaculture raceway; V L 50 ¯ is the average velocity of water whose velocities are below the raceway’s average velocity; V H 50 ¯ is the average velocity of water whose velocities are above the raceway’s average velocity.
The floating particulate waste discharge rate K to evaluate the waste removal performance of the raceway is defined, and the waste discharge rate of particles in the aquaculture raceway is analyzed at different times, defined as
K = P t S t P t × 100 % ,
where P t represents the total mass of particles introduced into the aquaculture raceway, S t represents the mass of particles remaining within the aquaculture raceway at various times.
The instantaneous thrust coefficient of the hydrofoil is defined:
C T t = 2 F T ( t ) ρ U ¯ 2 s c ,
where FT(t) is the instantaneous thrust generated by the hydrofoil, ρ is the density of water, taken as 998.2 kg/m3; U ¯ is the average outlet flow velocity of the flow field, and s is the span of the hydrofoil. In this paper, it is a two-dimensional calculation with a default span s = 1; c is the chord length of the hydrofoil.

3. Numerical Method

3.1. S S T   k ω Turbulence Model and DPM Model

The fluid flow model employs the S S T   k ω turbulence model. Compared to the R N G   k ε turbulence model, the S S T   k ω turbulence model combines the advantages of the k ω model in near-wall treatments and the k ε model in free-flow regions away from walls. This model smoothly transitions between the two models through a specific blending function, enhancing the prediction capabilities for flow separation and reattachment [30], making it more accurate in predicting open channel flow characteristics. Therefore, the S S T   k ω turbulence model is used to establish the fluid numerical model, with corresponding equations found in reference [31].
The solid motion model adopts the DPM (Discrete Phase Model). The main components of floating particles in aquaculture raceways are feed residues and fish excretions, with the discrete phase volume fraction accounting for less than 10 % . Therefore, the Discrete Phase Model (DPM) is selected to track the floating particles within the aquaculture raceway. Considering the two-way coupling between the solid and liquid phases (Interaction with Continuous Phase), the simulation models the motion of solid particles in the liquid phase, considering gravity, drag force, and lift force on the solid phase.

3.2. Mesh Generation and Solving Settings

In this study, we use Ansys-Fluent 2024R1 for CFD simulation. Li et al. [32] conducted a comparison and validation between two-dimensional numerical results and experimental results in their study on the propulsion characteristics of hydrofoils. The results indicated that when the incoming flow velocity was 0.4   m / s , the amplitude of the translational motion was 0.75 c , and the maximum angle of attack was 30 ° , the two-dimensional numerical calculations were essentially consistent with the experimental results from the MIT towing tank. The parameters involved in this paper are fundamentally similar to those in the aforementioned study. By employing two-dimensional numerical calculations, computational efficiency can be enhanced while ensuring precision. Therefore, a two-dimensional numerical model is adopted. The solution is computed using the Ansys-Fluent solid–liquid model, with both the continuous and dispersed phases employing an implicit pressure-solving method. The COUPLE algorithm is used for pressure-velocity coupling. Pressure and momentum are discretized using a second-order upwind scheme, while turbulent kinetic energy and turbulent dissipation rate are discretized with a first-order upwind scheme. The simulation is considered to have converged when the residuals for all variables are less than 10−5.
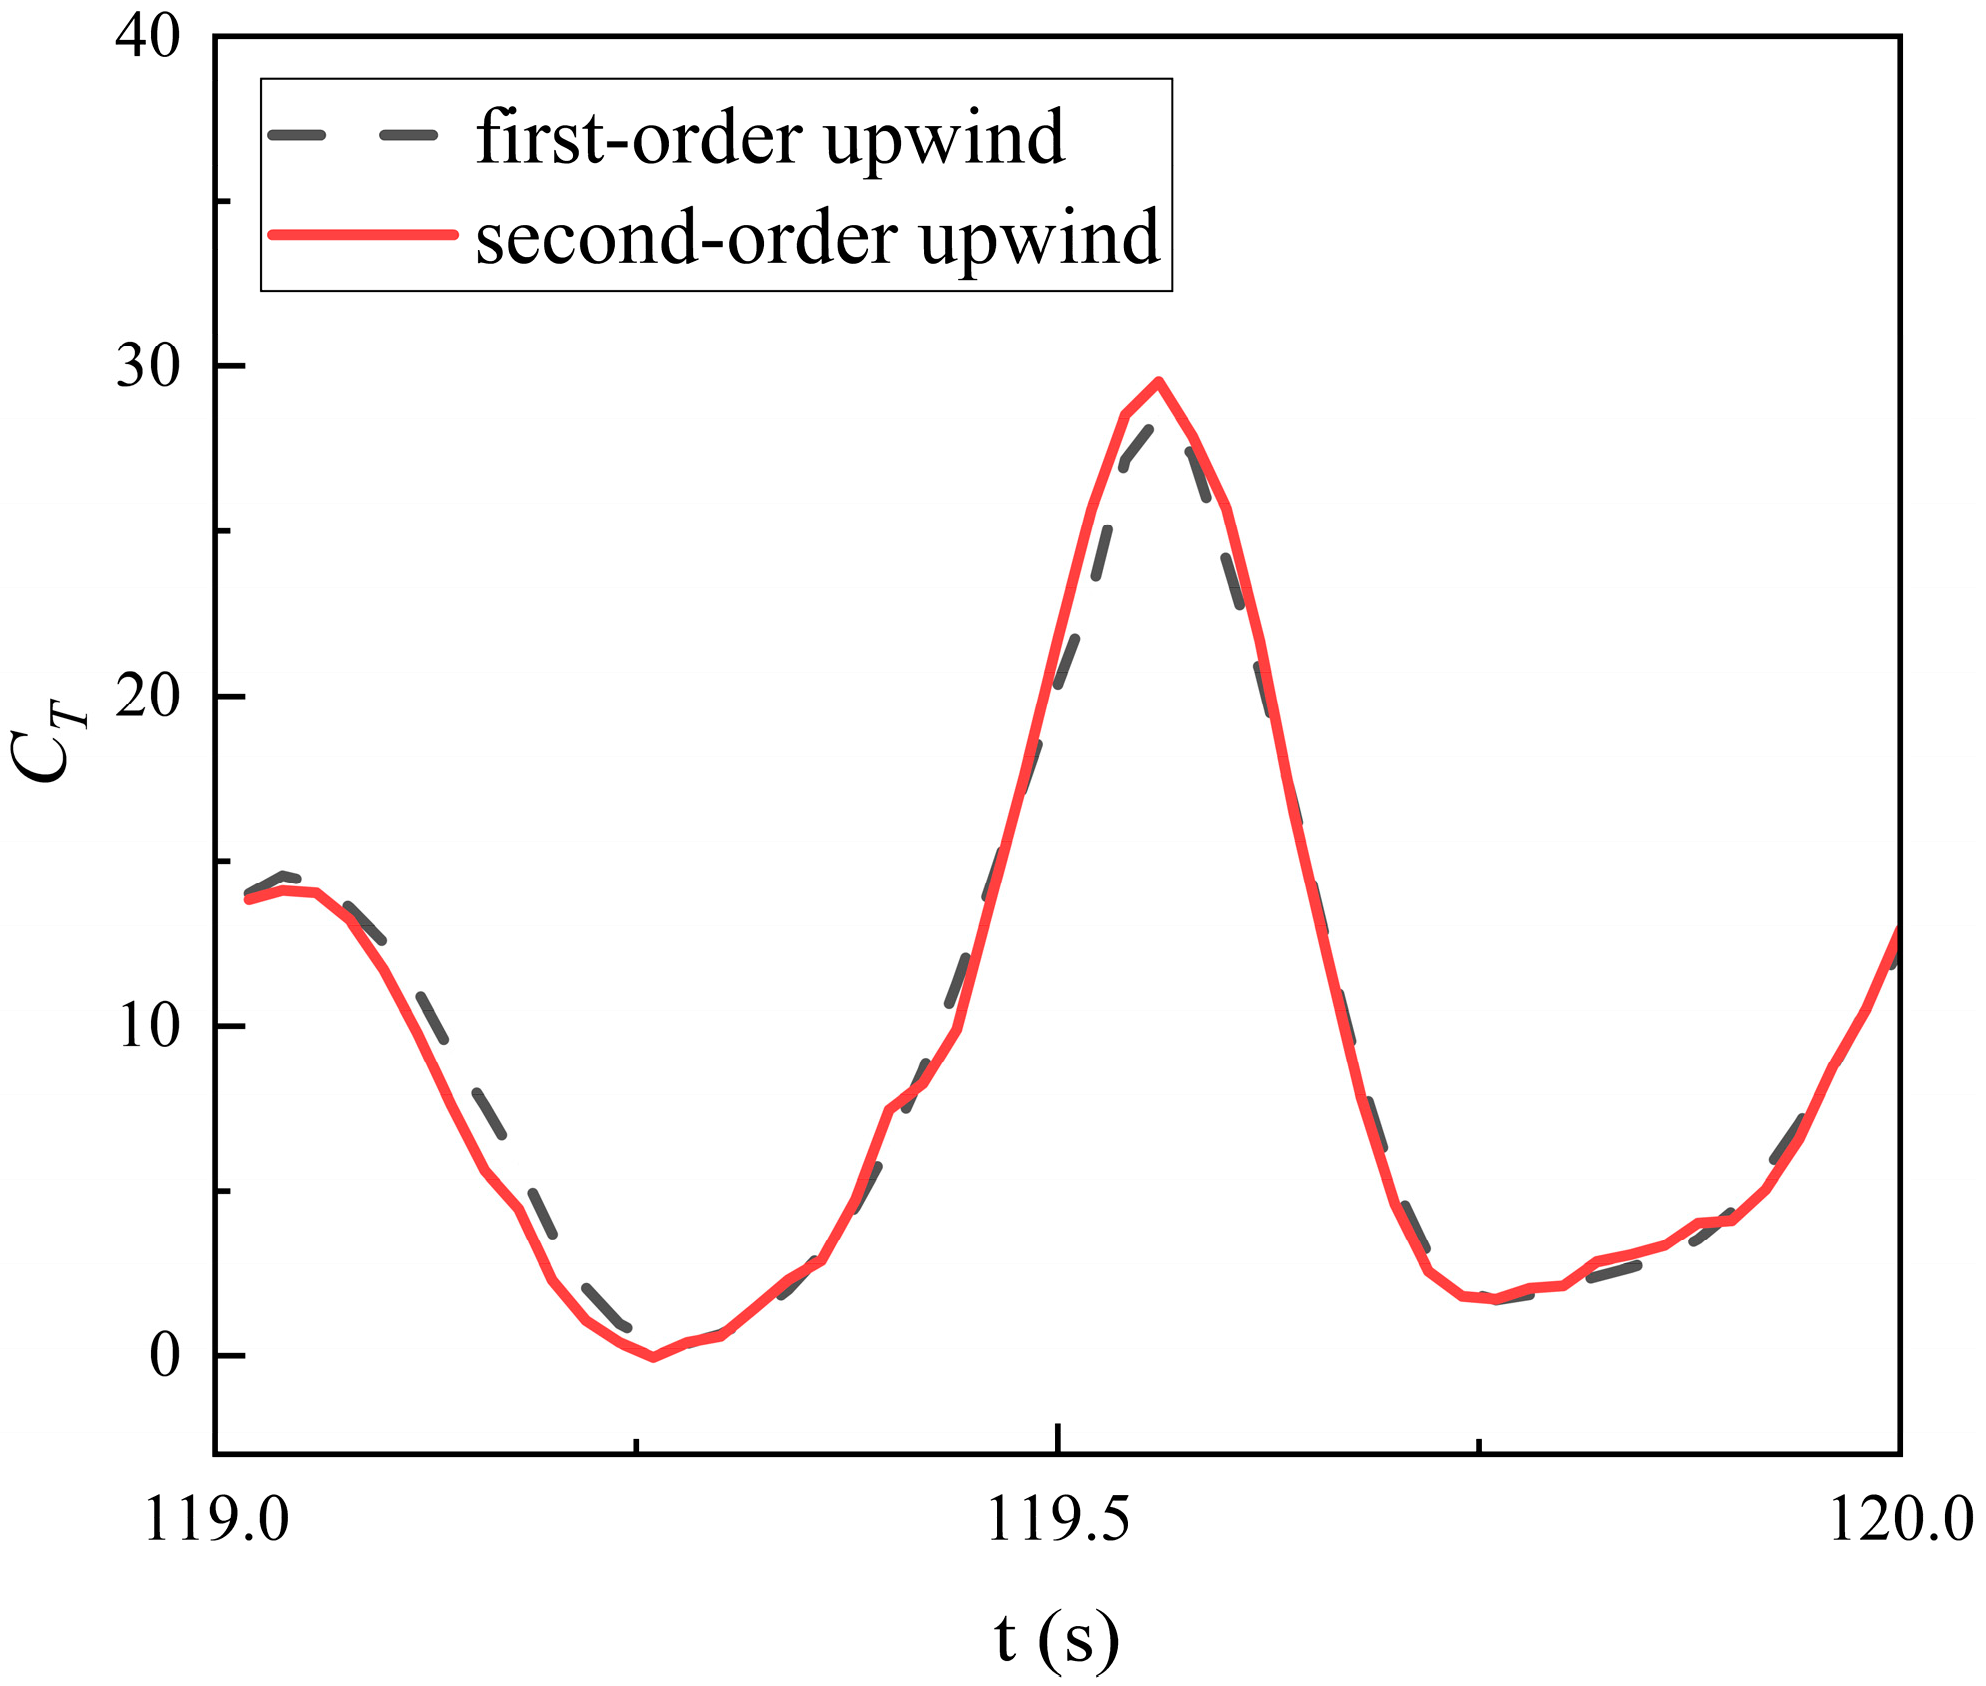
To verify that the first-order upwind discretization scheme has sufficient accuracy for computations, we selected the operational conditions with a chord length of c = 0.2 W and a frequency of 1 Hz, and conducted simulations using the first-order upwind discretization scheme and the second-order upwind discretization scheme separately. When the runway flow field stabilized, the instantaneous thrust coefficient over one cycle of the hydrofoil was compared, as shown in Figure 4.
The continuous phase density is ρ = 998.2 kg/m3, the viscosity μ = 1.005 × 10⁻³ kg/m3 To better simulate the quiescent water environment in the wastewater purification area, we set the inlet and outlet of the raceway as pressure inlet and pressure outlet, respectively; the pressure inlet is set at 0 Pa with a turbulence intensity of 3.53% and a hydraulic diameter of 4 m; the pressure outlet is also set at 0 Pa with a turbulence intensity of 3.53% and a hydraulic diameter of 4 m. The runway boundary is set as a wall. It is assumed that there is no shear and no slip velocity. According to the study by Liu et al. [33], the average particle size of solid particles in the tailwater of traditional pond aquaculture is 12.13 μm. Therefore, the calculated particle size is set to 12 μm, with a solid phase density of ρ = 900   k g / m 3 . Considering spherical particles, the relative collisions between particles are not taken into account. The physical mode of particles with the inlet and wall surface is set to reflect, and the physical mode of particles with the outlet is set to escape.
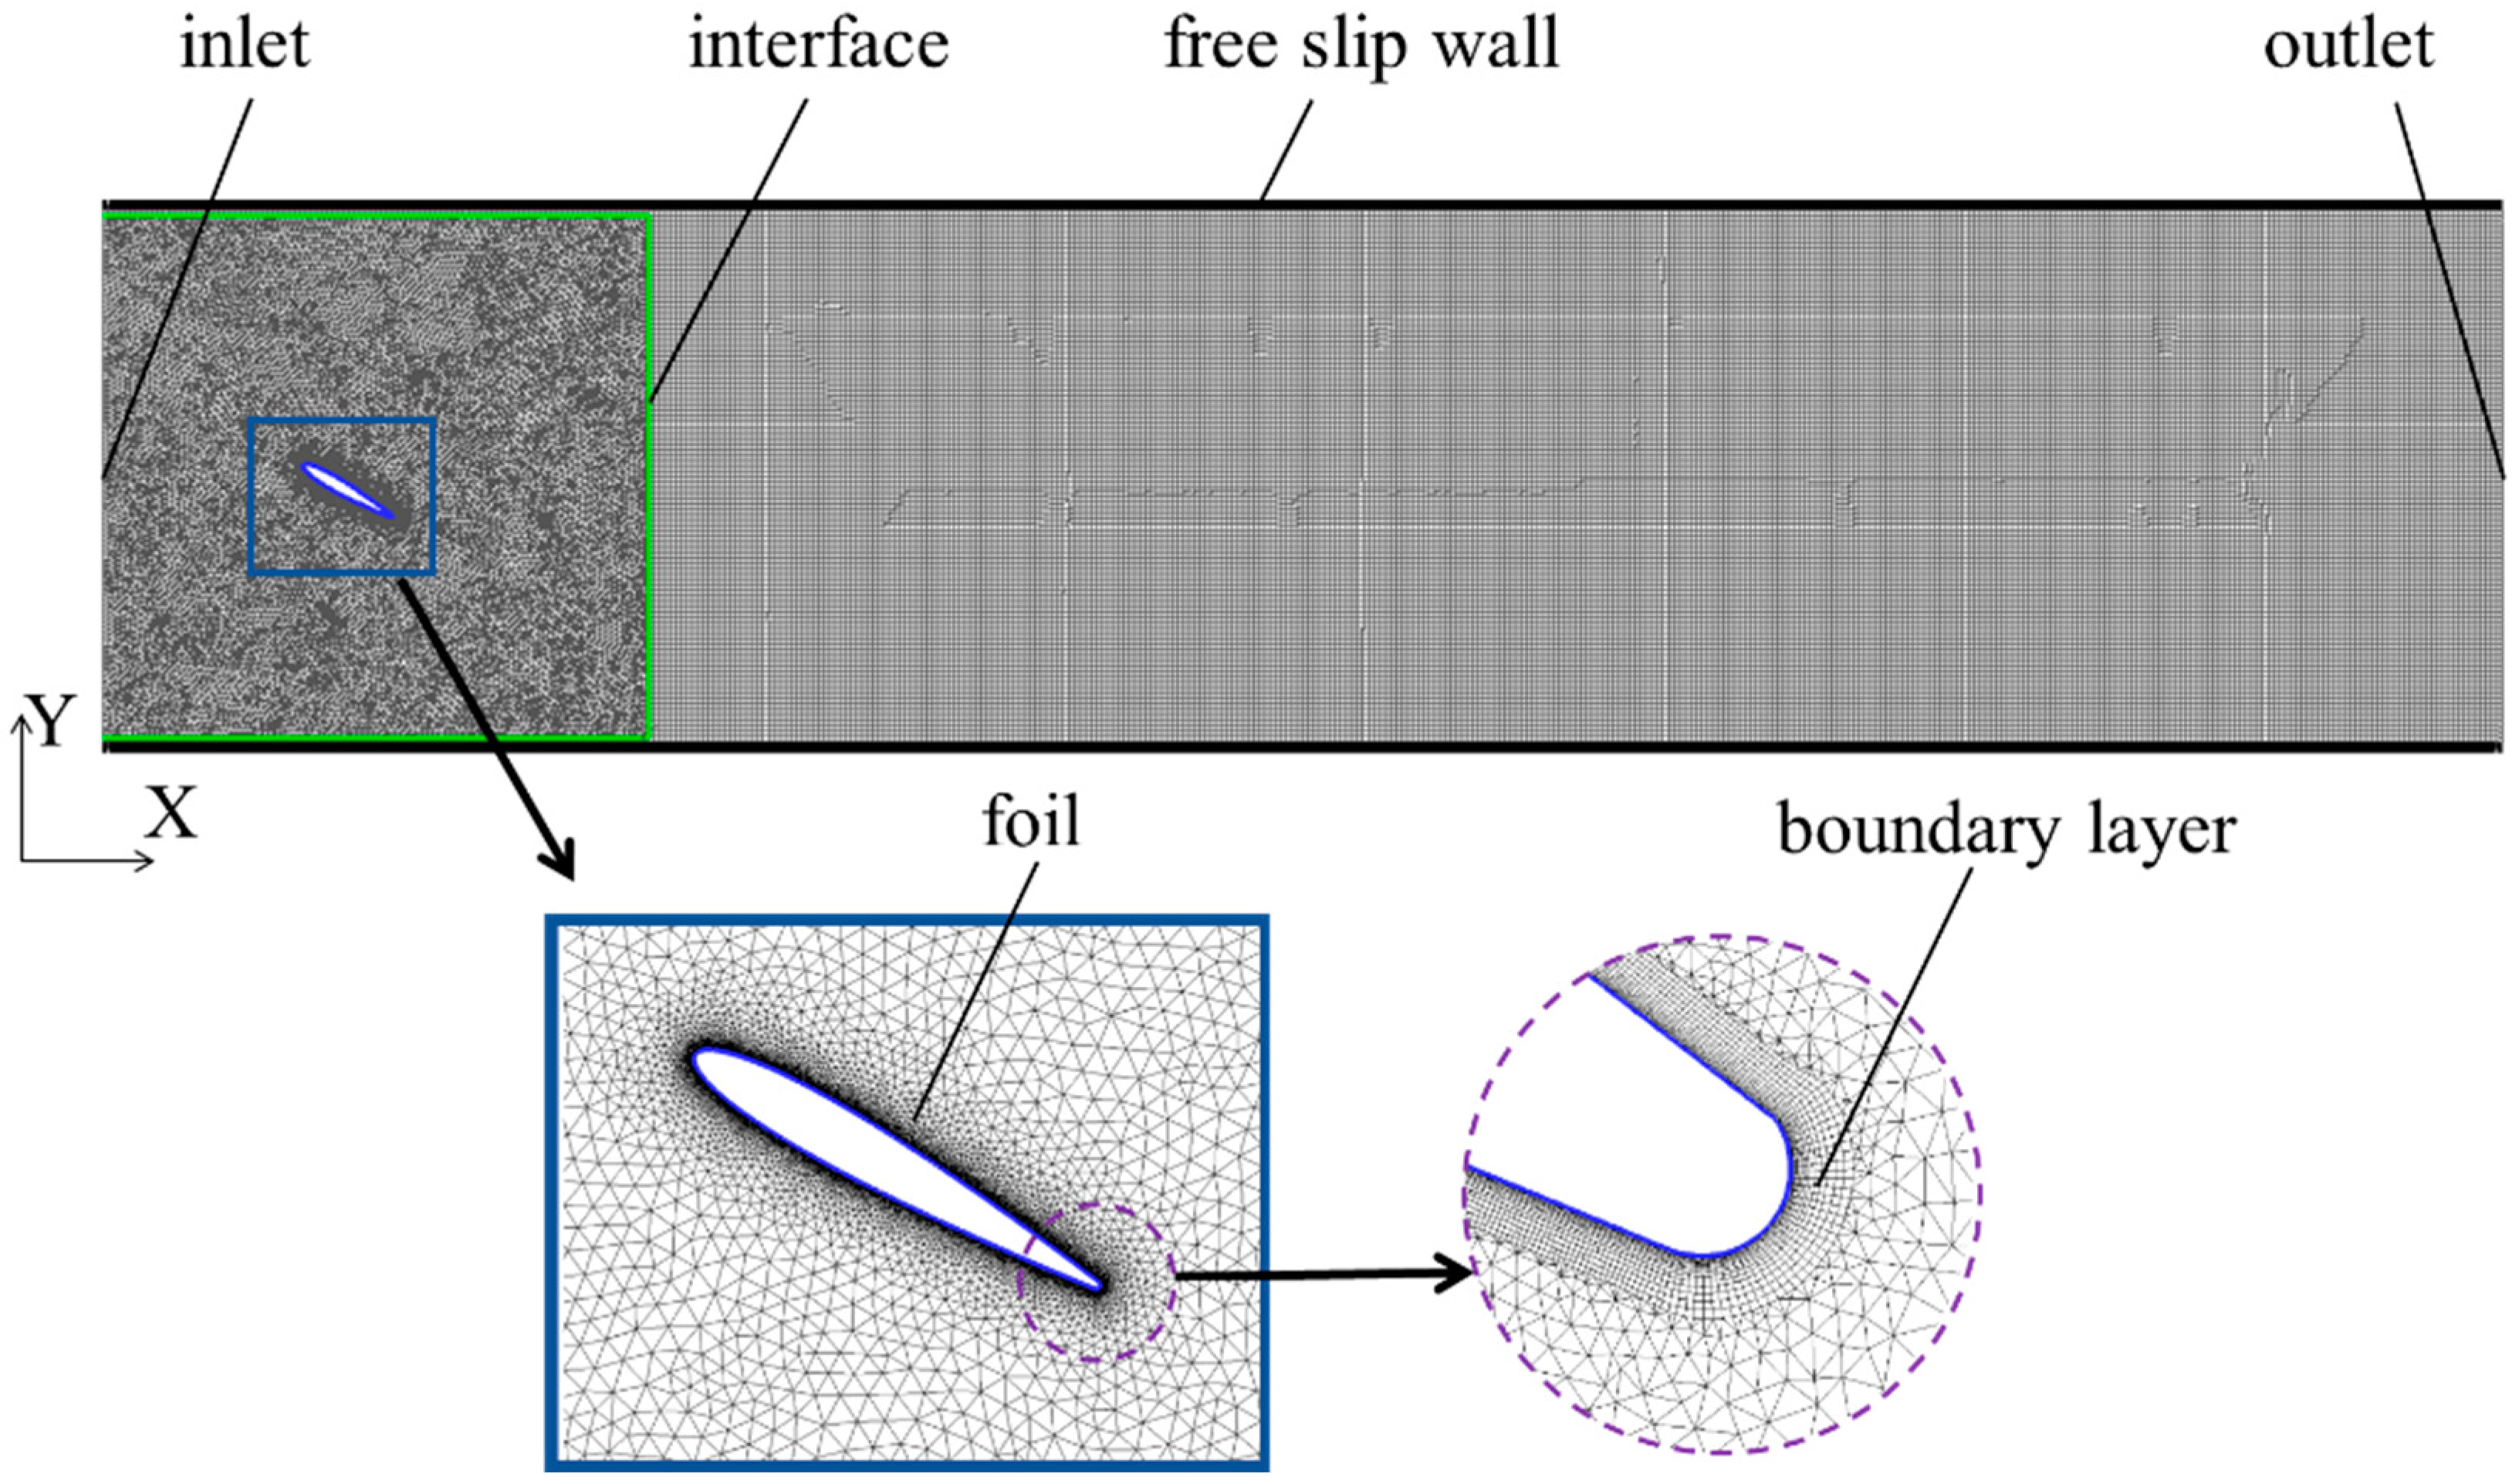
To make reasonable use of computing resources and consider the compatibility issues of the DPM model, we employ dynamic mesh technology to deal with the motion problem of the hydrofoil. To simulate a realistic aquaculture raceway scenario, the overall computational domain is designed to be 20   m × 5   m . Due to the hydrofoil needing to perform combined translational and rotational movements, dynamic mesh technology is required to reconstruct the mesh at different times; therefore, unstructured meshes are used around the hydrofoil. Meanwhile, to improve the computational efficiency, the computational domain was divided into two parts, consisting of unstructured grids around the hydrofoil motion and structured grids in the particle production area. Data transfer is achieved by establishing a grid interface. The structured grid area is composed of structured grids with a global size of 0.005   m . Near the walls and the hydrofoil, there is a significant gradient in normal velocity, so to better capture the flow field around the walls and the hydrofoil, boundary layers need to be set up on the hydrofoil and the flow channel walls. The height of the first layer of grid in the boundary layers of the hydrofoil and wall is set to 4.64 × 10⁻⁵ m. The target y+ value is 1, and the dynamic viscosity of the selected fluid is 1.005 × 10⁻³. The specific grid division is shown in Figure 5.

3.3. Numerical Simulation of Particle Dispersal Strategy

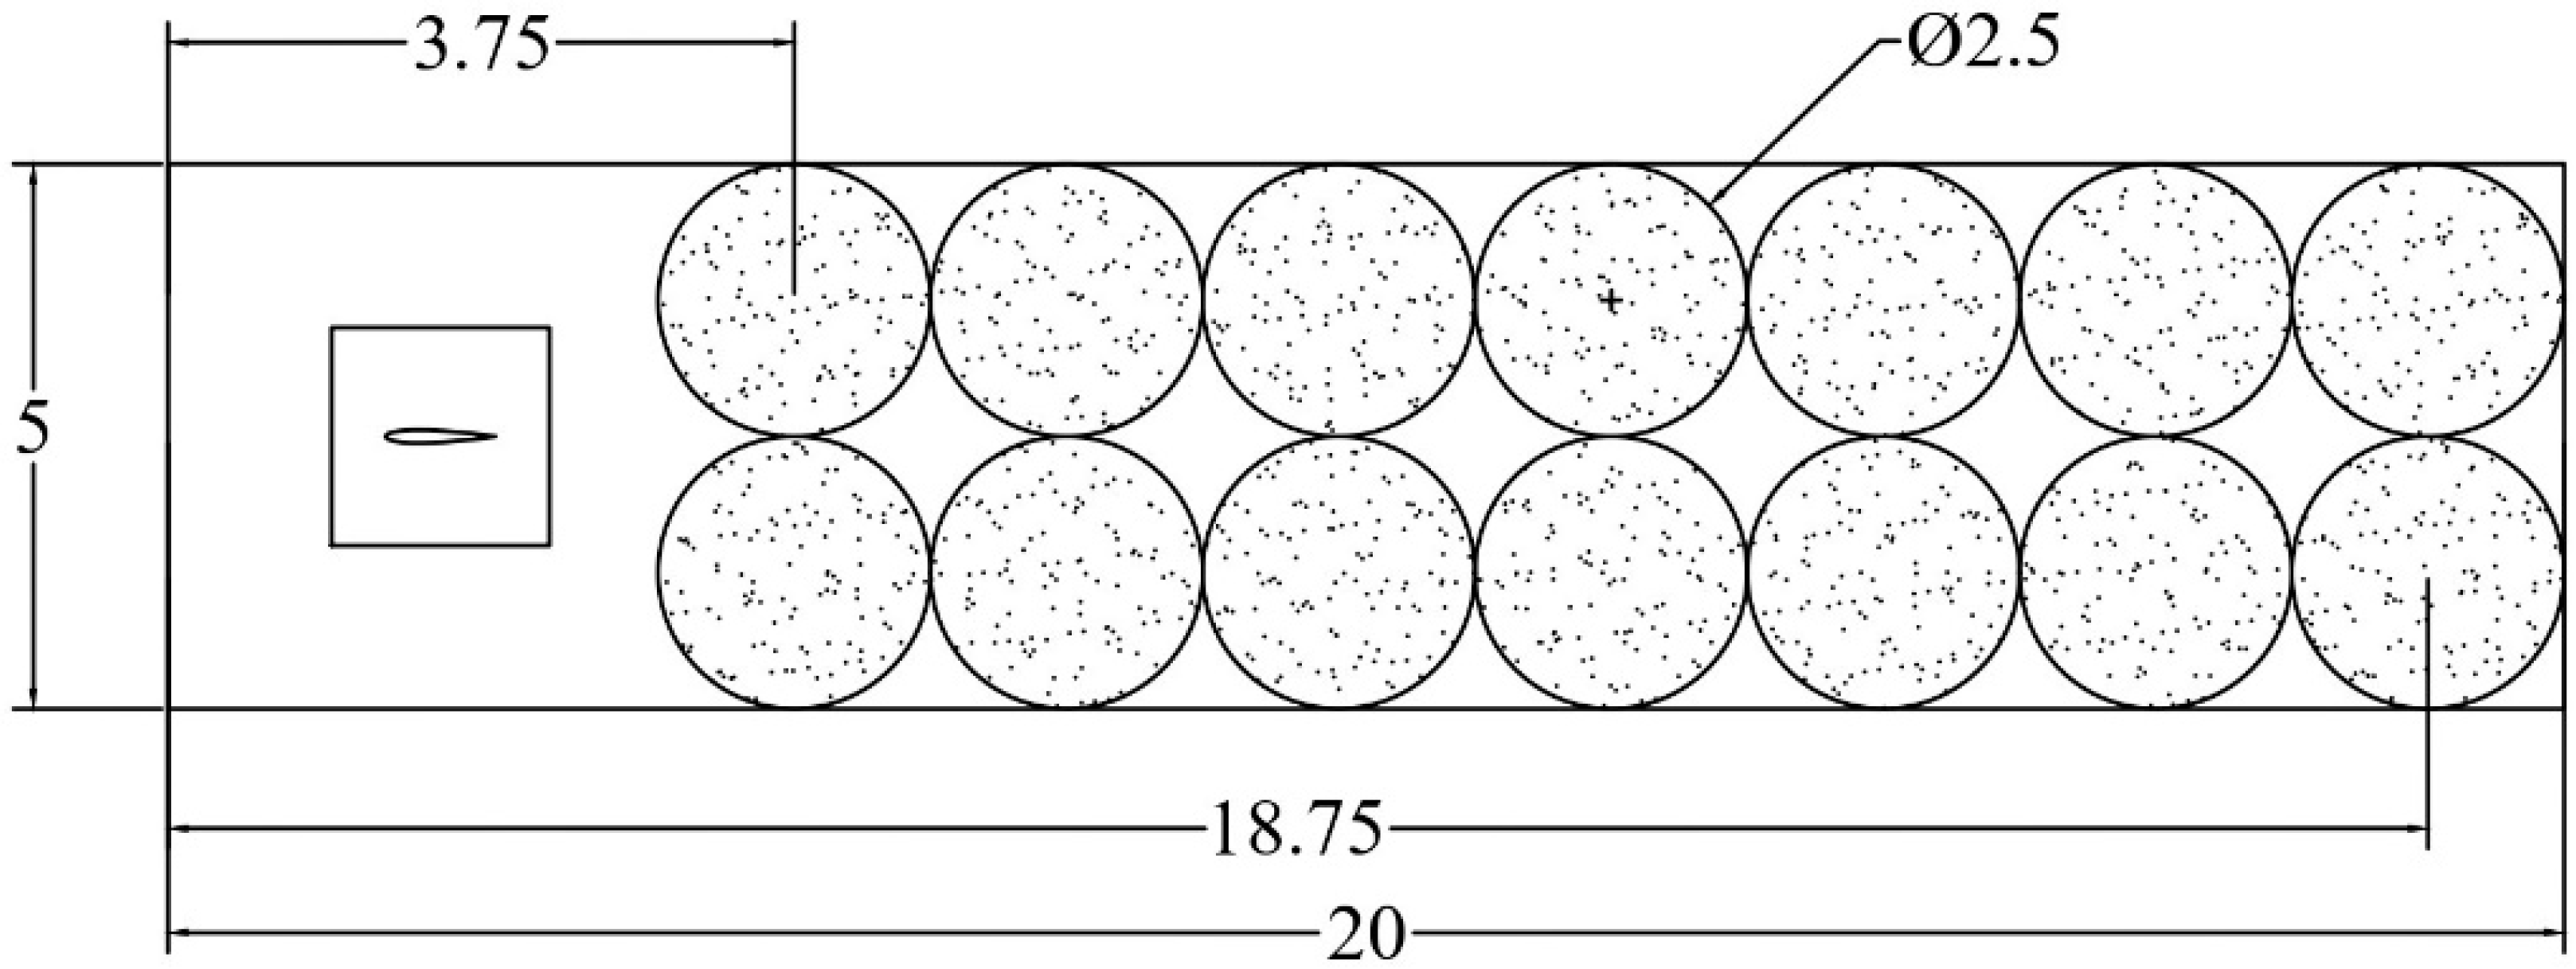
In Ansys-Fluent, it is not possible to randomly distribute particles within an arbitrary-shaped area. To achieve random distribution, one can only choose to scatter particles randomly within a circle of a fixed radius. Therefore, to better simulate the random dispersion of fish excretions and feed scattering, we adopted the uniform dispersion method used in the study by Li et al. [34], as shown in Figure 6. This approach allows for a better random distribution of particles within the raceway. A total of 14 circular areas, arranged in a 2 × 7 configuration, are used to randomly disperse particles within the aquaculture raceway after 40 oscillating cycles. Zhang et al. [35] found through experiments that the concentration of particles in the aquaculture water body is 36.00 ± 4.58   m g / L . The dimensions of a single raceway are 20   m × 5   m × 2   m , and it is calculated that a total of 0.36   kg of floating particles need to be released within 10 s after the start of the release.

3.4. Grid Independence Validation

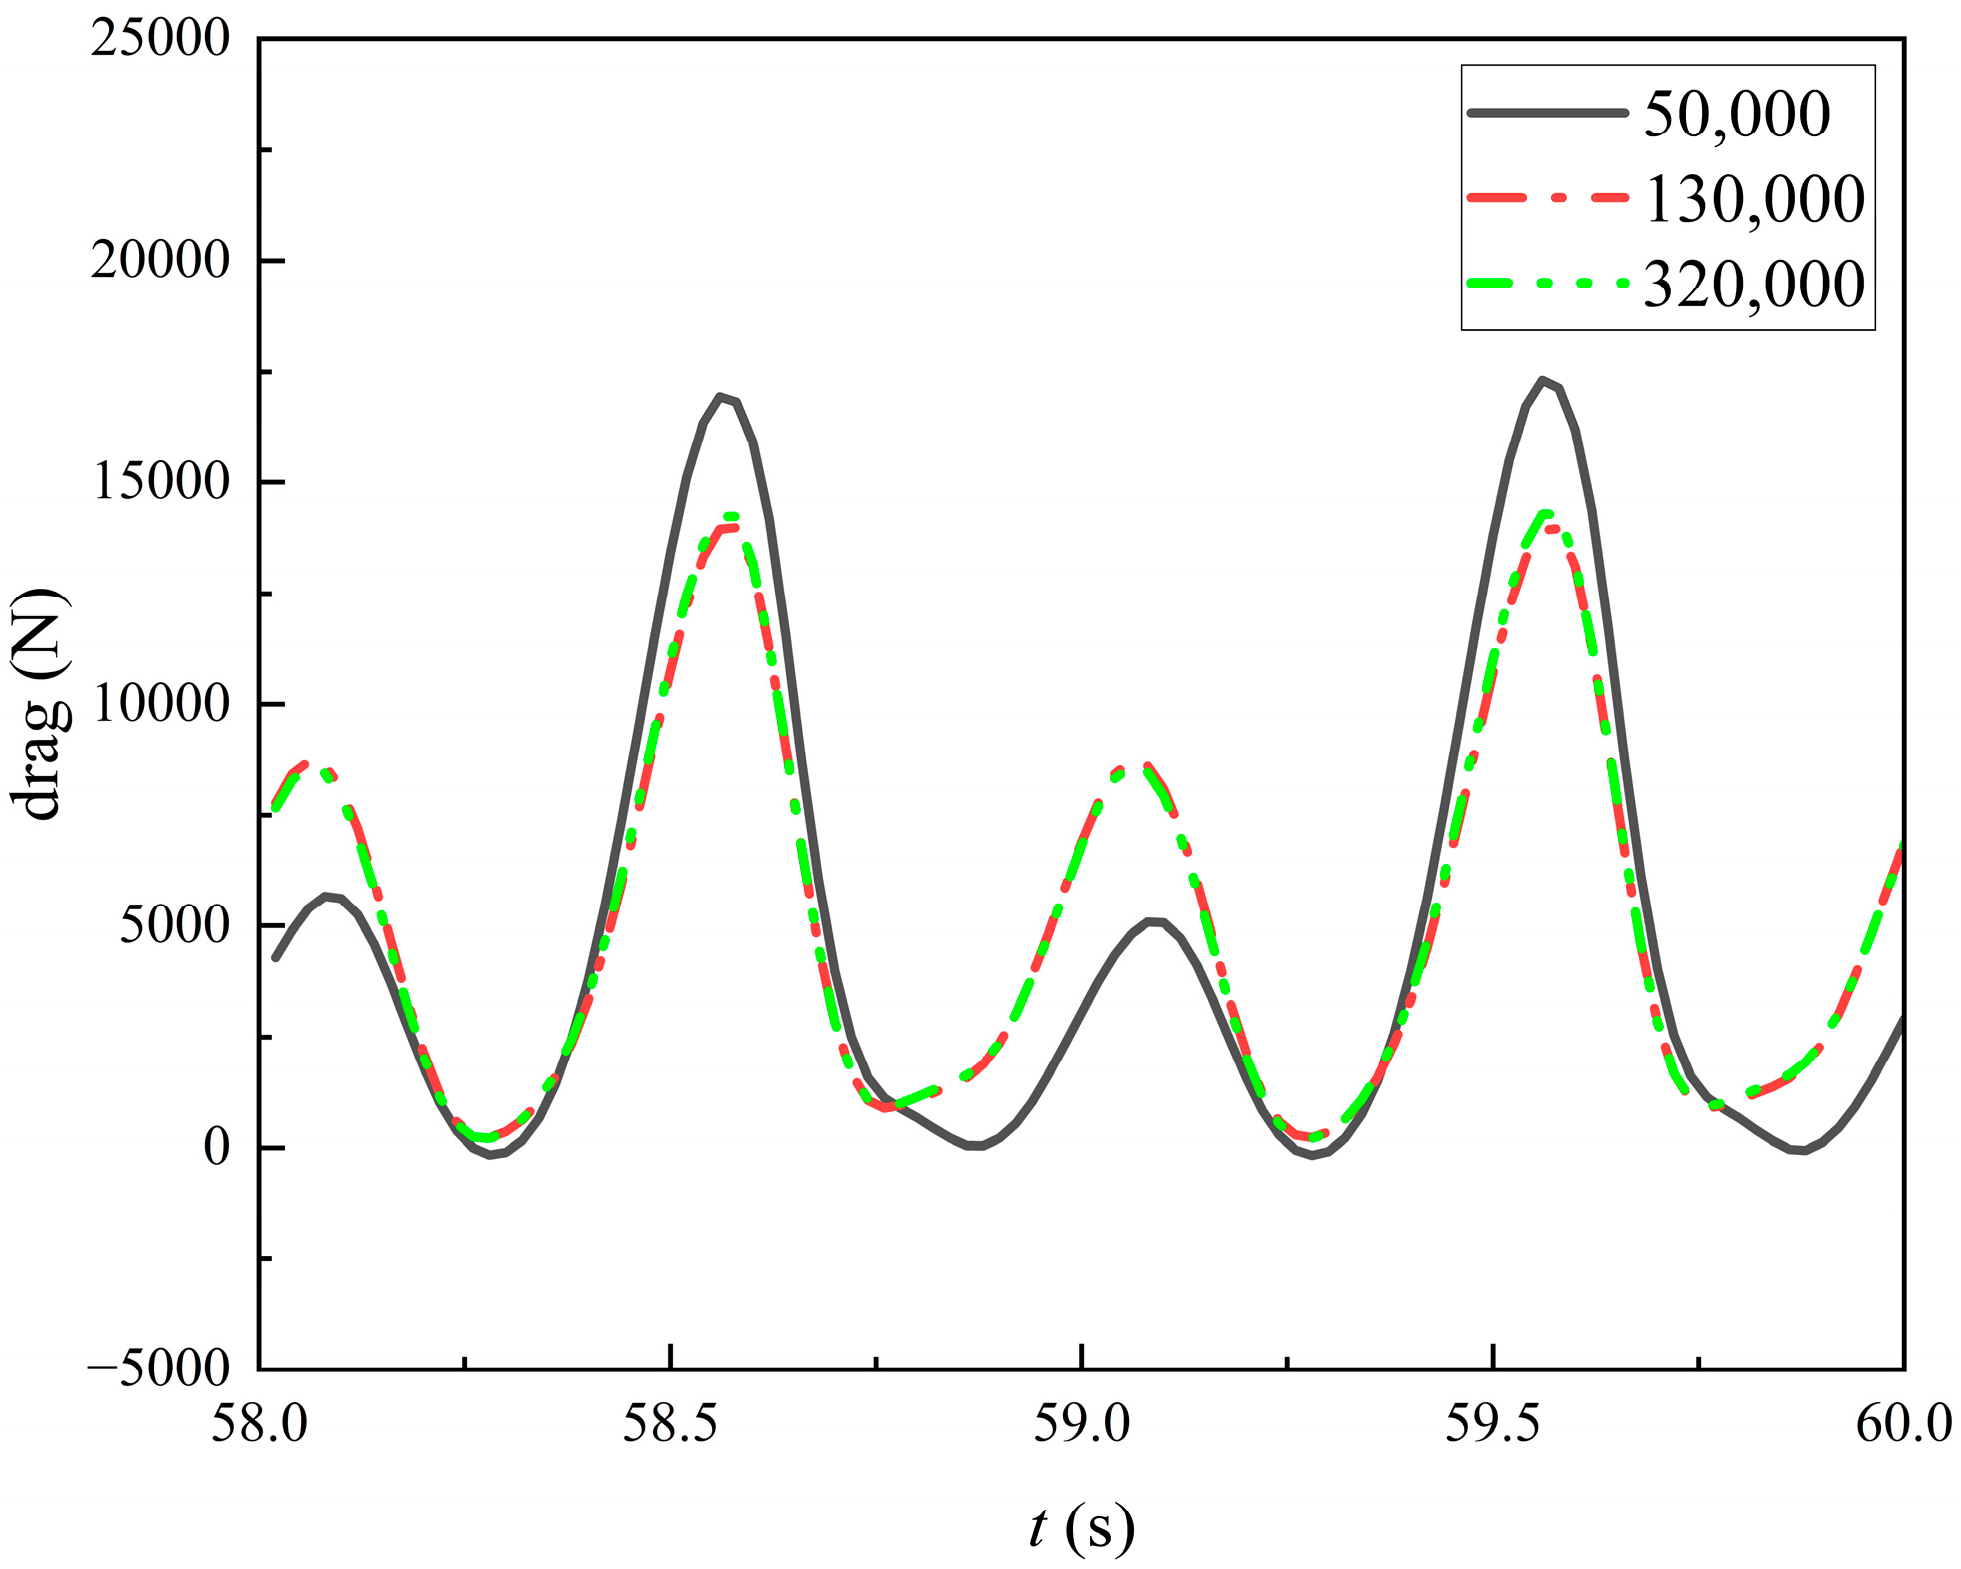
During the process of CFD numerical calculations, the density of the mesh directly impacts the results and computational speed. Therefore, it’s essential to perform a grid-independency verification to ensure the accuracy and reliability of the results. The validation conditions include a hydrofoil chord length of c = 1.0   m , a rotational amplitude of θ m a x = 30 ° , a translational motion amplitude of A m a x = 0.5   m , and a frequency of 1 Hz.
We compared the thrust curves of the hydrofoil under three different grid conditions (50,000, 140,000, and 320,000) when the flow field was stable. The results are shown in Figure 7. The results show that the 50,000-element mesh has a larger deviation in instantaneous thrust than the other two. Based on computational efficiency and resource considerations, we’ve decided to use the 140,000-element mesh for the calculation.

3.5. Method Validation

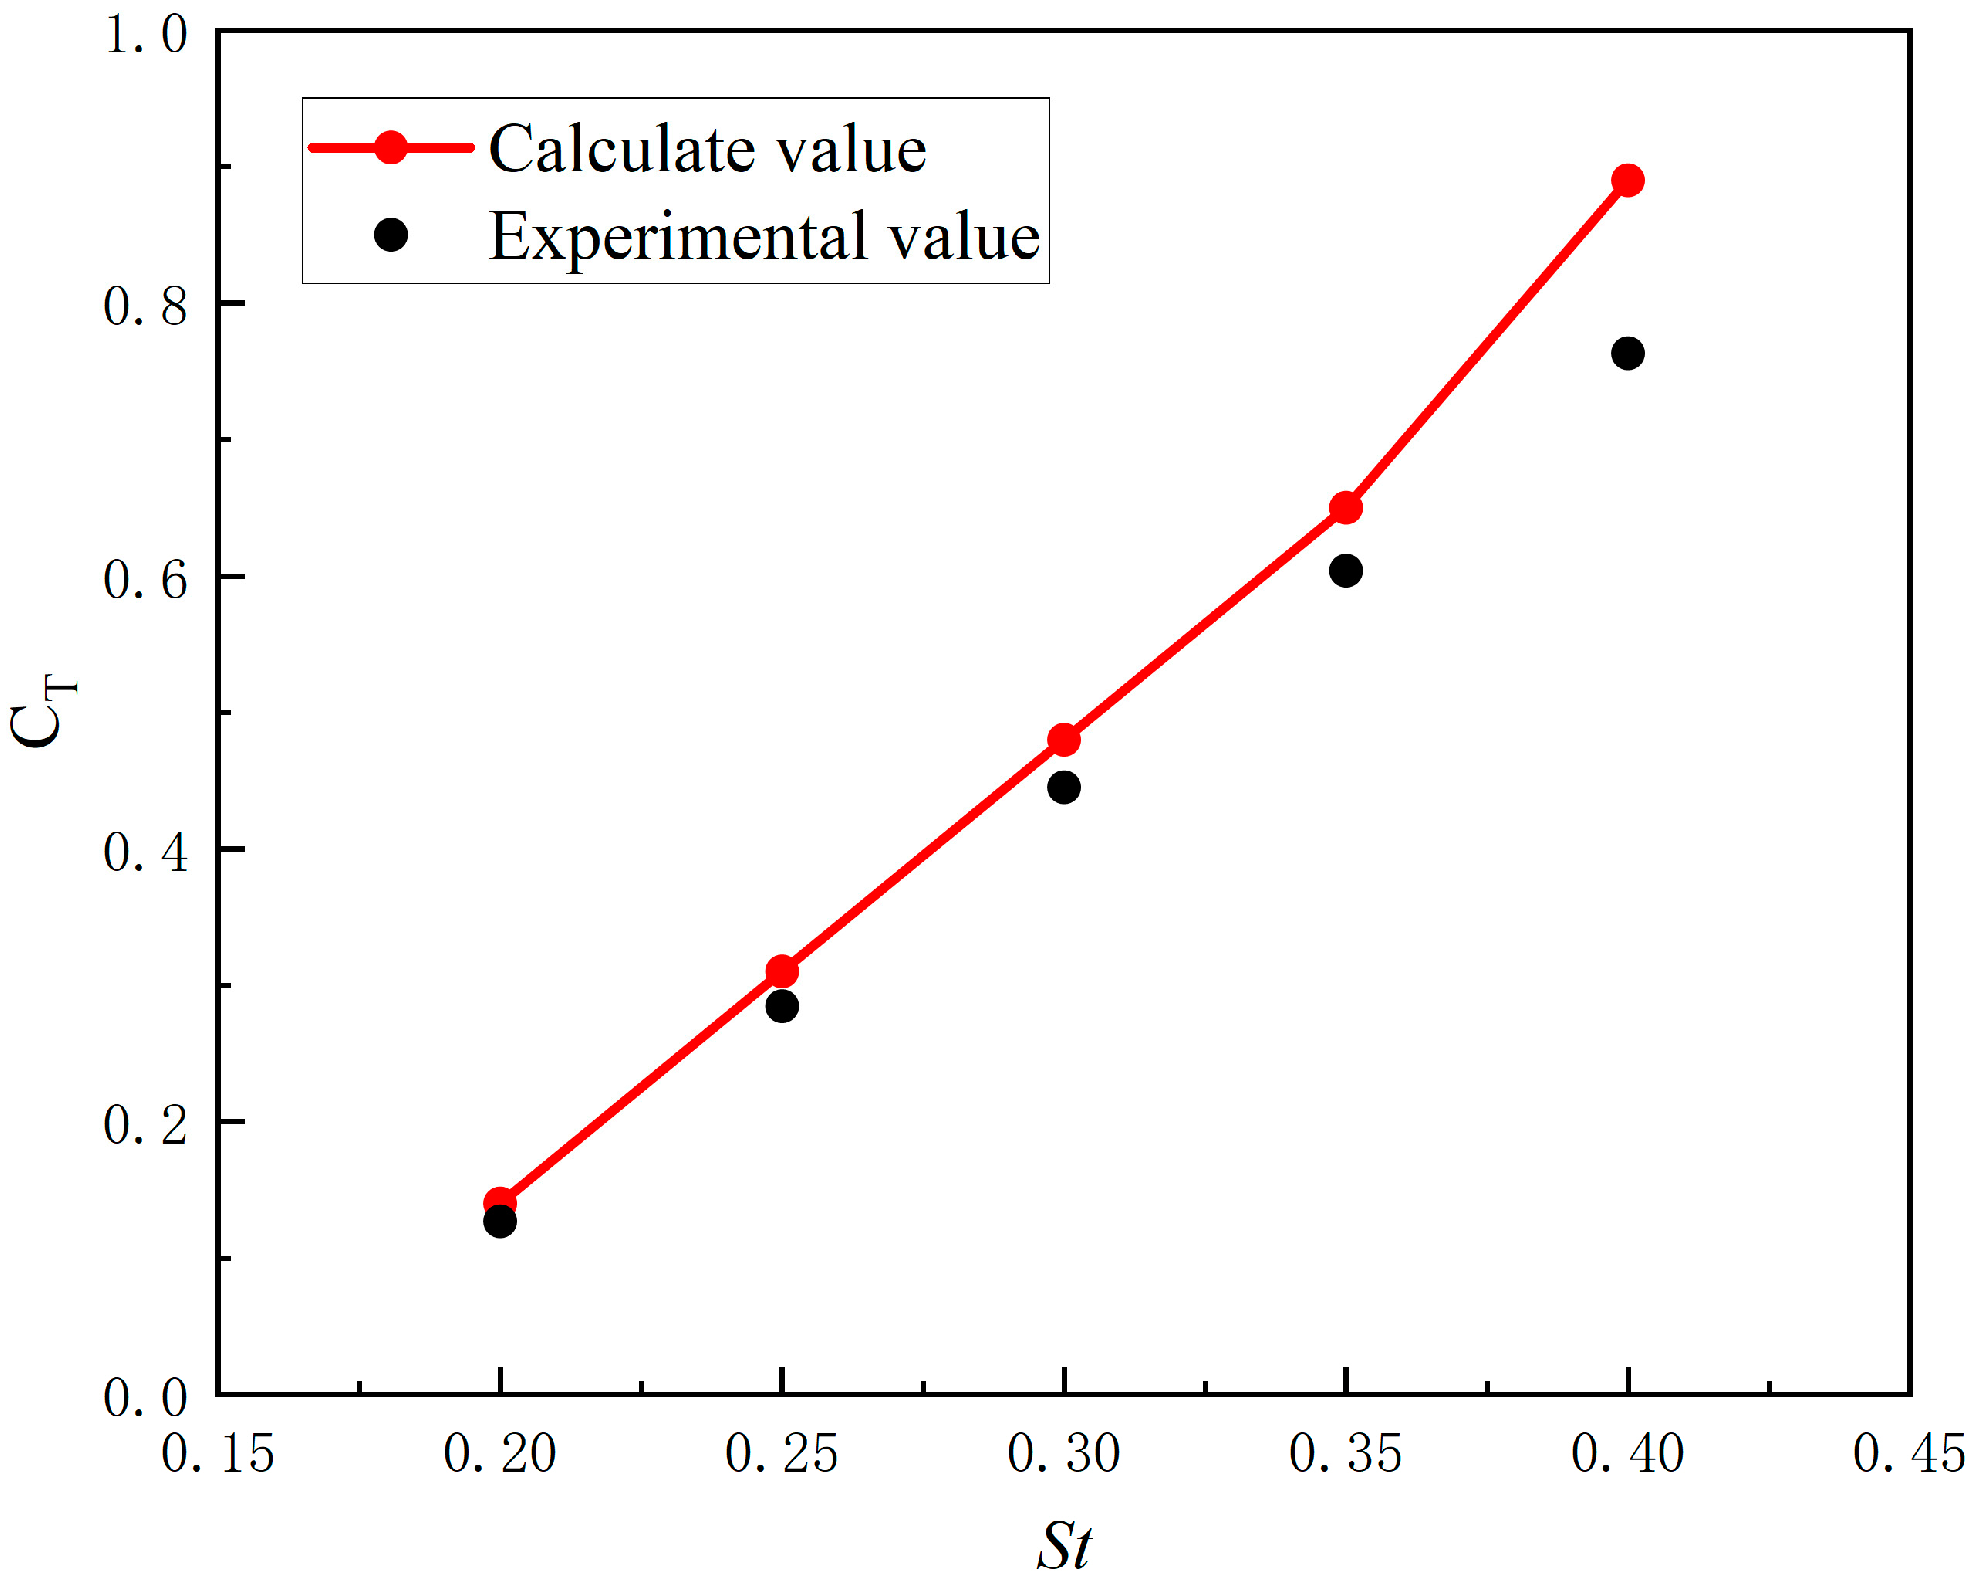
To verify the accuracy of the numerical simulation experiments, we conduct method validation for both continuous phase and discrete phase. By comparing with the experimental results obtained from the Massachusetts Institute of Technology’s towing water tank laboratory [36], a numerical calculation model is established based on the experimental conditions described in the literature: inlet velocity U = 0.4   m / s , maximum angle of attack φ = 30 ° the ratio of heaving, amplitude to hydrofoil chord length A m a x c = 0.75 , and hydrofoil chord length c = 0.6   m ; the distance between the hydrofoil’s pivot center and the leading edge of the hydrofoil l = 1 / 3 c ; oscillation frequency f = 1.0 Hz. The thrust coefficients for Strouhal numbers of 0.2, 0.25, 0.3, 0.35, and 0.4 are calculated, respectively, and the results are shown in Figure 8. Through comparison, it can be found that the simulation results are generally consistent with the experimental results.
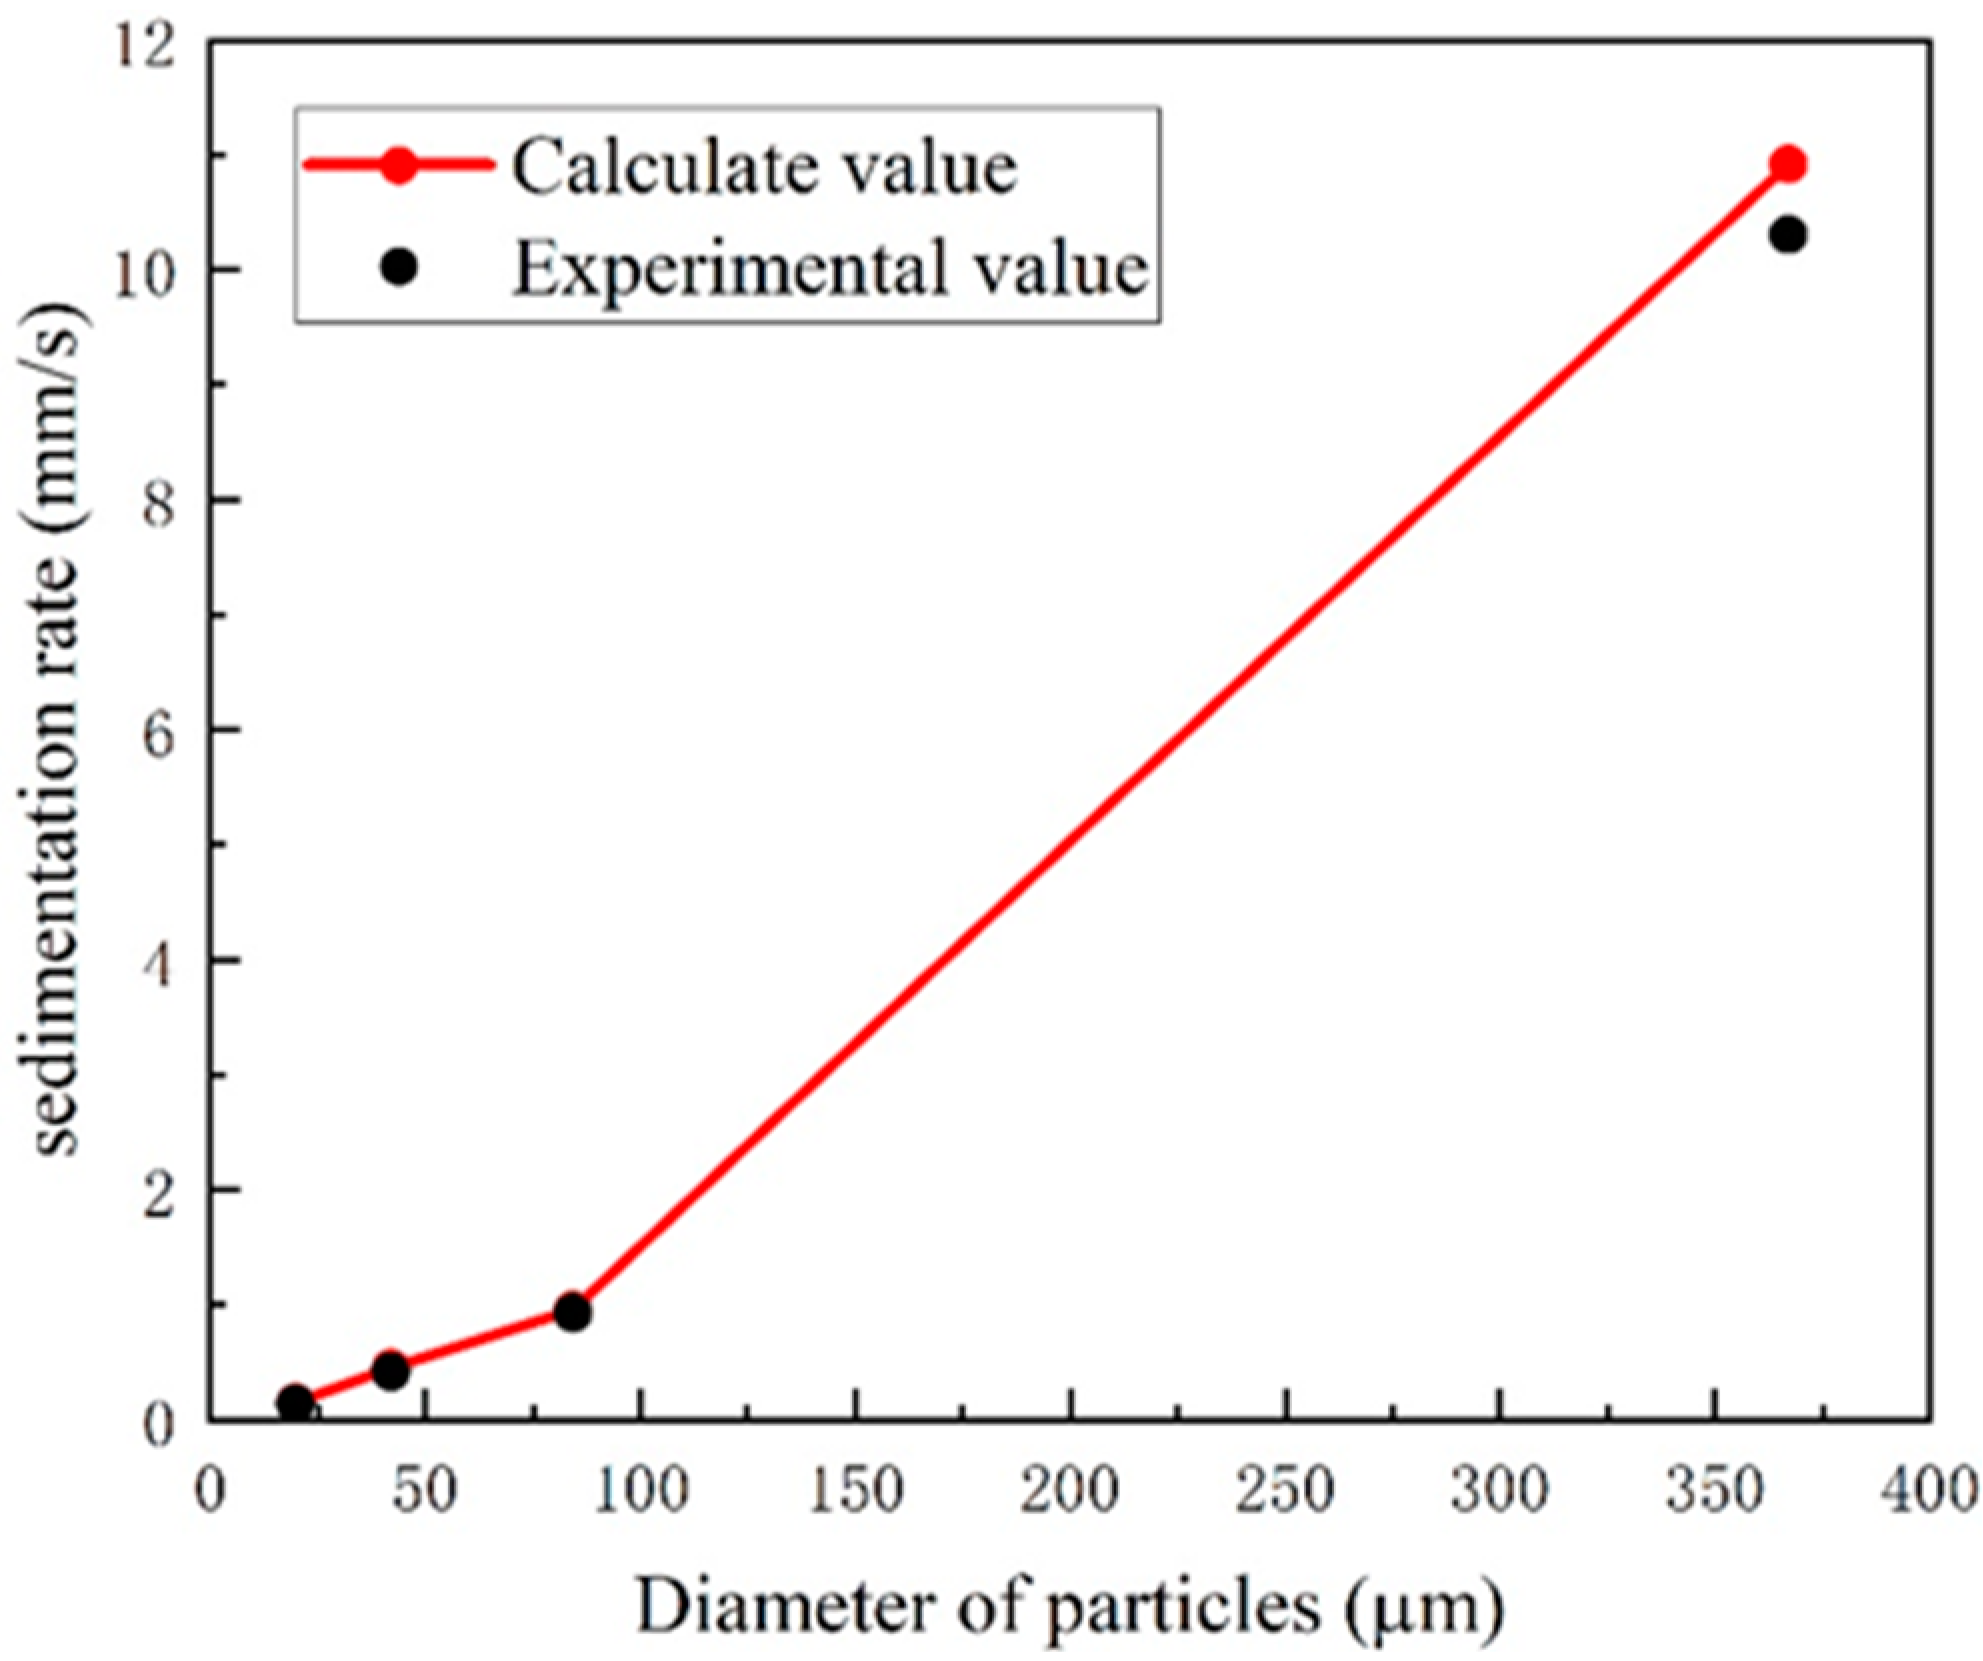
In comparison with the experimental results of the sedimentation rate of spherical polystyrene microspheres in an organic glass sedimentation column obtained from the literature [37], a model is established based on the conditions described in the literature: the height of the experimental sedimentation column h = 1500 mm, cross-sectional dimensions 113.5 mm × 113.5 mm, sand particle density ρ = 1050   k g / m 3 , fluid density ρ = 998.2   kg / m 3 , viscosity η = 1.005 × 10⁻³ Pa∙s. The sedimentation rate of spherical polystyrene microspheres with diameters of 19.7 μm, 41.9 μm, 84.3 μm, and 367.0 μm were calculated, respectively, and the results are shown in Figure 9. It can be found that there is a certain error between the experimental values and the simulated values, but the maximum error does not exceed 10%, and the trends are consistent. Therefore, the simulation method adopted in this paper is effective.

4. Results and Discussion

4.1. Effect of Chord Length and Frequency on the Flow Field

4.1.1. Effect of Different Frequencies and Chord Lengths on the Flow Field

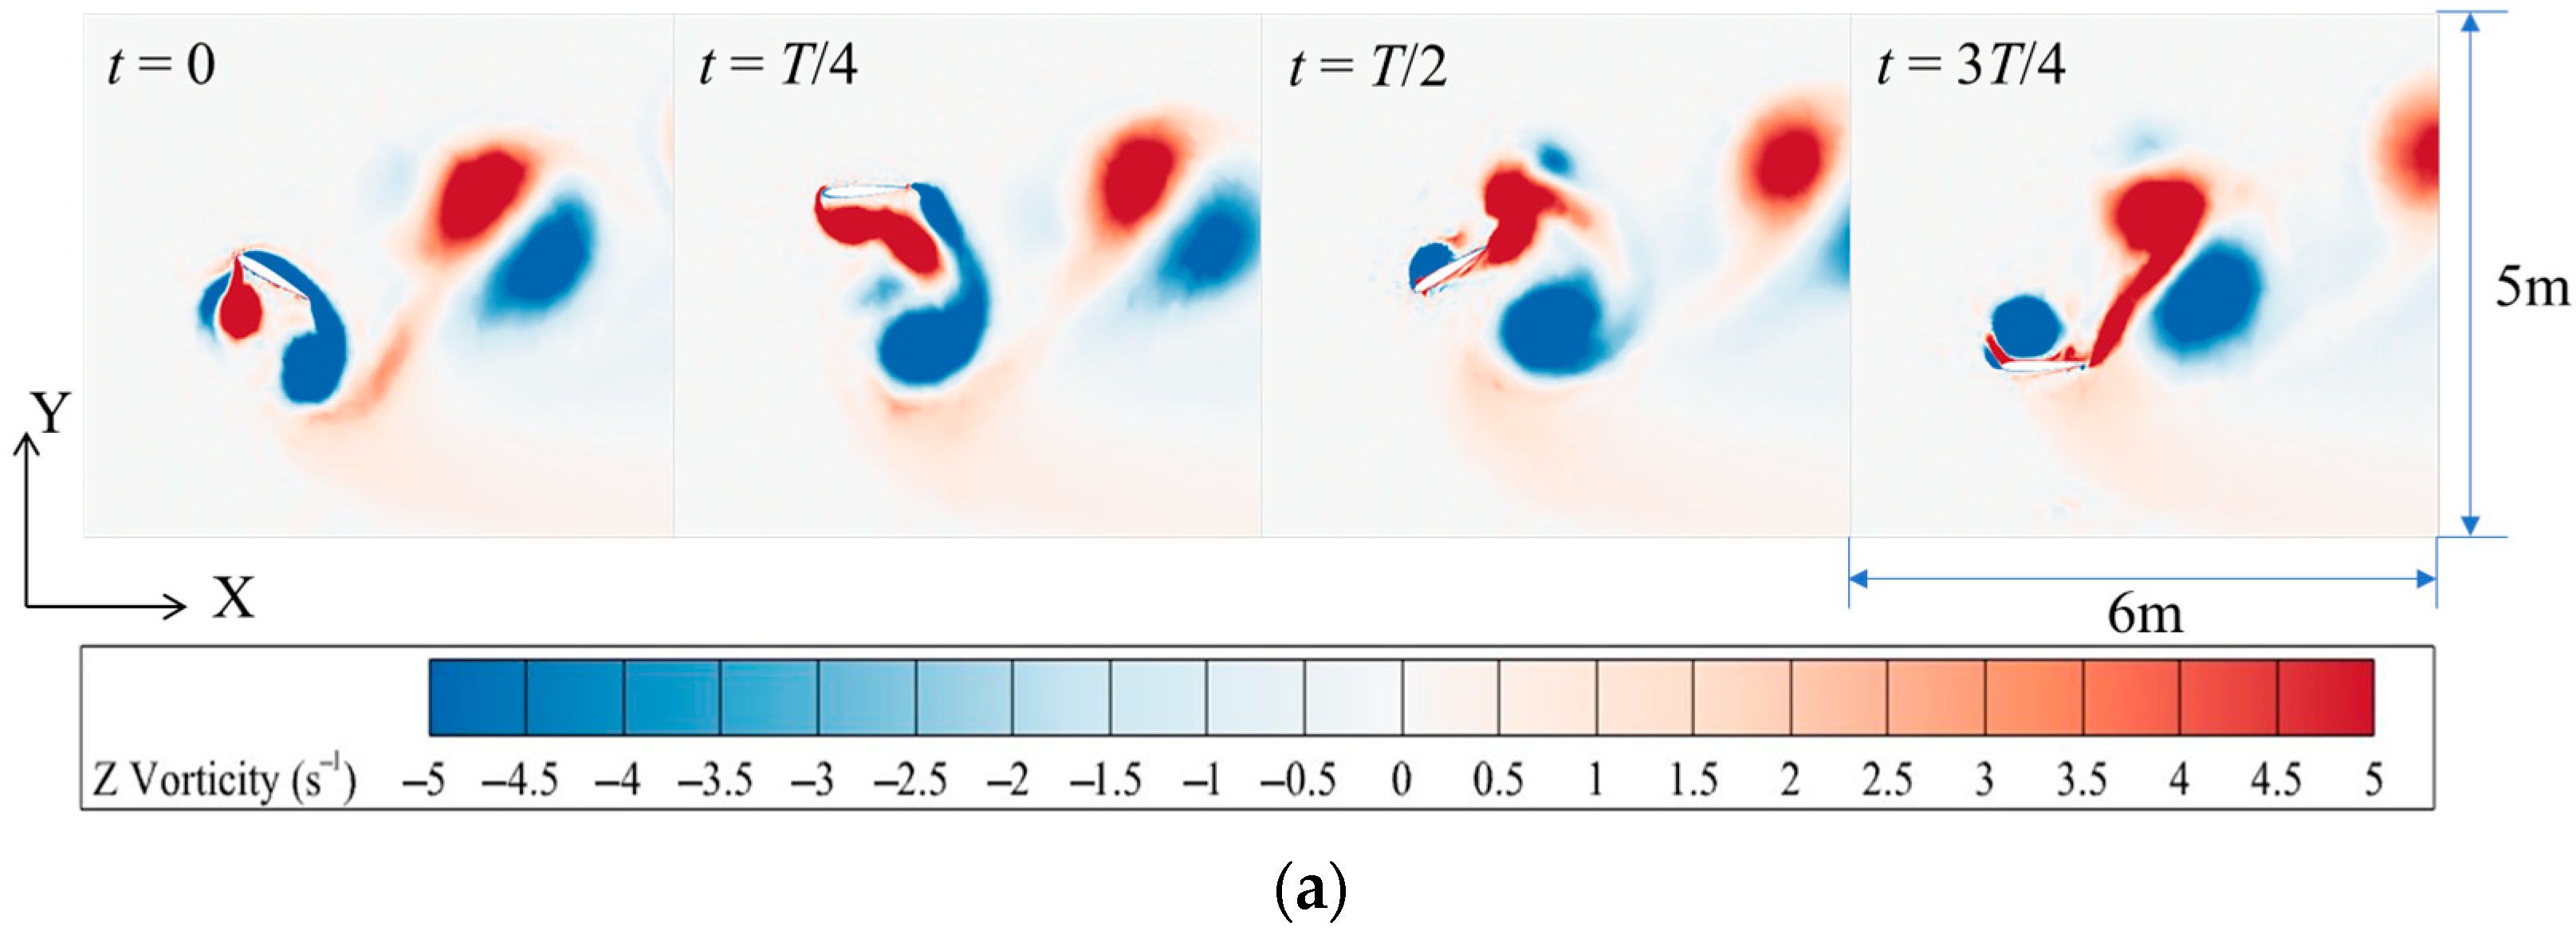
When the hydrofoil achieves a specific combined motion of translation and rotation, within one cycle, a clockwise vortex is generated and separated from the lower surface of the hydrofoil, and a counterclockwise vortex is generated and separated from the upper surface. The two separated vortices move downstream with the fluid. Continuous motion of the hydrofoil forms a series of alternating clockwise and counterclockwise vortices, with the counterclockwise vortex above and the clockwise vortex below. This pattern, opposite to the Karman vortex street, is known as the anti-Karman vortex street [38], as shown in Figure 10. The red vortices are positive (rotating counterclockwise), and the blue vortices are negative (rotating clockwise). The two types of vortices with opposite rotational directions accelerate the water between them forward, thereby creating a jet that propels the flow.
The structure and uniformity of the flow field can directly affect the expulsion of particles within the flow field. When the chord length of the hydrofoil changes, its motion at different frequencies can significantly impact the surrounding flow field structure and flow velocity. To visually demonstrate this influence, we compare and analyze the vorticity nephogram of 18 working conditions with three different chord lengths and different frequencies, as shown in Figure 11.
From Figure 9, it can be seen that the chord length of the hydrofoil has a significant effect on the flow field structure. When the hydrofoil begins to move, an upward-slanting vortex is generated due to the initial upward motion of the trailing edge of the hydrofoil. This leads to a varying degree of offset in the subsequently formed anti-Karman vortex street. As the chord length of the hydrofoil increases, the distance between the pivot and the trailing edge of the hydrofoil also increases. Since the rotation speed of the hydrofoil remains constant, the vortex strength generated by the trailing edge is greater, having a more significant impact on the formation of the anti-Karman vortex street, resulting in a larger degree of offset in the vortex street. When the chord length increases to a certain extent (c = 0.3 W), the vortex offset becomes excessively large and, influenced by the wall effect, cannot form an anti-Karman vortex street.
It is evident from the figures that when c = 0.1 W and 0.3 W, as the frequency decreases, the vortex strength generated by the hydrofoils of different chord lengths also decreases, but the structure of the flow field does not undergo significant changes, nor does the offset degree and sustained distance of the vortex streets change, resulting in a gradual decrease in the flow velocity without major fluctuations. However, when c is constant at 0.2 W, as the frequency gradually decreases to 0.5 Hz, the vortex pattern in the flow field changes significantly compared to conditions at other frequencies. This is because when the strength of the trailing vortex decreases to a certain point, the incoming flow velocity caused by the hydrofoil is too low, resulting in the positive and negative vortices being too close together, which accelerates the dissipation of the vortex street. It is no longer possible to form an anti-Karman vortex street. Meanwhile, the positive vortex is influenced by the wall, causing a portion of the water to flow backward, ultimately forming a “blocked” vortex pattern on one side of the hydrofoil.
To further analyze the reasons for the random offset of anti-Karman vortex street, we take the cases of c = 0.5 m, f = 0.8 Hz and c = 0.5 m, f = 1.0 Hz as examples to compare and analyze the vorticity nephogram on the surface of the hydrofoil within one motion cycle, as shown in Figure 12.
Figure 12 shows the nephogram of vorticity variation on the surface of hydrofoil with different chord lengths within one cycle. Observation of Figure 12 reveals that when the hydrofoil moves upwards, it rotates counterclockwise around the pivot axis. The upward movement of the leading and trailing edges generates a counterclockwise and a clockwise vortex on the lower surface of the hydrofoil, respectively. The leading-edge vortex moves along the surface of the hydrofoil towards the trailing edge and combines with the counterclockwise trailing-edge vortex produced on the other side of the hydrofoil as it moves downwards. Subsequently, as the hydrofoil reaches its limit position, it detaches, and the hydrofoil detaches two vortices with opposite rotation directions in sequence within one motion cycle, forming an anti-Karman vortex street. When the chord length of the hydrofoil is 0.1 W, due to the low incoming flow velocity caused by the hydrofoil’s motion, the vortex generated by the trailing edge is dispersed by the reverse motion when the hydrofoil reaches its limit position before it can fully move from the leading edge to the trailing edge. This leads to unstable vorticity on the surface of the hydrofoil, causing the vortex street to randomly offset to one side.
To explore the causes and impacts of the blocked vortex pattern, we analyzed the vorticity nephograms around the hydrofoil within one cycle at c = 1.5 W and f = 1.0 Hz, as presented in Figure 13.
Based on the analysis of the vorticity nephograms for three different chord lengths at various frequencies mentioned earlier, it is observed that as the chord length increases, the degree of offset in the anti-Karman vortex street also becomes greater. When c = 0.3 W, the positive vortices, which are the counterclockwise rotating vortices within the anti-Karman vortex street, come into contact with the wall surface during their movement. While a portion of the fluid continues to move downstream, a larger portion of the fluid forms a recirculation zone on one side of the hydrofoil due to the counterclockwise rotation, resulting in a “blocked” vortex pattern, as shown by the streamlines in Figure 13. Therefore, it can be understood that the formation of the blocked vortex pattern is due to the combined effect of the offset anti-Karman vortex street and the wall effect. When the hydrofoil moves upwards, clockwise circulation is generated around the hydrofoil, as shown at t = 86T/100 in Figure 13, which enhances the production of clockwise trailing edge vortices. However, when the hydrofoil moves upwards, the recirculation zone above the hydrofoil impedes the formation of this circulation, as shown at t = 36T/100 in Figure 13, thereby suppressing the production of counterclockwise trailing edge vortices. This means that when a recirculation zone is present, the vortex strength of the counterclockwise vortices in the anti-Karman vortex street produced by the hydrofoil is less than that of the clockwise vortices, further leading to an offset in the vortex street.
According to the flow field uniformity coefficient calculated by Equation (6) as shown in Table 1, it can reflect the uniformity of the flow field within the aquaculture raceway to a certain extent. As can be seen from Table 1, as the chord length increases, the uniformity of the flow field in the aquaculture raceway decreases. When the chord length is 0.1 W, the flow field has better uniformity, with the maximum flow field uniformity coefficient being 0.458. Increasing the chord length to 0.2 W results in a decline in flow field uniformity due to the presence of recirculation zones, with the maximum flow field uniformity coefficient being 0.214, which is a 53.3% decrease compared to 0.1 W. Further increasing the chord length to 0.3 W, the occurrence of blocked vortex patterns and further offset of the vortex streets leads to an increase in the area of recirculation zones, resulting in a further decrease in flow field uniformity, with the maximum flow field uniformity coefficient being only 0.081. It is noteworthy that when c = 0.2 W and f = 0.5 Hz, the flow field uniformity coefficient is the lowest at only 0.001. The reason for this situation is that the decrease in frequency leads to a decrease in average velocity in low-velocity areas, while the production of “blocked” vortex patterns causes high-velocity areas to be more concentrated in the upper half of the flow domain, making the minimum and maximum velocities at the outlet of the flow domain more extreme.

4.1.2. The Impact of Chord Length on Flow Field Structure

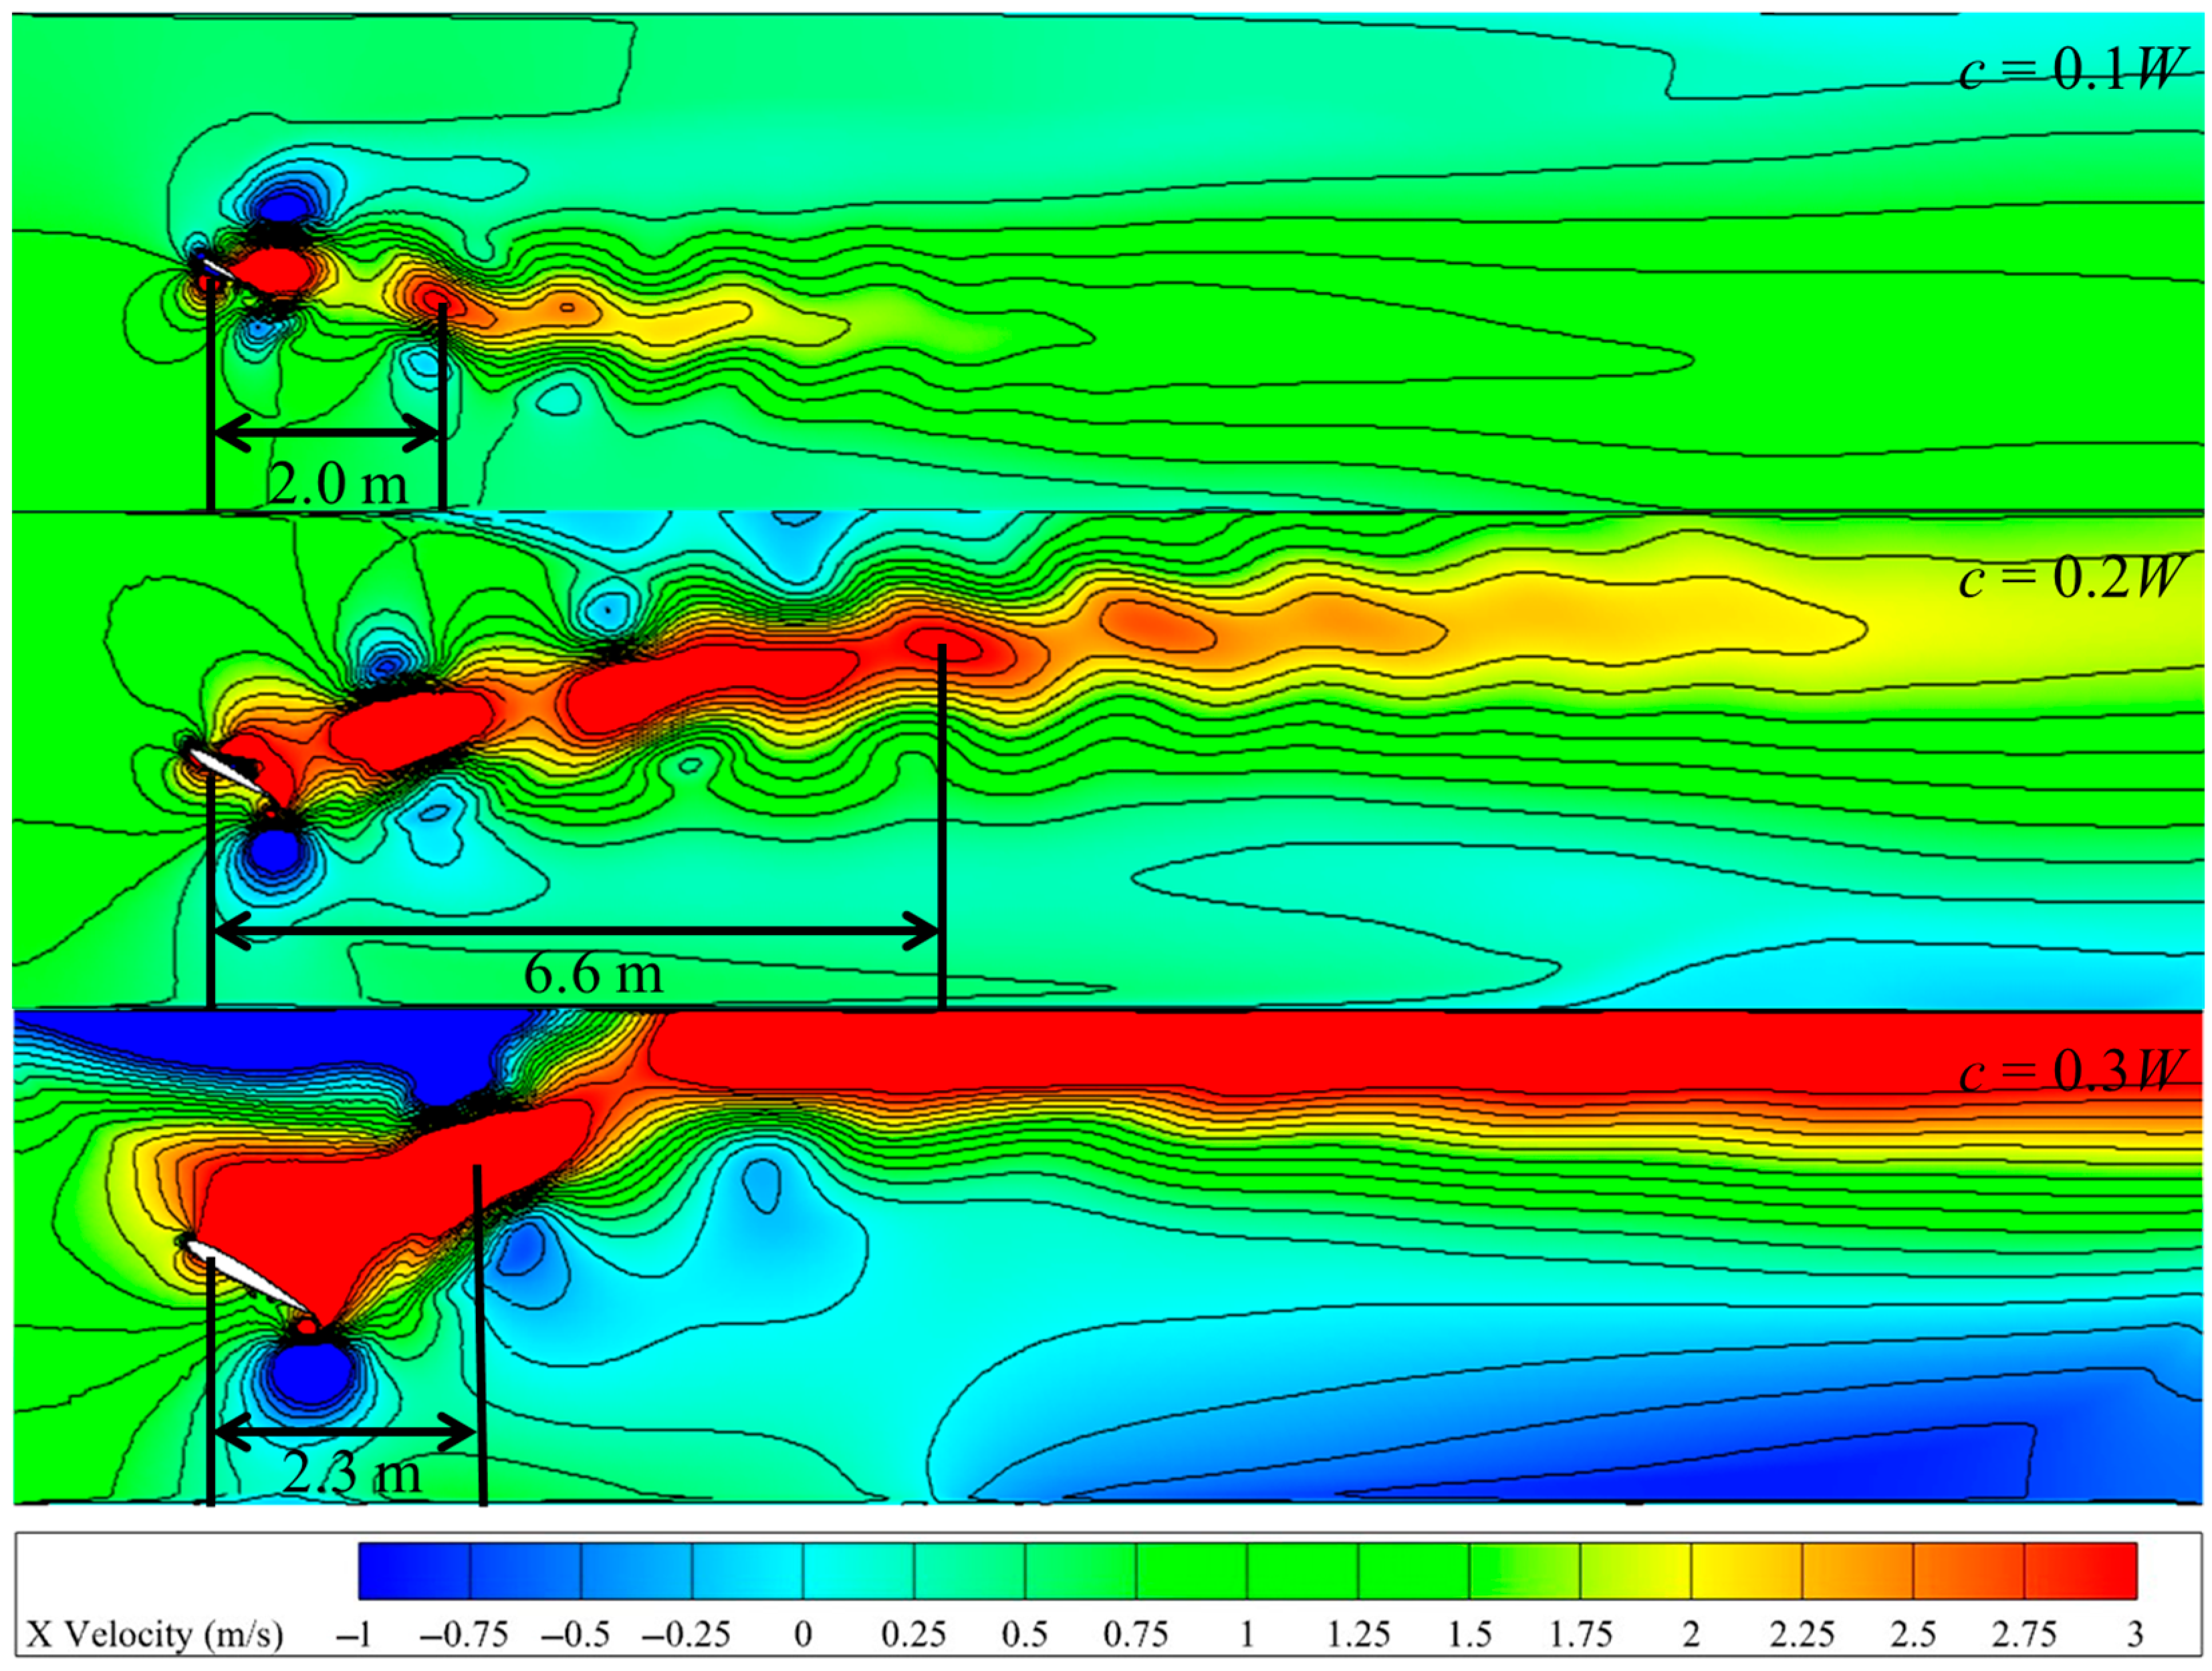
According to the analysis in Section 4.1.1, increasing the frequency can enhance the vortex strength on the surface of the hydrofoil, making the structure of the flow field more distinct. To facilitate the analysis of the impact of chord length on the flow field structure, we select the velocity nephogram of raceways with different chord lengths at a frequency of f = 1 Hz for comparative analysis, as shown in Figure 14.
Upon observing Figure 14, it is noted that the water accelerated by the anti-Karman vortex Street moves rapidly, exhibiting a jet-like state, and tends to stabilize in the latter half of the flow field. When the chord length is 0.3 W, the velocity distribution in the flow field is extremely non-uniform, with a large area of recirculation occurring, and the regions of high velocity are concentrated on one side wall of the raceway, peaking at over 3 m/s. Additionally, it is worth noting that the trailing vortex with a chord length of 0.2 W persists longer in the flow field compared to the other two chord lengths, extending for 6.6 m, and its flow velocity is also faster. and due to the lower flow velocity, the distance between the positive and negative vortices is closer, thereby causing the vortices to dissipate more quickly, whereas an excessively long chord length results in a large offset of the vortex street, and the shed wake vortices are significantly disturbed by wall shear forces, accelerating the dissipation of the vortices.
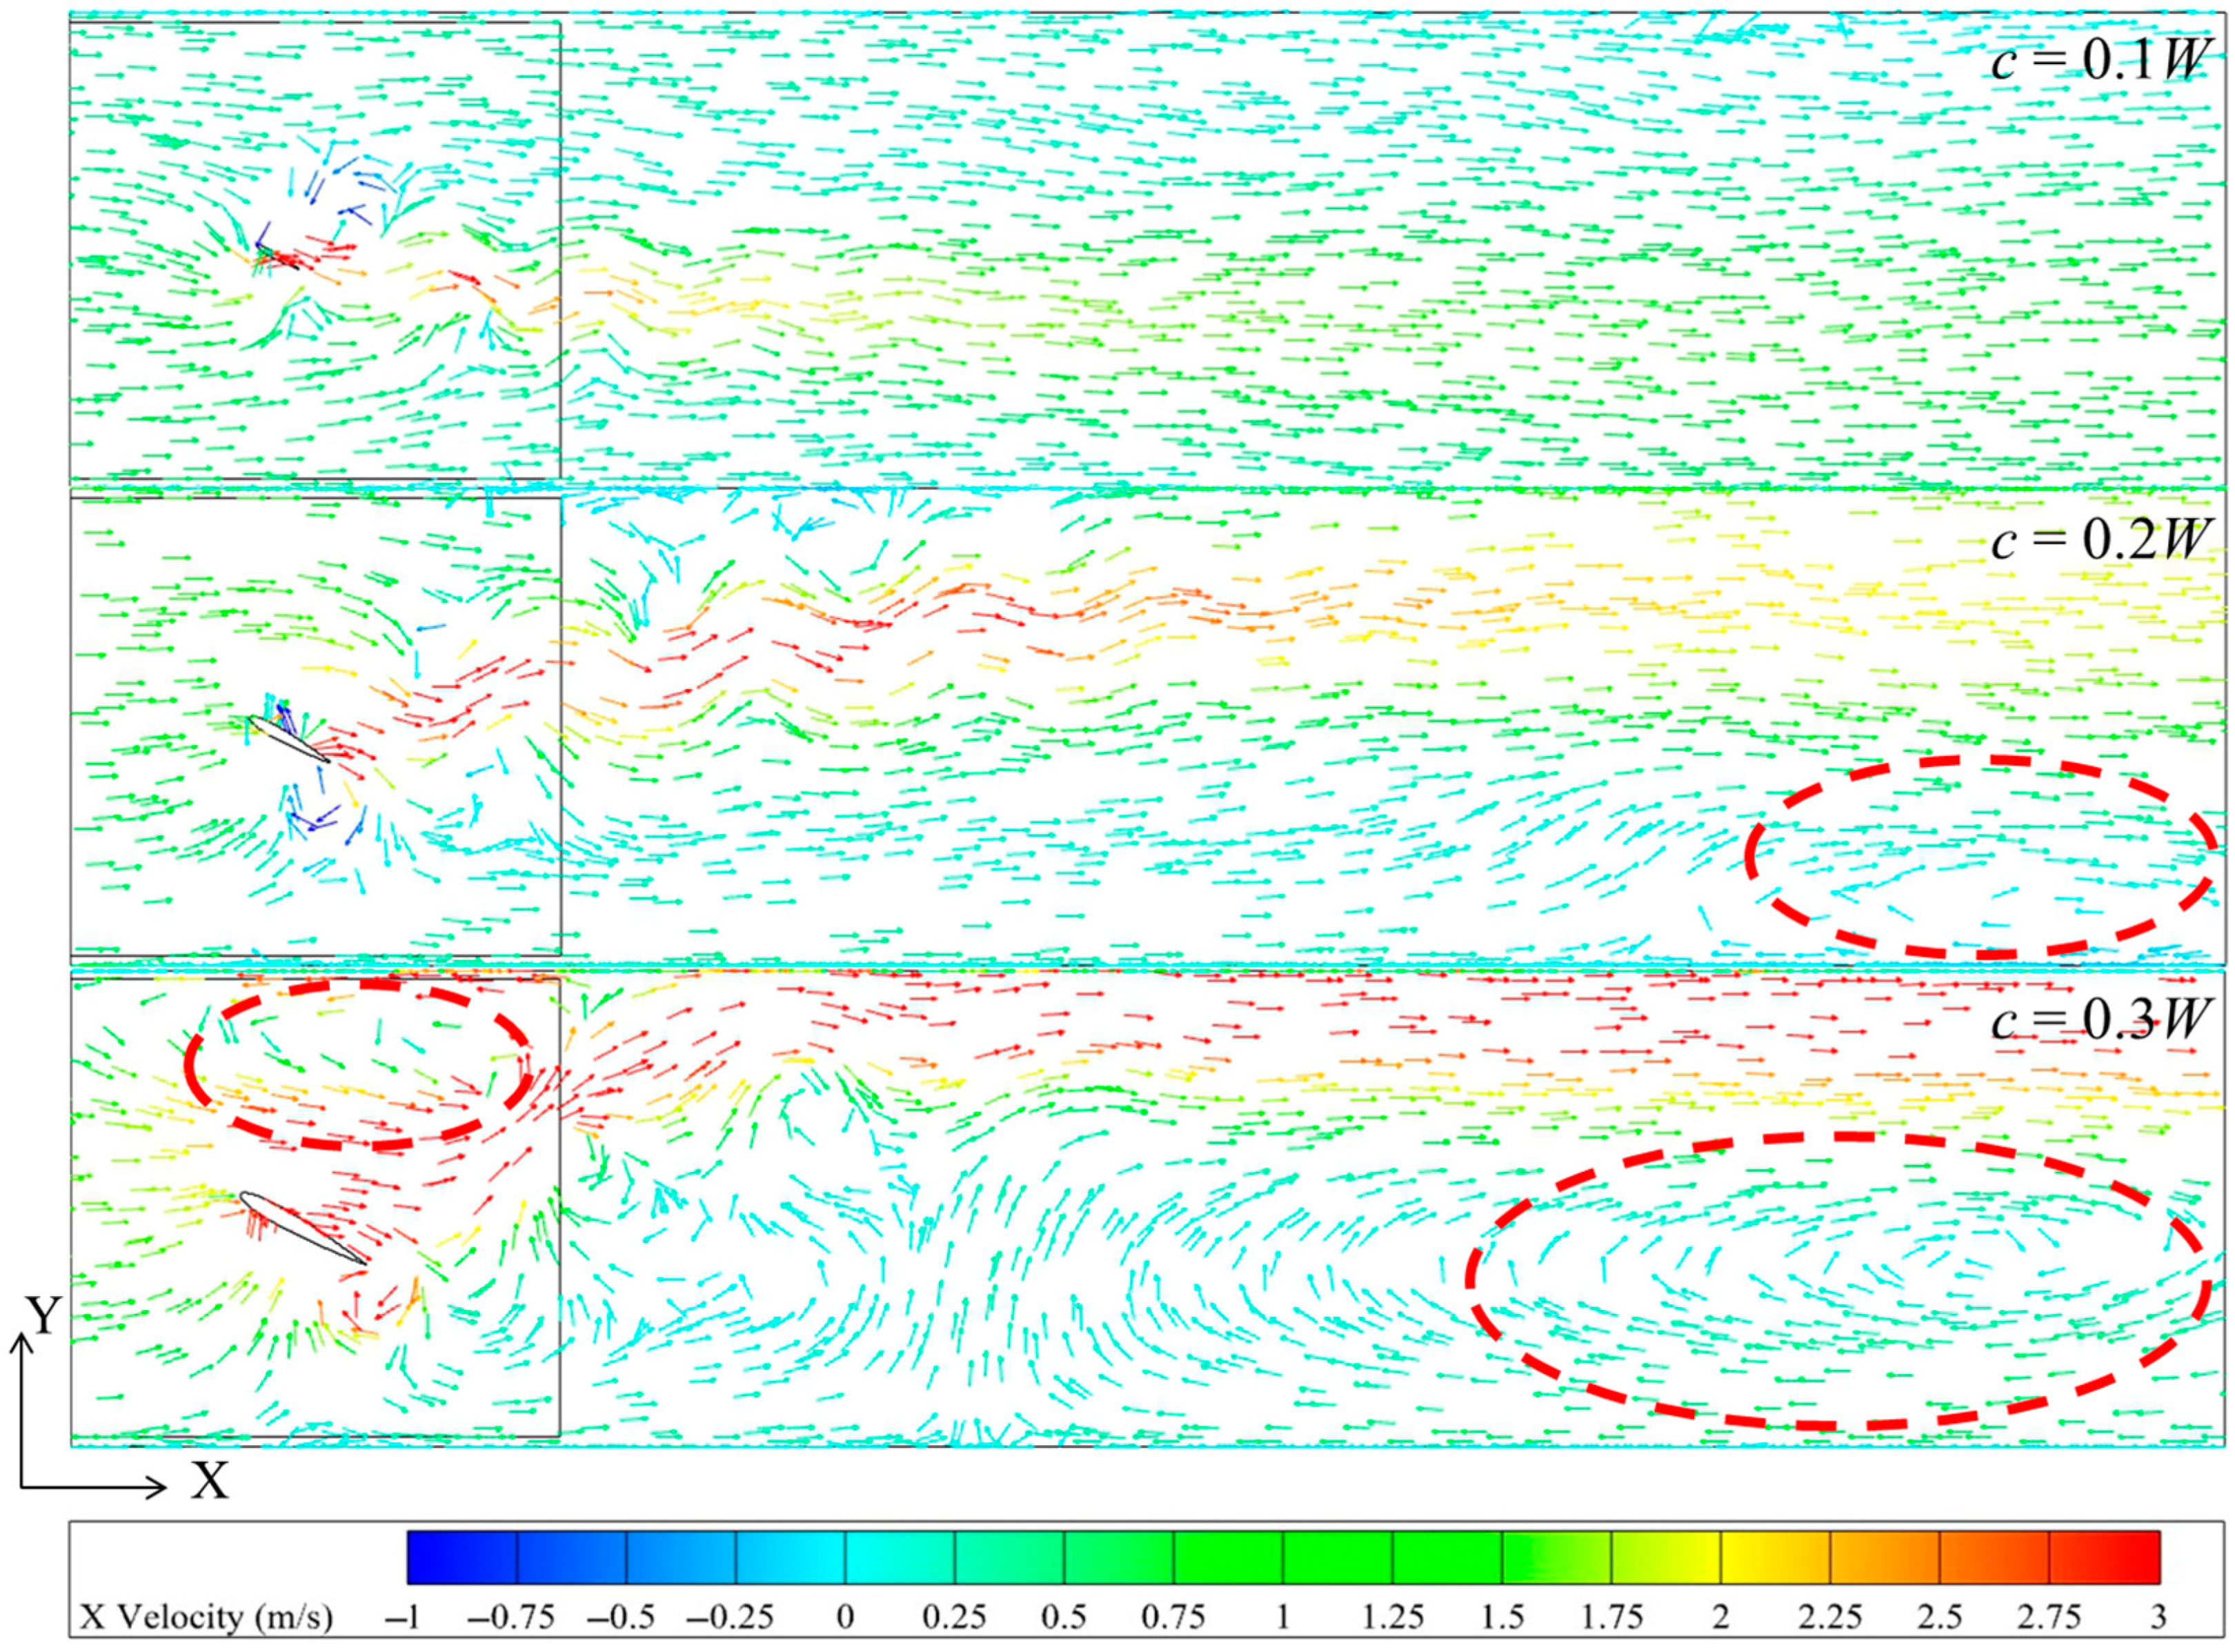
The velocity vector diagrams of the aquaculture raceway under different chord lengths are shown in Figure 15. When the chord length is small (c = 0.1 W), the uniformity of the flow field is better, and there are no obvious recirculation zones within the flow field. However, the flow velocity in the region where the anti-Karman vortex street occurs is significantly higher than in other areas. As the chord length increases (c = 0.2 W), the flow field begins to exhibit distinct high, medium, and low velocity regions, accompanied by the formation of larger recirculation areas at the outlet region, as shown by the red circle in the figure. The primary cause of these recirculation zones is the negative vortices generating a reverse thrust while dissipating, which drives the low-velocity area at the outlet backward, contacting the forward flow of the flow field and creating a recirculation zone. As the chord length continues to increase, the range of the low-velocity area at the outlet gradually expands, consequently enlarging the size of the recirculation zone. Concurrently, it is observed that the velocity of the recirculation zone has a significant relationship with the strength of the negative vortices; the greater the vortex strength, the higher the velocity of the formed recirculation zone, rendering the flow field behavior more “extreme”.

4.2. Effect of Chord Length and Frequency on Particulate Discharge Performance

4.2.1. Distribution Characteristics of Floating Particles in Raceway Aquaculture Driven by Hydrofoil Device

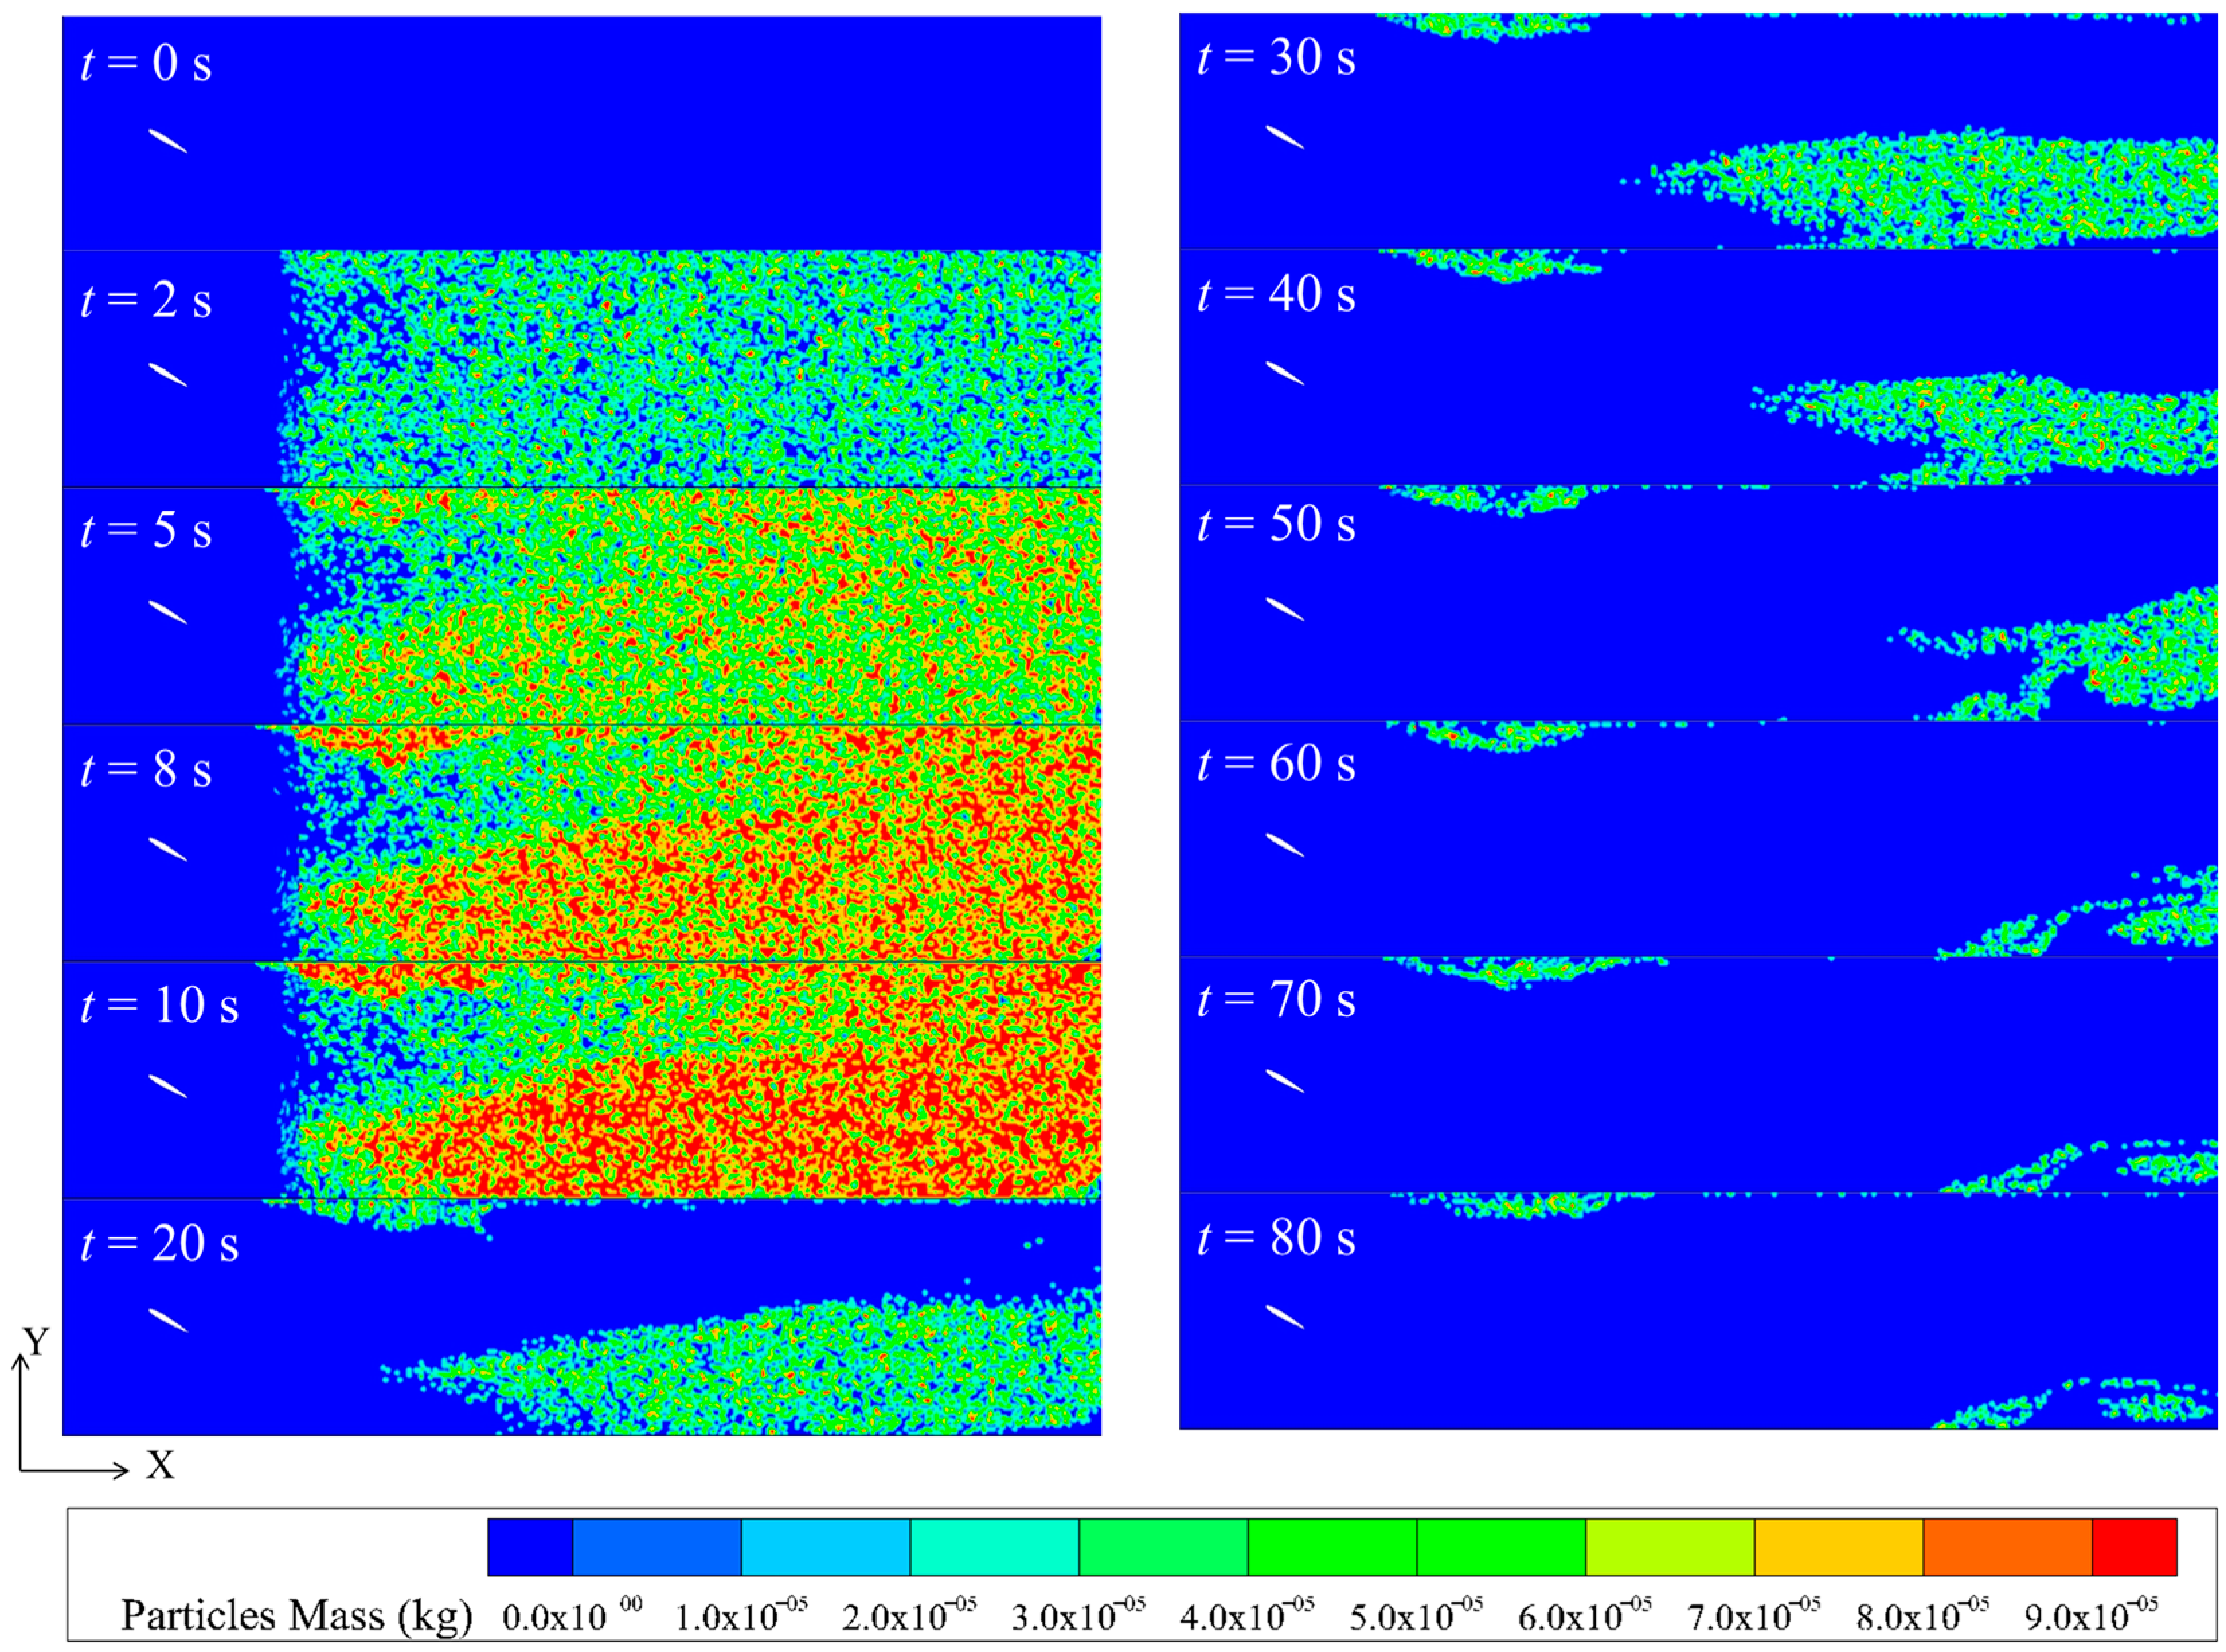
To investigate the distribution characteristics of floating particles driven by a hydrofoil device, we take the working condition with a chord length of 0.2 W and a frequency of 1 Hz as an example to analyze the time-varying movement of floating particles in the aquaculture raceway from 0 s to 80 s, as shown in Figure 16.
In order to better simulate the dynamic excretion process of fish, we continuously released a total of 0.36 kg of particles within 0 s–10 s. During 0 s–10 s, the mass of particles in the flow field continued to increase, reaching a maximum at 10 s. In addition, we can observe from the diagram that the distribution of particles over time is not symmetrical. Combined with the flow velocity nephogram mentioned earlier, it can be seen that an offset anti-Karman vortex street forms a high-velocity jet on one side of the flow field. This portion of the jet, due to its high velocity, discharges the particles within the runway first. During the initial phase of particle discharge (0 s–20 s), particles at the front part of the raceway are gradually gathered in the latter half of the raceway. At the same time, due to the dissipation caused by the collision between the vortex street and the wall surface, the moving rate of particles at the edge of the raceway wall is significantly slower than those in the middle of the raceway. Meanwhile, as the anti-Karman vortex street dissipates, it generates a certain thrust, causing particles in the high-velocity area to be quickly discharged from the raceway. The number of particles in this area is significantly less than in other areas, showing a significant effect on particle discharge. During the mid-phase of particle discharge (30 s–60 s), affected by the flow velocity of the flow field, the rate of particle discharge gradually slows down. However, noticeable vortices are observed near the outlet, and although the formation of these vortices intensifies the gathering of particles and accelerates the rate of particle discharge, they also create recirculation zones affecting the final particle discharge rate. In the later phase of particle discharge (60 s–80 s), most particles have already been discharged from the raceway, and a small number of particles gather in the recirculation zones at the outlet and upper wall, forming a dead zone for particle discharge.

4.2.2. Effect of Frequency and Chord Length on Particle Discharge Rate

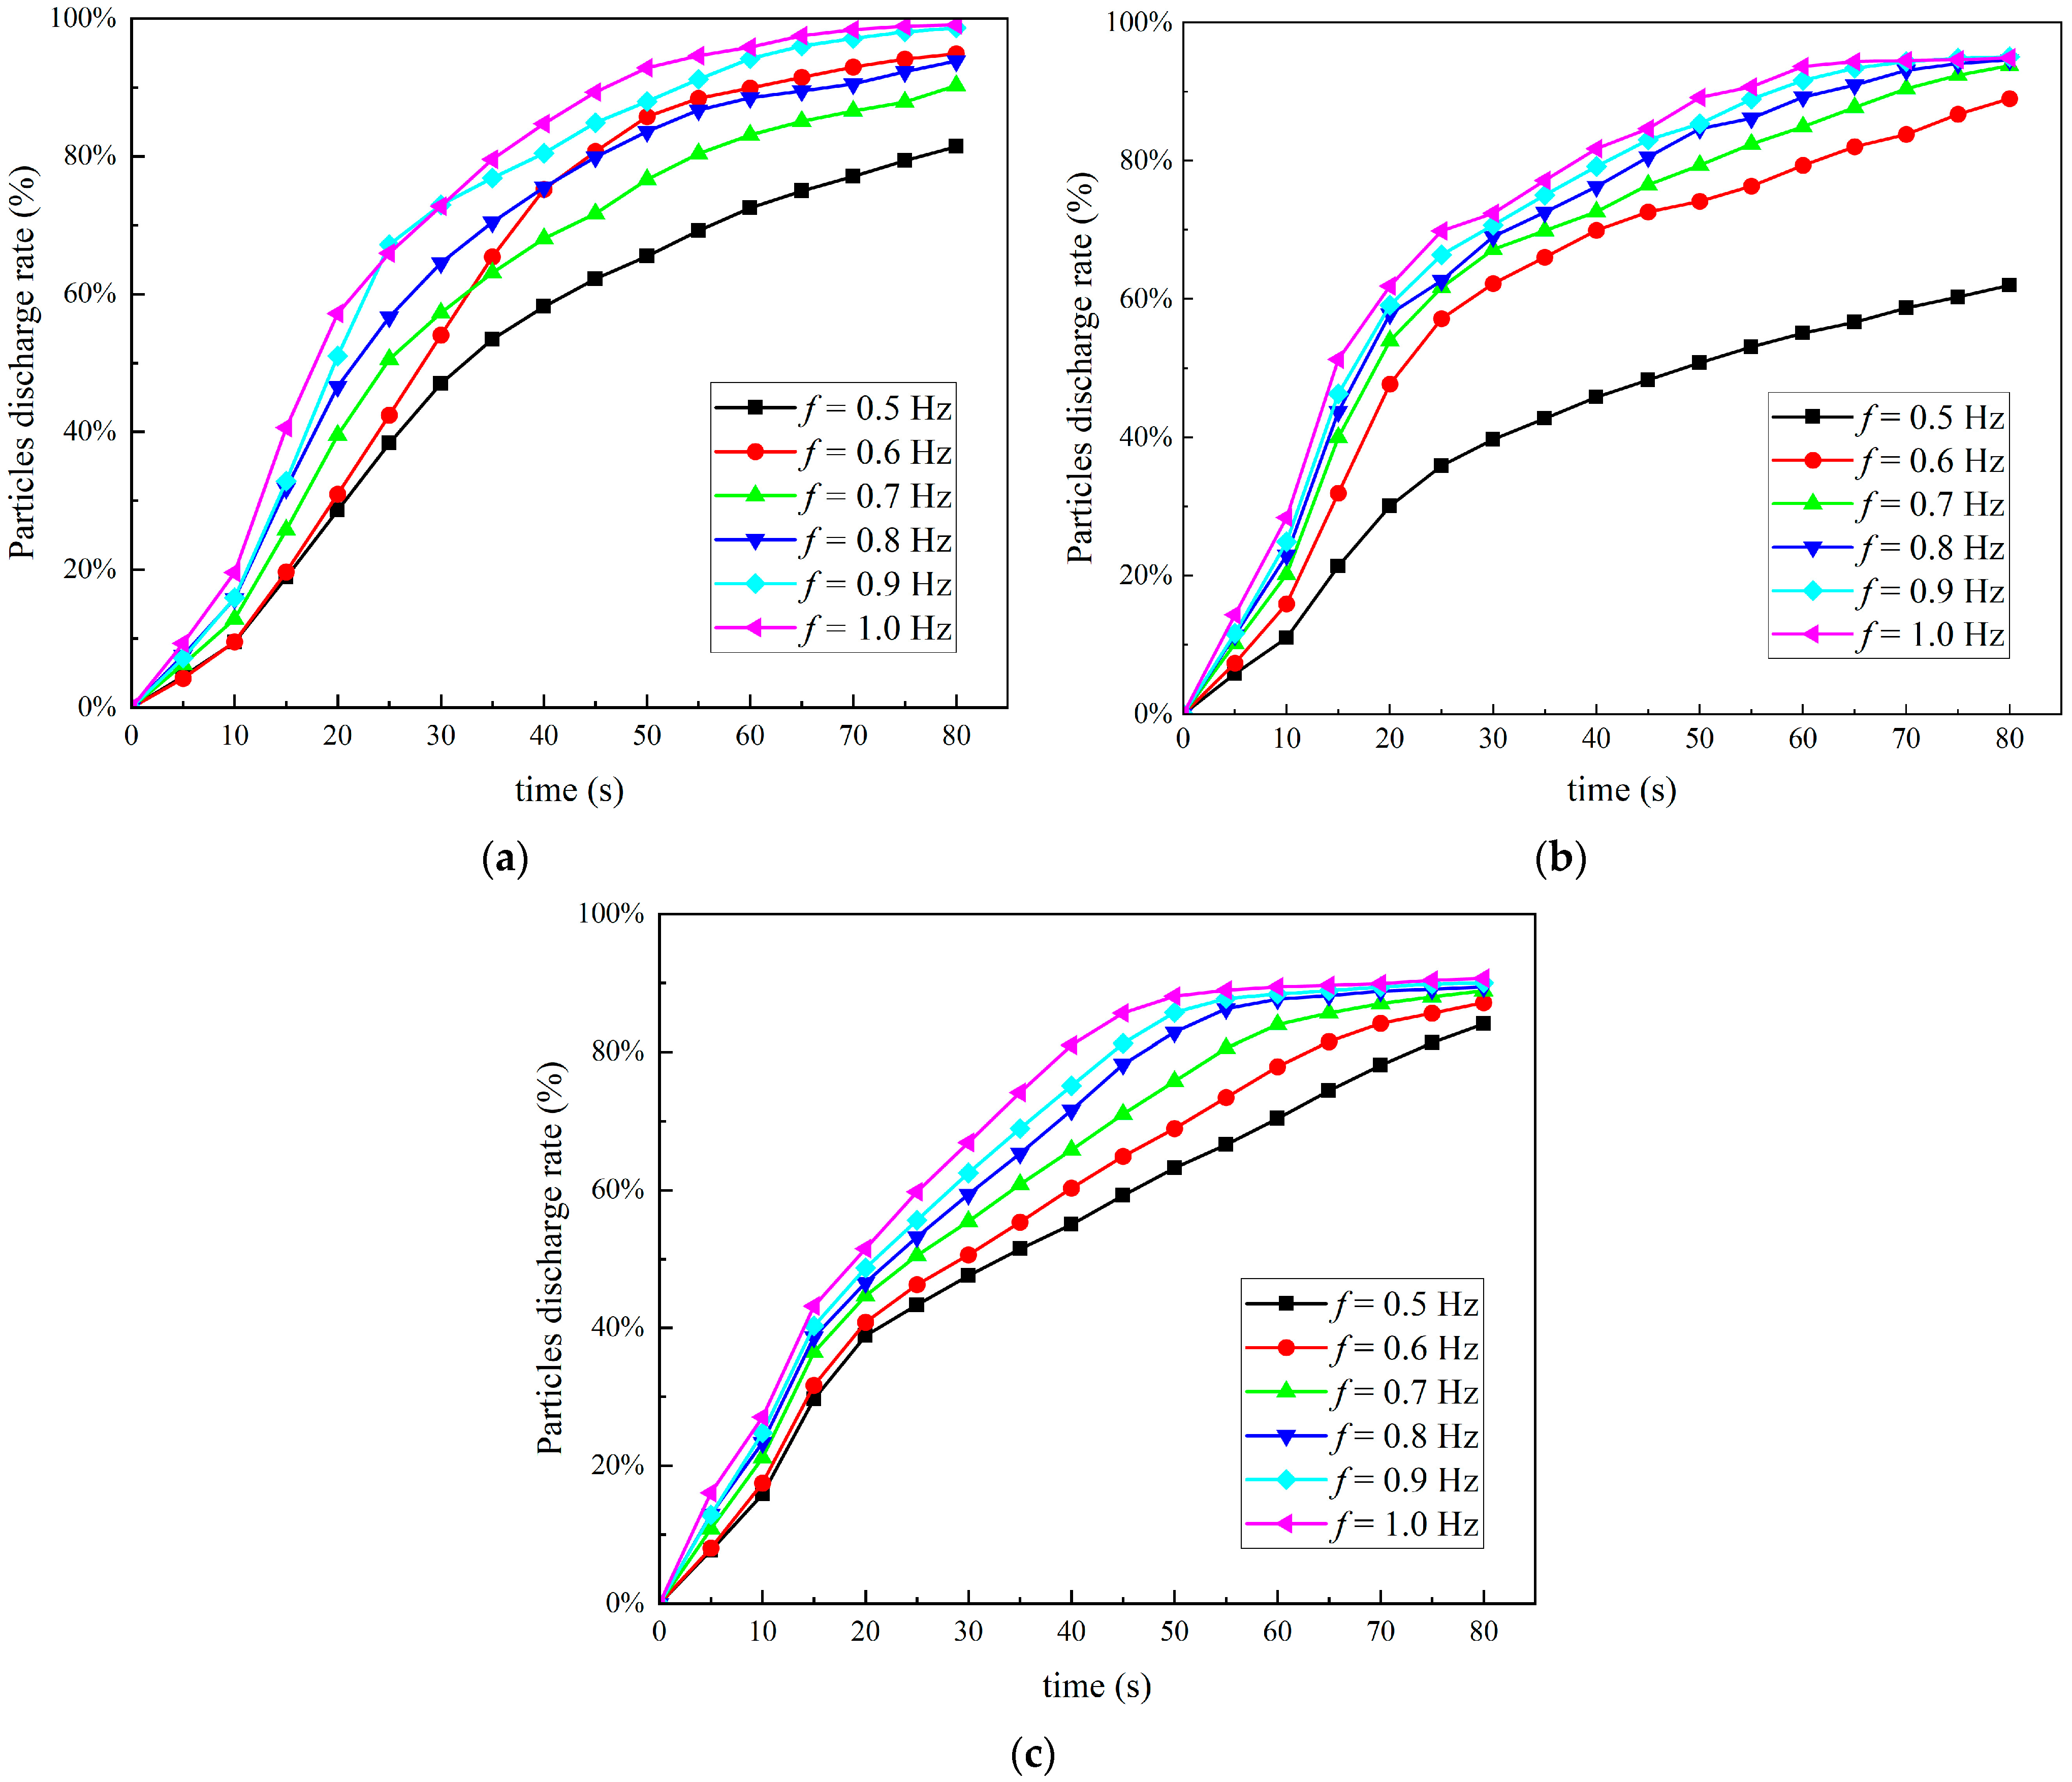
The rates of waste discharge for floating particles exhibit temporal variations under different chord lengths and frequencies, as shown in Figure 17.
It can be observed from Figure 17 that the chord length and motion frequency of the hydrofoil device have varying degrees of impact on the particle discharge rate in the aquaculture raceway. Initially, when the chord length is equal to 0.1 W, 0.2 W, and 0.3 W, increasing the frequency can enhance both the discharge rate and the final particle discharge rate in the aquaculture raceway. When c = 0.1 W and f = 1.0 Hz, the maximum final particle discharge rate of 99.09% is achieved after 80 s. However, under the working condition of c = 0.2 W and f = 0.5 Hz, the final particle discharge rate is significantly lower compared to other conditions, with the lowest final particle discharge rate of only 61.97% after 80 s. This situation arises due to the presence of a “blocked” vortex pattern within the flow field, which greatly diminishes the uniformity of the flow field, resulting in a decrease in the final particle discharge rate.
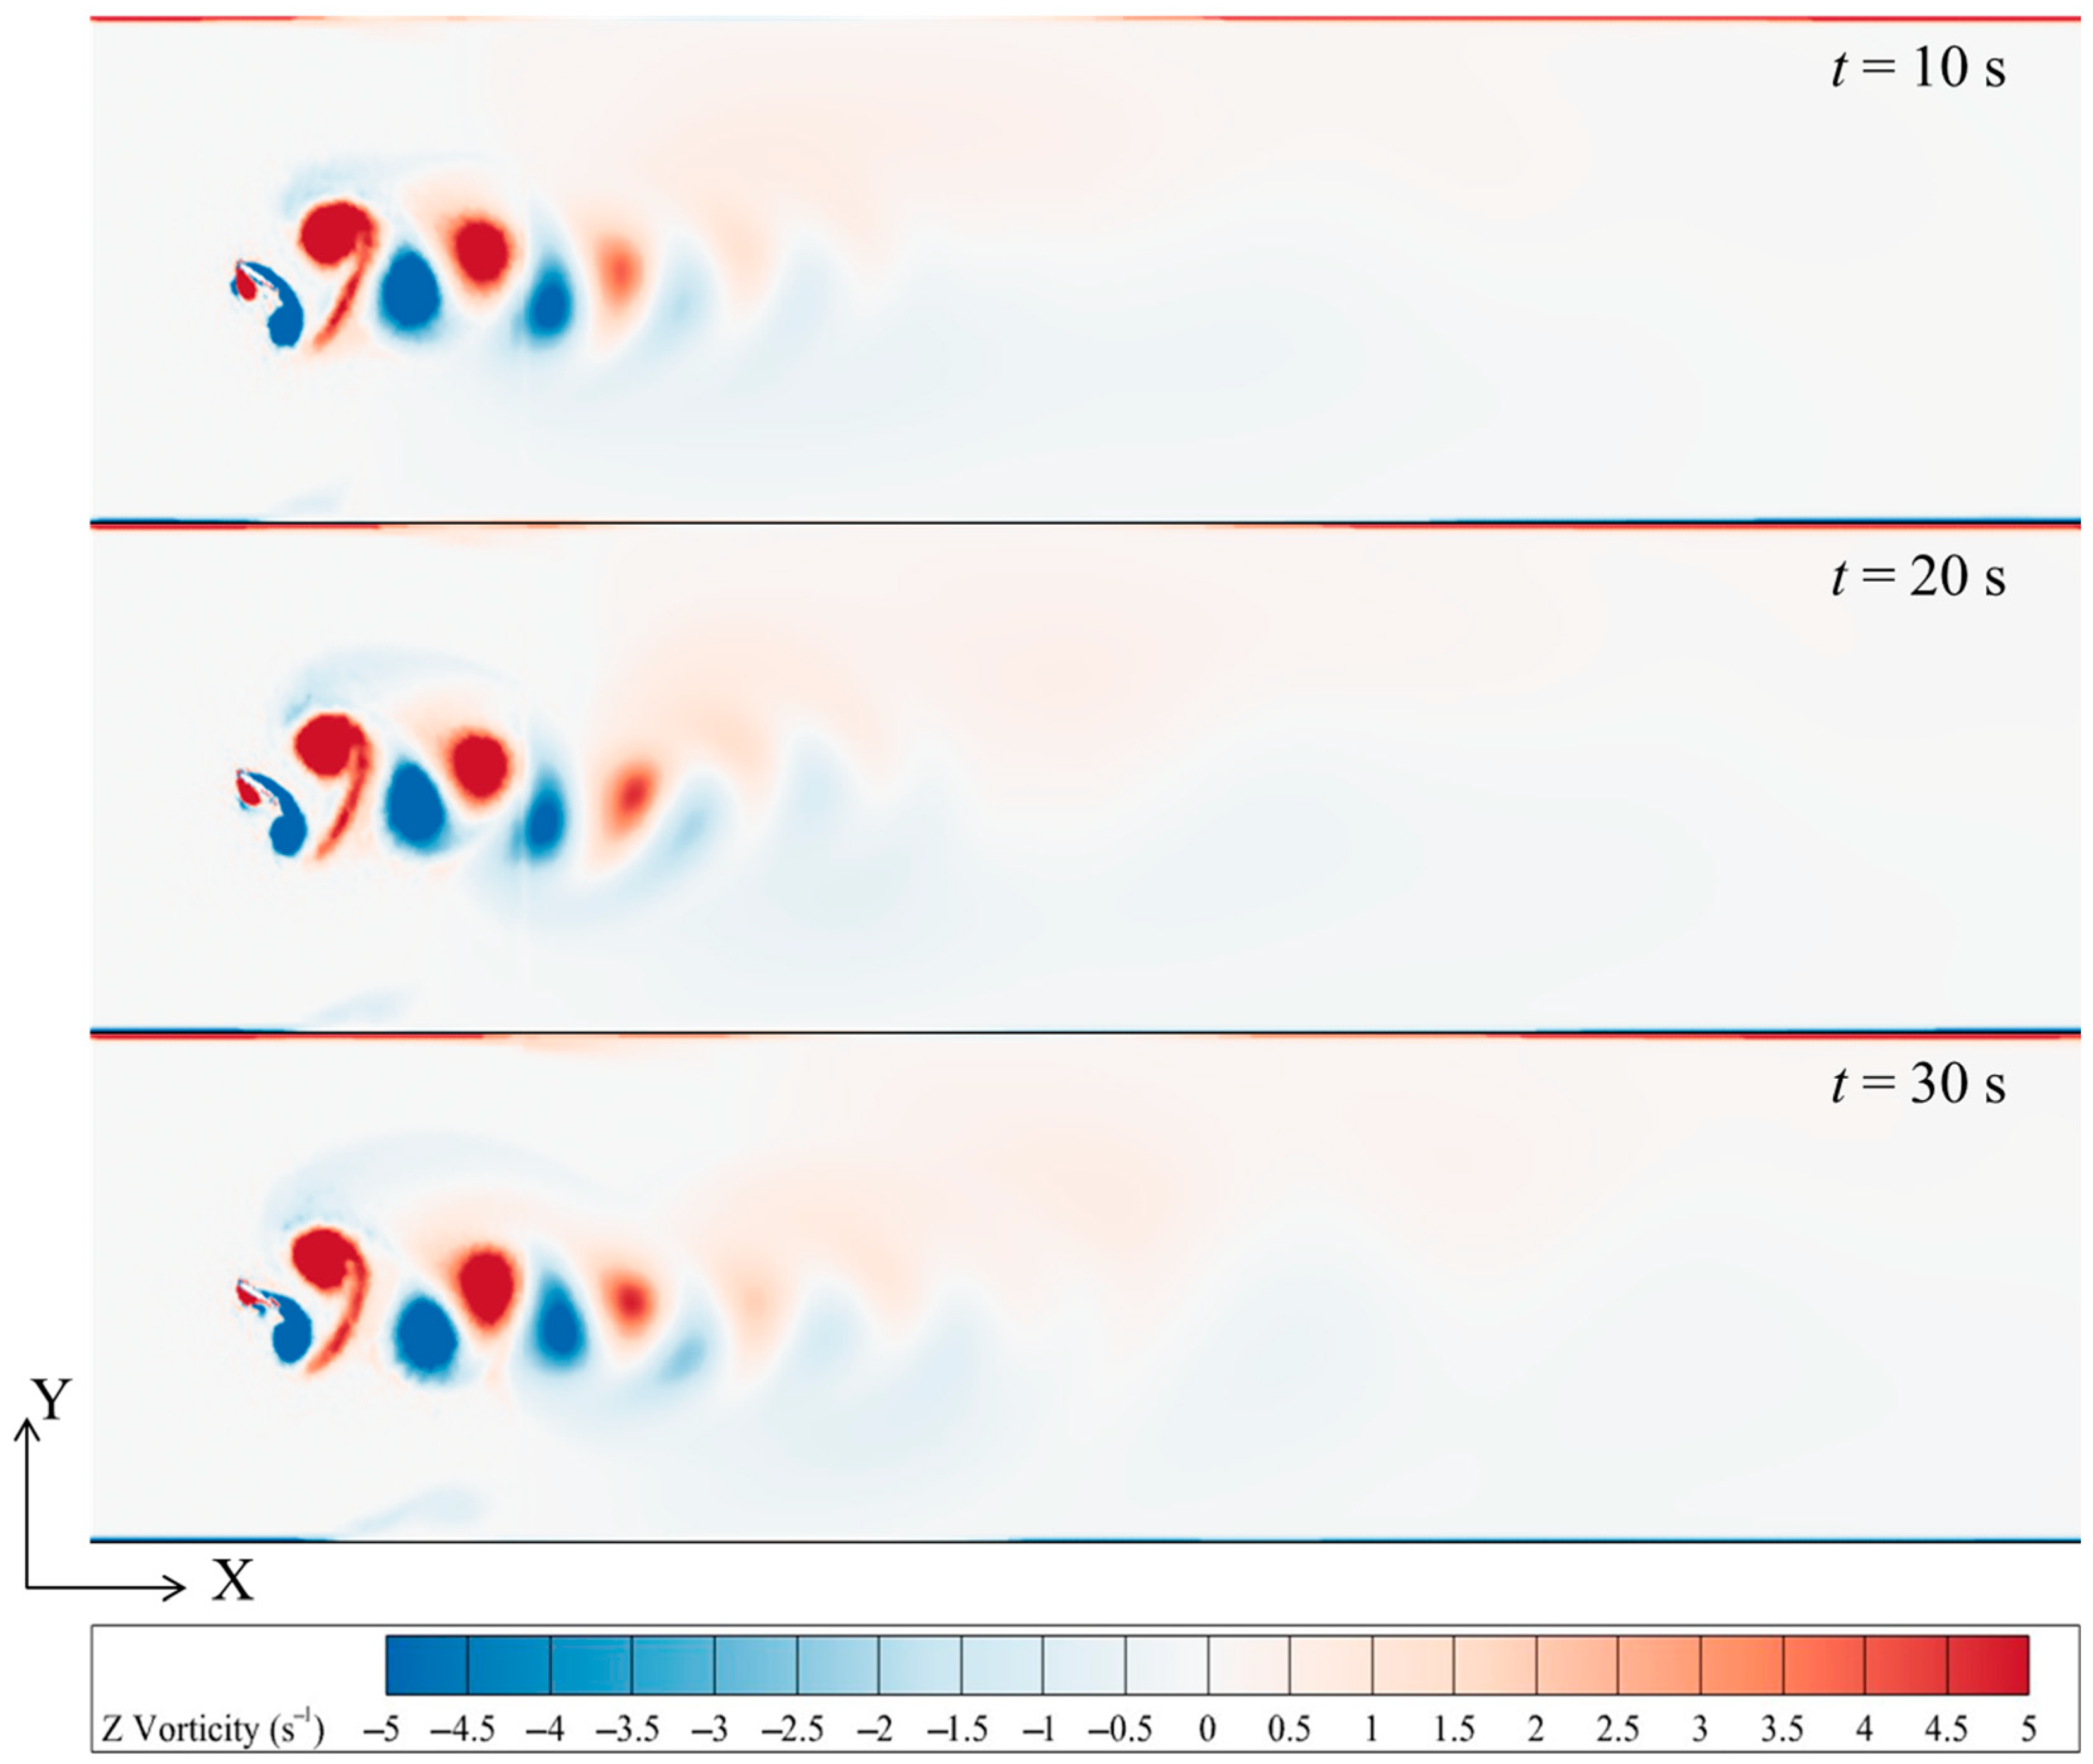
Additionally, it is noteworthy that when c = 0.1 W, the particle discharge rate of f = 0.6 Hz exceeded that for f = 0.7 Hz after 30 s and surpassed f = 0.8 Hz after 40 s, achieving a final particle discharge rate of 94.88% at 80 s, which is higher than the 90.28% for 0.7 Hz and 93.84% for 0.8 Hz. To further analyze the reasons for this situation, we selected the vorticity nephogram from 10 s to 30 s for analysis, as shown in Figure 18.
Comparing with Figure 18, it is found that the reason for this situation is that under the working condition of c = 0.1 W, f = 0.6 Hz, the anti-Karman vortex street produced during its motion starts with an upward offset and gradually shifts downwards. The random upward or downward shifts accelerated the discharge of particulate matter in the medium-velocity region, enhancing its final particle discharge rate and surpassing those at 0.7 Hz and 0.8 Hz. This shows that even though a smaller chord length can reduce the fluidity of the raceway flow field, the instability of the leading-edge vortices produced by the small chord hydrofoil causes the anti-Karman vortex street to shift randomly, which can improve the pollutant removal rate of the raceway.
Table 2 lists the statistics of the average outlet velocity under various working conditions. From the data in the table, it can be seen that as the chord length increases, the average outlet velocity first increases and then decreases. When the chord length is 0.2 W, the average outlet velocity is significantly higher than when it is 0.1 W and 0.3 W, with the highest average outlet velocity reaching 1.042 m/s, indicating the best hydrodynamic performance. The main reason for this phenomenon is that increasing the chord length can enhance the strength of vortices in the flow field, extend the sustained distance of the anti-Karman vortex street, and simultaneously increasing the flow velocity can enlarge the distance between positive and negative vortices, slowing down the dissipation of vortices. When the chord length increases to 0.3 W, the structure of the flow field changes significantly, and the anti-Karman vortex street cannot be effectively generated, resulting in a decrease in the average outlet velocity. Similarly, when the frequency is 0.5 Hz and the chord length is 0.2 W, the appearance of a “blocked” vortex pattern in the flow field leads to the lowest average outlet velocity, only 0.338 m/s. At the same time, under different chord length conditions, increasing the motion frequency of the hydrofoil can increase the average outlet velocity of the aquaculture raceway, with an average increase of 19.42% in the outlet average velocity for every 0.1 Hz increase in motion frequency.
Combining Table 2 with a comparison of the final particle discharge rate and discharge rate under different chord lengths, it can be observed that the flow performance of the flow field has a significant impact on the discharge rate. When the chord length is 0.2 W and the frequency is 1 Hz, the average outlet velocity is the highest, resulting in the highest discharge rate. At the same time, by comparing Figure 15, it can be seen that the particle discharge performance of the aquaculture raceway is related to the characteristics of the flow field. When the chord length is 0.1 W, the uniformity of the flow field is good, and the final particle discharge rate after 80 s is the highest. Increasing the chord length to 0.2 W leads to the appearance of recirculation zones in the flow field, causing the final particle discharge rate in the raceway to decrease to 95.01%. Further increasing the chord length to 0.3 W results in an enlargement of the recirculation zones, causing the final particle discharge rate to drop to 90.67%.
Based on the above analysis, the chord length and frequency of the hydrofoil device have a significant impact on the particle discharge performance of the aquaculture raceway. The higher the motion frequency of the hydrofoils, the faster the particle discharge rate and the higher the final particle discharge rate. Although increasing the chord length of the hydrofoils can significantly improve the flow performance of the flow field, it will reduce the final particle discharge rate of the aquaculture raceway. Therefore, in order to balance the particle discharge performance and flow performance of the Aquaculture raceway, it is recommended to use a hydrofoil chord length of 0.1 W and a motion frequency of 1 Hz.

5. Conclusions

We take raceway aquaculture as an example and systematically compare and analyze the flow field characteristics and particle discharge performance of hydrofoil devices with different chord lengths and frequencies by two-dimensional numerical simulation. It provides a theoretical basis and practical guidance for using hydrofoil devices to improve the efficiency of floating particulate waste treatment in raceway aquaculture environments. The conclusions are as follows:
  • In the floating particle discharge of raceway aquaculture, when the chord length and motion frequency of the oscillating hydrofoil device are 0.1 W and 1.0 Hz, respectively, the anti-Karman vortex street generated by the hydrofoil device is less affected by the wall, the uniformity of the flow field is higher, and the final floating particle discharge rate reaches 99.09%.
  • Changing the chord length of the hydrofoils can effectively improve the recirculation problems in the flow field, and enhance the uniformity and flow performance of the flow field, with the best uniformity at a chord length of 0.1 W; and superior flow performance at a chord length of 0.2 W.
  • The frequency has less impact on the structure of the flow field, but increasing the frequency can improve the flow performance of the flow field. On average, every 0.1 Hz increase in motion frequency can improve the outlet average velocity by 19.42%, with the highest outlet average velocity of 1.042 m/s at chord length c = 0.2 W and frequency f = 1 Hz.
In consideration of the fact that fish fins and tails exhibit three-dimensional structures in nature, analyses based on two-dimensional models may have certain discrepancies. However, 2D simulations still provide valuable insights. Wu et al. [39] compared 2D simulations, 3D simulations, and experimental results, finding consistent trends in calculating lift and other parameters during flapping motion, especially during the upward pitch phase, but discrepancies still existed between these two types of simulations and experimental data during the dynamic stall phase. Ozdemir et al. [40] compared 3D flapping wing simulation results with different span-to-chord ratios to 2D simulation results, discovering that the larger the span-to-chord ratio, the closer the lift results of the two, especially when the span-to-chord ratio exceeded 8; the results were very close but not entirely consistent. Green et al. [41] analyzed the three-dimensional flow structure of a tail fin-type hydrofoil using PIV technology and compared it with 2D simulations, showing that the complexity of the 3D hydrofoil flow structure mainly originated from the generation of crosswise vortices and tip vortices. The aforementioned studies all indicate that under specific conditions, 2D simulations can provide results similar to 3D simulations, but there are still some differences. To better verify and explore the flow characteristics of hydrofoils, we plan to extend our research field to three dimensions in future work to study the effects of parameters such as span-to-chord ratio and trailing edge shape on the performance of hydrofoil devices, and to increase experimental research on hydrofoil devices for verification.

Author Contributions

E.H. articulated the main research directions on the Influence of Chord Length and Frequency of Hydrofoil Device on the Discharge Characteristics of Floating Matter in Raceway Aquaculture; T.W. contributed to the writing of the entire paper and data processing; M.X. provided detailed elucidations and conceptualized simulation designs, participating in model construction. C.L. was involved in model construction, simulation experiments, and validation. Y.S. offered conceptual writing ideas; Q.S. conducted a review of the manuscript. All authors have read and agreed to the published version of the manuscript.

Funding

This research was funded by the National Natural Science Foundation of China (Grant No. 51976202, 61772469) and the Zhejiang Provincial Key Research and Development Project (Grant No. 2021C03019).

Data Availability Statement

All data, models, and code generated or used during the study appear in the submitted article.

Acknowledgments

The authors gratefully thank the National Natural Science Foundation of China and Zhejiang Provincial Key Research and Development Project for their financial support.

Conflicts of Interest

The authors declare no conflicts of interest.

References

  1. Brown, T.W.; Chappell, J.A.; Boyd, C.E. A commercial-scale, in-pond raceway system for Ictalurid catfish production. Aquac. Eng. 2011, 44, 72–79. [Google Scholar] [CrossRef]
  2. Brown, T.W.; Boyd, C.E.; Chappell, J.A. Organic carbon and dissolved oxygen budgets for a commercial-size, in-pond raceway system. J. World Aquac. Soc. 2015, 46, 539–548. [Google Scholar] [CrossRef]
  3. Zhang, Z.D.; Xiao, Y.H.; Fan, Y.H.; Ma, W.J.; Zhou, F. A brief analysis of the development status of the pond engineering recirculating water aquaculture model. China Fish. 2019, 5, 34–37. [Google Scholar]
  4. Jia, L.; Pan, Y.; Liu, S. One new culture pattern of America: Running water of internal recycle in pond. China Fish. 2011, 1, 40–42. [Google Scholar] [CrossRef]
  5. Martins, C.I.M.; Eding, E.H.; Verdegem, M.C.J.; Heinsbroek, L.T.N.; Schneider, O.; Blancheton, J.P.; Roque d’Orbcastel, E.; Verreth, J.A.J. New developments in recirculating aquaculture systems in Europe: A perspective on environmental sustainability. Aquac. Eng. 2010, 43, 83–93. [Google Scholar] [CrossRef]
  6. He, Y.M.; Zhang, T.H.; Chen, W.Y.; Zhang, Z.B. Factors and countermeasures affecting the effect of tank collection and sewage discharge in the industrial ecological aquaculture system of ponds. Sci. Fish Farming 2016, 6, 2–3. [Google Scholar] [CrossRef]
  7. Gesto, M.; Gregersen, K.J.; Pedersen, L.F. Effects of ozonation and foam fractionation on rainbow trout condition and physiology in a small-scale freshwater recirculation aquaculture system. Aquaculture 2022, 557, 738312. [Google Scholar] [CrossRef]
  8. Timmons, M.B.; Ebeling, J.E. Recirculating Aquaculture, 2nd ed.; Cayuga Aqua Ventures NRAC Publication: New York, NY, USA, 2010; p. 177. [Google Scholar]
  9. Song, D.J.; Li, Z.Y.; Lu, W.; Ma, S.S.; Xue, Z.R.; Qu, K.M.; Chen, Q.S.; Wang, B.X. Study on a new type of high efficiency filter. Mar. Fish. Res. 2003, 4, 51–56. [Google Scholar] [CrossRef]
  10. An, X.L.; Zhou, Q.X. Progress in study of bioremediation for aquaculture self-polluted water bodies. Chin. J. Environ. Eng. 2006, 7, 1–6. [Google Scholar] [CrossRef]
  11. Li, W.; Cheng, X.; Xie, J.; Wang, Z.; Yu, D. Hydrodynamics of an in-pond raceway system with an aeration plug-flow device for application in aquaculture: An experimental study. R. Soc. Open Sci. 2019, 6, 182061. [Google Scholar] [CrossRef] [PubMed]
  12. Wang, X.; Cui, K.; Li, H.Y.; Jiang, Y.Y.; He, J.X.; Zhang, J. Numerical simulation of flow field characteristics for aquaculture raceway and analysis of solid phase distribution in waste settling zone. Trans. Chin. Soc. Agric. Eng. 2019, 35, 220–227. [Google Scholar] [CrossRef]
  13. Wu, Y.F.; Zhang, Q.J.; Gui, F.K.; Zhang, Z.K.; Chen, Q.L.; Feng, D.J. Waste collection performance of the octagonal aquaculture tank driven by submersible flow propellers. J. Fish. China 2024, 48, 132–144. [Google Scholar] [CrossRef]
  14. Yu, Z.Y.; Xiong, B.; Liu, W.; Jiang, B.; Gao, J.; Zhao, Q.; Yang, Y.J. Analysis of the types and adaptability of aerators. Farm Mach. 2019, 2, 97–99. [Google Scholar] [CrossRef]
  15. Wei, W.; Wei, J.W.; Wang, D.Q.; Geng, L.L. Study on the Modes of Aeration and Push Flow of Oxidation Ditch Process. Water Sci. Eng. Technol. 2011, 2, 26–29. [Google Scholar] [CrossRef]
  16. Hua, E.T.; Chen, W.Q.; Tang, S.W.; Xie, R.S.; Guo, X.M.; Xu, G.H. Water Pushing Flow Characteristics of Flapping Hydrofoil Device in Small River. Trans. Chin. Soc. Agric. Mach. 2022, 53, 154–162. [Google Scholar] [CrossRef]
  17. He, G.Y.; Zhang, X.; Zhang, S.G. Numerical studies on flows around a flexiblly wiggling hydrofio. Chin. J. Theor. Appl. 2010, 42, 15–22. [Google Scholar]
  18. Ding, H.; Song, B.W.; Tian, W.L. Exploring Propulsion Performance Analysis of Bionic Flapping Hydrofoil. J. Northwestern Polytech. Univ. 2013, 31, 150–156. [Google Scholar] [CrossRef]
  19. Zhang, Y.; Yang, F.; Wang, D.; Jiang, X. Numerical investigation of a new three-degree-of-freedom motion trajectory on propulsion performance of flapping foils for UUVs. Ocean Eng. 2021, 224, 108763. [Google Scholar] [CrossRef]
  20. Cao, Y.H.; Chao, L.M.; Ding, H.; Zhao, H.Y. Propulsive Performance of Complex Flapping Foils. J. Shanghai Jiaotong Univ. 2016, 50, 1228–1232. [Google Scholar] [CrossRef]
  21. Hua, E.T.; Luo, H.T.; Xie, R.S.; Chen, W.Q.; Tang, S.W.; Su, Z.X. Design and Test of Flapping Hydrofoil Bionic Water Pumping Device. Trans. Chin. Soc. Agric. Mach. 2023, 54, 155–162. [Google Scholar] [CrossRef]
  22. Hua, E.T. Investigation of the Effect of Pumping Depth and Frequency of Flapping Hydrofoil on Suspended Matter Discharge Characteristics. Machines 2024, 12, 300. [Google Scholar] [CrossRef]
  23. Jin, W.; Luo, R.B.; Gu, R.B.; Xu, P. A review about pond engineering aquacultural systems. Fish. Mod. 2015, 42, 32–37. [Google Scholar] [CrossRef]
  24. Xie, O.; Zhu, Q.X.; Jiang, Q.S.; Shen, Y.H. Study on wall effect of near wall swimming of biomimetic robot fish. J. Huazhong Univ. Sci. Technol. (Nat. Sci. Ed.) 2018, 46, 59–63. [Google Scholar] [CrossRef]
  25. Li, Y.C.; Wang, J.; Chen, J.J. Numerical Investigation of Pitching Foil’s Propulsive Performance with Wall Effect. Nav. Archit. Ocean Eng. 2020, 36, 26–31. [Google Scholar] [CrossRef]
  26. Techet A, H. Propulsive performance of biologically inspired flapping foils at high Reynolds numbers. J. Exp. Biol. 2008, 211, 274–279. [Google Scholar] [CrossRef] [PubMed]
  27. Hua, E.T.; Su, Z.X.; Xie, R.S.; Chen, W.Q.; Tang, S.W.; Luo, H.T. Optimization and experimental verification of pivot position of flapping hydrofoil. J. Hydroelectr. Eng. 2023, 42, 128–138. [Google Scholar] [CrossRef]
  28. Zhou, Y.X.; Liu, H.B.; Hu, W.; Ren, X.Z.; Li, M. A Review: Application and Prospect of Fish Rheotaxis in a Recirculating Aquaculture System. Fish. Sci. 2024, 43, 1–15. [Google Scholar] [CrossRef]
  29. Venegas, P.A.; Narváez, A.L.; Arriagada, A.E.; Llancaleo, K.A. Hydrodynamic effects of use of eductors (Jet-Mixing Eductor) for water inlet on circular tank fish culture. Aquac. Eng. 2014, 59, 13–22. [Google Scholar] [CrossRef]
  30. Menter, F.R. Two-equation eddy-viscosity turbulence models for engineering applications. AIAA J. 1994, 32, 1598–1605. [Google Scholar] [CrossRef]
  31. Könözsy, L. The k-ω shear-stress transport (SST) turbulence model, 6th ed. Fluid Mech. Its Appl. 2019, 120, 57–66. [Google Scholar] [CrossRef]
  32. Li, F.; Yu, P.; Deng, N.; Li, G.; Wu, X. Numerical analysis of the effect of the non-sinusoidal trajectories on the propulsive performance of a bionic hydrofoil. J. Appl. Fluid Mech. 2022, 15, 917–925. [Google Scholar] [CrossRef]
  33. Liu, J.J.; Zhang, L.L.; Zhang, Y.P. Particle Size Distribution of Suspended Solids in Cultured Tailwater of Pacific White Shrimp Litopenaeus vannamei. Fish. Sci. 2024, 43, 41–50. [Google Scholar] [CrossRef]
  34. Li, M. The Length-Width Ratio of Rectangular Arc Angle Aquaculture Tank Impact of Flow Field and Sewage Discharge. Master’s Thesis, Dalian Ocean University, Dalian, China, 2023. [Google Scholar] [CrossRef]
  35. Zhang, J.H.; Wu, T.; Xu, D.; Gao, Y.P.; Tang, W. Feeding on feces, diets and cage farming sediments of Paralichthys olivaceus by Japanese scallop Patinopecten yessoensis. Prog. Fish. Sci. 2013, 34, 96–102. [Google Scholar] [CrossRef]
  36. Read, D.A.; Hover, F.S.; Triantafyllou, M.S. Forces on oscillating foils for propulsion and maneuvering. J. Fluids Struct. 2003, 17, 163–183. [Google Scholar] [CrossRef]
  37. Zhang, J.F.; Liang, J.X.; Qi, H.; Zhang, Q.H. Experimental study on the effect of marine snow on the settling of microplastics in nearshore waters. Oceanol. Limnol. Sin. 2022, 53, 852–860. [Google Scholar] [CrossRef]
  38. Von Kármán, T. General aerodynamic theory-perfect fluids. Aerodyn. Theory 1935, 2, 346–349. [Google Scholar] [CrossRef]
  39. Wu, Q.; Huang, B.; Wang, G. Numerical Simulation of Transient Flows around a 3D Pitching Hydrofoil. Adv. Mech. Eng. 2015, 7, 808034. [Google Scholar] [CrossRef]
  40. Ozdemir, Y.H.; Cosgun, T.; Barlas, B. Wave field generated by finite-span hydrofoils operating beneath a free surface. Brodogr. Int. J. Nav. Archit. Ocean Eng. Res. Dev. 2021, 72, 145–167. [Google Scholar] [CrossRef]
  41. Green, M.A.; Rowley, C.W.; Smits, A.J. The unsteady three-dimensional wake produced by a trapezoidal pitching panel. J. Fluid Mech. 2011, 685, 117–145. [Google Scholar] [CrossRef]
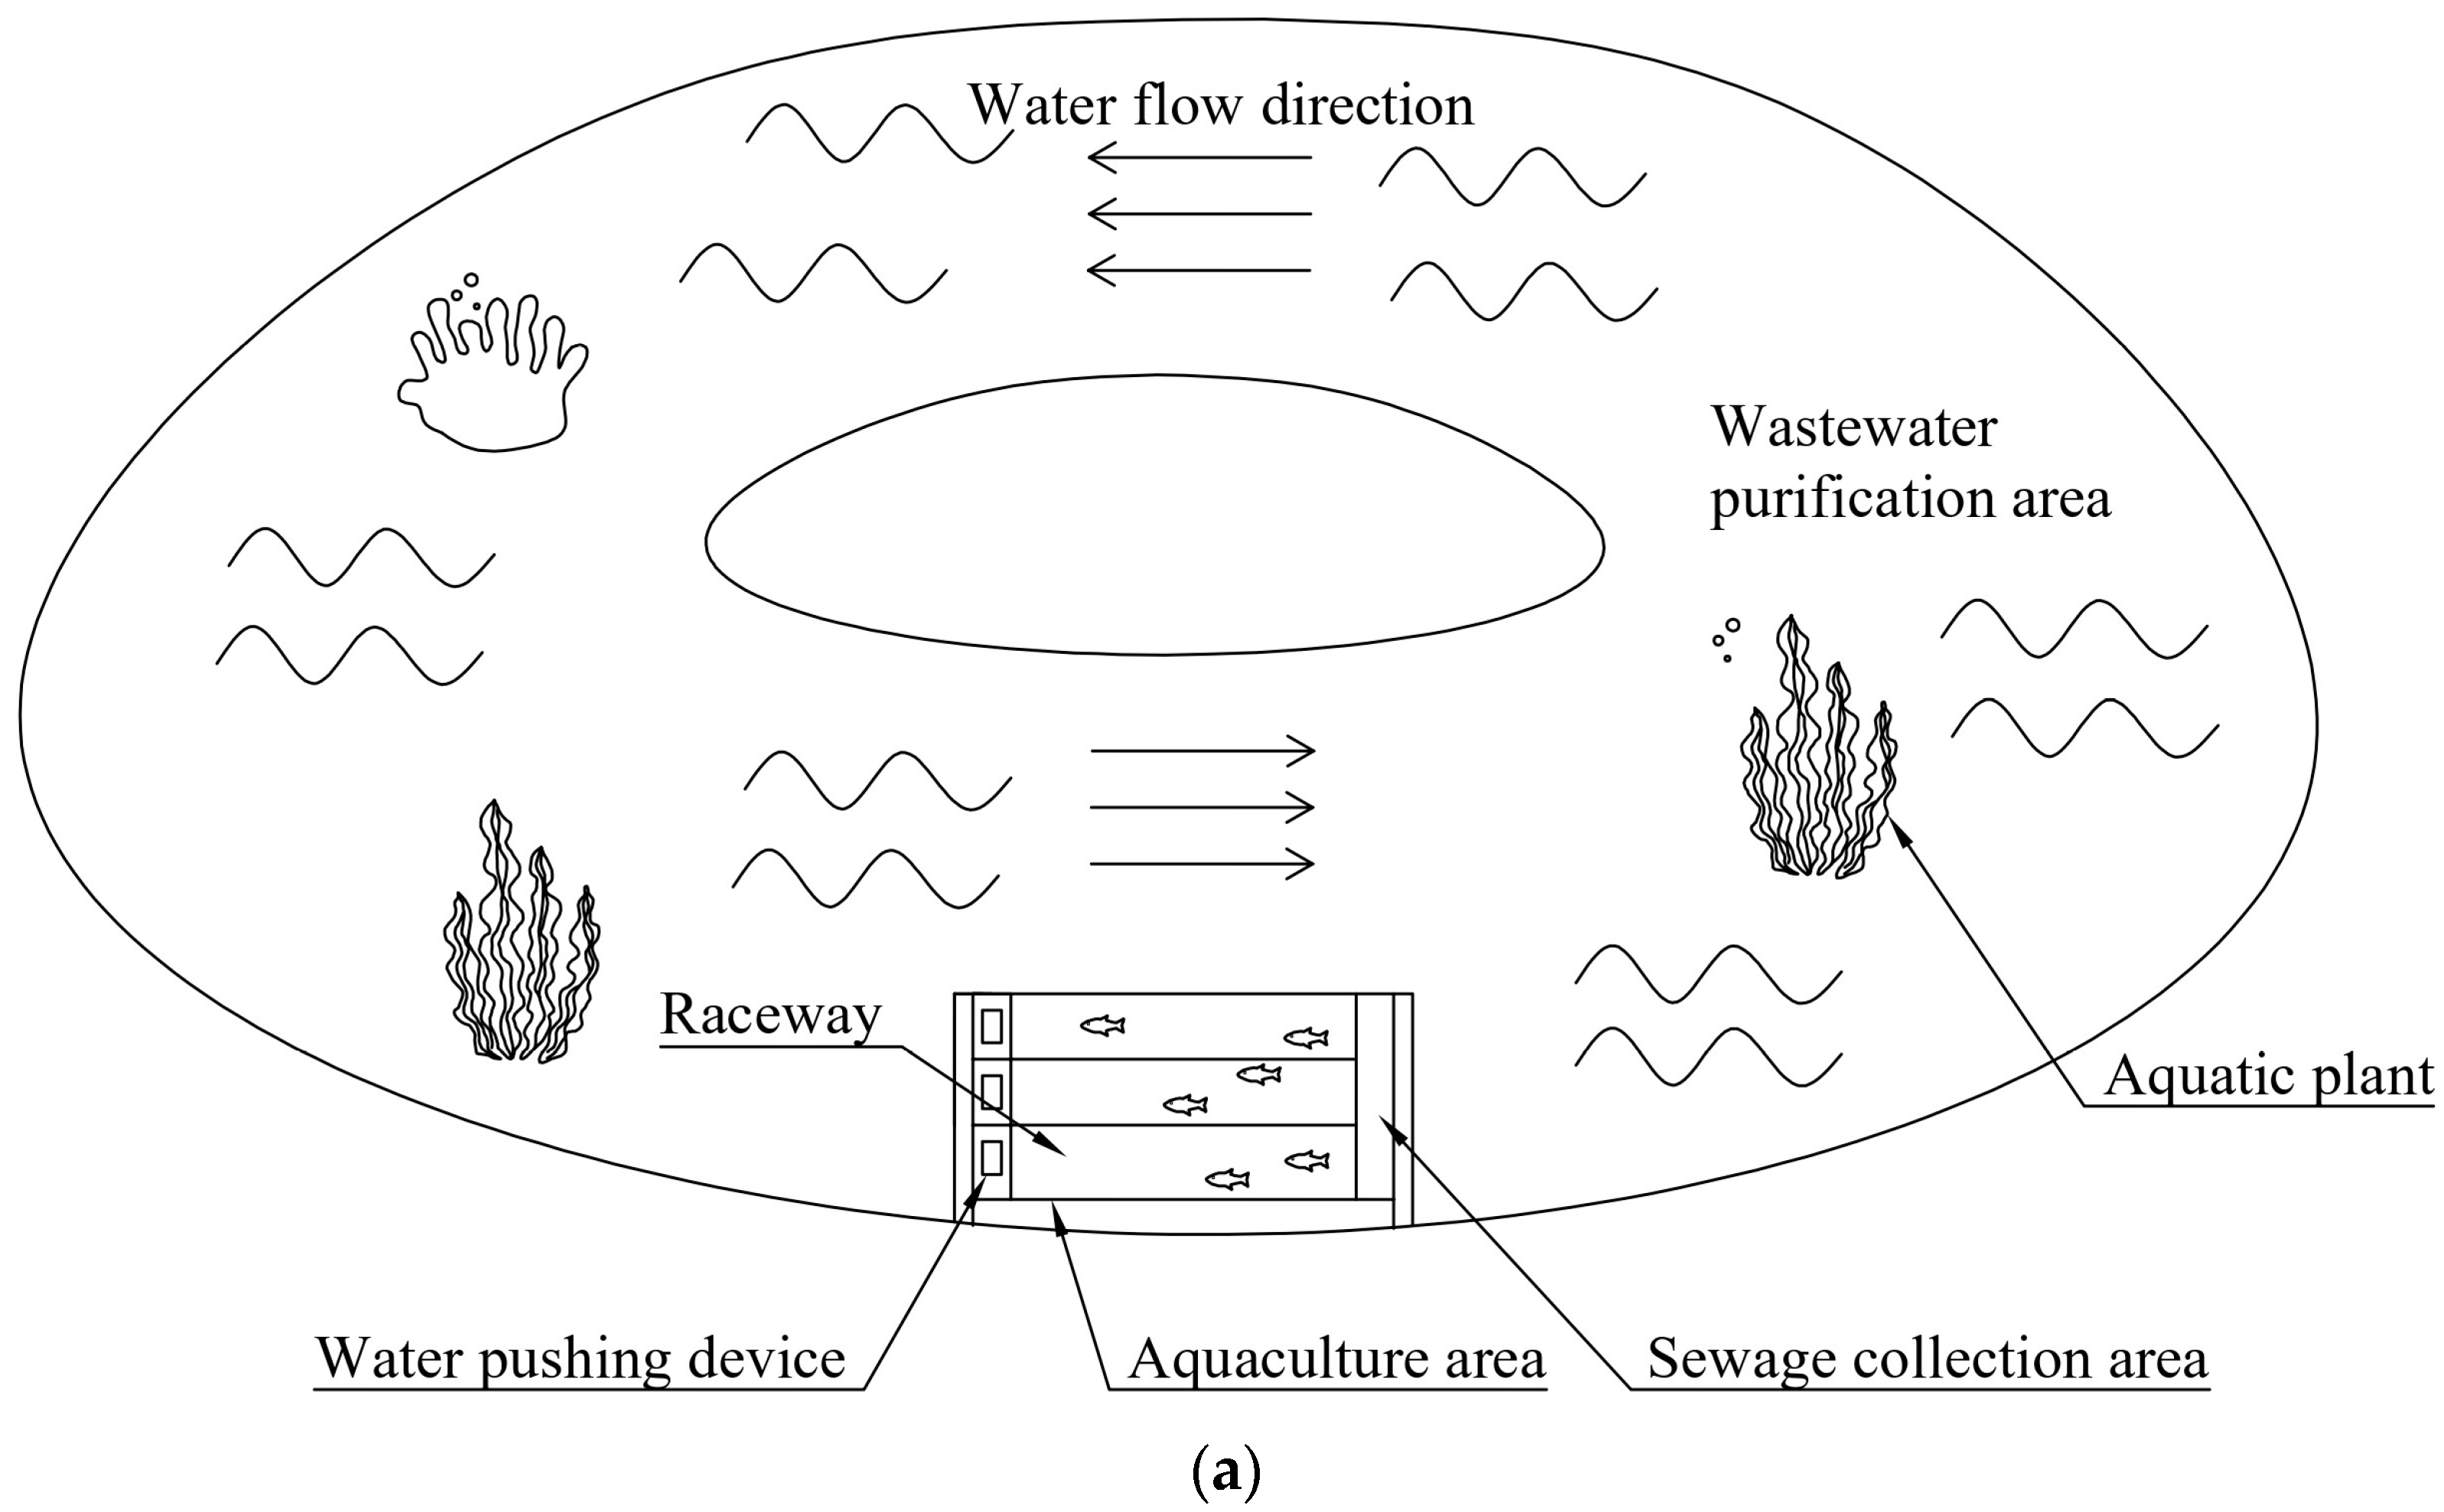
Figure 1. Schematic diagram of IPRS: (a) IPRS regional division; (b) top view of a single aquaculture raceway.
Jmse 12 01584 g001aJmse 12 01584 g001b
Figure 2. The motion pattern of a hydrofoil.
Jmse 12 01584 g002
Figure 3. Schematic diagram of the hydrofoil’s angle of attack.
Jmse 12 01584 g003
Figure 4. Comparison of thrust coefficients under different discretization methods.
Jmse 12 01584 g004
Figure 5. Diagram of grid division.
Jmse 12 01584 g005
Figure 6. Particle dispersal strategy.
Jmse 12 01584 g006
Figure 7. Grid independence validation.
Jmse 12 01584 g007
Figure 8. Comparison of calculated and experimental thrust coefficients for hydrofoil.
Jmse 12 01584 g008
Figure 9. Comparison of calculated and experimental sedimentation rates for spherical polystyrene microspheres of different diameters.
Jmse 12 01584 g009
Figure 10. Diagram of the anti-Karman vortex street.
Jmse 12 01584 g010
Figure 11. Vorticity nephogram of different chord lengths and frequencies.
Jmse 12 01584 g011
Figure 12. Vorticity nephogram on the surface of the hydrofoil within one motion cycle: (a) c = 0.1 W, f = 0.8 Hz; (b) c = 0.1 W, f = 1.0 Hz.
Jmse 12 01584 g012aJmse 12 01584 g012b
Figure 13. Vorticity nephograms around the hydrofoil within one cycle at c = 1.5 W and f = 1.0 Hz.
Jmse 12 01584 g013
Figure 14. Velocity nephogram of different chord lengths.
Jmse 12 01584 g014
Figure 15. Velocity vector diagrams of the aquaculture raceway for different chord lengths.
Jmse 12 01584 g015
Figure 16. Movement diagram of floating particles in the aquaculture raceway at different times.
Jmse 12 01584 g016
Figure 17. Particle discharge rates under different chord lengths and frequencies: (a) c = 0.1 W; (b) c = 0.2 W; (c) c = 0.3 W.
Jmse 12 01584 g017
Figure 18. Vorticity nephogram of the flow field from 10 s to 30 s at c = 0.1 W, f = 0.6 Hz.
Jmse 12 01584 g018
Table 1. Uniformity coefficient of flow field in aquaculture raceway under various working conditions, U C 50 .
Frequency (Hz)Chord Length
0.1 W0.2 W0.3 W
0.50.3970.0010.047
0.60.4580.2090.053
0.70.3960.2140.051
0.80.3960.2130.062
0.90.4180.2020.071
1.00.4200.2120.081
Table 2. Average outlet velocity of the aquaculture raceway under various working conditions (m/s).
Frequency (Hz)Chord Length
0.1 W0.2 W0.3 W
0.50.3570.3380.481
0.60.4700.6210.576
0.70.5120.7260.668
0.80.6010.8270.756
0.90.6910.9250.839
1.00.7651.0420.916
Disclaimer/Publisher’s Note: The statements, opinions and data contained in all publications are solely those of the individual author(s) and contributor(s) and not of MDPI and/or the editor(s). MDPI and/or the editor(s) disclaim responsibility for any injury to people or property resulting from any ideas, methods, instructions or products referred to in the content.