Article

Exploring Innovative Methods in Maritime Simulation: A Ship Path Planning System Utilizing Virtual Reality and Numerical Simulation

College of Intelligent Systems Science and Engineering, Harbin Engineering University, Harbin 150001, China
*
Author to whom correspondence should be addressed.
J. Mar. Sci. Eng. 2024, 12(9), 1587; https://doi.org/10.3390/jmse12091587
Submission received: 24 July 2024 / Revised: 30 August 2024 / Accepted: 6 September 2024 / Published: 8 September 2024
(This article belongs to the Special Issue Motion Control and Path Planning of Marine Vehicles—3rd Edition)

Abstract

:
In addressing the high costs, inefficiencies, and limitations of purely digital simulations in maritime trials for unmanned vessel path planning, this paper introduces a ship virtual path planning simulation test system. This system, unbound by temporal and spatial constraints, vividly showcases the navigational performance of vessels. After analyzing the virtual testing requirements for the autonomous navigation performance of unmanned surface vehicles (USVs), we established the overall framework of this system. Data-driven by a numerical simulation platform, the system achieves synchronized operation between physical and virtual platforms and supports interactive path planning simulations between USVs and the virtual testing system. Furthermore, to address the limitations of traditional ship trajectory planning evaluation, this paper develops a global path planning fitness evaluation function that comprehensively considers trajectory safety, navigation distance, and vessel stability, achieving optimal comprehensive routes through the particle swarm optimization algorithm. Test results indicate an average roll reduction of 14.31% in the planned routes, with a slight increase in navigation distance. By integrating two-dimensional curve simulation with three-dimensional visualization, this paper not only overcomes the limitations of purely physical and purely virtual simulations but also enhances the overall credibility and intuitiveness of the simulation. Experimental results validate the system’s effectiveness, providing a novel method for autonomous navigation testing and evaluation of USVs.

1. Introduction

In the realm of maritime transportation, ship path planning is a crucial area of research, directly impacting navigation efficiency, safety, and environmental protection. In recent years, the research and development of unmanned vessels have advanced rapidly, positioning them as a burgeoning force in future maritime operations [1]. The demand for automation and intelligent path planning for unmanned vessels is increasingly imperative. Path planning for unmanned vessels must not only respond in real time to the complex and ever-changing marine environment but also ensure the efficiency of task execution and the safety and stability of the vessel [2].
However, the research into the autonomous navigation performance of USVs still faces significant challenges. Firstly, traditional ship path planning methods predominantly rely on historical data and simplistic mathematical models to estimate the optimal route in various marine environments. These conventional approaches often fail to adequately consider the complex environmental factors such as ocean currents, wind speeds, and waves, which are crucial for determining the vessel’s course and safety [3]. Secondly, the high costs and inherent complexities and dangers of maritime trials limit the frequency and scale of such tests. Traditional sea trials are not only time-consuming and expensive but also difficult to replicate under identical environmental conditions, posing a major constraint on the stability and reliability of algorithm testing. Although numerical simulation-based path planning methods can reduce costs and risks to some extent, they often lack the ability to interact with the real physical environment, failing to provide intuitive feedback on navigational performance, thus casting doubt on the credibility of their simulation results [4]. Consequently, developing an efficient system capable of real-time simulation and optimization of ship routes has become an urgent technical challenge.
In traditional path planning simulations, system diversity results in data format discrepancies and unnecessary accumulation of redundant information [5]. As large vessels and complex navigation environments proliferate, data volumes increase exponentially, posing significant challenges to data processing and exchange. Simultaneously, the existing simulation software interfaces lack intuitiveness, making them difficult for users to master, especially when dealing with complex 2D and 3D navigation environments. The interactivity and display effects are suboptimal. Traditional 2D views fail to adequately represent the dynamic changes in path planning, and the animation effects are rather crude. During the path planning process, the visualization of refined models is often insufficiently smooth, internal states and results are hard to obtain, and the interaction between users and models is weak and inefficient [6]. These limitations result in inefficient simulation testing and insufficient interactivity, frequently leading to additional and unexpected redesign iterations, thereby extending the development cycle [7].
Significant progress has been made in recent years in the fields of maritime simulation and unmanned vessel path planning. The primary validation and testing methods currently employed include sea trials, digital simulations, and virtual simulations [8].
Numerical simulation technology is a vital tool widely used in ship simulation. By constructing mathematical models and computational methods, it simulates the behavior and performance of ships in various marine environments. Common numerical simulation platforms include Ansys, Abaqus, Matlab, and COMSOL, all of which offer robust computational capabilities and flexible modeling functions, making them suitable for simulating a wide range of complex conditions [9]. However, these platforms differ in terms of accuracy, computational speed, and ease of use. For instance, Ansys is renowned for its high precision and extensive library of physical models, while Abaqus excels in solving complex nonlinear problems. Zhu et al. employed the Dijkstra algorithm for numerical simulation of ship route planning, demonstrating the method’s efficacy in real route selection [10]. Numerical simulation allows the modeling of ship behavior under different marine conditions in a virtual environment, significantly reducing the high costs and risks associated with actual sea trials. Li et al. proposed an optimization algorithm under multiple constraints, combining physical model testing with numerical simulation to enhance the credibility and reliability of simulation results [11]. Despite the significant role of numerical simulation technology in ship simulation, its purely digital nature weakens its interaction with the actual physical environment [12], making it challenging to fully capture the dynamic behavior of ships and the influence of environmental factors [13].
In maritime validation, virtual technology is employed to create immersive ship path planning environments, offering powerful graphics processing capabilities and highly flexible development tools to generate realistic virtual ocean environments. Within these environments, users can intuitively observe and adjust ship path planning, receiving real-time simulation feedback. Kim et al. provide a detailed analysis of the needs for USV autonomous local obstacle avoidance and propose a USV software and hardware framework system, establishing a V-REP semi-physical simulation platform and an actual ship experimental platform, both of which were validated through simulations and real-world tests [14]. Wang et al. utilized the Unity engine for simulating ship maneuvering, proposing an efficient and easily implementable simulation method. This method integrates three-dimensional modeling, a physics engine, and scripting, enabling the creation of complex simulation environments and the realization of ship motion control without the need for actual code [15]. Shin et al. used the Unity3D engine to construct virtual ocean scenes to address the issue of insufficient marine image data, subsequently training USV intelligent control within this framework [16]. Zhang et al. combined the high-precision formation maintenance capability of virtual structures with the low computational complexity of the artificial potential field, effectively achieving formation control and obstacle avoidance in multi-USV systems [17]. Xue et al. developed a high-fidelity simulation environment to validate a fully autonomous USV framework based on Gaussian process motion planning [18]. Xiao et al. proposed a virtual system-based method for testing the autonomous navigation performance of USVs [19]. This system comprises multiple modules, including an environment module, motion module, sensor module, and three-dimensional visualization module, achieving comprehensive testing of USV autonomous navigation performance. Subsequent researchers have continued to explore this direction, making contributions to the system’s interactivity, visualization, credibility, and user experience.
USVs must consider multiple factors such as distance, safety, and stability in their path planning processes to ensure efficient operation. However, if these tests are conducted in isolated modules, they may overlook the system’s overall integrity and the interaction effects between different modules [20]. Such fragmented testing methods fail to comprehensively reflect the complexity and integrated performance required in actual operations. Unlike land-based unmanned systems, USVs operating in marine environments face greater uncertainties and challenges. Current route optimization objectives primarily focus on the shortest navigation distance and the safest distance from obstacles. However, these objectives often neglect environmental interference factors such as wind, waves, and currents, which significantly impact USV navigation and path planning. These environmental disturbances not only affect the stability and safety of USV navigation but can also lead to path deviations and navigation errors [21]. Zhou et al. indicate that although optimized routes may theoretically be the shortest, neglecting environmental disturbances in practical applications adversely affects the vessel’s navigation stability and safety [22]. Peng et al. further emphasize that incorporating environmental interference factors significantly enhances the practical utility of route optimization and the safety of vessel navigation [23]. Ignoring these factors during simulations renders the results meaningless and ineffective in predicting USV performance in real-world conditions. Therefore, to enhance the realism and reliability of USV virtual simulation systems, it is imperative to comprehensively consider and simulate these environmental disturbances. By introducing dynamic environmental parameters such as wind, waves, and currents into the simulation system, it is possible to more accurately recreate the various conditions USVs may encounter during actual operations [24]. This approach not only improves the accuracy and credibility of simulation results but also provides more reliable data support for the design optimization and performance enhancement of USVs.
This paper proposes a ship path planning system that integrates virtual simulation with numerical modeling, offering an interactive three-dimensional visualization that is unrestricted by time and location. By utilizing data-driven approaches, the system synchronizes physical and virtual platforms, providing a novel framework for autonomous navigation testing of unmanned surface vessels. Additionally, the study develops a fitness evaluation function that comprehensively considers path safety, navigation distance, and vessel stability, employing Particle Swarm Optimization (PSO) to derive optimal routes. This innovative method bridges the gap between theoretical simulation and real-world maritime trials, significantly enhancing the reliability of autonomous navigation testing for unmanned surface vessels. The primary contributions of this study are as follows:
(1) A path planning system combining virtual reality and numerical simulation: This research introduces an innovative system that merges virtual reality with numerical simulation, overcoming the high costs and limitations of traditional sea trials. The proposed system offers a highly interactive and immersive environment for assessing and optimizing ship path planning, marking a significant advancement over conventional methods.
(2) Development of a comprehensive route optimization model: The study proposes an innovative route optimization constraint model that takes into account multiple factors such as route safety, navigation distance, and vessel stability. By incorporating environmental disturbances like wind and waves into the model, the research addresses real-world challenges in maritime navigation, providing a more holistic and practical approach to ship path planning.
(3) A rapid roll prediction model based on RBF neural networks: This paper introduces a rapid prediction model for ship roll using Radial Basis Function neural networks, which offers higher accuracy under complex sea conditions compared to traditional Random Forest and Support Vector Machine models, thereby providing reliable data support for path optimization.
The remainder of this paper is organized as follows: In the Section 2, we introduce the fundamental architecture of the ship virtual path planning simulation test system. The Section 3 details the construction of both the numerical simulation platform and the virtual simulation platform, wherein a novel route constraint model incorporating environmental disturbances is proposed. In the Section 4, we validate the ship virtual path planning simulation test system to evaluate its performance.

2. Framework of the Ship Virtual Path Planning Simulation Test System

2.1. Requirements Analysis and System Functionality Specifications

To address the issues of lacking real-ship trials, the inability to intuitively perceive ship navigation attitudes, and the difficulty in observing the effectiveness of path planning, we designed a virtual simulation system driven by ship path planning simulation data. This system enables an immersive interaction experience of the ship’s navigation state and path planning effectiveness based on virtual reality. Functionally, the system is divided into a numerical simulation module, virtual simulation module, data management module, and joint simulation experiment module, as illustrated in Figure 1.
(1) The numerical simulation module primarily generates the data that drive the operation of the virtual system, encompassing mathematical models, constraint models, and path planning. The mathematical model involves constructing the ship’s rolling motion model and the environmental loads it encounters. The constraint model defines the conditional constraints for path planning. Path planning entails determining the navigable routes for the ship, ensuring that the optimized path considers the constraints and reaches the target point under optimal conditions.
(2) The virtual simulation module is designed to construct a virtual ocean environment and observe the operational processes of the virtual ship. It mainly includes environment construction, three-dimensional visualization, and human–computer interaction. Environment construction involves creating the ocean, terrain islands, and floating obstacles to simulate the conditions a real ship might encounter while operating at sea. Three-dimensional visualization allows users to observe the virtual ship from multiple perspectives and visually assess the ship’s operational posture and the distance between the platform and obstacles during its operation to evaluate the effectiveness of path planning. Human–computer interaction enables users to interact with the UI interface and scenes using devices such as a mouse, allowing for the selection of validation types, parameters, and other operations.
(3) The data management module is designed to handle the drive data generated by the numerical simulation module. It primarily includes data processing, data communication, and offline management. Data processing involves saving the simulated data and performing linear interpolation mapping to convert it into coordinates within the virtual scene, thereby driving the operation of the virtual platform. Data communication ensures the exchange of data between the numerical simulation module and the virtual simulation module. Offline management involves saving the most recent simulation data, ensuring that the platform can continue to operate even after the user exits the system.
(4) The joint simulation experiment module primarily comprises three components: path planning simulation, ship motion state simulation, and path optimization simulation. The path planning and path optimization simulations are employed to validate the rationality of the designed algorithms, allowing for visual observation of trajectory issues and optimization verification within the path optimization simulation. The ship motion state simulation enables operators to directly experience the impact of ship movements during navigation through the device.
Based on the requirements analysis and the aforementioned functionalities of the ship virtual path planning simulation test system, specific operational procedures for virtual scenes and data connections within the virtual simulation system are proposed. The specific technical specifications of the system’s functionalities are as follows:
  • During the operation of the virtual system, the scene rendering should remain smooth and clear. Under high-load conditions, such as full-screen water rendering, advanced reflections, and ambient occlusion effects, the GPU utilization is expected to stabilize around 70–90%; average CPU utilization should remain below 15%, with single-core CPU usage for AI logic computations maintained at 60%. The average frame rate should exceed 60 fps. Even during extensive ocean rendering and island interactions, the system should maintain a fluid experience, with no lag observed during interactions;
  • The virtual simulation system is equipped with data communication capabilities, allowing for the mapping of simulation data. The data latency is less than one second, ensuring smooth and stable data flow with no significant fluctuations;
  • Ensure that the numerical simulation module possesses the capability to save simulation data in real time.
  • The path planning simulation within the system can evaluate the optimization effects of the algorithm by comparing path length, computation time, and ship navigation posture data.

2.2. Design Framework of the Ship Virtual Path Planning Simulation Test System

Based on the critical requirements for virtual testing of autonomous navigation performance of unmanned vessels, a virtual simulation system driven by ship path planning simulation data was designed to achieve immersive interaction with the vessel’s navigation status and path planning effects through virtual reality. The system is functionally divided into the Numerical Simulation Module, Virtual Simulation Module, Data Management System, and Joint Simulation Experiment Module, as shown in Figure 2.
The Joint Simulation Experiment Module simulates the impact of real marine environment disturbances on vessel movement for the operator. The Virtual Simulation Module, utilizing a virtual dynamic positioning model and a virtual ocean environment, achieves real-time simulation and navigation of USVs through dynamic light tracing and environment rendering optimization technologies. The Data Management System is responsible for reading, storing, updating, and processing data, ensuring real-time accuracy through data filtering, fusion, and calculation, while providing efficient data communication interfaces. The Numerical Simulation Module handles USV ship modeling, sea-state modeling, and planning algorithm design, enabling simulation process control and system status assessment through model construction and path planning validation. Interactions between these components, driven by data and statistical information, ensure synchronous operation between the physical and virtual platforms, guaranteeing the realism and reliability of simulation tests, and thereby comprehensively evaluating the autonomous navigation performance of USVs.

3. Construction of the Virtual Simulation System

3.1. Design of the Numerical Simulation Module

The primary objective of the numerical simulation module is to generate data for driving the virtual platform. Its core components include the route optimization constraint model, rapid ship roll calculation, and path planning algorithms. Through the synergy of these three elements, the numerical simulation module can produce high-precision simulation data, enabling the virtual platform to conduct realistic simulation tests, thereby enhancing the overall efficiency and reliability of the virtual simulation system.

3.1.1. Route Optimization Constraint Model

The route optimization constraint model entails the development of a mathematical framework that, within the context of a defined navigational mission, comprehensively considers the marine environment, vessel performance, and safety requirements. This model must meticulously detail various constraints such as minimal travel time, lowest energy consumption, and obstacle avoidance criteria. Such precision ensures that the USV can perform its tasks safely and efficiently in the dynamic and complex marine environment. Consequently, this paper constructs the route optimization constraint model from the following three perspectives.
(1) Route Safety. Route safety is the foremost objective in route optimization, focusing primarily on ensuring that the vessel does not collide with obstacles or other ships during navigation. The safety cost function F s a f e is defined as:
F s a f e = 0 d A A A 1 + e d d < A
where d represents the minimum distance between the transport vessel and obstacles. The cost function begins to increase when the distance between the vessel and the obstacle is less than or equal to the predetermined safety distance A . This cost function follows an exponential form, with a gradual increase initially, which intensifies as the distance decreases. When the distance reaches zero, the safety cost function attains its maximum value.
(2) Vessel Navigation Distance. The optimization of navigation distance aims to minimize the vessel’s travel time and fuel consumption by selecting the shortest or near-shortest path. The cost function for navigation distance is denoted as F l e n g t h , is defined as:
F l e n g t h = i = 1 N ( x i x i + 1 ) 2 + ( y i y i + 1 ) 2
where x represents the horizontal coordinate of the route, y represents the vertical coordinate of the route, and i denotes the index of the planned route points.
(3) Vessel Stability. Stability refers to minimizing the rolling motion of the vessel caused by waves and currents during navigation. The cost function for vessel stability, denoted as F s t a b i l i t y , is defined as:
F s t a b i l i t y = k 1 θ m e a n + k 2 θ max
where θ m e a n and θ max represent the average roll angle and the maximum roll angle induced by the trajectory, respectively, k 1 and k 2 are the weight coefficients.
In summary, by considering these three aspects, the route optimization constraint model is constructed as follows:
F c o n s t r a int = a F l e n g t h + b F s t a b i l i t y + c F s a f e
where a , b , and c are the weight coefficients for the distance cost function, safety cost function, and stability cost function, respectively. To enhance the model’s versatility and adaptability, the settings of these weight factors will be customized based on the type of target vessel and finely tuned through empirical analysis and expert judgment.
Different types of vessels exhibit distinct requirements for distance, safety, and stability during operation. Therefore, this study first designs specific weight parameter ranges tailored to the vessel type, such as cargo ships, passenger ships, or unmanned vessels. For instance, cargo ships may prioritize stability to ensure the safety of transported goods, while passenger ships may emphasize safety and comfort. Consequently, different vessel types correspond to varying ranges of weight factors, reflecting their unique operational demands. After establishing initial weight parameter ranges, these parameters are further refined and adjusted through empirical data analysis and expert judgment. This process ensures the accuracy and efficacy of the weight factors in achieving the desired path optimization outcomes in practical applications.

3.1.2. Rapid Ship Roll Calculation Model

In the previous Section, we discussed the need to calculate the roll angle of the route when studying the route optimization constraint model. Traditional methods for predicting ship roll are primarily based on model calculations, which involve creating a mathematical model of the ship’s roll motion based on its dynamic equations and wave energy spectrum. However, these methods are limited in practical applications due to their slow computation speed and weak generalization ability. Therefore, this paper employs a data-driven approach to establish a rapid calculation model for the ship’s roll response.
The Radial Basis Function (RBF) neural network is a powerful tool capable of achieving complex nonlinear mappings [25]. It can approximate intricate mathematical relationships with high precision and good generalization ability, utilizing only a small number of hidden layer neurons. Additionally, it possesses a certain degree of fault tolerance. The basic structure of the RBF neural network comprises three parts: the input layer, the hidden layer, and the output layer, as illustrated in Figure 3.
In this paper, we selected wave direction angle, wave height, wind direction angle, and wind speed as the input layer parameters for the RBF neural network. The input layer is responsible for receiving these external environmental parameters, which directly affect the vessel’s motion state and stability. The hidden layer employs radial basis functions as activation functions, which effectively capture the nonlinear characteristics of the input parameters. By computing the Euclidean distance from each input parameter to the center, the model generates a high-dimensional feature space, enhancing its ability to express and approximate complex functions. The expression for the radial basis function is:
ϕ ( x i ) = exp x i c i   2 2 σ 2
where ϕ ( x i ) represents the output of the radial basis function, x i denotes the input vector, c i is the center vector of the radial basis function, and σ is the width parameter that controls the function’s range of influence.
The output layer employs a linear activation function, achieving the final predicted value through a linear combination of the outputs from the hidden layer. In this paper, our objective is to predict the maximum roll angle of the ship under specific sea conditions. Leveraging the nonlinear mapping capabilities of the RBF neural network, we can accurately forecast the maximum roll angle based on the inputs of wave direction, wave height, wind direction, and wind speed.
y = i = 1 N w i ϕ i + b
where y represents the final predicted value from the output layer, w i is the weight of the i -th hidden layer neuron, ϕ i denotes the output of the i -th hidden layer neuron, b is the bias term, and N is the number of hidden layer neurons.

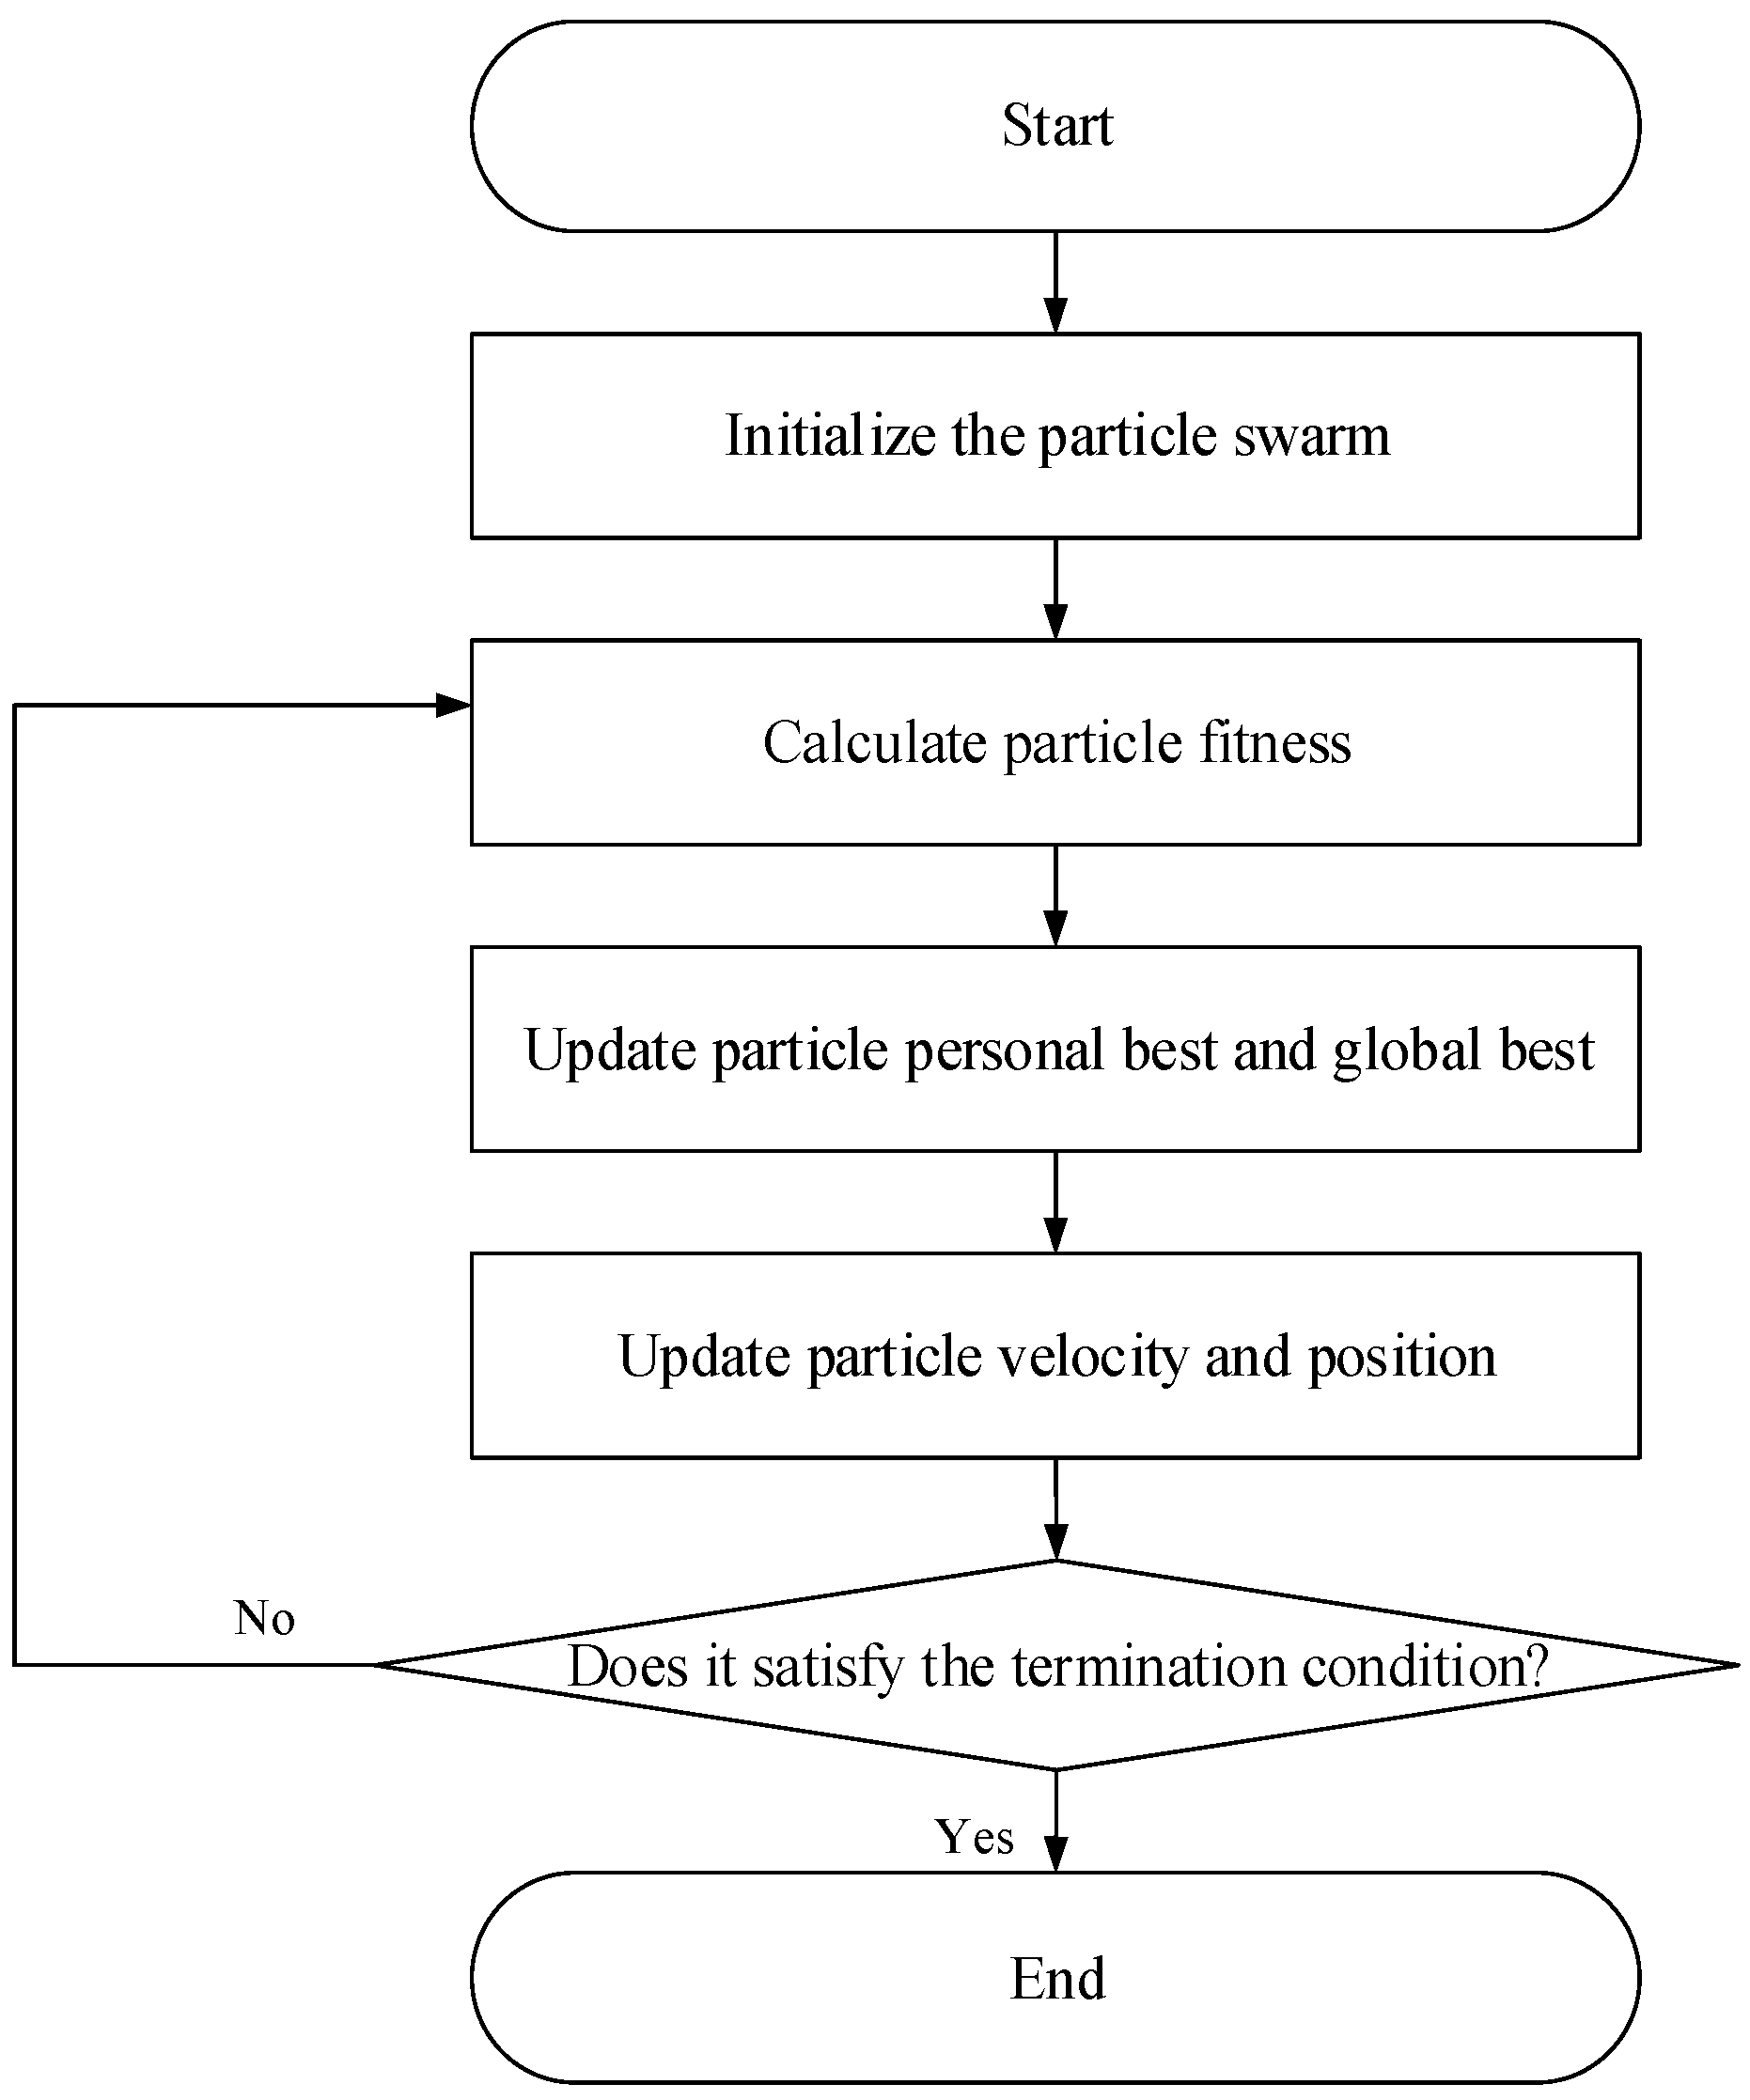
3.1.3. Global Path Planning Based on the PSO Algorithm

To address the conditions of the route optimization constraint model, this paper proposes a global path planning method based on the PSO algorithm. As an intelligent optimization algorithm, PSO boasts strong global search capabilities and rapid convergence performance [26]. It can devise an optimal path while considering track safety, navigation distance, and stability. Compared to genetic algorithms, simulated annealing, and ant colony algorithms, the PSO algorithm is simpler to implement, has lower computational complexity, and features intuitive and easily adjustable parameters. Furthermore, it demonstrates strong adaptability in handling dynamic and complex environments. These characteristics make PSO perform excellently in solving multimodal optimization problems, enabling effective ship path planning in the complex and ever-changing marine environment.
The PSO algorithm simulates the foraging behavior of bird flocks, leveraging the information sharing among particles to find the optimal solution [27]. In this paper, the PSO algorithm is employed to chart an optimal path in a complex and dynamic marine environment, ensuring track safety, navigation distance, and stability. The route optimization constraint model constructs a fitness function to evaluate the quality of each particle’s position, which directly influences the performance and effectiveness of the PSO algorithm. In the path planning problem, this paper uses the route optimization constraint model as the fitness function—the smaller the fitness value, the better the particle’s position. The algorithmic process is illustrated in Figure 4.
In each iteration, the fitness value of each particle is computed based on its current position using the fitness function. A smaller fitness value indicates a better position for the particle. For each particle, if the current fitness value is less than its historical best fitness value, the particle’s individual best position is updated. Among all particles, the one with the smallest fitness value is identified, and its position is designated as the global best position. Subsequently, the velocity and position of each particle are updated according to the following equations:
v i ( t + 1 ) = w v i ( t ) + c 1 r 1 ( p b e s t i x i ( t ) ) + c 2 r 2 ( g b e s t x i ( t ) ) x i ( t + 1 ) = x i ( t ) + v i ( t + 1 )
where v i ( t ) and x i ( t ) represents the velocity and position of particle i at time t , p b e s t i is the individual best position of particle i , g b e s t signifies the global best position, r 1 and r 2 are random numbers between [0, 1], and c 1 and c 2 are the learning factors.
Through the aforementioned equations, particles continuously adjust their positions within the search space, gravitating towards both their individual best positions and the global best position, thereby progressively approaching the optimal solution. After each iteration, the fitness values of all particles are recalculated, updating the individual best positions and the global best position until the maximum number of iterations is reached or the fitness value of the global best position ceases to decrease significantly.
Upon reaching the stopping criteria, the final global best position is used to construct the optimal path. Through this process, the PSO algorithm evaluates the quality of particles using the fitness function and guides the particle swarm toward the optimal solution, thereby achieving global path optimization and planning. This method combines the global search capabilities of intelligent optimization algorithms with the practical requirements of the route optimization objective constraint model, providing robust support for ship navigation and path planning.

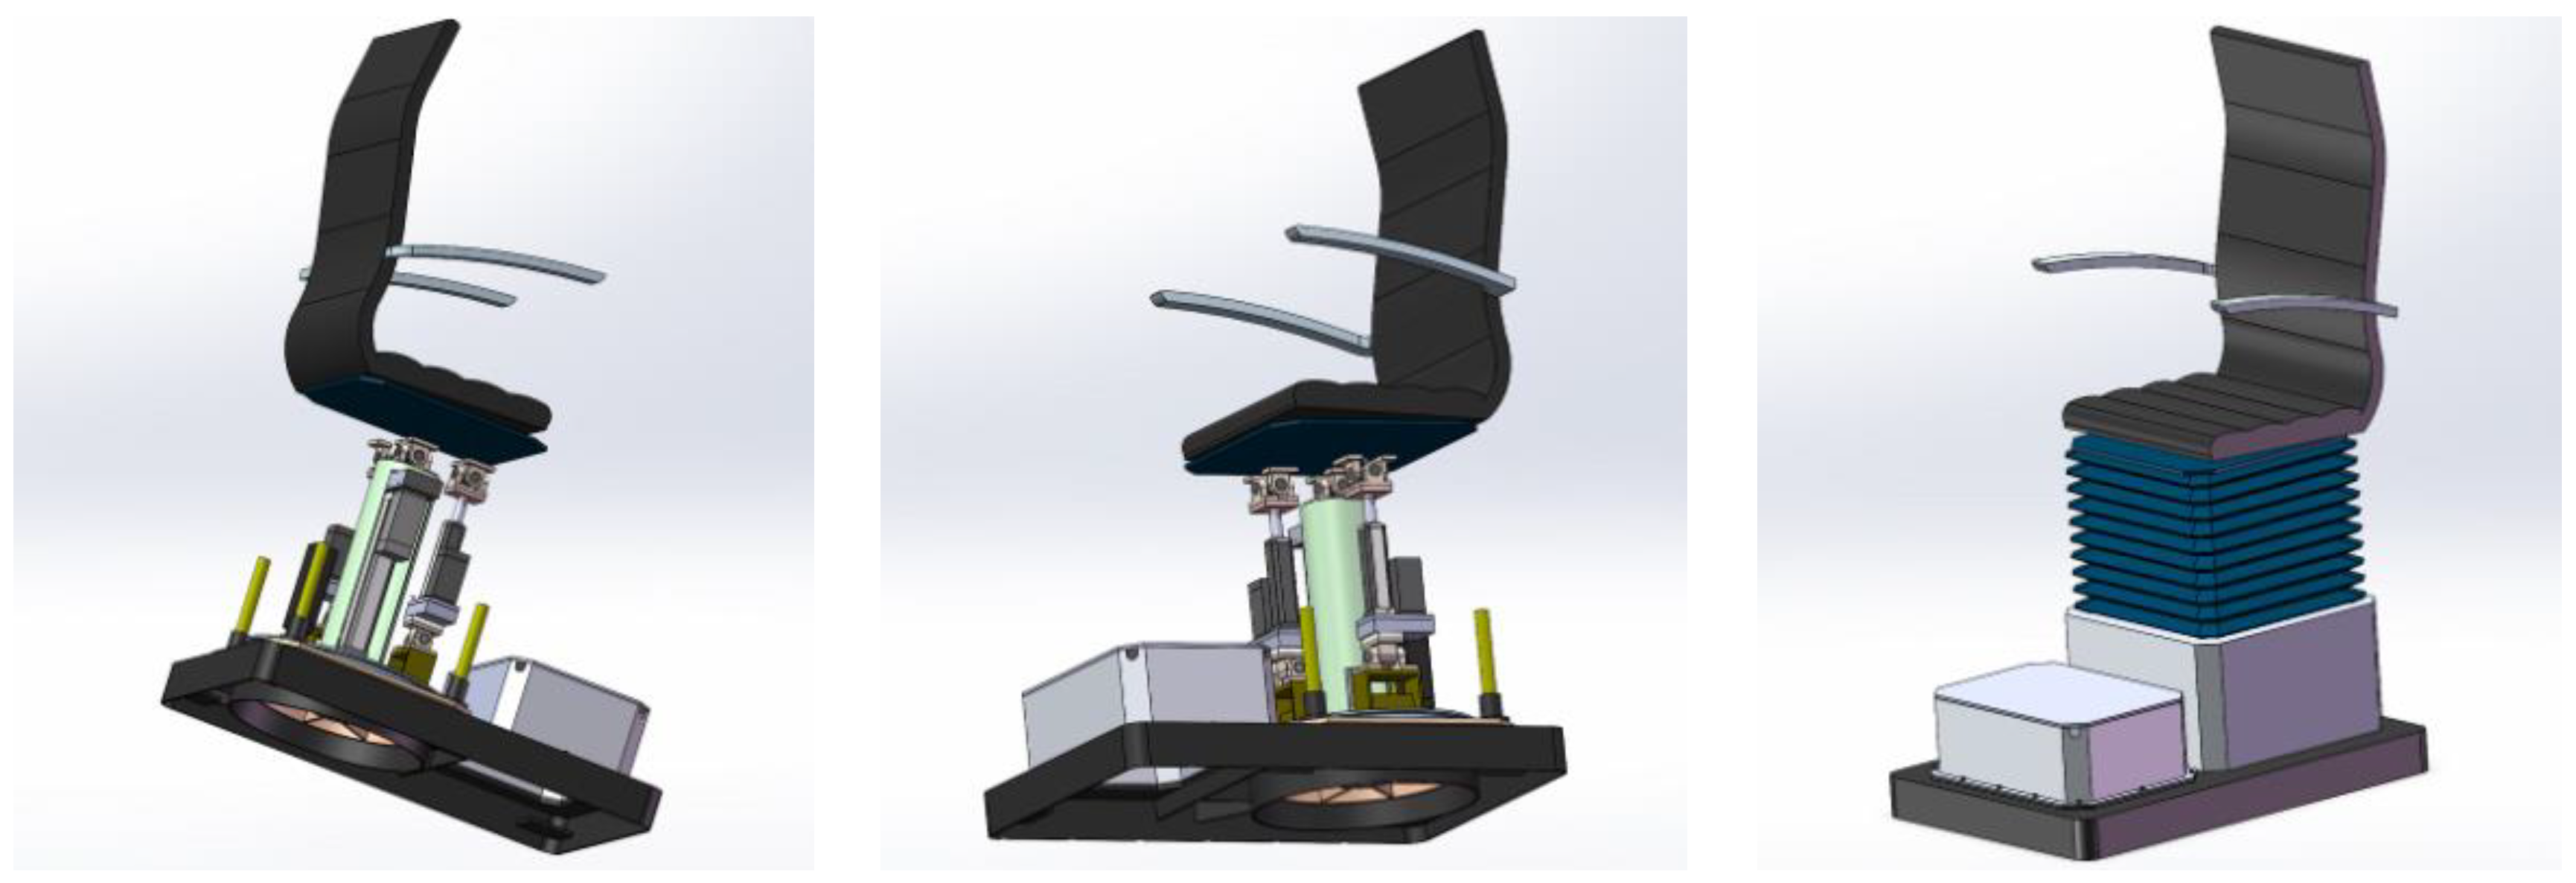
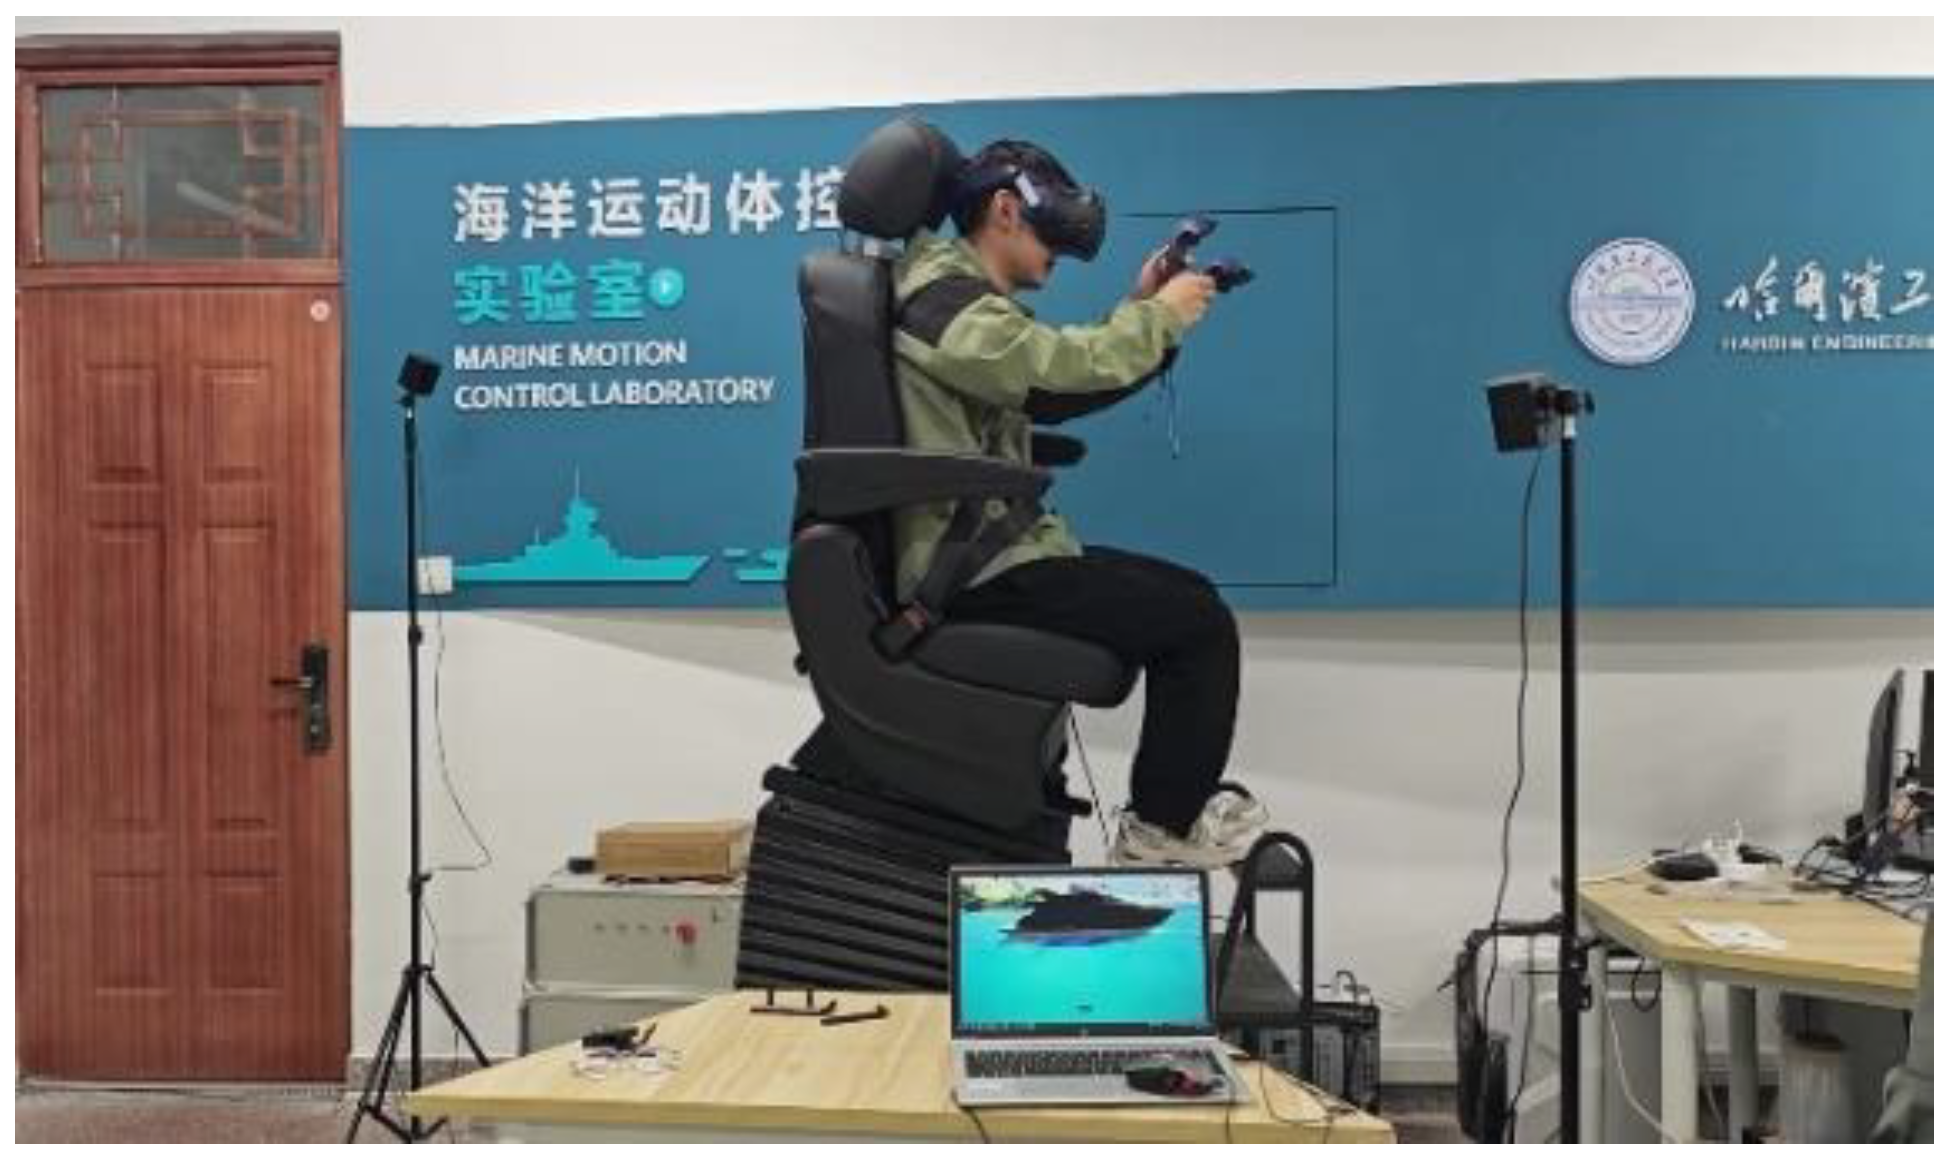
3.2. Design of the Physical Simulation Module

The physical simulation platform utilizes a multi-degree-of-freedom motion seat to enable users to deeply experience the real-time motion posture of a vessel, thereby enhancing an immersive sensory experience. It primarily relies on PLC control and servo motor drive control, with simulated data sent from the virtual simulation platform to control the motion. The motion simulation platform framework is illustrated in Figure 5.
The simulation platform consists of a PLC controller, servo motors, servo-electric cylinders, servo drivers, and measuring instruments. The PLC, serving as the primary information processing unit, decodes the drive data and transmits them to the servo drivers. The servo drivers, equipped with three control modes—position control, speed control, and torque control—send high-speed differential pulse signals (4 Mpps) to drive the motors and electric cylinders, achieving precise position settings and facilitating the four-degrees-of-freedom motion of the seat module. The minimal coupling between different degrees of freedom makes the system easy to control. The mechanical structure of the seat is illustrated in Figure 6.
The motion simulation platform designed in this paper simulates the four degrees of freedom of a vessel, which can operate individually or in combination. To achieve a more pronounced longitudinal motion simulation experience for hydrofoil vessels, the design of the motion simulation platform requires each degree of freedom to have a travel limit that exceeds the normal motion amplitude of the vessel. The specific design parameters are detailed in Table 1.
One of the crucial steps when utilizing such high-degree-of-freedom platforms is virtual space calibration. This ensures that the actual physical position aligns accurately with the scene positioning in the virtual environment, thereby maintaining synchronized interaction between the user’s line of sight and the virtual perspective. In this platform design, the coupling effects between different degrees of freedom are minimal, facilitating independent precise control. This allows the motion platform to flexibly simulate movements in the longitudinal direction, enhancing the controllability of the entire system and the authenticity of the user experience.

3.3. Design of the Virtual Simulation Platform

The development of the virtual simulation platform involves constructing 3D models for both the ship and the marine environment. This process begins with gathering and organizing relevant information about the research subjects, including the dimensions and appearance of the ship as well as the ocean environment. Subsequently, dynamic positioning models are created using software such as SolidWorks 2023 and Blender 3.6 based on real-world data. To achieve highly realistic representations, Unreal Engine 5 (UE5) is employed to render and create three-dimensional scenes that closely resemble actual environments [28]. Various interactive visualizations are designed to enhance the user’s operational experience.

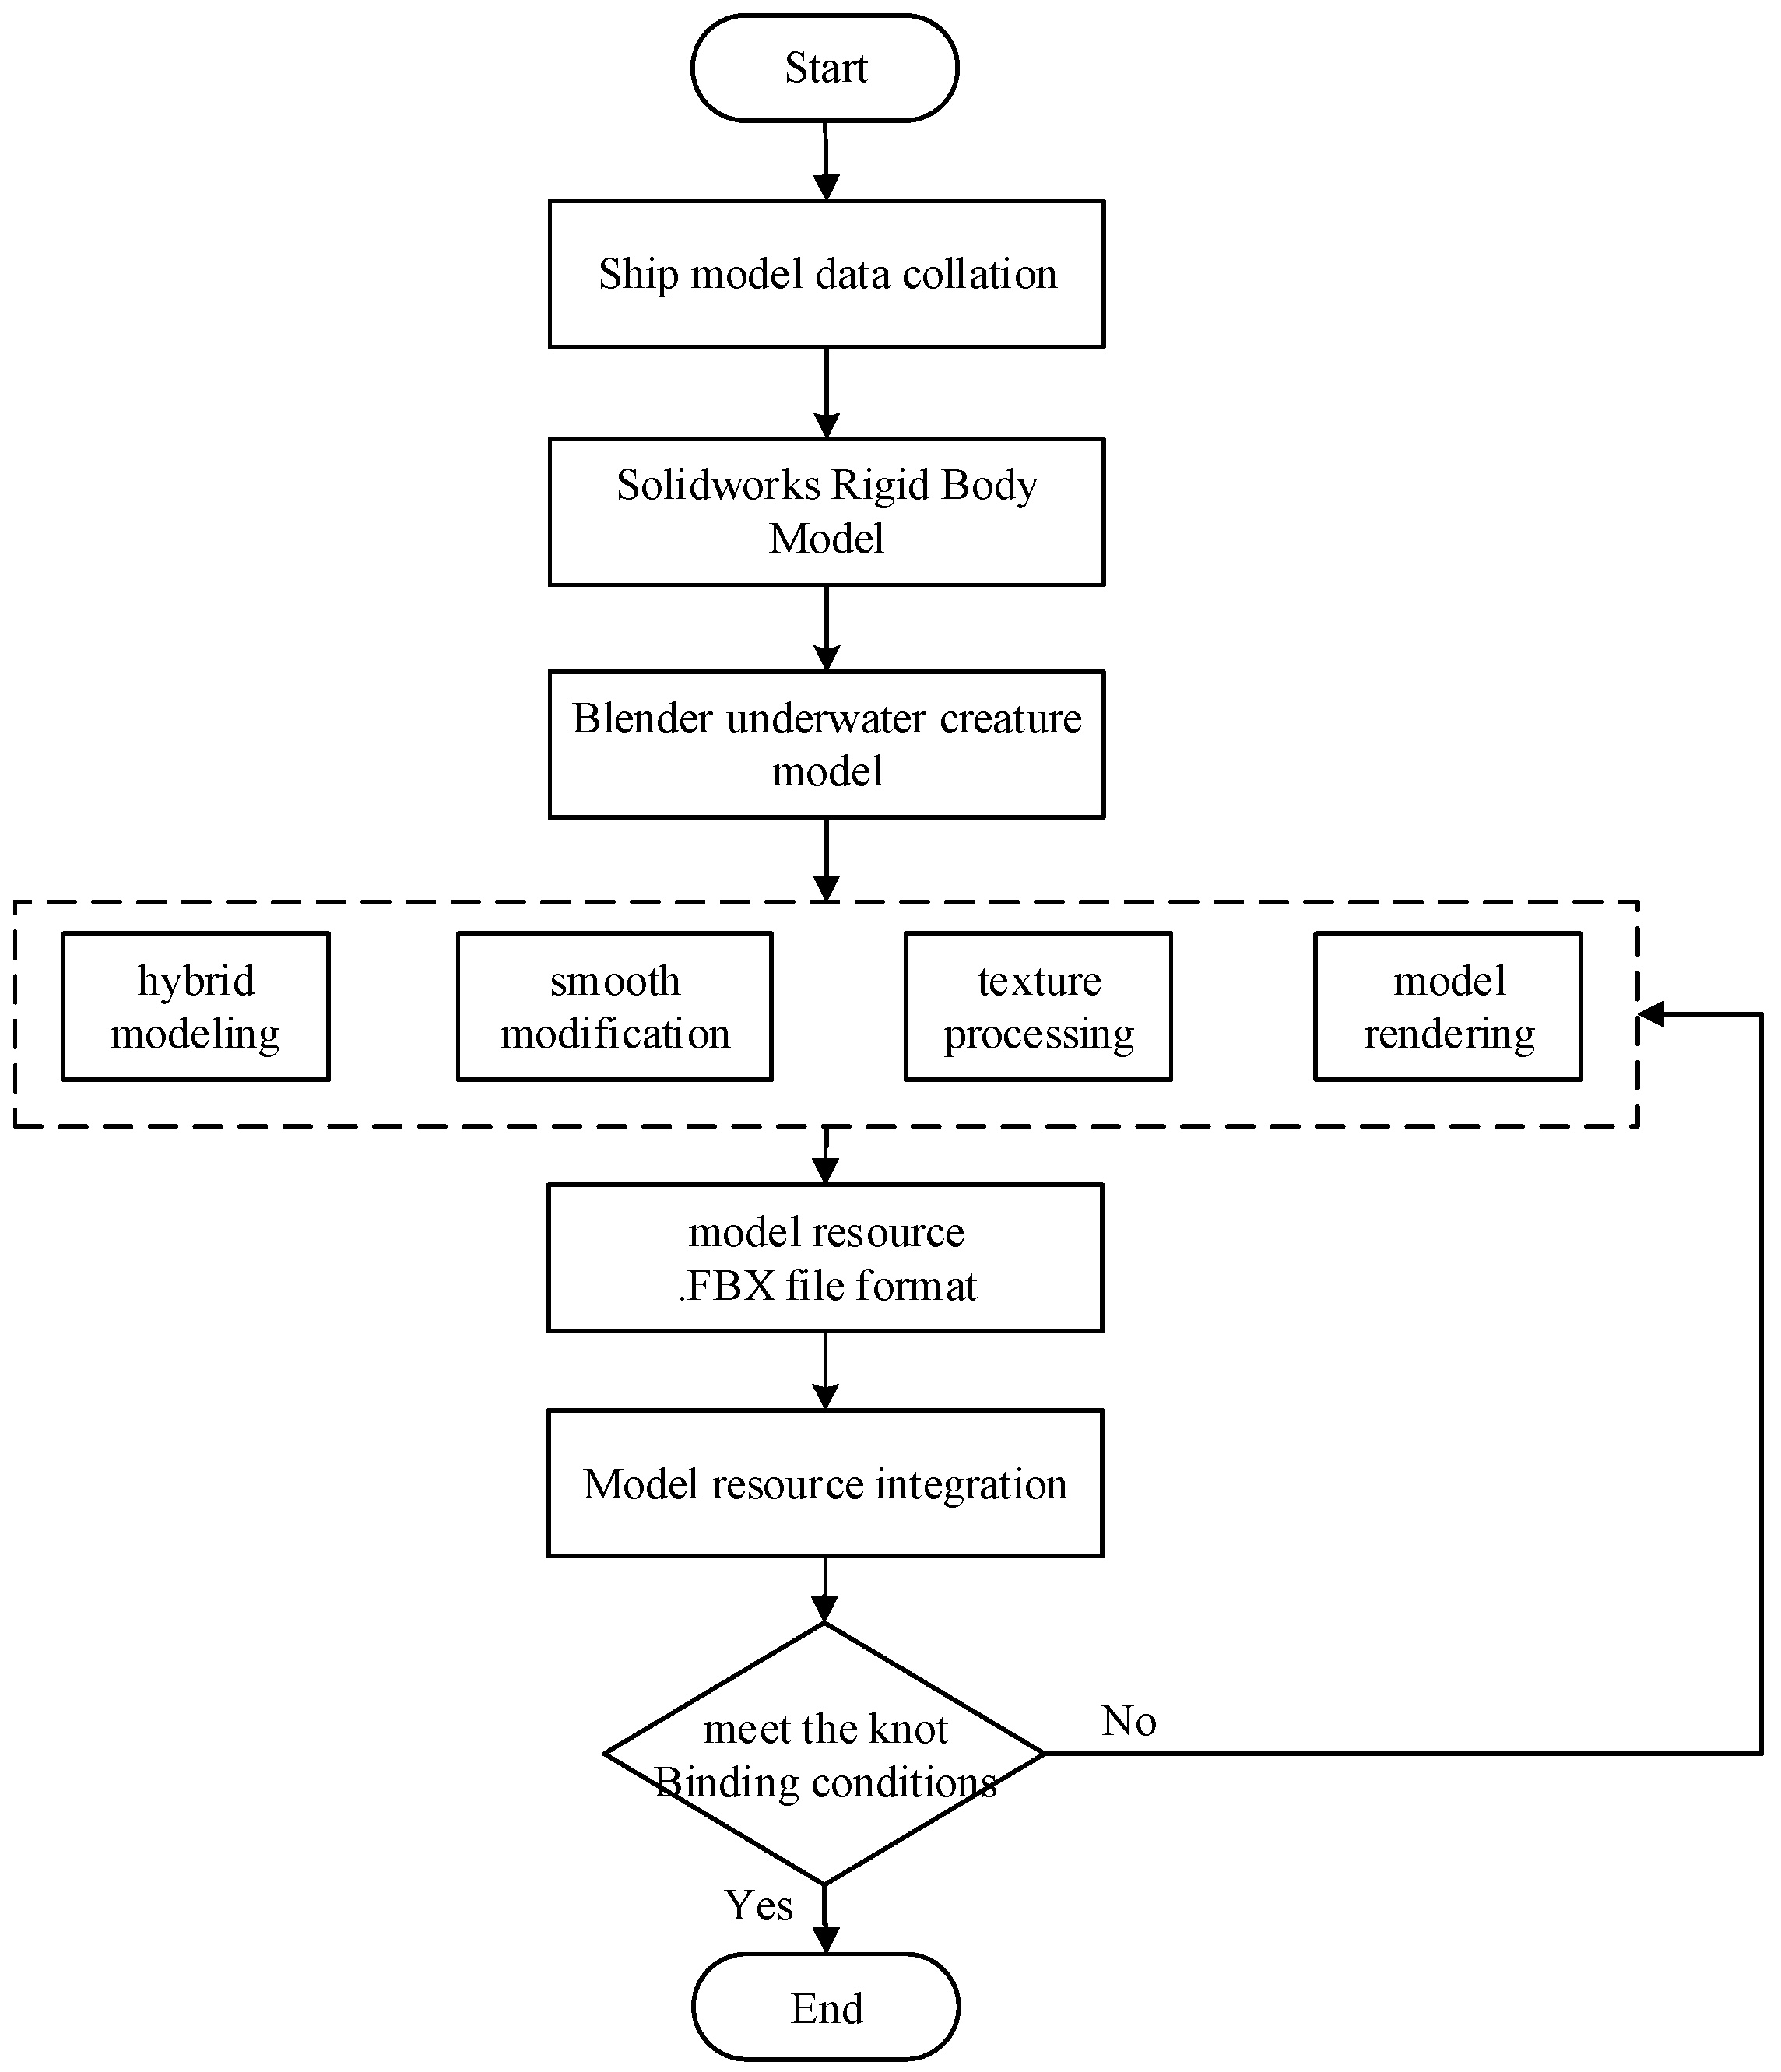
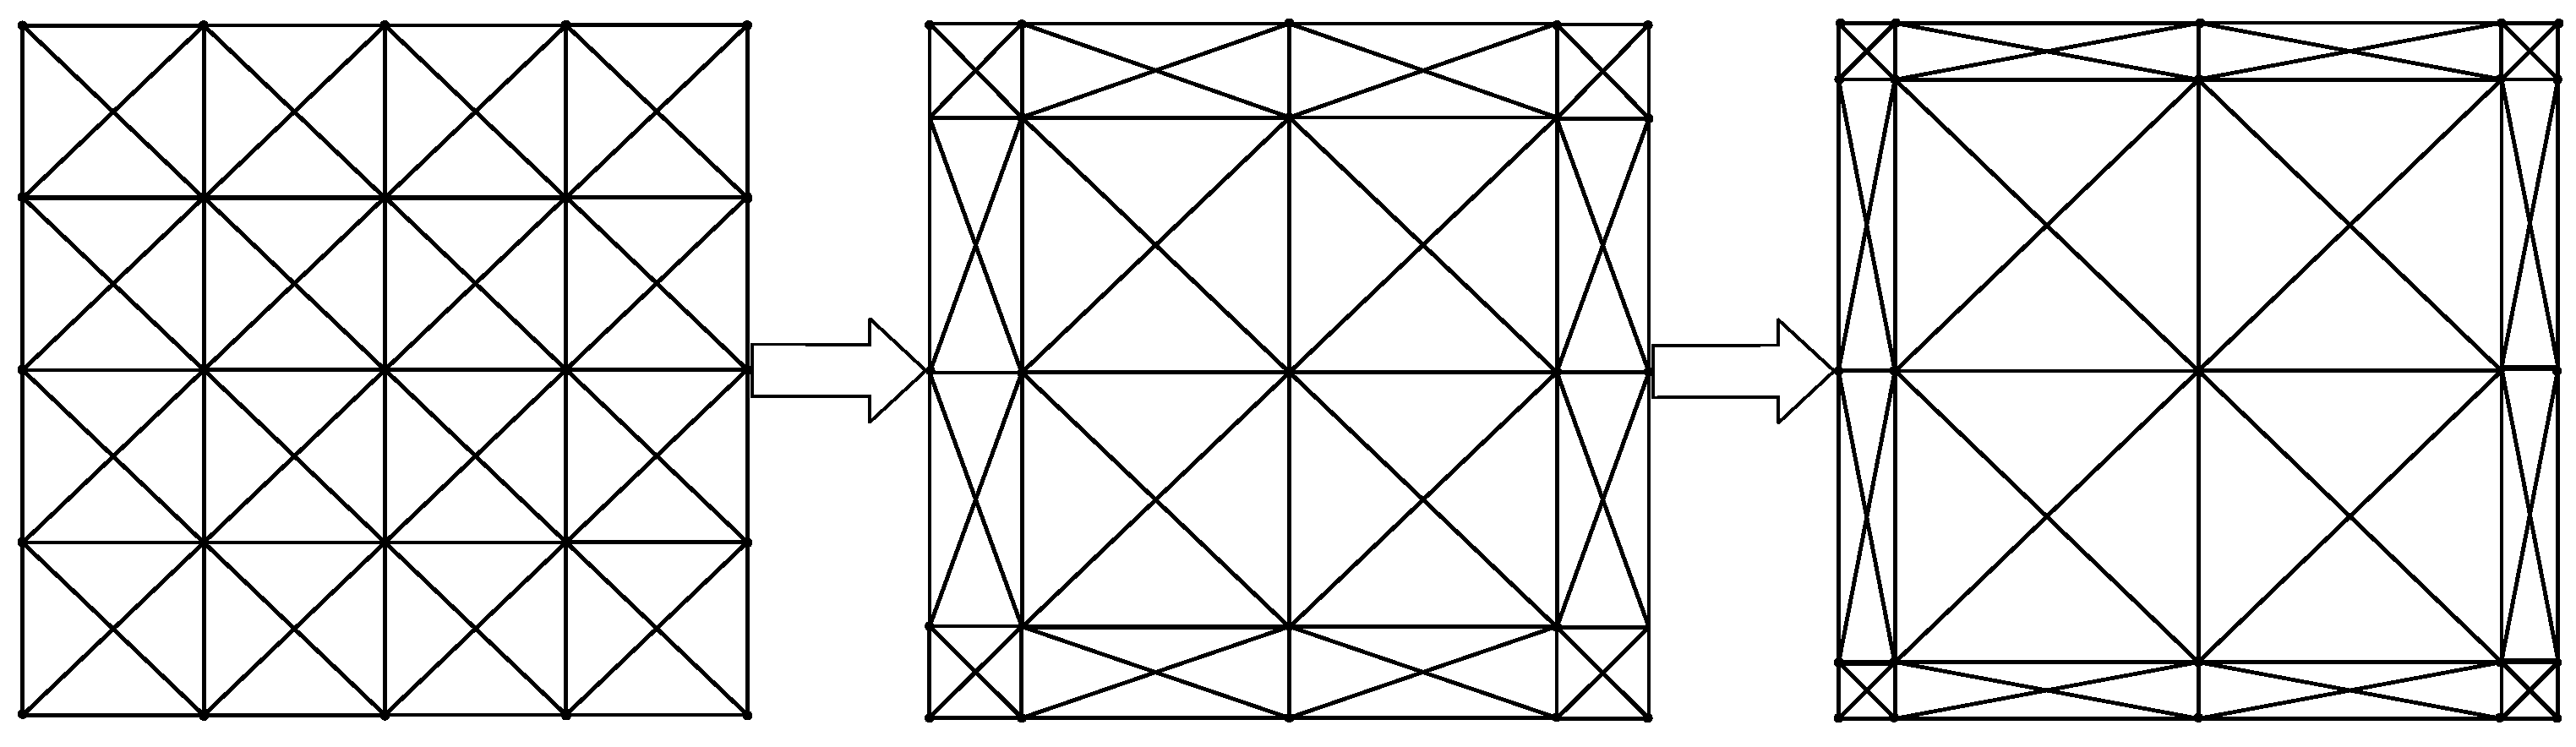
3.3.1. Construction of the Three-Dimensional Virtual Ship Model

Based on the analysis and relevant information of the ship’s system structure, the key components including the ship’s main body, propulsion propellers, and rudder are identified. To enhance realism, the model may also include the superstructure. Using Blender software, each part of the model is drawn according to the actual parameters of the ship. Subsequently, a UV mapping operation is conducted, which involves unfolding the surface of the model into a two-dimensional map to facilitate texture mapping design and application. After completing the UV unwrapping, the data are exported and further refined in Adobe Illustrator 2023 (AI) and Substance 3D Painter 8.3 to meticulously detail the material and texture effects, aiming to accurately reflect the appearance and texture characteristics of each part. Finally, the individual models are assembled and rendered. The models are combined according to the ship’s actual assembly relationships to form a complete ship model, presented with realistic visual effects using high-quality rendering techniques [29]. The process of building the three-dimensional model is illustrated in Figure 7.

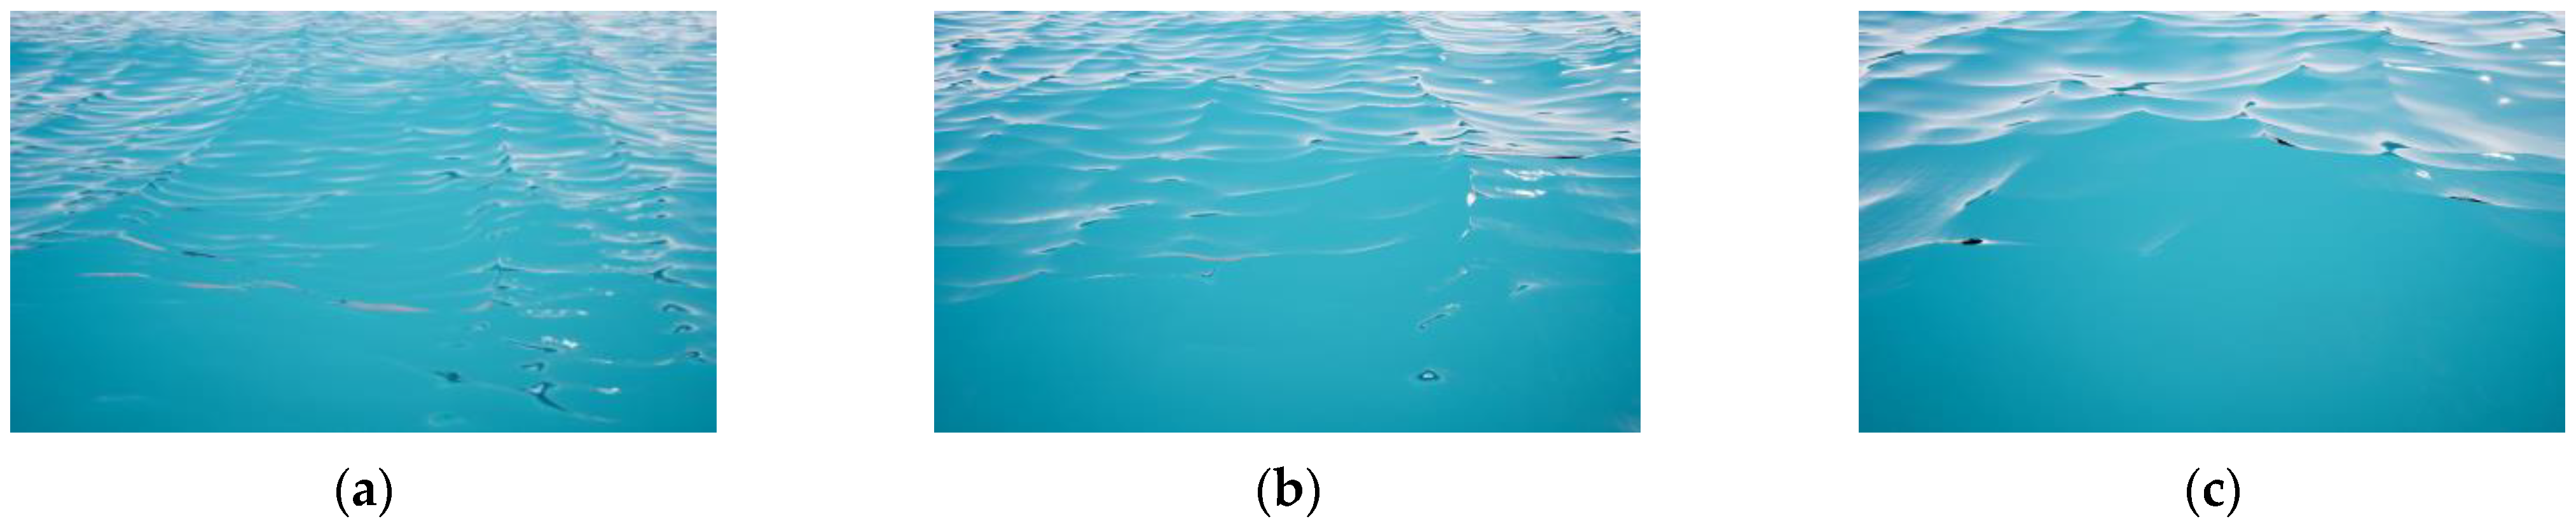
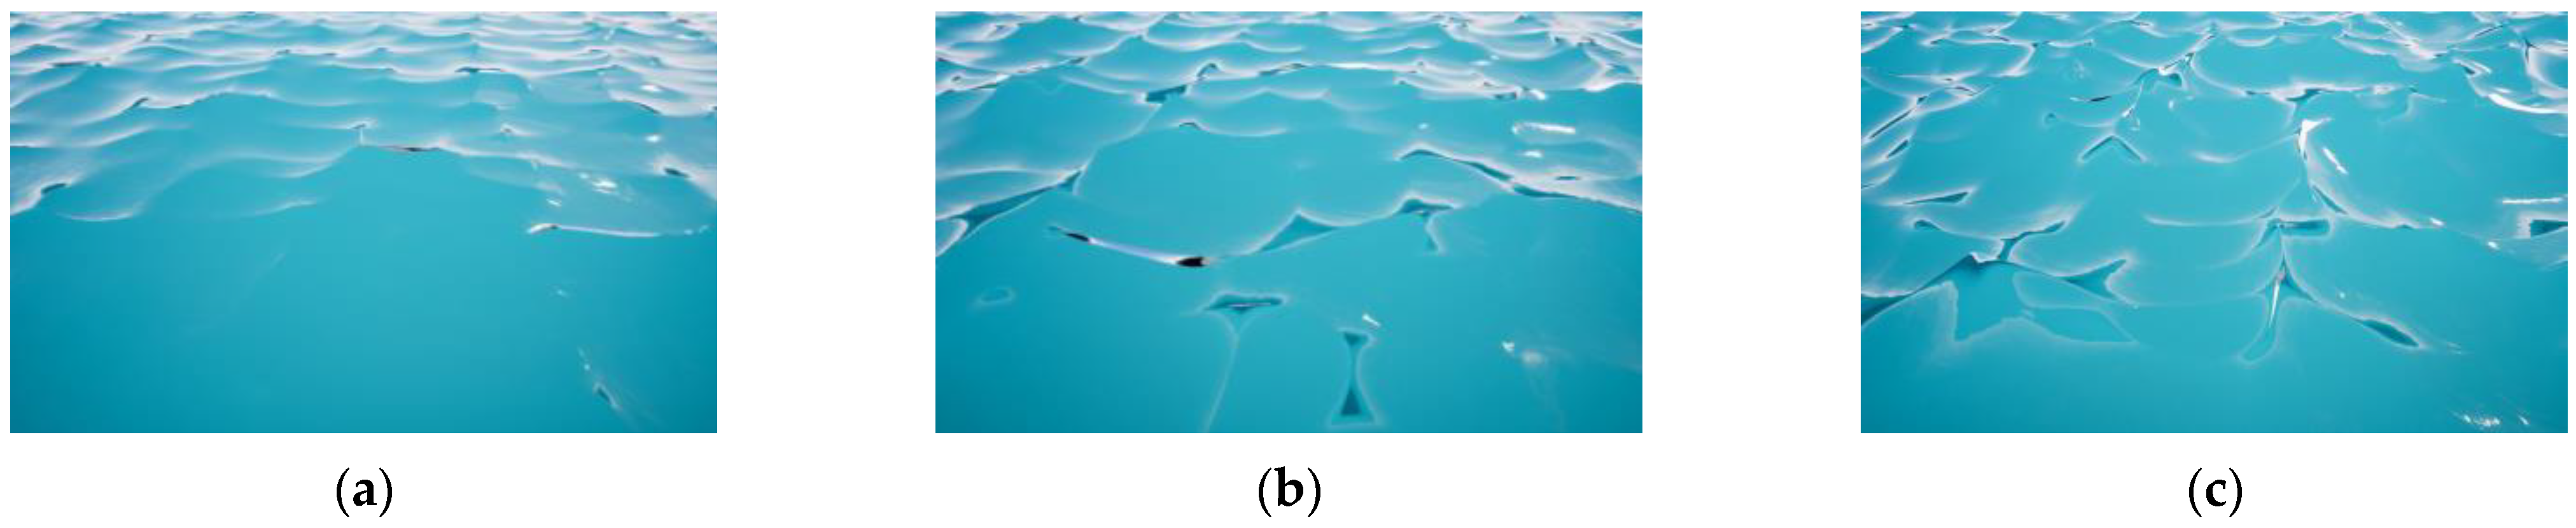
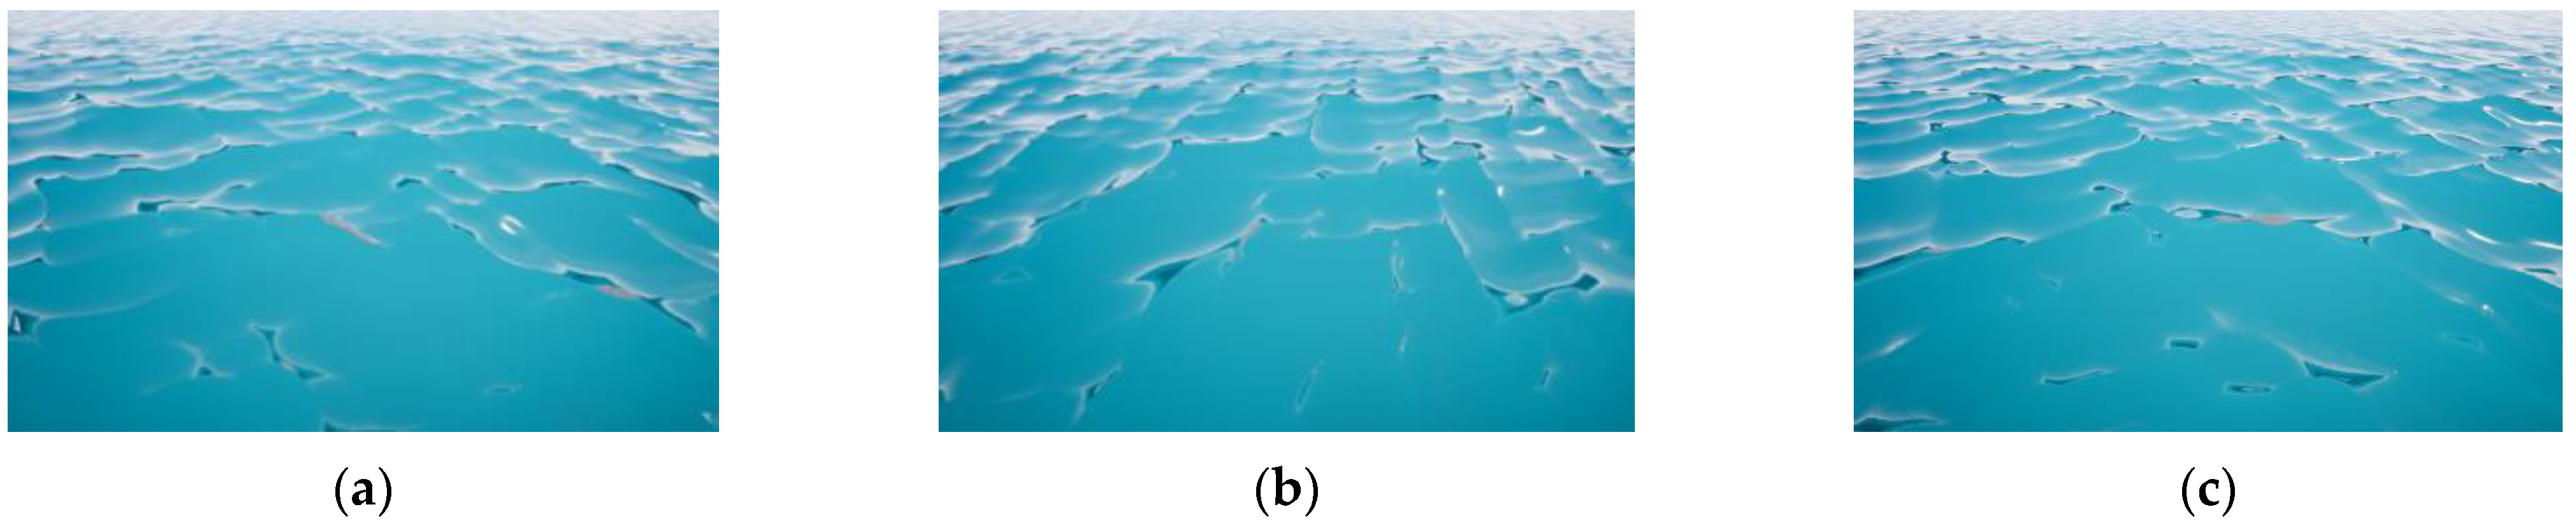
3.3.2. Construction of the Virtual Ocean Environment

The construction of a virtual ocean environment is a crucial step in simulating and testing the navigational performance of vessels. This process encompasses two main aspects: the creation of the virtual ocean terrain and the virtual ocean water body.
(1) Virtual ocean terrain construction
The construction of the virtual ocean terrain aims to accurately reflect the complexities of the seabed, including features such as islands, reefs, and slopes. To address the challenges of complex real-world ocean terrain modeling and low model accuracy reliability, we designed an online rapid construction method for ocean terrain based on electronic nautical charts.
This method stores elevation data in height maps using grayscale images from electronic nautical charts, with black and white values representing terrain elevations. These height data are applied in the terrain system of Unreal Engine, enabling the creation of large worlds through world partitioning and allowing for free scale adjustments [30]. This approach facilitates the rapid creation of a virtual ocean environment that accurately maps real-world ocean terrain, significantly enhancing the system’s practicality.
During the terrain construction process, custom height maps are initially imported. These height maps can be created using terrain generation applications such as Gaea, World Machine, Terragen, or Houdini, or they can be drawn in an image editing application and saved as 16-bit grayscale PNGs. Unreal Engine also supports RAW format height maps with a JSON sidecar file. The import process involves entering the terrain mode, selecting the option to import from a file, and setting the appropriate world partition grid and region size, followed by adjusting the height map file and calculating the Z-axis scale.
Additionally, a real-time terrain update mechanism was introduced, allowing dynamic adjustments to the virtual terrain model based on the latest survey data and marine observation information, reflecting changes in the actual marine environment. The resolution and realism of the terrain model are enhanced through refined mesh and multi-level detail rendering techniques, ensuring rapid and reliable modeling results. The ocean environment modeling process is illustrated in Figure 8.
(2) Construction of virtual ocean water body
Since the dynamics of ocean waves directly impact the vessel’s navigation posture, the virtual environment needs to simulate various wave conditions in real time. This paper employs shading and rendering techniques to achieve realistic water visuals, supporting physical interactions and real-time fluid simulations, significantly enhancing the scene’s realism and immersion. The core of water body construction involves editable water surfaces and materials that affect water appearance and interaction, such as the waves generated by the vessel’s movement and buoyancy. The water surface grid is built based on spline curves, and the Water Zone manages water characteristics (rivers, lakes, oceans, etc.) uniformly, determining rendering quality and detail levels. The Water Zone not only controls surface mesh quality but also sets size limitations for the water body, with special options for the ocean, utilizing splines to define water areas for efficiently rendering visible parts.
Real-time wave dynamics are achieved by traversing the quadtree grid for each frame, rendering only the tiles within the field of view, and applying the LOD strategy based on distance: detailed close-ups and simplified geometry for distant views to enhance efficiency. As shown in Figure 9, the mesh deformation method offers smoother edge transitions and superior visual effects compared to terrain deformation.
An example of the water mesh after LOD processing clearly demonstrates how mesh density adjusts with changes in distance. As the position and viewpoint continuously shift, the mesh graphics follow specific transformation rules, resulting in a refined and seamless dynamic display, as illustrated in Figure 10.
The water system leverages GPU processing to handle wave data, achieving realistic water surface effects through built-in wave simulation modules and preset parameters. The standard configuration employs the Gerstner wave model [31], allowing for adjustments in wave count and randomness, wind direction and angular spread, wave simulation wavelength, steepness, and amplitude. This flexibility accommodates a variety of wave scenarios. The Gerstner wave equation is as follows:
P ( x , y , t ) = x + ( Q i A i D i x cos ( ω i D i ( x , y ) + φ i t ) ) y + ( Q i A i D i x cos ( ω i D i ( x , y ) + φ i t ) ) ( A i sin ( ω i D i ( x , y ) + φ i t ) ) )
where Q i is the wave steepness control parameter, D i represents the wave direction control parameter, and A i denotes the wave amplitude.
In this paper, wave normal mapping is achieved through TBN basis vectors, converting the normals from the tangent space to the object space or world space. This transformation allows for the utilization of high-detail normal information from the normal map during lighting calculations. By computing these vectors, the tangent, bitangent, and normal directions at each point can be determined, resulting in more detailed and realistic surface effects of the water waves. The TBN basis vectors are:
B = 1 Q i × D i x 2 × W A × S ( ) , Q i × D i x × D i y × W A × S ( ) , D i x × W A × C ( )
T = Q i × D i x × D i y × W A × S ( ) , 1 Q i × D i y 2 × W A × S ( ) , D i y × W A × C ( )
N = D i x × W A × C ( ) , D i y × W A × C ( ) , 1 D i × W A × S ( )
where B represents the bitangent, T denotes the tangent, and N stands for the normal, C ( ) = cos w i × D i + φ i t , S ( ) = sin w i × D i + φ i t , W A = w i × A i .
The motion of ocean waves exhibits inherent randomness. Therefore, in simulating wave dynamics, multiple Gerstner waves with varying directions and parameters can be superimposed to achieve a more realistic representation. Notably, in practical scenarios where Gerstner wave simulations are employed, both the CPU and GPU can share the same wave data resources. This eliminates the need to prepare separate wave resources and perform complex data synchronization for each, thereby enhancing overall operational efficiency and performance.

4. Results and Analysis

To comprehensively validate the effectiveness of the proposed virtual simulation system and path planning method, a series of systematic experiments and demonstrations were designed. The validation analysis is divided into two main components: numerical simulation and virtual system testing. Through numerical simulation, we assessed the accuracy of the roll motion solution and verified the superiority of the route optimization objective constraint model in terms of safety and traditional constraints. Virtual system testing allowed us to evaluate the realism and performance of the virtual ocean terrain construction and water body simulation.

4.1. Numerical Computation Platform Testing and Validation

4.1.1. Preparation of Roll Data

To validate the performance of the RBF neural network proposed in this paper for roll motion computation, roll data of the target vessel are essential for system training and validation. However, due to limitations in acquiring substantial real-world roll data, we established a ship roll dynamics model in MATLAB. This model simulates the roll motion under various sea conditions, including different wave directions, wave heights, wind directions, and wind speeds. The roll results obtained through numerical simulation serve as the training and testing sets for the RBF neural network model, facilitating the rapid computation of ship roll motion.
The roll motion of the ship can be described using a linear dynamic equation, which is given by:
I ϕ ϕ ¨ + B ϕ ˙ + C ϕ = F e x t e r n a l
where I ϕ is the moment of inertia of the ship’s roll motion, B is the damping coefficient, C is the restoring coefficient, ϕ is the roll angle, and F e x t e r n a l is the external moment, which includes moments caused by waves, wind, and other forces. This equation describes the roll motion of the ship under external disturbances such as waves and wind. By numerically solving this equation, we can simulate the roll behavior of the ship under various sea conditions.
To simulate various sea conditions, it is essential to define relevant environmental parameters, including wave direction, wave height, wind direction, and wind speed. These parameters are utilized to generate wave moments and wind moments. The wave moments and wind moments can be expressed as follows:
F w a v e ( t ) = A w a v e sin ( ω w a v e t + θ w a v e ) F w i n d ( t ) = A w i n d sin ( ω w i n d t + θ w i n d )
where A w a v e and A w i n d represent the amplitudes of the wave and wind forces, respectively, ω w a v e and ω w i n d denote the frequencies of the wave and wind forces, respectively, and θ w a v e and θ w i n d are the phase angles of the wave and wind forces, respectively.
In this paper, to comprehensively evaluate the performance of the RBF neural network in roll motion calculation, we designed and prepared a comprehensive dataset encompassing various sea state parameters. Specifically, the parameters for wave direction, wave height, wind direction, and wind speed were ranged and distributed as follows:
  • The range of wave direction is from 0° to 360°, with values taken at every 30°, resulting in 12 sampling points.;
  • The wave height ranges from 0.5 m to 5 m, with values taken at every 0.5 m, resulting in 10 sampling points;
  • The wind direction ranges from 0° to 360°, with values taken at every 45°, resulting in 8 sampling points;
  • The wind speed ranges from 2 m/s to 12 m/s, with values taken at every 1 m/s, resulting in 10 sampling points.
The above parameter combinations generate a total of 9600 distinct simulation scenarios. Each scenario undergoes numerical simulation using the ship dynamics model in MATLAB, simulating the maximum roll angle of the vessel under different sea conditions. These simulation results are used to construct both the training and testing datasets. Specifically, 70% (approximately 6720 scenarios) are used as the training set to train the RBF neural network, while the remaining 30% (approximately 2880 scenarios) are designated as the testing set to validate the model’s performance. Through this systematic experimental design and dataset preparation, we are able to comprehensively assess and verify the RBF neural network’s capability to predict ship roll motion under complex sea conditions, ensuring the model’s reliability and generalization capability.

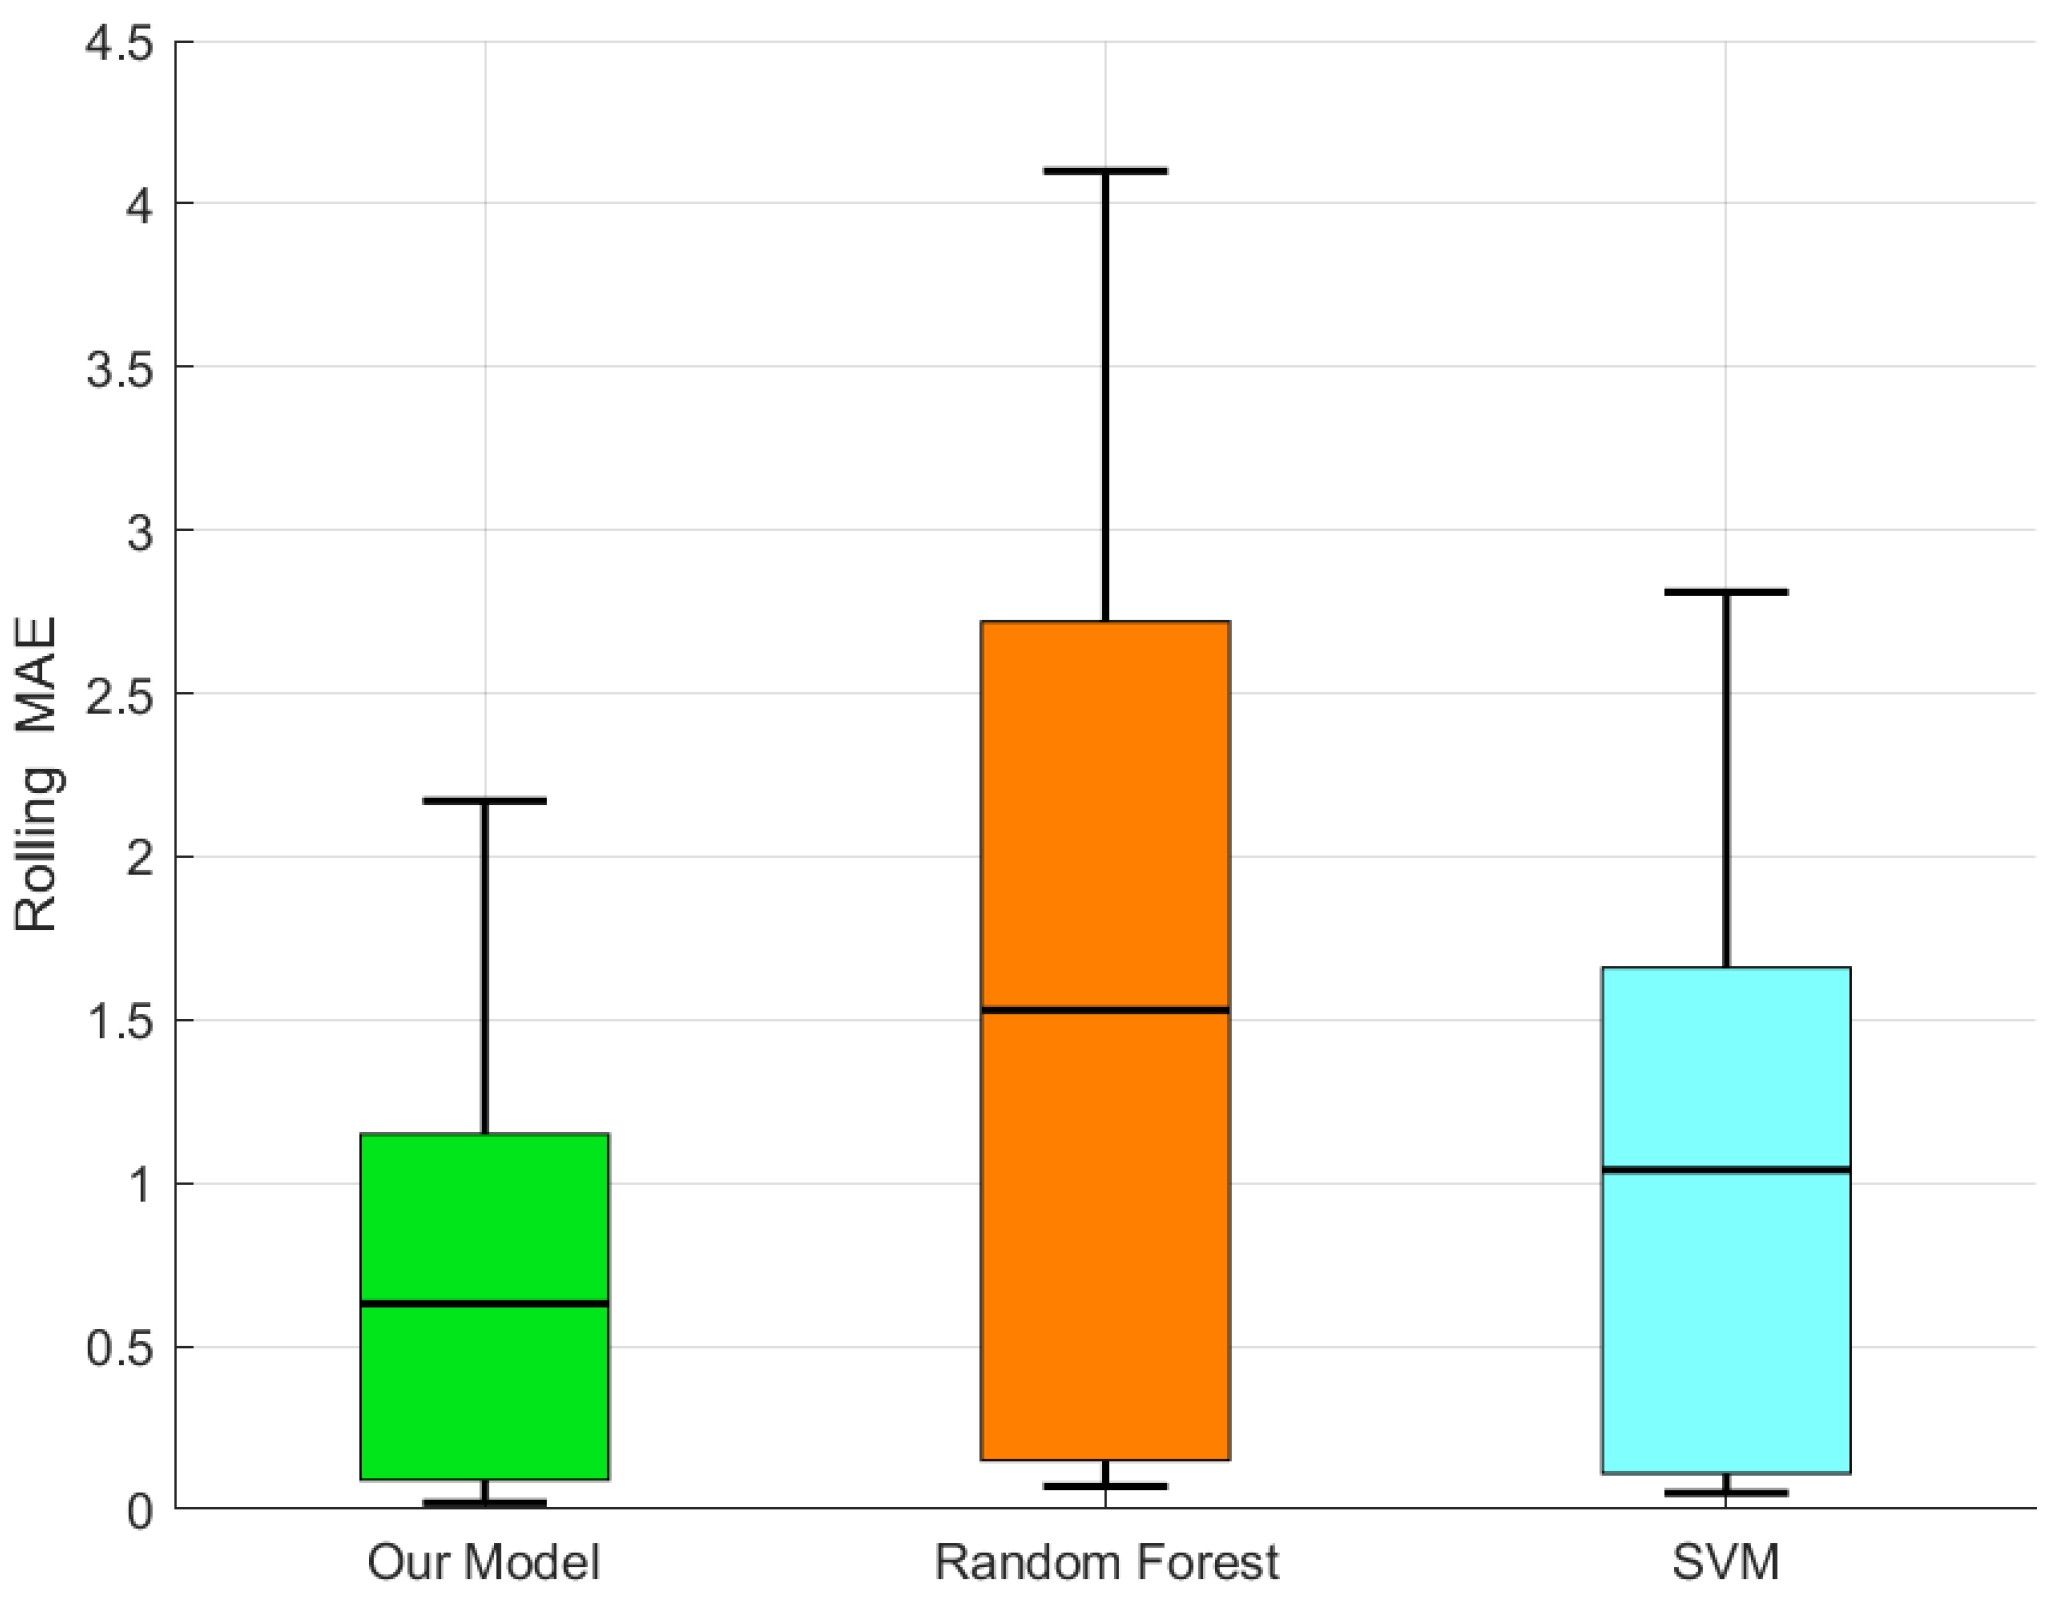
4.1.2. Testing and Analysis of Rapid Roll Motion Calculation for Ships

In this Section, we evaluate the effectiveness of the RBF neural network model proposed in this paper using the dataset prepared in the previous Section. All simulations were conducted on a system with a 2.26 GHz CPU, 16 GB RAM, and a 64-bit Windows 10 operating system. During the entire simulation process, the K-means clustering algorithm was used to determine the center vectors of the hidden layer nodes, the weights connecting the input data to the hidden layer nodes were randomly selected between −1 and 1, and the Gaussian function was chosen as the radial basis function. Data were provided to the model at 1 s intervals. The model consumed the first 6720 samples’ data to complete the initialization training phase, with the remaining samples provided to the network for one-step-ahead prediction testing. For comparison purposes, this paper also employed Random Forest and Support Vector Machine methods to predict the same test set, evaluating model performance using Mean Absolute Error (MAE) and Root Mean Square Error (RMSE), with the expressions as follows:
M A E = 1 N i = 1 N y i y i ^ × 100 % R M S E = i = 1 N ( y i y i ^ ) 2 N
where N represents the number of test samples, y i denotes the true value of the test samples, and y i ^ signifies the algorithm’s test results.
To evaluate the performance of the model, we conducted a statistical analysis of the results obtained from the test set using different methods. A box plot was employed to display the MAE of roll angle predictions, as illustrated in Figure 11. Table 2 summarizes the comparative results of different models, including the performance of the RBF neural network, random forest, and support vector machine, in terms of MAE and RMSE.
As indicated in Table 2, the RBF neural network model demonstrates exceptional performance in predicting the roll angle of ships, with an MAE of 0.56 and an RMSE of 0.412, both being the lowest among all tested models. In comparison, the random forest algorithm has an MAE of 1.52 and an RMSE of 0.790, while the support vector machine’s MAE and RMSE are 1.08 and 0.531, respectively. These figures clearly illustrate that the RBF neural network significantly outperforms both the random forest and support vector machine models in terms of prediction accuracy and stability. Firstly, the low MAE value of the RBF neural network indicates that the model can provide predictions that are closer to the actual values in most cases, showcasing its higher accuracy. An MAE of 0.56 implies that the average absolute error between the predicted and actual values is only 0.56 degrees, which is a very small margin in practical applications, demonstrating the high precision of the RBF neural network in addressing the roll angle prediction problem. Secondly, the analysis of RMSE values further supports this conclusion. The RBF neural network’s RMSE of 0.412 suggests a lower variance in prediction errors, indicating higher stability in its predictions. In contrast, the RMSE values for the random forest and support vector machine models are 0.790 and 0.531, respectively. These higher values suggest that their prediction results may exhibit larger deviations in certain cases, thereby affecting the stability and reliability of their predictions.
The experimental results further demonstrate that the RBF neural network model can accurately predict ship roll angles in complex sea conditions. Its nonlinear mapping capability and excellent generalization performance enable it to maintain high prediction accuracy and stability in variable marine environments, thus providing robust support for the subsequent ship route optimization objective constraint model that considers ship stability.

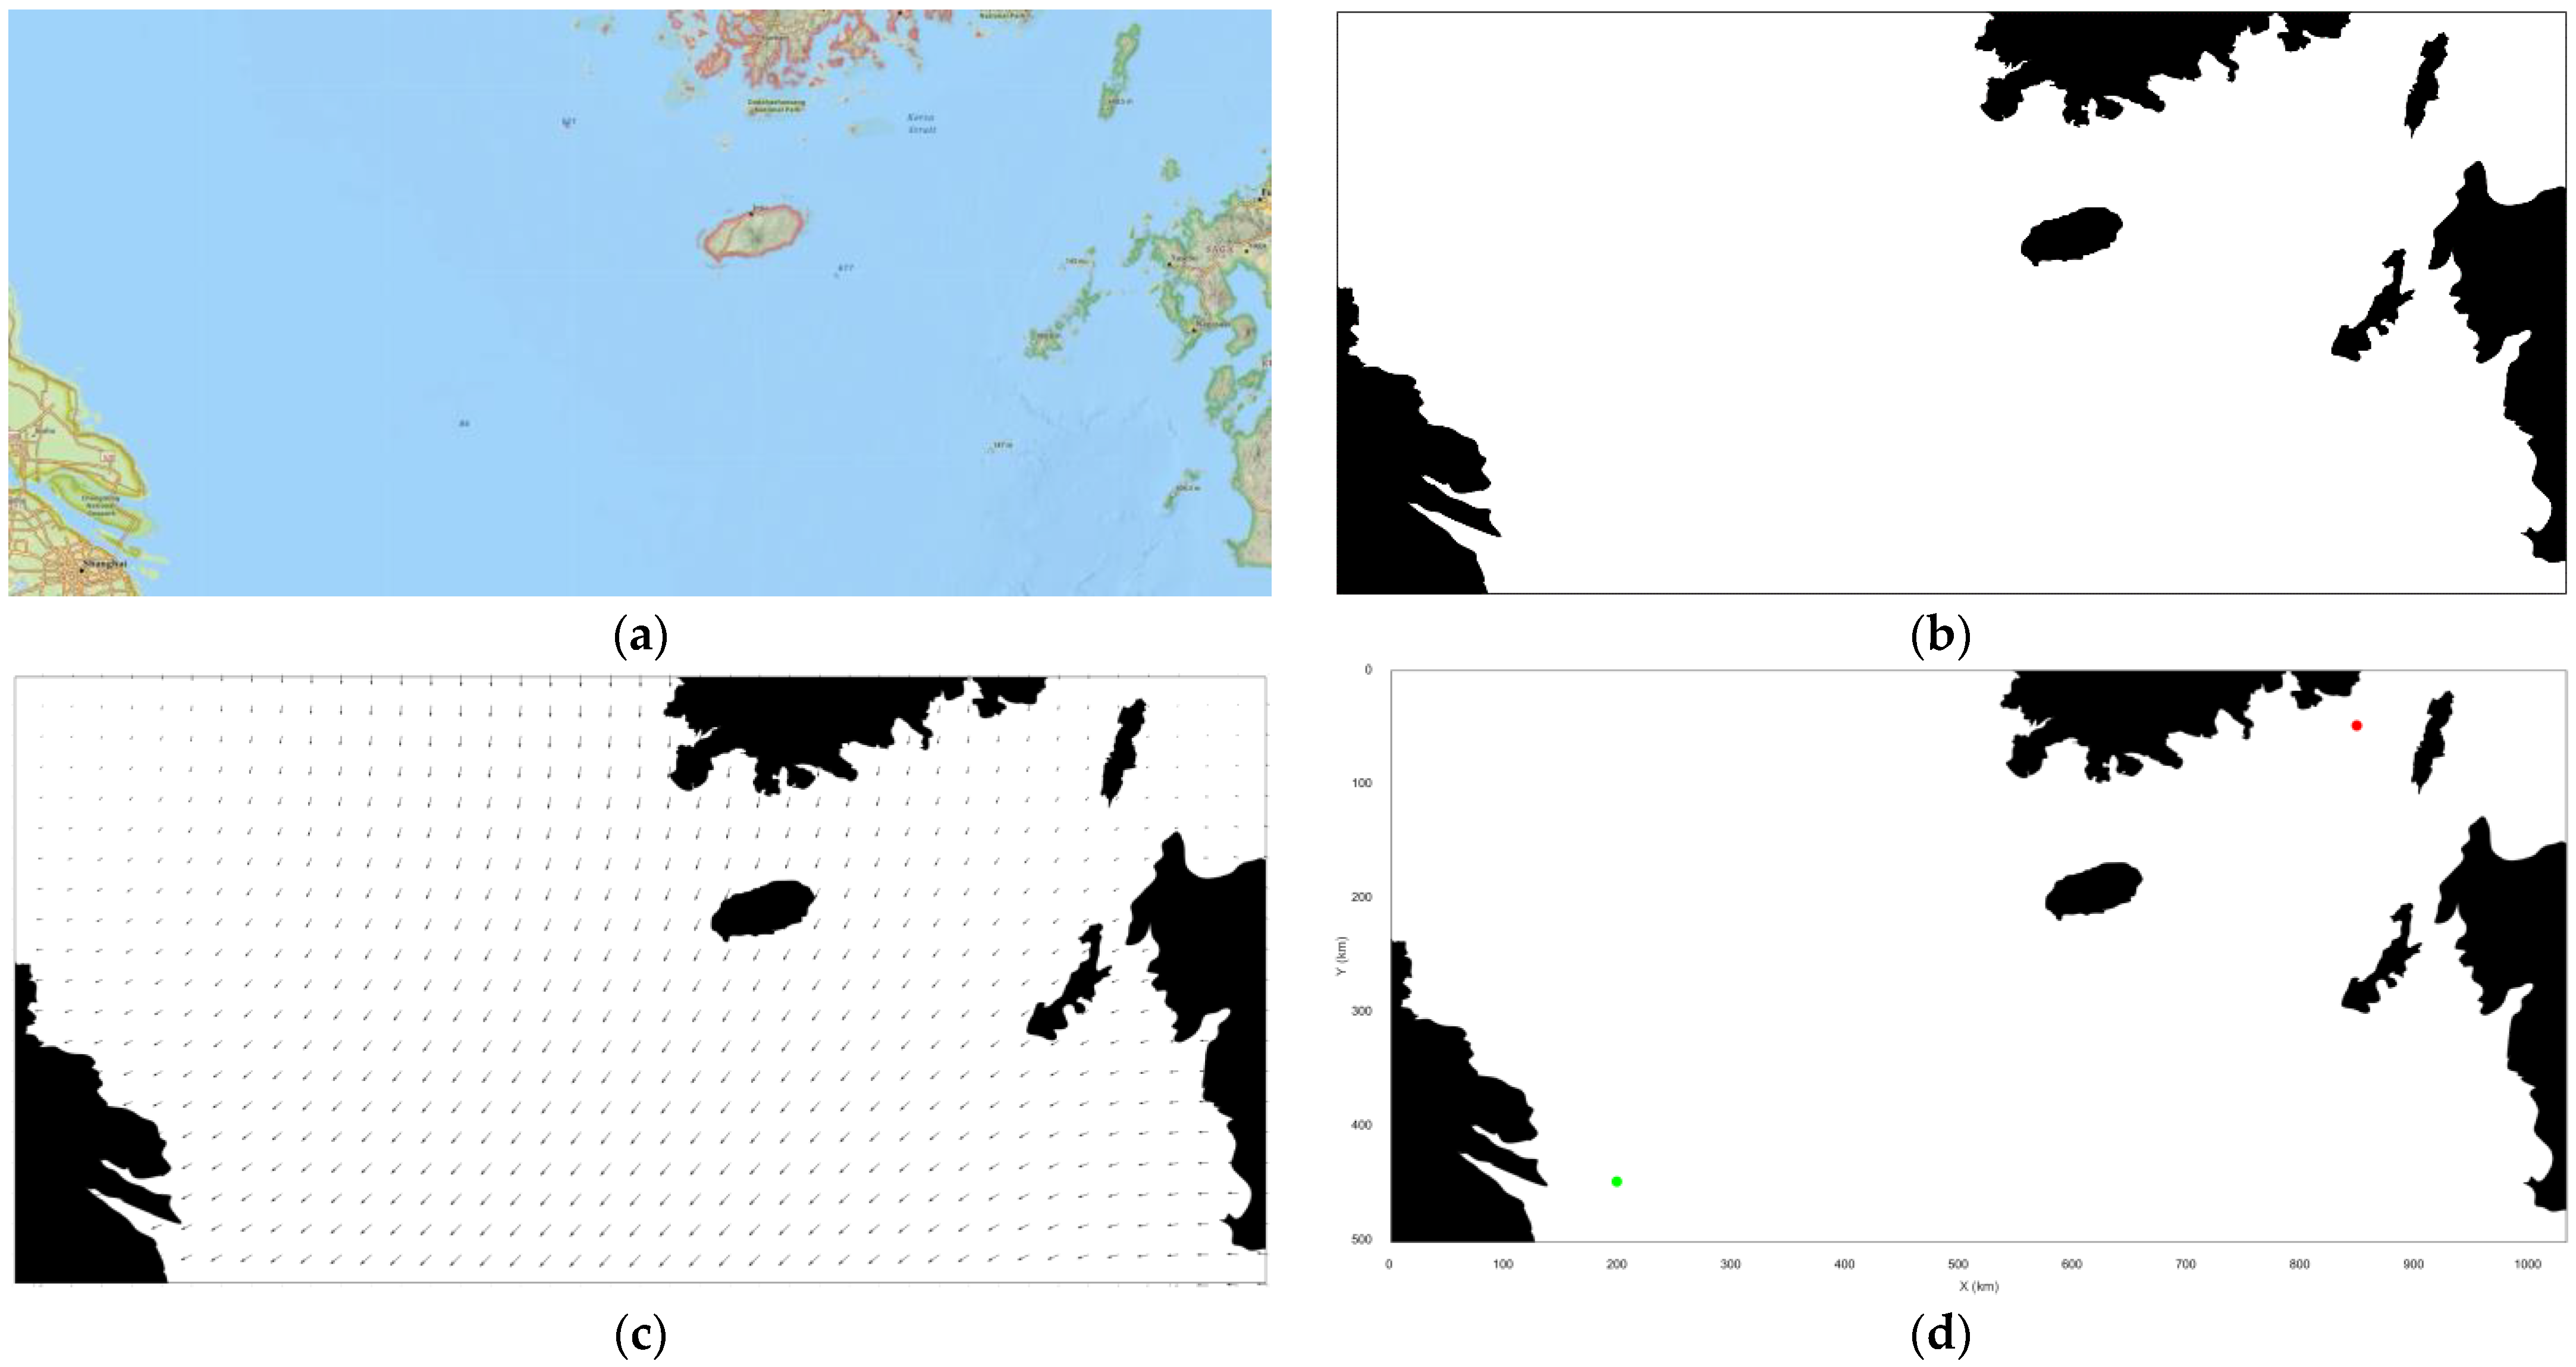
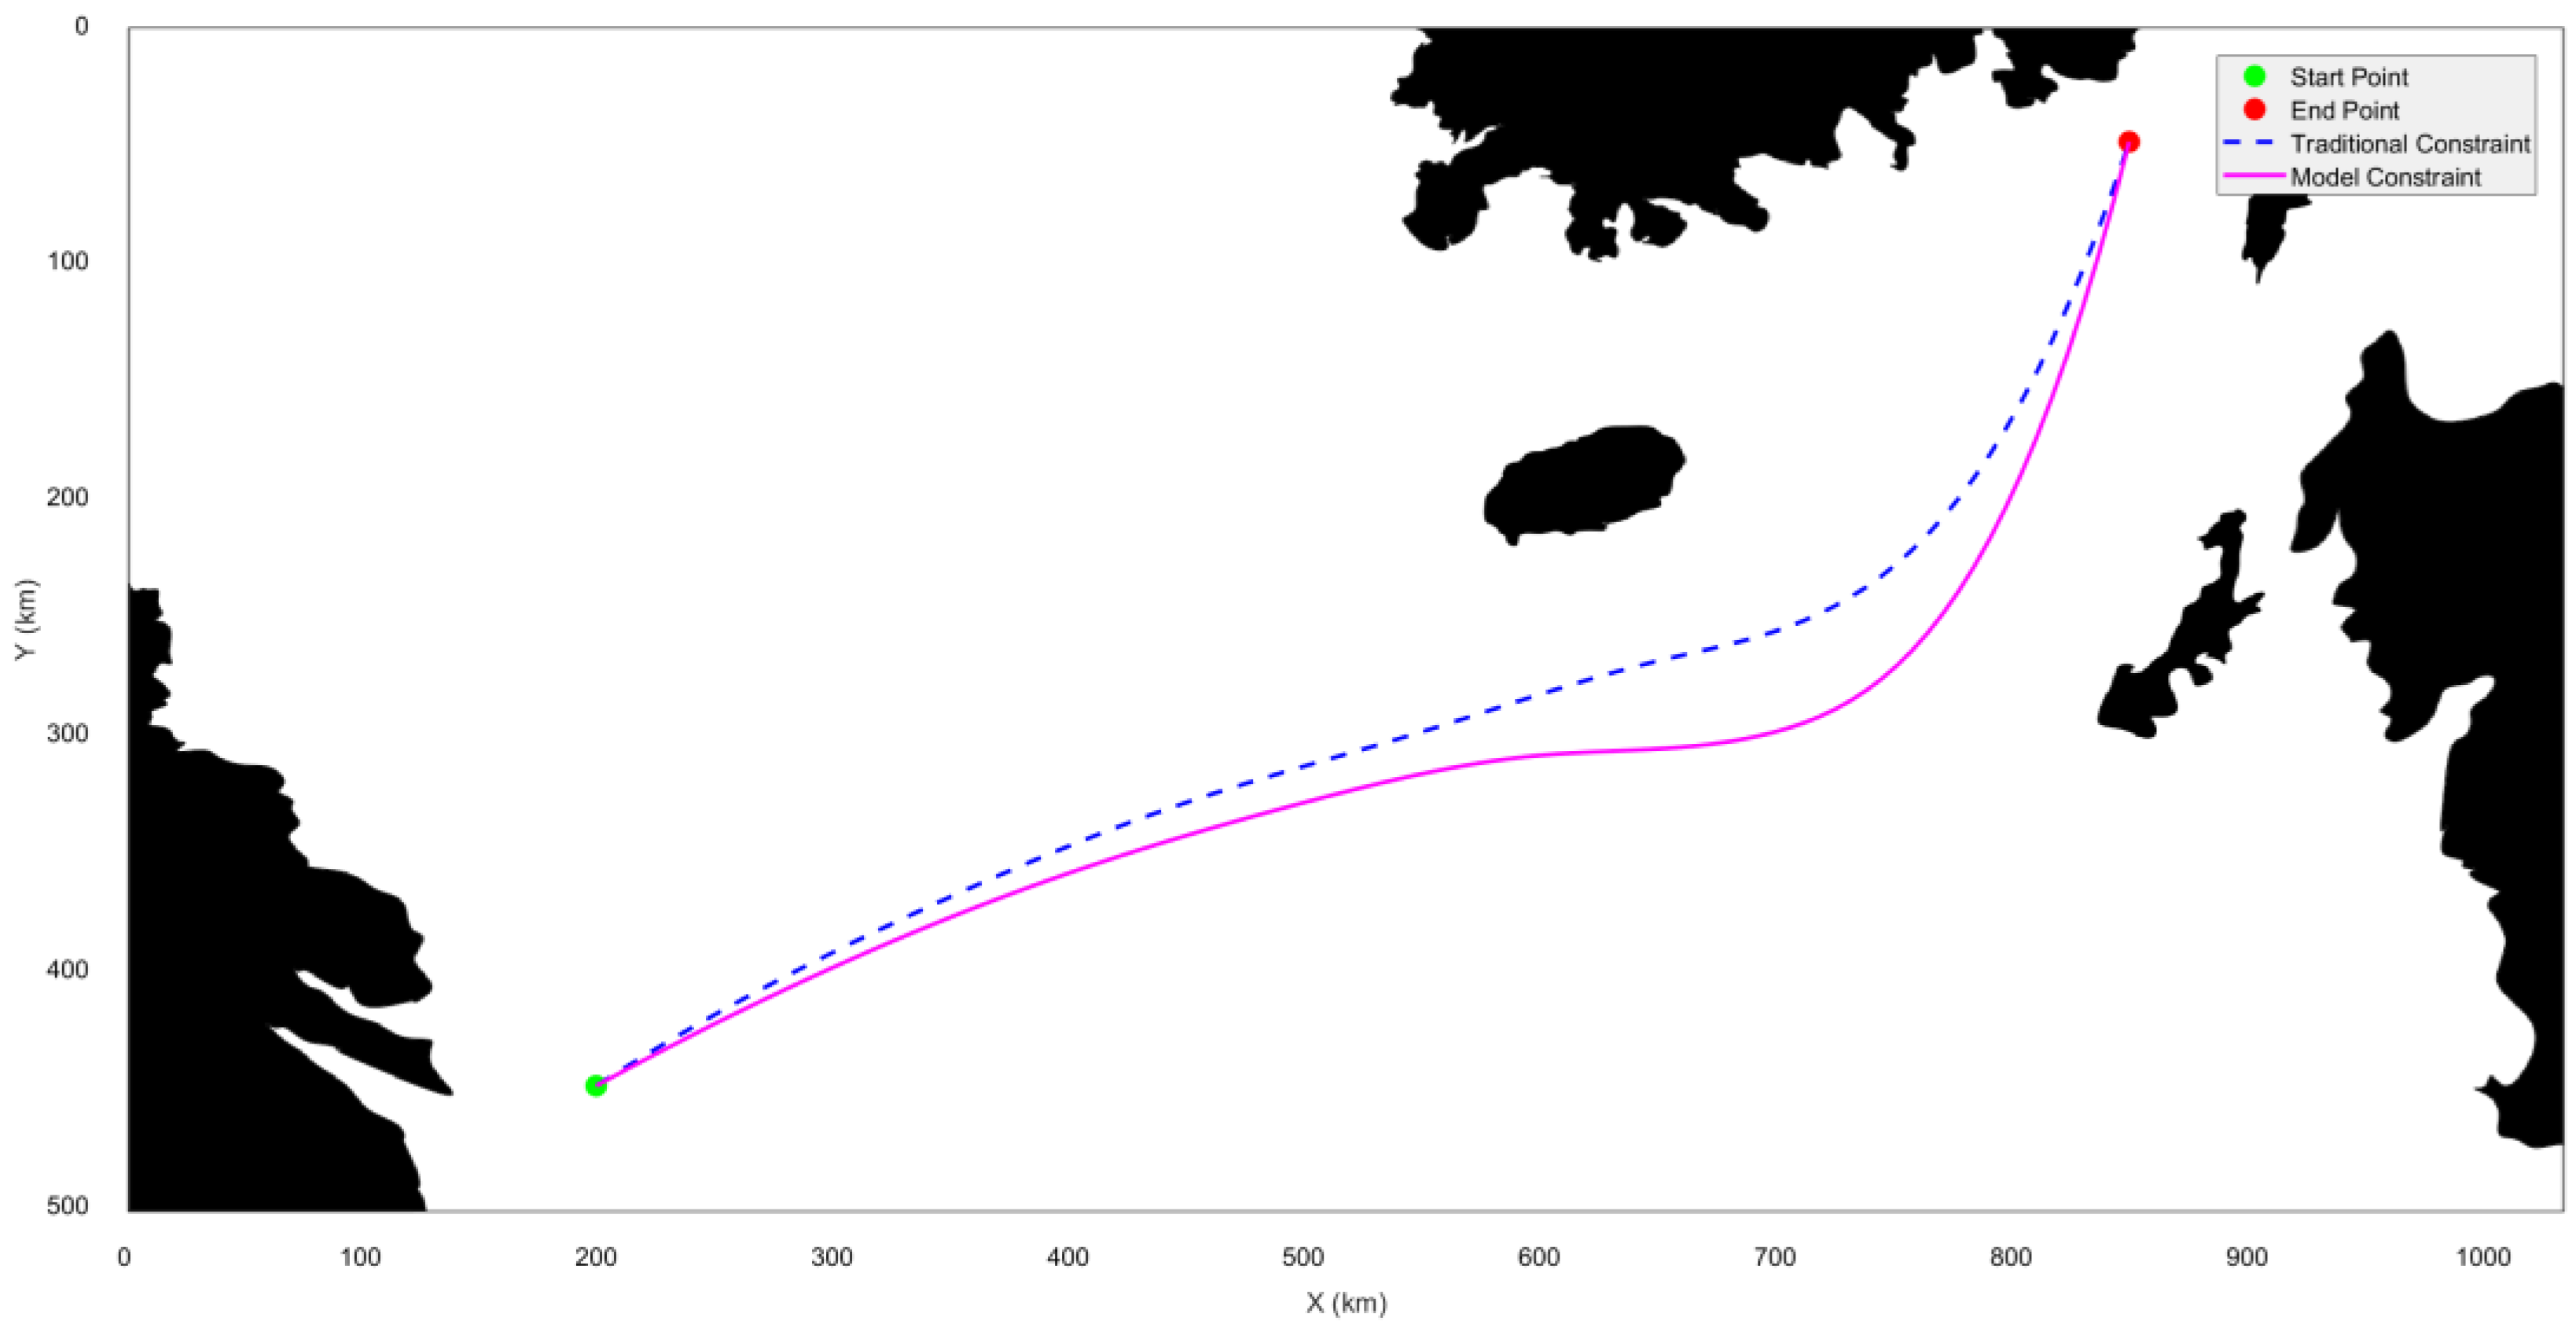
4.1.3. Verification of Ship Route Optimization Planning

In this paper, we optimized traditional route constraints by considering the impact of environmental disturbances on vessel stability and adhering to the requirements and regulations of ship route planning. Consequently, we established an objective constraint model for route optimization under maritime environmental disturbances and utilized the particle swarm algorithm in conjunction with this model to achieve global path planning. To further verify the stability, effectiveness, and reliability of the ship route optimization method, we conducted simulation experiments on the ship’s obstacle avoidance decision-making and path planning algorithm.
To validate the effectiveness of the proposed route optimization objective constraint model, key maritime meteorological conditions were first identified for the experimental setup. The meteorological data utilized in this paper were sourced from the European Centre for Medium-Range Weather Forecasts (ECMWF), specifically the ERA5 reanalysis dataset, which encompasses meteorological variables from 1979 to the present, including temperature, humidity, wind speed, precipitation, and cloud cover. Based on the obtained sea-state information, these data were matched with electronic nautical charts. The map rendering was accomplished using the Cartopy package, an open-source Python library developed by the UK Met Office for geospatial data processing, map generation, and other geospatial data analyses. Subsequently, the images were binarized, with black indicating navigable areas and white indicating non-navigable areas. The edges of the obstacles were then detected for subsequent calculations, as illustrated in Figure 12b.
Based on the actual selected spatial range under the Mercator projection, which spans 1036 km by 505 km, corresponding to a map image of 2387 by 1135 pixels, each horizontal pixel represents 0.434 km and each vertical pixel represents 0.445 km. The starting coordinates are set at (200, 450) and the ending coordinates at (850, 50). The blue dot indicates the starting point, and the red dot indicates the ending point, as shown in Figure 12d.
The experimental procedure involves initializing the experimental scenario and conditions, setting the starting and target points, testing both the traditional path planning constraint model and the model proposed in this paper, calculating the optimal path, and recording and comparing the performance of the two methods in terms of path length, obstacle avoidance effectiveness, and navigation stability. Statistical analysis is then conducted on the experimental results.
In configuring the parameters for the particle swarm optimization algorithm, we set the number of particles to 50, the maximum number of iterations to 1000, the inertia weight to 0.5, and both the cognitive and social coefficients to 1.5. The search space encompasses the two-dimensional plane area of the experimental scenario. For the traditional path planning algorithm, constraints include minimizing path length and maintaining a safe distance between the vessel and obstacles. The objective function is:
F t r a d i t i o n a l ( X ) = α L + β d
where L represents the path length, d denotes the safety distance from obstacles, and α and β are the weight coefficients.
The path points planned by the Particle Swarm Optimization algorithm need to be interpolated to generate a smooth and continuous curve. Unlike the method of connecting path points with straight lines, interpolation produces a curve that better aligns with the changes in speed and acceleration during the ship’s navigation. In this paper, we choose Bezier curves for interpolation smoothing. A Bezier curve is a parametric curve based on control points, defined in either two-dimensional or three-dimensional space, which generates a smooth curve. It possesses favorable mathematical properties, being continuous and differentiable at the control points. By adjusting these control points, one can precisely control the shape and trajectory of the curve, thereby creating various smooth curve effects. Based on this, we conducted tests, and Figure 13 illustrates the planning results using both the traditional path planning constraint model and the proposed model. Table 3 summarizes the comparative results of different models.
The experimental results reveal that the optimized constraint model demonstrates advantages in overall smoothness and path length. The sailing distance generated by the traditional constraint model is 434.15 nautical miles, while the optimized constraint model produces a path length of 449.06 nautical miles, slightly increasing the distance. This increase is due to the optimized constraint model’s consideration of more complex factors encountered during actual navigation, such as the impact of sea conditions on ship rolling. Consequently, this model avoids potentially hazardous areas during path planning, enhancing both the safety and stability of the voyage.
Table 3 summarizes the comparative results of different models, including sailing distance, maximum roll angle, and average roll angle. The average testing times for the improved model and the traditional model are 14.6 s and 13.2 s, respectively. The increased computational complexity of the stability cost function accounts for the slightly slower performance of the improved model compared to the traditional model. The maximum roll angle for the traditional constraint model is 4.62 degrees, with an average roll angle of 3.50 degrees. In contrast, the optimized constraint model shows a maximum roll angle of 3.85 degrees and an average roll angle of 3.13 degrees. Furthermore, comparative validation tests conducted on 14 sets of sea conditions and marine maps reveal that the proposed method results in a 4.60% increase in sailing distance but achieves a 14.31% reduction in average roll angle. This indicates that under complex sea conditions, the optimized constraint model significantly outperforms the traditional constraint model in terms of roll angle, effectively reducing ship roll and thereby enhancing the stability and comfort of the voyage.
In summary, the optimized constraint model proposed in this paper demonstrates superior performance in terms of safety and vessel stability in ship route planning compared to the traditional constraint model, though it shows a slightly poorer performance in terms of sailing distance. The optimized constraint model is more adept at handling complex sea conditions, reducing ship roll, and enhancing sailing comfort and safety. This provides a more reliable route-planning solution for the autonomous navigation of specialized ships or missions.

4.2. Validation of the Virtual Simulation Platform

This Section aims to validate the performance and effectiveness of the proposed virtual simulation platform in ship route planning and navigation through a series of detailed tests. These tests will encompass the construction of virtual terrain and environments as well as the specific validation of virtual path planning to ensure the system’s reliability and accuracy in various application scenarios.

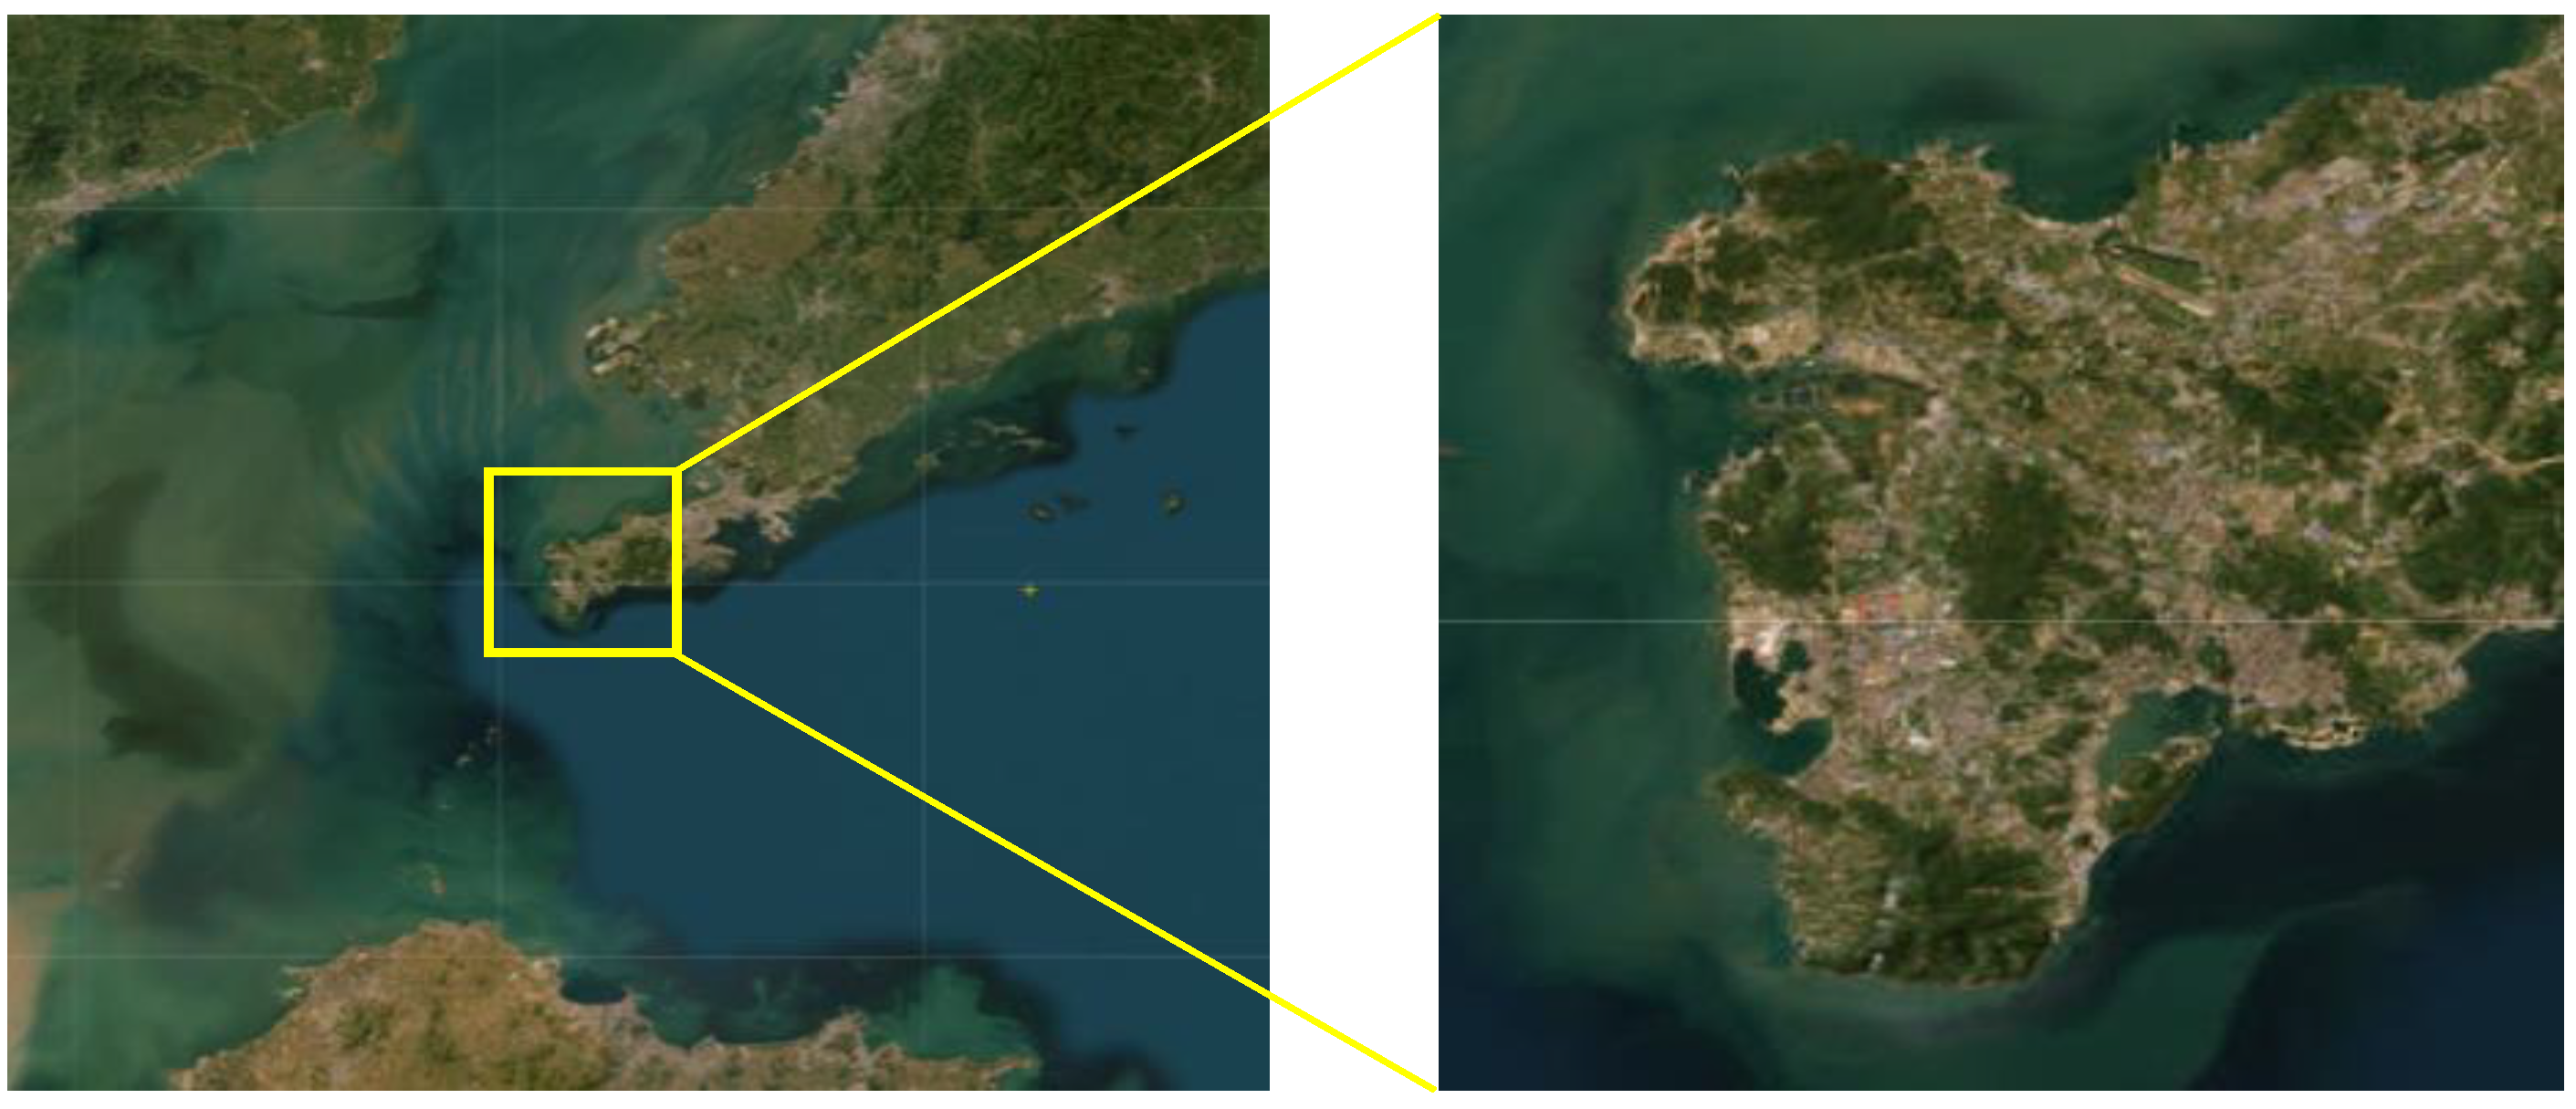
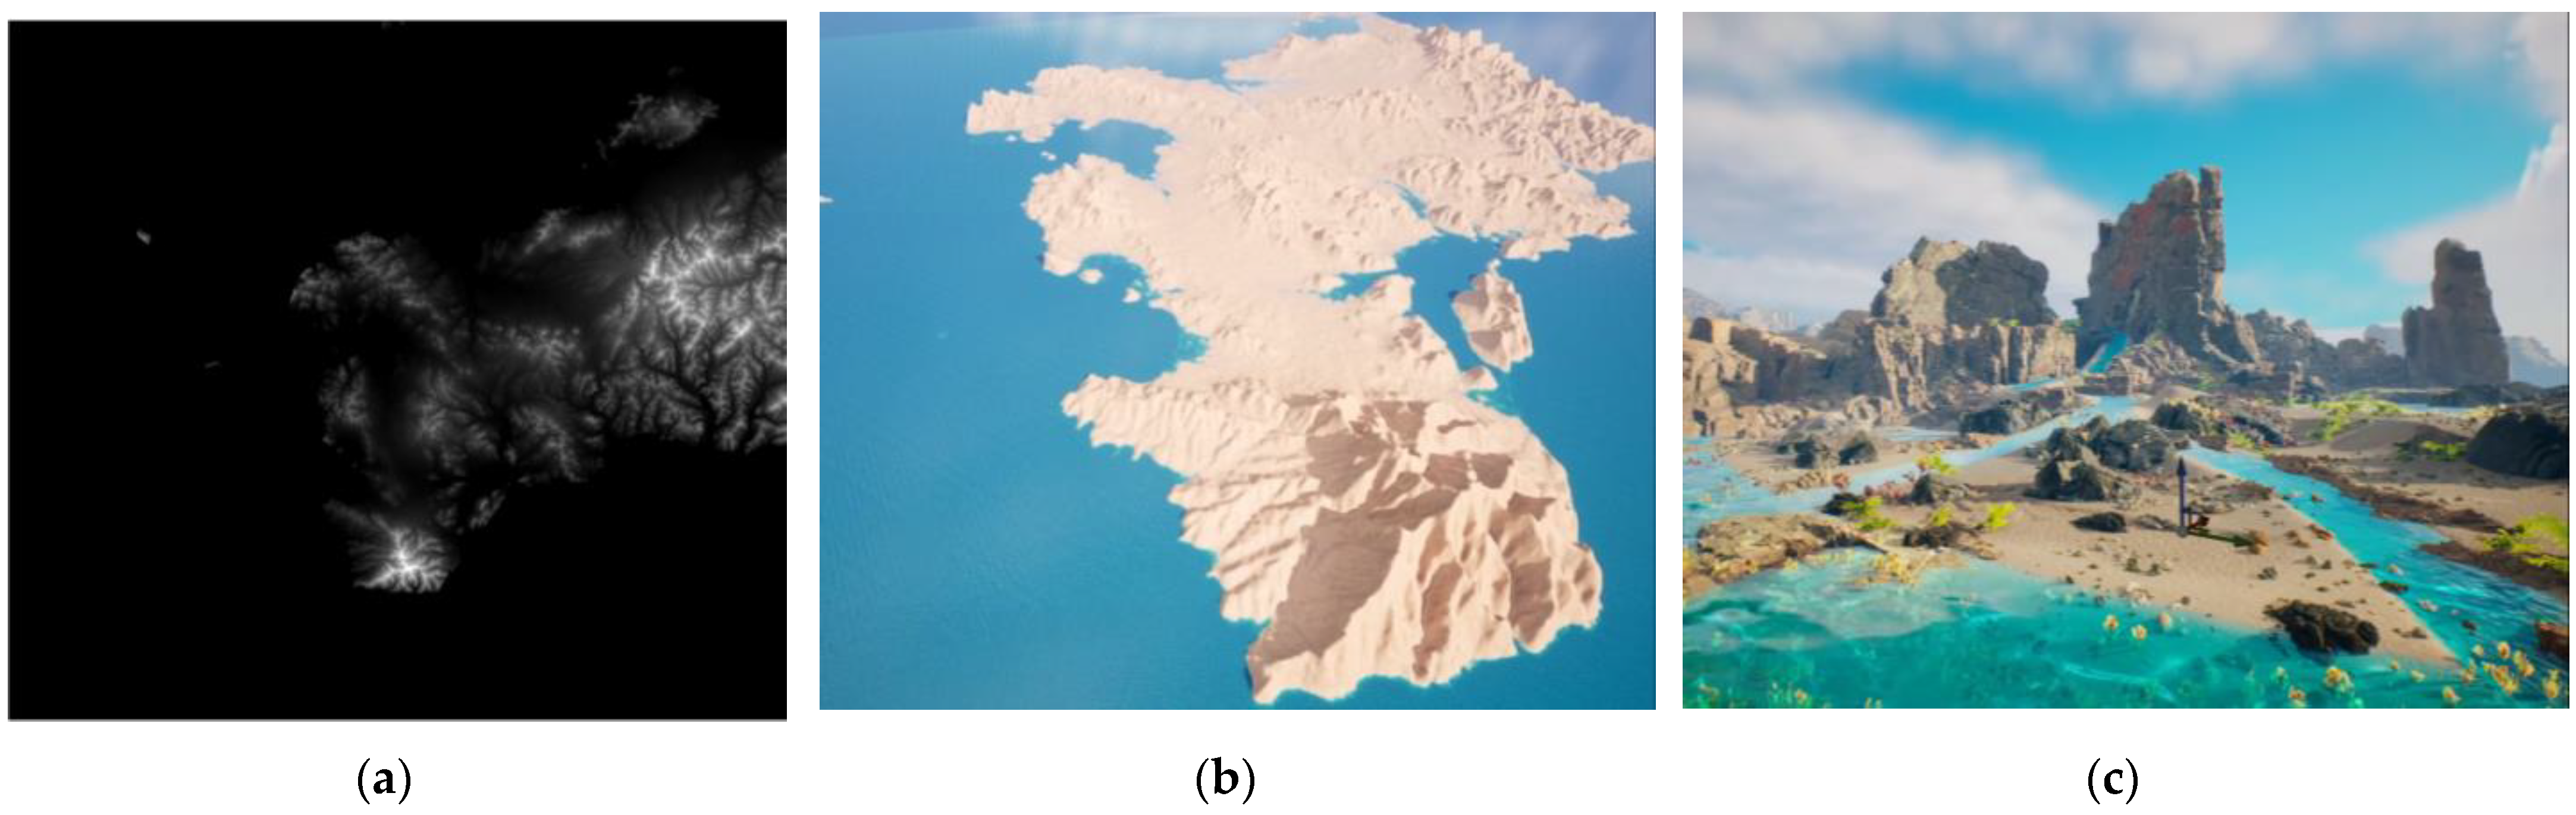
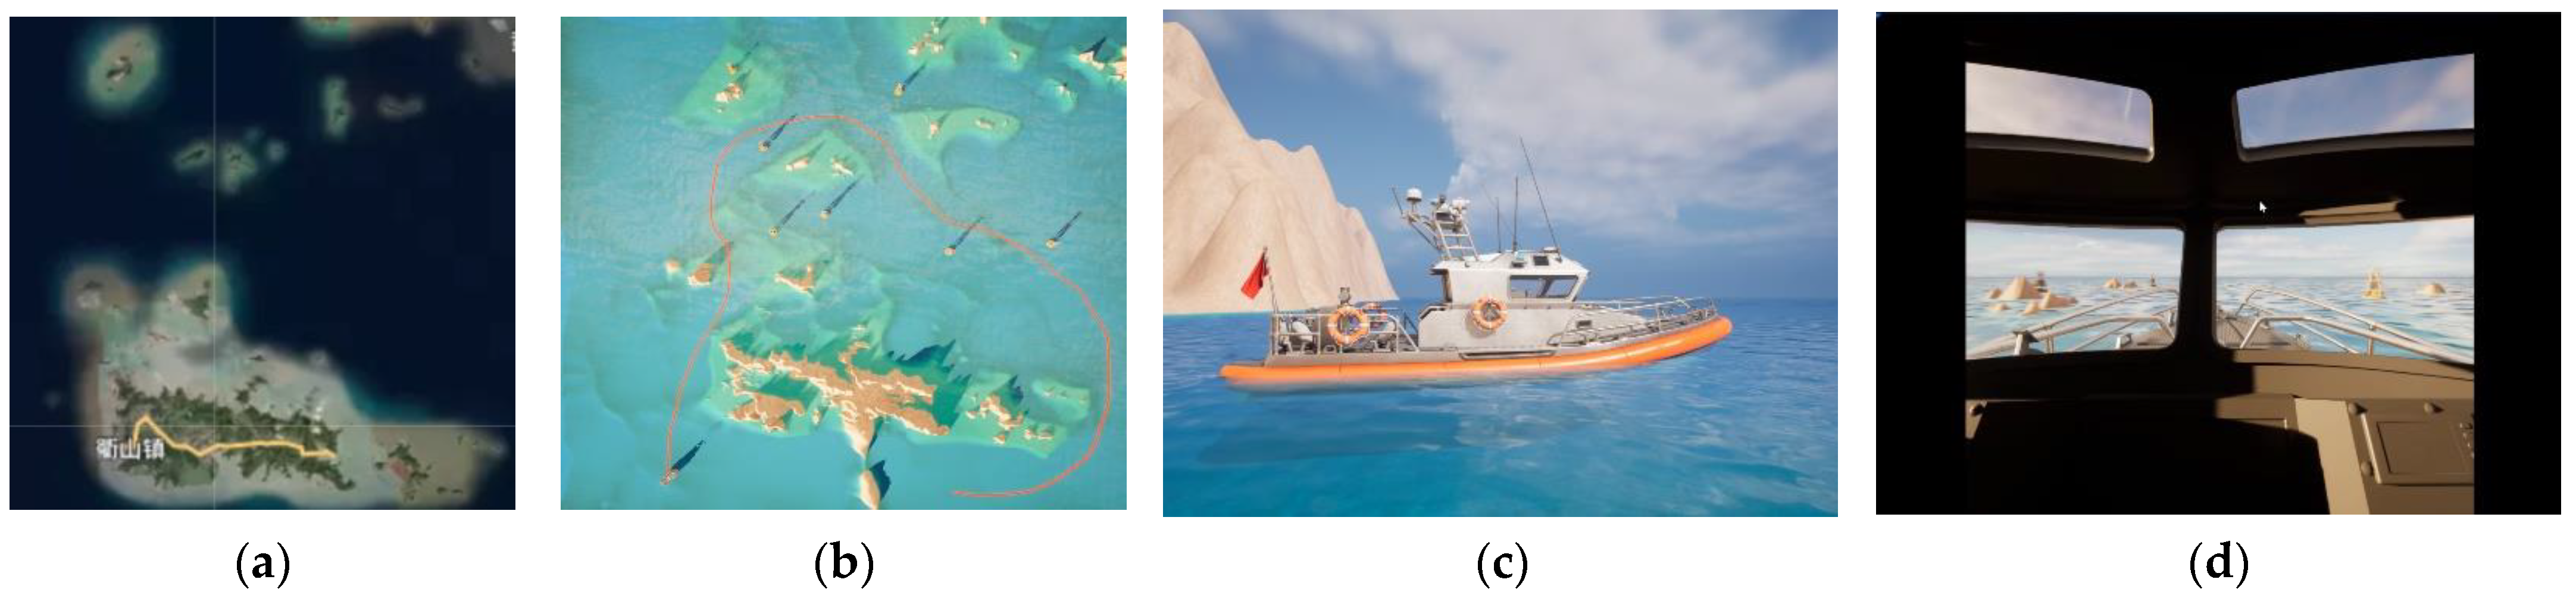
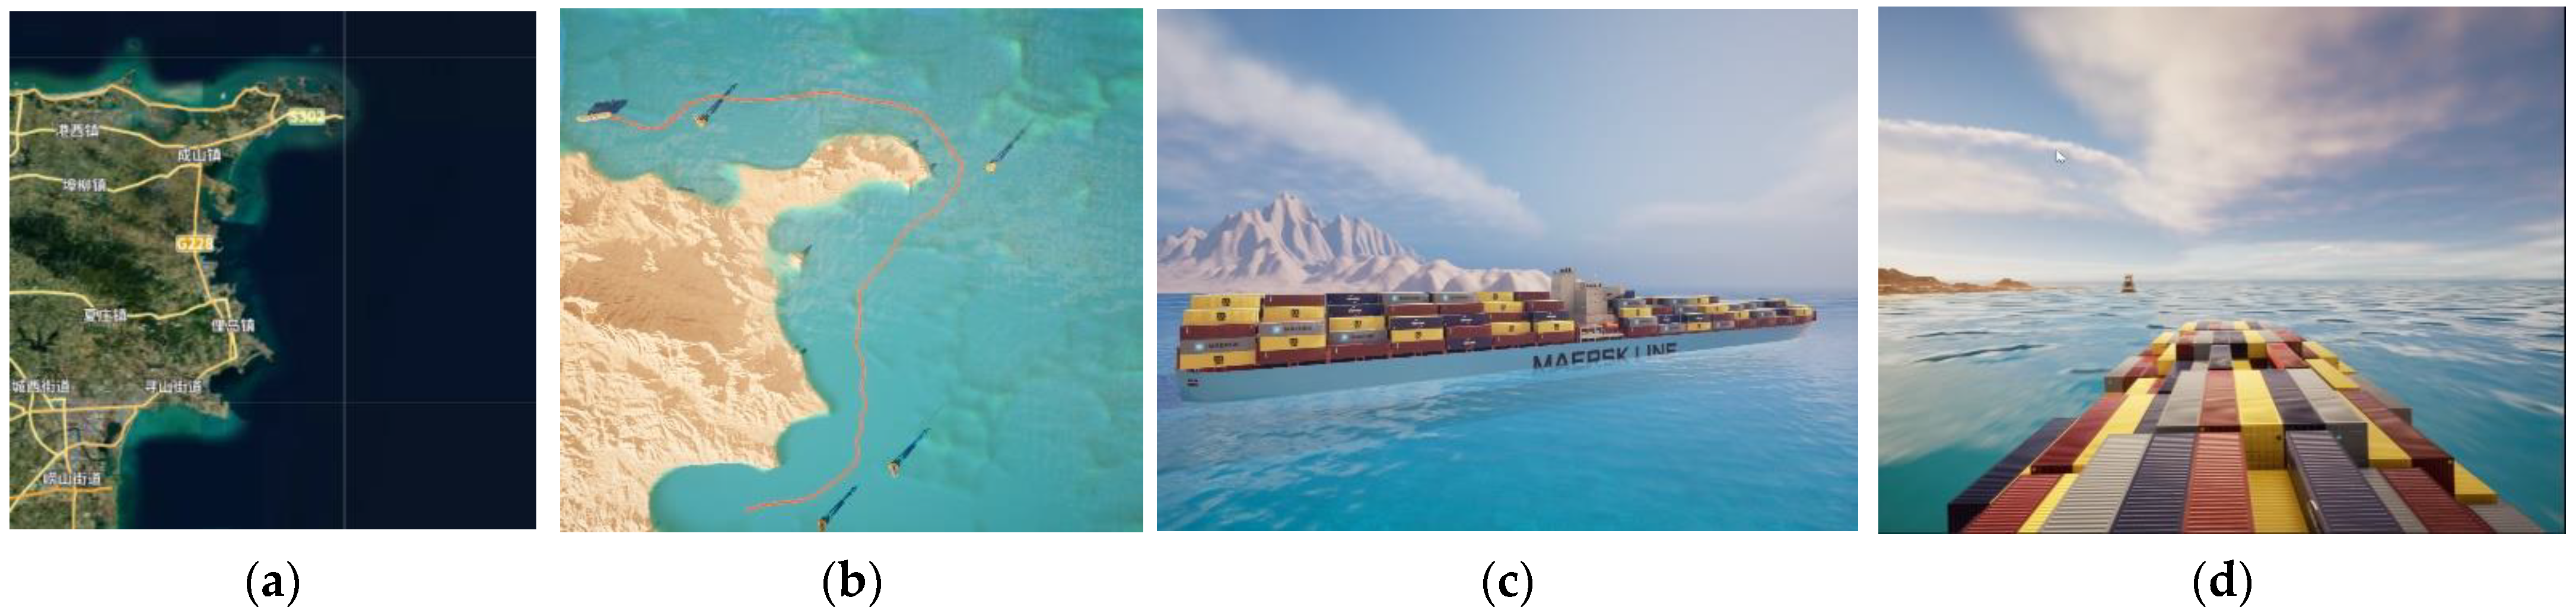
4.2.1. Testing of Virtual Terrain and Environment Construction

To validate the accuracy and reliability of virtual terrain and environment construction, this Section focuses on creating a virtual terrain based on satellite images of a portion of the Bohai Sea and Yellow River regions in China, followed by comprehensive testing and evaluation. High-resolution satellite images of the Bohai Sea and Yellow River regions were selected as the data source for this test. These images were used to extract terrain and topographic features, including islands, reefs, and slopes, as shown in Figure 14.
The hardware configuration of the experimental platform includes an Intel Core i7-9700K @ 3.60 GHz CPU, an NVIDIA GeForce RTX 2080 GPU, 32 GB DDR4 RAM, and 1 TB NVMe SSD storage, operating on Windows 10 Pro 64-bit. In terms of software tools, Unreal Engine 5.4 was utilized for the construction and rendering of virtual terrain and environments, QGIS 3.16 for processing satellite images and generating height maps, Photoshop 2021 for editing and optimizing height maps, and Gaea 1.3 for terrain generation and detail optimization.
The test results are shown in Figure 15. Utilizing an online marine terrain rapid construction method based on electronic nautical charts, the grayscale images from these charts store altitude data in height maps, with black and white values representing terrain elevation. These height data are applied in the terrain system of Unreal Engine, supporting the creation of large-scale worlds through world partitioning and allowing for free scale adjustment. The test results demonstrate that the constructed virtual terrain achieved the expected accuracy in height data and richness in terrain details. Terrain features in the virtual environment are clearly visible. To enhance the resolution and realism of the terrain model, mesh refinement and multi-level detail rendering techniques were employed, ensuring the speed and reliability of the modeling results. The terrain variations accurately reflect actual conditions, laying a solid foundation for the further application of the virtual simulation platform.
Moreover, the water system effects are illustrated in Figure 16, Figure 17 and Figure 18. The motion of waves exhibits inherent randomness; thus, when simulating waves, multiple Gerstner waves with varying directions and parameters are superimposed. In this test, by configuring different wavelength, wave height, and wave direction parameters, we validated the simulation effects of the water system.
Notably, this paper achieved efficient data processing and transmission through Gerstner wave simulation, enabling the CPU and GPU to share the same wave data resources. This approach eliminates the need for separate wave data preparation and complex synchronization processes, significantly enhancing overall operational efficiency and performance. The experimental results confirmed that the water system effectively simulates different wavelengths, wave heights, and wave directions, accurately replicating wave characteristics in real ocean environments. This provides a reliable foundation for subsequent path planning and motion simulation. In summary, the water system demonstrated highly realistic ocean wave simulation effects by adjusting various wave parameters, highlighting its application value in marine simulation.

4.2.2. Validation of Virtual Path Planning

To comprehensively demonstrate and validate the functionality and effectiveness of the virtual path planning system, this Section will introduce the overall presentation process of the system. It will integrate the previously simulated planning data, utilizing both visual simulation and VR for operation and evaluation. The virtual path planning system offers an intuitive and efficient path planning experience, allowing users to observe and adjust the planning results in real time within a virtual environment.
To validate the effectiveness of the virtual path planning system, we designed a series of test scenarios, encompassing various sea conditions and obstacle distributions. By conducting path planning within these scenarios, we evaluated the system’s performance and behavior under different conditions, as illustrated in Figure 19, Figure 20 and Figure 21.
Showcasing the path planning process through visual simulation leverages the robust graphical processing capabilities of the virtual simulation platform, rendering a detailed three-dimensional maritime environment and path planning outcomes on a computer screen. Users can operate the system via keyboard and mouse, enabling real-time monitoring of the vessel’s navigation route, obstacle avoidance, and navigation parameter changes. The system supports multi-perspective switching of the path planning results, including bird’s-eye view, ship’s perspective, and cabin view, aiding users in comprehending and assessing the effectiveness of the path planning. Test results indicate that the virtual path planning system can rapidly and accurately generate optimal routes and effectively avoid obstacles under various complex sea conditions. Compared to traditional path planning methods, the virtual path planning system offers greater interactivity and intuitiveness, significantly enhancing the efficiency and accuracy of path planning.
Secondly, VR offers an immersive path planning experience. In constructing the VR interactive system, the HTC Vive Pro 2.0 set was selected as the hardware solution, which includes essential components such as trackers, VR controllers, and a VR headset [32].
The system’s performance is illustrated in Figure 22, where the user is seated on a four-degree-of-freedom motion simulation platform, operating the system with VR glasses and controllers. The VR glasses immerse the user in a completely virtual ocean environment, while the controllers are used to manage and adjust the ship’s path planning. The motion simulation platform dynamically adjusts the seat’s posture and movements in real-time based on the ship’s state within the virtual environment, enhancing the user’s sense of immersion and realism. This setup not only allows users to observe and modify the path planning more intuitively but also provides an experience of the actual navigational movements.
The system also features an operational user interface, allowing users to configure task operations. During system execution, it can display real-time attitude data curves, as illustrated in Figure 23.
The UI of the virtual path planning system encompasses various modules designed to display and control the ship’s position and orientation in the virtual world, GPS coordinates, ocean conditions, and real-world Inertial Measurement Unit (IMU) data. Specifically, the UI presents the ship’s coordinates in the virtual environment, along with the roll, pitch, and yaw angles. Additionally, the interface shows the current GPS latitude and longitude, wind direction, and wind speed, as well as real-time IMU data on orientation, angular velocity, and linear acceleration. These features provide users with a comprehensive operational platform to monitor and adjust various parameters throughout the virtual path planning process. Furthermore, the system continuously displays the ship’s motion-state curve data, helping users visually understand the ship’s behavior under different sea conditions. These data enable users to analyze and validate the effectiveness and stability of the path planning algorithm. Moreover, the system supports real-time saving of attitude data, facilitating subsequent data analysis and research.
Overall, the virtual path planning system, by integrating visual simulation and VR technology, offers users a highly immersive and interactive operational environment. Users can utilize VR headsets and controllers on a four-degree-of-freedom motion simulation platform to adjust the ship’s path planning in real time. The system not only supports path planning and adjustments within the virtual environment but also simulates the motion effects of actual navigation, enhancing the realism and user experience. The entire system is designed to provide an efficient, intuitive, and accurate path planning test solution, offering a novel and practical path planning testing platform for the autonomous navigation of unmanned vessels.

5. Conclusions

This paper proposes a virtual path planning simulation testing system for ships, aiming to address the high costs, low efficiency, and limitations of purely digital simulations in maritime trials for unmanned vessels. By integrating virtual and numerical simulation technologies, this research systematically establishes a virtual testing environment unrestricted by time and location, enabling intuitive demonstrations and comprehensive evaluations of ship navigation performance. The paper develops a rapid roll angle calculation model for ships based on a radial basis function neural network, with experiments demonstrating its high accuracy in complex sea conditions, significantly outperforming random forest and support vector machine models. Furthermore, it introduces a path optimization constraint model that comprehensively considers path safety, navigation distance, and ship stability, achieving optimal path planning through the PSO algorithm. Experimental results show that this model excels in safety and navigation stability compared to traditional methods, reducing the average roll angle of the planned route by 14.31%, albeit with an increase in route length. The virtual simulation platform’s tests validated the efficiency and practicality of the path planning system. Users operate on a four-degree-of-freedom motion simulation platform through visual simulation and VR equipment, observing and adjusting path planning results in real-time, enhancing the operational experience and simulation credibility. In conclusion, the virtual path planning simulation testing system proposed in this paper effectively overcomes the limitations of purely physical and purely virtual simulations, improving the efficiency and intuitiveness of autonomous navigation testing for unmanned vessels, and providing a novel approach to ship path planning testing.
In future research, to address potential system failures or interference during ship navigation, we plan to explore a broader range of planning scenarios and develop response strategies for situations such as total power loss, propulsion failure, collisions with other vessels, and collisions with floating obstacles (e.g., wreckage, debris, or floating containers). We intend to integrate various path planning methods into the system for comparative validation and analysis, aiming to further verify and enhance the system’s applicability and robustness, ensuring its effective operation in diverse and challenging real-world environments.

Author Contributions

Conceptualization, B.L. and M.L.; methodology, J.L. and M.L.; software, M.L. and Z.Q.; validation, B.L., Q.W. and M.L.; formal analysis, Z.Q. and J.L.; writing—original draft preparation, M.L., B.L. and J.W.; project administration, J.L., Q.W. and J.W.; funding acquisition, J.L., Q.W. and J.W.; writing—review and editing, M.L., B.L. and Z.Q. All authors have read and agreed to the published version of the manuscript.

Funding

This research was funded by the National Natural Science Foundation of China (32472000), Project of Education Science Planning in Heilongjiang Province (GJB1320064), and Harbin Engineering University Education and Teaching Program (JG2021B06).

Institutional Review Board Statement

Not applicable.

Informed Consent Statement

Not applicable.

Data Availability Statement

The data used to support the findings of this study are included within the article and are also available from the corresponding authors upon request.

Conflicts of Interest

The authors declare no conflicts of interest.

References

  1. Öztürk, Ü.; Akdağ, M.; Ayabakan, T. A review of path planning algorithms in maritime autonomous surface ships: Navigation safety perspective. Ocean Eng. 2022, 251, 111010. [Google Scholar] [CrossRef]
  2. Ali, H.; Xiong, G.; Tianci, Q.; Kumar, R.; Dong, X.; Shen, Z. Autonomous ship navigation with an enhanced safety collision avoidance technique. ISA Trans. 2024, 144, 271–281. [Google Scholar] [CrossRef]
  3. Zhen, R.; Gu, Q.; Shi, Z.; Suo, Y. An Improved A-Star Ship Path-Planning Algorithm Considering Current, Water Depth, and Traffic Separation Rules. J. Mar. Sci. Eng. 2023, 11, 7. [Google Scholar] [CrossRef]
  4. Rubio-Tamayo, J.L.; Barrio, M.G.; García, F.G. Immersive Environments and Virtual Reality: Systematic Review and Advances in Communication, Interaction and Simulation. Multimodal Technol. Interact. 2017, 1, 4. [Google Scholar] [CrossRef]
  5. Zaccone, R.; Martelli, M. A collision avoidance algorithm for ship guidance applications. J. Mar. Eng. Technol. 2019, 19 (Suppl. S1), 62–75. [Google Scholar] [CrossRef]
  6. Zhang, R. Construction of Virtual Ship Simulation Practical Training Platform. In Proceedings of the 2018 3rd International Conference on Automation, Mechanical Control and Computational Engineering (AMCCE 2018), Dalian, China, 12–13 May 2018; Atlantis Press: Amsterdam, The Netherlands, 2018; pp. 269–274. [Google Scholar] [CrossRef]
  7. Yin, J.; Ren, H.; Zhou, Y. The Whole Ship Simulation Training Platform Based on Virtual Reality. IEEE Open J. Intell. Transp. Syst. 2021, 2, 207–215. [Google Scholar] [CrossRef]
  8. Ueng, S.-K.; Lin, D.; Liu, C.-H. A ship motion simulation system. Virtual Real. 2008, 12, 65–76. [Google Scholar] [CrossRef]
  9. Benedict, K.; Fischer, S.; Gluch, M.; Kirchhoff, M.; Schaub, M.; Baldauf, M.; Müller, B. Innovative Fast Time Simulation Tools for Briefing / Debriefing in Advanced Ship Handling Simulator Training and Ship Operation. Trans. Marit. Sci. 2017, 6, 24–38. [Google Scholar] [CrossRef]
  10. Zhu, Z.; Li, L.; Wu, W.; Jiao, Y. Application of improved Dijkstra algorithm in intelligent ship path planning. In Proceedings of the 2021 33rd Chinese Control and Decision Conference (CCDC), Kunming, China, 22–24 May 2021; pp. 4926–4931. [Google Scholar] [CrossRef]
  11. Li, Y.; Chen, J.; Luo, X.; Bai, X. A Multi-Constraint Planning Approach for Offshore Test Tasks for an Intelligent Technology Test Ship. Processes 2024, 12, 392. [Google Scholar] [CrossRef]
  12. Niu, Y.; Zhang, J.; Wang, Y.; Yang, H.; Mu, Y. A Review of Path Planning Algorithms for USV. In Proceedings of the 2021 International Conference on Autonomous Unmanned Systems (ICAUS 2021), ICAUS 2021, Changsha, China, 24–26 September 2022; Wu, M., Niu, Y., Gu, M., Cheng, J., Eds.; Lecture Notes in Electrical Engineering. Springer: Singapore, 2022; Volume 861. [Google Scholar] [CrossRef]
  13. Zhou, Z.; He, X.; Xu, L.; Qu, C. Simulation Platform for USV Path Planning based on Unity3D and A* Algorithm. In Proceedings of the 2019 IEEE International Conference on Signal, Information and Data Processing (ICSIDP), Chongqing, China, 11–13 December 2019; pp. 1–6. [Google Scholar] [CrossRef]
  14. Kim, M.-S.; Lee, K.-K.; Kim, D.H. Experimental Validation of Longitudinal Control of a Platoon of Vessels Established via the V-REP Simulator. Int. J. FUZZY Log. Intell. Syst. 2019, 19, 263–271. [Google Scholar] [CrossRef]
  15. Wang, S.; Yang, J.; Hu, R.; Qingnian, Z. Research on Unmanned Ship Simulation on the basis of Unity3d. In Proceedings of the 1st International Conference on Control and Computer Vision, in ICCCV ’18, Singapore, 15–18 June 2018; Association for Computing Machinery: New York, NY, USA, 2018; pp. 101–105. [Google Scholar] [CrossRef]
  16. Shin, I.-S.; Beirami, M.; Cho, S.-J.; Yu, Y.-H. Development of 3D Terrain Visualization for Navigation Simulation using a Unity 3D Development Tool. J. Adv. Mar. Eng. Technol. 2015, 39, 570–576. [Google Scholar] [CrossRef]
  17. Zhang, L.; Mou, J.; Chen, P.; Li, M. Path Planning for Autonomous Ships: A Hybrid Approach Based on Improved APF and Modified VO Methods. J. Mar. Sci. Eng. 2021, 9, 761. [Google Scholar] [CrossRef]
  18. Xue, Y.; Liu, Y.; Xue, G.; Chen, G. Identification and Prediction of Ship Maneuvering Motion Based on a Gaussian Process with Uncertainty Propagation. J. Mar. Sci. Eng. 2021, 9, 8. [Google Scholar] [CrossRef]
  19. Xiao, G.; Zheng, G.; Tong, C.; Hong, X. A Virtual System and Method for Autonomous Navigation Performance Testing of Unmanned Surface Vehicles. J. Mar. Sci. Eng. 2023, 11, 11. [Google Scholar] [CrossRef]
  20. Wang, N.; Wang, Y.; Zhao, Y.; Wang, Y.; Li, Z. Sim-to-Real: Mapless Navigation for USVs Using Deep Reinforcement Learning. J. Mar. Sci. Eng. 2022, 10, 7. [Google Scholar] [CrossRef]
  21. Zhou, X.; Wu, P.; Zhang, H.; Guo, W.; Liu, Y. Learn to Navigate: Cooperative Path Planning for Unmanned Surface Vehicles Using Deep Reinforcement Learning. IEEE Access 2019, 7, 165262–165278. [Google Scholar] [CrossRef]
  22. Zhou, J.; Ding, F.; Yang, J.; Pei, Z.; Wang, C.; Zhang, A. Navigation safety domain and collision risk index for decision support of collision avoidance of USVs. Int. J. Nav. Archit. Ocean. Eng. 2021, 13, 340–350. [Google Scholar] [CrossRef]
  23. Peng, Z.; Li, J.; Han, B.; Gu, N. Safety-Certificated Line-of-Sight Guidance of Unmanned Surface Vehicles for Straight-Line Following in a Constrained Water Region Subject to Ocean Currents. J. Marine. Sci. Appl. 2023, 22, 602–613. [Google Scholar] [CrossRef]
  24. Liu, S.; Wang, C.; Zhang, A. A Method of Path Planning on Safe Depth for Unmanned Surface Vehicles Based on Hydrodynamic Analysis. Appl. Sci. 2019, 9, 3228. [Google Scholar] [CrossRef]
  25. Yin, J.; Zou, Z.; Xu, F. On-line prediction of ship roll motion during maneuvering using sequential learning RBF neuralnetworks. Ocean Eng. 2013, 61, 139–147. [Google Scholar] [CrossRef]
  26. Guo, X.; Ji, M.; Zhao, Z.; Wen, D.; Zhang, W. Global path planning and multi-objective path control for unmanned surface vehicle based on modified particle swarm optimization (PSO) algorithm. Ocean Eng. 2020, 216, 107693. [Google Scholar] [CrossRef]
  27. Xin, J.; Zhong, J.; Li, S.; Sheng, J.; Cui, Y. Greedy Mechanism Based Particle Swarm Optimization for Path Planning Problem of an Unmanned Surface Vehicle. Sensors 2019, 19, 21. [Google Scholar] [CrossRef] [PubMed]
  28. Romero, M.; Sewell, B. Blueprints Visual Scripting for Unreal Engine 5: Unleash the true Power of Blueprints to Create Impressive Games and Applications in UE5; Packt Publishing Ltd.: Birmingham, UK, 2022. [Google Scholar]
  29. Tai, N.C.; Yeh, T.W. Investigation of Computer-Simulated Visual Realism for Envisioning the Illusory Visual Effect of Installation Art Using Depth Reversal. J. Asian Archit. Build. Eng. 2017, 16, 581–587. [Google Scholar] [CrossRef]
  30. Li, R. Real-world large-scale terrain model reconstruction and real-time rendering. In Proceedings of the 28th International ACM Conference on 3D Web Technology, San Sebastian, Spain, 9–11 October 2023. [Google Scholar] [CrossRef]
  31. Cavaleri, L.; Alves, J.-H.; Ardhuin, F.; Babanin, A.; Banner, M.; Belibassakis, K.; Benoit, M.; Donelan, M.; Groeneweg, J.; Herbers, T.; et al. Wave modelling–The state of the art. Prog. Oceanogr. 2007, 75, 603–674. [Google Scholar] [CrossRef]
  32. Borges, M.; Symington, A.; Coltin, B.; Smith, T.; Ventura, R. HTC Vive: Analysis and Accuracy Improvement. In Proceedings of the 2018 IEEE/RSJ International Conference on Intelligent Robots and Systems (IROS), Madrid, Spain, 1–5 October 2018; pp. 2610–2615. [Google Scholar] [CrossRef]
Figure 1. Functional requirements of the virtual simulation system.
Jmse 12 01587 g001
Figure 2. Overall system architecture diagram.
Jmse 12 01587 g002
Figure 3. The architecture of the roll calculation neural network model.
Jmse 12 01587 g003
Figure 4. Flowchart of the PSO algorithm.
Jmse 12 01587 g004
Figure 5. Motion simulation platform framework.
Jmse 12 01587 g005
Figure 6. Four-degree-of-freedom motion simulation platform.
Jmse 12 01587 g006
Figure 7. Flow chart of 3D modeling.
Jmse 12 01587 g007
Figure 8. Process of constructing a virtual ocean environment.
Jmse 12 01587 g008
Figure 9. Waterbody mesh transformation.
Jmse 12 01587 g009
Figure 10. Waterbody mesh transformation: (a) Near-distance water wave model; (b) Far-distance water LOD optimization model.
Jmse 12 01587 g010
Figure 11. Boxplot of roll angle errors for various algorithms.
Jmse 12 01587 g011
Figure 12. Validation test sea area image preprocessing: (a) Electronic nautical chart image; (b) Binarized image; (c) Regional wind direction distribution map; (d) Route planning area.
Jmse 12 01587 g012
Figure 13. Results of path planning tests.
Jmse 12 01587 g013
Figure 14. Selection of satellite images for the test area.
Jmse 12 01587 g014
Figure 15. The process of constructing the marine terrain: (a) Target sea area height grayscale map; (b) Generated basic terrain model; (c) Terrain model after detailed optimization.
Jmse 12 01587 g015
Figure 16. Waves with different wavelengths: (a) 15 m; (b) 30 m; (c) 60 m.
Jmse 12 01587 g016
Figure 17. Waves with different heights: (a) 1 m; (b) 2 m; (c) 3 m.
Jmse 12 01587 g017
Figure 18. Waves with different directions: (a) 0°; (b) 120°; (c) 180°.
Jmse 12 01587 g018
Figure 19. Ship route planning simulation in the waters near Zhoushan, China (Zhoushan is a coastal city in Zhejiang province of China): (a) satellite map of the waters near Zhoushan; (b) overhead view of path planning results in the virtual system; (c) virtual model of a small ship; (d) cabin interior view during simulation.
Jmse 12 01587 g019
Figure 20. Ship route planning simulation in the waters near Weihai, China (Weihai is a coastal city in Shandong province of China): (a) satellite map of the waters near Weihai; (b) overhead view of path planning results in the virtual system; (c) virtual model of a container ship; (d) on-board view during simulation.
Jmse 12 01587 g020
Figure 21. Ship route planning simulation in the waters near Wenzhou, China (Wenzhou is a coastal city in Zhejiang province of China): (a) satellite map of the waters near Wenzhou; (b) overhead view of path planning results in the virtual system; (c) virtual model of a passenger ship; (d) on-board cabin view during simulation.
Jmse 12 01587 g021
Figure 22. Actual motion demonstration of the virtual reality system.
Jmse 12 01587 g022
Figure 23. System UI interface: (a) system input operation interface; (b) simulation data and curve display.
Jmse 12 01587 g023
Table 1. Design parameters of the motion simulation platform.
Motion DirectionMotion RangeStatic Precision
Pitch Motion−40° to 40°≤1°
Pitch Angular Speed0.5°/s~2°/s±5% to ±10%
Heave Motion−20 cm to 20 cm≤0.4 cm
Heave Motion Speed0.8 cm/s~2.0 cm/s±5% to ±10%
Table 2. Comparison of different algorithms.
AlgorithmMotion RangeStatic Precision
Our model0.560.412
Random forest1.520.790
SVM1.080.531
Table 3. Comparison of ship route planning results.
ModelSailing Distance (nm)Maximum Roll Angle (deg)Average Roll Angle (deg)
Traditional Constraint Model434.154.623.50
Optimized Constraint Model449.063.853.13
Disclaimer/Publisher’s Note: The statements, opinions and data contained in all publications are solely those of the individual author(s) and contributor(s) and not of MDPI and/or the editor(s). MDPI and/or the editor(s) disclaim responsibility for any injury to people or property resulting from any ideas, methods, instructions or products referred to in the content.

