Abstract
The deep-sea mining lift pump is one of the pivotal components in deep-sea mineral transportation systems and its internal flow is very complex; consequently, unraveling its unsteady flow behavior pattern holds immense practical value. This study adopts numerical methods to analyze the time-averaged distribution characteristics of the internal flow field in mining lift pumps, as well as the flow field’s pulsation intensity distribution characteristics, the vortex’s spatiotemporal evolution process in both moving and static cascades, and the time- and frequency-domain pulsation characteristics of internal pressure in each flow passage component under four different flow conditions are also investigated. The hydraulic properties of mining lift pumps under these four different conditions are also evaluated, and the outcomes are benchmarked against those of numerical predictions. Our findings reveal that the interplay between impeller blades and guide vanes significantly influences the pump’s flow characteristics, with the pump’s unsteady flow influencing its hydraulic properties. Experimental validation of this system confirms that the pump under study is in line with design specifications in terms of hydraulic properties. The method validation test on the prototype pump shows that the SST k-ω model is capable of successfully forecasting instability in the flow features of deep-sea mining lift pumps. These results will serve as a theoretical reference for regulating the flow state inside deep-sea mining lift pumps.
1. Introduction
Electric pumps play a pivotal role in conveying solid particles. These solid particles cause severe abrasion to the pump’s flow channel, leading to the loss of transported goods and shortening the pump’s lifespan [1]. The design and development of pumps that exhibit excellent performance, experience low levels of wear, and achieve a long working life have become common research topics [2].
Gahlot and others [3] conducted a study on the properties of an open centrifugal slurry pump impeller for conveying coal as well as tailings, and their findings revealed that the solid particles’ concentration affects the pump head and pump performance. Li and others [4] explored the influence of the rate of flow and the size of particles on centrifugal slurry pump performance by adopting computational fluid dynamics (CFD) simulations. The findings demonstrated that as the size of the particle and the rate of flow increased, the efficiency of the pump decreased in a gradual process. Wang and others [5] utilized the radial basis function (RBF) neural network and NSGA-II algorithms for optimizing the hydraulic properties of the impeller and pump efficiency. Jeon and others [6] adopted an optimized model to assess the pump’s efficiency and achieved an improvement in pump performance. Sellgren and others [7] focused on the impact of a sand–clay mixture on centrifugal slurry pump efficiency, discovering that the addition of clay reduced head loss by approximately 30%. Serrano and others [8] analyzed a pump’s performance under different sediment loads. Gandhi and others [9] introduced an idea for analyzing the performance of a slurry pump that transports clean water, which includes the influence of pump leakage. Tarodiya and others [10,11] demonstrated the applicability of the Euler–Euler model for validating that an increase in solid particle size and concentration leads to a decrease in pump head performance. With increasingly fine-grained particles, the pump head loss level has been found to decrease. Several scholars have researched the movement features of solid particles in centrifugal pumps from diverse angles via experimental methods, while also assessing the impact of the concentration of slurry and the size of particles on the pump’s head and its efficiency [12,13,14]. Previous studies have been conducted concerning the impact of the geometric parameters of the pump flow passage components on the pump’s efficiency [15,16].
The intricacies of fluid dynamics within pumps necessitate a profound analysis of their unsteady flow characteristics during the operation of pumps. Zhang and others [17] delved into the intricacy of flow patterns and their evolution in a low-specific-speed centrifugal pump, using particle image velocimetry (PIV) measurement technology. They mainly focused on intricate flow structures near the volute tongue region, characterized by robust rotor–stator interactions. Their results showed that when the flow velocity is slower than under normal operating conditions, the distinct jet wake flow pattern appears at the blade exit, accompanied by an inflection point at the blade channel’s center. Nevertheless, when using a higher flow velocity, the aforementioned pattern is not readily observable because high-momentum fluid is concentrated on the blade’s suction side. Huang and others [18] performed a numerical examination on transient cavitation flow in jet pumps when subjected to non-uniform inflow conditions, using Reynolds-averaged Navier–Stokes equations as well as a homogeneous cavitation model to simulate the unsteady flow. They investigated the correlation between jet pump cavitation, vorticity diffusion, and outlet pressure fluctuations. The outcomes pointed to cavity acceleration as the primary driver of internal pressure fluctuations in pumps with a mixed-flow water jet. Cheng and others [19] introduced an innovative modeling scheme aimed at analyzing the non-steady state features found in molten salt pumps that transport media of various viscosities. Their results showed that the contour of the pressure curve at the volute tongue changes with the conveyed medium’s viscosity, and the blade’s position exerts a substantial impact on the velocity distribution within the volute, thereby revealing the loss mechanism of flow rate regarding media with different viscosities therein. Zhang and others [20] studied centrifugal pumps’ rotating stall characteristics and described the instability in the progression of the stall structure meticulously. They showed that the rotating stall triggers an escalation in the pulsation amplitude and low-frequency components in the pressure spectrum. Leveraging coherence analysis, it was found that a current-based methodology is effective in identifying rotational stall characteristics, which provides a method for analyzing the rotating stall characteristics of other fluid machinery. Elsewhere, Zhang and others [21] investigated the influence of unstable pressure pulsation as well as flow structures in centrifugal pumps with low specific speed by adjusting the pressure side of the blades, utilizing a combined laboratorial and calculative framework. Su and others [22] studied the characteristics of internal flow velocity in pumps to examine the periodicity found in velocity distribution. Using the CFD method, they analyzed the flow velocity characteristics in the fluid domain, based on the Euler–Lagrangian model. Their results revealed that commencing from the volute’s 1–8 section, the time–average speed curve exhibited an overall downward trend, with the accuracy of these simulated outcomes validated through experimental methods. Zhang and others [23] used a calculative simulation model for a meticulous analysis of the pump’s internal flow field, leveraging the delayed detached eddy simulation (DDES) model to study unsteady wake changes during blade operation. Their analysis unveiled a characteristic jet wake flow pattern emerging from the relative velocity distribution, from the pressure side toward the suction side of the blade. With the impeller rotating, the point of reflection of the jet wake flow pattern shifts at the impeller’s midspan. Consequently, mitigating the wake flow stands out as an efficacious approach to diminishing unsteady flow pulsations in centrifugal pumps. Additionally, studies using the DDES model based on an analysis of the unsteady flow features in pumps have served as a guideline for optimizing the structure of pumps [24,25].
The performance of deep-sea mining lift pumps differs when transporting clean water and solid–liquid two-phase flowing media. However, no unified standard has yet been identified for pump tests involving a solid–liquid two-phase flow. Typically, general inspections into pump hydraulic performance would be conducted based on clean water tests, and hydraulic performance involving a solid–liquid two-phase flow medium is inferred. In this study, we consider the properties of a mining lift pump working at depth in the sea under clean water conditions.
In this study, the CFD method was used to calculate internal unsteady flow characteristics within two-stage mining lift pumps, and the hydraulic properties of a mining lift pump under four operating conditions were tested and verified. The results lay the groundwork in theory for investigations of unsteady flow characteristics and the performance improvement of a mining lift pump working at depth in the sea in the future.
2. Three-Dimensional Model and Numerical Calculation Strategy
2.1. Three-Dimensional Model
A mining lift pump’s core through-passage components comprise impellers, guide vanes, and other essential elements. The flow component model is illustrated in Figure 1, and the holistic structural model is shown in Figure 2.
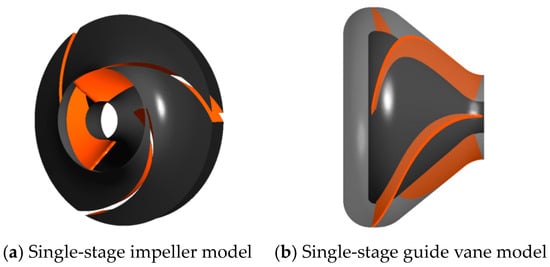
Figure 1.
Single-stage impeller and guide vane model.
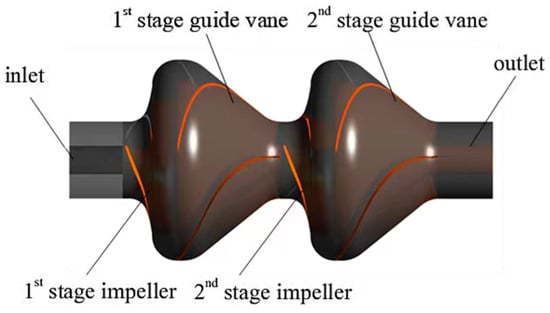
Figure 2.
Structure model diagram of the mining lift pump.
The key specifications of the deep-sea mining lift pump encompass the following: rated flow rate Qd = 420 m3/h, single-stage head Hd = 45 m, and rated efficiency ηd = 52%, as well as rated rotational speed n = 1450 r/min.
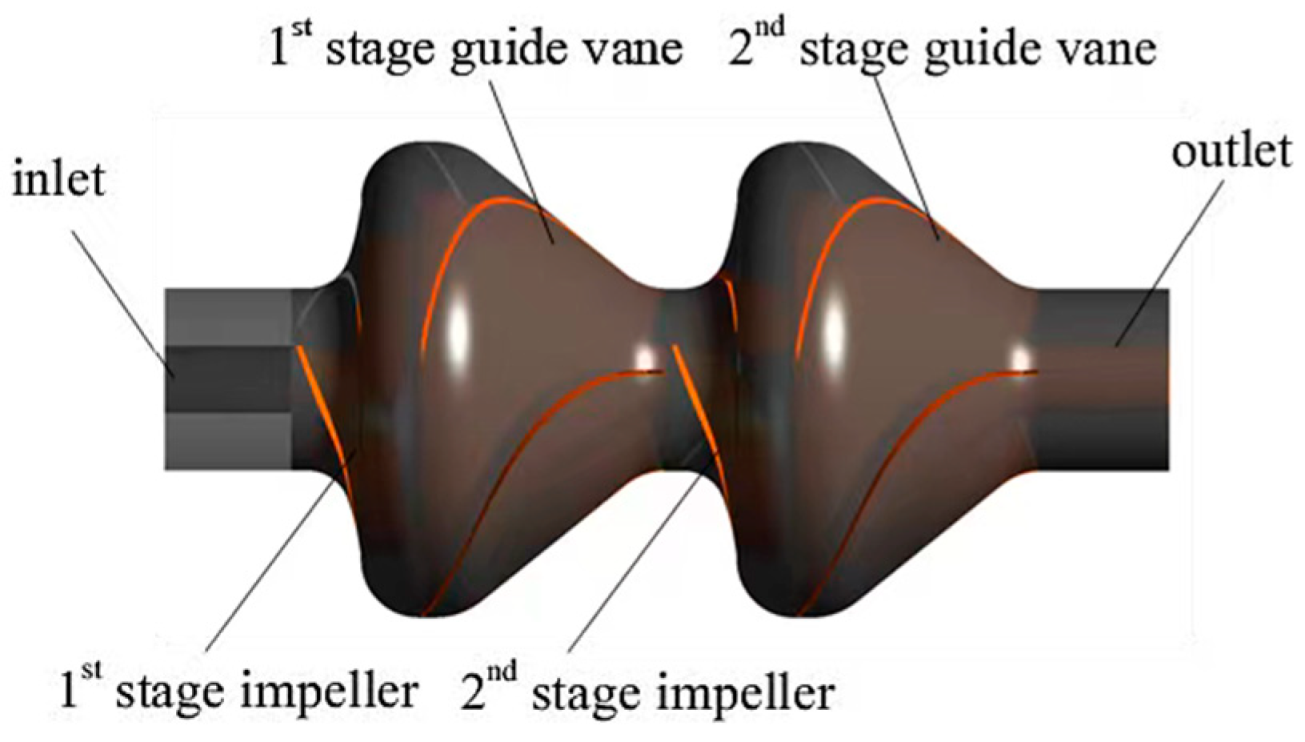
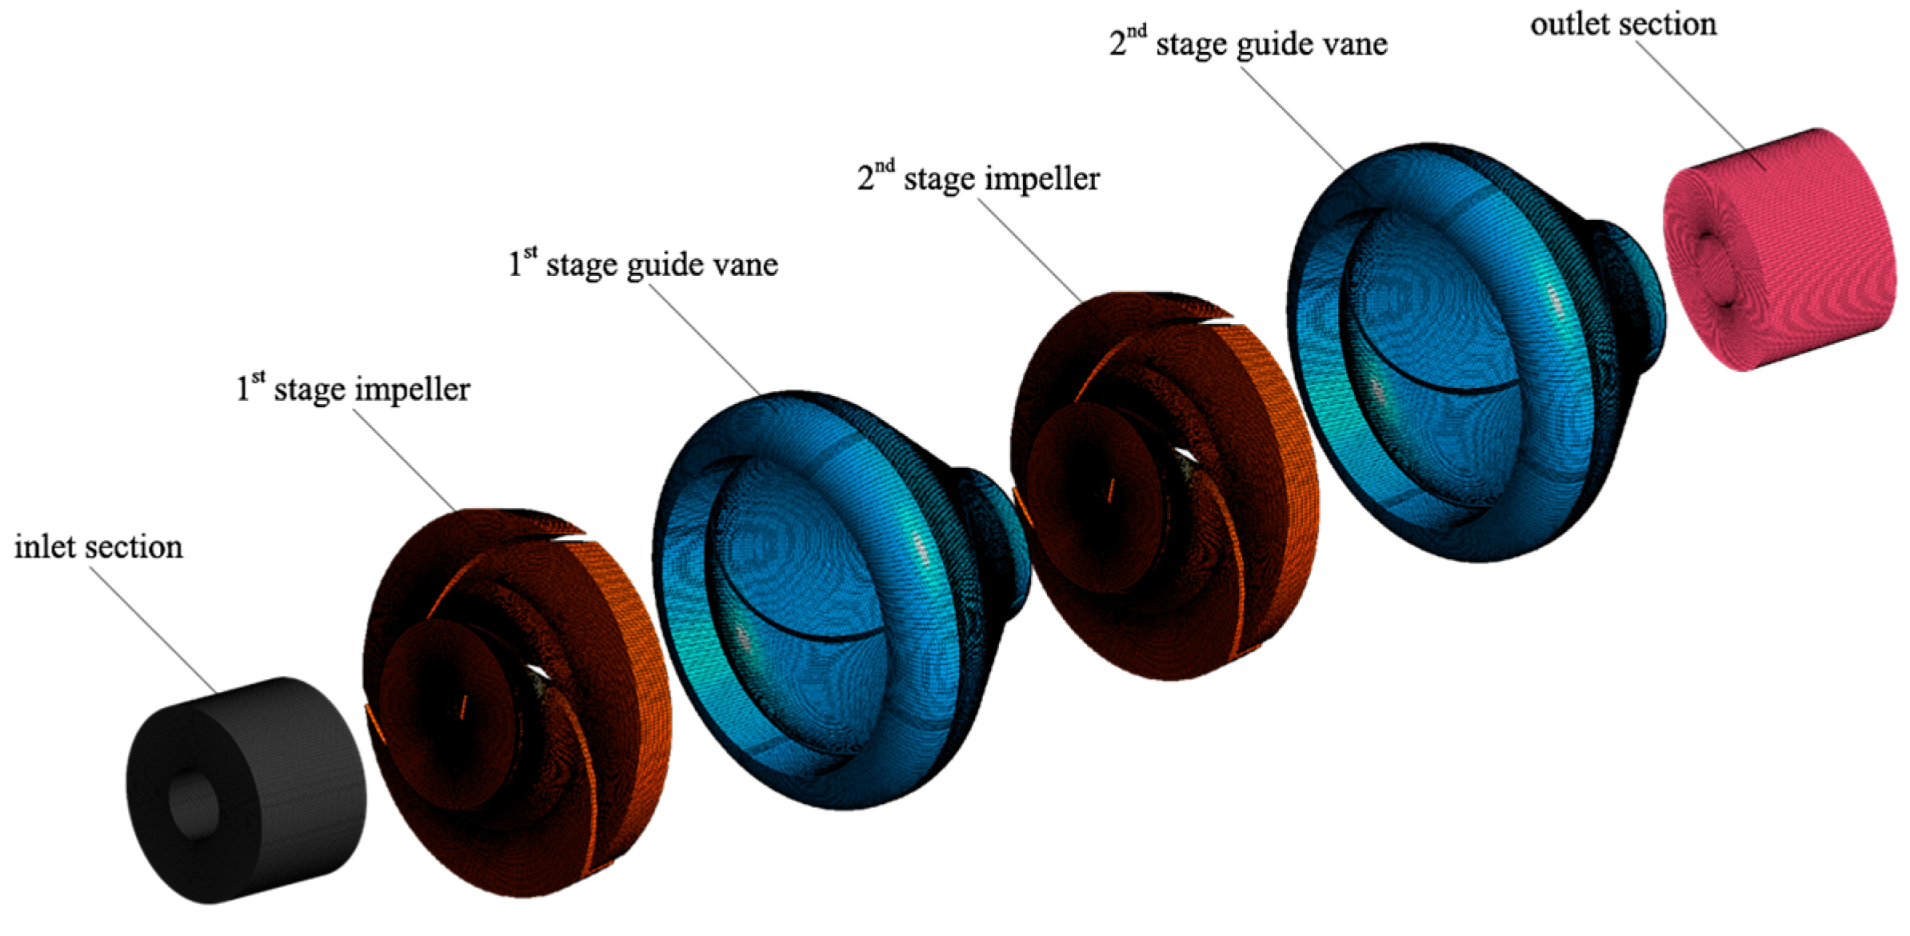
In the numerical simulation, the calculation domain of a full flow field encompasses the inlet section, first-stage impeller, first-stage guide vane, second-stage impeller, and second-stage guide vane, as well as the outlet section, as represented in Figure 3.
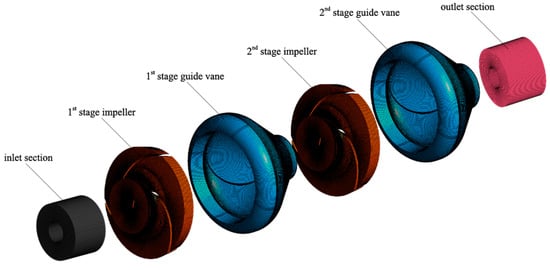
Figure 3.
Model pump computational domain grid.
2.2. Numerical Calculation Method
The boundary conditions in the numerical calculations are set as follows: the inlet of the mining pump is in the form of a velocity inlet, and the inlet velocity is calculated based on the inlet flow rate and inlet cross-sectional area. At the same time, the axial entry of solid particles on the inlet surface into the calculation domain is defined, and their entry velocity is the same as the fluid velocity, without relative velocity. The mining pump outlet adopts boundary conditions in the form of outflow and defines the flow-rate weighting as 1. All overcurrent components in the computational domain are subject to boundary conditions without slip, and the wall roughness is defined as 0.5, based on the actual blades of the mining pump. The data transmission between the inlet section of the mining pump and the impeller, as well as between the impeller and the guide vane, is performed through an interface. For the setting of boundary conditions for solid particles, escape boundary conditions are used at the inlet and outlet of the mining pump, and reflection boundary conditions are used on the surface of other flow-through components.
In the numerical calculations, various inlet velocities are provided to achieve boundary conditions for the pump inlet and obtain the performance output curve across diverse flow rate scenarios. The head of a deep-sea mining lift pump is determined by the equation below:
Here,
- and are the pump inlet and outlet pressures [Pa], respectively;
- ρ is the density of the transported fluid [kg/m3];
- g is the gravitational acceleration [m/s2];
- v1, v2 are the pump inlet and outlet velocities, respectively [m/s]; and
- is the height difference between the pump inlet and outlet [m].
The shaft power of the pump can be expressed by the product of the torque and the impeller’s rotational angular velocity as:
where M serves as the moment [N/s]. The impeller angular velocity can be expressed as:
P = Mω,
Here,
- ω is the rotational angular velocity [rad/s];
- n is the pump shaft’s rotating speed [rpm].
The pump’s efficiency under various working conditions can be expressed according to the following equations:
η = Pe/P
Pe = ρgQH.
Here,
- Pe serves as the effective power [kW];
- Q serves as the pump’s inlet flow rate [m3/h]; and
- H serves as the pump’s head [m].
2.3. Boundary Conditions
In the calculation process, the inlet pressure and outlet velocity serve as the boundary conditions. All solid wall surfaces utilize non-slip wall conditions with a roughness of 25 μm. A second-order upwind method was adopted to discretize the turbulent viscosity term, and a second-order fully implicit method was used to discretize the time term, ensuring a calculation accuracy of 10−4. The time step was set to 0.00034483 s, allowing the impeller to rotate roughly 3° during each iteration. We ignore the collision phenomenon between particles and treat solid particles as discrete phases for tracking.
During the operation of deep-sea mining lift pumps, pulsations in the pressure, velocity, and volume of the fluid in the pump are the fundamental causes of its vibration and noise generation. The pulsation characteristics of the pressure, velocity, and volume are closely related to factors such as the geometric configuration of flow-passage units, the pump’s operating parameters, and the matching relationship between the moving and stationary blades. Consequently, a thorough analysis of the unsteady pulsation patterns and features within the internal flow field of deep-sea mining lift pumps, as well as an investigation into their formation mechanisms, holds paramount importance.
3. Analysis of Unsteady Flow Characteristics
3.1. Time-Averaged Flow-Field Distribution Characteristics
The relative alignment between the impeller blades and the guide vane blades undergoes constant adjustments and changes during each revolution of the impeller, which causes the physical quantities at each spatial point in the flow region to pulsate periodically. In order to dissect the internal flow-field distribution, a time-average algorithm is used to process all transient calculation results over a specified period. The average value of a certain physical quantity at any node (x, y, z) in the computational domain within a certain time range may be formulated as:
In Equation (6), n represents the grid node, N represents the number of samples, t0 represents the start time, and Δt represents the time step for the unsteady flow calculation. The transient calculation results of 10 impeller rotation cycles after the unsteady flow field showed that periodic changes were averaged in this study to enhance the precision of the analysis, as well as to mitigate random errors.
3.1.1. Time-Averaged Pressure Field Distribution Characteristics
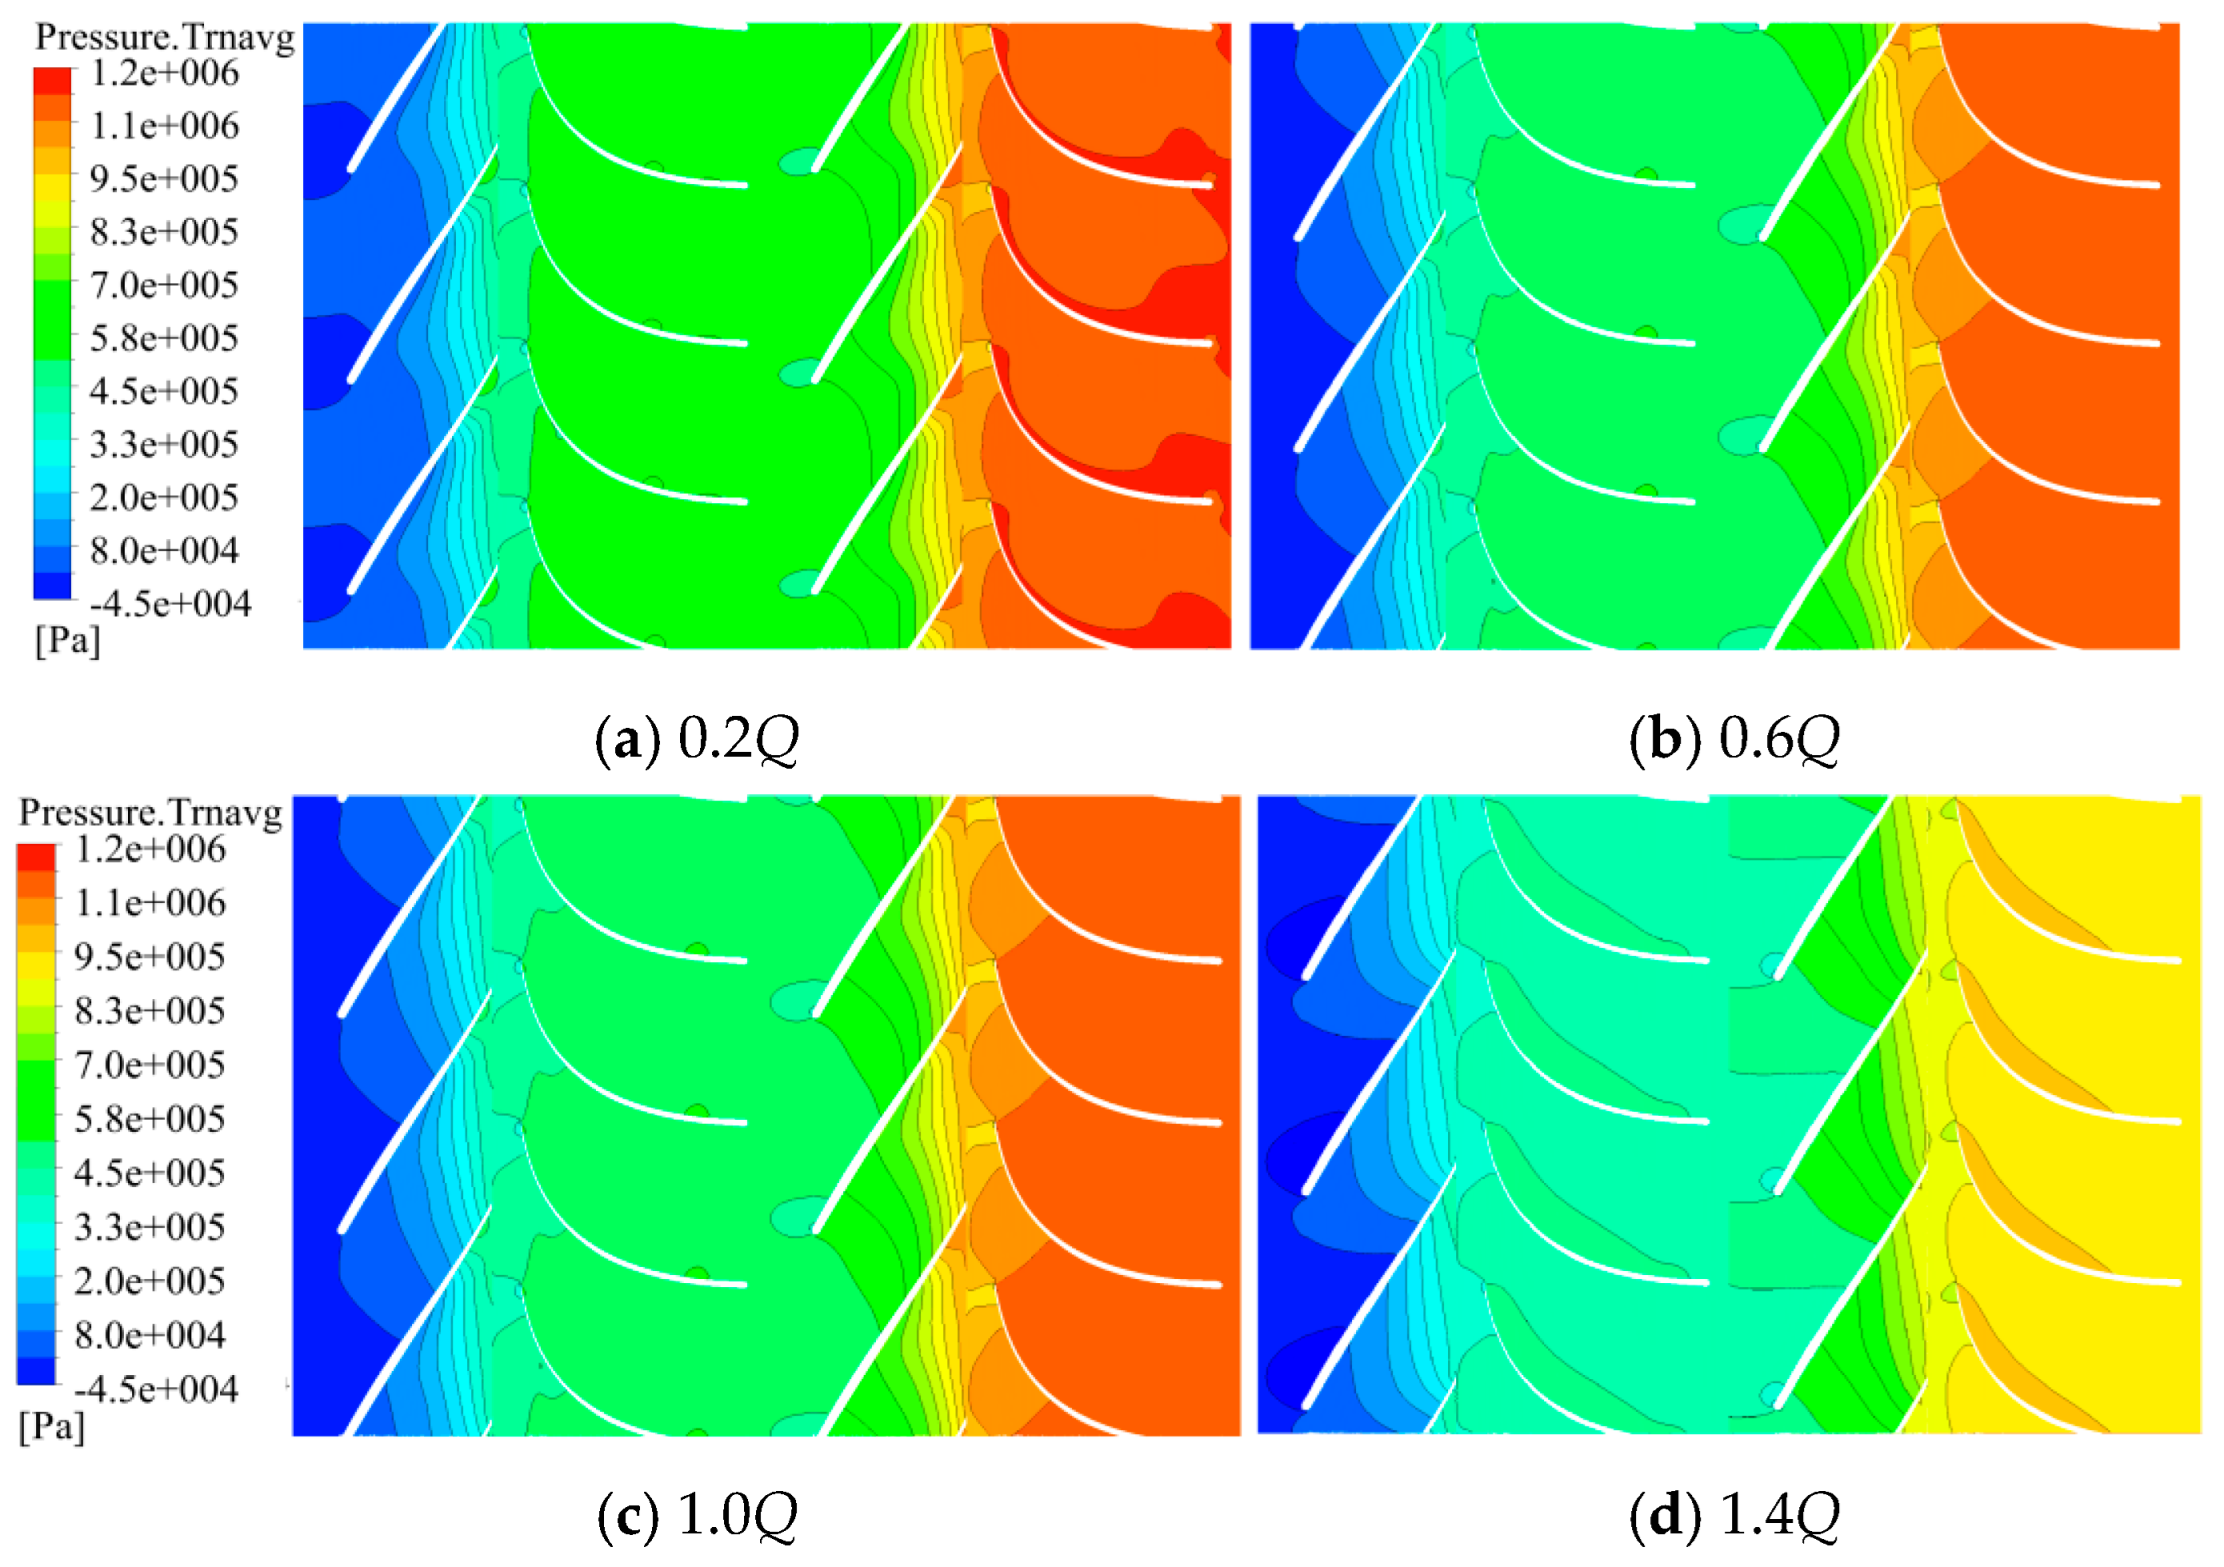
Figure 4 presents the time-averaged distribution of the pressure field on the height of the mining lift pump mid-blade under four different operating conditions.
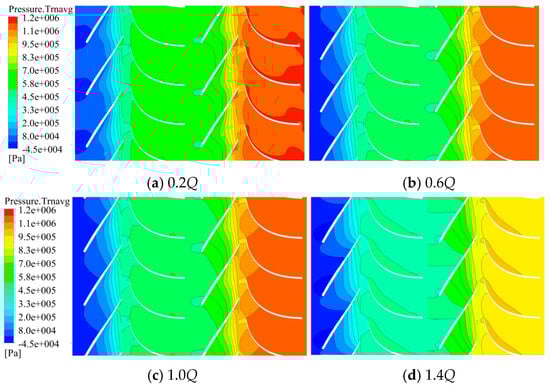
Figure 4.
Time-averaged pressure field distribution (B2B section).
As depicted in Figure 4, it is evident that as the flow rate increases, there is a gradual decline in pressure within each of the pump’s components. Notably, the lowest pressure is observed at the first-stage impeller’s inlet.
3.1.2. Time-Averaged Velocity Field Distribution Characteristics
Figure 5 illustrates the time-averaged distribution of the absolute velocity field of the mining lift pump at mid-blade height under four different operating conditions.
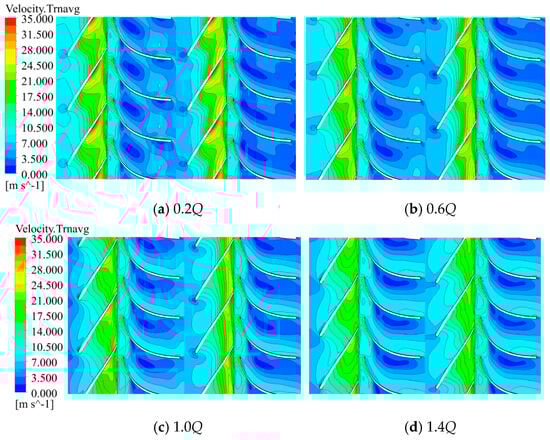
Figure 5.
Time-averaged absolute velocity field distribution.
As is discernible from the above Figures, the pump’s operating conditions have a small impact regarding the velocity of guide vanes, while they have a significant influence on the impeller speed, which gradually decreases along with the increasing flow rate. Additionally, the peak value appears proximate to the outlet region of the impeller.
3.1.3. Time-Averaged Turbulent Kinetic Energy Field Distribution Characteristics
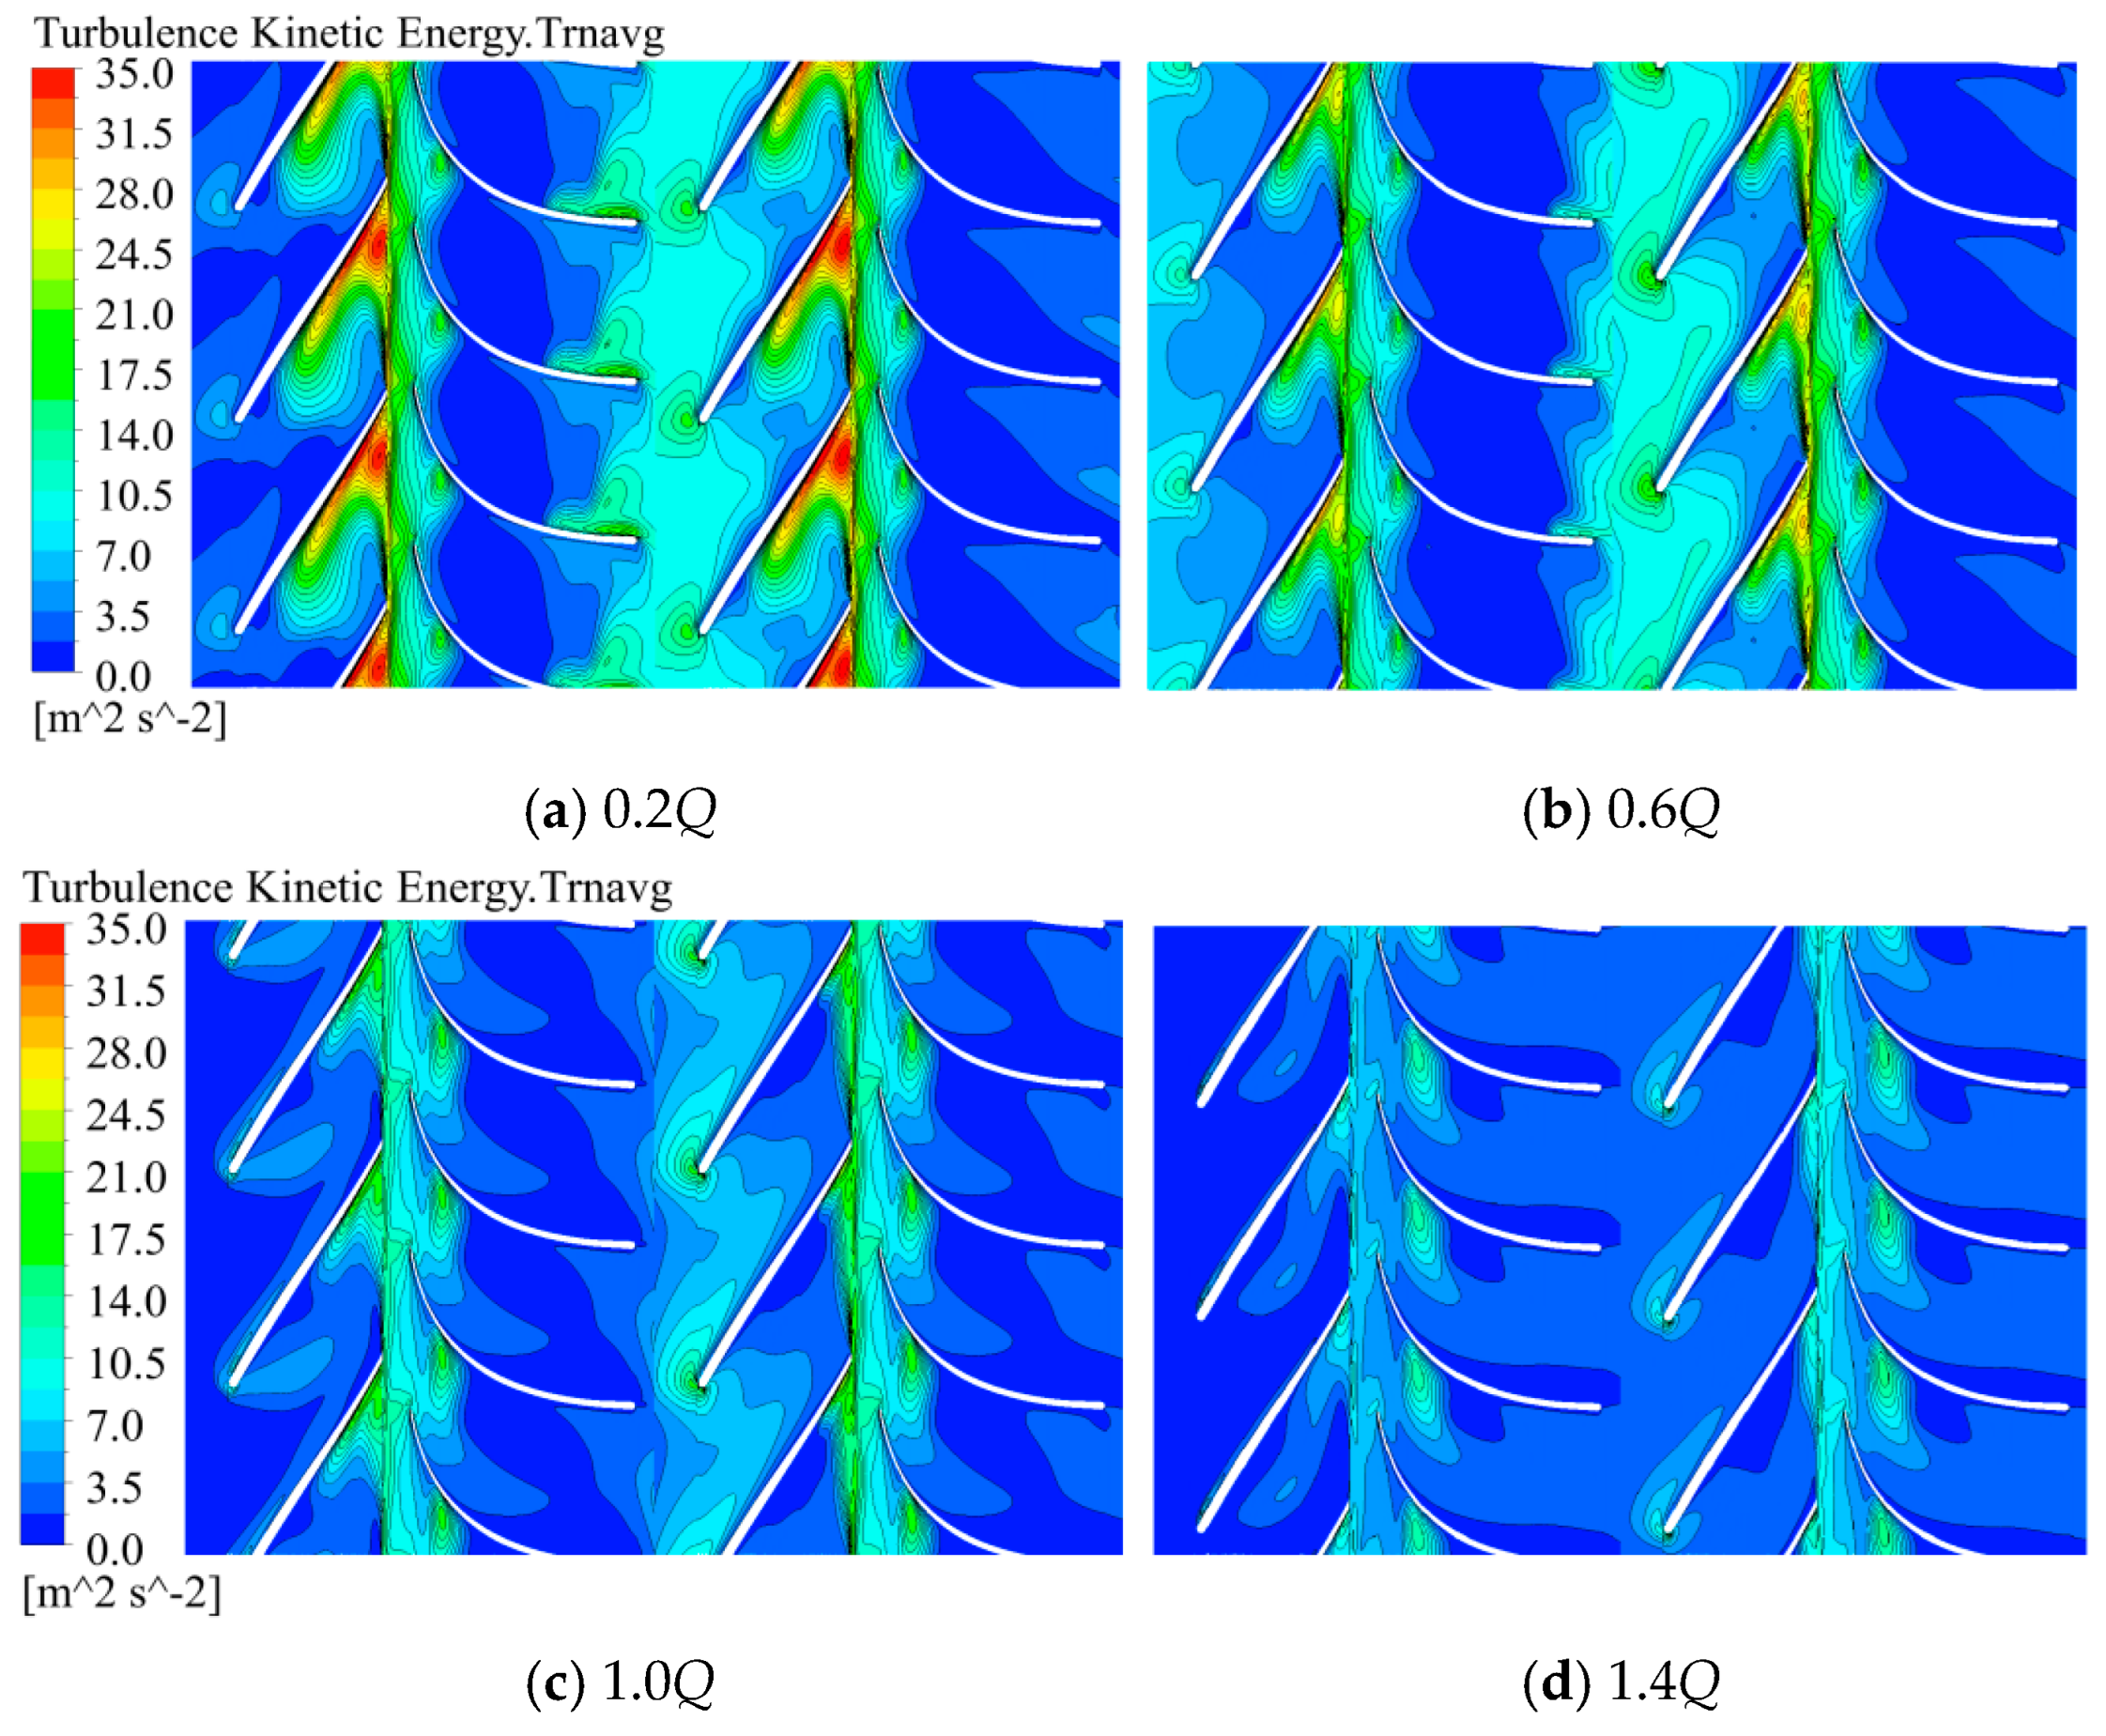
Figure 6 shows the time-averaged turbulent kinetic energy field of the mining lift pump at mid-blade height under four different operating conditions.
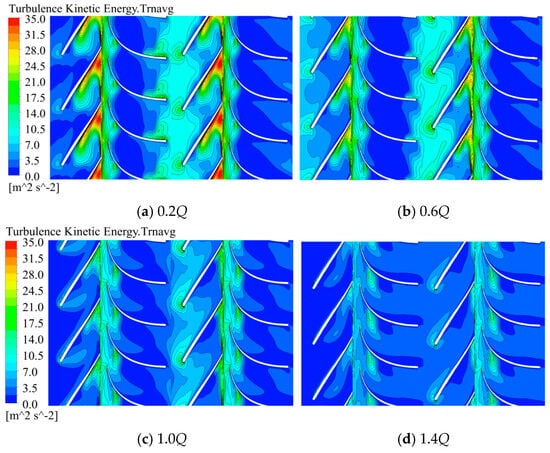
Figure 6.
Time-averaged turbulent energy field distribution.
It can be seen from Figure 6 that under the various operating conditions examined, near the outlet of the impeller, the pump exhibits the most obvious patterns of turbulent kinetic energy, significantly exceeding the performance of other flow-passage components. Moreover, along with the increasing pump inlet flow rate, the turbulent kinetic energy gradually decreases.
These analysis results indicate that both static and dynamic obstructions between the impeller and guide vanes have an important influence on the distribution characteristics in terms of pressure, velocity, and turbulent kinetic energy.
3.2. Flow Field Pulsation Intensity Analysis
Statistical methods were used to delve into unstable
flow characteristics within the pump. Periodic unstable physical quantity at
the calculation grid node (x, y, z) in the flow passage
contains a time-averaged component and a periodic
component , the latter of which represents the change in the physical quantity in an impeller rotation cycle. The time-averaged component is expressed by Equation (6), while the periodic component is expressed as:
In Equation (7), n represents the grid node, N represents the number of samples within one impeller rotation cycle, and t0 represents the starting time point of a rotation period. Standard deviations of the non-dimensional periodic component are delimited using flow-field pulsation intensity coefficients, which include the pressure pulsation intensity coefficient , velocity pulsation intensity coefficient , and turbulent kinetic energy pulsation intensity coefficient .
The pressure pulsation intensity coefficient is defined as:
The velocity pulsation intensity coefficient is defined as:
The turbulent kinetic energy pulsation intensity coefficient is defined as:
The turbulent kinetic energy pulsation intensity coefficient is defined as:
U2 in Equations (8)–(10) indicates the circumferential speed at the impeller outlet.
3.2.1. Pressure Pulsation Intensity Field
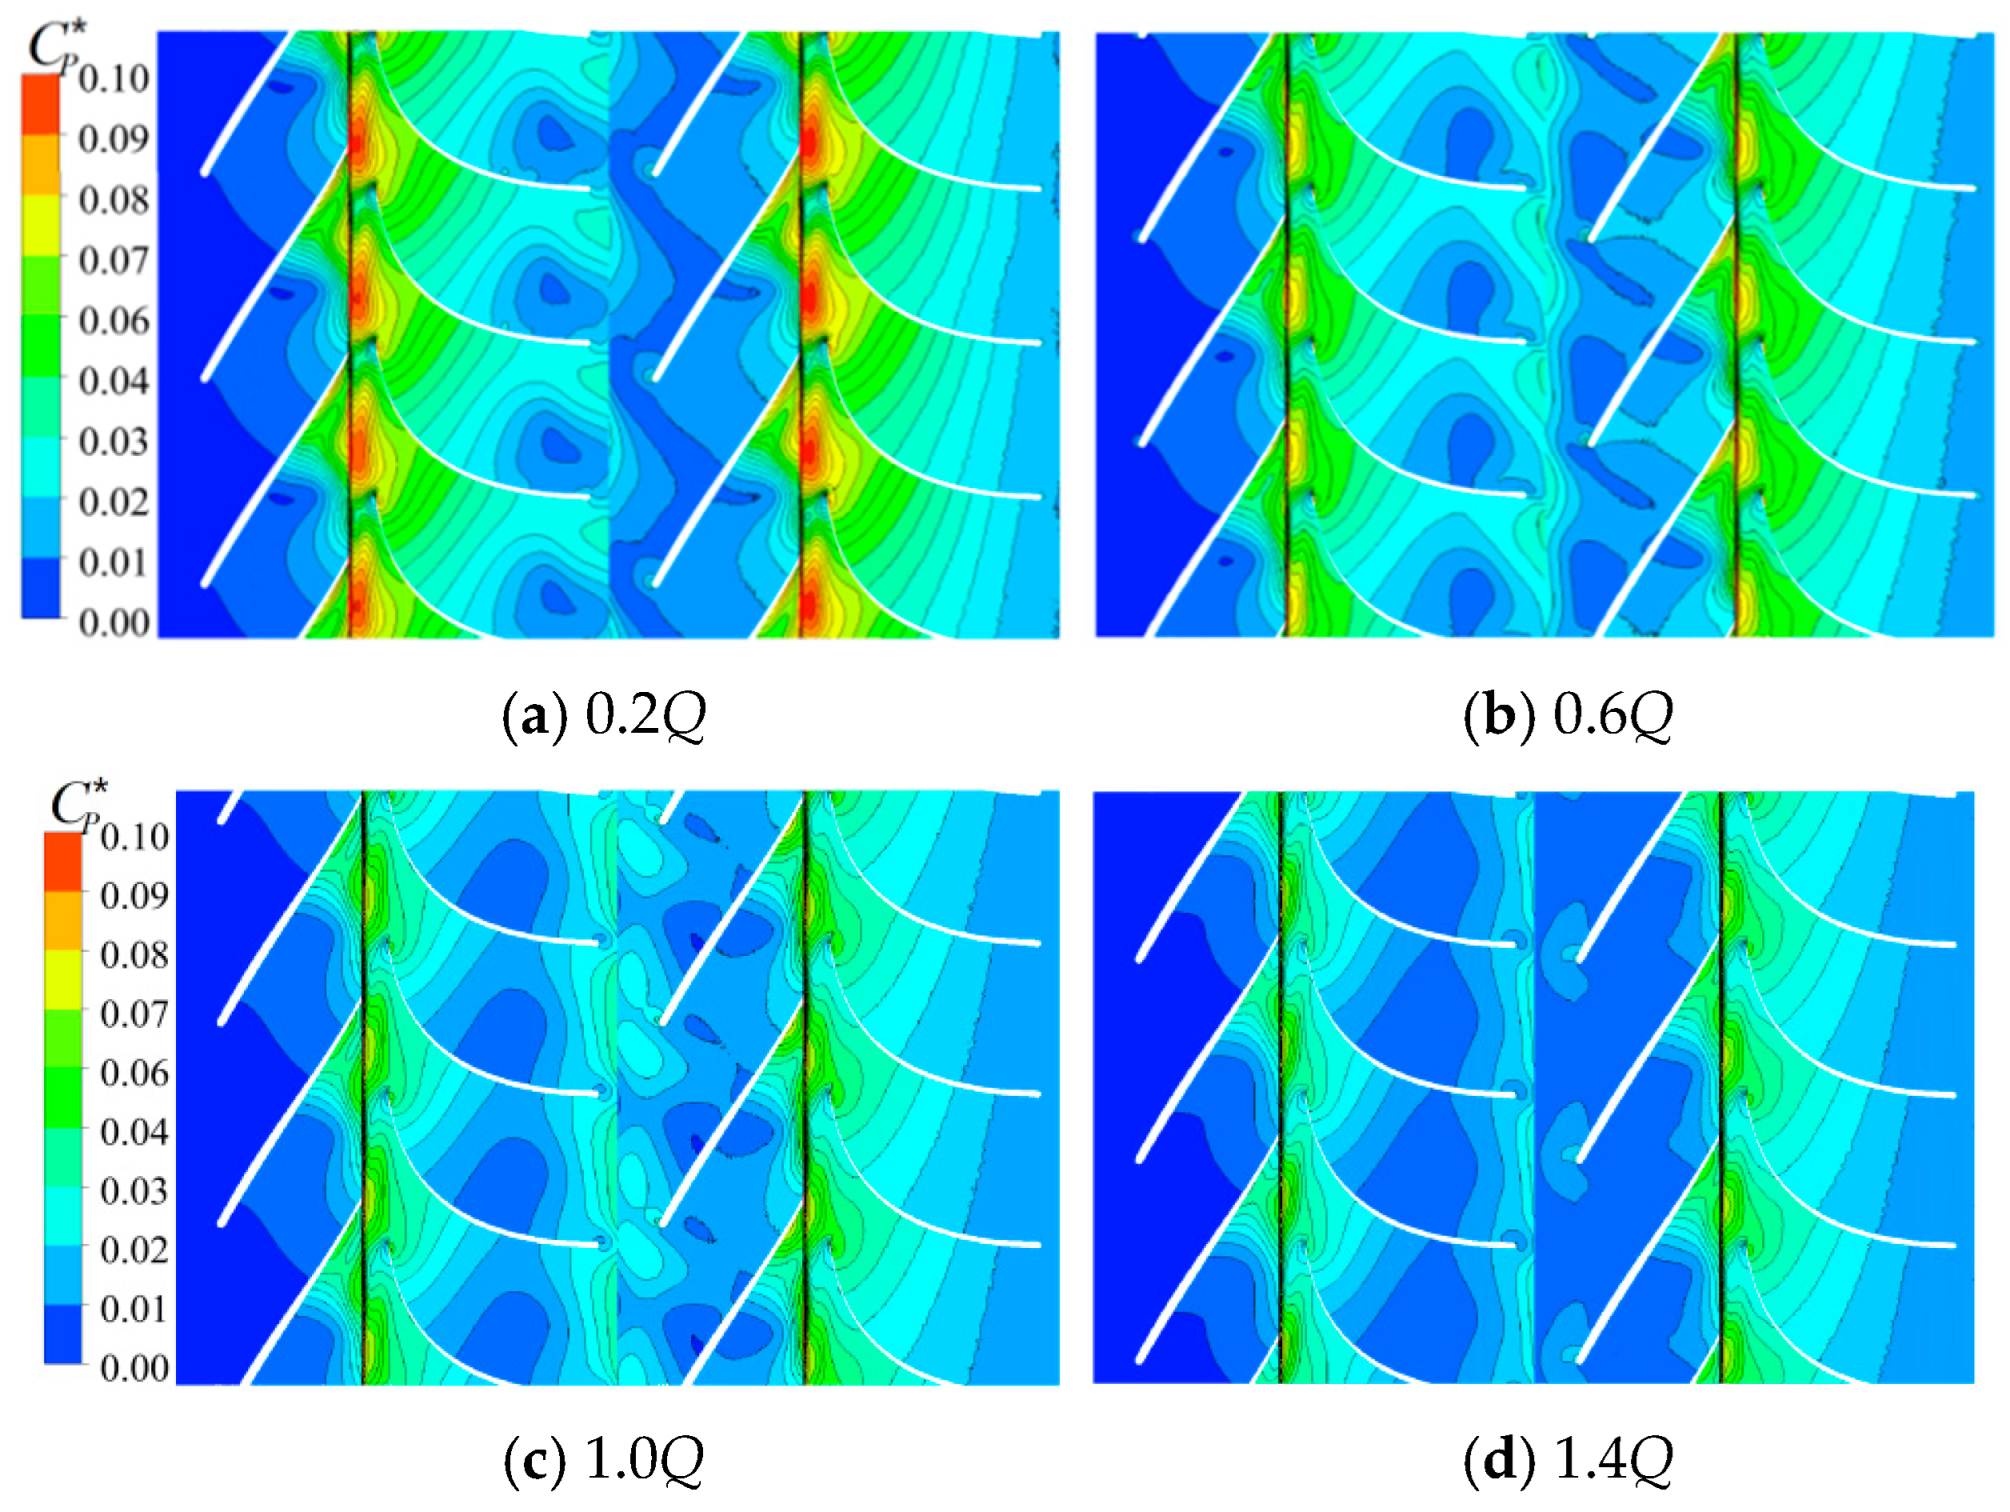
Figure 7 shows the pressure pulsation intensity at the height of the mining lift pump’s mid-blade under four different operating conditions.

Figure 7.
Pressure pulsation intensity field.
As depicted in Figure 7, the pressure pulsation intensity in the impeller and guide vanes significantly exceeds the values of the other flow passage components because of the interference from moving and static cascades, and the maximum intensity appears at the guide vanes’ entrance. Along with an increasing flow rate, the intensity near the interface between the impeller and the guide vanes gradually weakens.
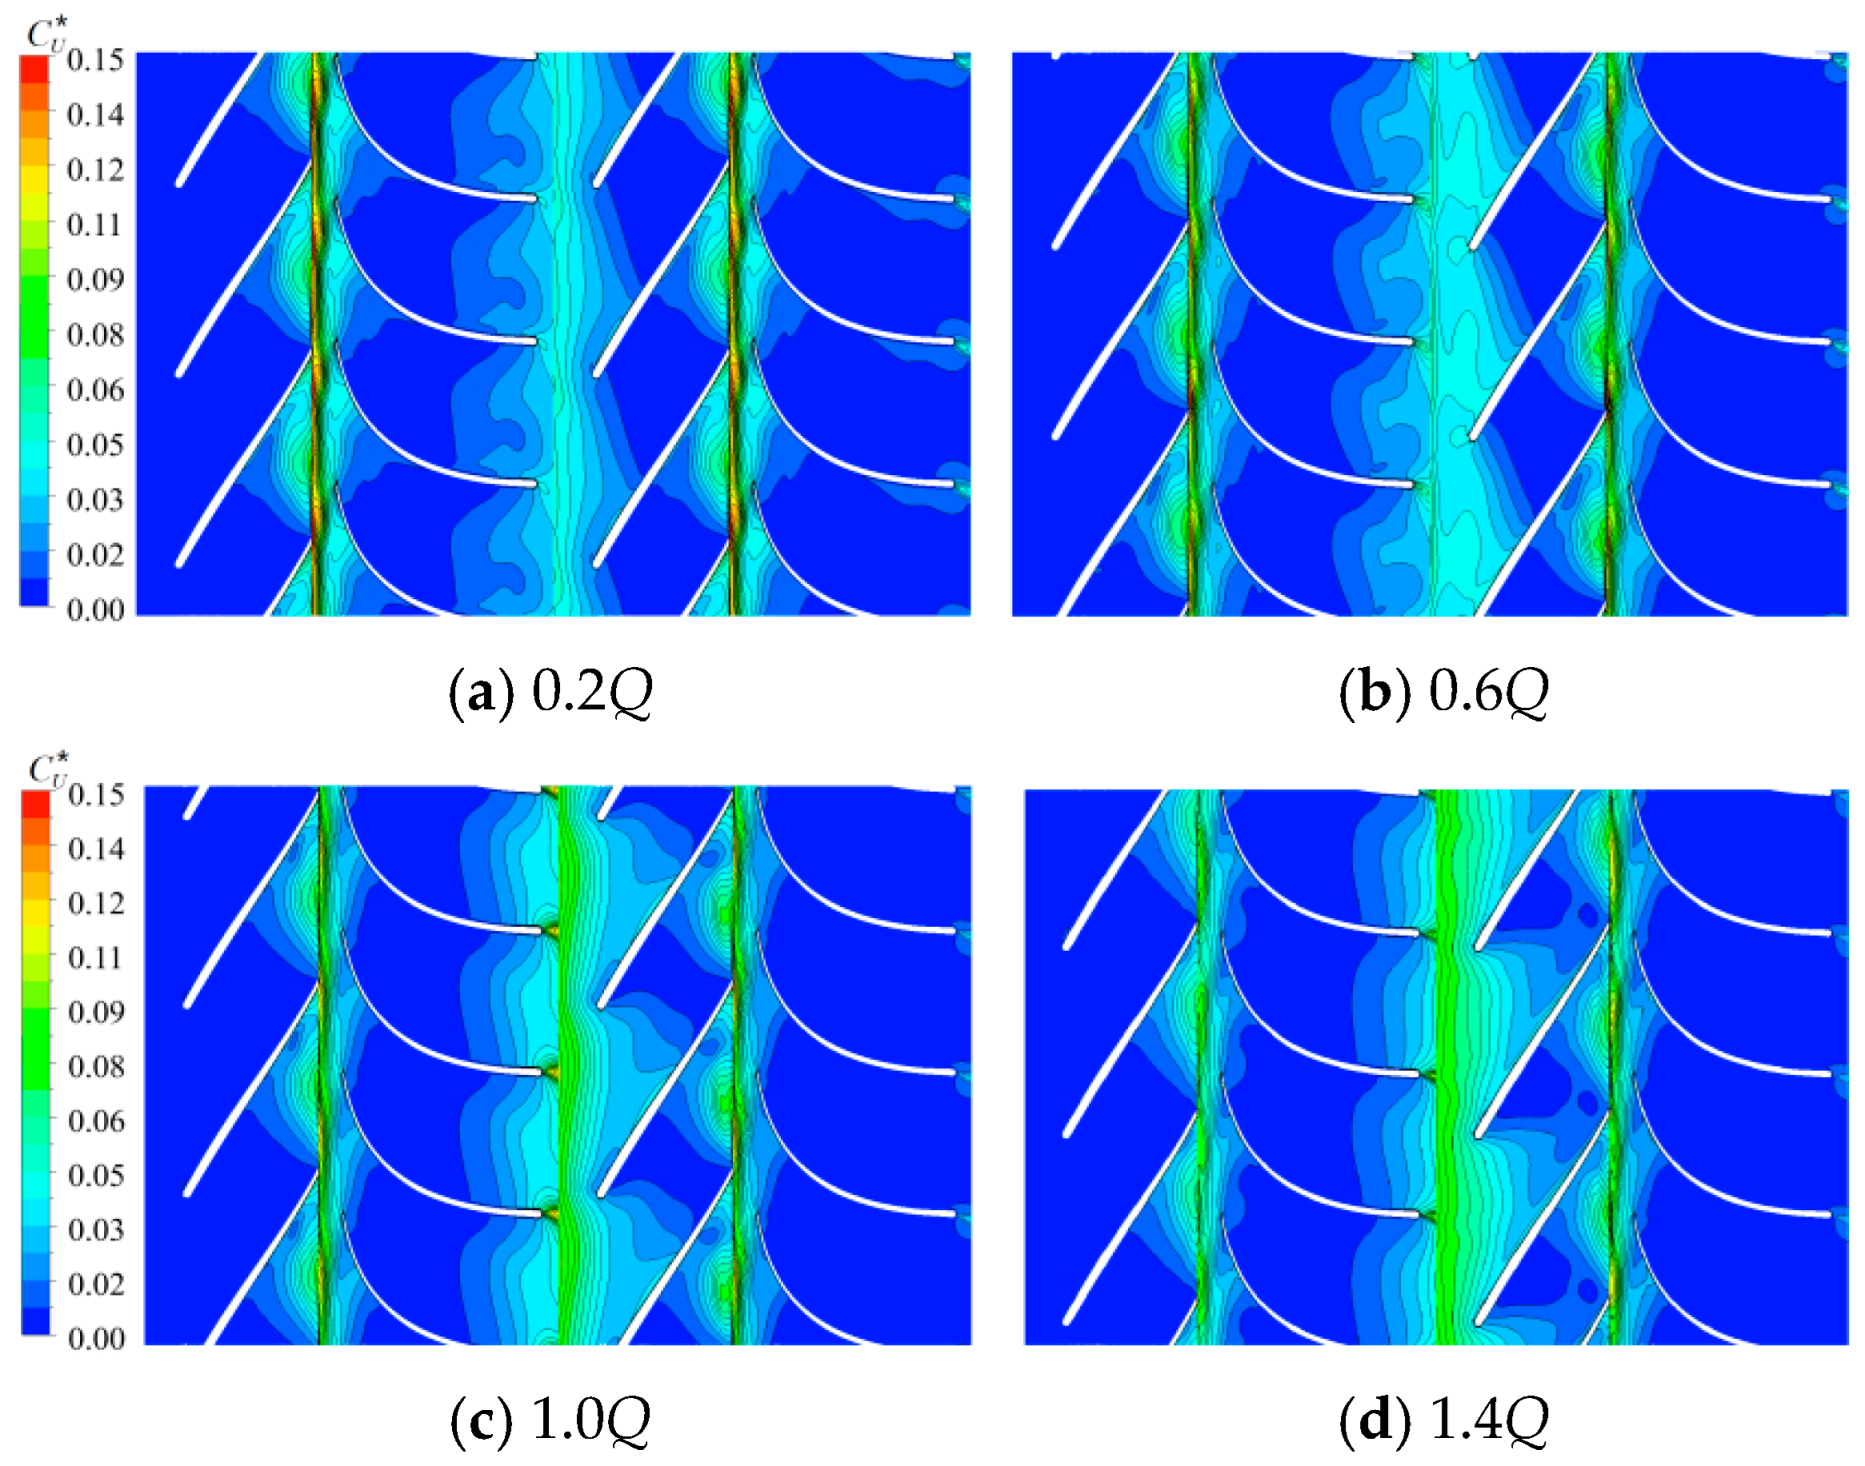
3.2.2. Velocity Pulsation Intensity Field
Figure 8 illustrates the velocity pulsation intensity at the height of the mining lift pump’s mid-blade under four different operating conditions.

Figure 8.
Absolute velocity pulsation intensity field.
As shown in Figure 8, similar to pressure pulsation intensity distribution, the velocity pulsation intensity in the impeller and guide vanes significantly exceeds the values of other flow passage components because of interactions between the dynamic impeller blades and static guide vane blades. The maximum intensity appears in the regions of the outlet of the impeller and the inlet of the guide vane. Along with an increasing flow rate, the velocity pulsation intensity at various locations near the impeller and guide vanes is strengthened.
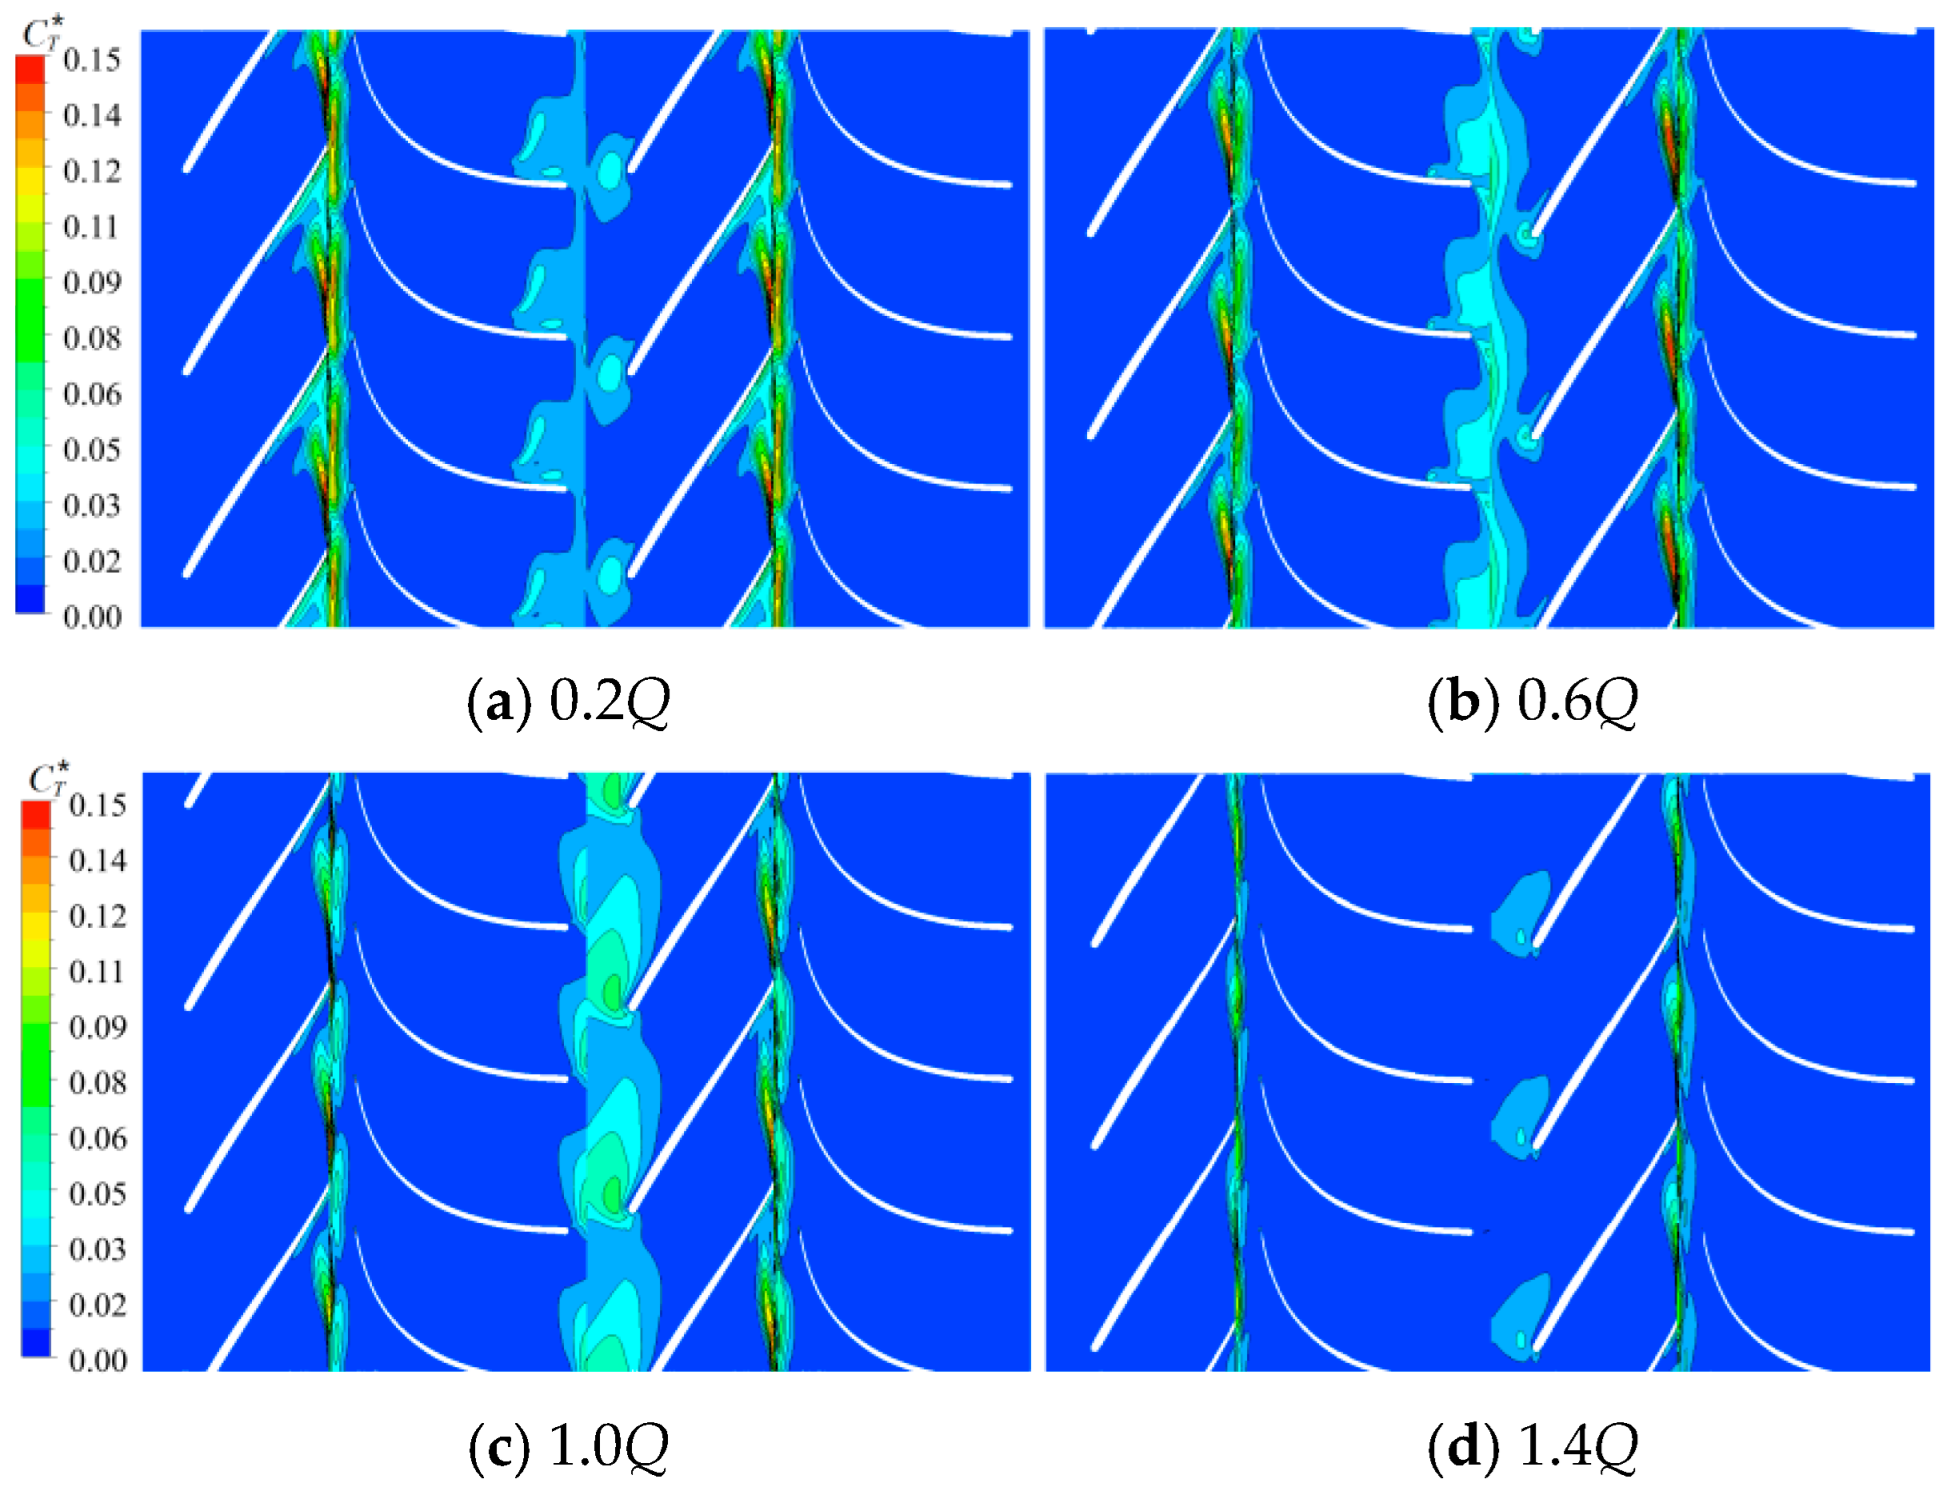
3.2.3. Turbulent Kinetic Energy Pulsation Intensity Field
Figure 9 shows the turbulent kinetic energy pulsation intensity at the height of the mining lift pump’s mid-blade under four different operating conditions.
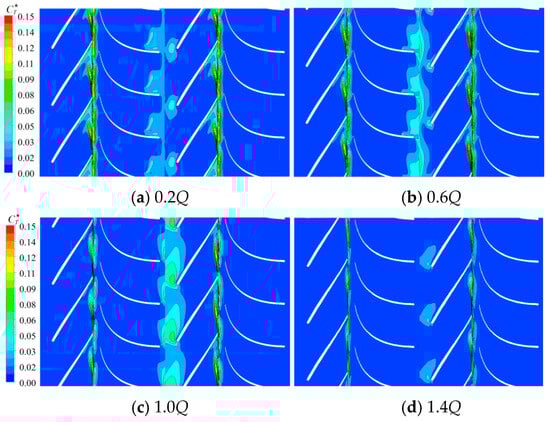
Figure 9.
Turbulent kinetic energy intensity field.
As shown in Figure 9, like pressure distribution and velocity pulsation intensity, the turbulent kinetic energy pulsation intensity at the junction between the impeller and the guide vanes significantly exceeds the values of other flow-passage components because of interactions between the dynamic impeller blades and the static guide vane blades. Moreover, along with an increasing pump inlet flow rate, the pulsation intensity in the boundary region between the moving and static cascades gradually weakens.
Figure 8 and Figure 9 show the pulsation intensity at the junction region between the impeller and the guide vanes exceeds that of the other flow-passage regions. This demonstrates that the interactions between dynamic impeller blades and static guide vane blades have a significant influence on the pulsation intensity of the internal flow field of an electric mining pump working at depth in the sea.
3.3. Spatiotemporal Evolution Mechanism and Characteristics of Vortices in Moving and Static Cascades
Because the interaction between the dynamic impeller blades and the static guide vane blades greatly influences the pulsation intensity of a mining lift pump’s internal flow field, this study adopts a transient analysis method to research the formation and evolution of vortices in the mining lift pump’s impeller and guide vanes under four different working conditions. This approach may achieve a deeper comprehension of pulsation characteristics and the formation mechanism of a mining lift pump’s internal flow field by examining the vortex flow process in the moving and static cascades.
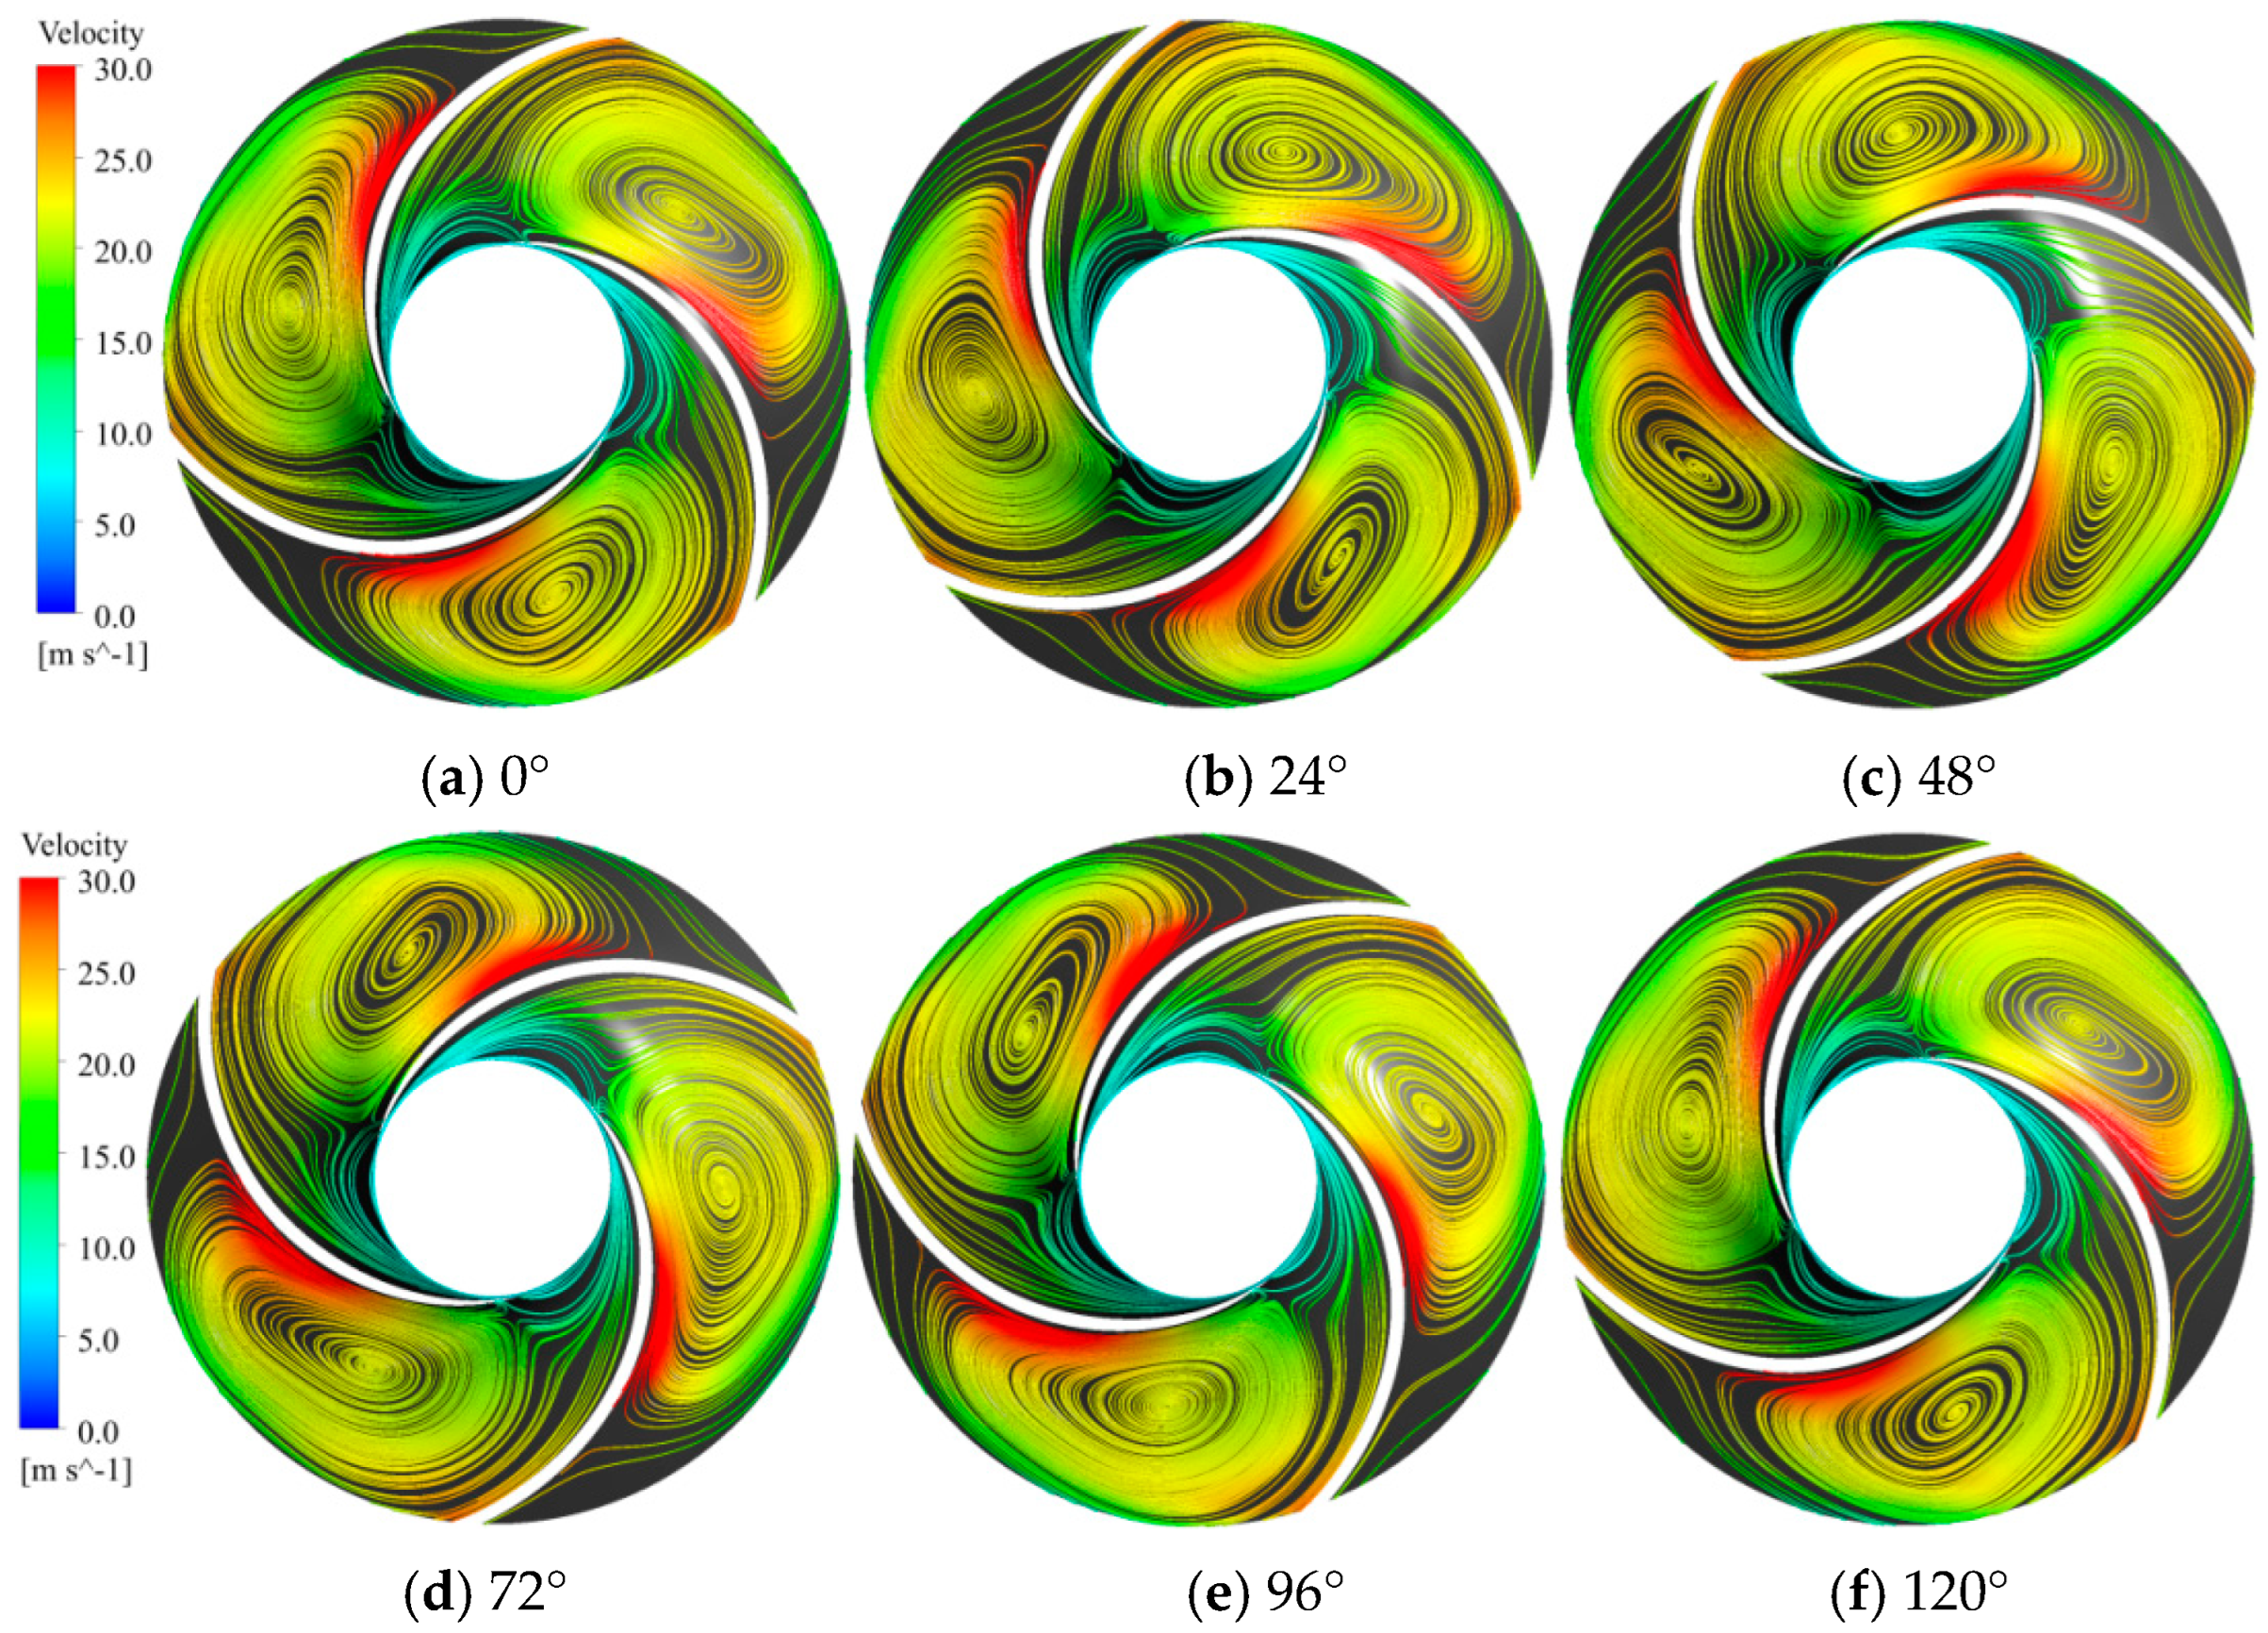
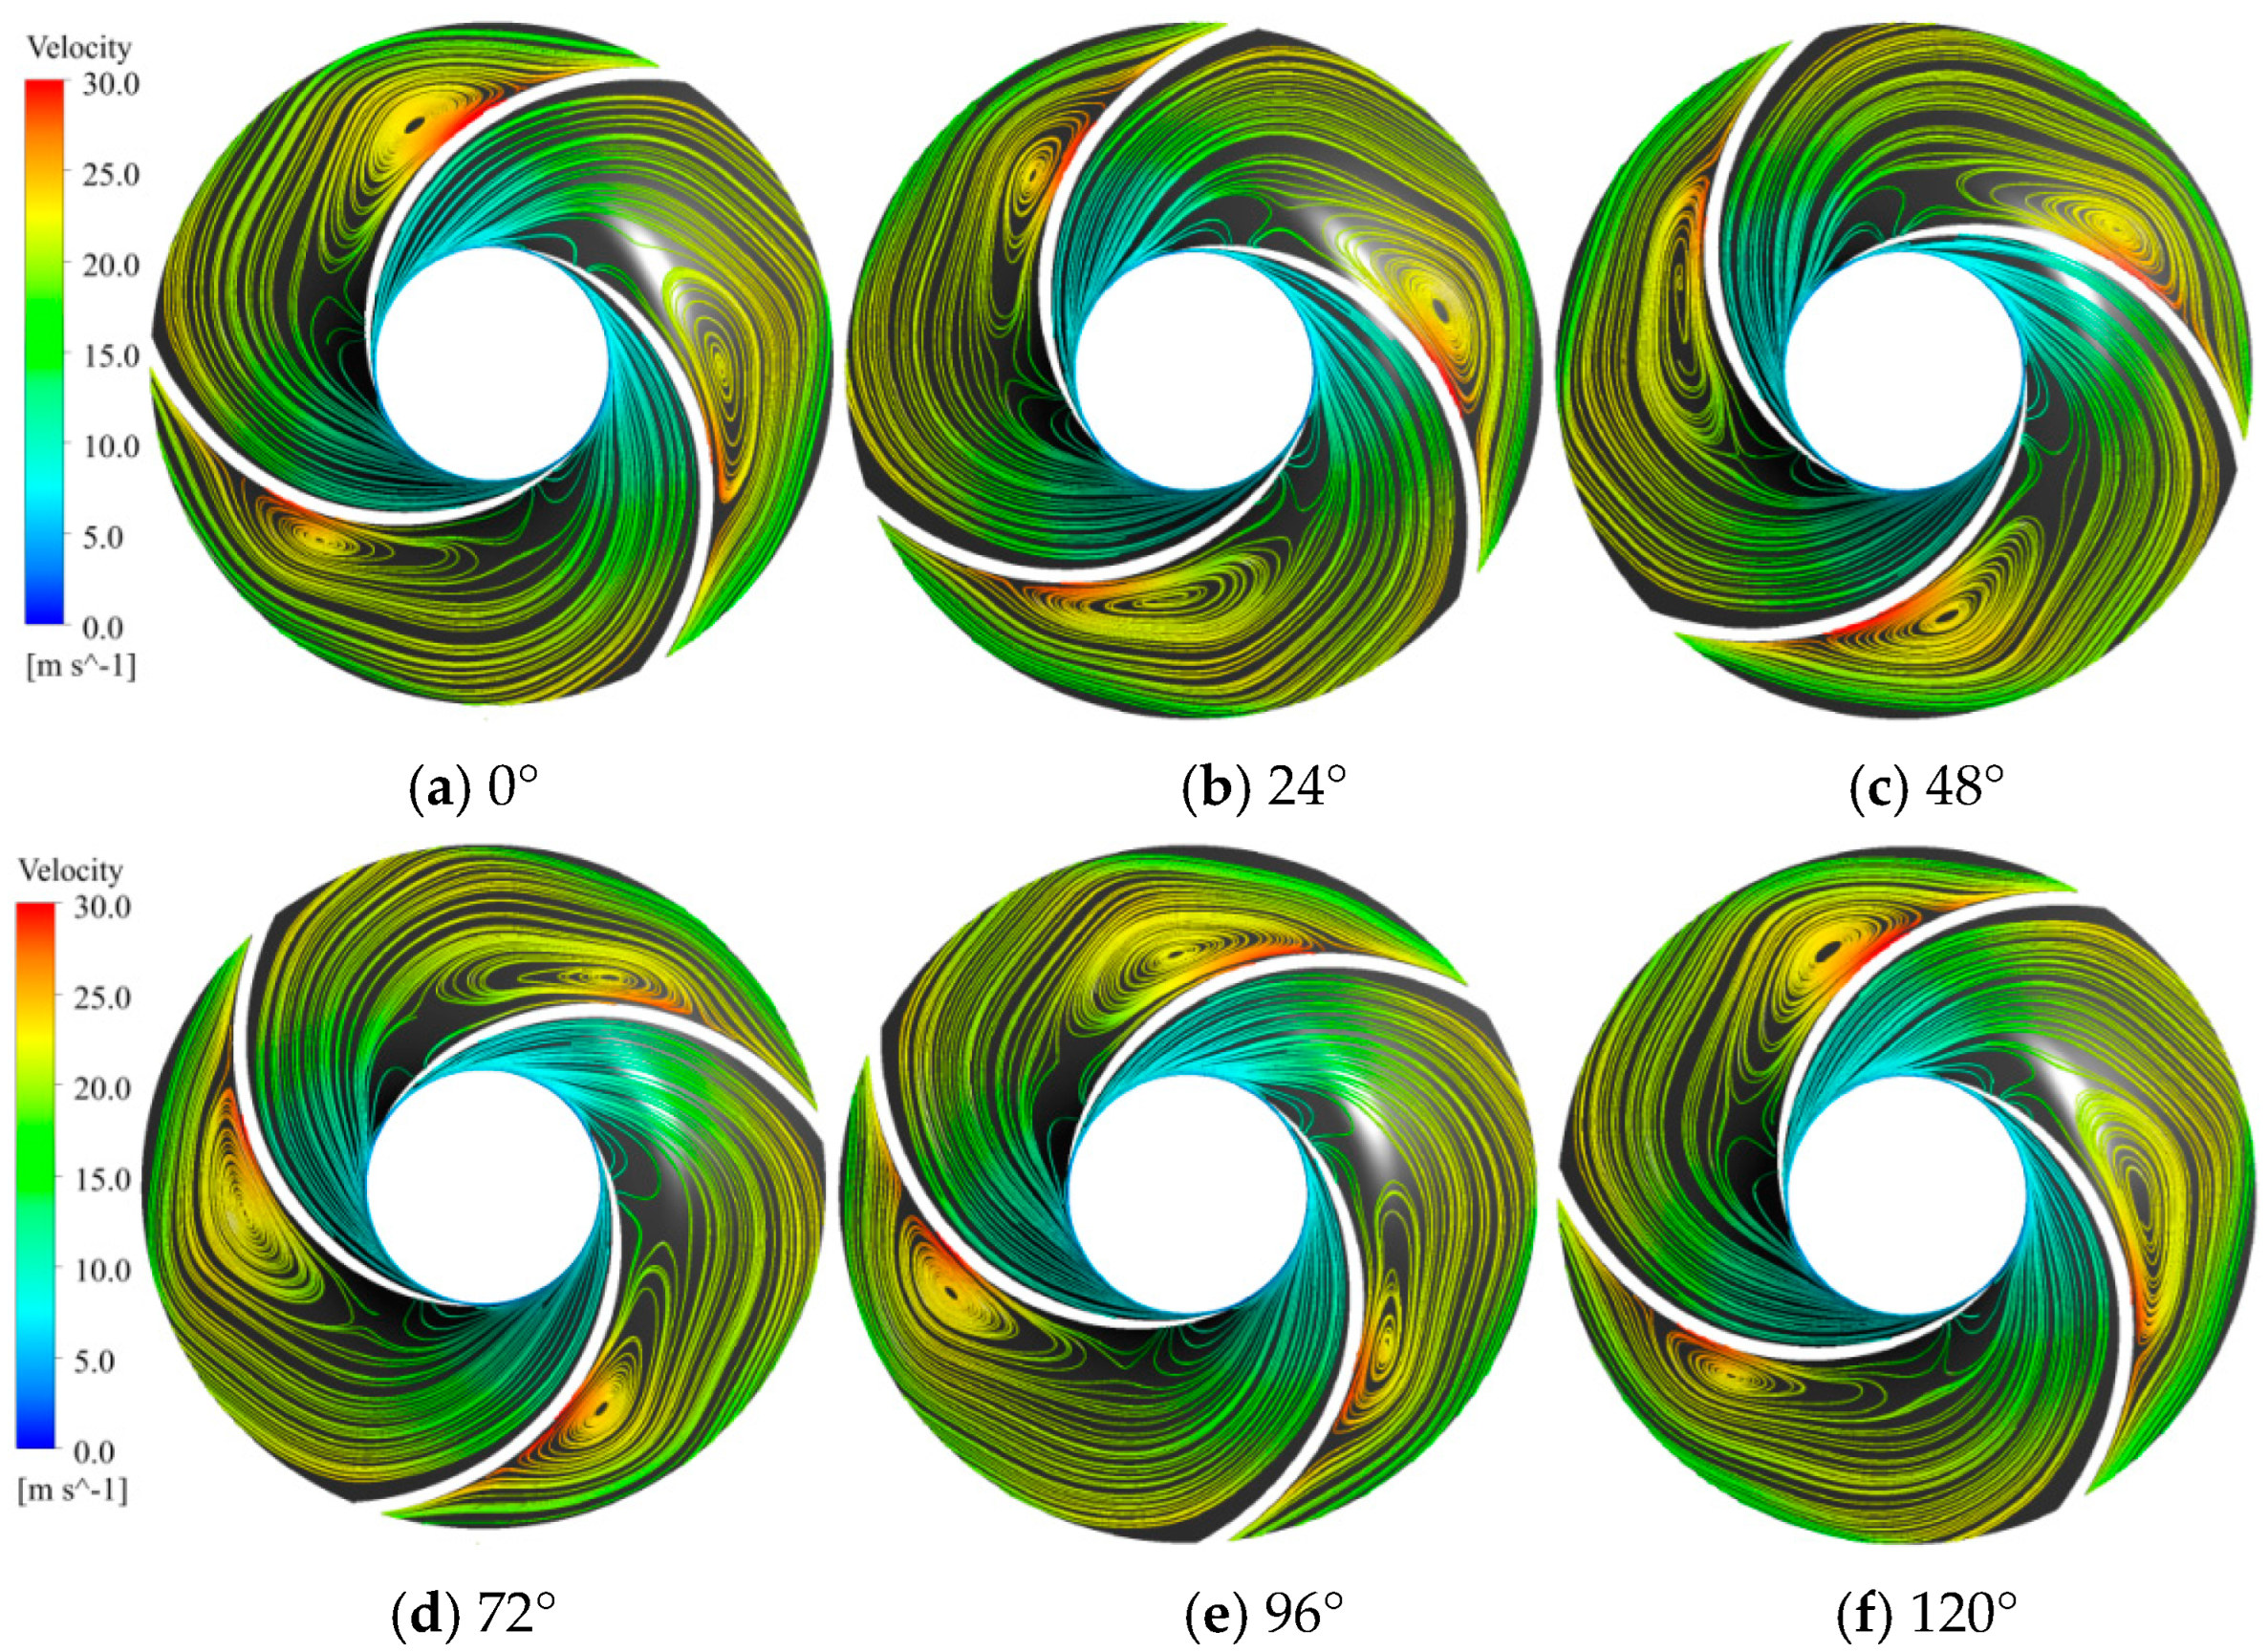
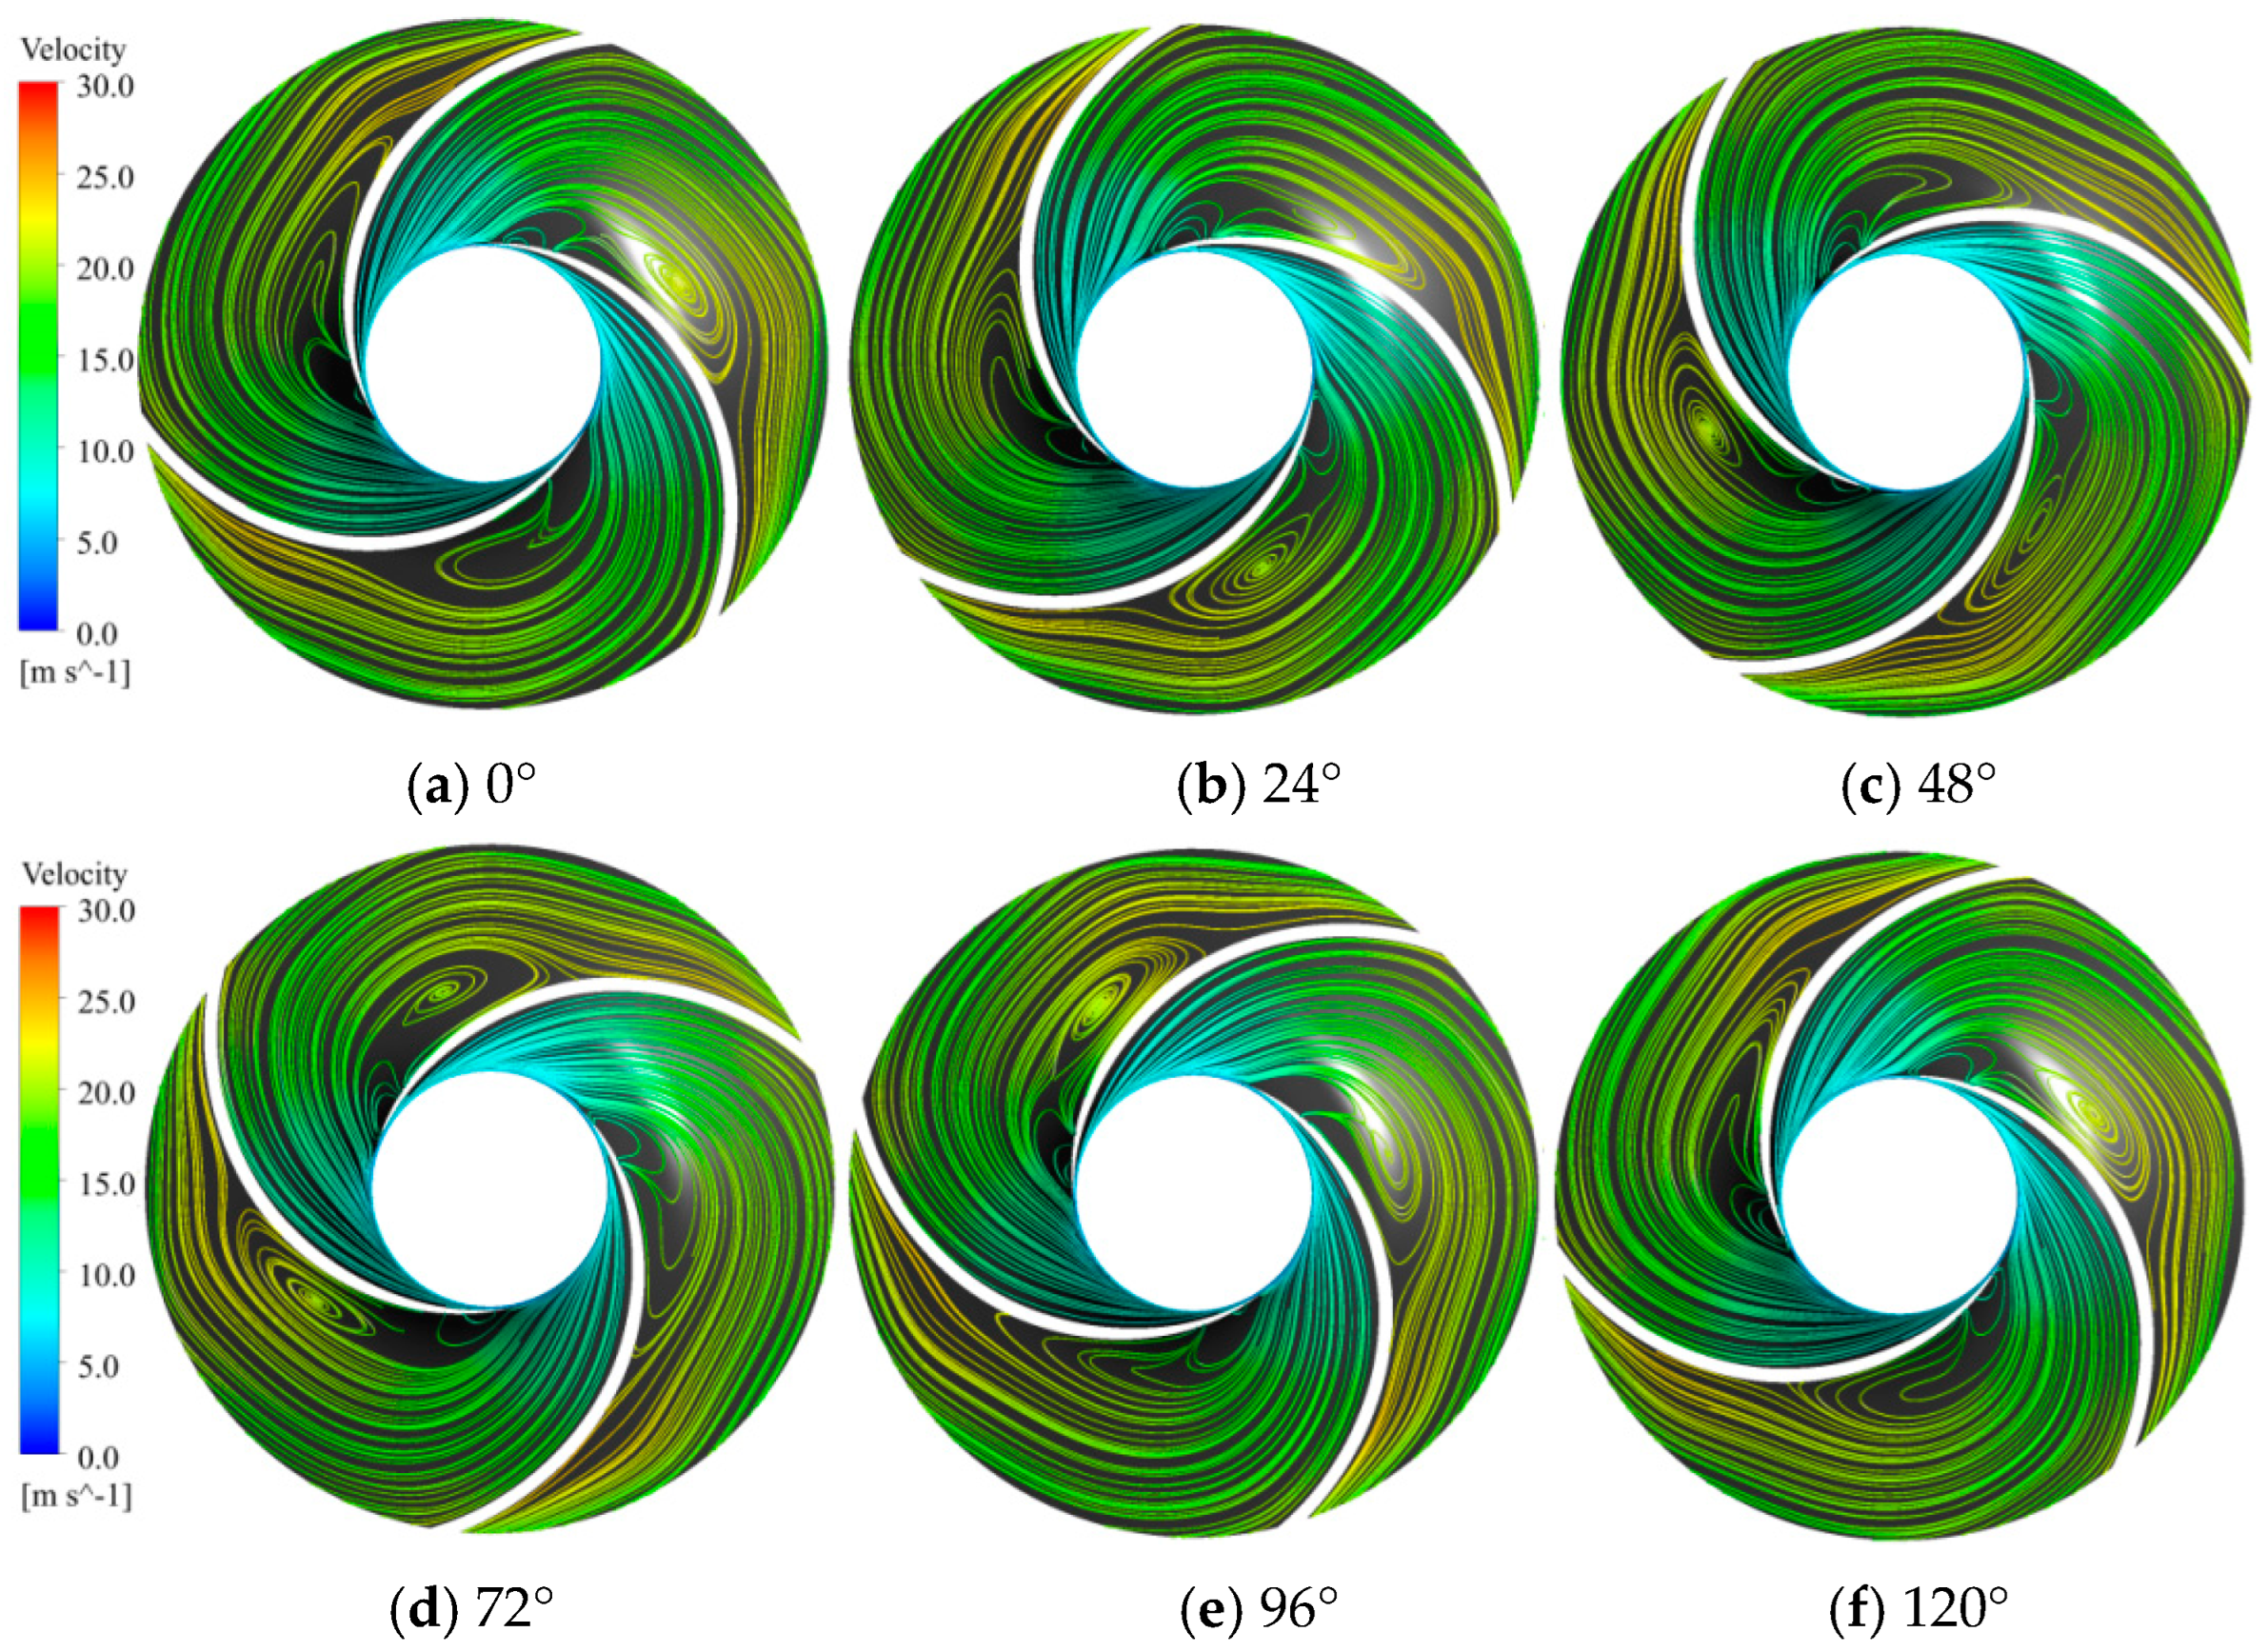
Figure 10, Figure 11, Figure 12, Figure 13 and Figure 14 show the evolution of the vortices inside the impeller and around the guide vanes during a rotation of 1/3 of a cycle (120°) of the first-stage impeller under four different operating conditions. Considering the uniform arrangement of the three blades in the model pump impeller’s circumferential direction, the flow behavior that was captured over 1/3 of a cycle provides a representative glimpse into the transient flow characteristics that span the whole impeller rotation cycle.
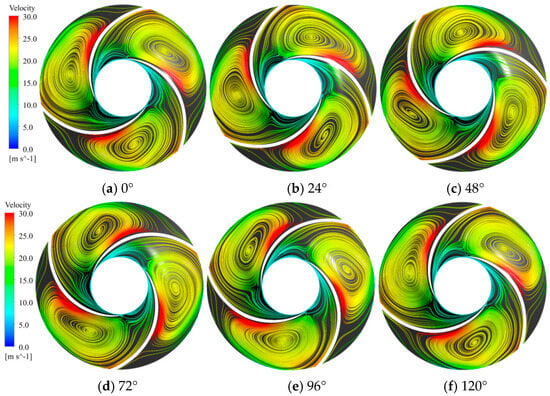
Figure 10.
Vortex evolution of 1/3 of the impeller rotation cycle (120°) with 0.2Q.
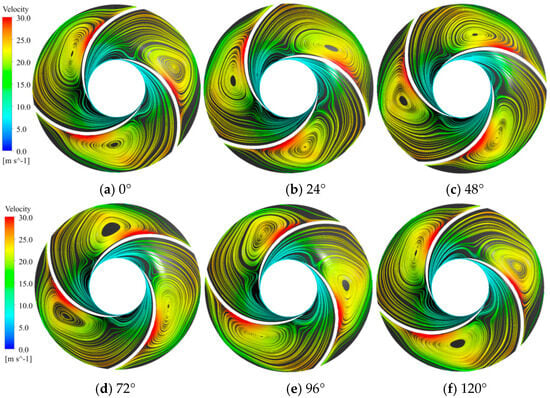
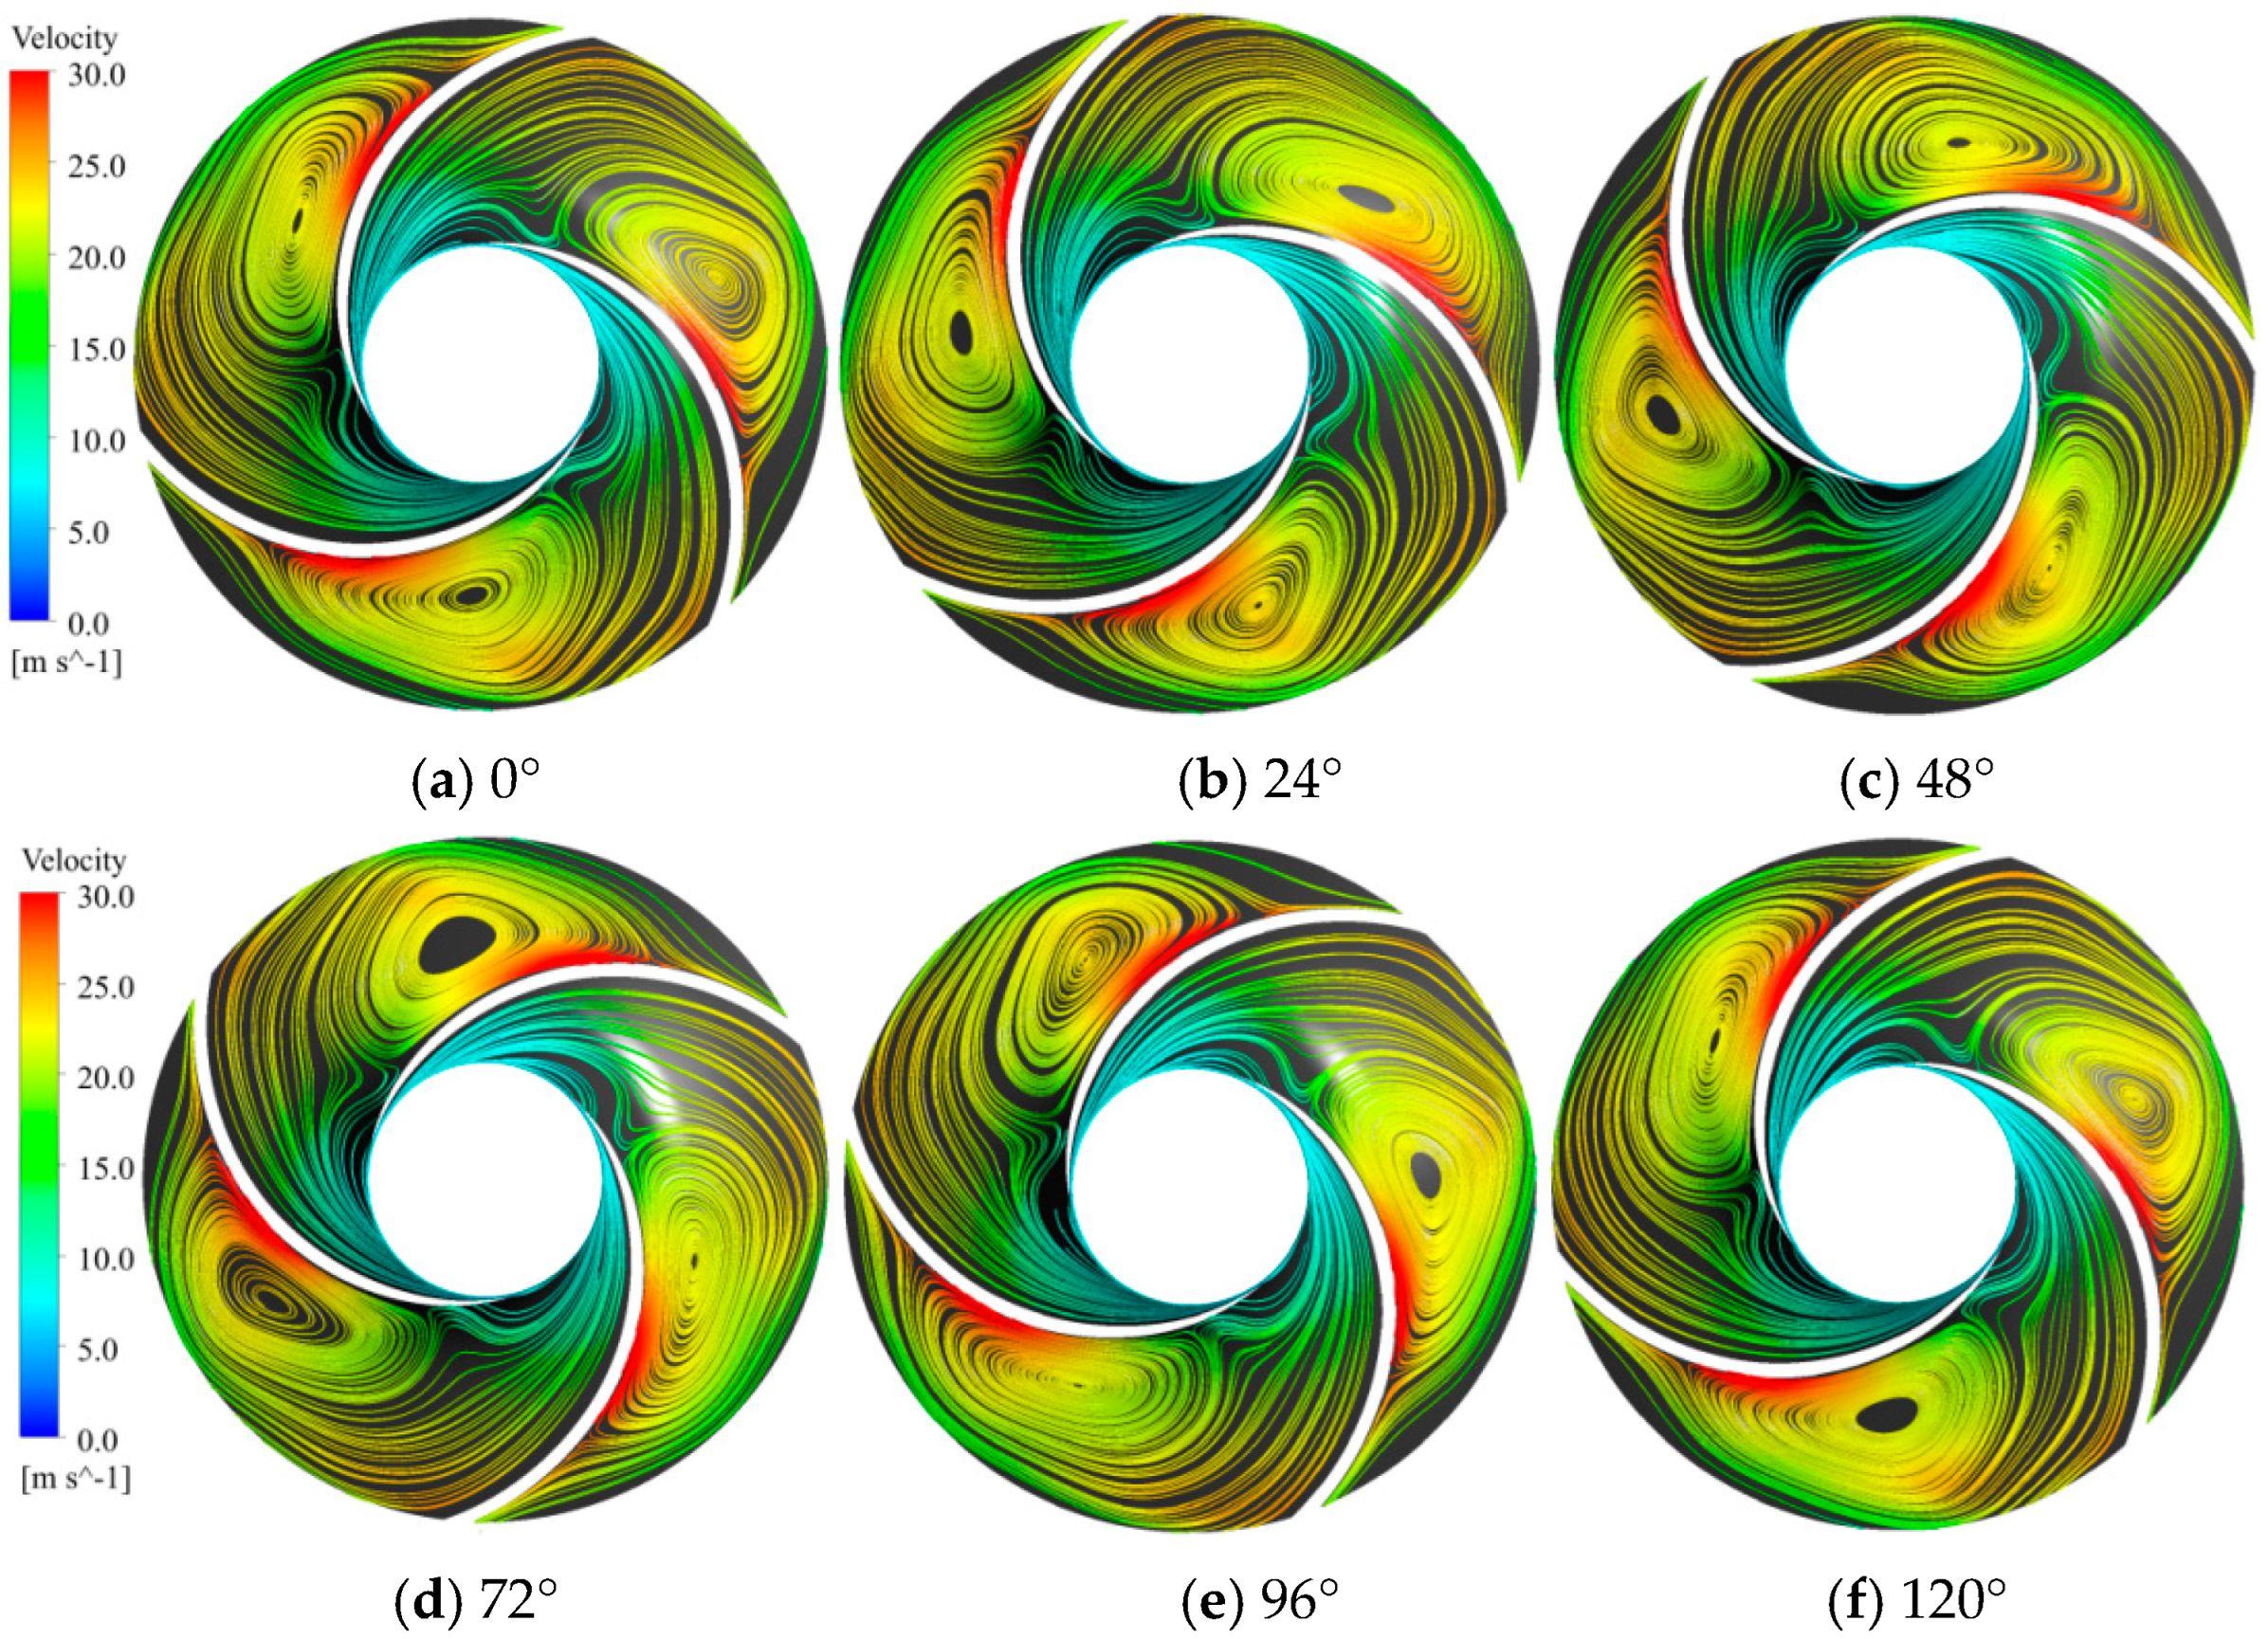
Figure 11.
Vortex evolution of 1/3 of the impeller rotation cycle (120°) with 0.6Q.

Figure 12.
Vortex evolution of 1/3 of the impeller rotation cycle (120°) with 1.0Q.

Figure 13.
Vortex evolution of 1/3 of the impeller rotation cycle (120°) with 1.4Q.
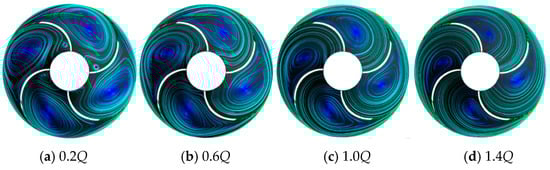
Figure 14.
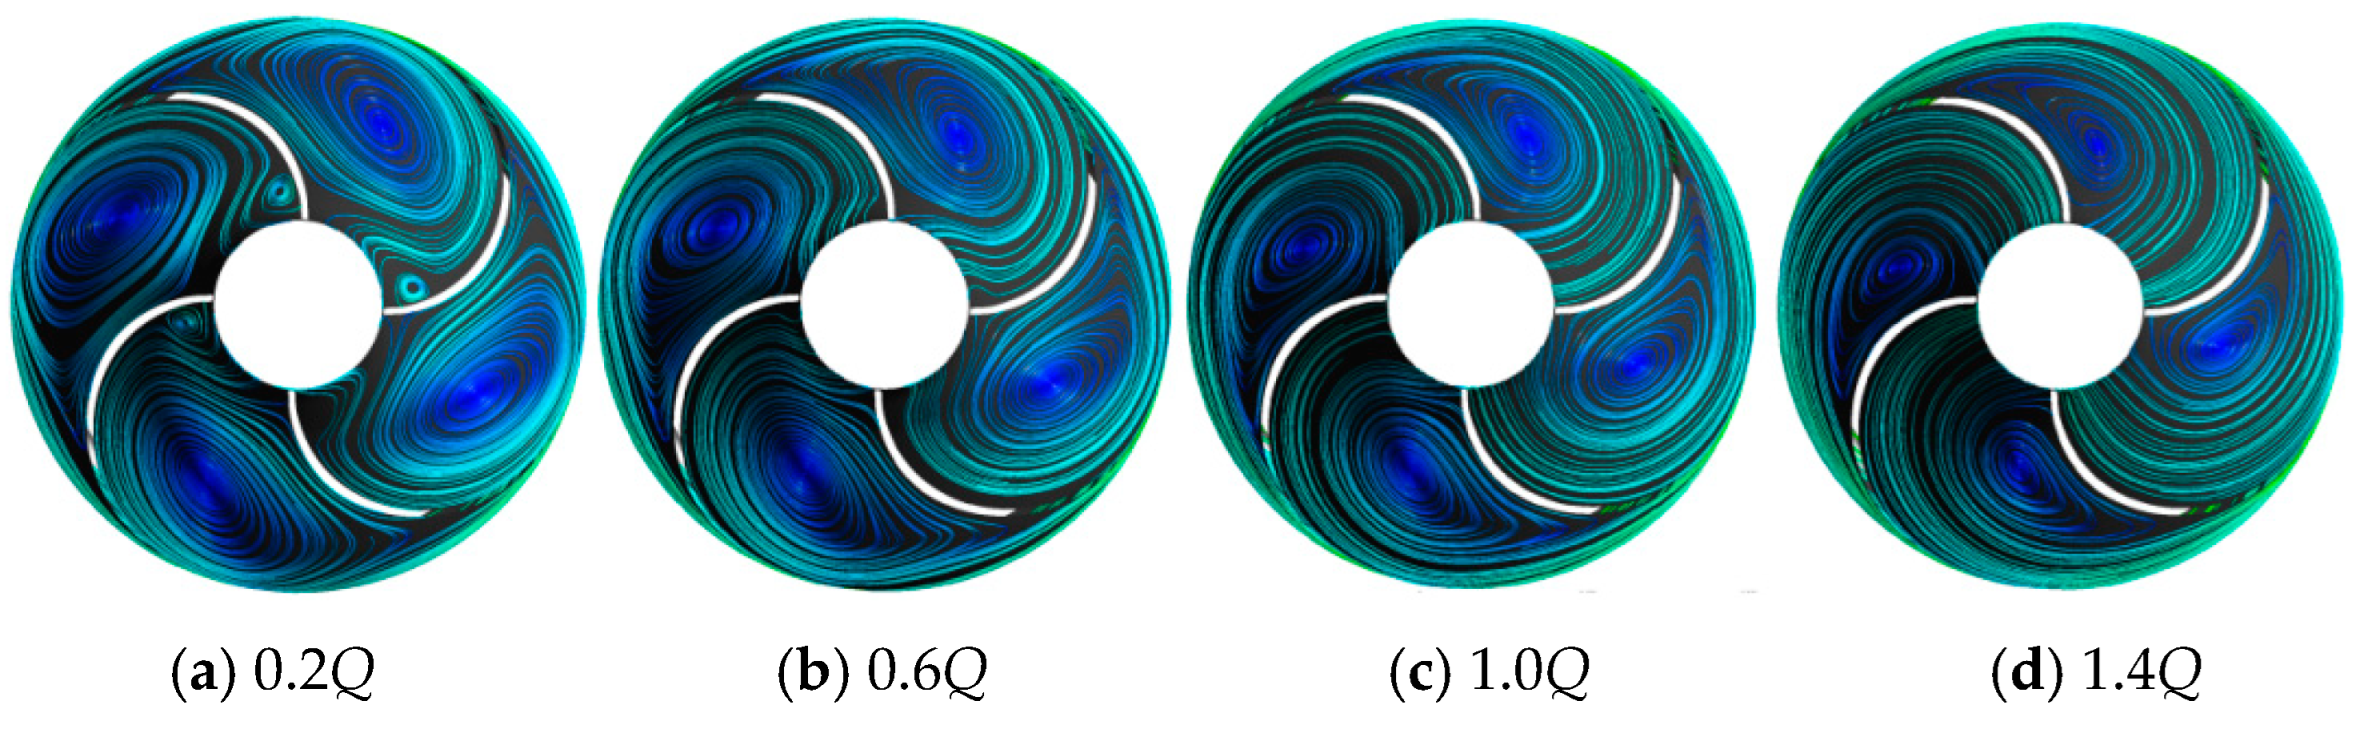
Internal vortices of the first-stage guide vane under the four operating conditions.
The following phenomena can be observed from Figure 10, Figure 11, Figure 12, Figure 13 and Figure 14. (1) Due to the small number of blades, the blade’s ability to control the flow field is weak. Within 1/3 of a cycle, there are obvious vortices inside the impeller and around the guide vanes under various operating circumstances. As te flow rate decreases, the presence of vortices becomes more pronounced. (2) Each vortex’s motion and the process of the impeller’s internal flow field in one rotation cycle are related to the constantly changing relative positions between the guide vanes and impeller blades. When two adjacent guide vane channels are present, obvious vortices will be generated on the impeller channel’s side that is proximate to the working surface. (3) The presence of vortices within the impeller flow channel causes a blockage on the guide vane’s inlet. The severity of the blockage intensifies with the prominence of the vortices; this affects the normal stable fluid flow inside the guide vane.
3.4. Internal Flow Field Pressure Pulsation Characteristics Analysis
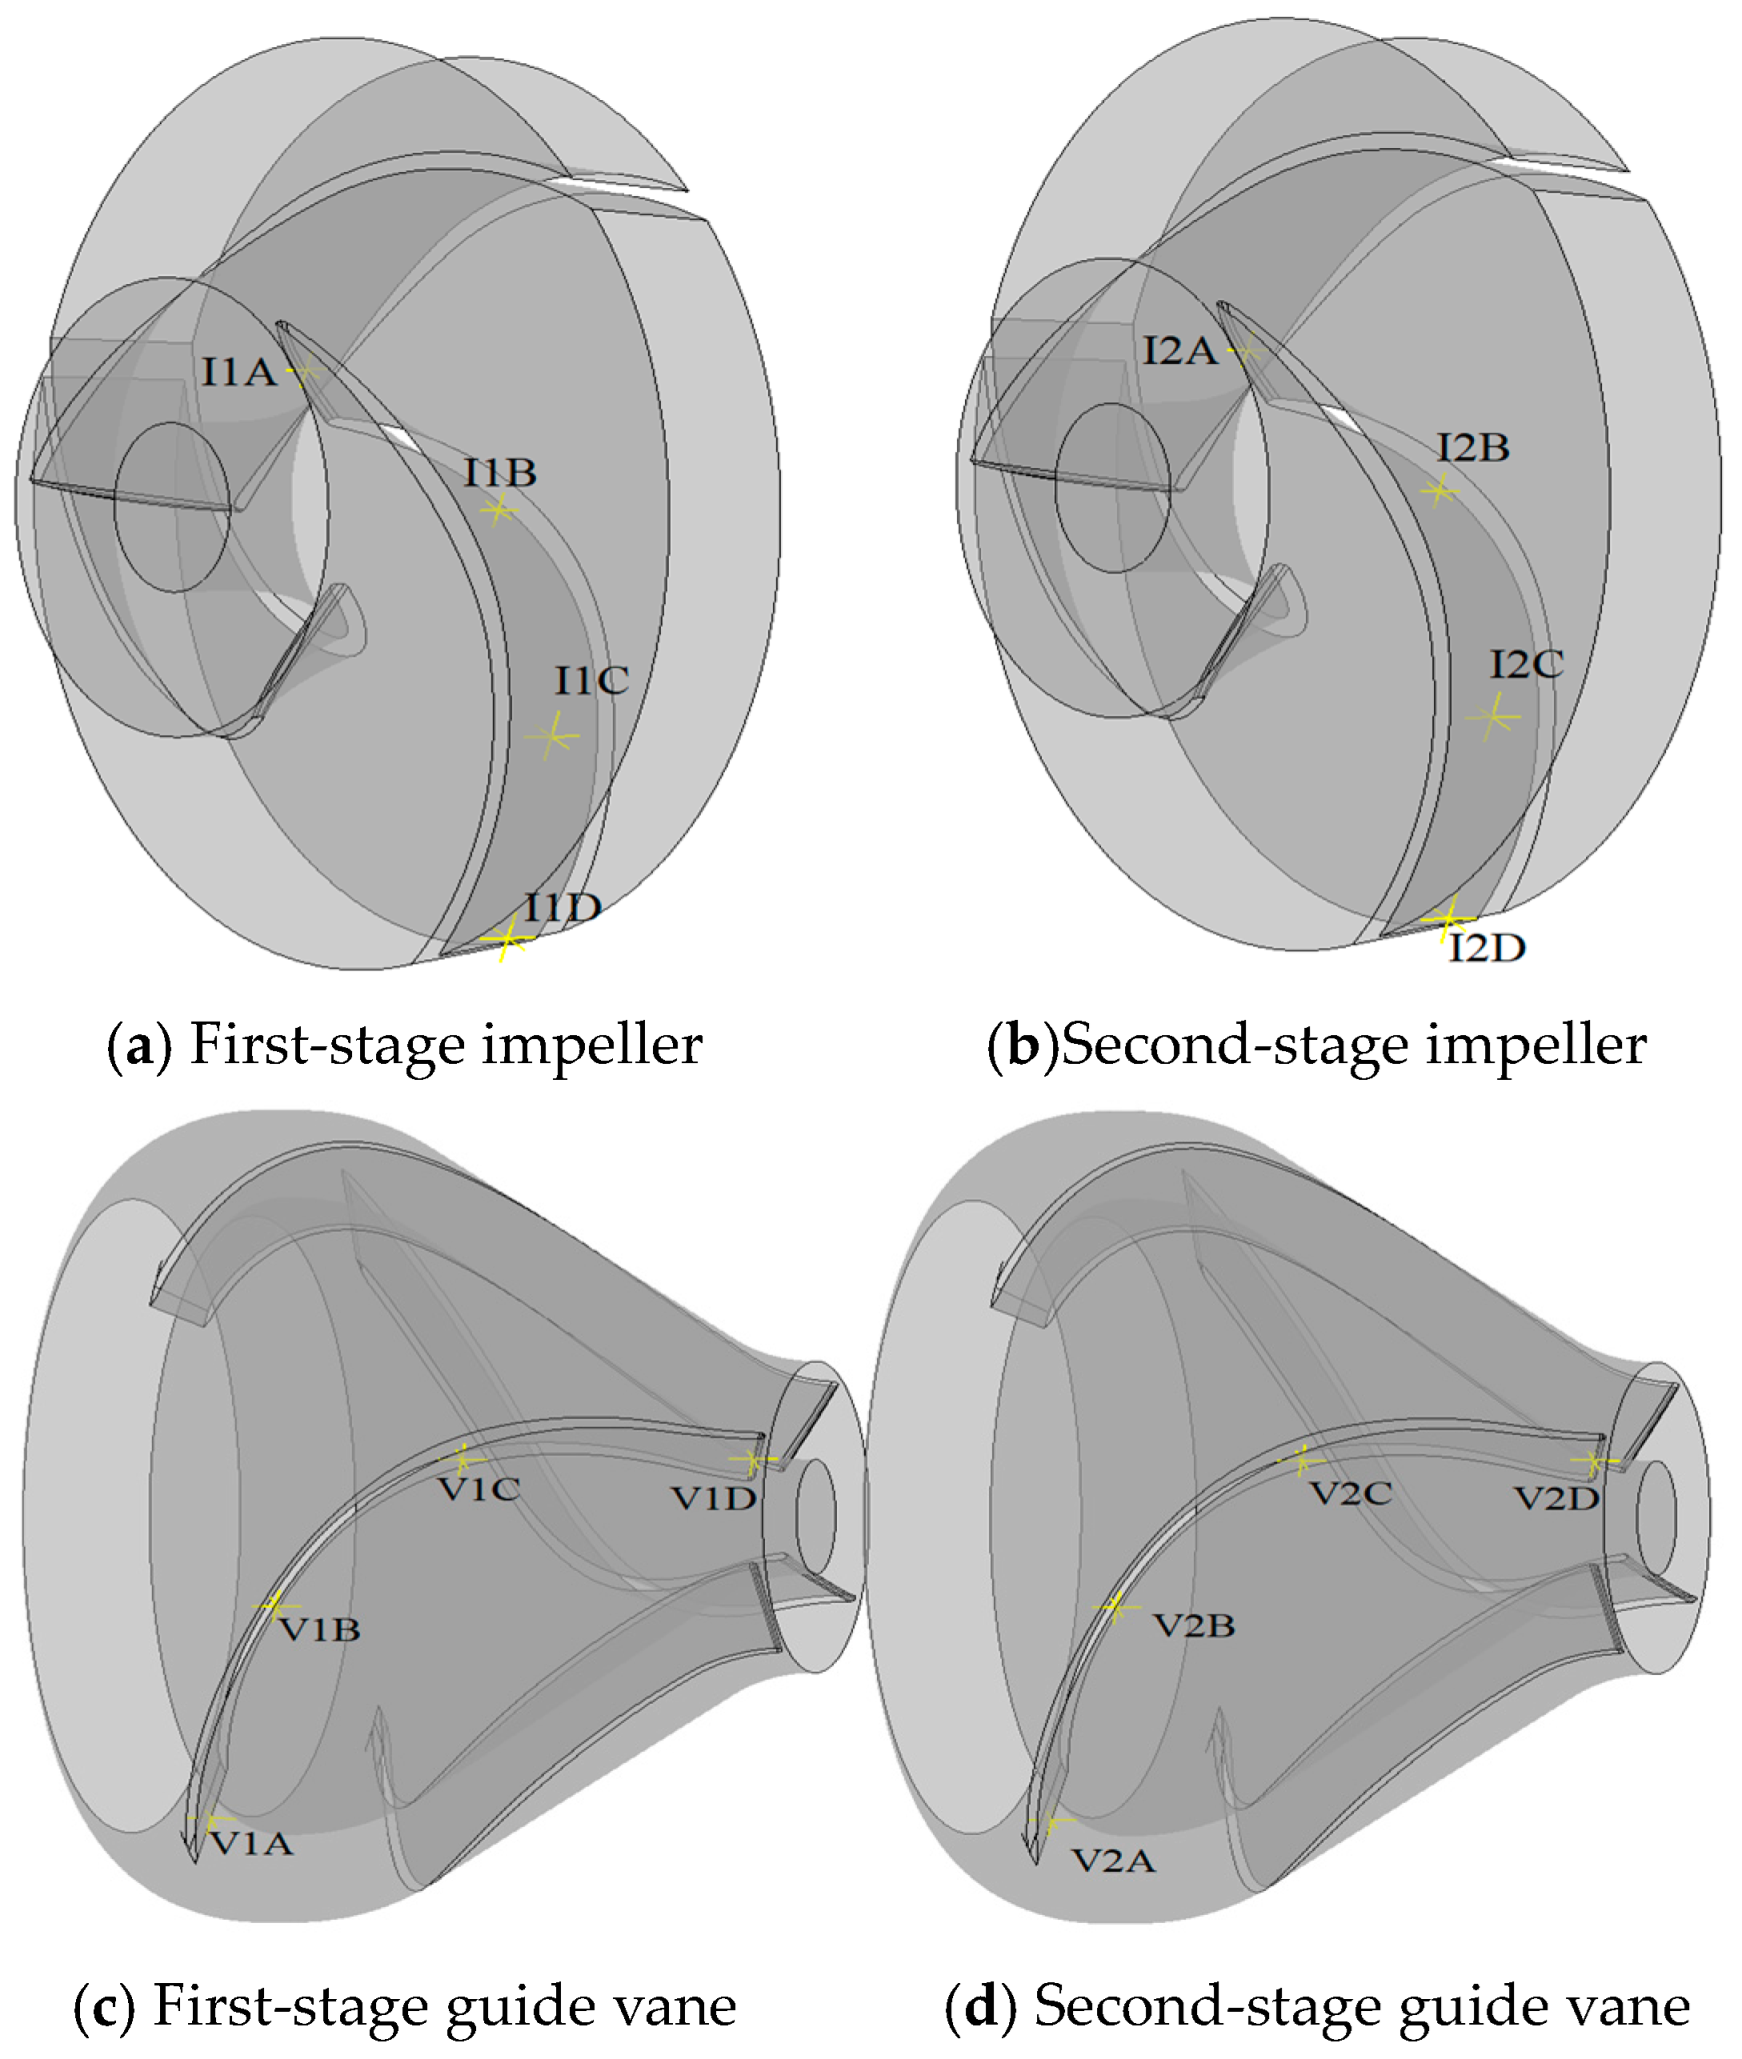
In terms of the internal flow field in the main flow-passage components of deep-sea mining lift pumps, by selecting representative monitoring points, an analysis of the pressure pulsation features was conducted under controlled circumstances from time-domain and frequency-domain perspectives. The study also investigated the internal unsteady flow features of mining lift pumps. The distribution of these monitoring points is depicted in Figure 15.
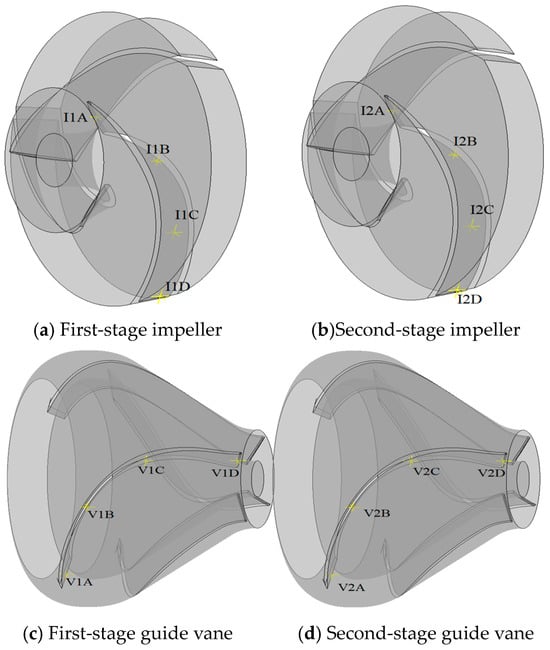
Figure 15.
Monitoring points.
3.4.1. Pressure Pulsation Characteristics in the First-Stage Impeller
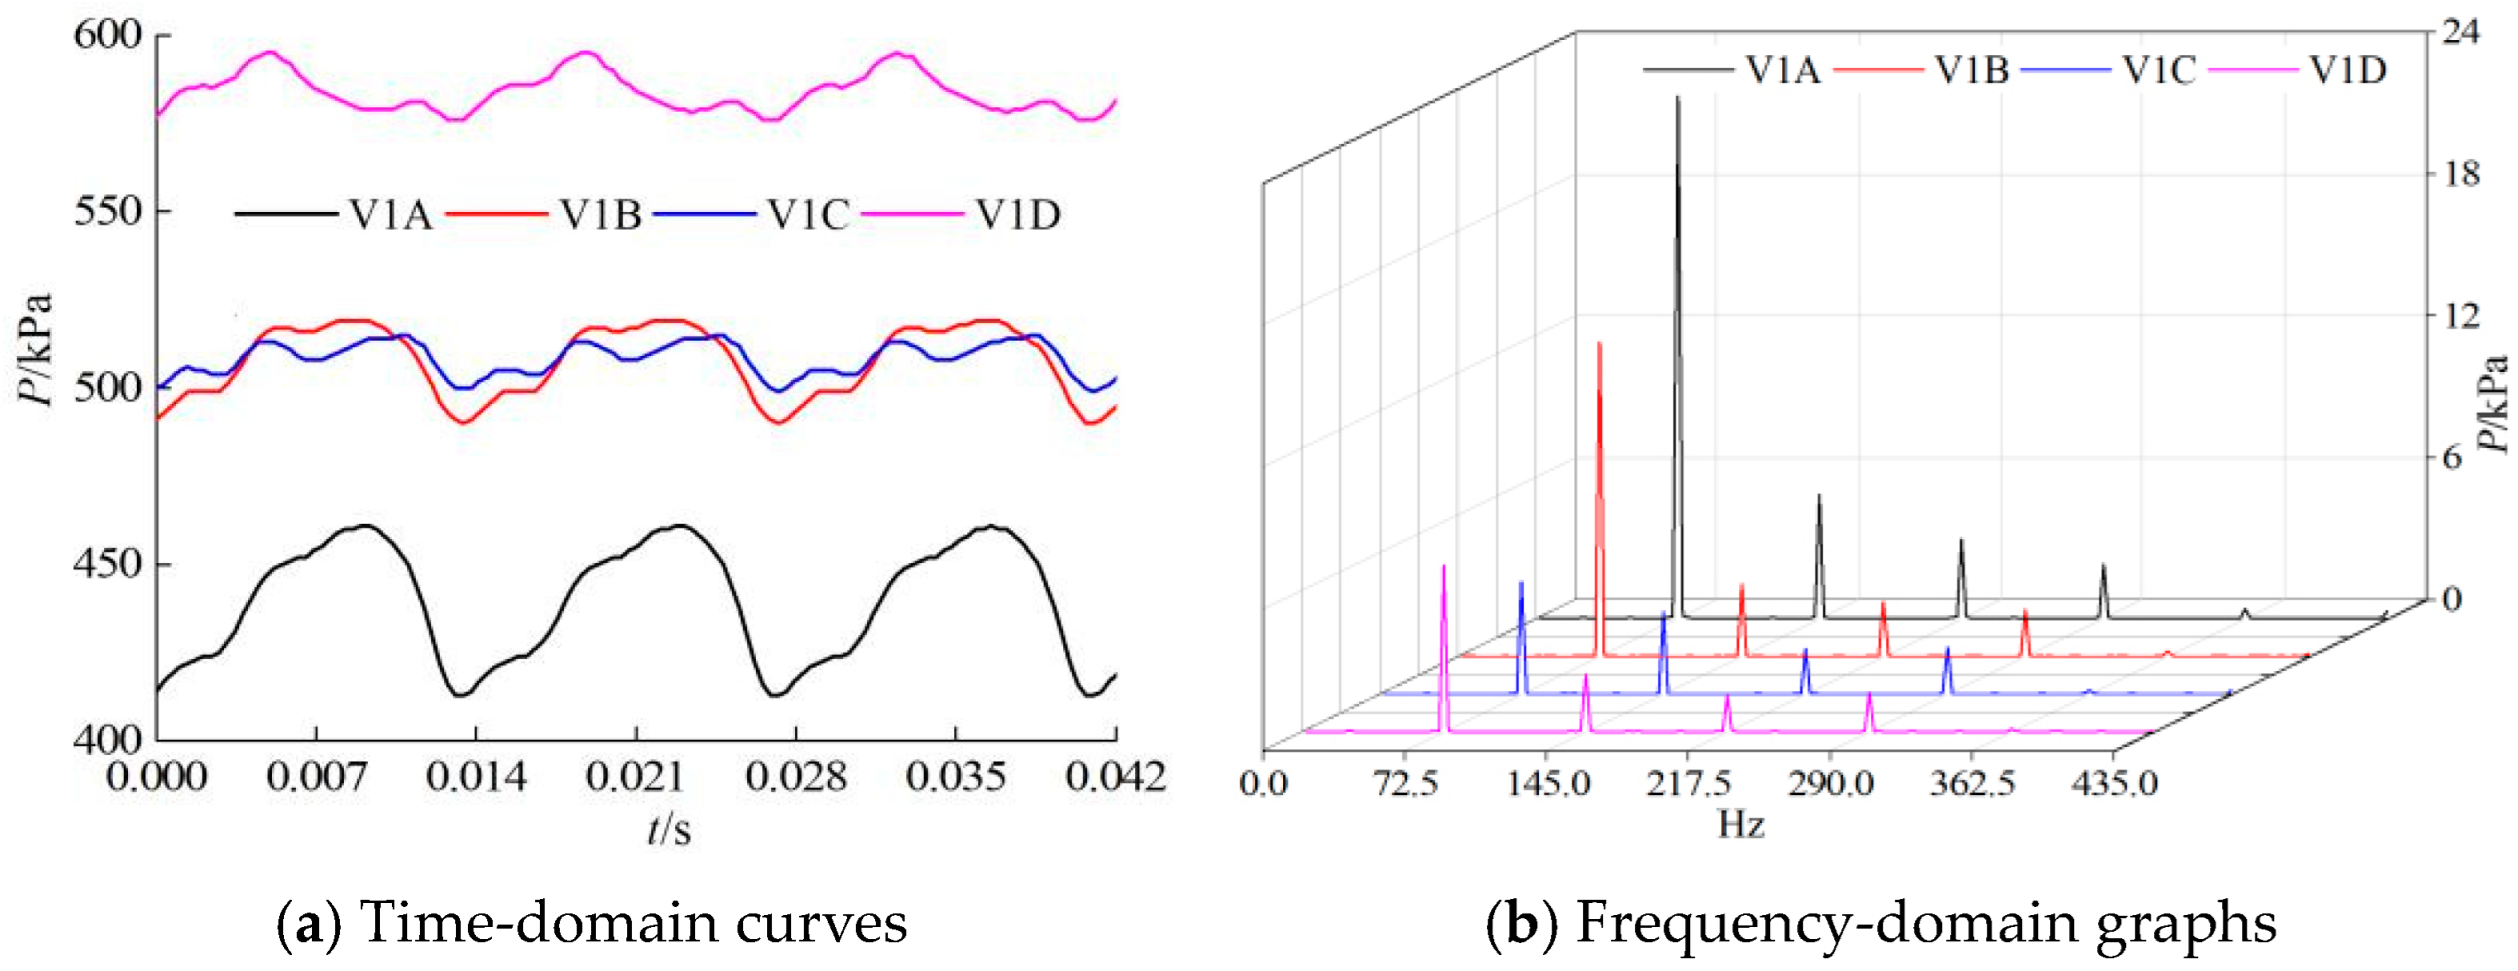
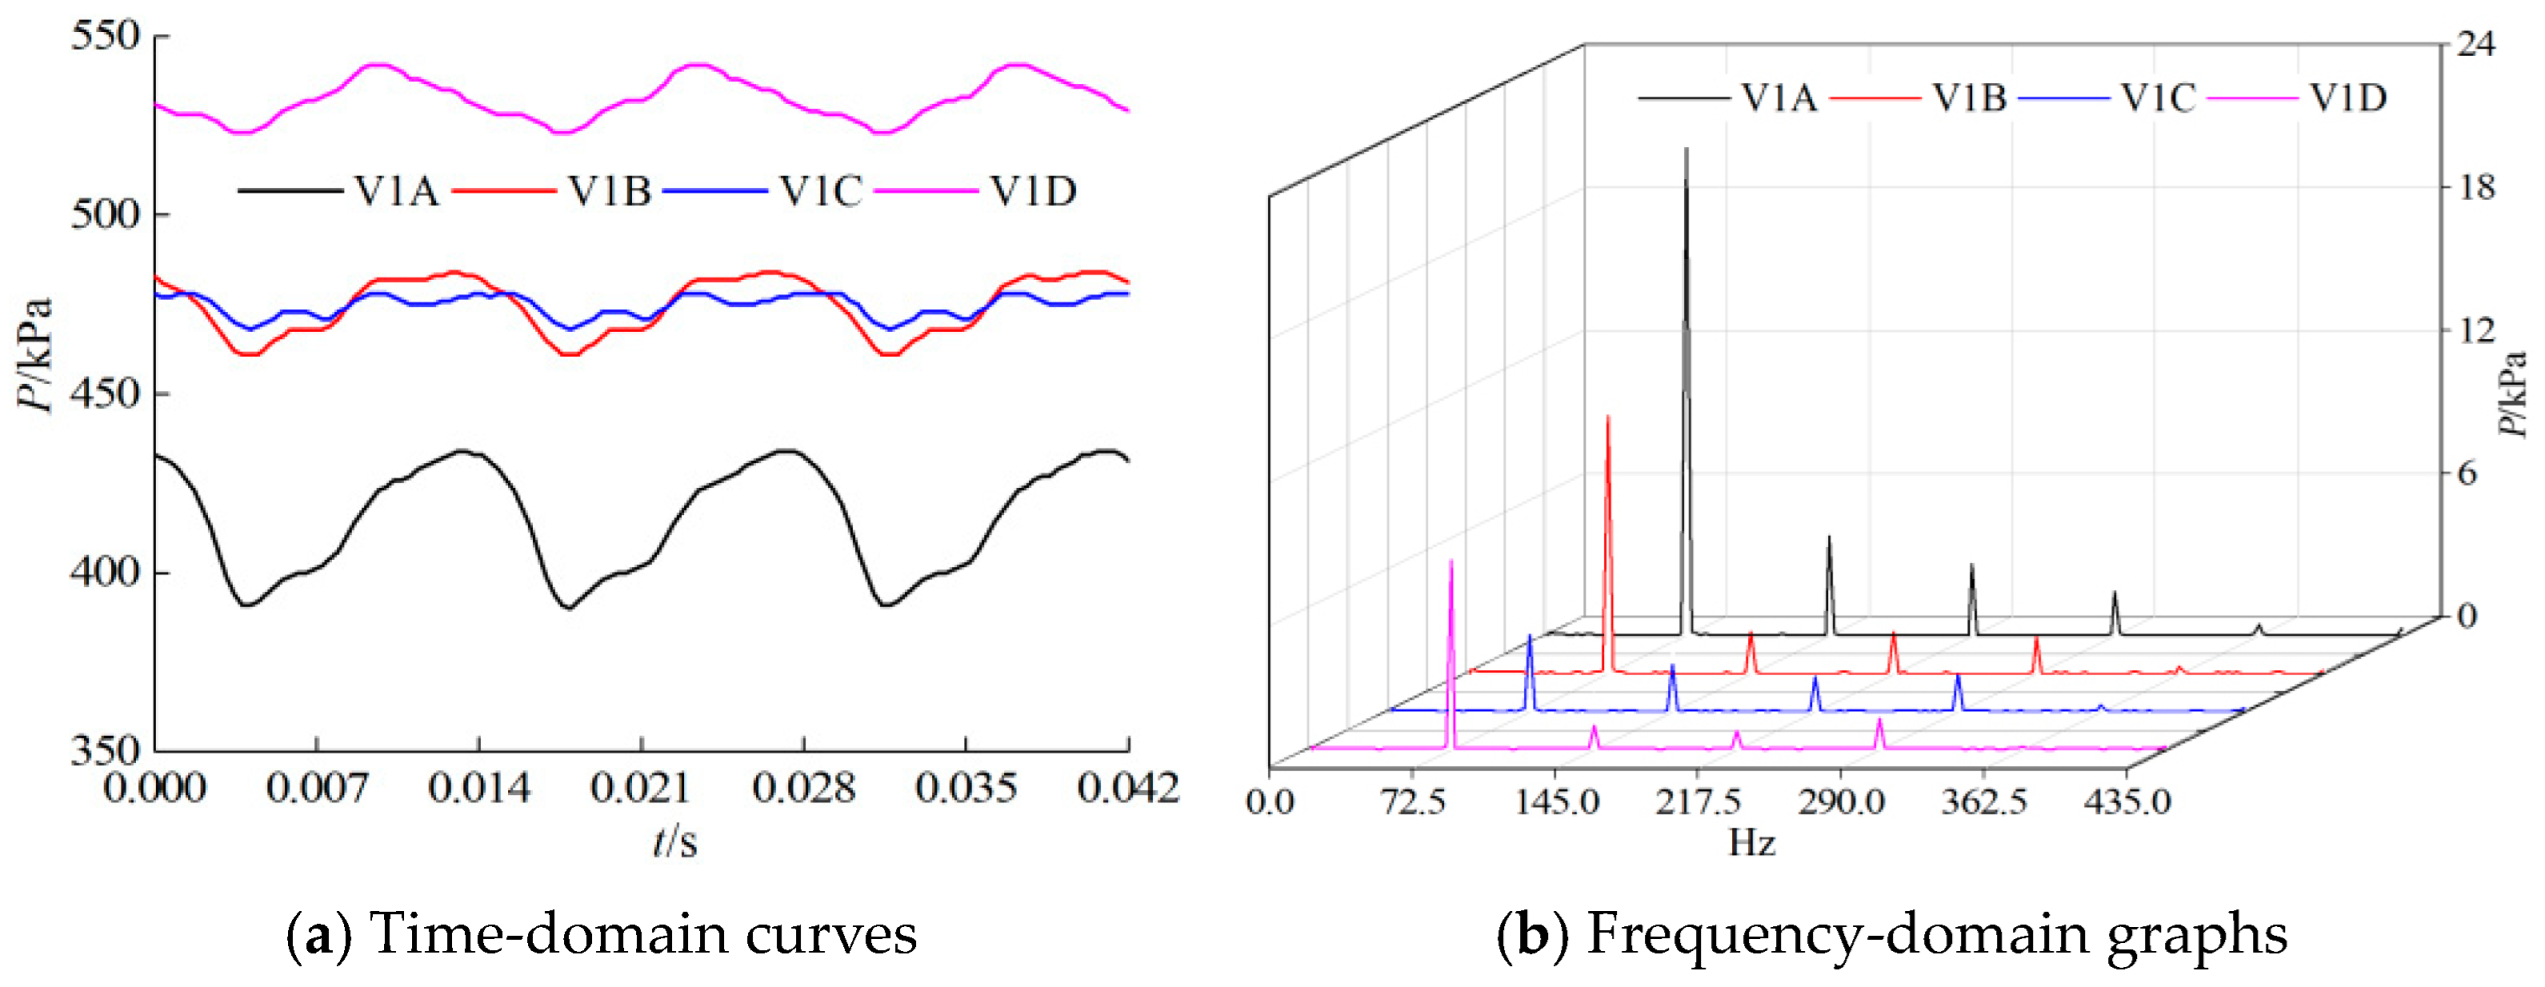
For any monitoring point on the working surface of the single-channel blade of a first-stage impeller, Figure 16, Figure 17, Figure 18 and Figure 19 show time- and frequency-domain graphs in terms of the pressure pulsation characteristics under four different operating conditions. The time-domain curves show the changes within one impeller rotation.
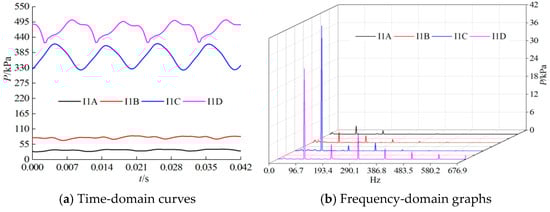
Figure 16.
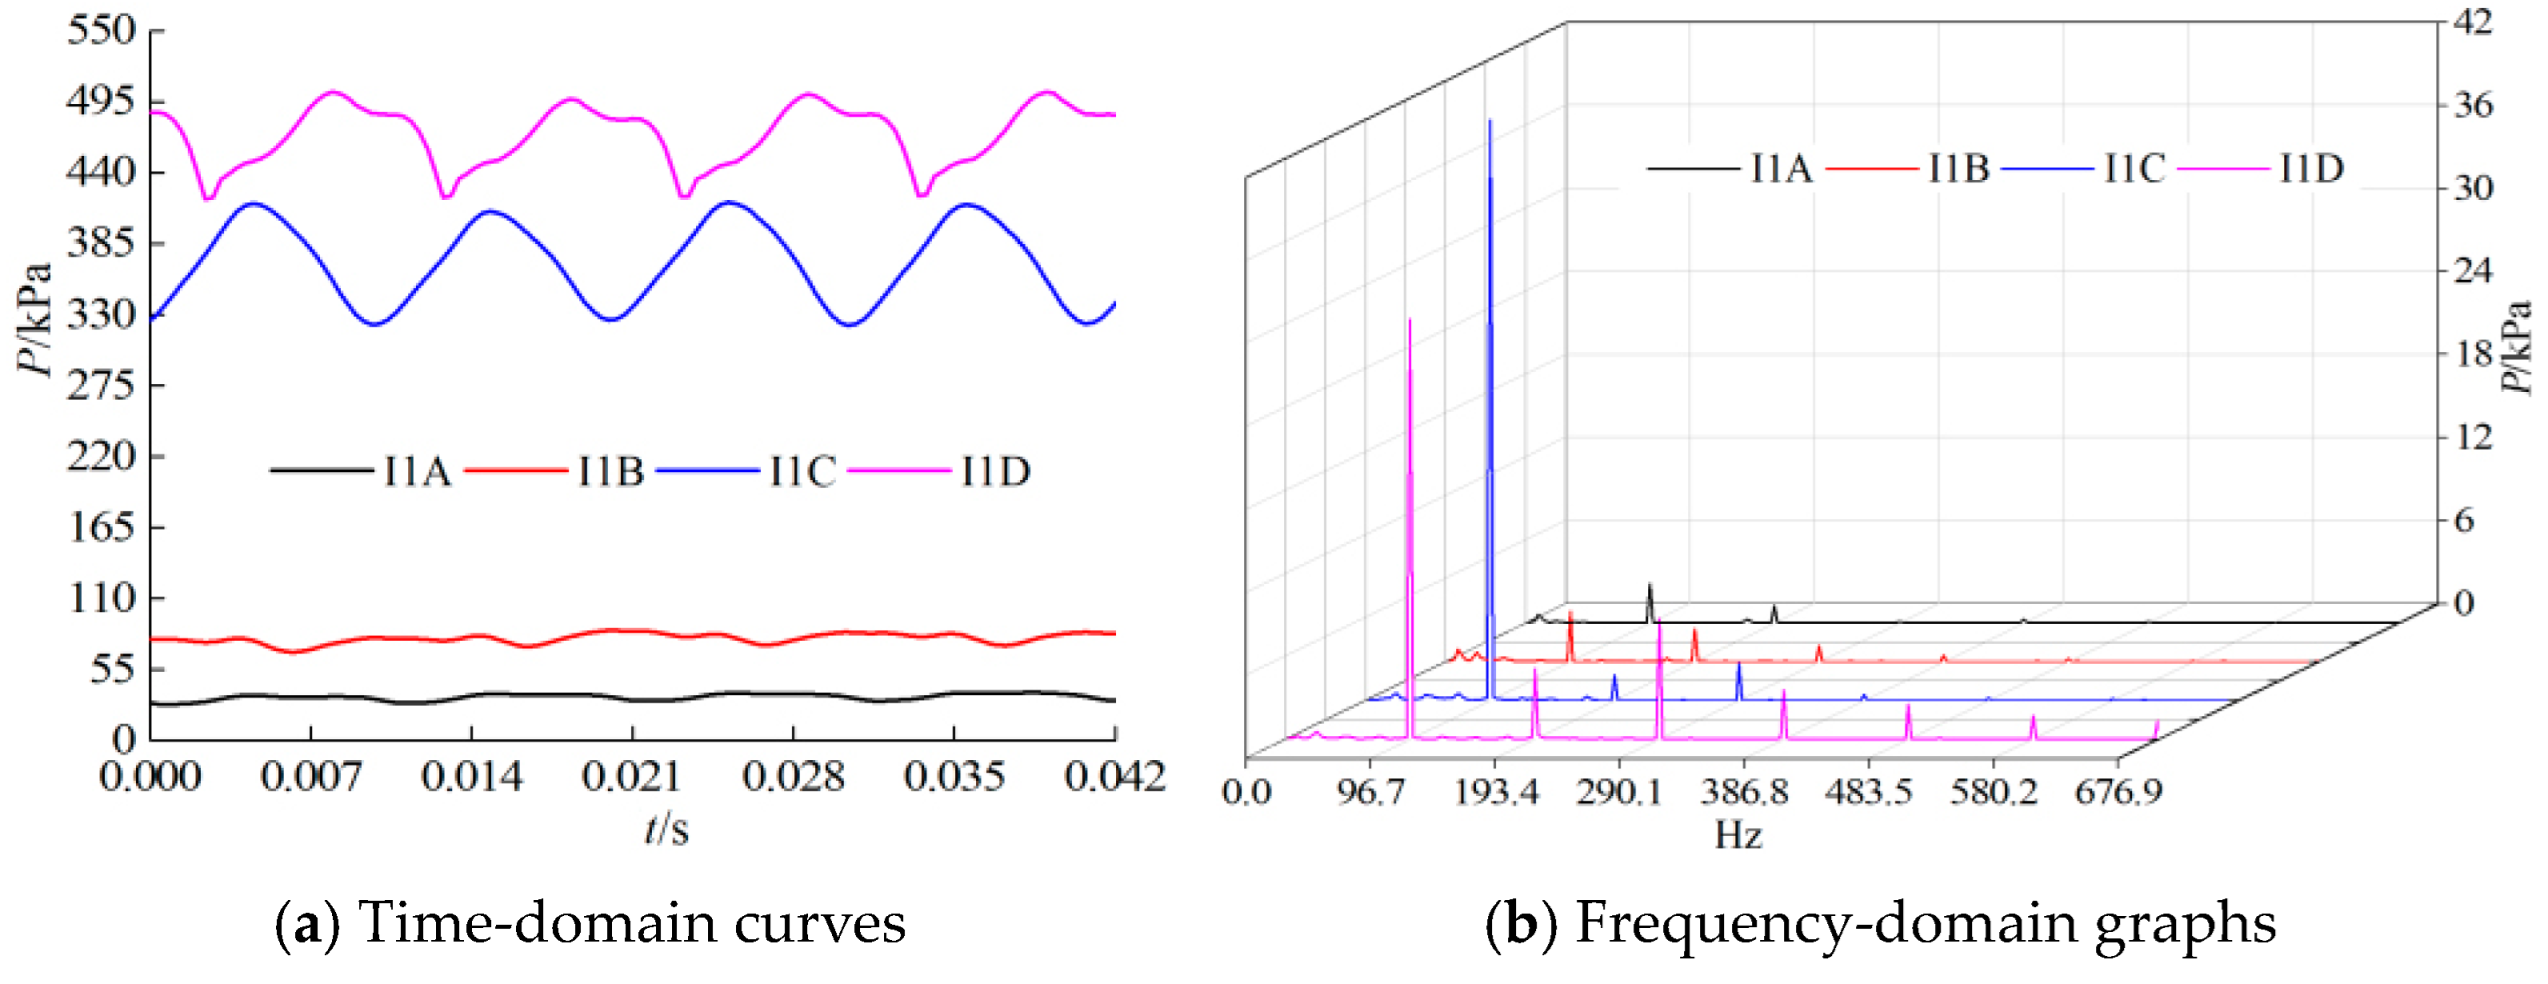
Pressure pulsation characteristics of a first-stage impeller with 0.2Q.
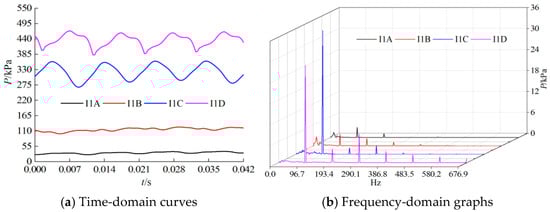
Figure 17.
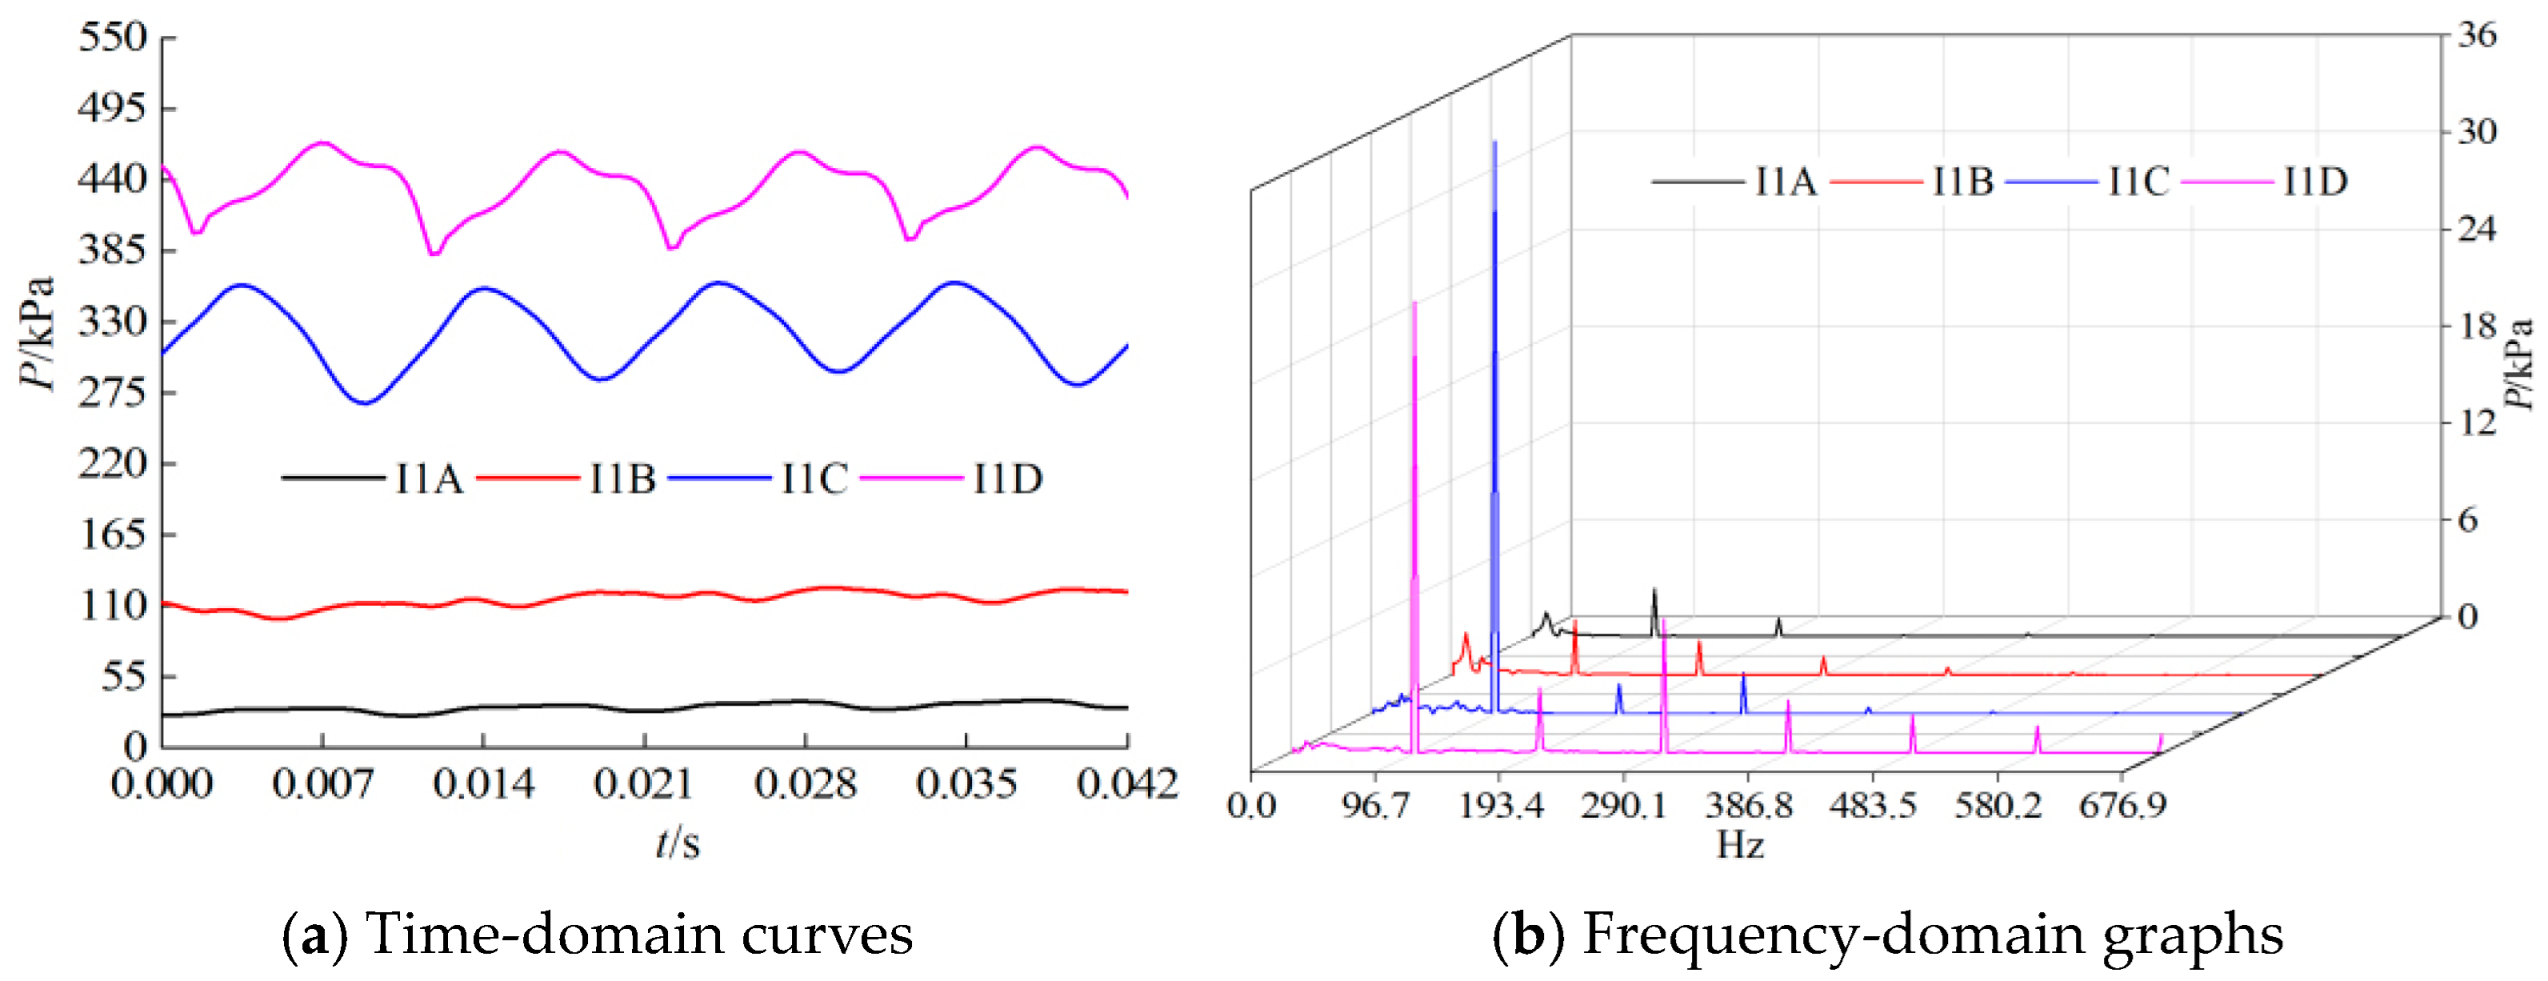
Pressure pulsation characteristics of a first-stage impeller with 0.6Q.
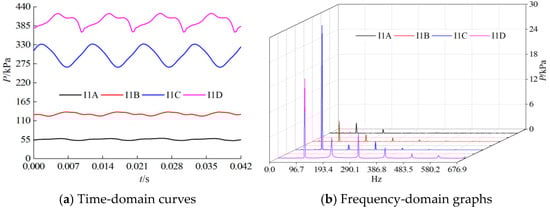
Figure 18.
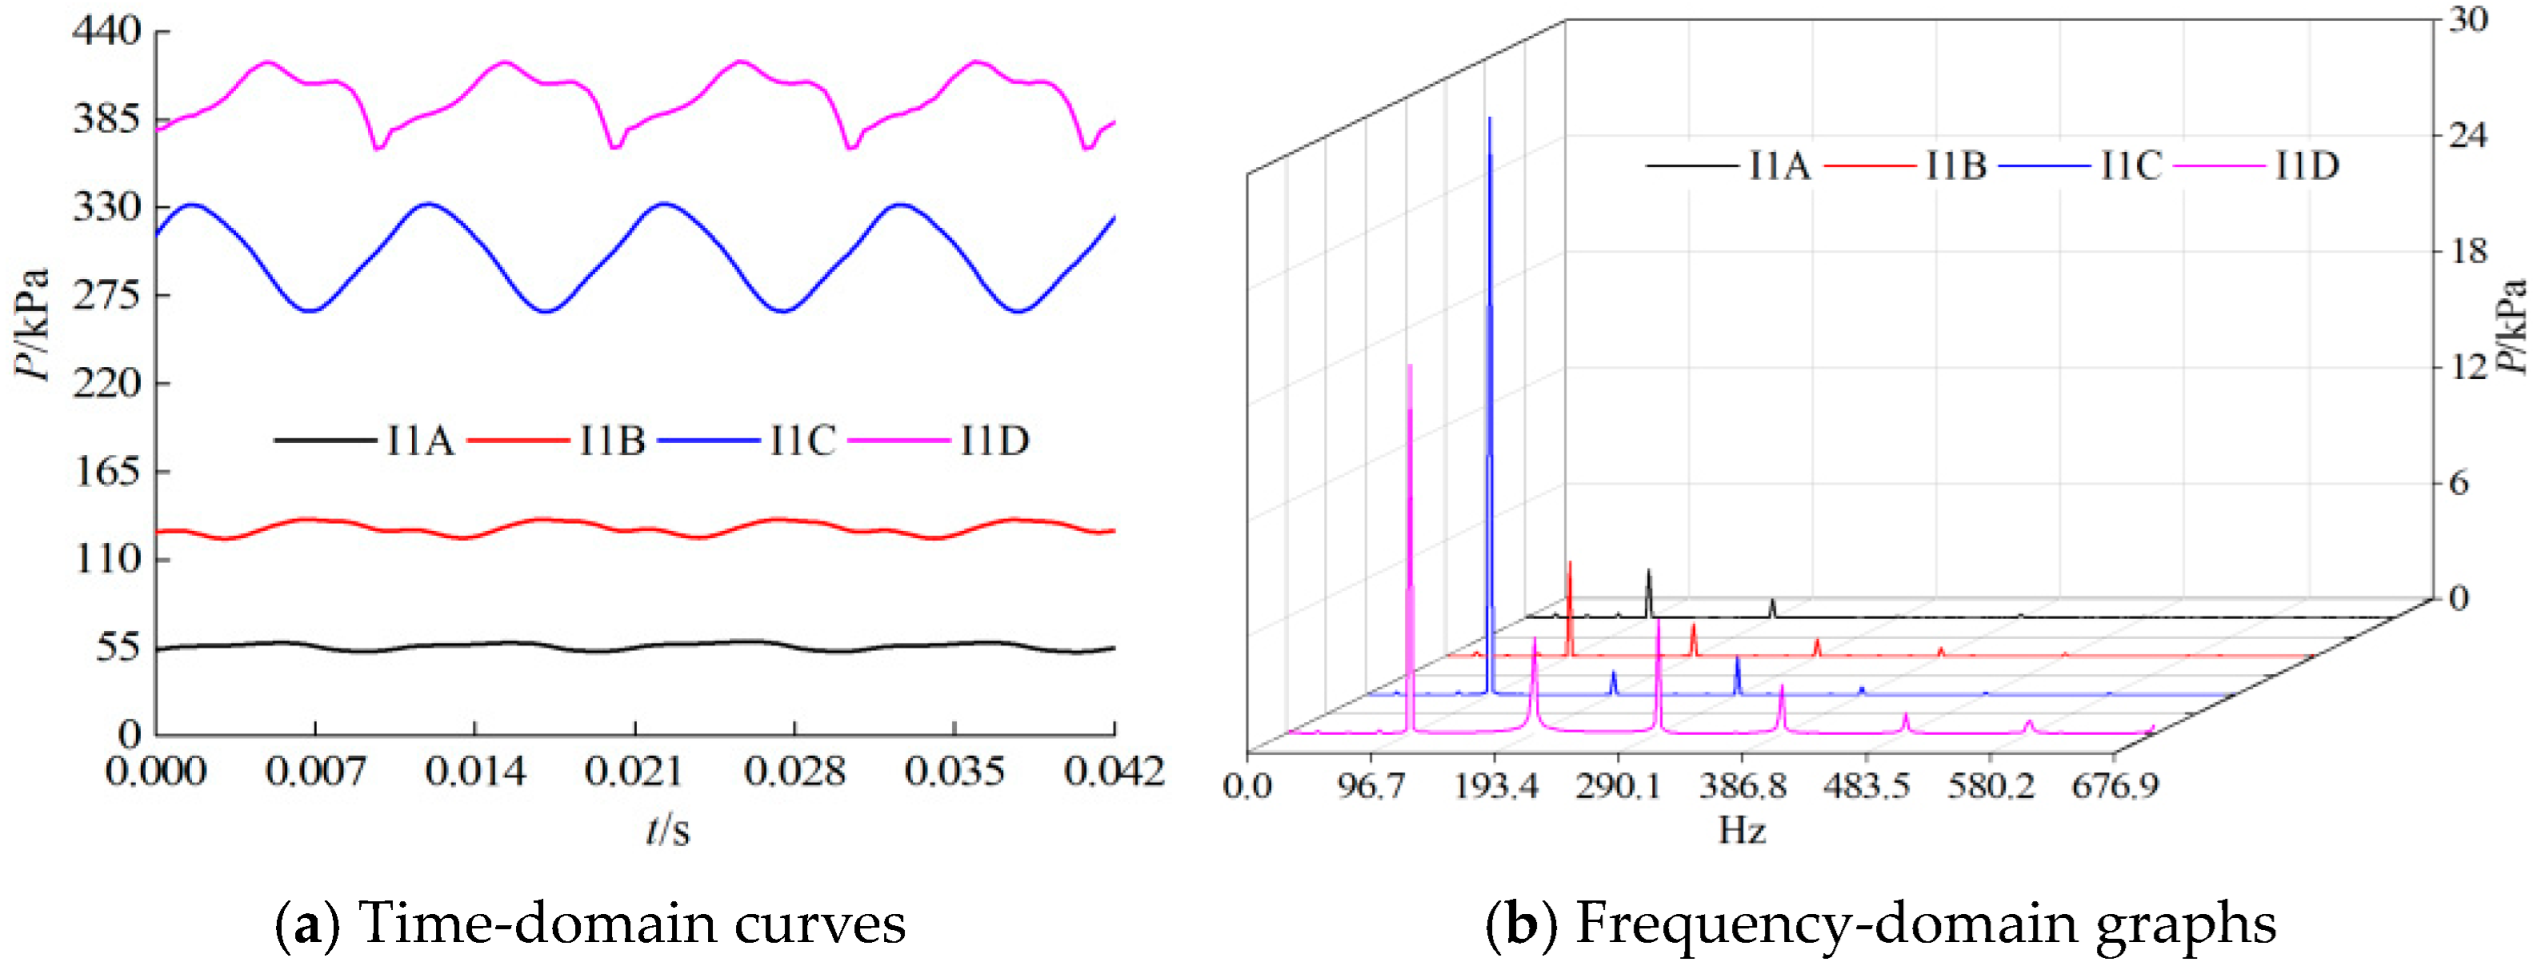
Pressure pulsation characteristics of a first-stage impeller with 1.0Q.
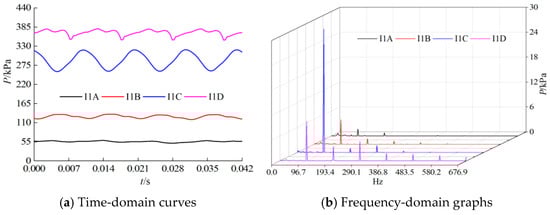
Figure 19.
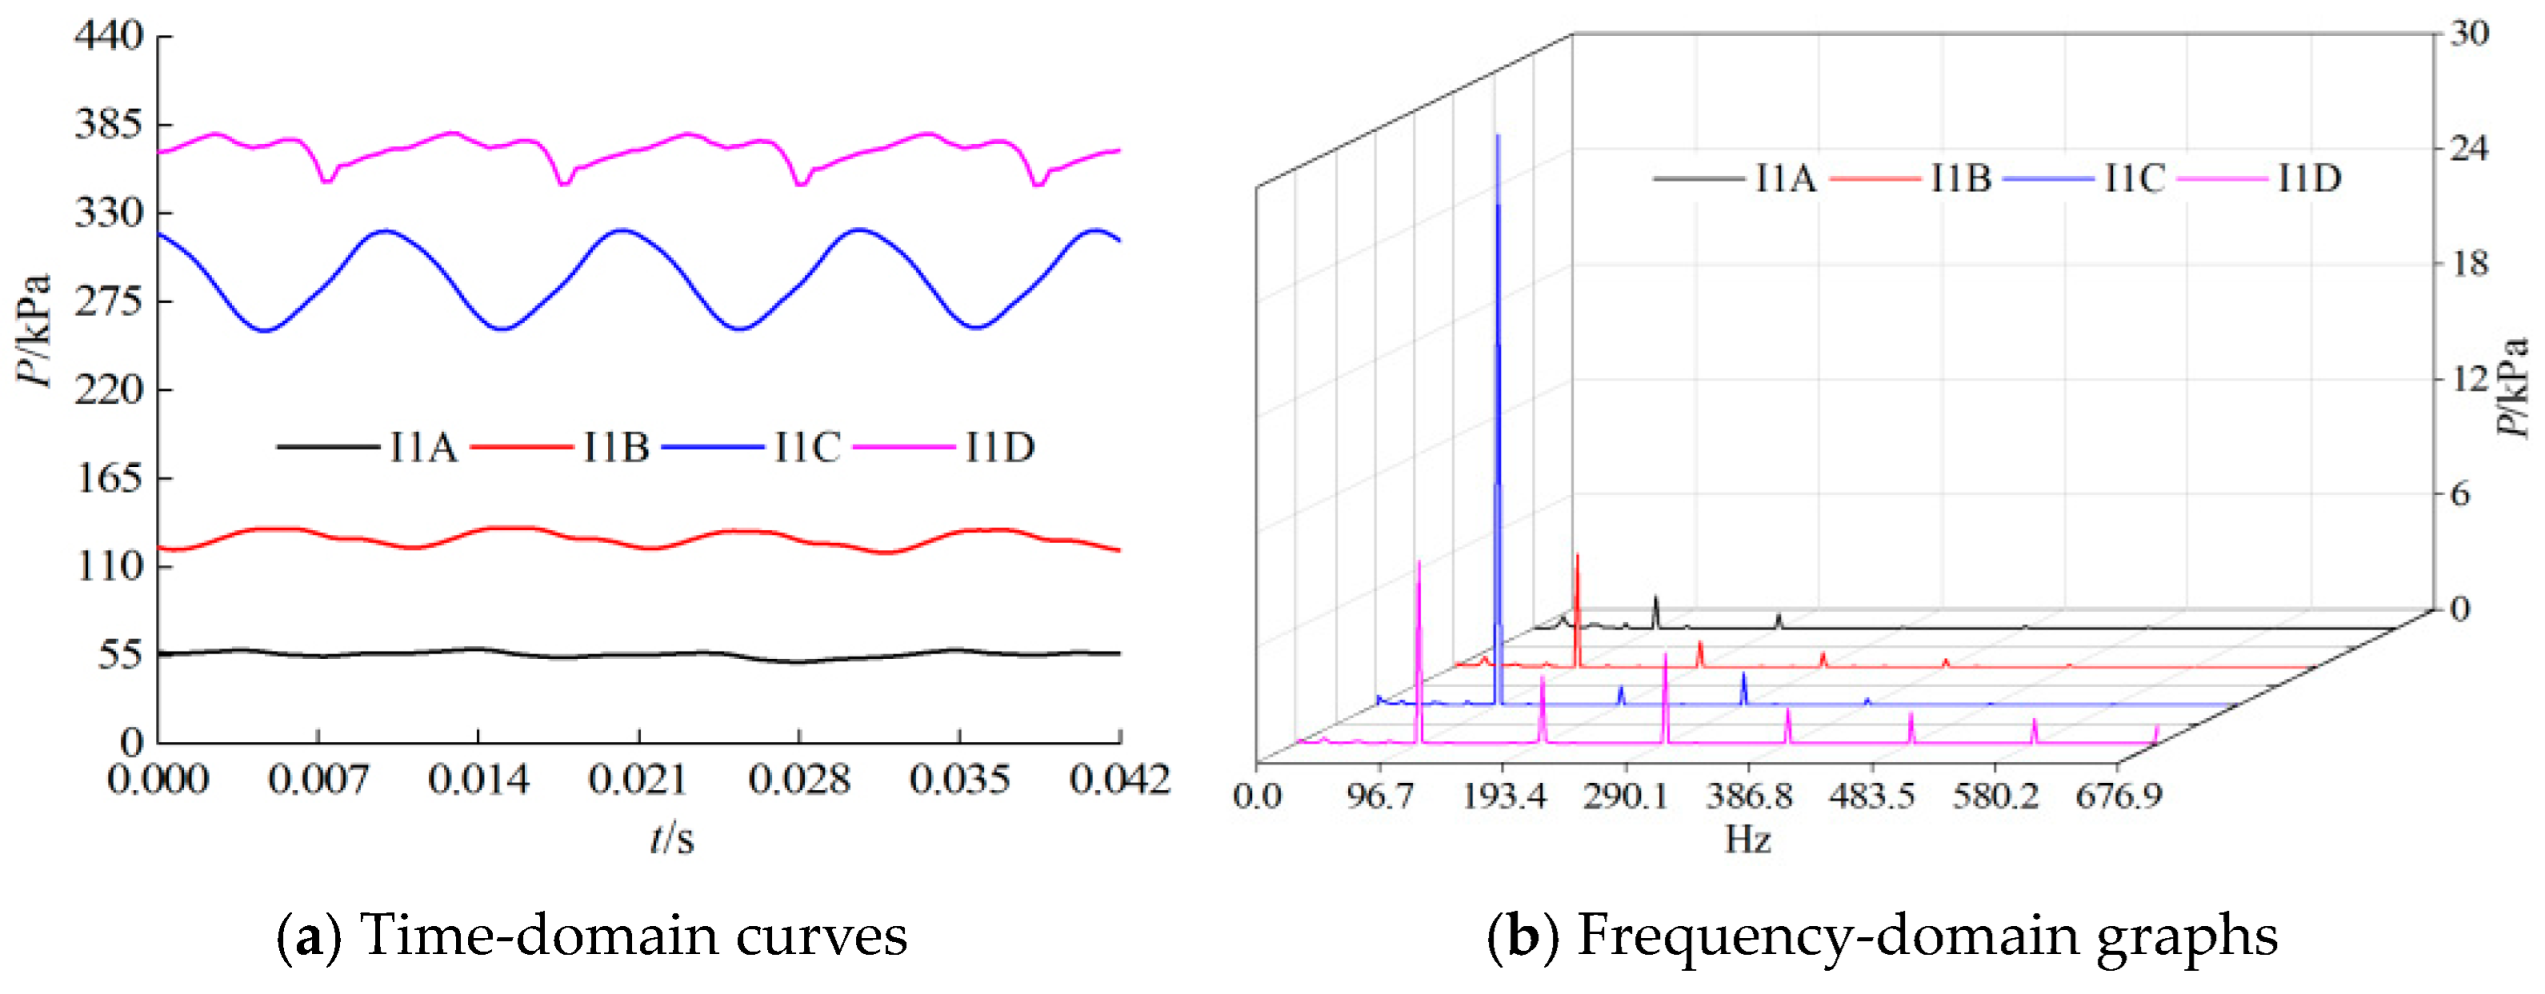
Pressure pulsation characteristics of a first-stage impeller with 1.4Q.
Figure 16, Figure 17, Figure 18 and Figure 19 show that when the impeller completes one rotation, for any monitoring point of the impeller, the number of its pressure pulsations is equal to that of guide vane blades, as four periodically similar waveforms appeared. The frequency-domain graphs reveal that the pressure pulsations’ dominant frequency coincides with that of the guide vane (96.7 Hz), with values appearing at other low-order multiples of the guide vane frequency. In addition, a comparison of these results reveals that along with increasing flow rate, the pressure pulsation’s amplitude gradually decreases.
3.4.2. Pressure Pulsation Characteristics in the Second-Stage Impeller
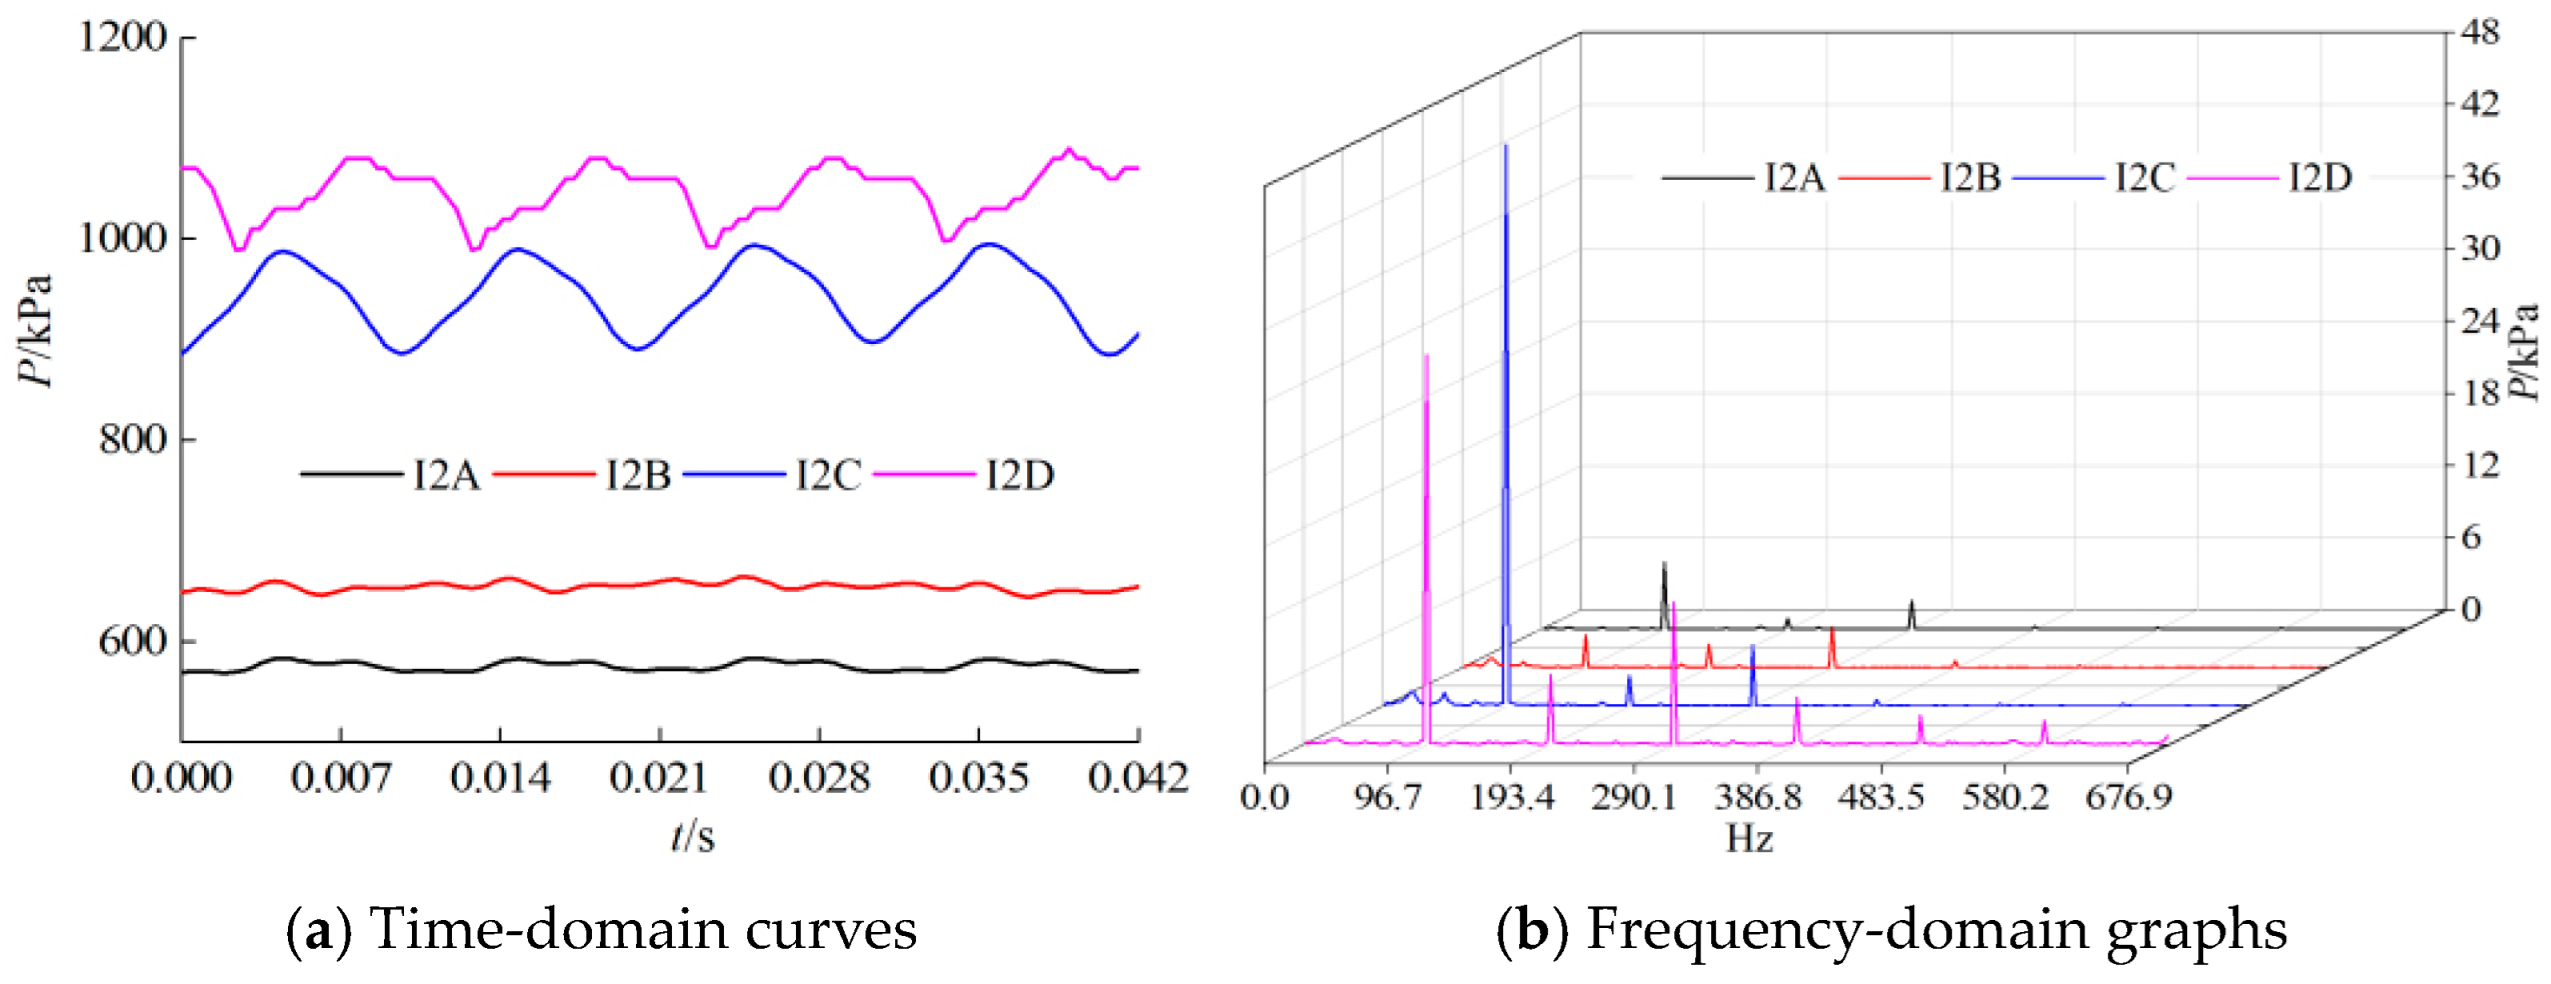
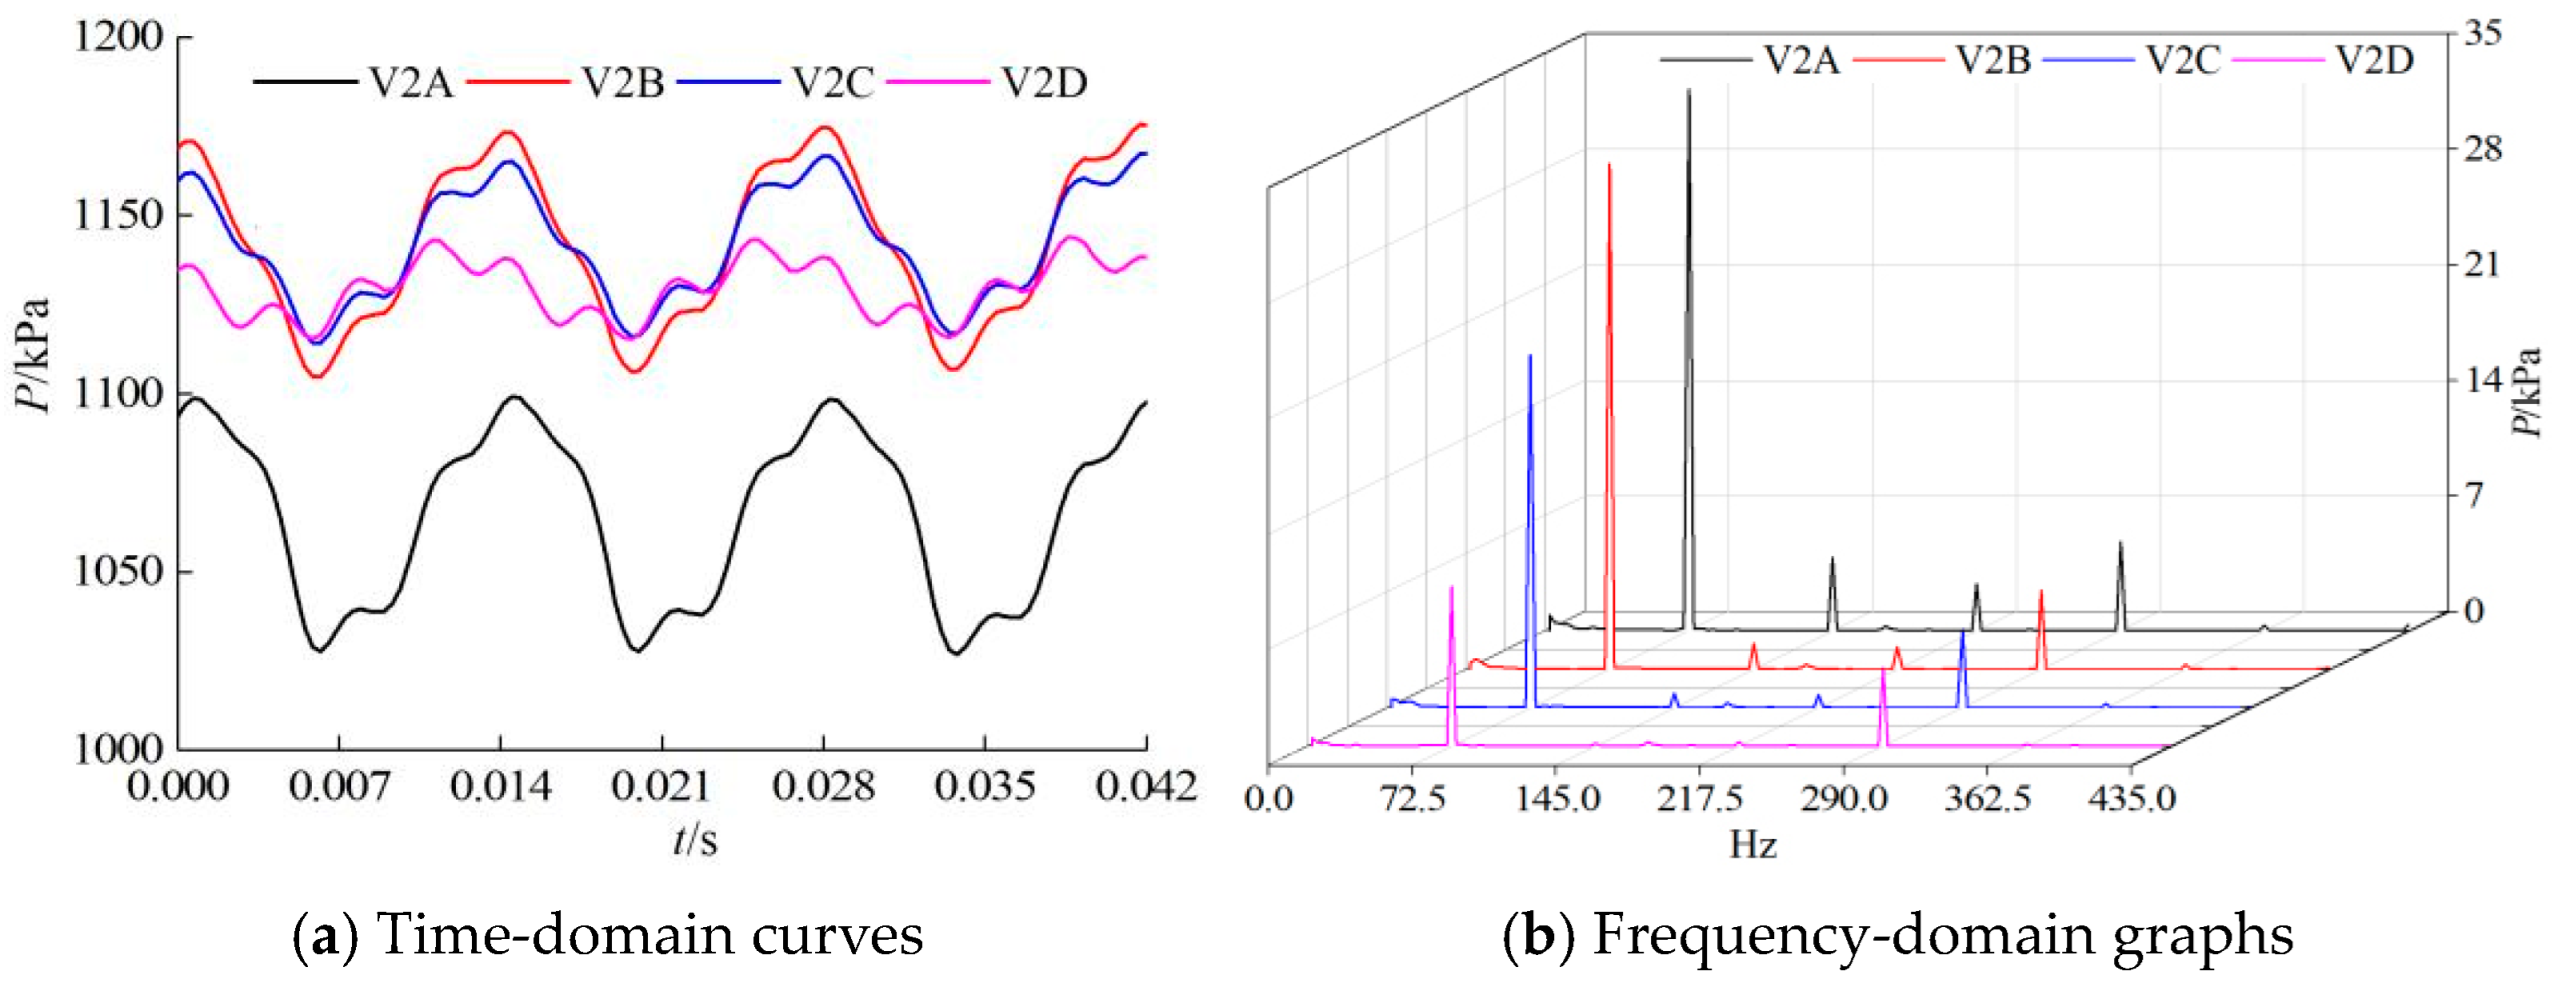
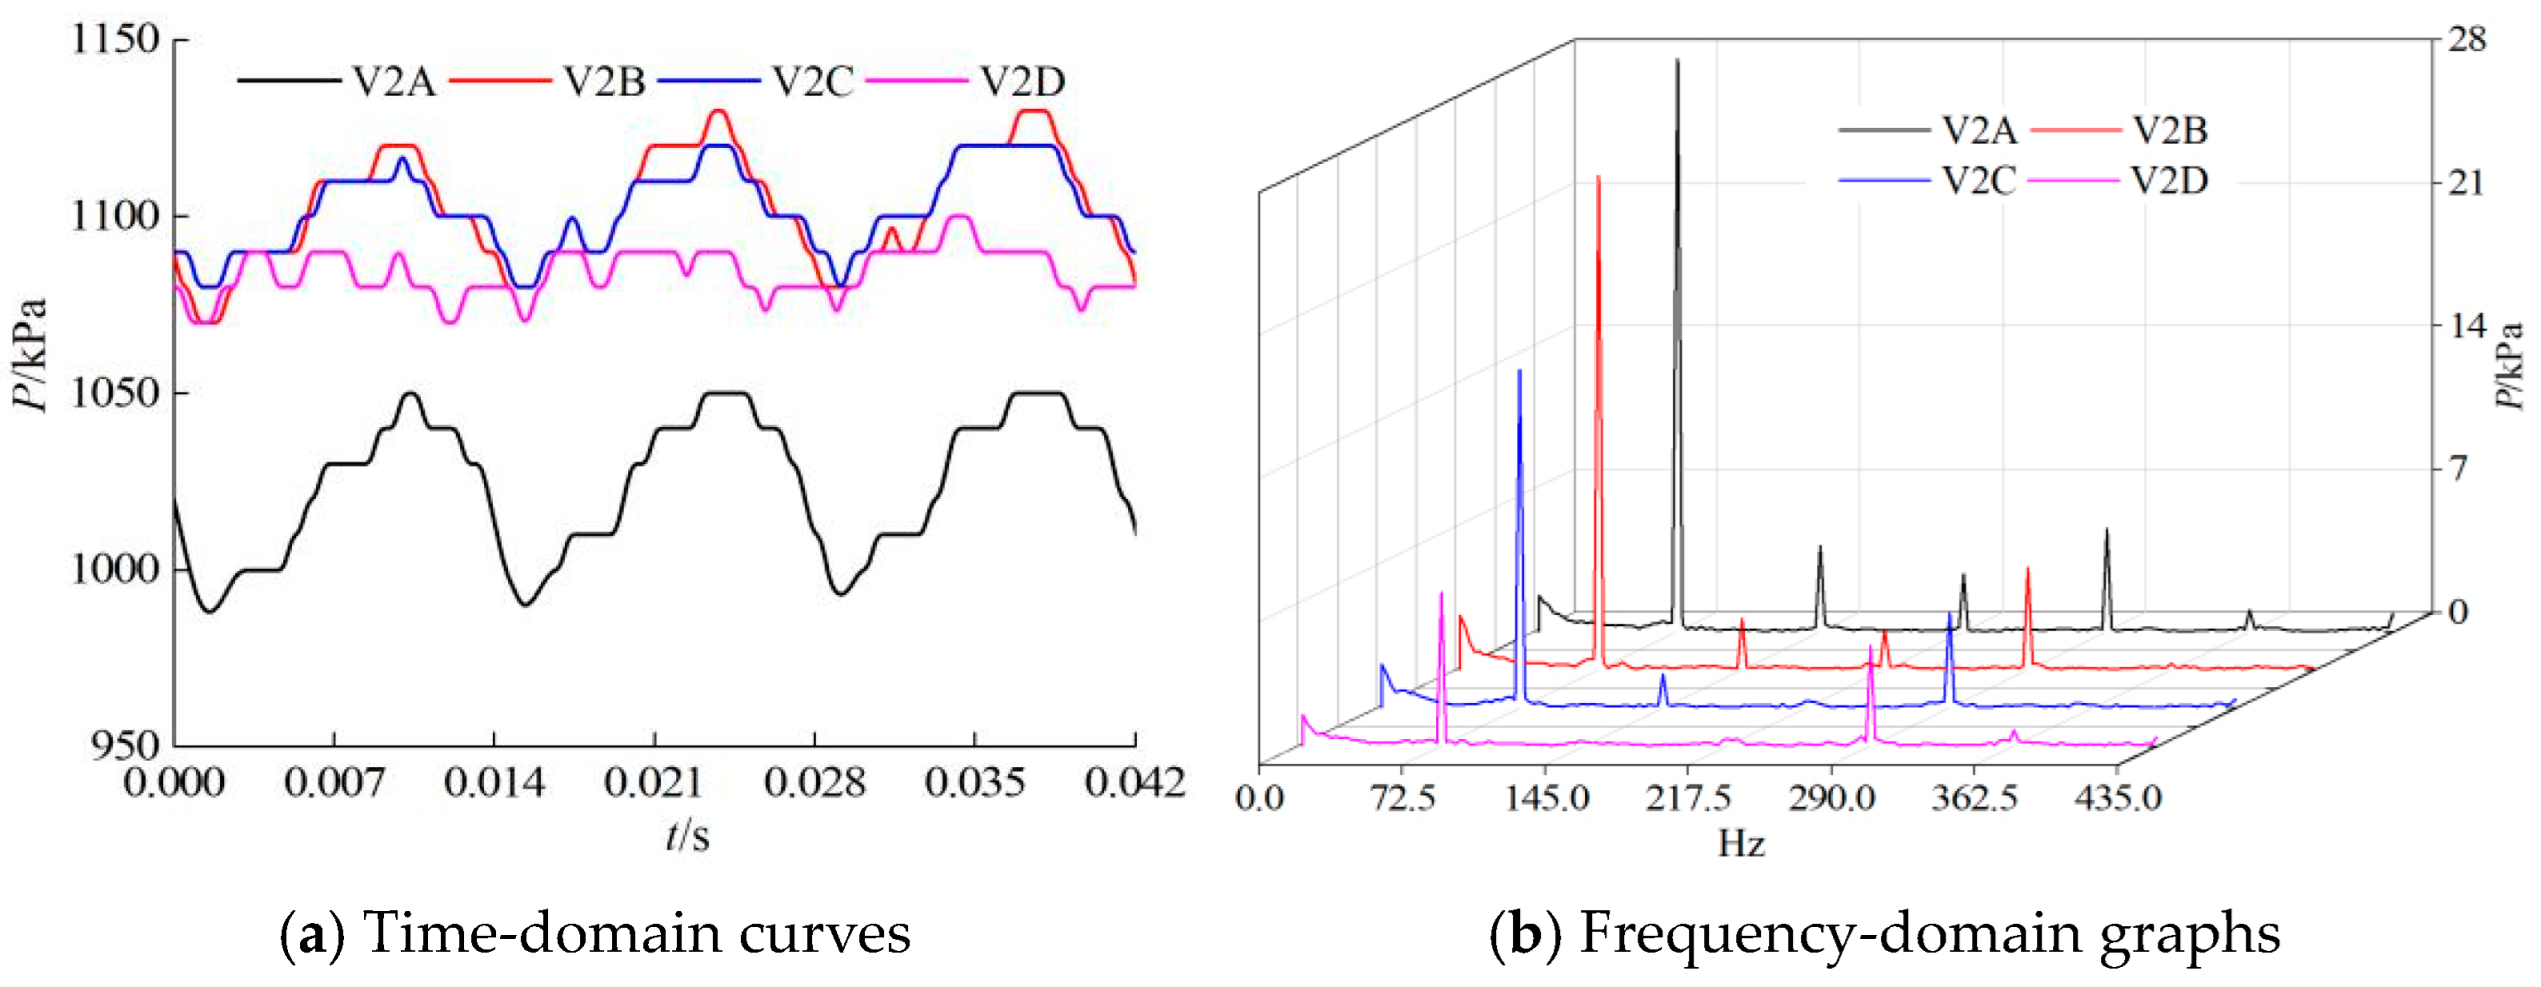
For any monitoring point of a working surface on the single-channel blade of the second-stage impeller, Figure 20, Figure 21, Figure 22 and Figure 23 show time- and frequency-domain graphs regarding the pressure pulsation characteristics seen under four different operating conditions. The time-domain curves show the changes seen within one impeller rotation.
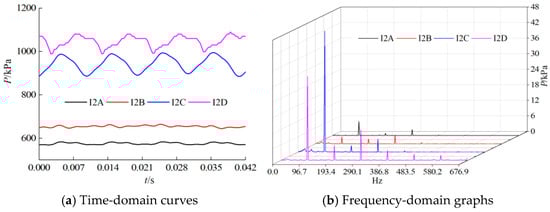
Figure 20.
Pressure pulsation characteristics of the second-stage impeller with 0.2Q.
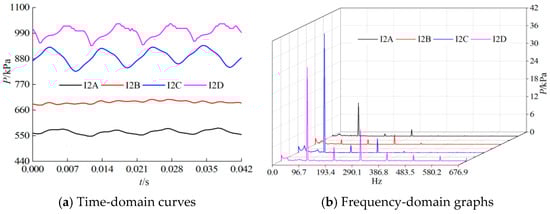
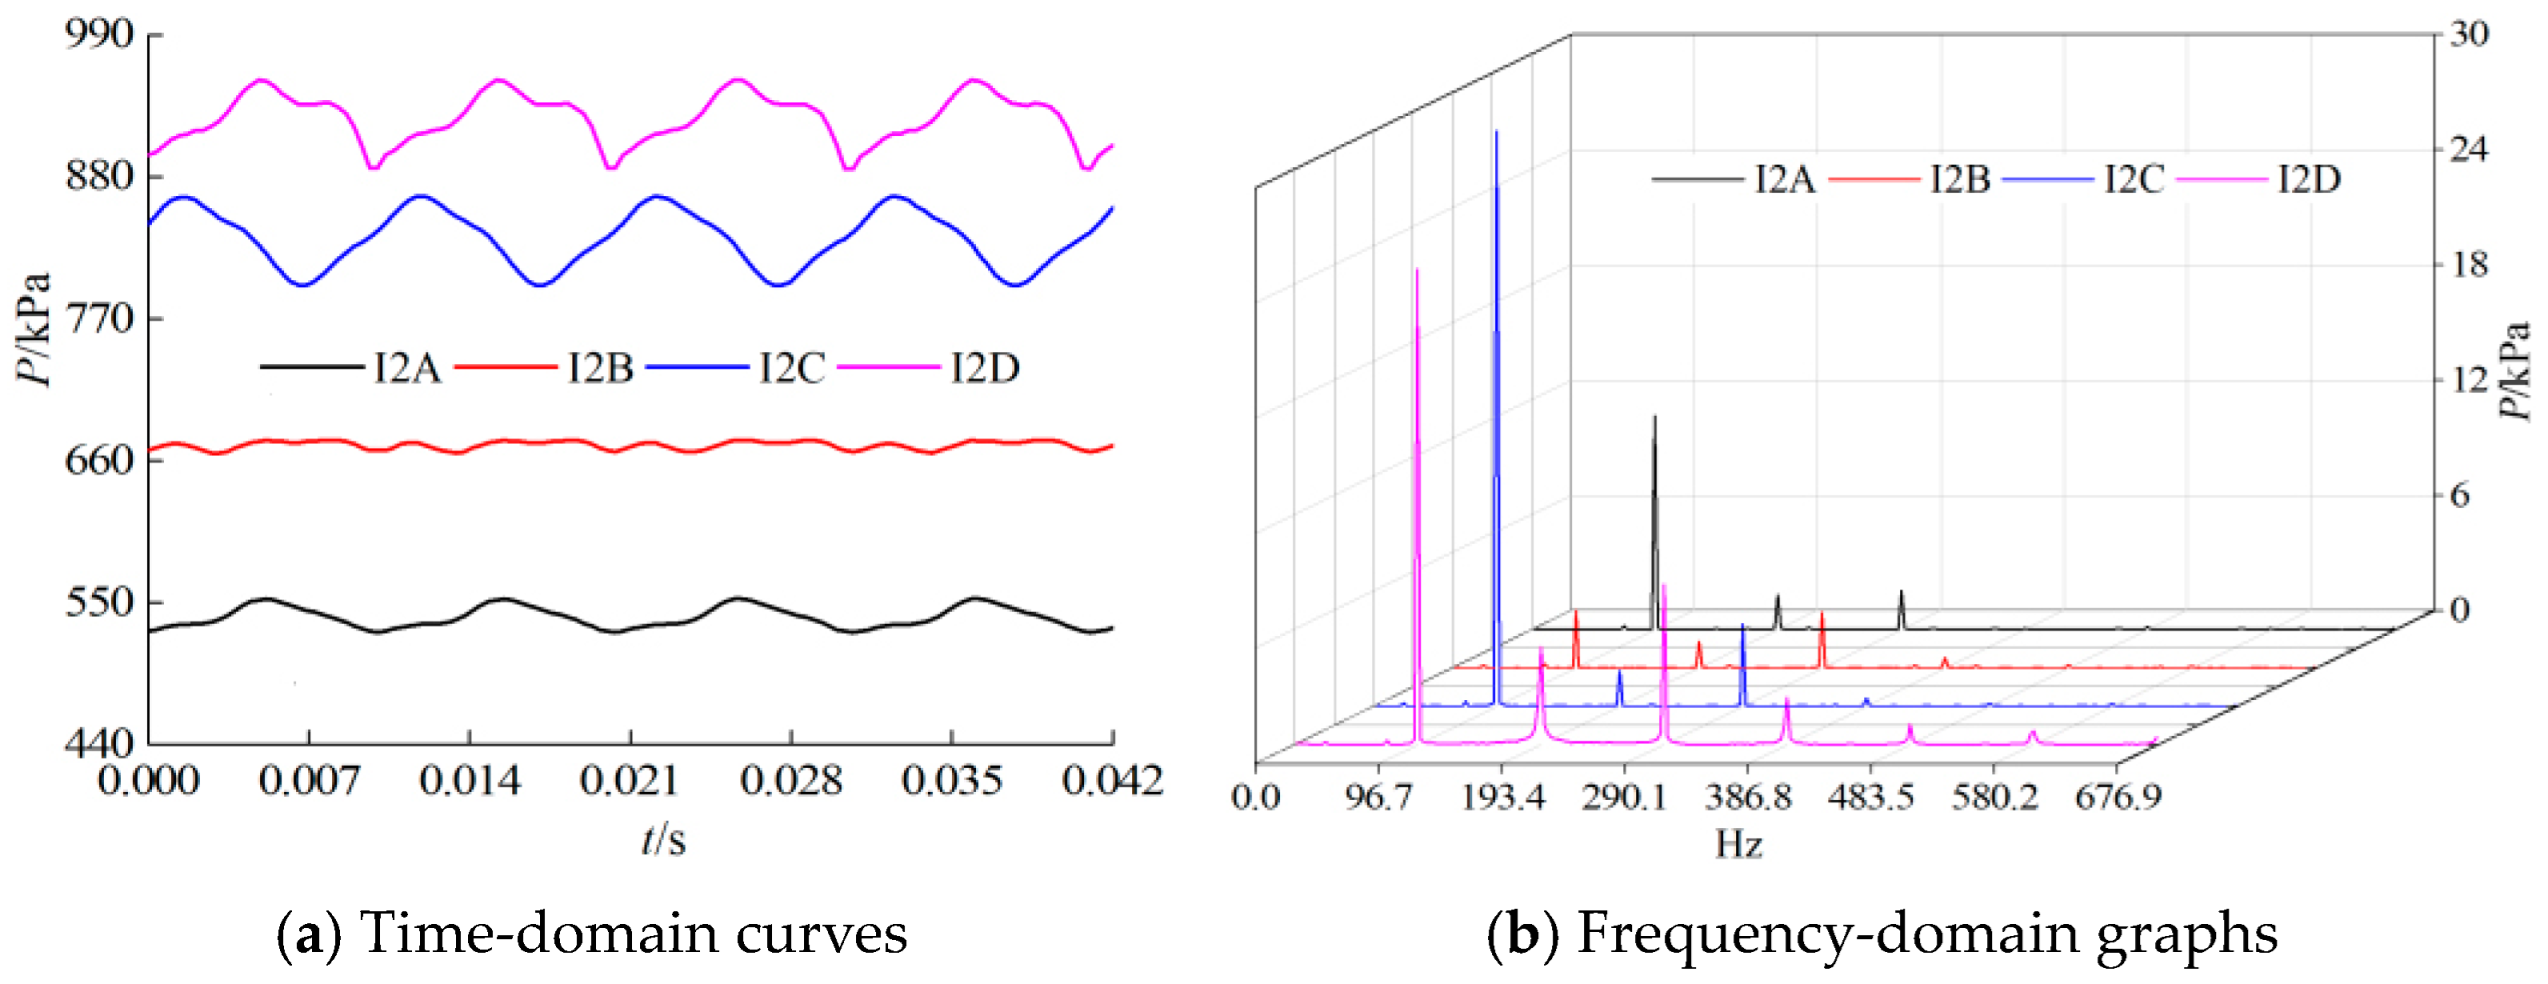
Figure 21.
Pressure pulsation characteristics of the second-stage impeller with 0.6Q.
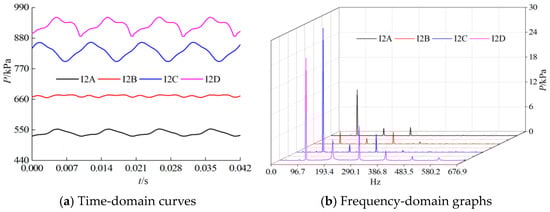
Figure 22.
Pressure pulsation characteristics of the second-stage impeller with 1.0Q.
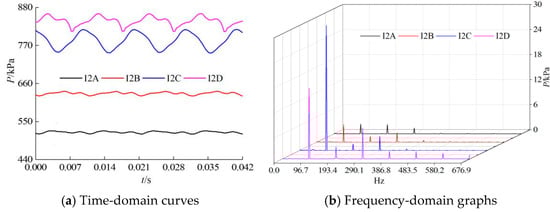
Figure 23.
Pressure pulsation characteristics of the second-stage impeller with 1.4Q.
Figure 20, Figure 21, Figure 22 and Figure 23 show that when the impeller completes one rotation, for any monitoring point on the second-stage impeller, the number of pressure pulsations is equal to the number of guide vanes, as four periodically similar waveforms appeared. The frequency-domain graphs reveal that the pressure pulsations’ dominant frequency coincides with that of the guide vane (96.7 Hz), with values appearing at other low-order multiples of guide vane frequency. Furthermore, a comparison of these results reveals that along with increasing flow rate, the pressure pulsation’s amplitude gradually decreases.
3.4.3. Pressure Pulsation Characteristics in the First-Stage Guide Vane
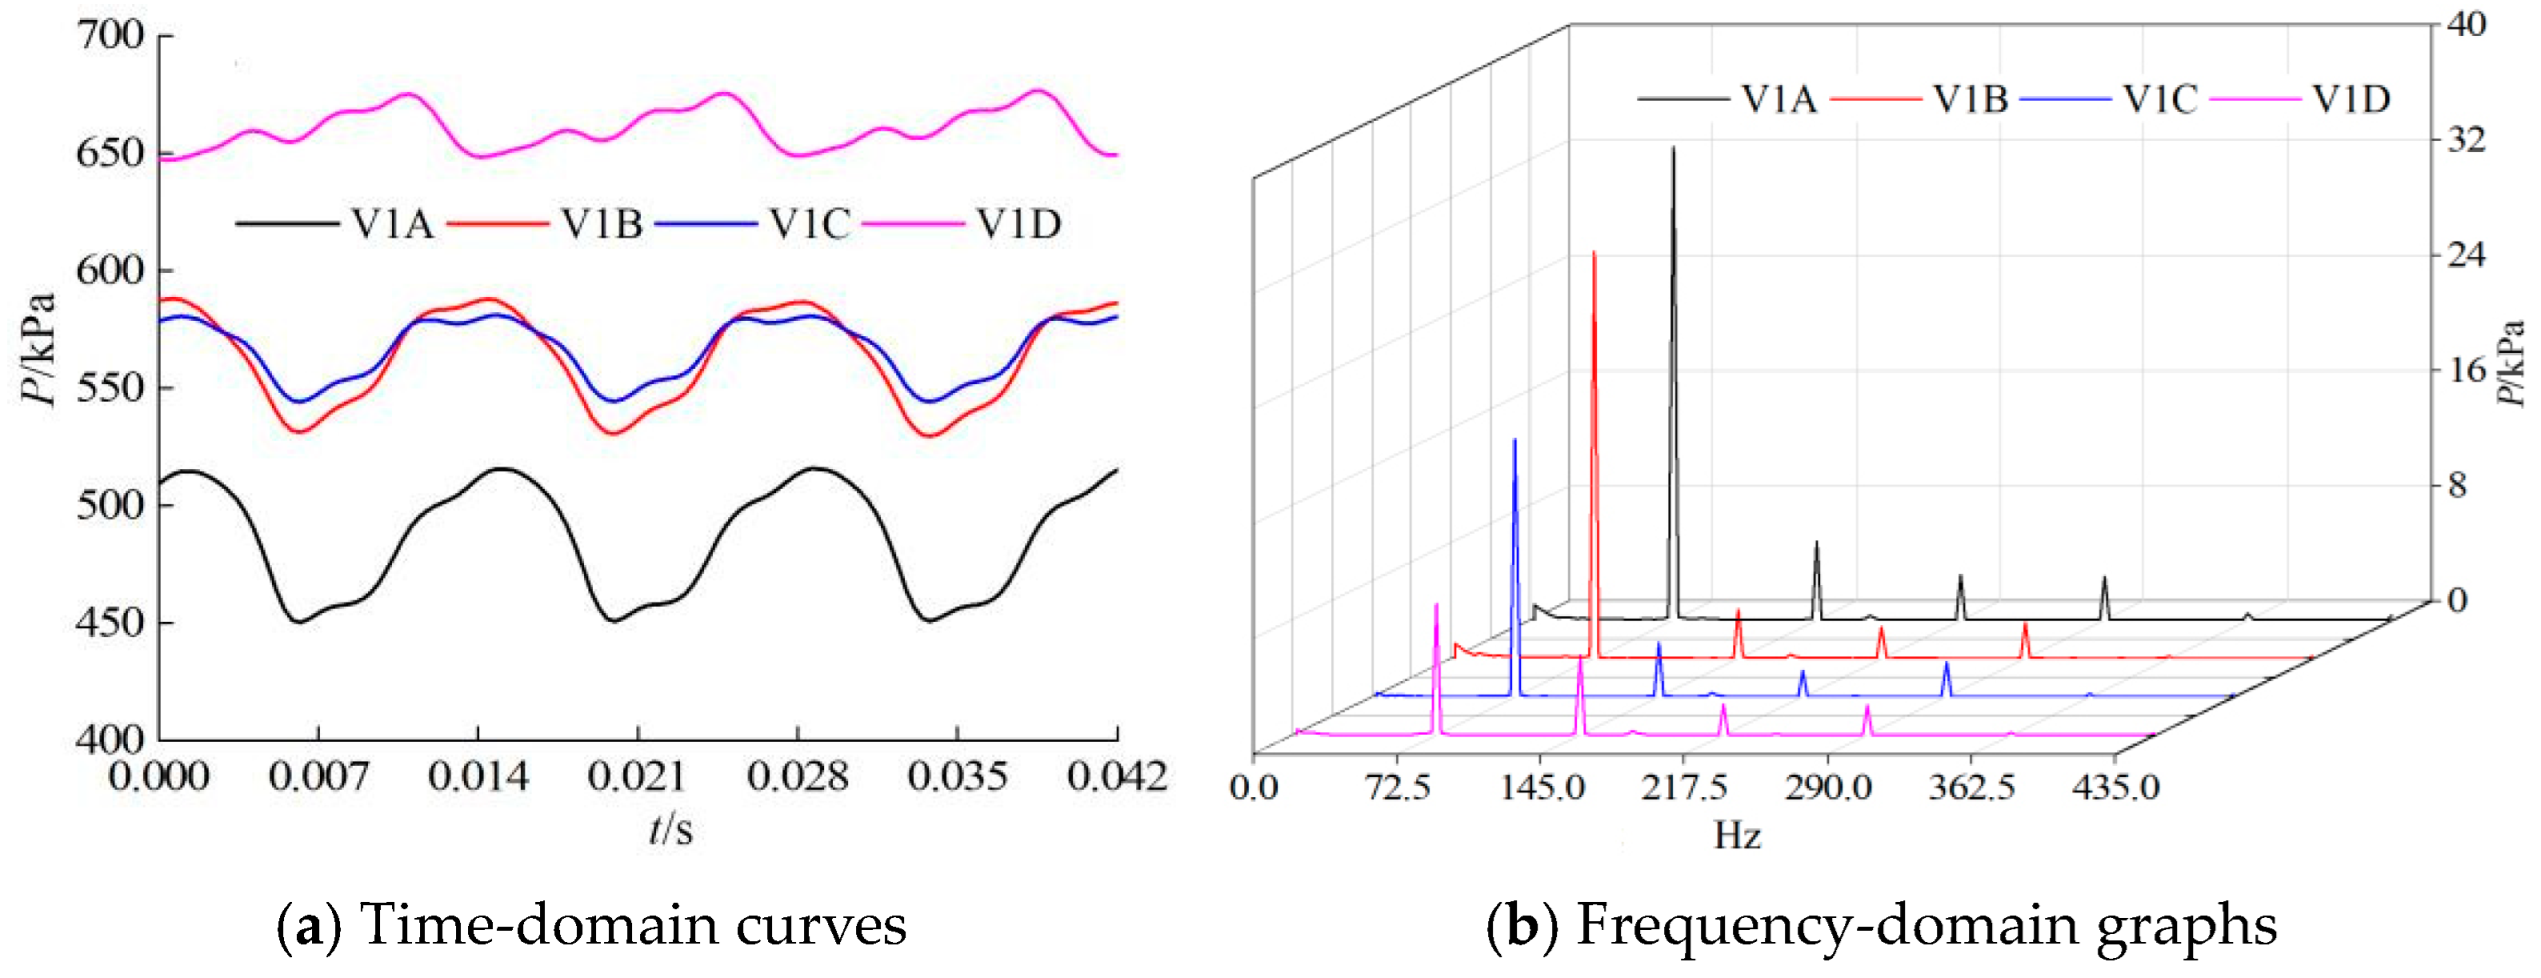
For any monitoring point on the working surface of a single-channel blade of the first-stage guide vane, Figure 24, Figure 25, Figure 26 and Figure 27 show time- and frequency-domain graphs regarding the pressure pulsation characteristics under four different operating conditions. The time-domain curves show the changes seen within one impeller rotation.
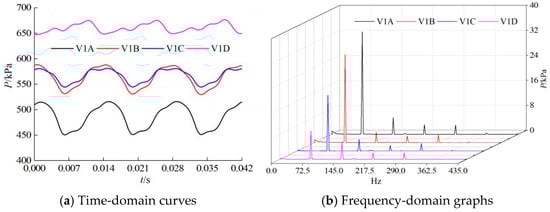
Figure 24.
Pressure pulsation characteristics of the first-stage guide vane with 0.2Q.
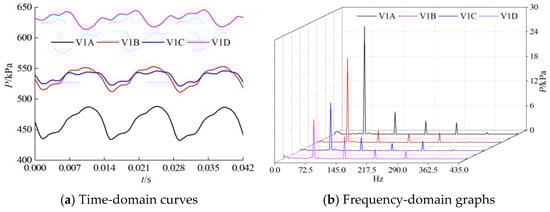
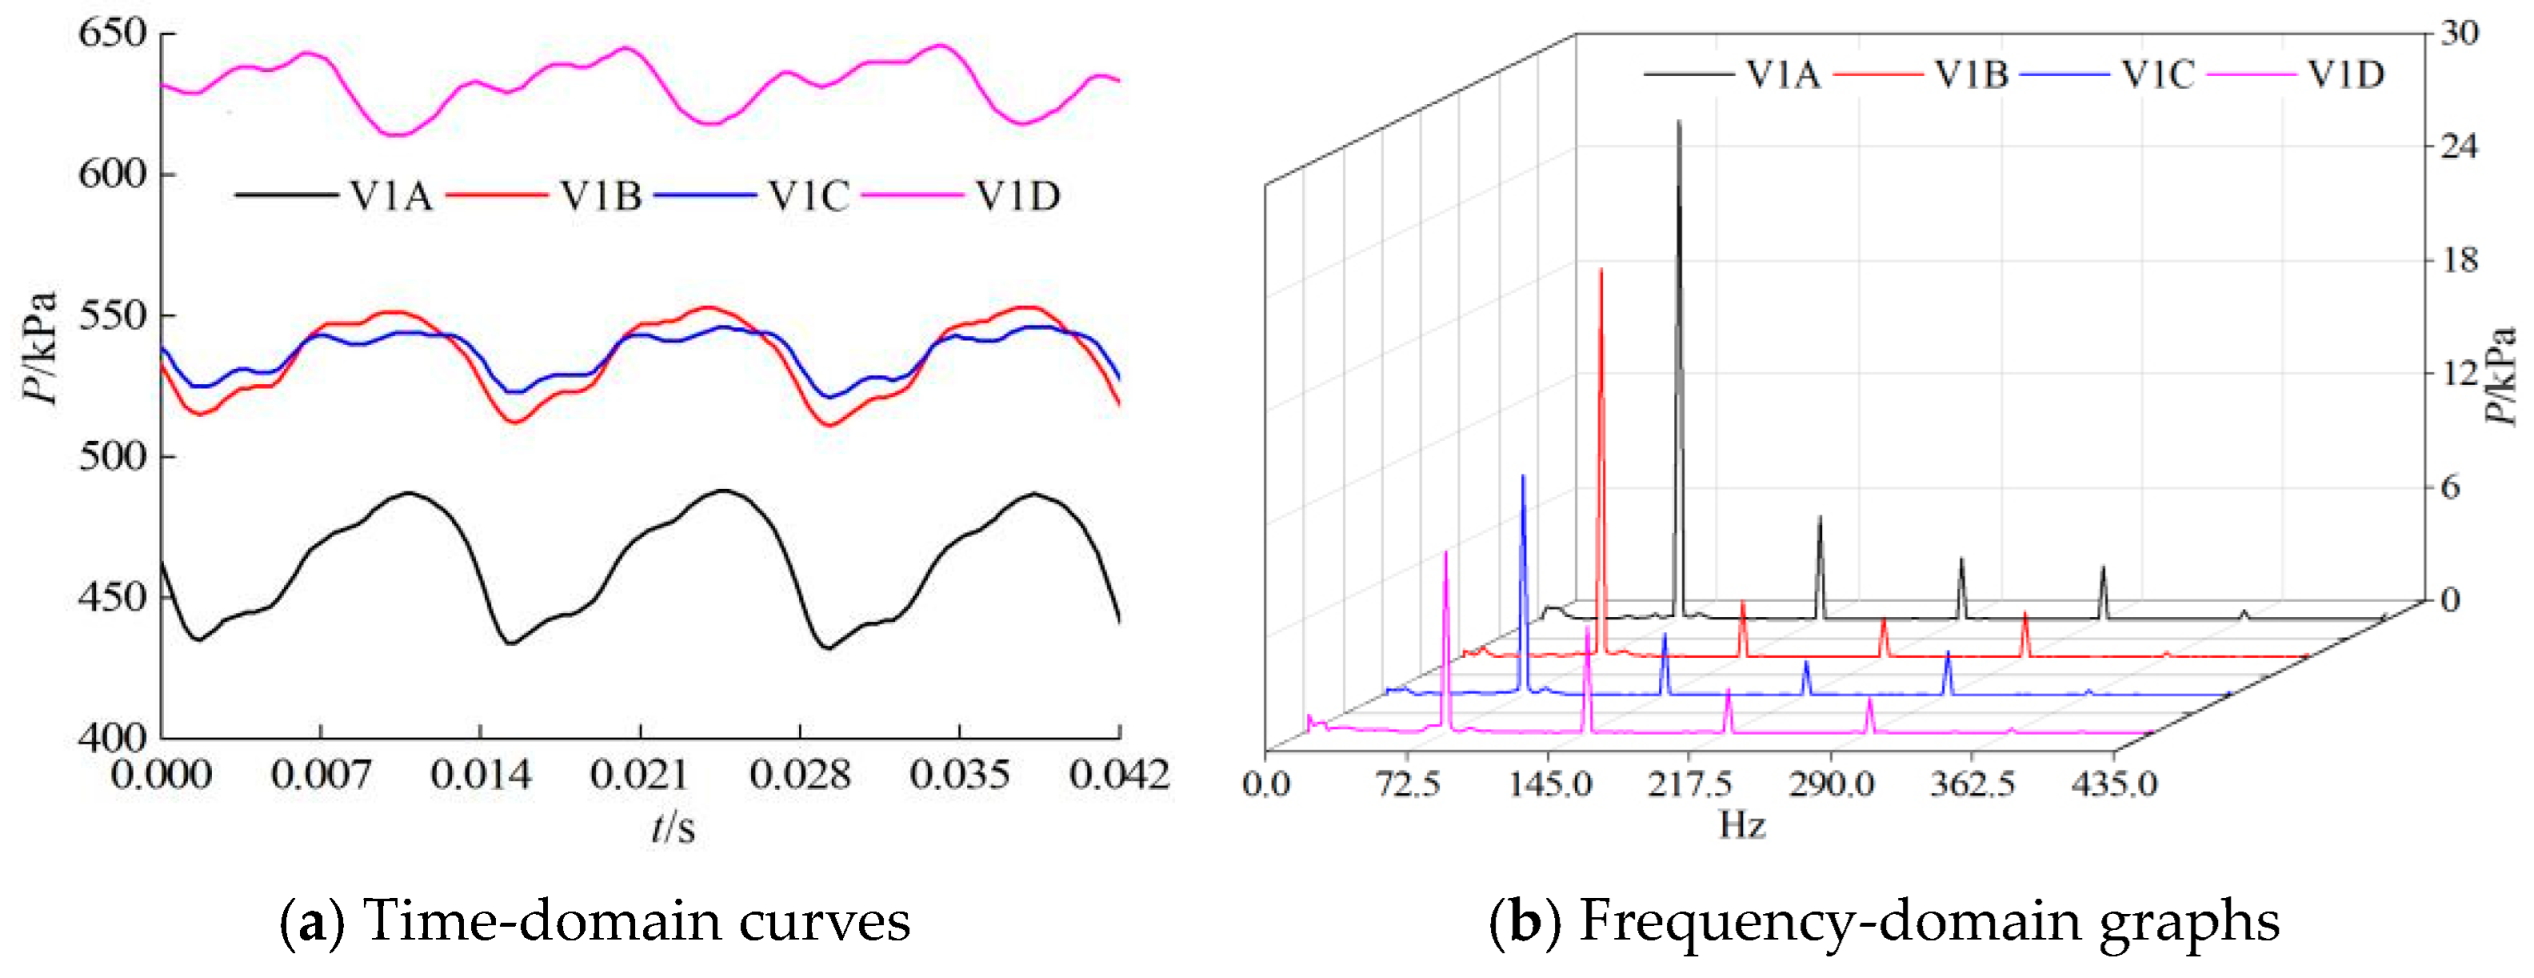
Figure 25.
Pressure pulsation characteristics of the first-stage guide vane with 0.6Q.
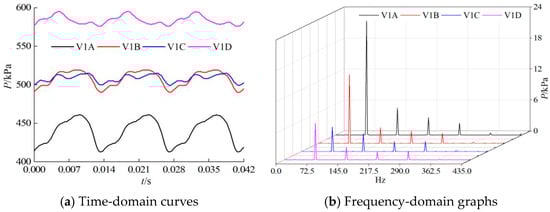
Figure 26.
Pressure pulsation characteristics of the first-stage guide vane with 1.0Q.
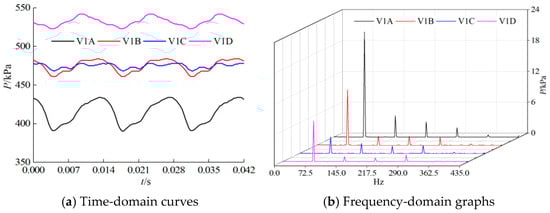
Figure 27.
Pressure pulsation characteristics of the first-stage guide vane with 1.4Q.
Figure 24, Figure 25, Figure 26 and Figure 27 show that when the impeller completes one rotation, for any monitoring point in the first-stage vane guide, the number of pressure pulsations is equal to that of the impeller blades when three periodically similar waveforms appeared. The frequency-domain graphs reveal that the pressure pulsations’ dominant frequency coincides with that of the impeller blade (72.5 Hz), with values appearing at other low-order multiples of impeller blade frequency. In addition, a comparison of these results reveals that along with an increasing flow rate, the pressure pulsation’s amplitude gradually decreases.
3.4.4. Pressure Pulsation Characteristics in the Second-Stage Guide Vane
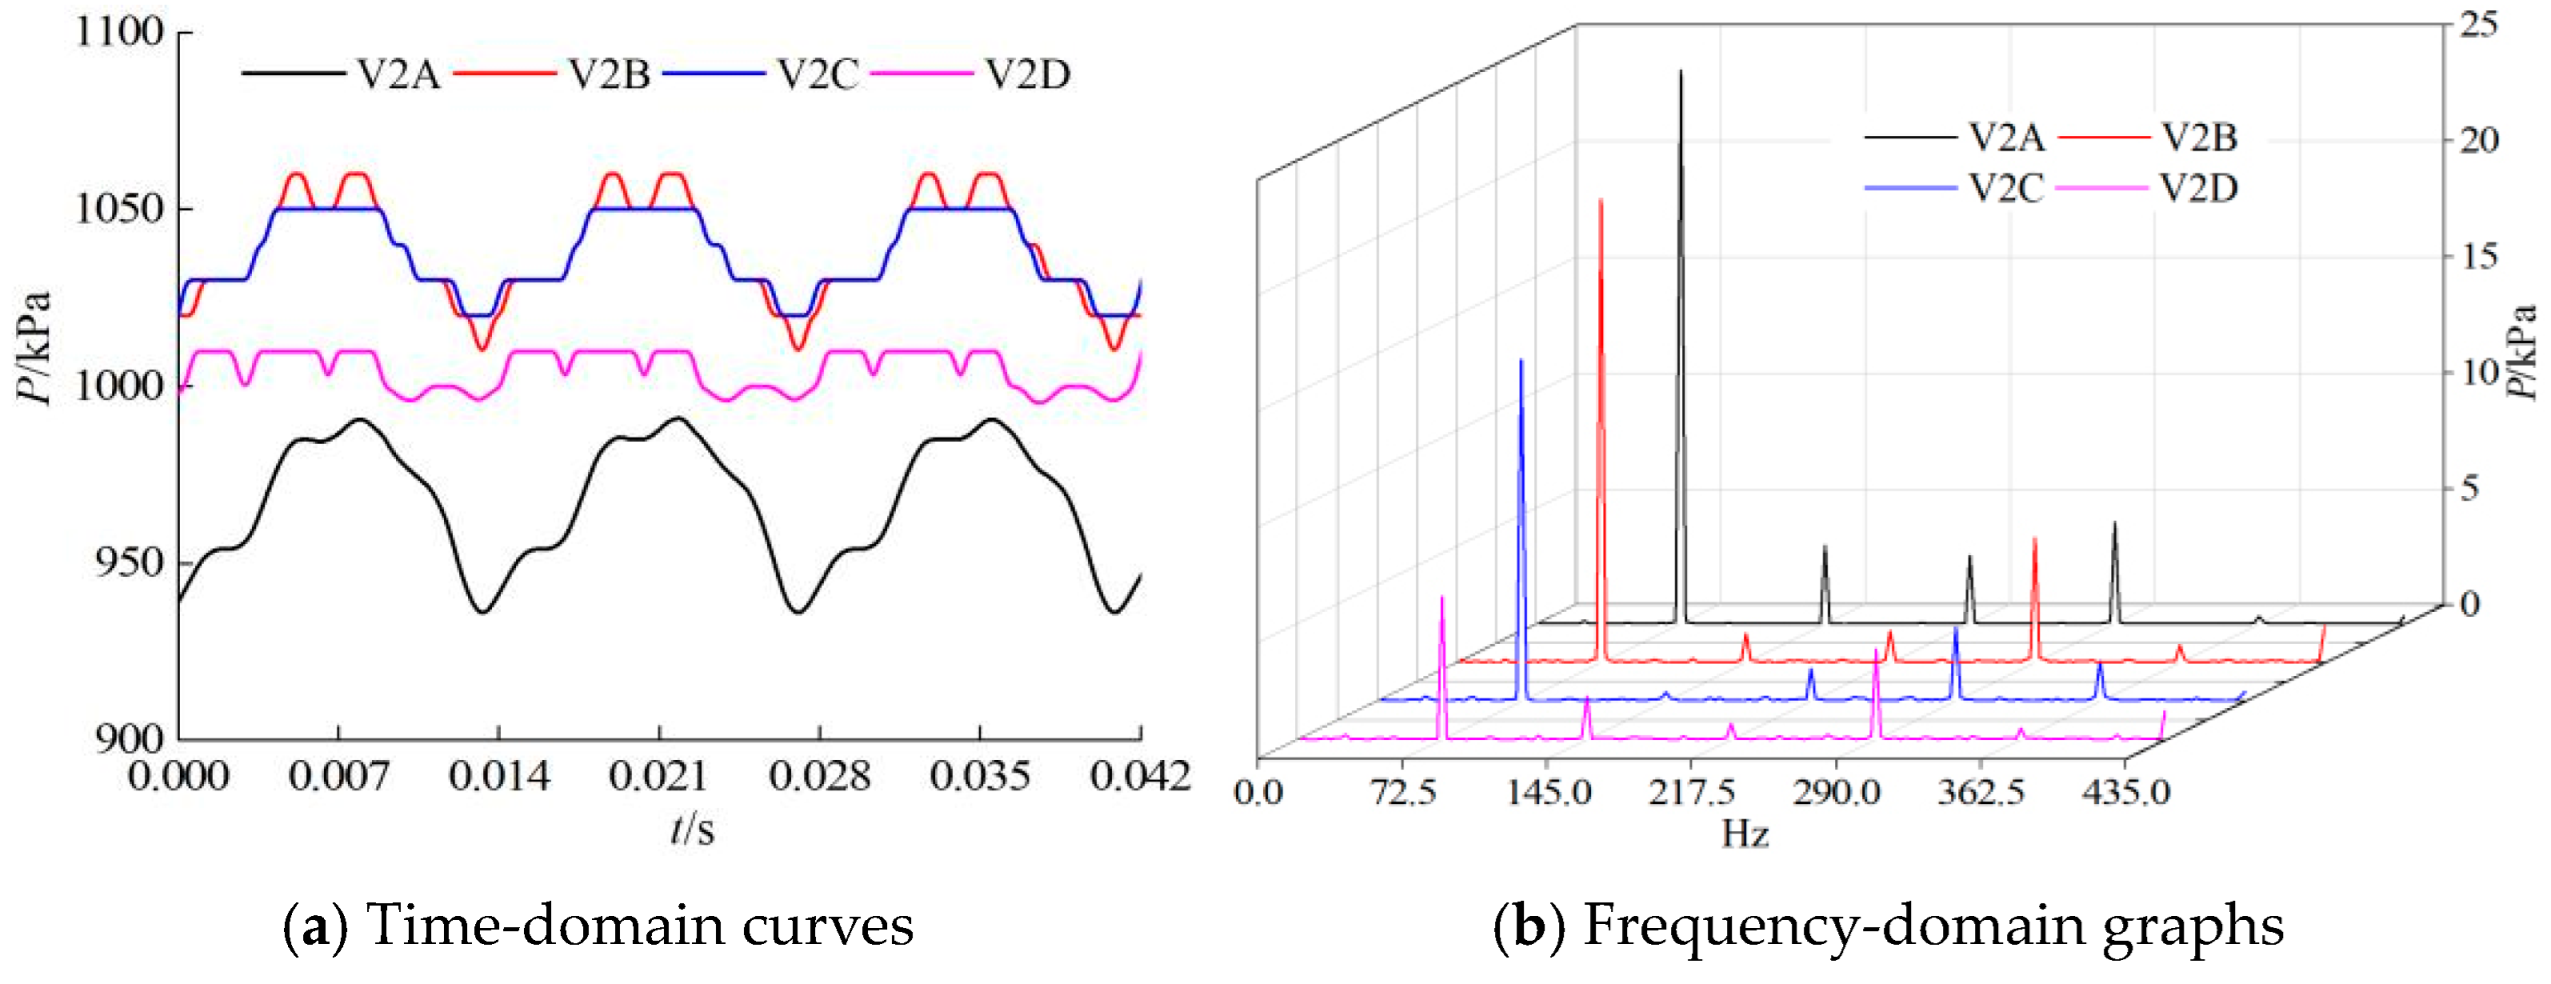
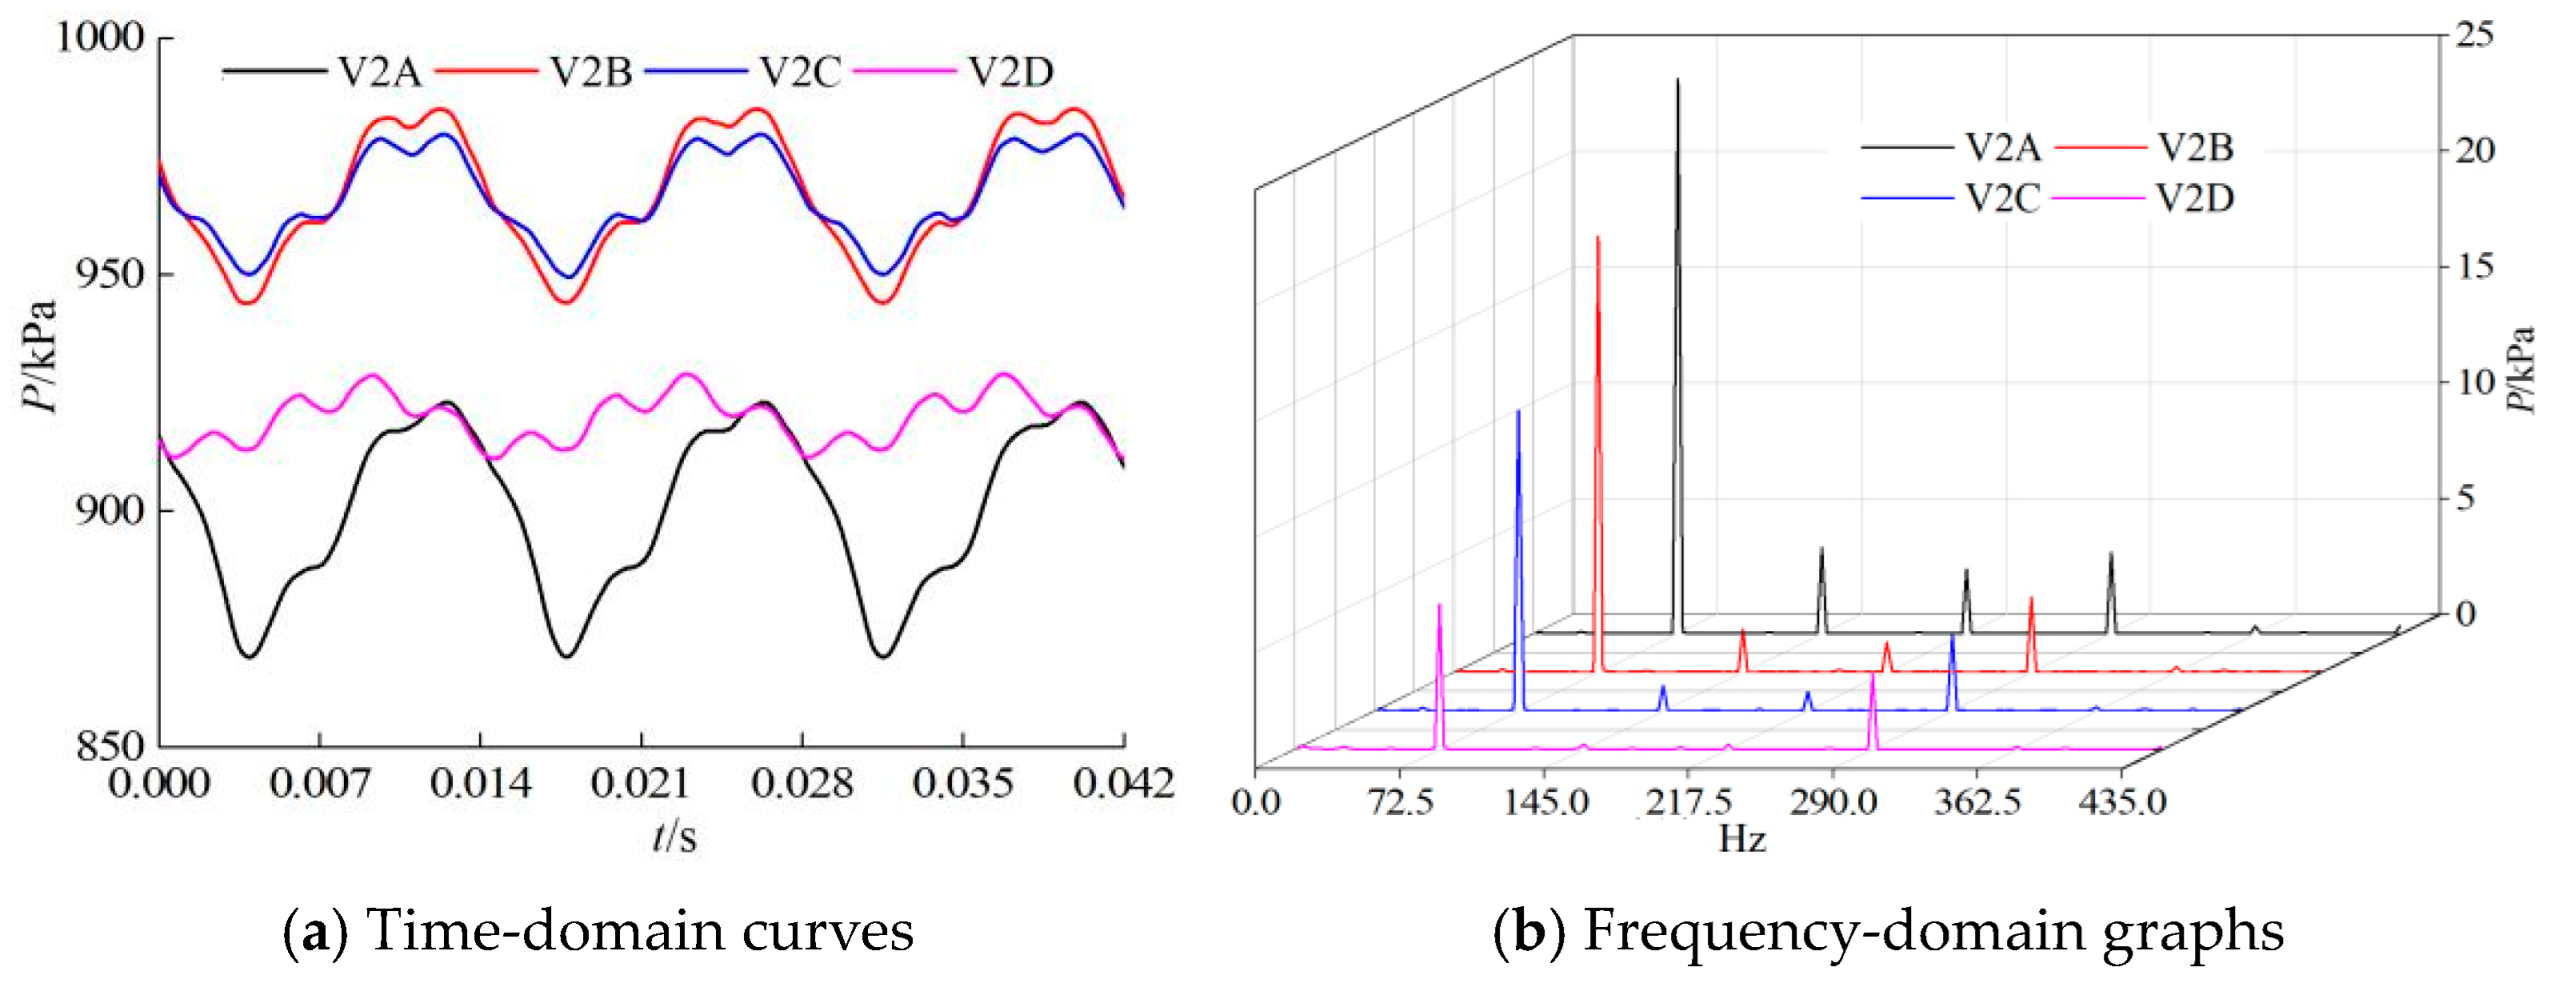
For any monitoring point of the working surface on the single-channel blade of the second-stage guide vane, Figure 28, Figure 29, Figure 30 and Figure 31 show time- and frequency-domain graphs regarding the pressure pulsation characteristics under four different operating conditions. The time-domain curves show the changes seen within one impeller rotation.
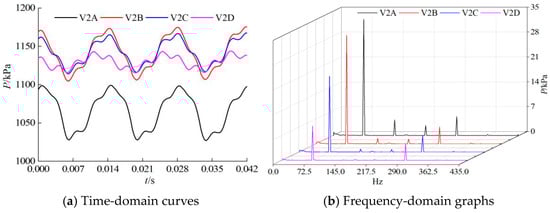
Figure 28.
Pressure pulsation characteristics of the second-stage guide vane with 0.2Q.
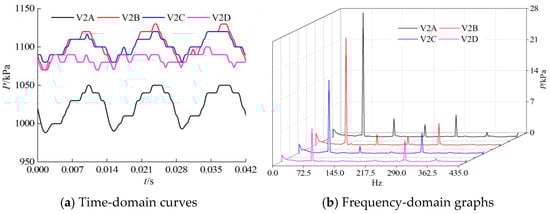
Figure 29.
Pressure pulsation characteristics of the second-stage guide vane with 0.6Q.
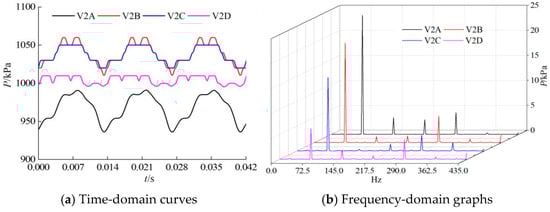
Figure 30.
Pressure pulsation characteristics of the second-stage guide vane with 1.0Q.
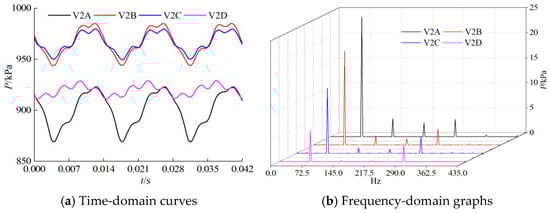
Figure 31.
Pressure pulsation characteristics of the second-stage guide vane with 1.4Q.
Figure 28, Figure 29, Figure 30 and Figure 31 show that when the impeller completes one rotation, for any monitoring point of the second-stage guide vane, the number of pressure pulsations is equal to that of the impeller blades as three periodically similar waveforms appeared. The frequency-domain graphs reveal that the pressure pulsations’ dominant frequency coincides with that of the impeller blade (72.5 Hz), with values appearing at other low-order multiples of the impeller blade’s frequency. In addition, a comparison of these results reveals that along with an increasing flow rate, the pressure pulsation’s amplitude shows a gradual decrease.
As shown by the above analyses, the impeller’s rotational speed and the quantity of guide vanes determine the pulsation behavior of the impeller’s internal flow field, while the impeller’s rotational speed and the quantity of impeller blades determine the pulsation behavior of the guide vane’s internal flow field. Interactions between the dynamic impeller blades and static guide vane blades significantly influence the pulsation characteristics of the flow field inside both the impeller and guide vane.
4. Test Validation of the Method
4.1. Testing Principle
Based on existing conditions, it is difficult to conduct qualitative wear tests for internal flow channels as well as for the components of deep-sea mining lift pumps. To validate the correctness of the numerical simulation method herein, this study manufactured one scaled-down version of a mining lift pump that mirrors the structural design and rotational speed profile of a full-scale deep-sea mining lift pump, which is depicted in Figure 32.
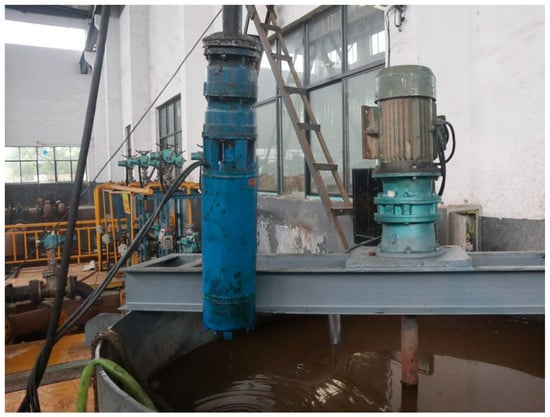
Figure 32.
Test pump.
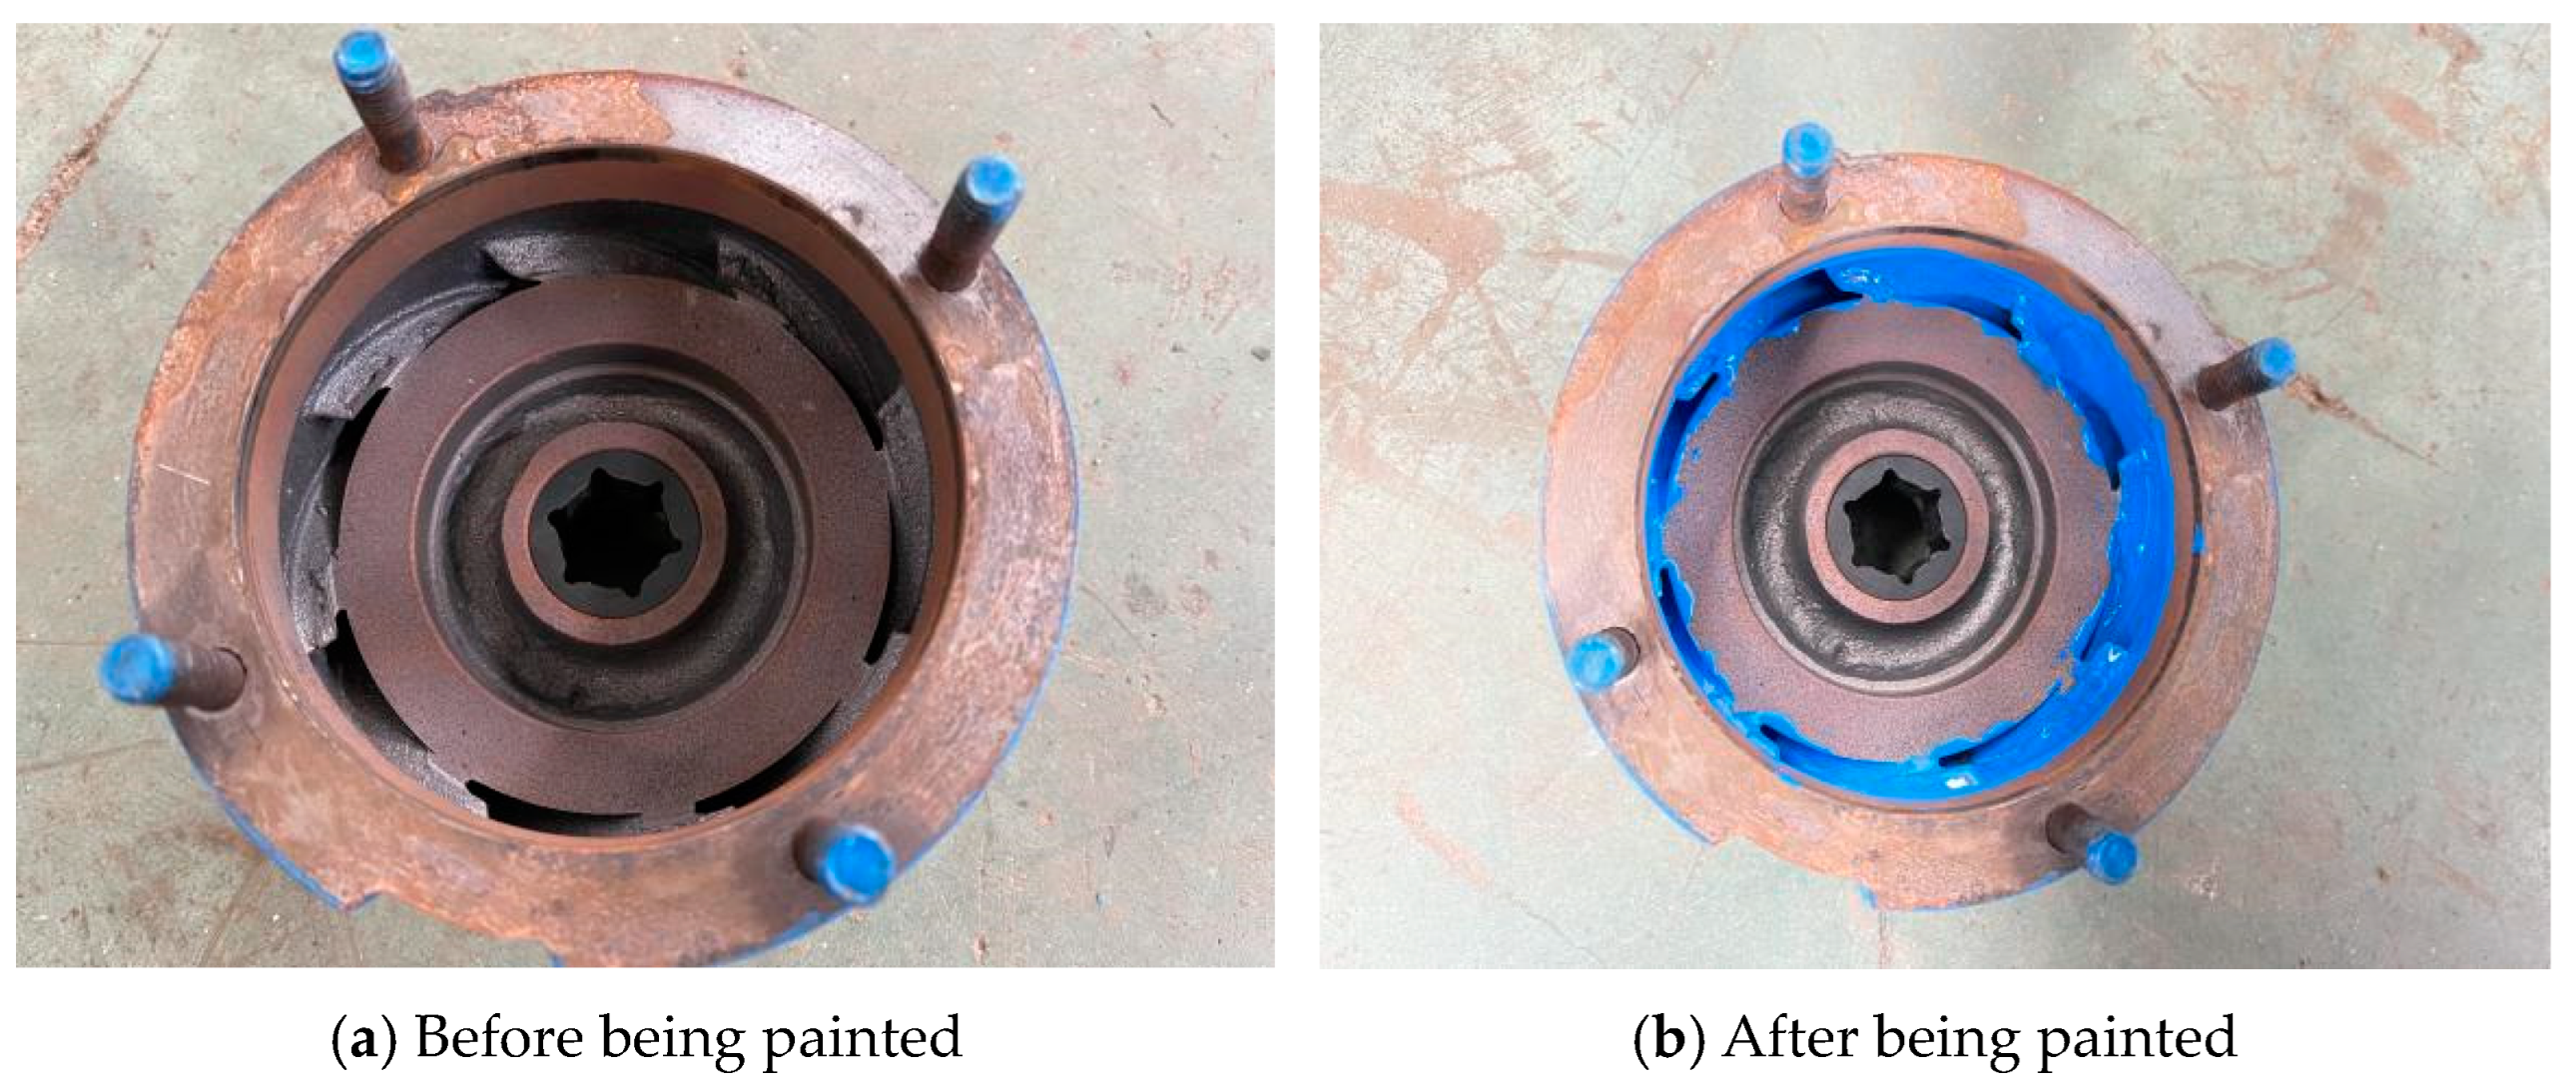
Considering the existing circumstances of the pump flow channel in the test, this study employs standard solid particles measuring 3 mm in diameter, with a test concentration of 7.5%. For this study, we performed the tests using low flow characteristics (13 m3/h). Prior to that, an even layer of water-based paint was painted onto the guide vane runners. Once the paint was completely dry, the testing process was performed. We observed the particles exerting an influence on the runners for 2 h of unsteady flow, subsequently comparing these observations with the numerical calculation outcomes when using the same boundary conditions. Comparative images of the guide vanes prior to and after using water-based paint are illustrated in Figure 33.
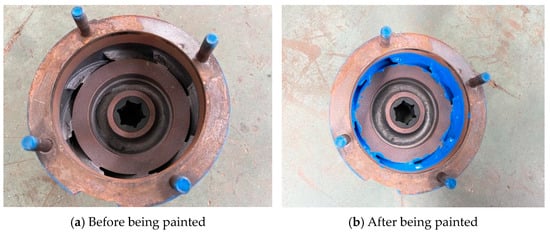
Figure 33.
Photographs of the guide-vane flow channels before and after they were painted with water-based paint.
The experimental procedures unfolded according to the following systematic steps. (1) Initially, the pump used in the experiments was mounted within the experimental setup. A zero-load test was conducted to verify the seamless functioning of both the electric motor and the data acquisition system. Upon the confirmation of normal operation, we initiated the unsteady flow characteristics experiment. (2) The pump’s guide vanes were meticulously dismantled, thoroughly cleaned, and then coated uniformly with water-based paint to a specified thickness. After allowing the paint to dry completely, the pump was reinstalled, ready for experimentation. (3) Clear water and sand were mixed in the water tank for experimentation, achieving a concentration of 7.5% for the sand. The prepared pump was mounted in the system, ready to be tested, and a thorough check was conducted to ensure the accuracy of all pipe and valve connections. (4) With the power switch activated on the master control console, we carried out the “pump unsteady flow characteristics experiment”. With the inlet flow adjusted to 13 m3/h using a regulating valve, data on the experiment were meticulously recorded over a period of 2 h. Upon the completion of data collection, the power was switched off, marking the end of the experimental phase. The pump’s guide vanes were then dismantled once again to inspect the condition of the water-based paint, specifically focusing on the first-stage and second-stage guide vane regions. Prior to reorganizing the test site, pictures were taken to document the state of the guide vanes and the experimental setup, which are presented in Figure 34.
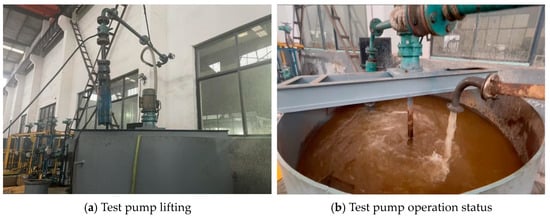
Figure 34.
Photographs of the experimental site.
4.2. Comparison between the Experimental and Numerical Results
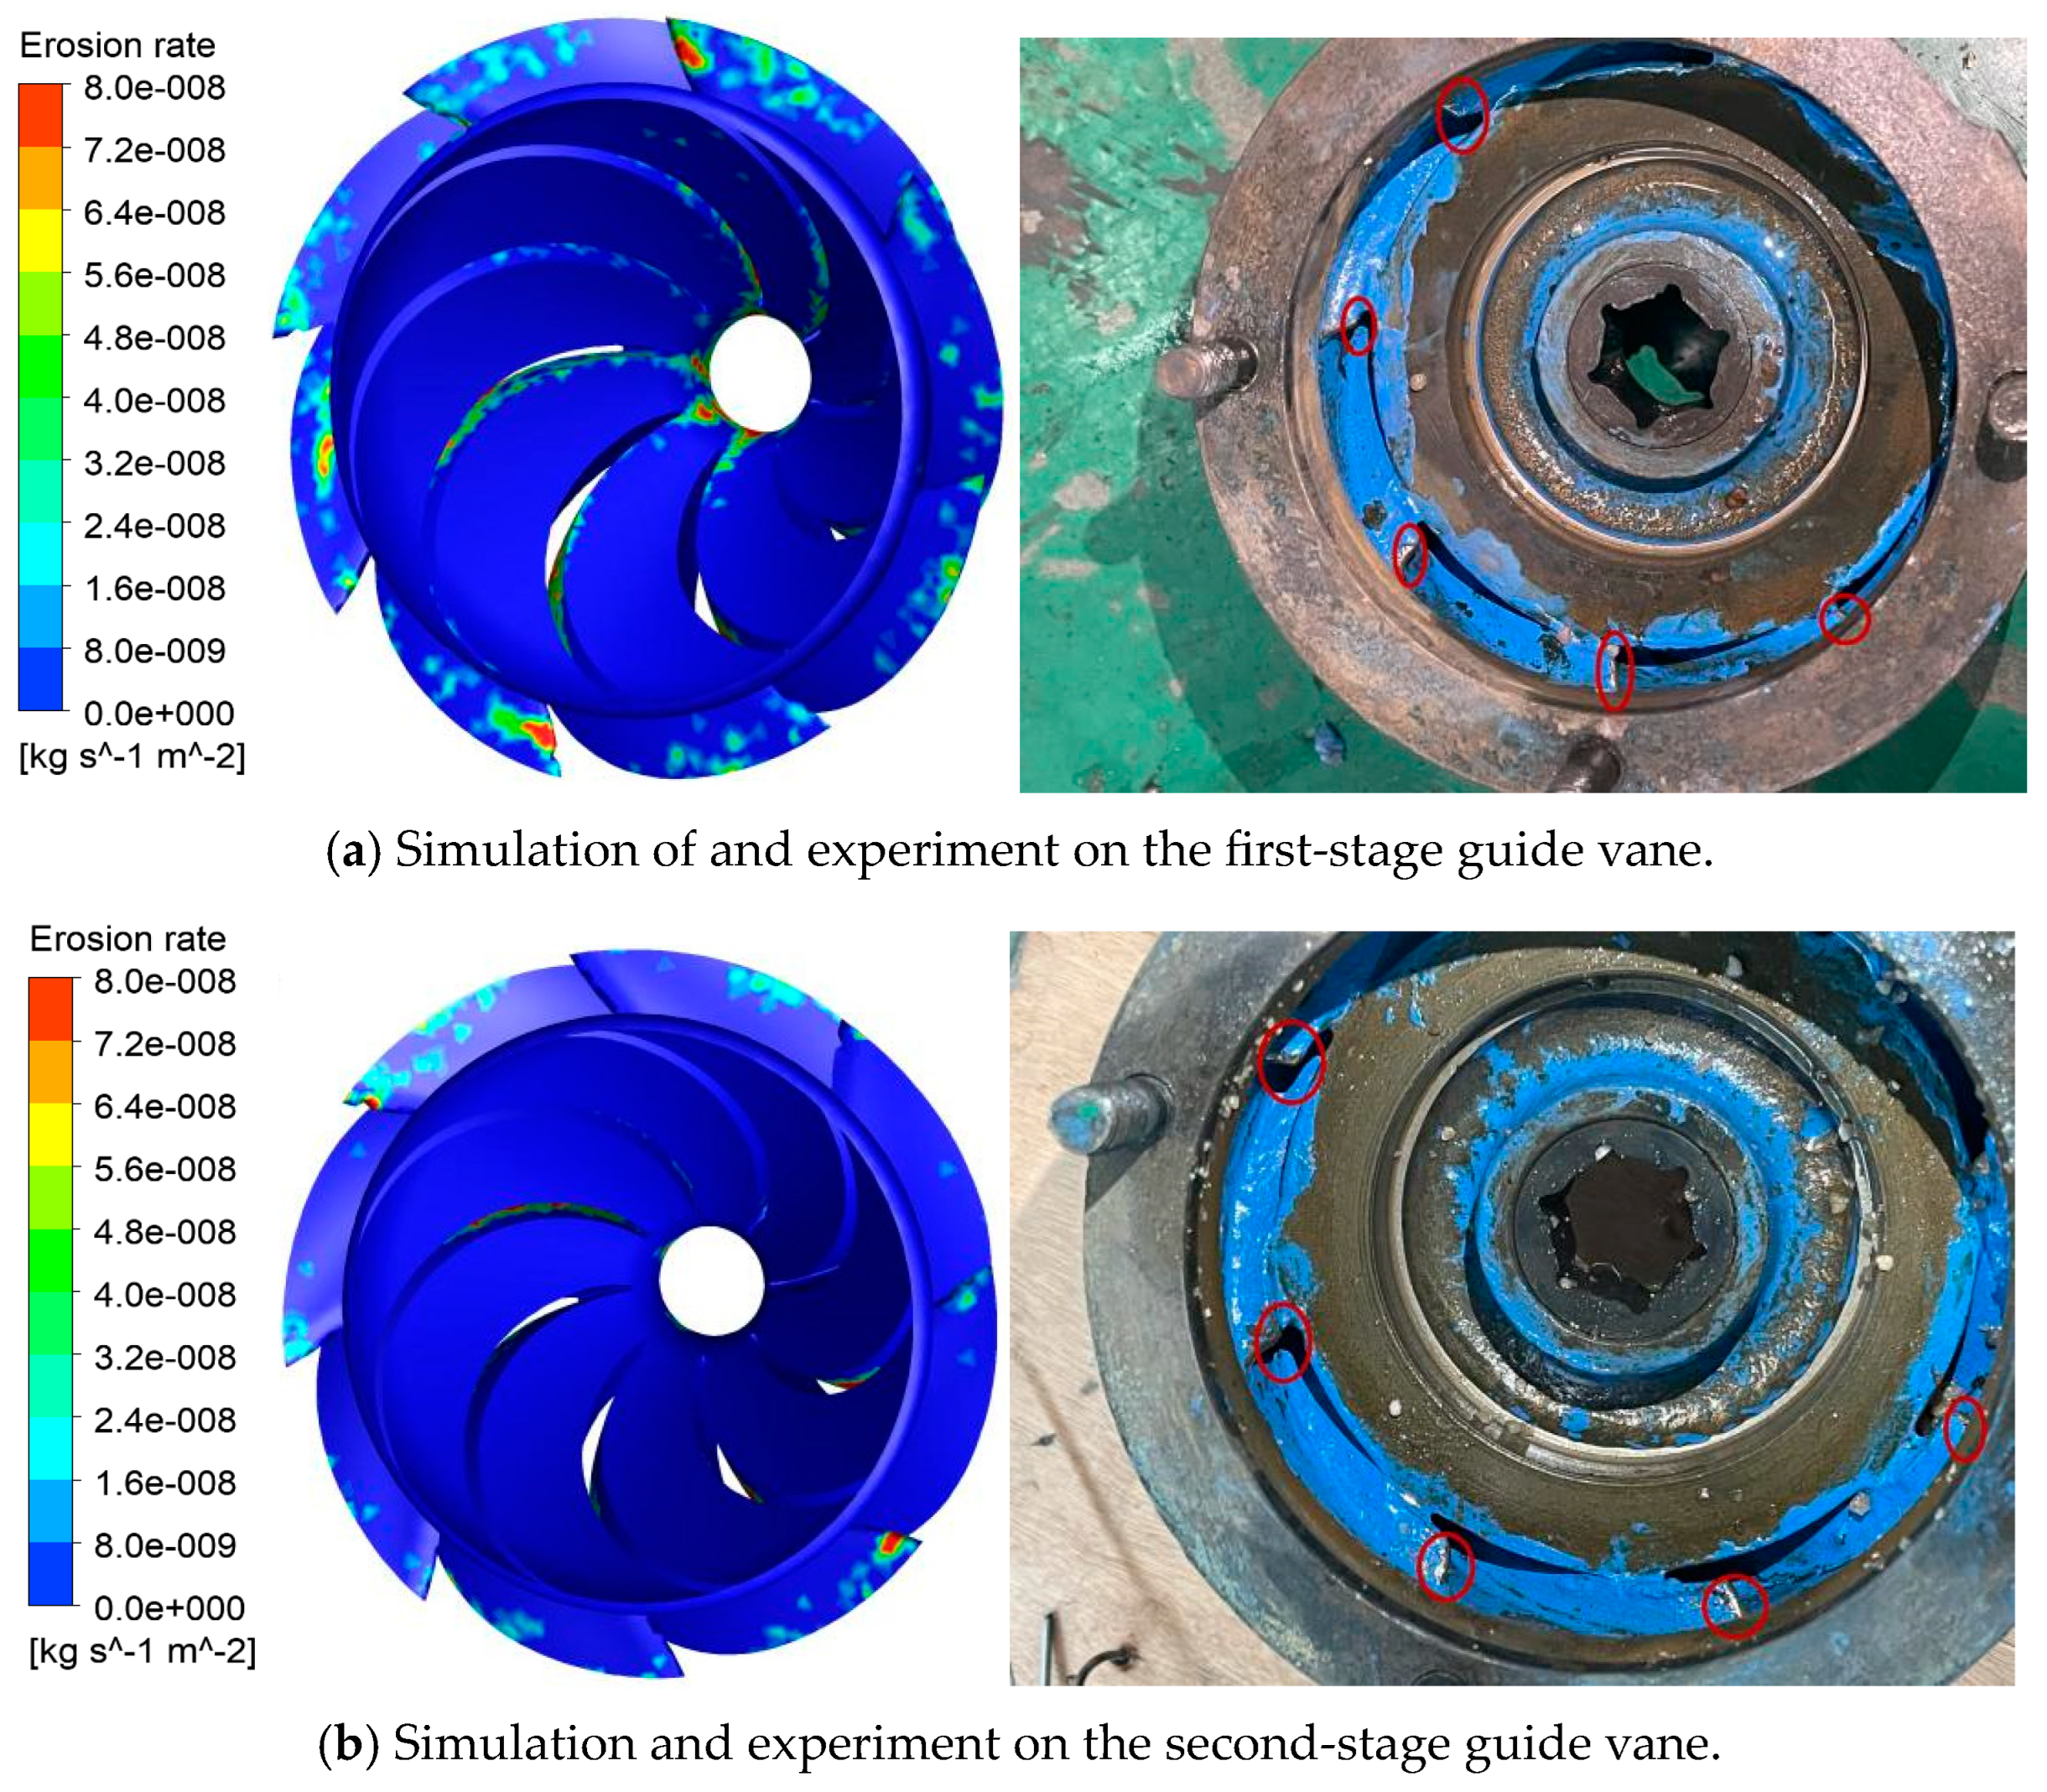
The numerical method outlined in the preceding sections was employed to simulate the unsteady flow behavior of the pump in the experiment, utilizing the same boundary conditions as those applied in the unsteady flow experiments. Both the first and second stages of the pump’s guide vanes were simulated, and the simulated outcomes were benchmarked against the empirical findings, which are illustrated in Figure 35.
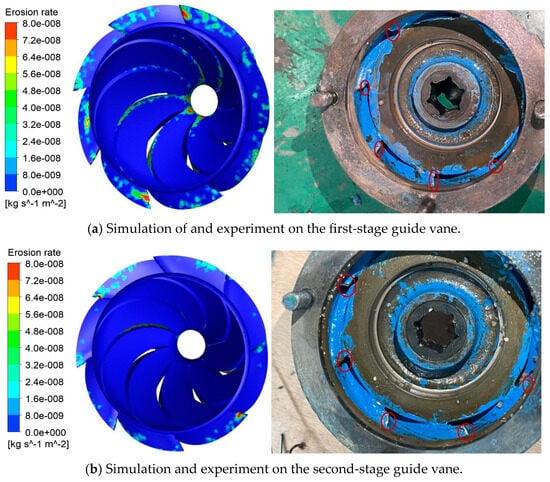
Figure 35.
Comparison between the numerical simulation and the experiment.
According to Figure 35a,b, because of damage from solid phase particles, the water-based paint at the inlet of the guide vane is seriously damaged, and the surface damage area of the first guide vane is greater than that of the secondary guide vane. After rectification, the flow of particles entering the secondary guide vane is more stable, and the number of collisions with the surface of the guide vane is reduced, thereby effectively reducing the damage to the surface of the guide vane. The numerical calculation results are in good agreement with the experimental results, indicating that the numerical calculation method and the model used in this paper are correct.
5. Conclusions
The flow process found inside deep-sea mining lift pumps is extremely complicated, due to the small number of blades, different-sized vortices, blockages of the flow passages to different degrees, and phenomena such as backflow, secondary flow, and circulation. In addition to causing large hydraulic losses, the existence of these phenomena causes flow instability and asymmetry, as well as an imbalance in the guide vanes and impellers. This is the main cause of the lower level of efficiency of deep-sea mining electric pumps compared to ordinary centrifugal pumps.
An analysis of the spatiotemporal evolution process of the vortices in the impeller revealed that the pulsation of the impeller flow field over one rotation cycle has a close relationship with the positioning of the guide vanes, as well as of the impeller blades. Therefore, the design and optimization of the impellers or guide vanes of deep-sea mining lift pumps ought to prioritize holistic integration of the moving and static components. Targeting only one of these aspects and ignoring the others may lead to inferior results.
Based on the examination results of flow-field pulsation intensity obtained from this study, the flow fields’ pulsation intensity within the impeller blades as well as around the guide vanes significantly exceeds the values of other regions in the flow passage. This indicates that the interactions between dynamic impeller blades and static guide vanes have a remarkable impact on the pulsation behavior of flow fields inside deep-sea mining lift pumps.
Analytical results of the flow field’s pressure pulsation characteristics in both the time and frequency domains showed that these characteristics, which are associated with the flow field inside the impeller, are related to the impeller’s speed and the number of guide vanes. Additionally, within the guide vanes, the flow field’s pulsation characteristics have a certain relationship with the impeller’s speed and the number of impeller blades.
The hydraulic properties of deep-sea mining lift pumps and the unsteady pulsation characteristics regarding the internal flow field were found to be mainly related to two factors. First, the flow in the pump body is asymmetrical in all directions and the flow process is complicated, which destroys the flow’s stability in the guide vanes and impeller, thereby resulting in low hydraulic efficiency. Second, the interference of the moving and static cascades between the impellers and guide vanes is a key factor that affects the time- and frequency-domain pulsation characteristics of the internal flow field within the deep-sea mining electric pump.
A comparative analysis of the hydraulic performance experiment outcomes, as well as a numerical analysis, indicated that the designed mining lift pump has successfully fulfilled the specified design objectives, which provides valuable insights regarding its practical application.
Furthermore, the methodology validation tests confirm that the SST k-ω model is fully capable of predicting unsteady flow characteristics and hydraulic performance issues in deep-sea mining lift pumps, serving as a trustworthy framework for studying the internal flow dynamics of these pumps.
Author Contributions
Conceptualization, S.H.; methodology, S.H. and X.H.; software, S.H.: J.H. and J.W.; validation, S.H. and J.H.; formal analysis, S.H.; investigation, S.H., Z.Y. and P.W.; resources, S.H., H.M. and X.H.; data curation, S.H., J.H. and P.W.; writing—original draft preparation, S.H.; writing—review and editing, S.H. and X.H.; visualization, S.H.; supervision, S.H.; project administration, S.H. and J.W.; funding acquisition, X.H. All authors have read and agreed to the published version of the manuscript.
Funding
This work was supported by the National Key Research and Development Project of China (2016YFC0304103).
Institutional Review Board Statement
Not applicable.
Informed Consent Statement
Not applicable.
Data Availability Statement
The data presented in this study are available on request from the corresponding author.
Conflicts of Interest
The authors declare no conflicts of interest.
References
- Yang, Y.; Zhou, L.; Shi, W.; He, Z.; Han, Y.; Xiao, Y. Interstage difference of pressure pulsation in a three-stage electrical submersible pump. J. Pet. Sci. Eng. 2020, 196, 107653. [Google Scholar] [CrossRef]
- Zhang, Y.; Wang, J. Numerical simulation and wear research of slurry pump internal flow field. Energy Eng. 2017, 2, 71–75. [Google Scholar]
- Gahlot, V.K.; Seshadri, V.; Malhotra, R.C. Effect of density, size distribution, and concentration of solid on the characteristics of centrifugal pumps. ASME J. Fluids Eng. 1992, 114, 386. [Google Scholar] [CrossRef]
- Li, Y.; Zhu, Z.; He, W.; He, Z. Numerical simulation and experimental research on the influence of solid-phase characteristics on centrifugal pump performance. Chin. J. Mech. Eng. 2012, 25, 1184–1189. [Google Scholar] [CrossRef]
- Wang, C.; Feng, Y.; Ye, J.; Luo, B.; Liu, K. Multi-objective parameters optimization of centrifugal slurry pump based on RBF neural network and NSGA-II genetic algorithm. Trans. Chin. Soc. Agric. Eng. 2017, 33, 109–115. [Google Scholar]
- Jeon, S.-Y.; Kim, C.-K.; Lee, S.-M.; Yoon, J.-Y.; Jang, C.-M. Performance enhancement of a pump impeller using optimal design method. J. Therm. Sci. 2017, 26, 119–124. [Google Scholar] [CrossRef]
- Sellgren, A.; Addie, G.; Scott, S. The effect of sand-clay slurries on the performance of centrifugal pumps. Can. J. Chem. Eng. 2000, 78, 764–769. [Google Scholar] [CrossRef]
- Serrano, R.O.P.; Ferreira, A.G., Jr.; Castro, A.L.P.; de Castro, A.L.P. Desgaste do rotor por abrasão: O efeito do bombeamento de água bruta com diferentes cargas de sedimento. In Proceedings of the XXVII Congreso Latinoamericano de Hidráulica, Lima, Peru, 30 September 2016. [Google Scholar]
- Gandhi, B.K.; Singh, S.N.; Seshadri, V. Prediction of performance characteristics of acentrifugal slurry pump handling clear liquid. Indian J. Eng. Mater. Sci. 1998, 5, 91–96. [Google Scholar]
- Tarodiya, R.; Gandhi, B.K. Numerical simulation of a centrifugal slurry pump handlingsolid-liquid mixture: Effect of solids on flow field and performance. Adv. Powder Technol. 2019, 30, 2225–2239. [Google Scholar] [CrossRef]
- Tarodiya, R.; Gandhi, B.K. Effect of particle size distribution on performance and particle kinetics in a centrifugal slurry pump handling multi-size particulate slurry. Adv. Powder Technol. 2020, 31, 4751–4767. [Google Scholar] [CrossRef]
- Engin, T.; Gur, M.; Calli, I. Slurry and tip clearance effects on the performance of an open impeller centrifugal pump. In Handbook of Powder Technology; Elsevier: Amsterdam, The Netherlands, 2001; Volume 10, pp. 499–504. [Google Scholar]
- Zarya, A.N. The effect on the solid phase of a slurry on the head developed by a centrifugal pump. Fluid Mech. Sov. Res. 1975, 4, 144–154. [Google Scholar]
- Gandhi, B.K.; Singh, S.N.; Seshadri, V. Effect of speed on the performance characteristics of a centrifugal slurry pump. J. Hydraul. Eng. 2002, 182, 225–233. [Google Scholar] [CrossRef]
- Engin, T.; Kurt, A. Prediction of centrifugal slurry pump head reduction: An artificial neural networks approach. ASME J. Fluids Eng. 2003, 125, 199–202. [Google Scholar] [CrossRef]
- Xu, H.; Zhou, Y.; Yang, F.; Wu, B. Analysis on influences of feeding flow rate on flow characteristics in deep-sea ore hydraulic transport equipment. J. Drain. Irrig. Mach. Eng. 2019, 37, 618–624. [Google Scholar]
- Zhang, N.; Gao, B.; Li, Z.; Ni, D.; Jiang, Q. Unsteady flow structure and its evolution in a low specific speed centrifugal pump measured by PIV. Exp. Therm. Fluid Sci. 2018, 97, 133–144. [Google Scholar] [CrossRef]
- Huang, R.; Wang, Y.; Du, T.; Luo, X.; Zhang, W.; Dai, Y. Mechanism analyses of the unsteady vortical cavitation behaviors for a waterjet pump in a non-uniform inflow. Ocean. Eng. 2021, 233, 108798. [Google Scholar] [CrossRef]
- Cheng, W.J.; Shao, C.L.; Zhou, J.F. Unsteady study of molten salt pump conveying mediums with different viscosities. Int. J. Heat Mass Transf. 2019, 137, 174–183. [Google Scholar] [CrossRef]
- Zhang, N.; Gao, B.; Ni, D.; Liu, X. Coherence analysis to detect unsteady rotating stall phenomenon based on pressure pulsation signals of a centrifugal pump. Mech. Syst. Signal Process. 2021, 148, 107161. [Google Scholar] [CrossRef]
- Zhang, N.; Liu, X.; Gao, B.; Wang, X.; Xia, B. Effects of modifying the blade trailing edge profile on unsteady pressure pulsations and flow structures in a centrifugal pump. Int. J. Heat Fluid Flow 2019, 75, 227–238. [Google Scholar] [CrossRef]
- Su, X.; Huang, S.; Zhang, X.; Yang, S. Numerical research on unsteady flow rate characteristics of pump as turbine. Renew. Energy 2016, 94, 488–495. [Google Scholar] [CrossRef]
- Zhang, N.; Liu, X.; Gao, B.; Xia, B. DDES analysis of the unsteady wake flow and its evolution of a centrifugal pump. Renew. Energy 2019, 141, 570–582. [Google Scholar] [CrossRef]
- Zhang, N.; Jiang, J.; Gao, B.; Liu, X. DDES analysis of unsteady flow evolution and pressure pulsation at off-design condition of a centrifugal pump. Renew. Energy 2020, 153, 193–204. [Google Scholar] [CrossRef]
- Zhang, N.; Jiang, J.; Gao, B.; Liu, X.; Ni, D. Numerical analysis of the vortical structure and its unsteady evolution of a centrifugal pump. Renew. Energy 2020, 155, 748–760. [Google Scholar] [CrossRef]


Disclaimer/Publisher’s Note: The statements, opinions and data contained in all publications are solely those of the individual author(s) and contributor(s) and not of MDPI and/or the editor(s). MDPI and/or the editor(s) disclaim responsibility for any injury to people or property resulting from any ideas, methods, instructions or products referred to in the content. |
© 2024 by the authors. Licensee MDPI, Basel, Switzerland. This article is an open access article distributed under the terms and conditions of the Creative Commons Attribution (CC BY) license (https://creativecommons.org/licenses/by/4.0/).