Abstract
The intensity change of Typhoon Songda (TY-0418) in the vicinity of the semi-enclosed Sea of Japan (SJ) was numerically investigated using 3D-WRF and UM-KMA models and GOES-IR satellite images on 4 to 8 September 2004. After the typhoon originated in the Western Pacific Ocean in August, it moved to the East China Sea. Following the north-eastward Kuroshio Warm Current, it developed with horizontal and vertical asymmetrical wind and moisture patterns until 5 September. On 7 September, closing to the Kyushu Island, it was divided into three wind fields near the surface due to the increased friction from the surrounding lands and shallower sea depth close to the land, but it still maintained its circular shape over 1 km in height. As it passed by the Korea Strait and entered the SJ, it became a smaller, deformed typhoon due to the SJ’s surrounding mountains, located between the East Korea and Tsushima Warm Currents inside the SJ. Its center matched a high equivalent potential temperature area, releasing significant latent heat through the condensation of water particles over warm currents. The latent heat converted to kinetic energy could be supplied into the typhoon circulation, causing its development. Moist flux and streamline at 1.5 km in height clearly showed the moisture transportation via the mutual interaction of the cyclonic circulation of the typhoon and the anti-cyclonic circulation of the North Pacific High Pressure from the typhoon’s tail toward both the center of the SJ and the Russian Sakhalin Island in the north of Japan, directly causing large clouds in its right quadrant. Simultaneously, the central pressure decrease with time could converge both transported moist air by the typhoon itself and water particles evaporated from the sea, causing them to rise and resulting in the formation of large clouds and the rapid development of the typhoon circulation. The strong downslope winds from the surrounding mountains of the SJ to its center also produced a cyclonic vortex due to the Coriolis force to the right, enhancing the typhoon’s circulation.
1. Introduction
In summer, typhoons, otherwise known as tropical cyclones or hurricanes, can be responsible for severe impacts including loss of life, economic hardship, destruction of dwellings, coastal erosion, inundation by floods, strong winds, and storm surges [1,2]. The classification of these systems varies across national institutions. The classification by the Hong Kong Observatory (HKO) [3] consists of six categories, comprising super typhoons, severe typhoons, typhoons, severe tropical storms, tropical storms, and tropical depression in terms of maximum sustained wind speeds averaged over 10 min near the center of the system, as suggested by the World Meteorological Organization (WMO) [4]. The Korean Meteorological Administration (KMA) [5] simplified the classifications into four groups consisting of typhoons, severe tropical storms, tropical storms, and tropical depression, which use different surface atmospheric pressure and wind speed thresholds near the center of the system.
Monaldo et al. [6], Cione and Uhlhorn [7], and Knauss [8] explained that surface divergence of sea surface water due to cyclonic surface winds in a hurricane results in upwelling of bottom colder water to the surface. Gilbes et al. [9] and Babin et al. [10] showed that hurricane-induced phytoplankton blooms were supplied by nutrient-laden waters upwelling colder bottom waters toward the sea surface. Willoughby et al. [11] presented a hurricane structure and evolution simulated by an axisymmetric, non-hydrostatic numerical weather prediction model. They explained that the spiral band structure in Hurricane Gert in 1981 was produced by convergence and divergence on the east and west sides of the eye wall by the movement of the environmental flow through the vortex core at the lower levels.
Using observational data, Marks et al. [12] analyzed an asymmetric wind pattern at several vertical levels for Hurricane Norbert, and similarly, Franklin et al. [13] analyzed these patterns for Hurricane Gloria. Including the research by Bender [14], their results indicated that the relative environmental flow in the direction of the storm motion was most important in Hurricane Norbert, while the cross-track component dominated in Hurricane Gloria as the hurricane moved northwest. Elsner [15] and Jian and Wu [16] explained that when a tropical cyclone approaches complex terrain during its landfall period, a more complicated asymmetric wind structure causes the deflection of the typhoon track. Choi and Lee [17] described the outbreak of cold sea surface temperatures near Cheju Island in response to strong cyclonic winds and a positive geopotential tendency at sea level following the track of a typhoon center based on the weather research and forecasting model simulation.
Shen et al. [18] simulated the prediction of Tropical Cyclone Nargis using a global mesoscale model. Xu at el. [19] investigated the impact of Tropical Storm Bopha on the intensity change of Super Typhoon Saomai in the 2006 typhoon season. They demonstrated that the existence of Typhoon Bopha and its increasing intensity would weaken Typhoon Saomai at its intensifying stage in 2006, while intensifying Saomai at its weakening stage was explained by the Fujiwhara effect [20]. Choi and Choi [21] numerically simulated the multiple interactions of not only three typhoons but also a mid-latitude cloud band-associated trough in the Northwest Pacific, showing their intensification and decay.
Yamasaki [22] examined the development of weak vortices and tropical cyclones by varying the ice microphysics in numerical experiments, and Bu et al. [23] showed the influences of boundary layer mixing and cloud-radiative forcing. Recently, significantly improved spaceborne microwave sensors can penetrate clouds and provide detailed microphysical information regarding clouds and precipitation, greatly improving the detection capability of fine cloud and rain structure inside tropical cyclones. Therefore, Wu et al. [24] explained that the ice water content might be an important indicator for the estimation of rapid intesification of tropical cyclones and the spatial structure of cloud and rain particles. Another paper by Wu et al. [25] described in detail the interaction of cloud dynamics and microphysics during the rapid intensification of Super-Typhoon Namadol (2022) based on multi-satellite observations. Su et al. [26] and Tapiador et al. [27] applied satellite observations, microwave data, and neural network techniques for predicting the rapid intensification of tropical cyclones.
Bruneau et al. [28] explained the impact of ocean mesoscale temperature anomalies on tropical cyclone size and AMS [29]. Tamamadin, et al. [30] showed that the area of high equivalent potential temperature containing significant moisture corresponds to the typhoon area. This is because latent heat released from the cloud cluster through the condensation process via cooling moisture can be converted into significant kinetic energy to be supplied into the typhoon system, resulting in typhoon intensification.
When most typhoons landfall and pass by the Korean Peninsula or Japan Island and moved into the SJ, their circular structures are quickly destroyed and deformed into a low pressure due to not only the increased friction by surrounding lands and the shallower sea depth close to the land, but also because there is an insufficient supply of moisture over the land for maintaining its structure [5,21]. The development and decay of typhoons are affected by many kinds of driving mechanisms based on micro-, meso-, and synoptic scales, which are directly and indirectly associated with each other. Namely, it is not appropriate to say which of them is the most important. However, our research focused on the intensification of a smaller reformed typhoon in the SJ that has not been previously explained its meso- and synoptic-scale horizontal and vertical structures dynamically and thermodynamically in detail.
Thus, the intensity change of Typhoon Songda was investigated using numerical simulations using both the WRF-3.6.1 model and UM-KMA model and evaluating wind velocity, relative humidity, moist flux, streamline, atmospheric pressure tendency, equivalent potential temperature, and sea surface temperature during the passage of Songda from 5–8 September 2004. The typhoon track and its horizontal and vertical structures were also analyzed using Geostationary Operational Environmental Satellite (GOES)-Infrared cloud images with no index that could be only obtained at that time (2004), differently from high-resolution images supplied by the Korean COMS satellite launched in recent and surface weather charts supplied by the KMA. We compared these images with the numerical simulation results of horizontal and vertical moist (relative humidity), wind and equivalent potential temperature distribution, and so on.
2. Study Area
Figure 1a,b show the Northwest Pacific Ocean, including the South China Sea, the East China Sea, the Yellow Sea, and the semi-enclosed Sea of Japan, as well as topographical features surrounding the Korean peninsula, Russia, China, and Japan. More than 10 typhoons originated in the Western Tropical Pacific Ocean near Guam Island and passed through these areas from early summer (June) until late fall (November) 2004 in Figure 1c. They made landfalls on the Chinese coast or penetrated the Korean peninsula or Japanese islands, resulting in huge economic losses from flooding and destructive winds.
The sea depth from Okinawa Islands close to the East China Sea and South Sea of Korea is much shallower than 200 m, different from the approximately 2000 m depth in the West Pacific Ocean. Figure 1d shows the ocean currents that flow along the coasts around the Korean Peninsula, China, and Japan, such as the Yellow Sea Warm Current, the East Korea Warm Current, the North Korea Cold Current, the Liman Cold Current, the Tsushima Warm Current, the Tsugaru Warm Current, the Soya Warm Current, etc. All typhoons traveling to Northeast Asia develop or decay partially under the influence of the ocean currents mentioned above.
The track of Typhoon Songda (TY 0418) formed in the Western Pacific Ocean is shown in Figure 1c from 27 August to 10 September 2004. Figure 1d displays the ocean currents flowing around the Korean peninsula, such as the Yellow Sea Warm Current, the East Korea Warm Current, the North Korea Cold Current, the Liman Cold Current, the Tsushima Warm Current, the Tsugaru Warm Current, and the Soya Warm Current, respectively.
Typhoon Songda passed by the East China Sea and the korea Strait and moved into the Sj, where both the East Korea Warm Current (EK) and the Tsushima Warm Current (TS) originated from the Kuroshio Current pass by the Korea Strait, consisting of a shallow depth of about 100 m, to the deepest depth of the SJ, extending down to about 3800 m. The SJ covers a three times larger area than the Yellow Sea, with a maximum depth of 74 m and a mean depth of about 40 m. It is enclosed by the mountains of Korea (west), Hokkaido, and Honshu islands of Japan (east) and Russia (north).
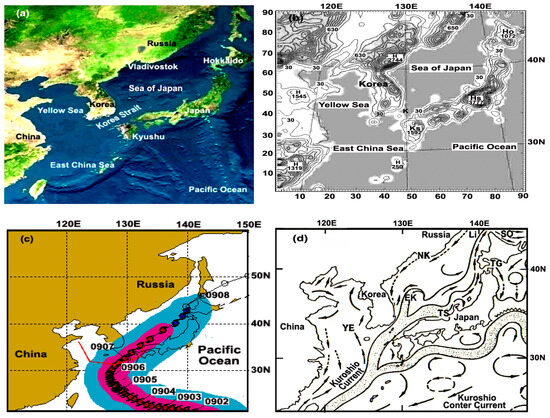
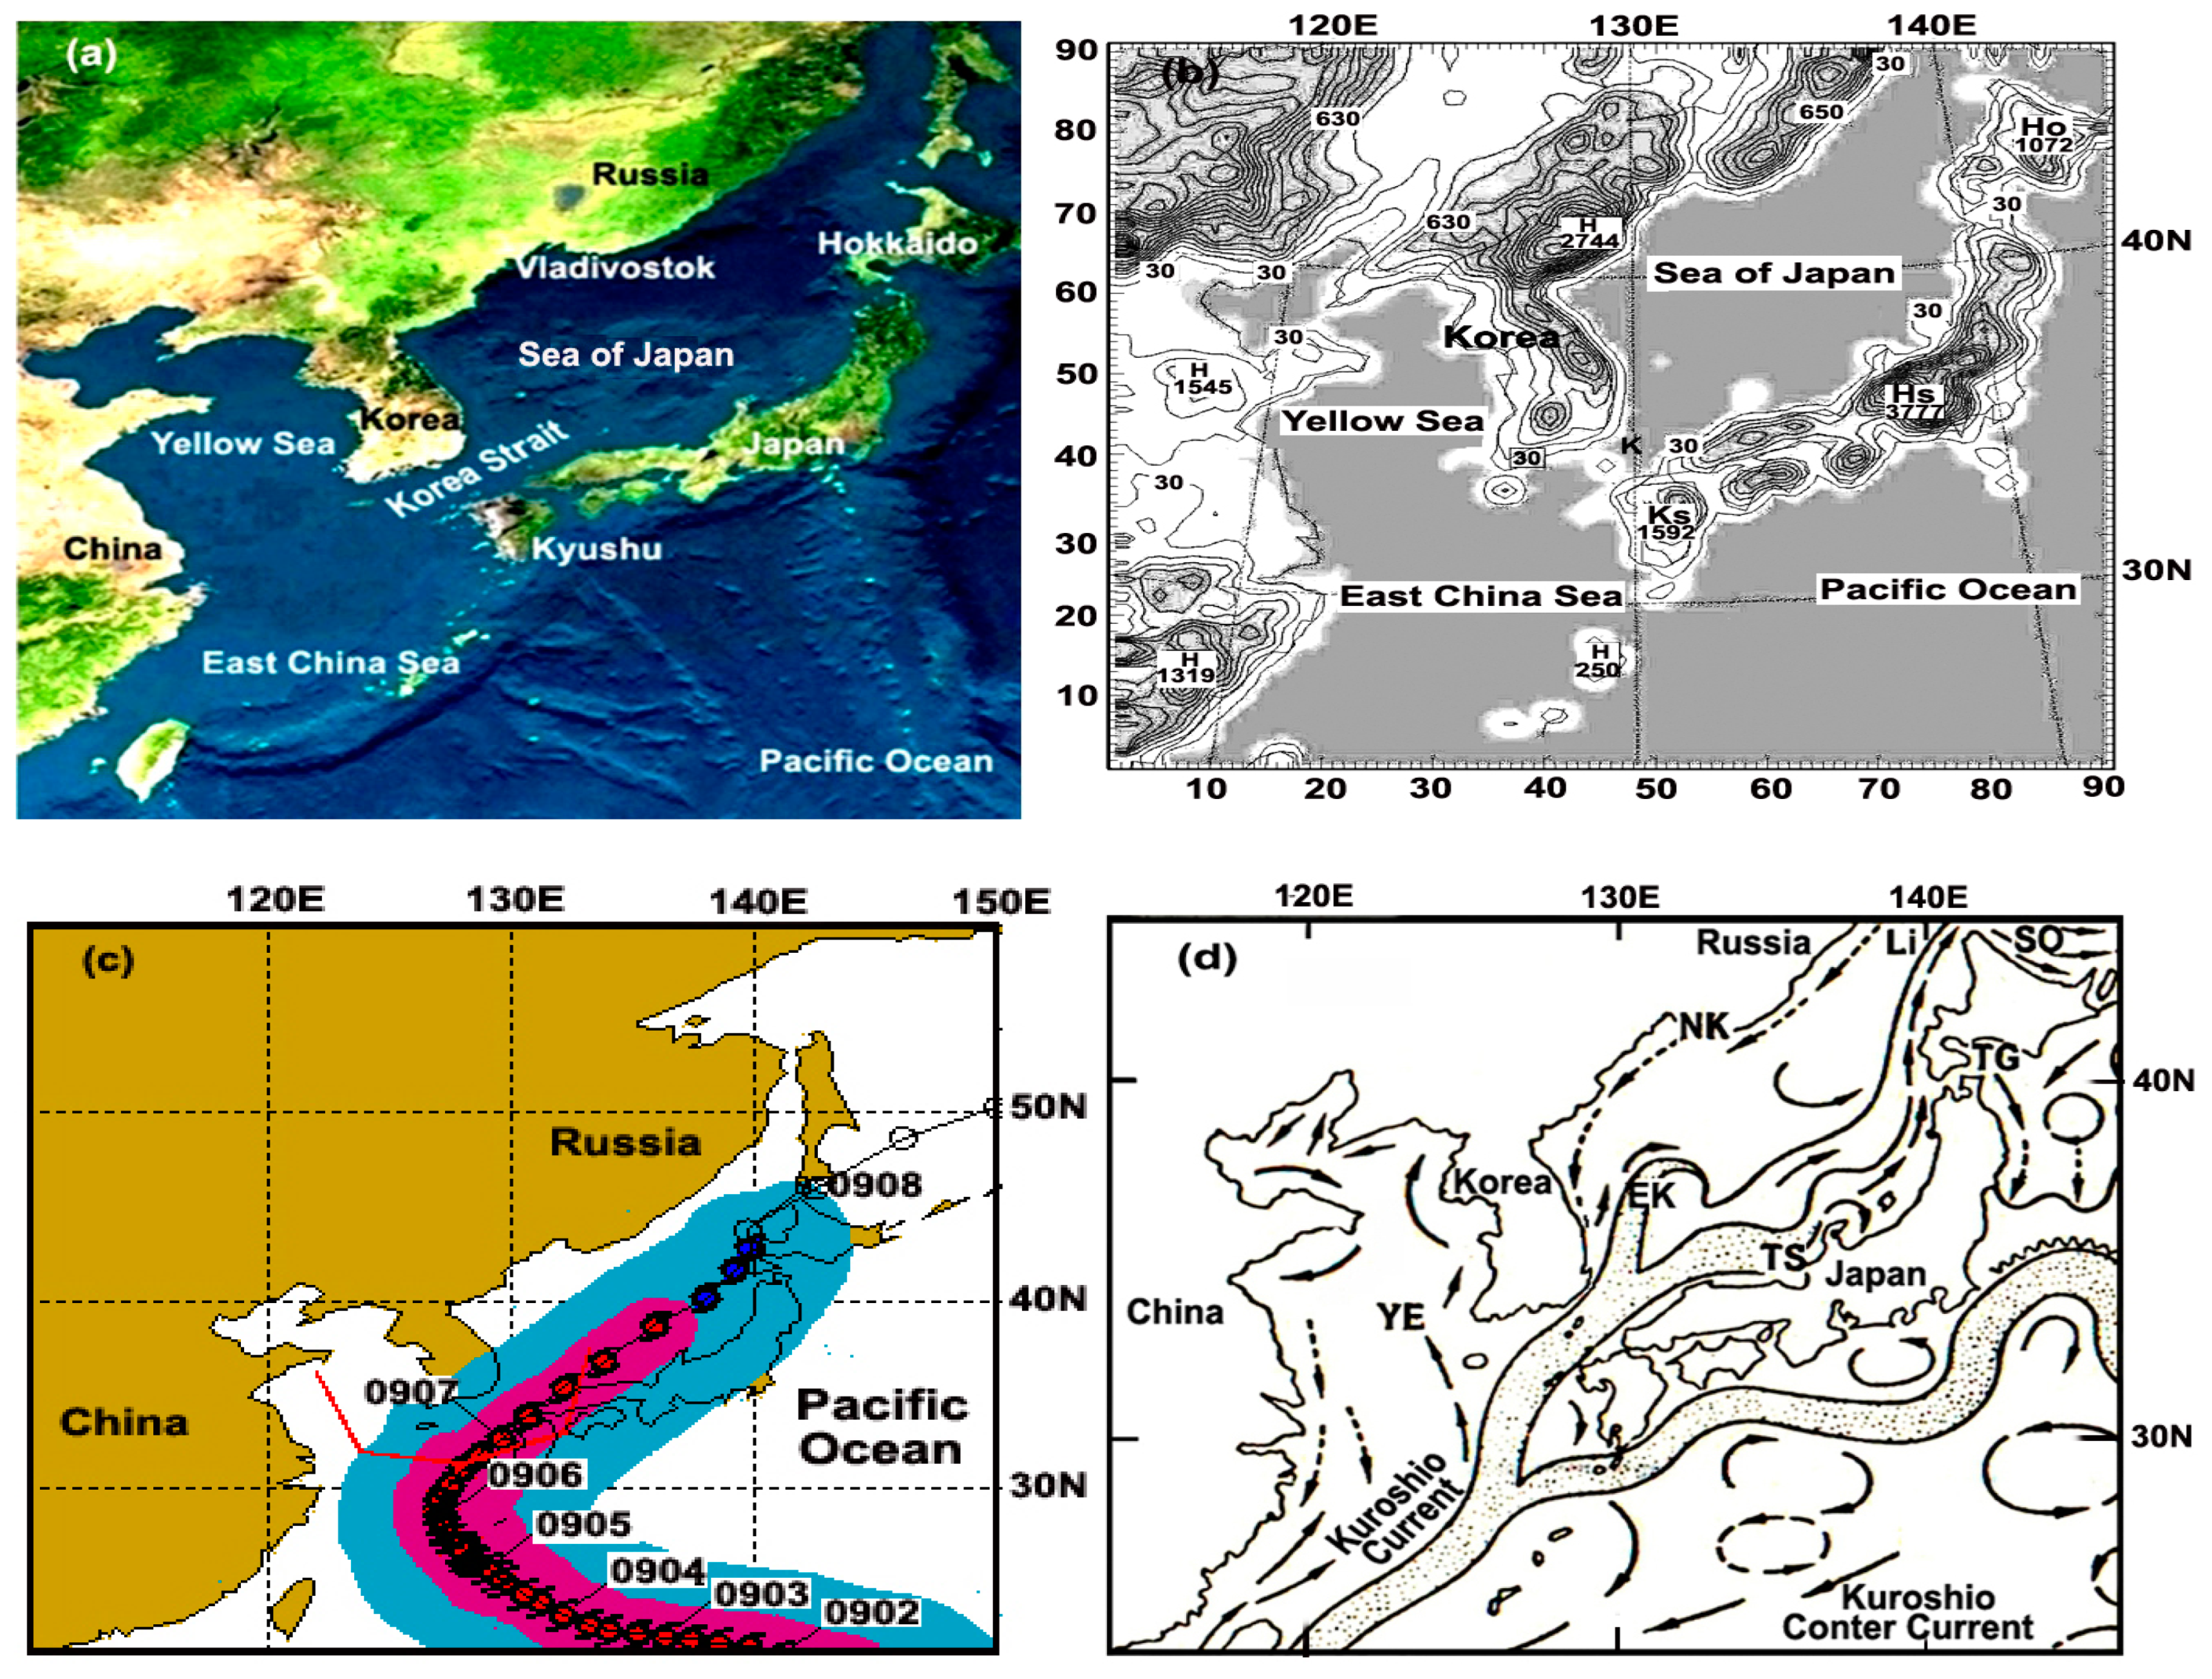
Figure 1.
(a) Map of Northeast Asia with seas and ocean, (b) topography surrounding the Korean peninsula, China, and Japan, (c) track of TY Songda from 2 to 9 September, and (d) ocean currents surrounding Korea (modified from Lee [31]). In (b), Ho, Hs, and Ks denote Hokkaido, Honshu, and Kyushu Islands, and in (d), YE, EK, NK, Li, TS, TG, and SO denote the Yellow Sea Warm Current, the East Korea Warm Current, the North Korea Cold Current, the Liman Cold Current, the Tsushima Warm Current, the Tsugaru Warm Current, and the Soya Warm Current.
3. Numerical Method and Input Data
The three-dimensional Weather Research and Forecasting (WRF)-Version 3.6.1 model released on 18 September 2014 [32] was adapted for the numerical simulation of wind speed and direction, precipitation, atmospheric pressure tendency, potential temperature, potential vorticity, etc., in Northeast Asia. In the numerical simulation, one-way triple nesting from a coarse-mesh domain to a fine-mesh domain was performed using a horizontal grid spacing of 27 km, covering a 91 × 91 grid square in the first coarse mesh domain. The second (third) domain consists of a 9 km (3 km) horizontal grid interval of the same number grid as the first domain.
As meteorological input data to the model, NCEP/NCAR reanalysis–final analyses (FNL) 1.00 × 1.00 resolution data were used by interpolating and extrapolating the data at each grid point onto the first model domain with vertical interpolation between the surface and the upper boundary level of 100 hPa onto 36 levels, being more closely stacked in the lower levels of the atmosphere [33]. The meteorological elements evaluated in the first model domain were set up at each grid point of the second domain, and these values were calculated again with a 30-second topography resolution for each grid point.
In the model, the WSM 6 scheme was used for heat and moisture budgets and microphysical processes in the atmospheric boundary layer, and the YSU PBL scheme was adopted for the planetary boundary layer. The Kain–Fritsch scheme (new Eta) was adopted for cumulus parameterization, and the fifth thermal diffusion model was employed for land surfaces. The RRTM long-wave radiation scheme and Dudhia short-wave radiation schemes were used [21]. However, all the figures created using the model in this study were shown in the first domain.
Another model, the British Unified Model (UM) [34] adopted and modified by the Korean Meteorological Administration, is called the UM-KMA model (weather forecasting model used by KMA at present), which consists of a software suite written in Fortran-90. It uses initial input data provided by observations from satellites, ground-based weather stations, marine buoys, data from radar, radiosonde weather balloons, wind profilers, commercial aircrafts, and a background meteorological field derived from preceding model runs. The UM-KMA model uses nesting techniques for horizontal grid domains of 1.5km and 4 km for representing areas such as the size of a city, 12 km for regional-scale domains, and 40 km for global-scale domains.
The streamline analyses, moisture flux fields, and equivalent potential temperature distribution at a 1.5 km height were evaluated to investigate how a typhoon can be intensified through moisture and momentum transfer into its system through complex interactions between moisture, wind, and temperature fields, as well as where the typhoon center exists.
4. Results
4.1. Wind Field before the Surface Split of TY-Songda
The Joint Typhoon Warning Center, USA (JTWC) reported a new area of convection at 11:00 UTC (20:00 LST = UTC + 09:00 LST (Korean Local Standard Time)), on 26 August 2004. It continued to develop at 210 nautical miles northeast of Kwajalein and was first warned as a tropical depression 22 W at 12:00 UTC, 27 August, with its center at 270 nautical miles east of Eniwetak Atoll in the Pacific Ocean (Figure 1c). This depression was re-assigned the name of Songda as a tropical storm with a maximum surface wind speed of 35 kts (~18.5 m/s) at 00:00 UTC, 28 August.
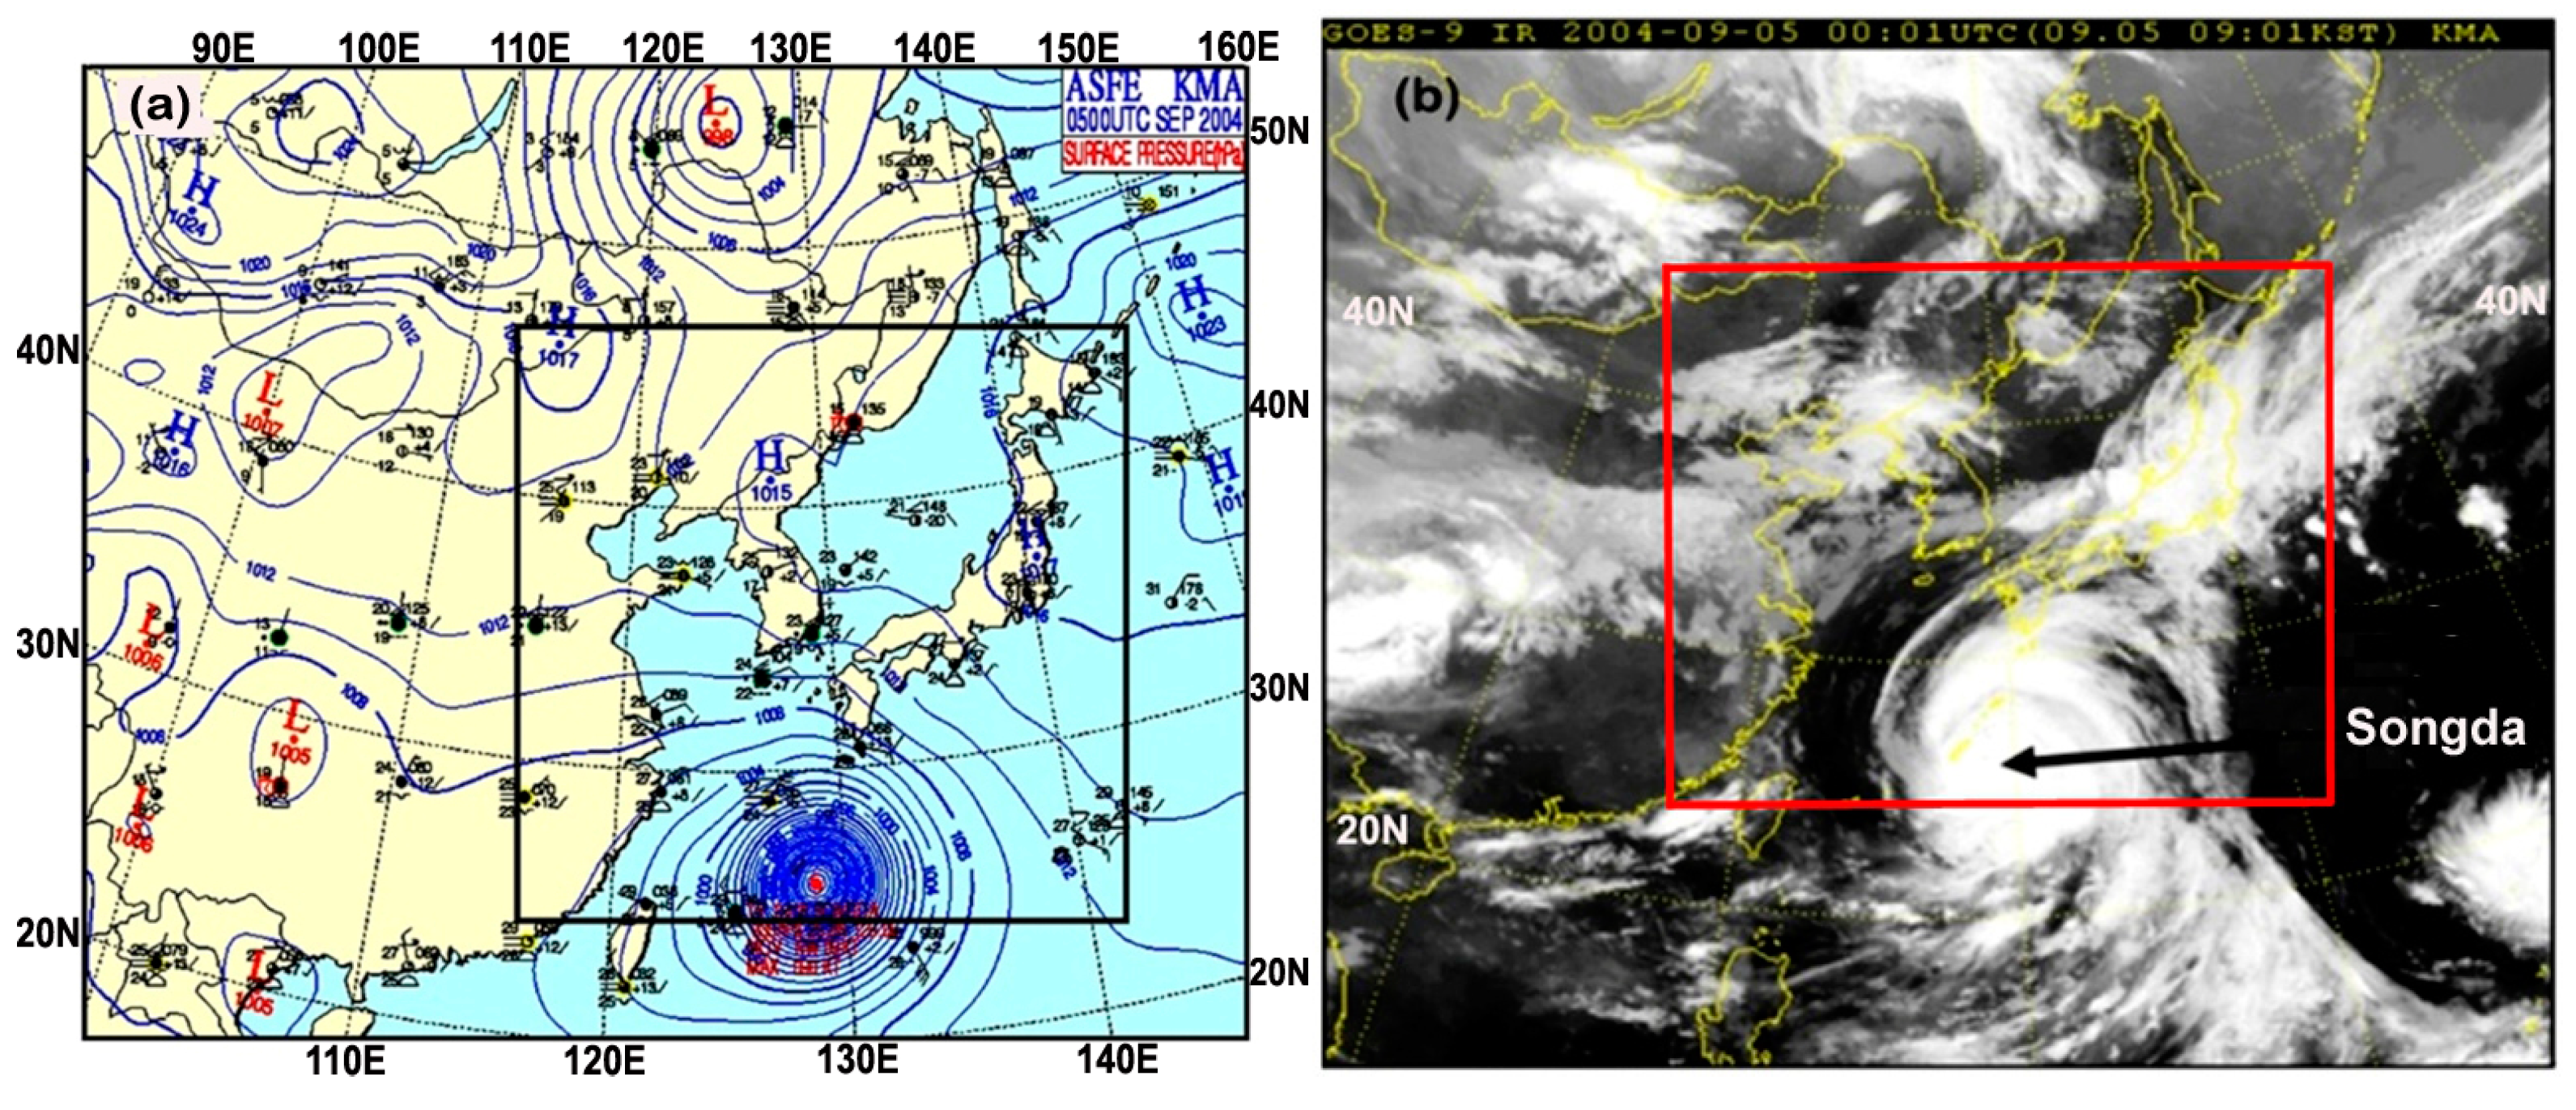
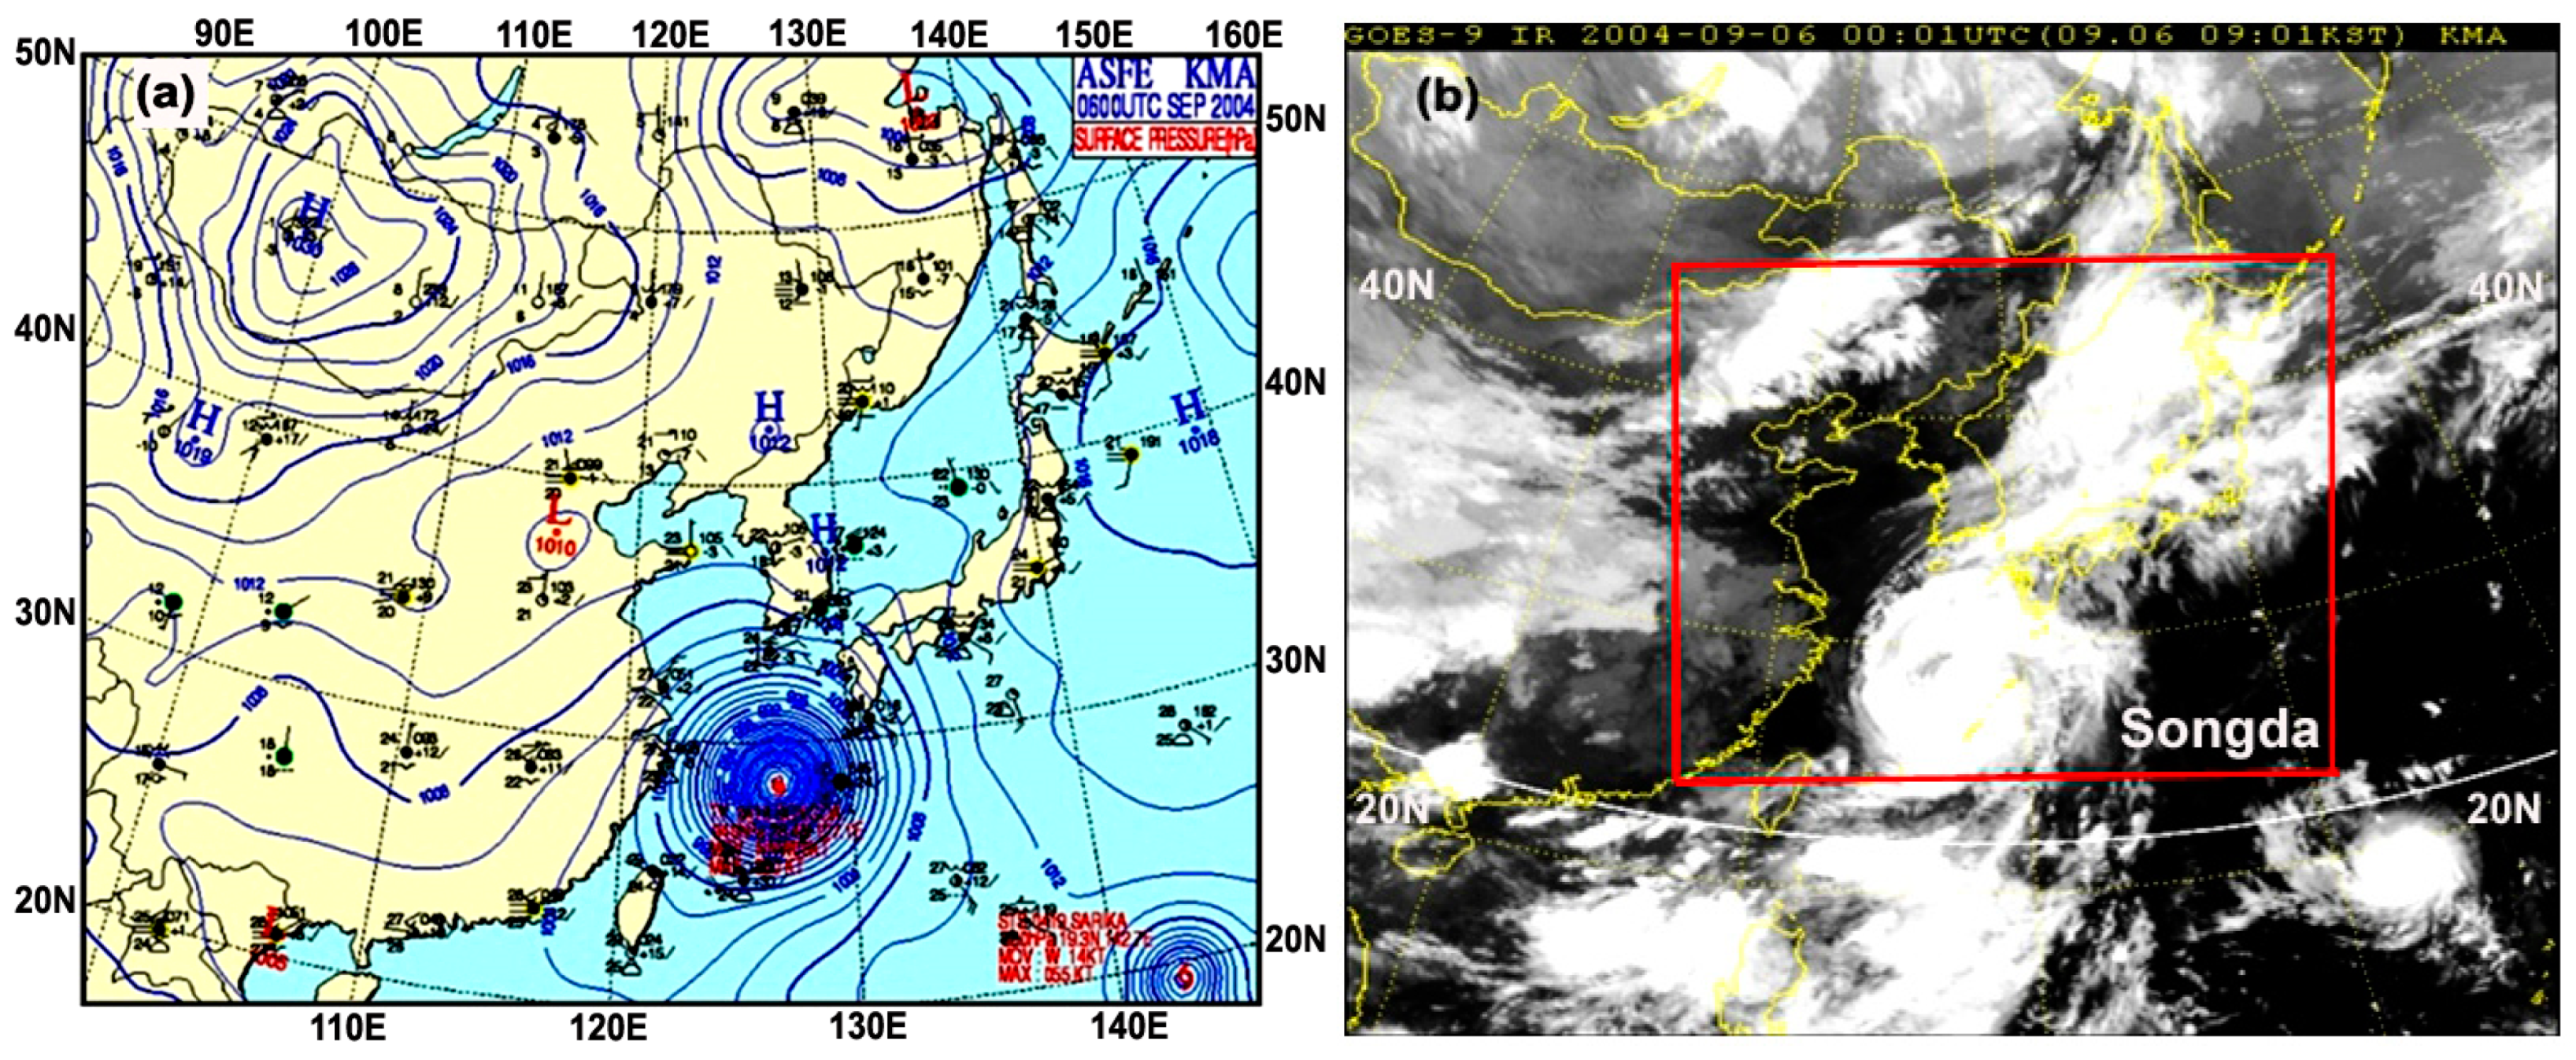
When it was located about 17 nautical miles north–northeast of Agrihan Island in the Northern Mariana Islands at 18:00 UTC, it became a typhoon, with a maximum wind speed of 95 kts (~47.5 m/s). After Typhoon Songda formed in the Western Pacific Ocean with a central pressure of 950 hPa and maximum surface wind speed of 40 m/s (10 min average), it maintained its track toward the northwest until 00:00 UTC (09:00 LST) on 5 September, and the typhoon reached the East China Sea at 09:00 LST on 5 September, as shown in the surface weather map including a square covering the WRF course-mesh model domain and GOES-9-IR satellite images in Figure 2a,b.
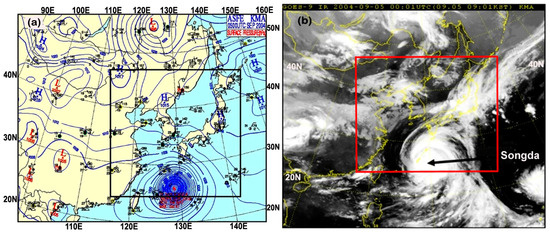
Figure 2.
(a) Surface weather map (hPa) supplied by the Korean Meteorological Administration (KMA) including a square area covered by the WRF course-mesh model domain at 09:00 LST, 5 September. (b) GOES-9 IR satellite image supplied by KMA at 09:01 LST, 2004.
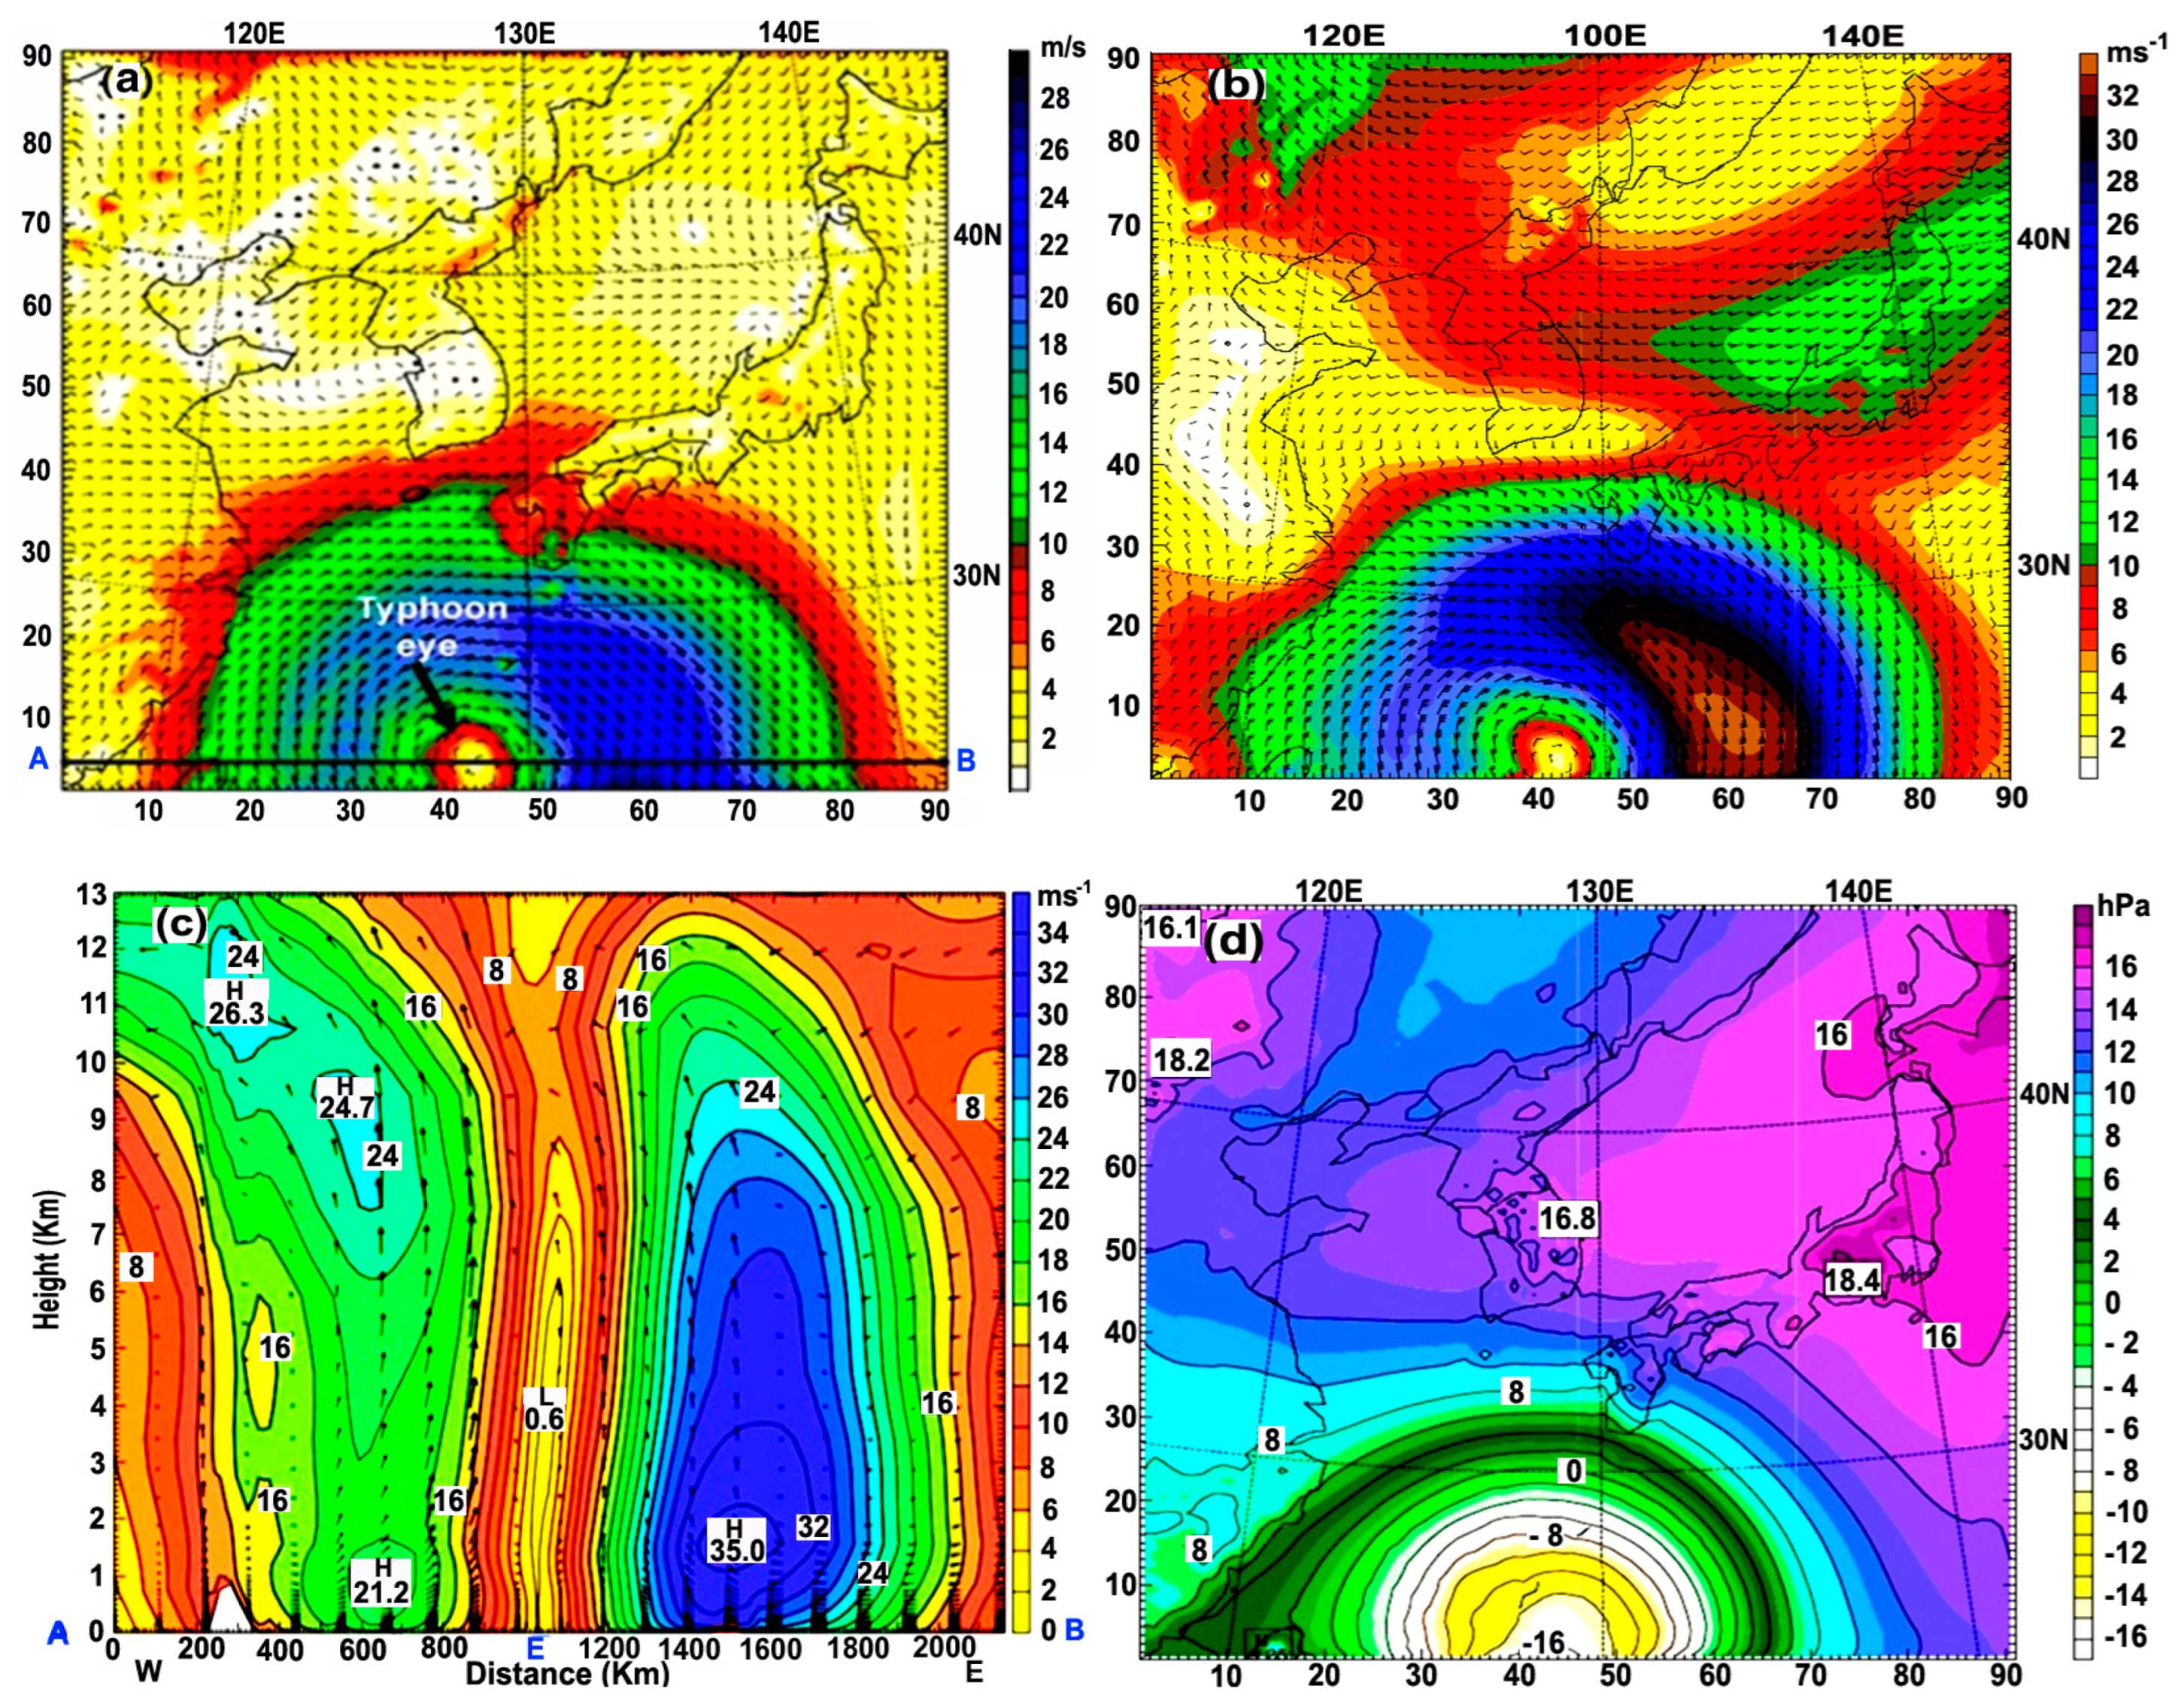
As shown in Figure 3, with the horizontal and vertical structure of the typhoon, the typhoon became weak due to not only the geographical friction of surrounding lands (China; west), Korean peninsula (north), and Kyushu Island (Japan; east)) but also the increase in shallower bottom friction created by its moving over a 200 m shallower sea on its left compared to a depth of about 1000 m on its right. Thus, the mutual interaction among the reduction of surface wind speeds in the left quadrant of the typhoon center due to the shallower bottom friction, the surface friction of surrounding lands, and the northward moving speed of a typhoon can cause an asymmetry, with weaker winds in the left than the right of the typhoon center, horizontally and vertically (Figure 3a–c). The typhoon eye, a small yellow circle with a 150 km diameter, has very weak wind or is calm (x = 43, y = 3).

Figure 3.
(a) Surface wind (m/s) at 10 m height at 09:00 LST, 5 September; (b) 3 km height; (c) vertical profile of horizontal winds (m/s) on a line A–B (typhoon eye; E) of Figure 3a; (d) surface atmospheric pressure tendency (−16h Pa/day) causing typhoon development. As it approaches the lands, there are horizontal and vertical asymmetries of stronger winds to its right and increased sea bottom friction in the East China Sea as well as surface friction from surrounding lands.
In Figure 3d, at 09:00 LST on 5 September, a negative rate of atmospheric pressure change with time (∂p/∂t) of −16 hPa/day for 12 h at the typhoon center reflected the deepening (falling) atmospheric pressure, strengthening the typhoon’s cyclonic wind. Hesselberg [35], Brunt and Douglas [36], Haurwitz [37], Gill [38], Choi [39], and AMS [40] defined the contours of atmospheric pressure change in a horizontal distance with time (atmospheric pressure tendency) as isallobars. The effects of friction on the ground and turbulence produce a flow of air across the isallobars toward falling pressure, proportional to the isallobaric gradient, resulting in the convergence of airflow and resultantly the uprising of air, causing the formation of clouds and severe weather.
Haurwitz [37] and AMS [40] showed mathematically that the isallobaric wind Vis is defined in terms of the vertical unit vector (k), the Coriolis parameter (f), the local accelerations of geostrophic wind (), the specific volume (α), and the horizontal spatial variation (; + ) of atmospheric pressure tendency (). The resulting surface wind is made up of geostrophic winds blowing parallel to the isobars, with an added component directed into the isallobaric low. Consequently, if the absolute value of negative atmospheric pressure tendency increases (|∂p/∂t|; |−16 hPa/day|), the isallobaric wind increases, causing the convergence of airflow to rise up and the rapid development of the typhoon circulation.
TY Songda was on a northerly track by 09:00 LST, 6 September in Figure 4a,b. At this time, the edge of the typhoon became torn by surrounding land masses like China, Korea, and Japan, and its circulation was prohibited owing to both the greater frictions of the adjacent lands in Eastern China, Southern Korea, and Southwestern Japan and the shallower sea depths of the East China Sea to the left of its eye in Figure 5a.
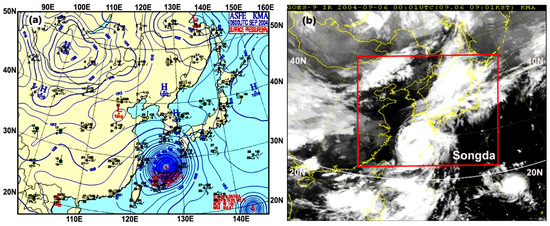
Figure 4.
(a) Surface weather chart (hPa) at 09:00LST, 6 September, 2004; (b) GOES-9 IR satellite image before TY-Songda reached the Korea Strait and the west of Kyushu Island.
This kind of geographical and topographical feature causes the horizontal wind pattern to be asymmetric, and a vertical cross-section of the horizontal wind on a straight cutting line (A-typhoon eye-B) in Figure 5a,b shows that the horizontal wind is asymmetric (E; an ellipse of about 200 km in the x-axis and 300 km in the y-axis). This corresponds to the vertical asymmetry of the horizontal winds of 20 m/s (21 m/s) near the surface in the left of the typhoon eye compared to 26 m/s (37.2 m/s) at a 1.5 km height in its right. This asymmetry is attributed to a weakening of the surface winds from the increased friction created by both the surrounding lands and the shallower sea depth closer to the land.
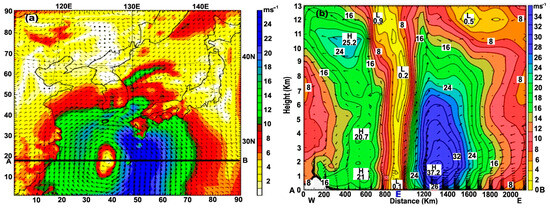
Figure 5.
(a) Surface wind (m/s) at 10 m height; (b) vertical profile of the horizontal wind (m/s) along the line A–B (across the typhoon eye; E) in (a) based on WRF model simulation at 09:00 LST, 6 September 2004, showing the asymmetrical deformation of the typhoon circulation.
Figure 5.
(a) Surface wind (m/s) at 10 m height; (b) vertical profile of the horizontal wind (m/s) along the line A–B (across the typhoon eye; E) in (a) based on WRF model simulation at 09:00 LST, 6 September 2004, showing the asymmetrical deformation of the typhoon circulation.

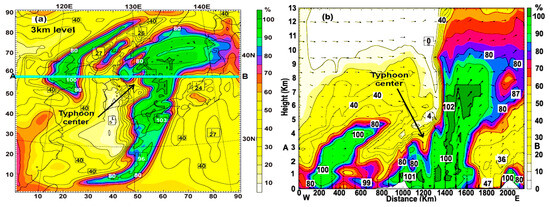
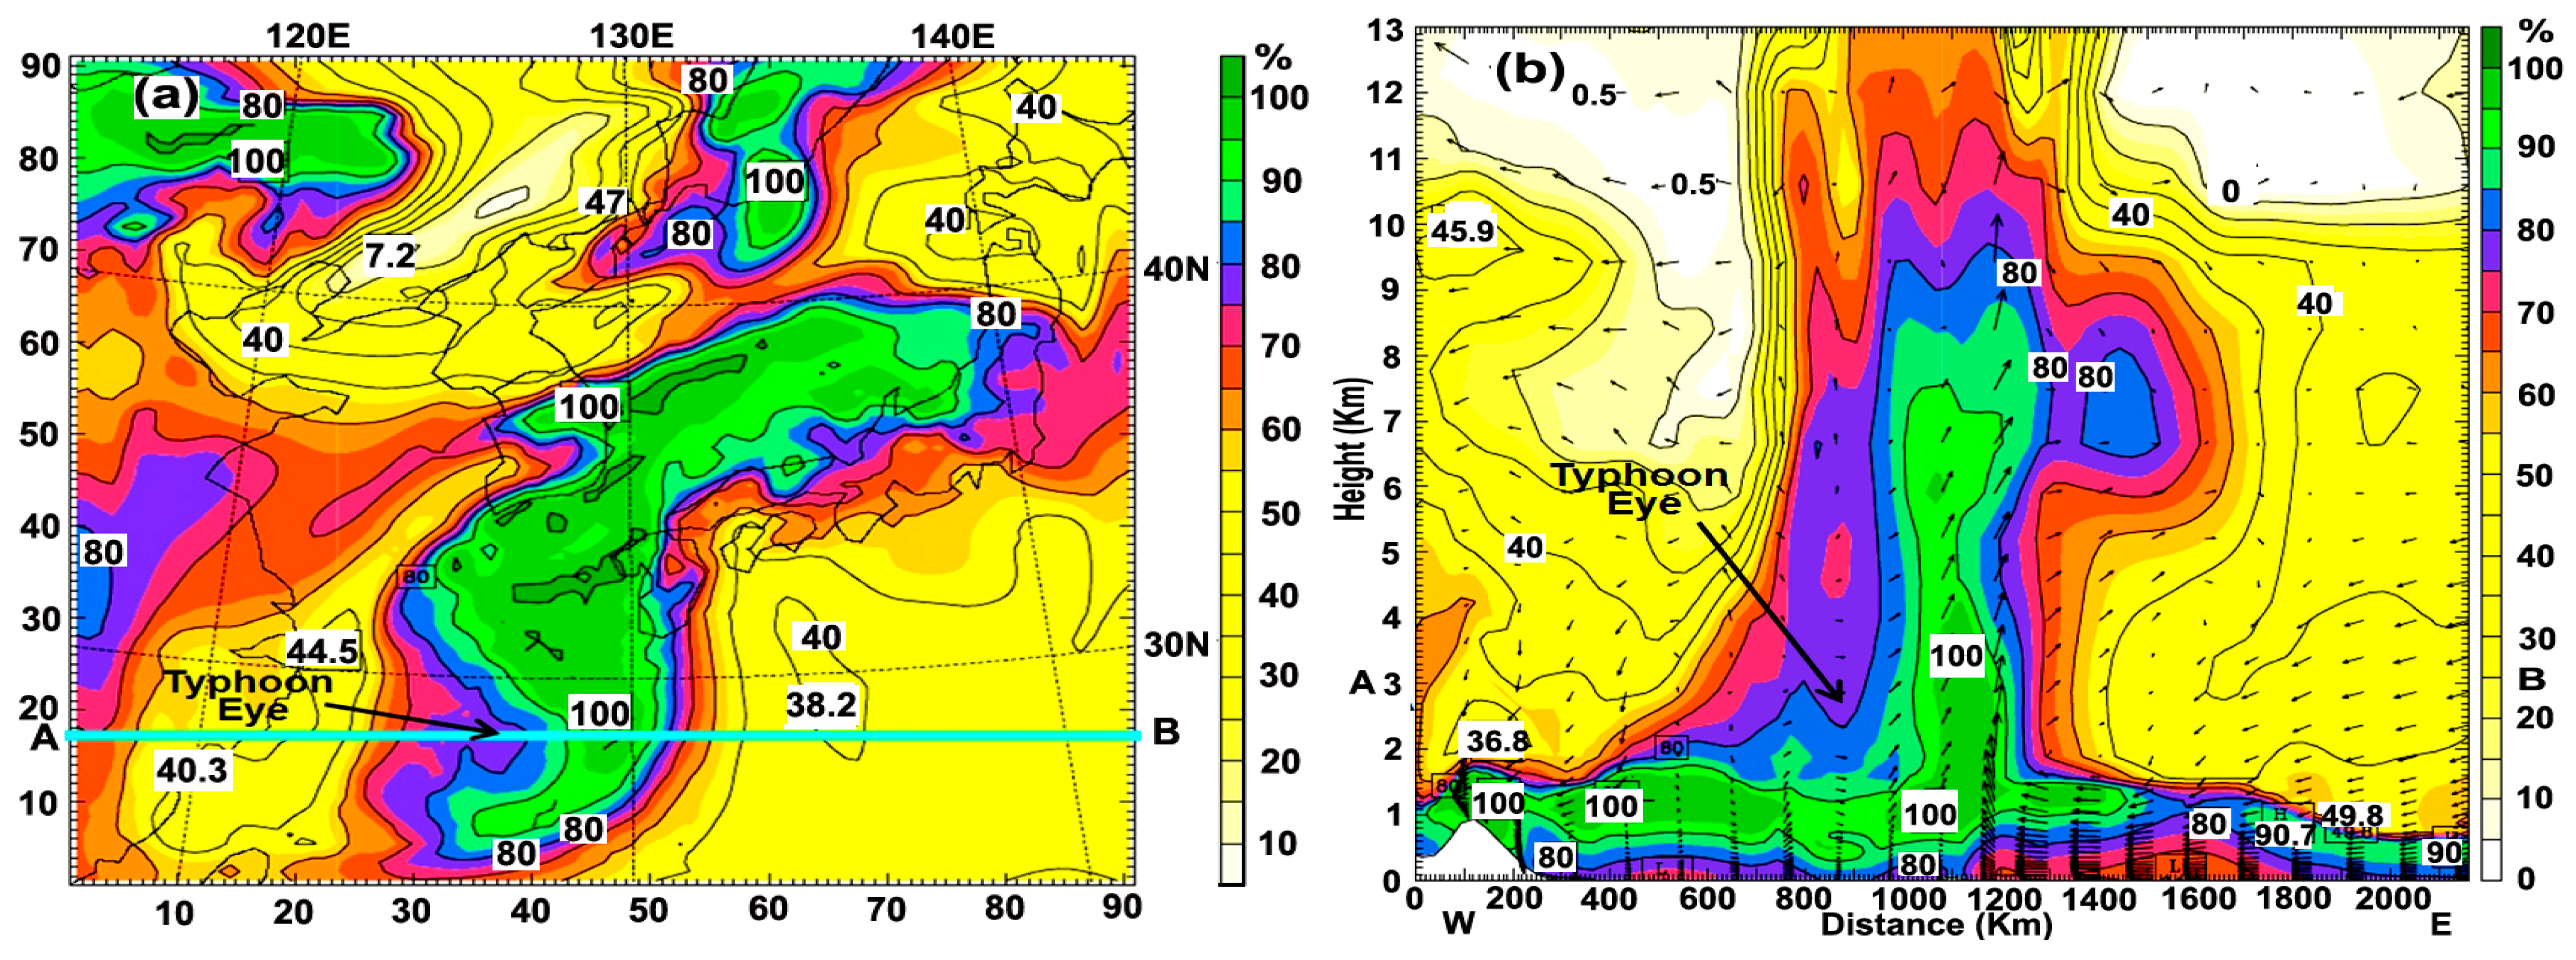
In Figure 6a,b, the majority of moist fluxes over 80% relative humidity took place at levels of 900~850 hPa (about 1~1.5 km height) in the right quadrant of the typhoon eye, from its tail in the East China Sea toward Honshu Island, Japan under the influence of strong southerly wind in Figure 5a,b. This kind of moist transport is clearly seen in the figure of relative humidity at a 3 km height in Figure 6a, and the vertical transport of moisture over 80% relative humidity extended from the sea surface (about 100 m) to a 9.5 km height in the right side of the typhoon eye in Figure 6b, in contrast to the vertical limitation of moisture to a 2 km height in its left side, showing an asymmetric distribution of the cloud.
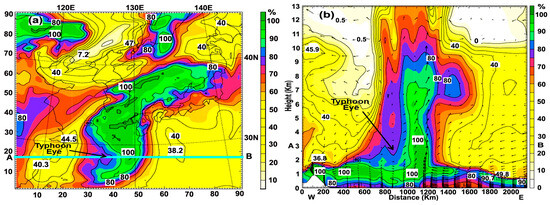
Figure 6.
(a) Relative humidity (%) with wind speed (m/s) at 3 km height; (b) relative humidity (%) with wind (m/s) from 0 m to 13 km height along a line A–B in (a); refer to Figure 5b.
In the area containing significant moisture with a large cloud cluster in the vicinity of the typhoon center, it is easily expected that more latent heat released from the cloud cluster forming by cooling the moisture can be converted into more kinetic energy to be supplied into the typhoon system, resulting in the production of stronger winds in the right quadrant of the typhoon circulation, horizontally and vertically. Thus, the transport of momentum (wind) and moisture (relative humidity) in the right-hand side of the typhoon center can drive stronger cyclonic circulation of the typhoon in its right, intensifying TY Songda.
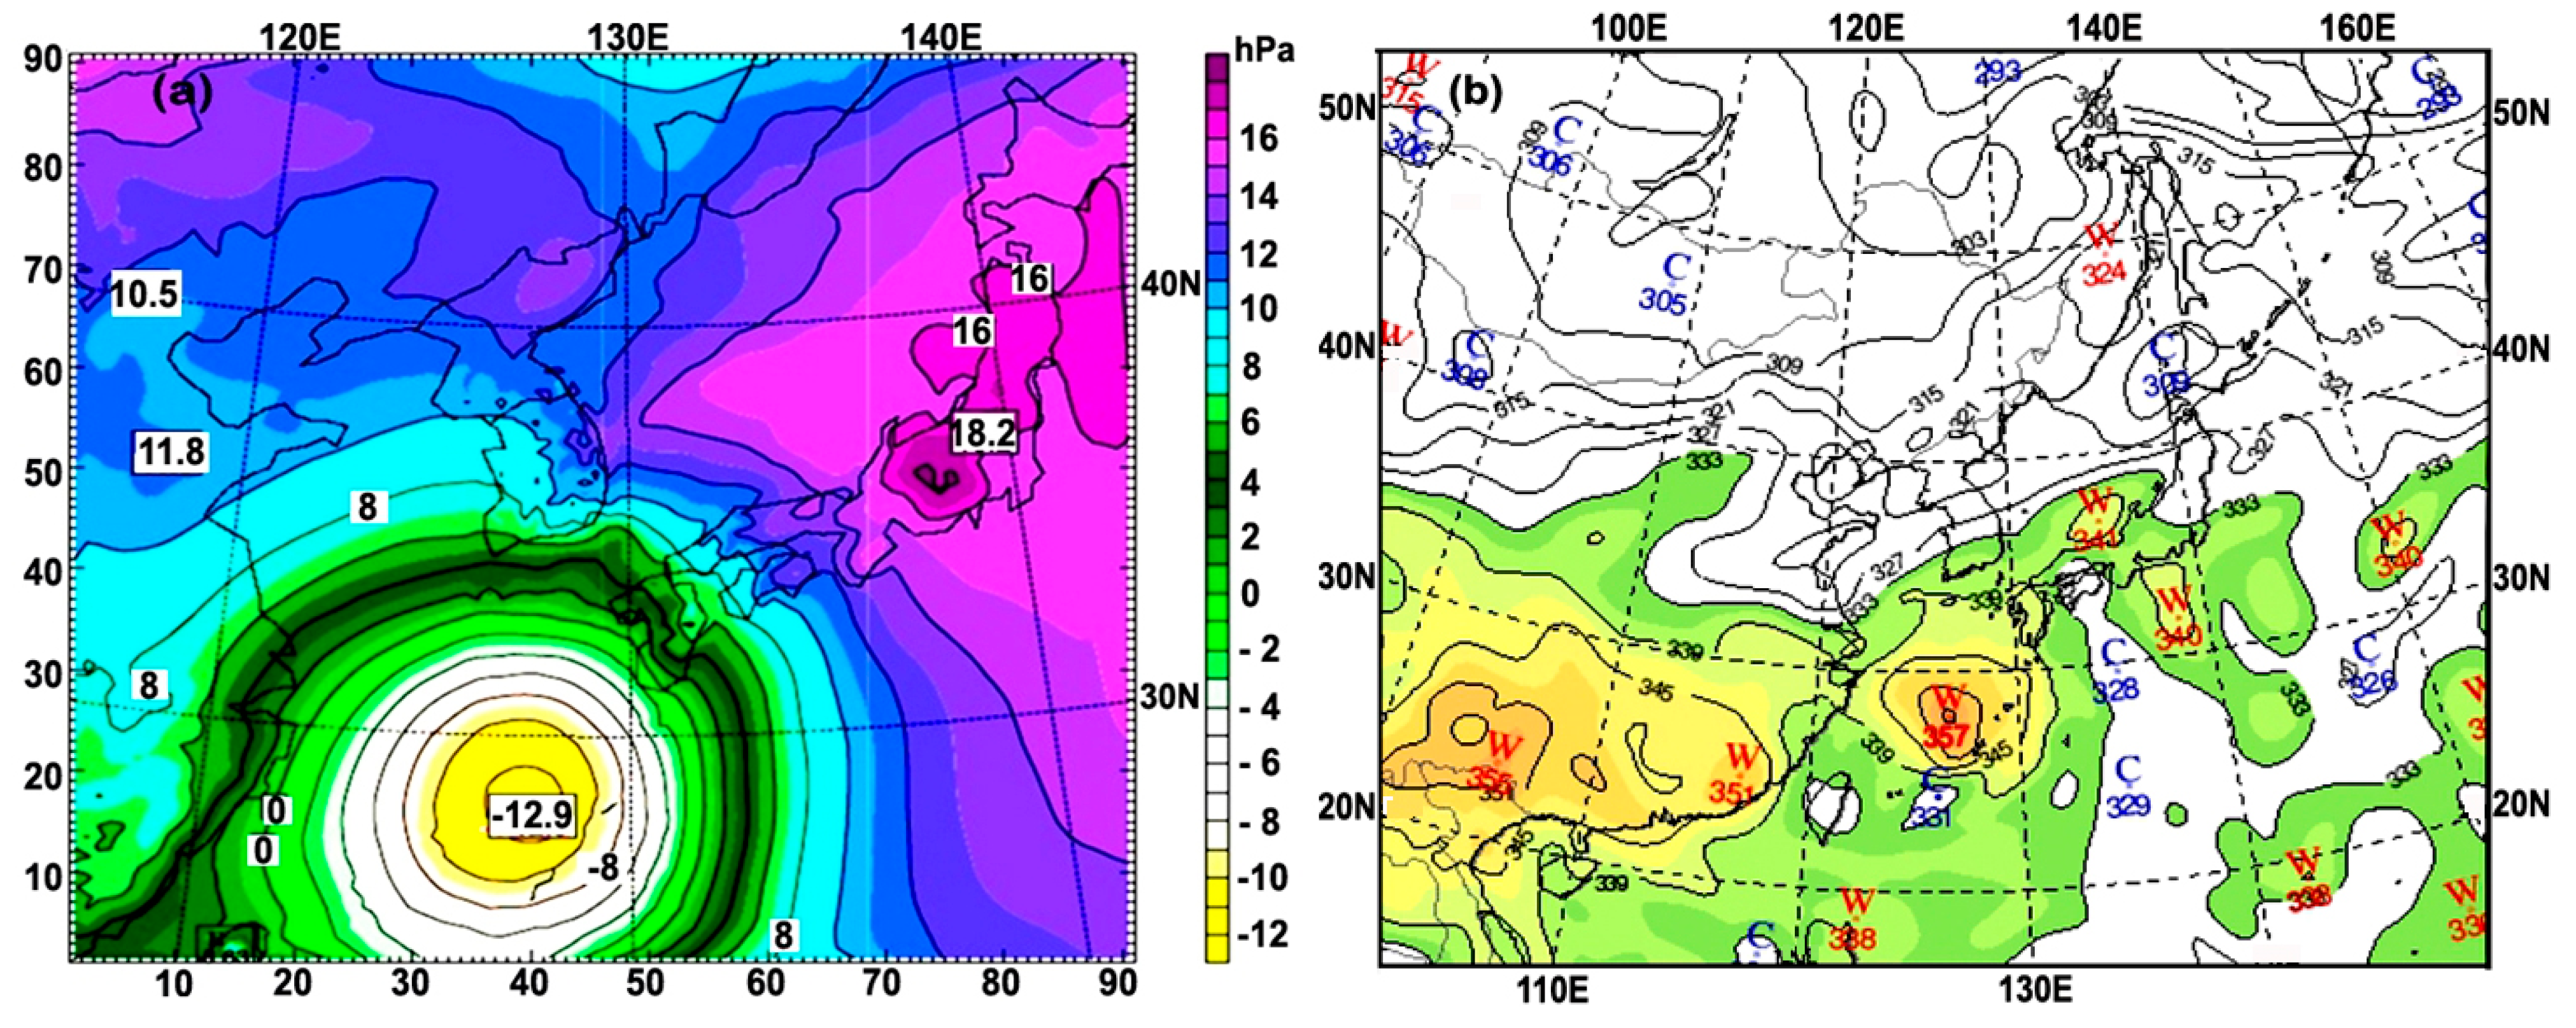
Figure 7a indicates that even if the deepened negative surface pressure tendency of −12.9 hPa/day on 6 September was less than −16 hPa/day on 5 September, the typhoon was still strengthened. Figure 7b shows that the area of high equivalent potential temperature (EPT) (357 K) contains much more moisture where the typhoon is located. It is expected that the latent heat released from the cloud cluster through the condensation process via significant moisture cooling can be converted into more kinetic energy to be transferred into the typhoon system, resulting in typhoon intensification, as referred to by Tamamadin et al. [30] and AMS [29]. Thus, it can be seen that the typhoon moves into the high equivalent potential temperature area.
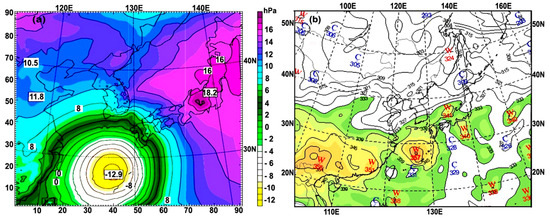
Figure 7.
(a) Surface pressure tendency (∂p/∂t; hPa/day) for 12 hrs at 10 m height based on WRF model simulation; (b) equivalent potential temperature (EPT; K) at 1.5 km height (850 hPa) based on UM-KMA model simulation at 09:00 LST, 6 September 2004. The typhoon center corresponds to −12.9 hPa/day and a 367 K area.
4.2. Intensification of a Smaller Typhoon Split by the Surrounding Mountains of the SJ
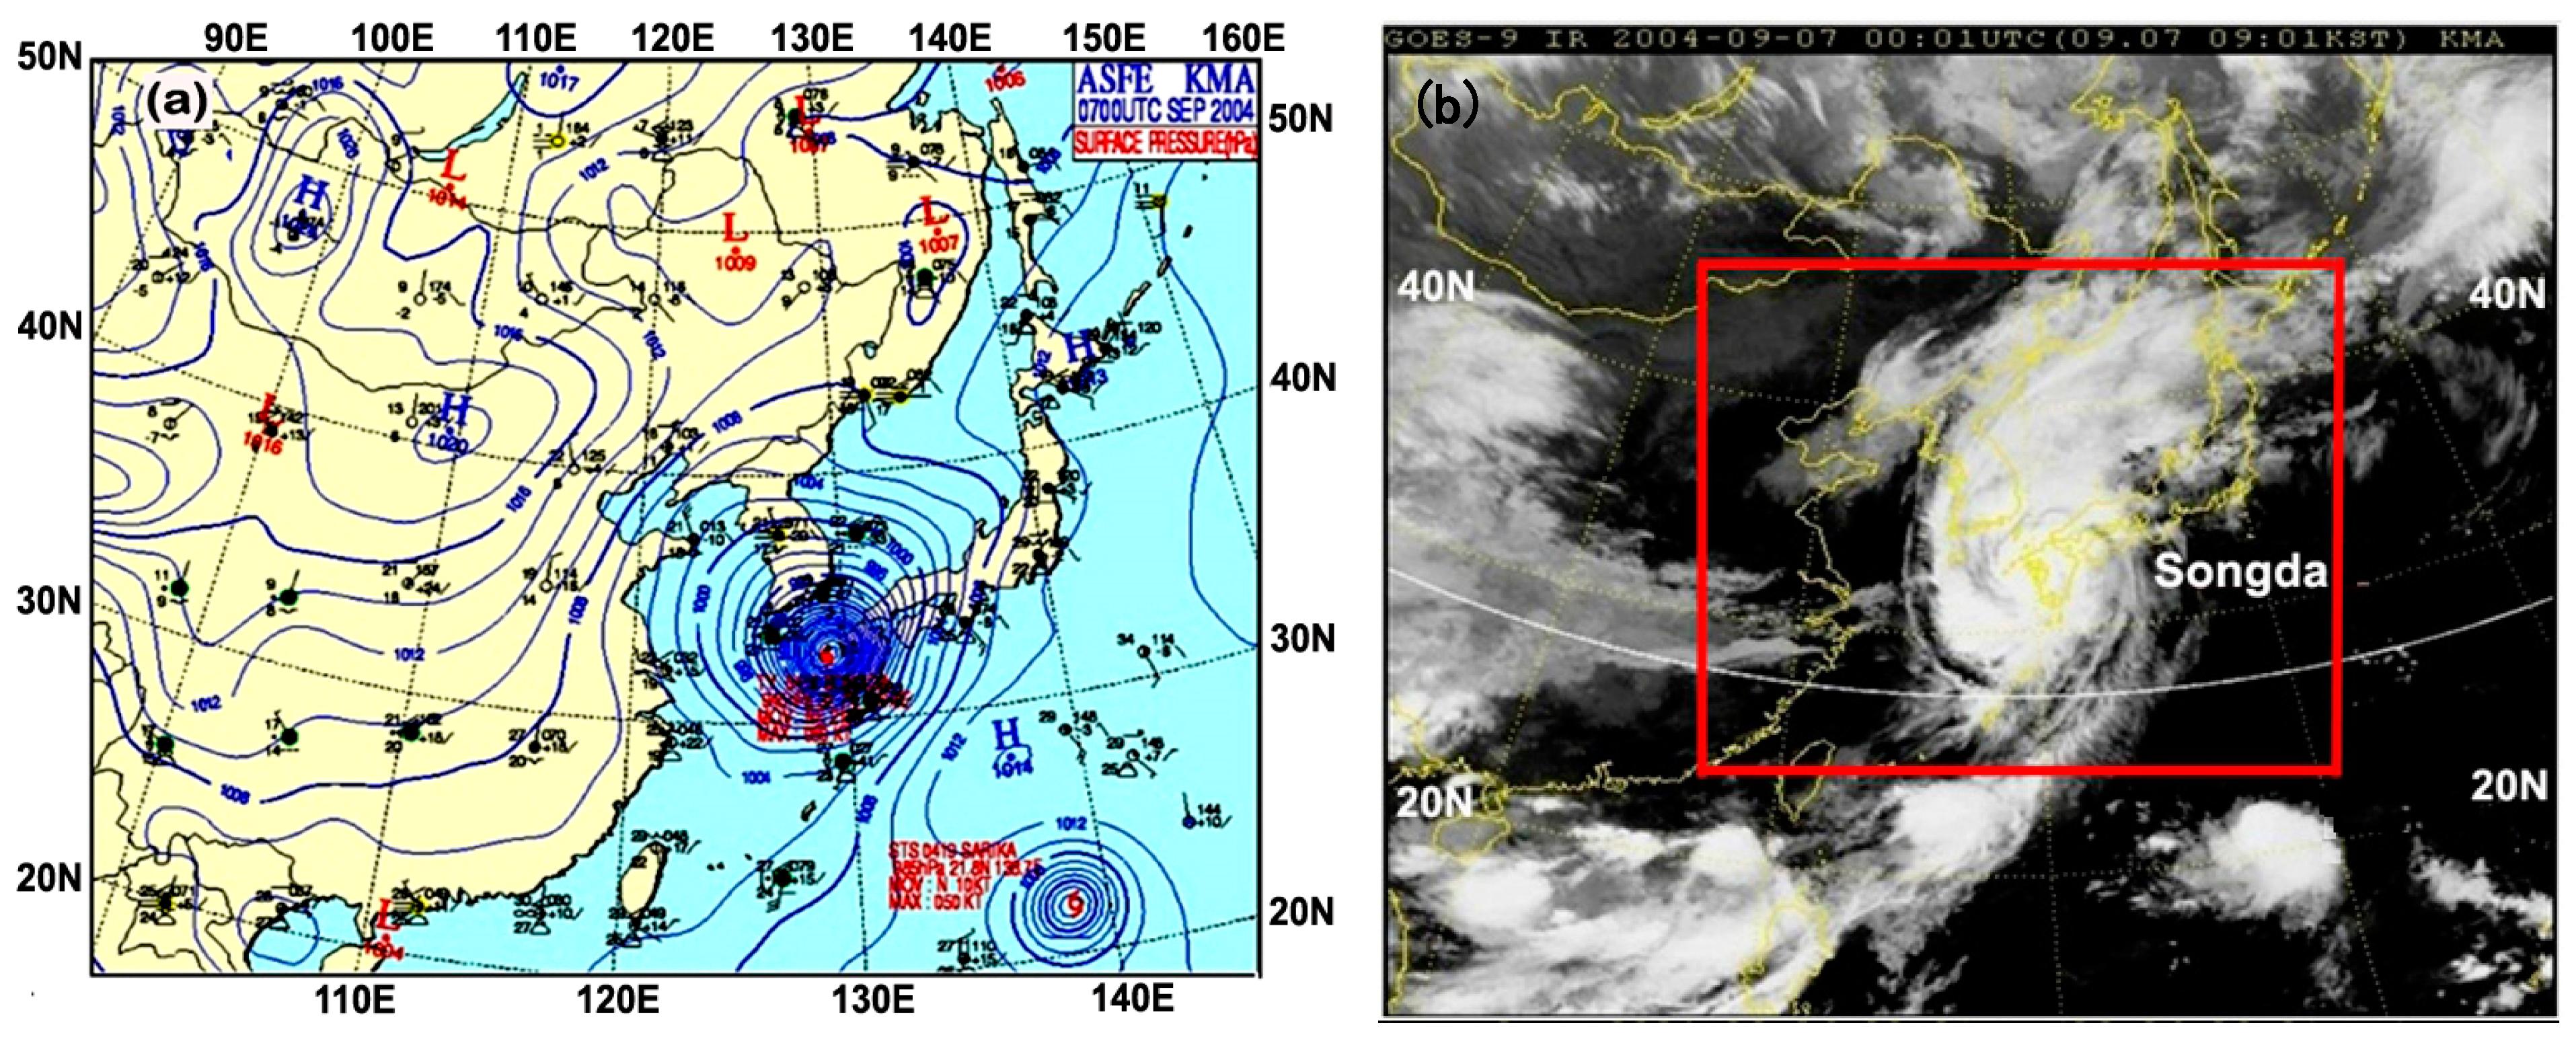
At 09:00 LST, 7 September, Typhoon Songda was located between the west of Kyushu Island, Japan and the South Sea of the Korean Peninsula (Figure 8 and Figure 9).
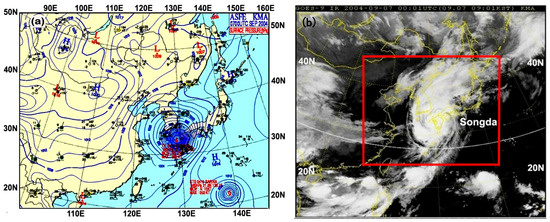
Figure 8.
(a) Surface weather chart (hPa) at 09:00 LST; (b) GOES−9−IR satellite image at 09:01 LST, 7 September 2004.
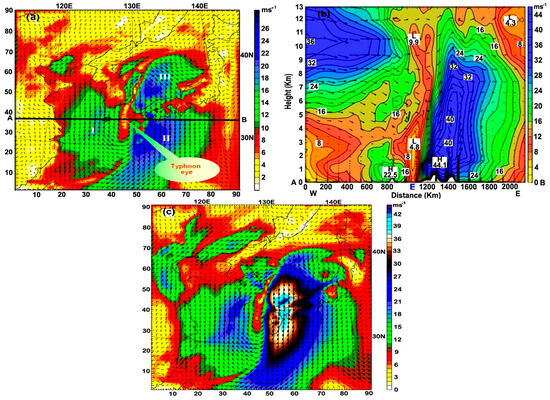
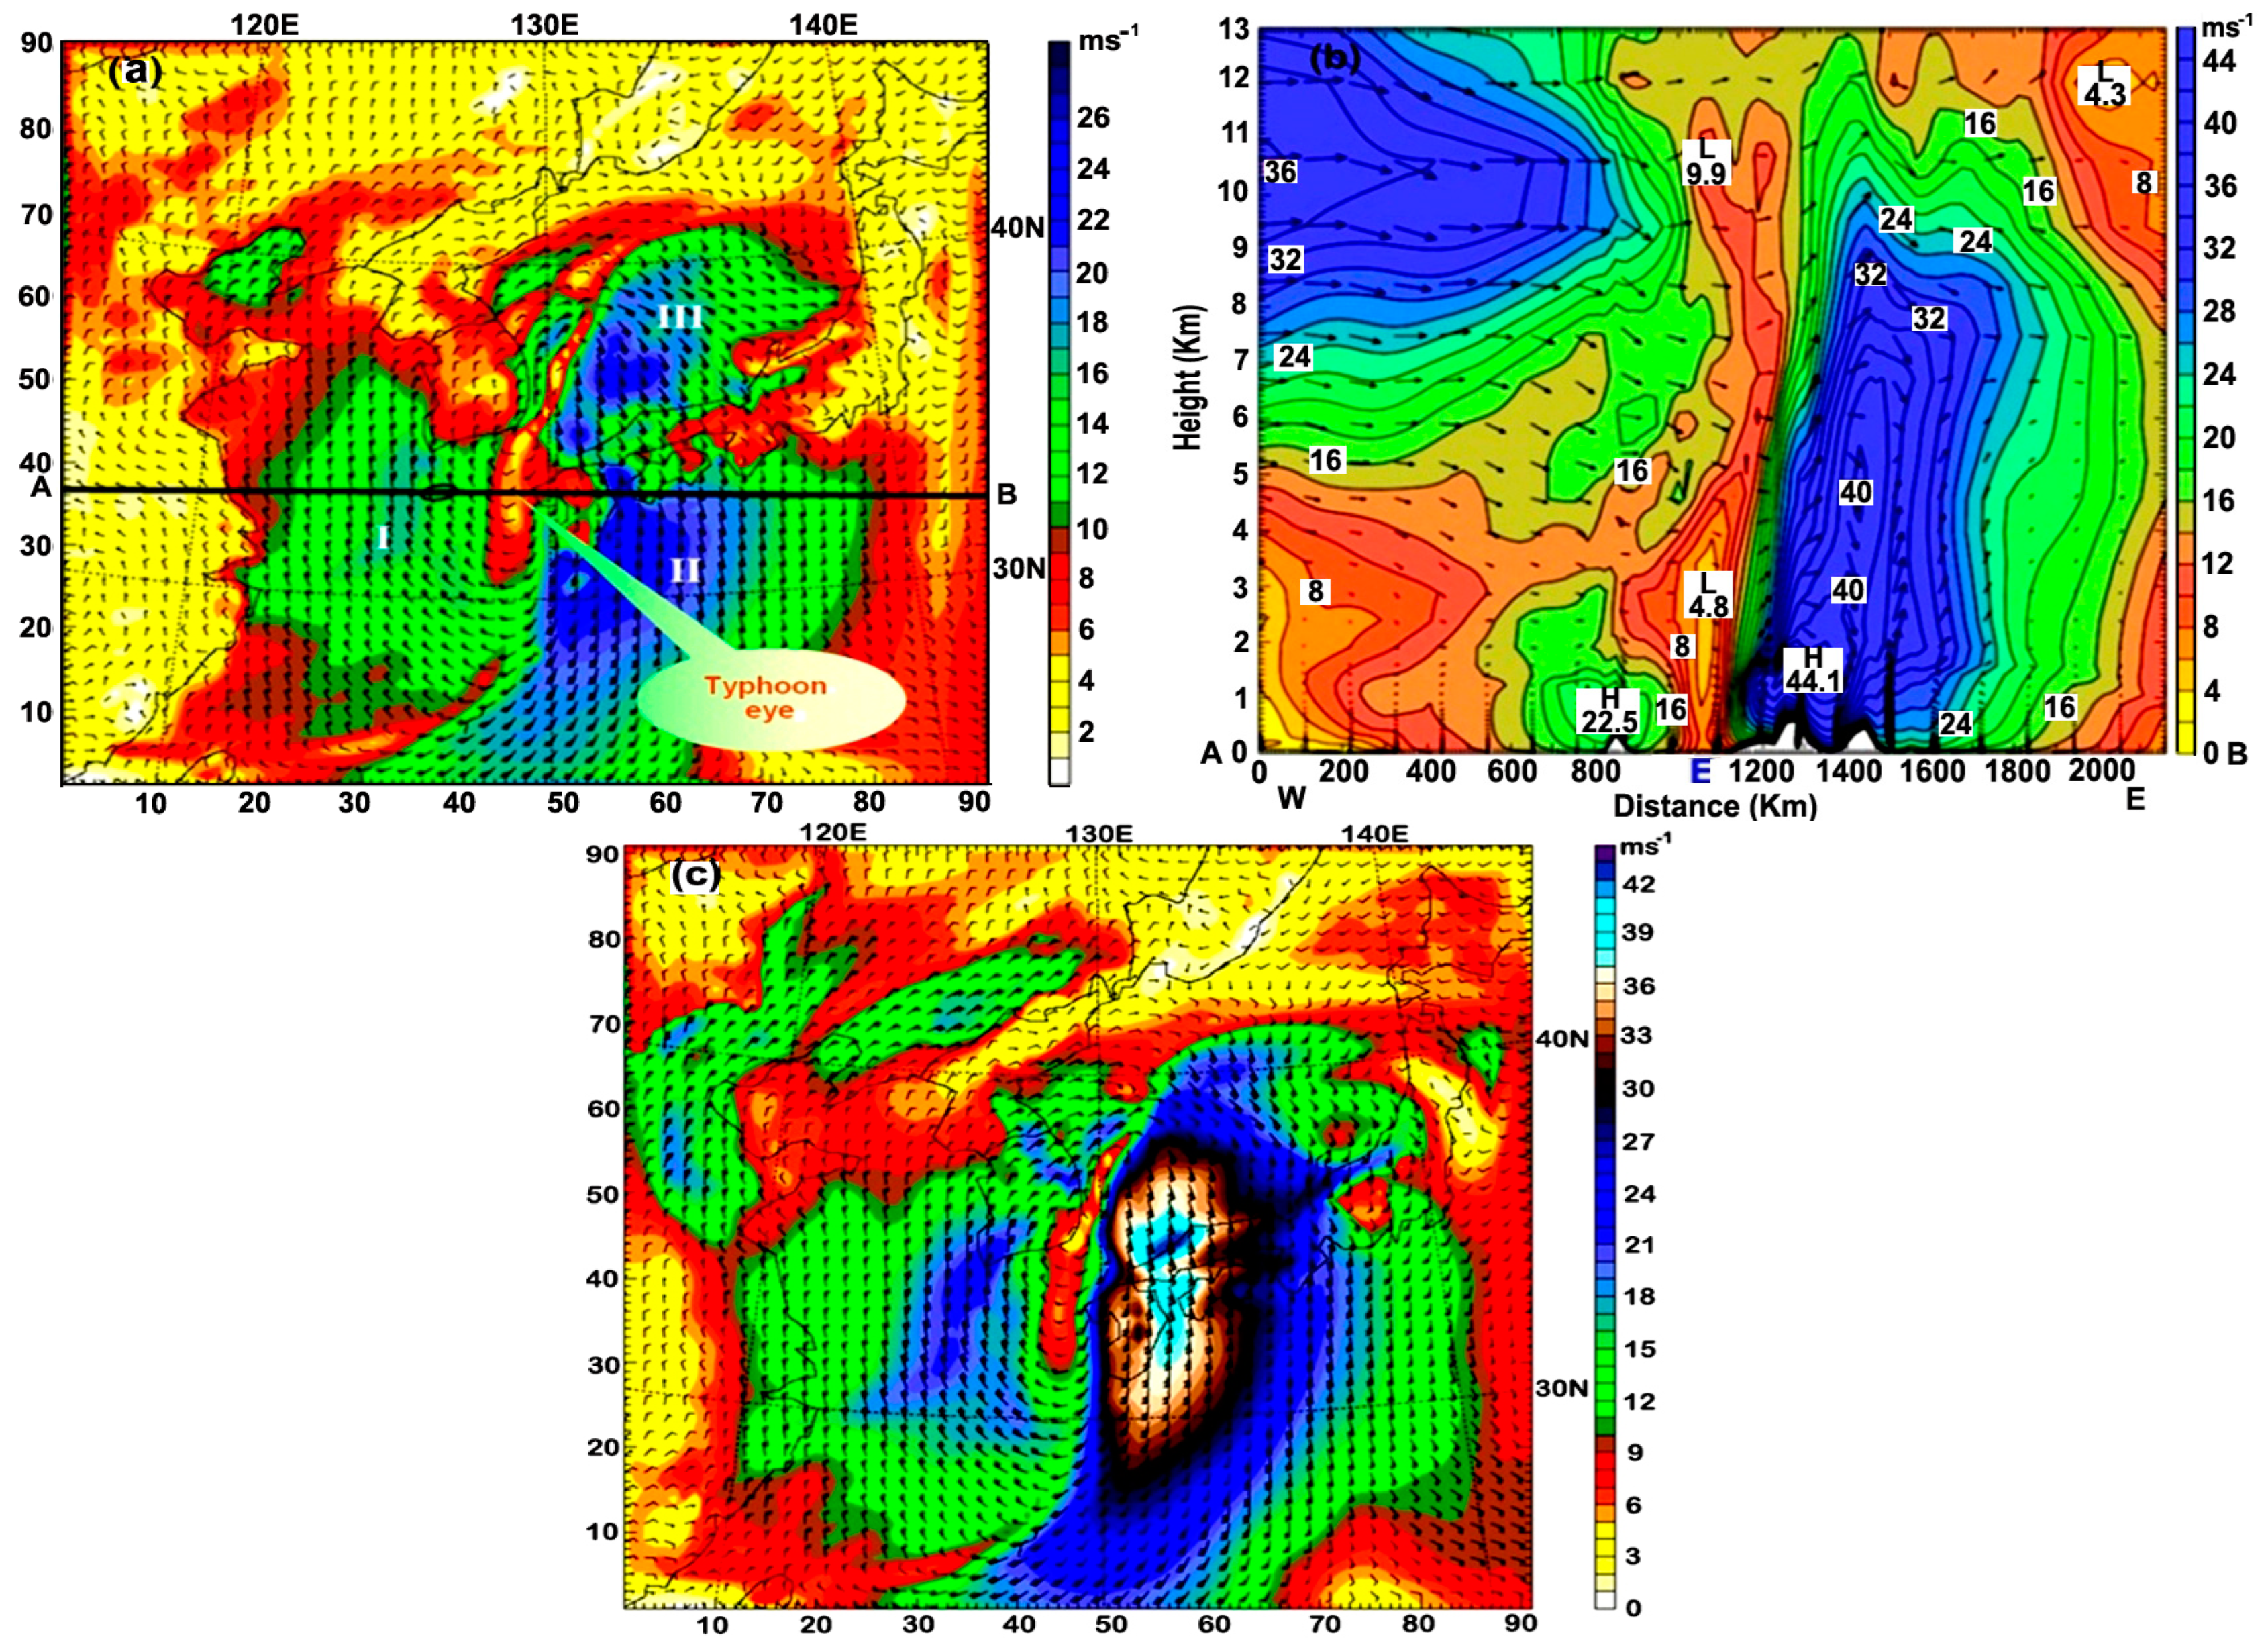
Figure 9.
(a) Surface wind (m/s) at 10 m height at 09:00 LST, 7 September; (b) vertical profile horizontal wind (m/s) along the line A–B (E; the typhoon eye) from the surface to 13 km height in (a) based on WRF model simulation; (c) wind (m/s) at 1 km height, still maintaining a circular shape.
According to the numerical simulation using the WRF model, as shown in Figure 9a,b, the typhoon was divided into three wind fields near the surface of 10 m over the Yellow Sea (I), the South Sea near Japan (II), and the Japan Sea (III) due to the increased friction from the surrounding lands of the moving typhoon and shallower sea depth approaching the lands. In particular, the vertical distribution of the horizontal winds showed a reinforced asymmetric structure with a maximum wind speed of 44.1 m/s at 1.5 km height at 09:00 LST, 7 September, in contrast to 37.2 m/s on 6 September. The vertical extension of the strong horizontal wind band was in the right of the typhoon eye, much higher than its left, still showing calm and weak wind in its eye (Figure 9b).
However, at a 1 km height, in Figure 9c, the typhoon structure still has a circular shape with a maximum wind speed in its right quadrant. This is because the friction effect of the land’s topography at an upper altitude was greatly reduced compared to the surface, so the typhoon could have still a circular shape. Thus, it is very important to recognize that although the edges of the circular typhoon are somewhat torn, it still maintains its circular structure at altitudes above 1 km. Namely, the intensification of vertical flow can draw more moisture from the sea surface to the atmosphere, which can be cooled to form large cloud clusters through the condensation process vertically on the right side of the typhoon eye.
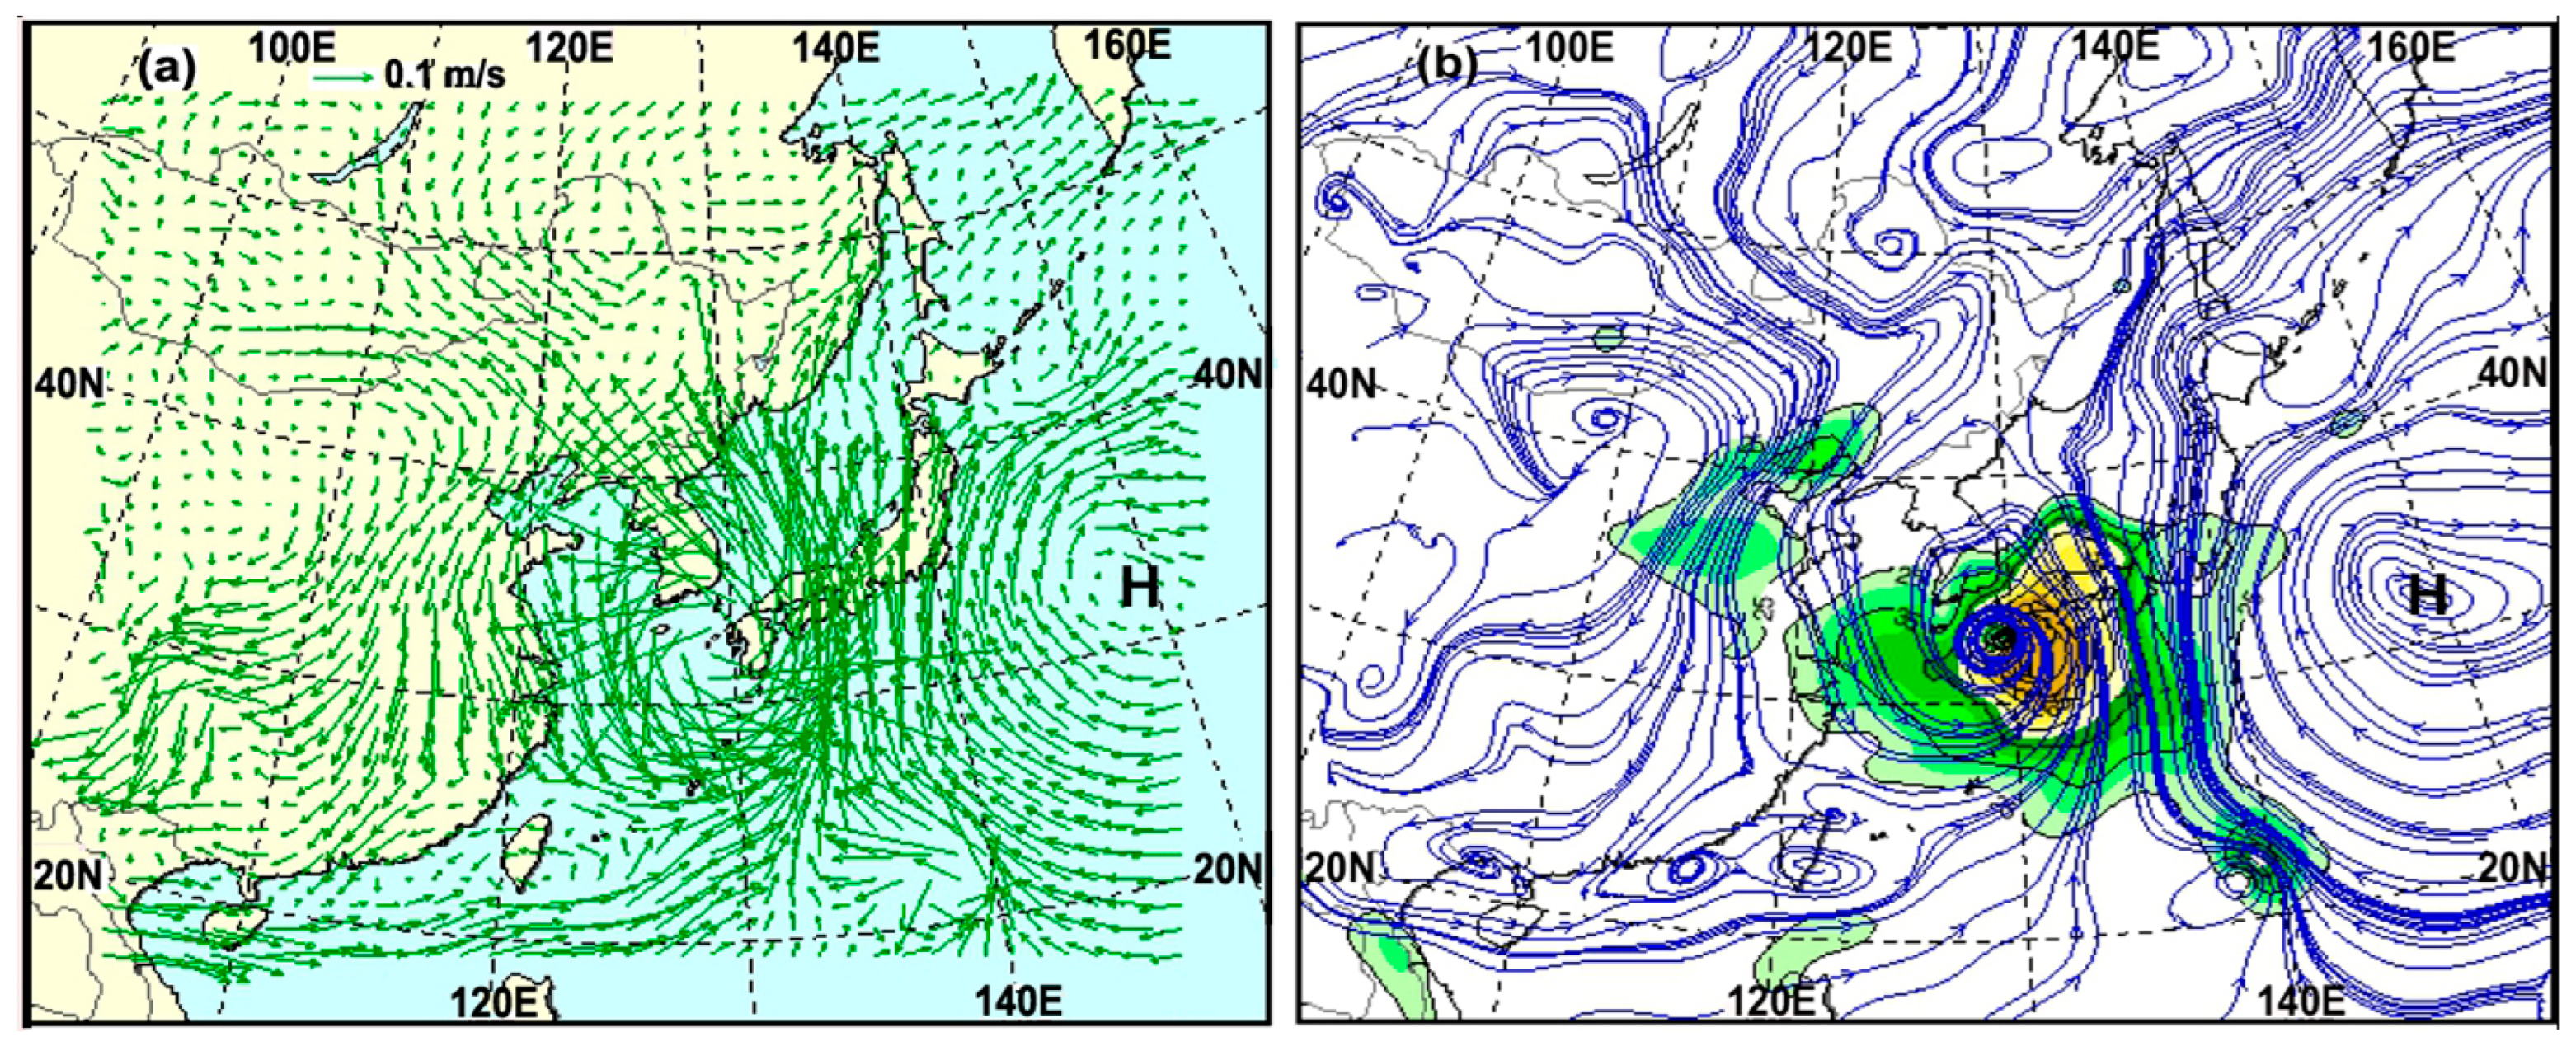
Further consideration was given to moist flux and streamline at 850 (hPa; about 1.5 km height) at 09:00 LST, 7 September, in Figure 10a,b. The majority of moisture transportation took place in the right quadrant of the typhoon, from its tail toward Kyushu Island and the center of the SJ, pulling significant moisture via mutual interactions between the cyclonic circulation by TY Songda and the anti-cyclonic circulation by the North Pacific High pressure (H) between 40 N and 20 N.
Thus, the merging area of the moisture corresponds to an area of significant amounts of latent heat being released through the moisture condensation to form clouds. Sequentially, the heat should be converted into sufficient amounts of kinetic energy to be supplied to the typhoon circulation, causing greater intensification of the typhoon.

Figure 10.
(a) Moist flux (0.1 m/s); (b) streamline and isotach (wind speed > 25 kt (green color and 50 kt (yellow color) at 850 (hPa; approximately 1.5 km height) based on UK-KMA model simulation at 09:00 LST, 7 September 2015. H denotes the North Pacific High pressure. The majority of moisture flux and streamline occurred in the right quadrant of the typhoon center, from its tail toward the right of Kyushu Island into the SJ (Japan), pulling significant moisture via mutual interactions between the cyclonic typhoon and the anti-cyclonic H from 40 N to 20 N.
In Figure 11a, the surface pressure tendency in its center changed from −12.9 hPa/day at 09:00 LST, 5 September to −6.0 hPa/day in the Korea Strait and −8.1 hPa/day to the left of Kyushu Island at 09:00 LST, 7 September. This may be attributed to the increased friction of the shallower sea depth and surrounding lands, as the typhoon passed by the Korea Strait with less than 100 m depth. Thus, its circulation should be prohibited to be slightly weakened compared to the one at 09:00 LST on 6 September.
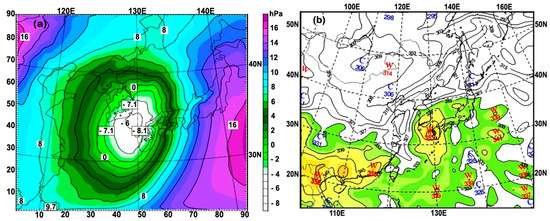
Figure 11.
(a) Surface pressure tendency (hPa/day) for 12 hours at a 10 m height based on WRF model simulation; (b) equivalent potential temperature (EPT; K) at 1.5 km height (850 hPa) based on UM-KMA model simulation at 09:00 LST, 7 September. The typhoon center corresponds to −8.1 hPa/day and a 355 K area.
Figure 11b displays the EPT (K) at a 1.5 km height (850 hPa) at 09:00 LST on 7 September 2004. Even if the EPT in the typhoon center slightly decreased from 357 k to 355 k, the area of high EFT still contains significant moisture, and latent heat released from the cloud condensation process via cooling of the air parcel can be converted into significant kinetic energy to be transferred into the typhoon system, enhancing its circulation. Thus, we can recognize the moving track of the typhoon, where significant energy exists.
As shown in Figure 12a,b, at 21:00 LST, 7 September, when TY-Songda entered the SJ, passing the Korea Strait, the original Songda was reformed into a smaller split typhoon with a circular shape, located in the central part of the SJ between the East Korea Warm Current and Tsushima Warm Current, closer to the west of Honshu Island, Japan, as shown in Figure 1d and Figure 12a.
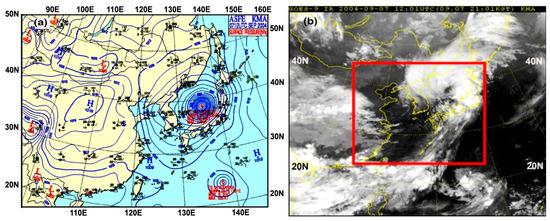
Figure 12.
(a) Surface weather chart (hPa) at 21:00 LST; (b) GOES-9 IR satellite image at 21:00 LST, 7 September 2004. Red frame in (b) denotes a coarse domain of the model.
Its intensification was detected at heights of 10 m, 1 km, and 3 km at 21:00 LST, 7 September in the mid part of the SJ (Figure 13a and Figure 14a,b). When TY Songda passed by the Korea Strait and entered the semi-enclosed SJ with a maximum depth of 3800 m near its center, it was blocked like the Japan Sea (III) wind field, and a small split typhoon could be intensified due to the channeling effects of cyclonic rotating winds from a shallow sea depth of the Korea Strait into the SJ’s center and the surrounding high terrain of Korea, Japan, and Russia, as well as sharp increasing sea depths of the SJ from the coast to its center.
Another effect of its intensification was the intrusion of a strong downslope wind from the Japan western coastal high mountains of Honshu and Hokkaido islands toward the SJ’s center in Figure 1b, which could be changed into cyclonic winds due to the Coriolis force to the downslope wind at 90 degrees toward the right in the northern hemisphere, resulting in the strengthening of the smaller deformed cyclonic circulation like a small split typhoon in Figure 13a and Figure 14a.

Figure 13.
(a) Wind velocity (m/s) at 10 m height; (b) vertical distribution of horizontal wind (m/s) on a black line in Figure 13a at 21:00 LST, 7 September 2004. When TY-Songda moved to the semi-enclosed SJ, the typhoon reformed as a smaller typhoon, still maintaining a circular shape with asymmetric wind patterns horizontally and vertically.
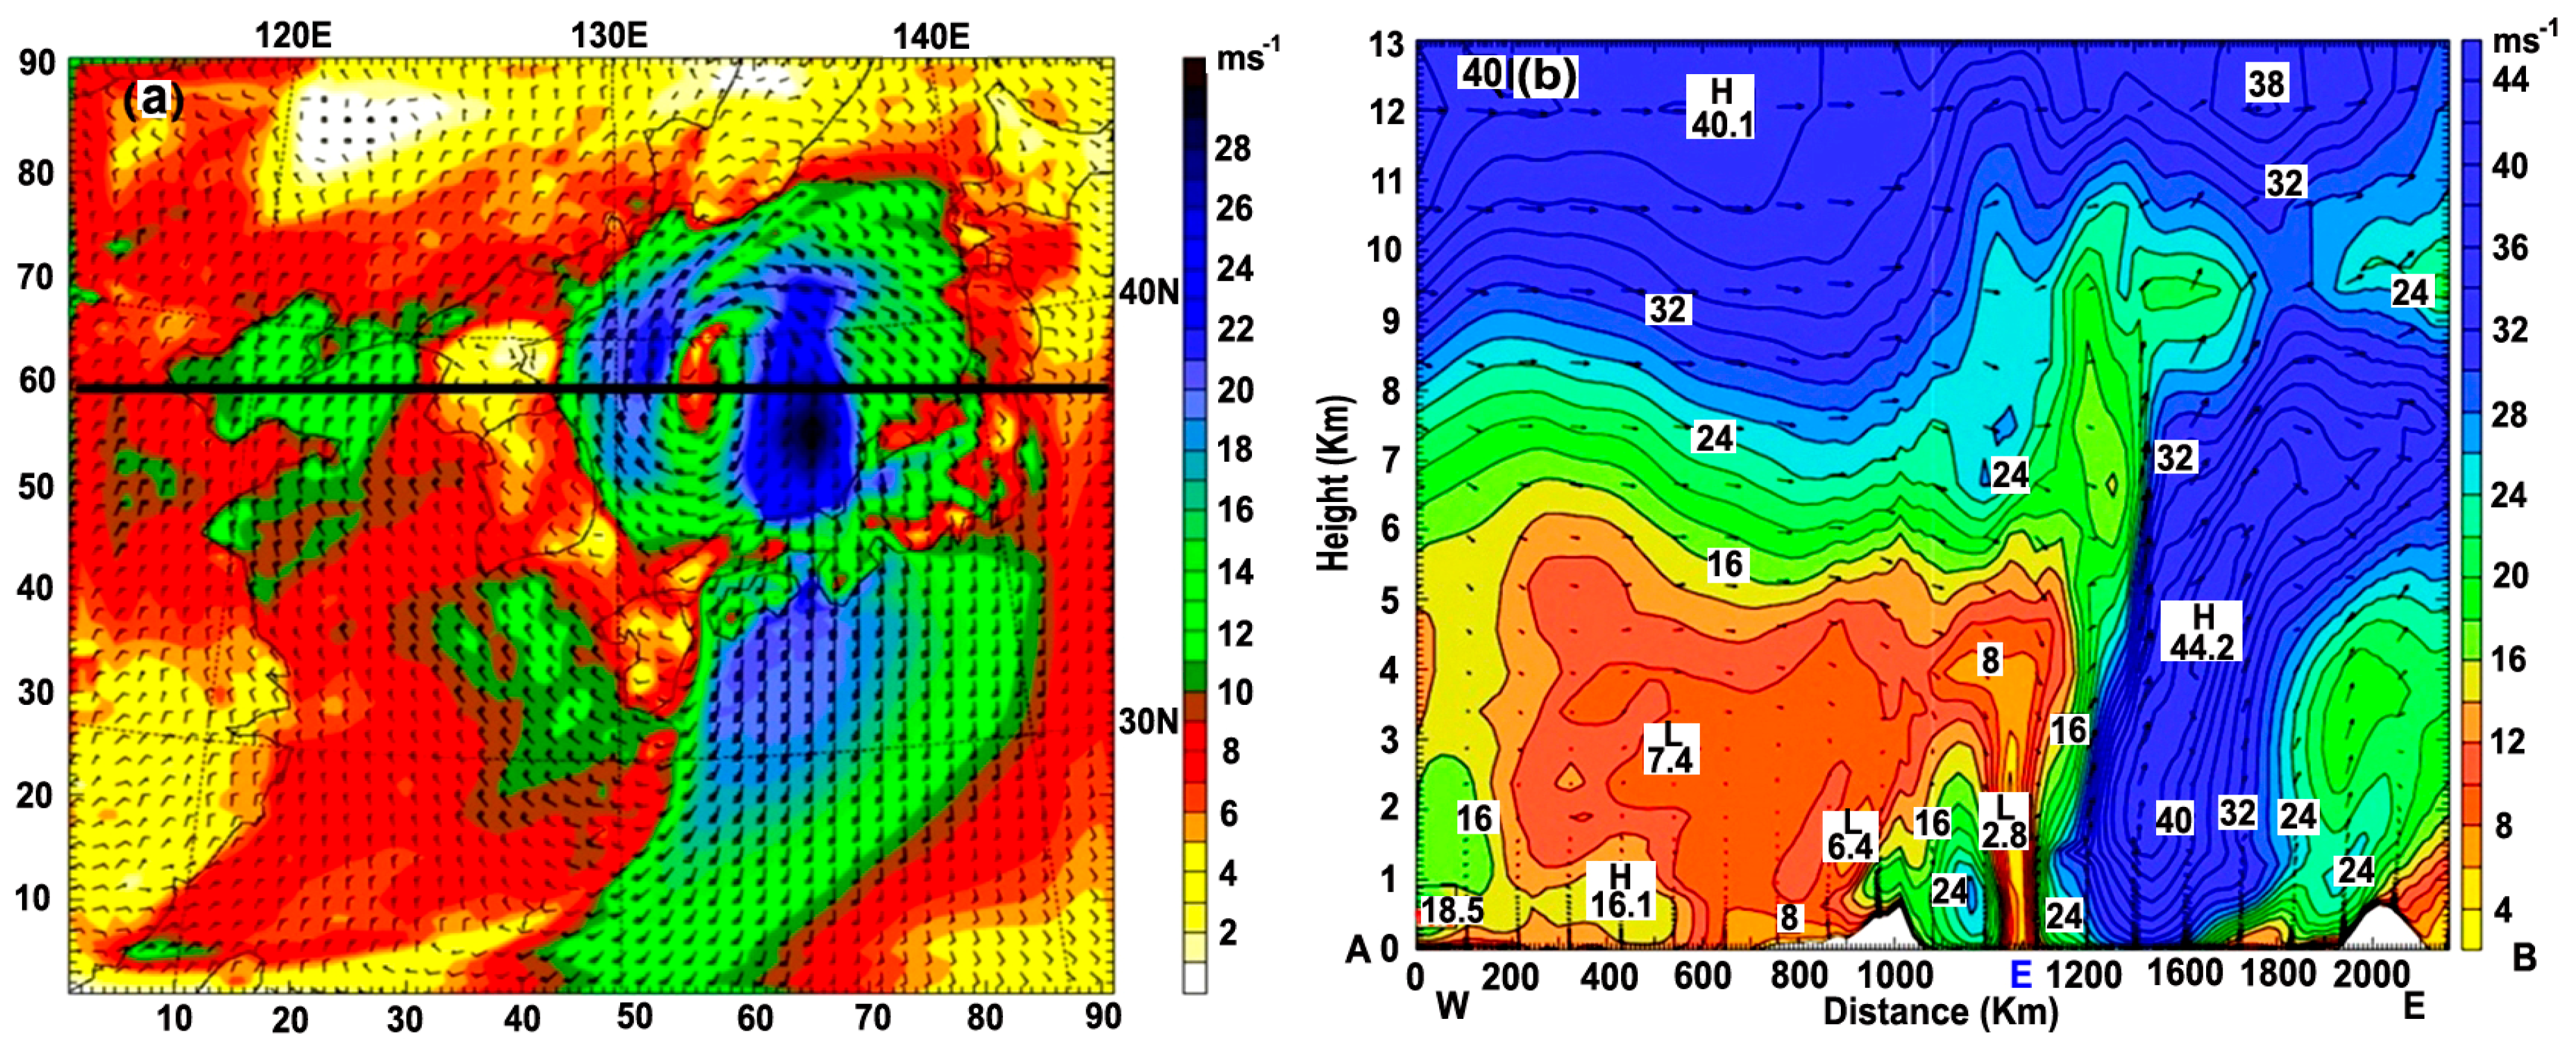
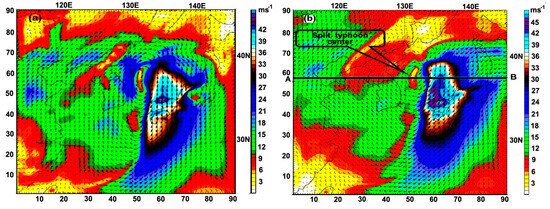
Figure 14.
(a) Wind velocity (m/s) at 1.5 km; (b) 3 km heights at 21:00 LST on 7 September.
Figure 14.
(a) Wind velocity (m/s) at 1.5 km; (b) 3 km heights at 21:00 LST on 7 September.
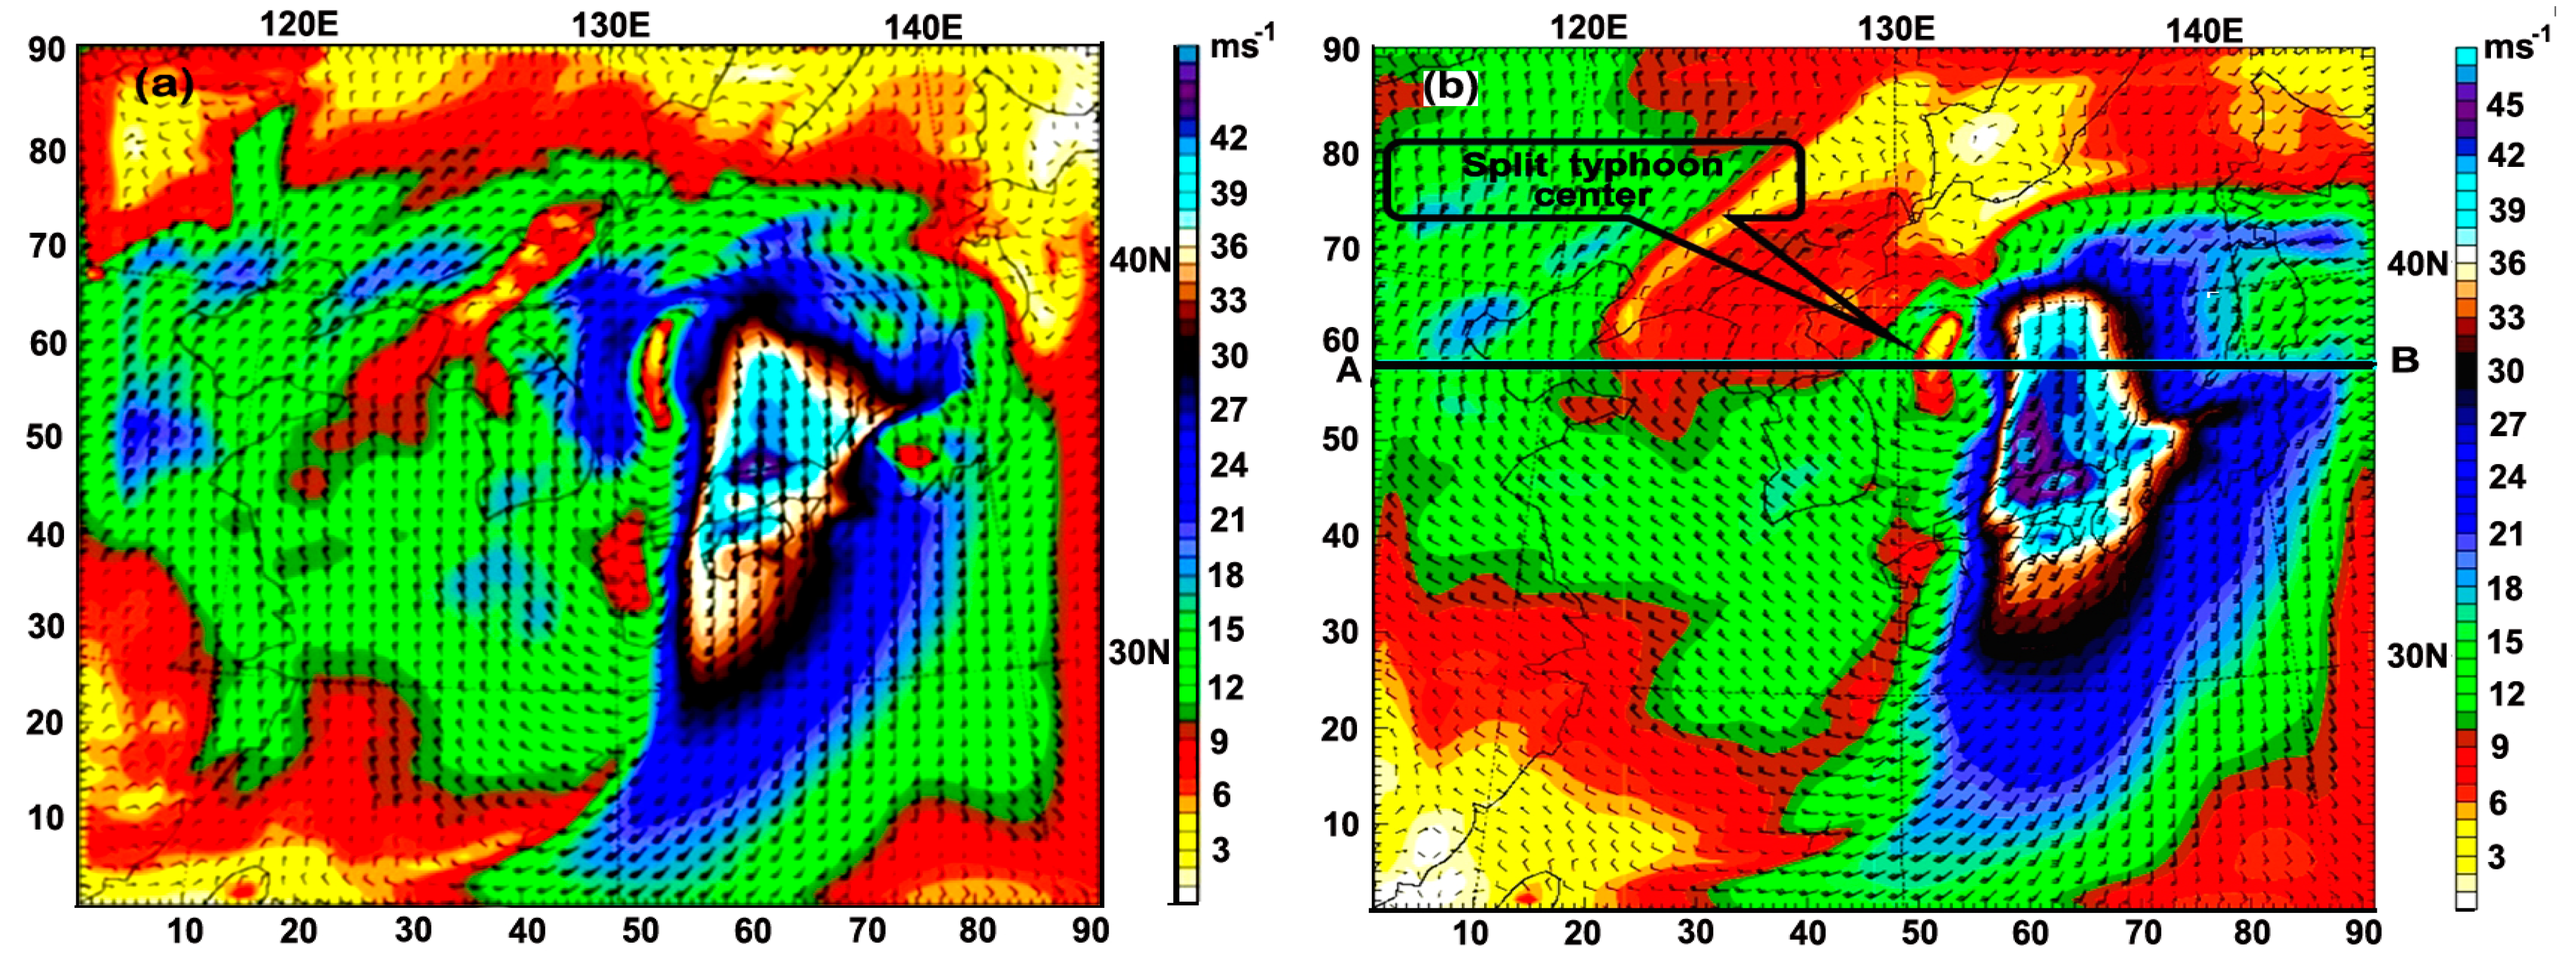
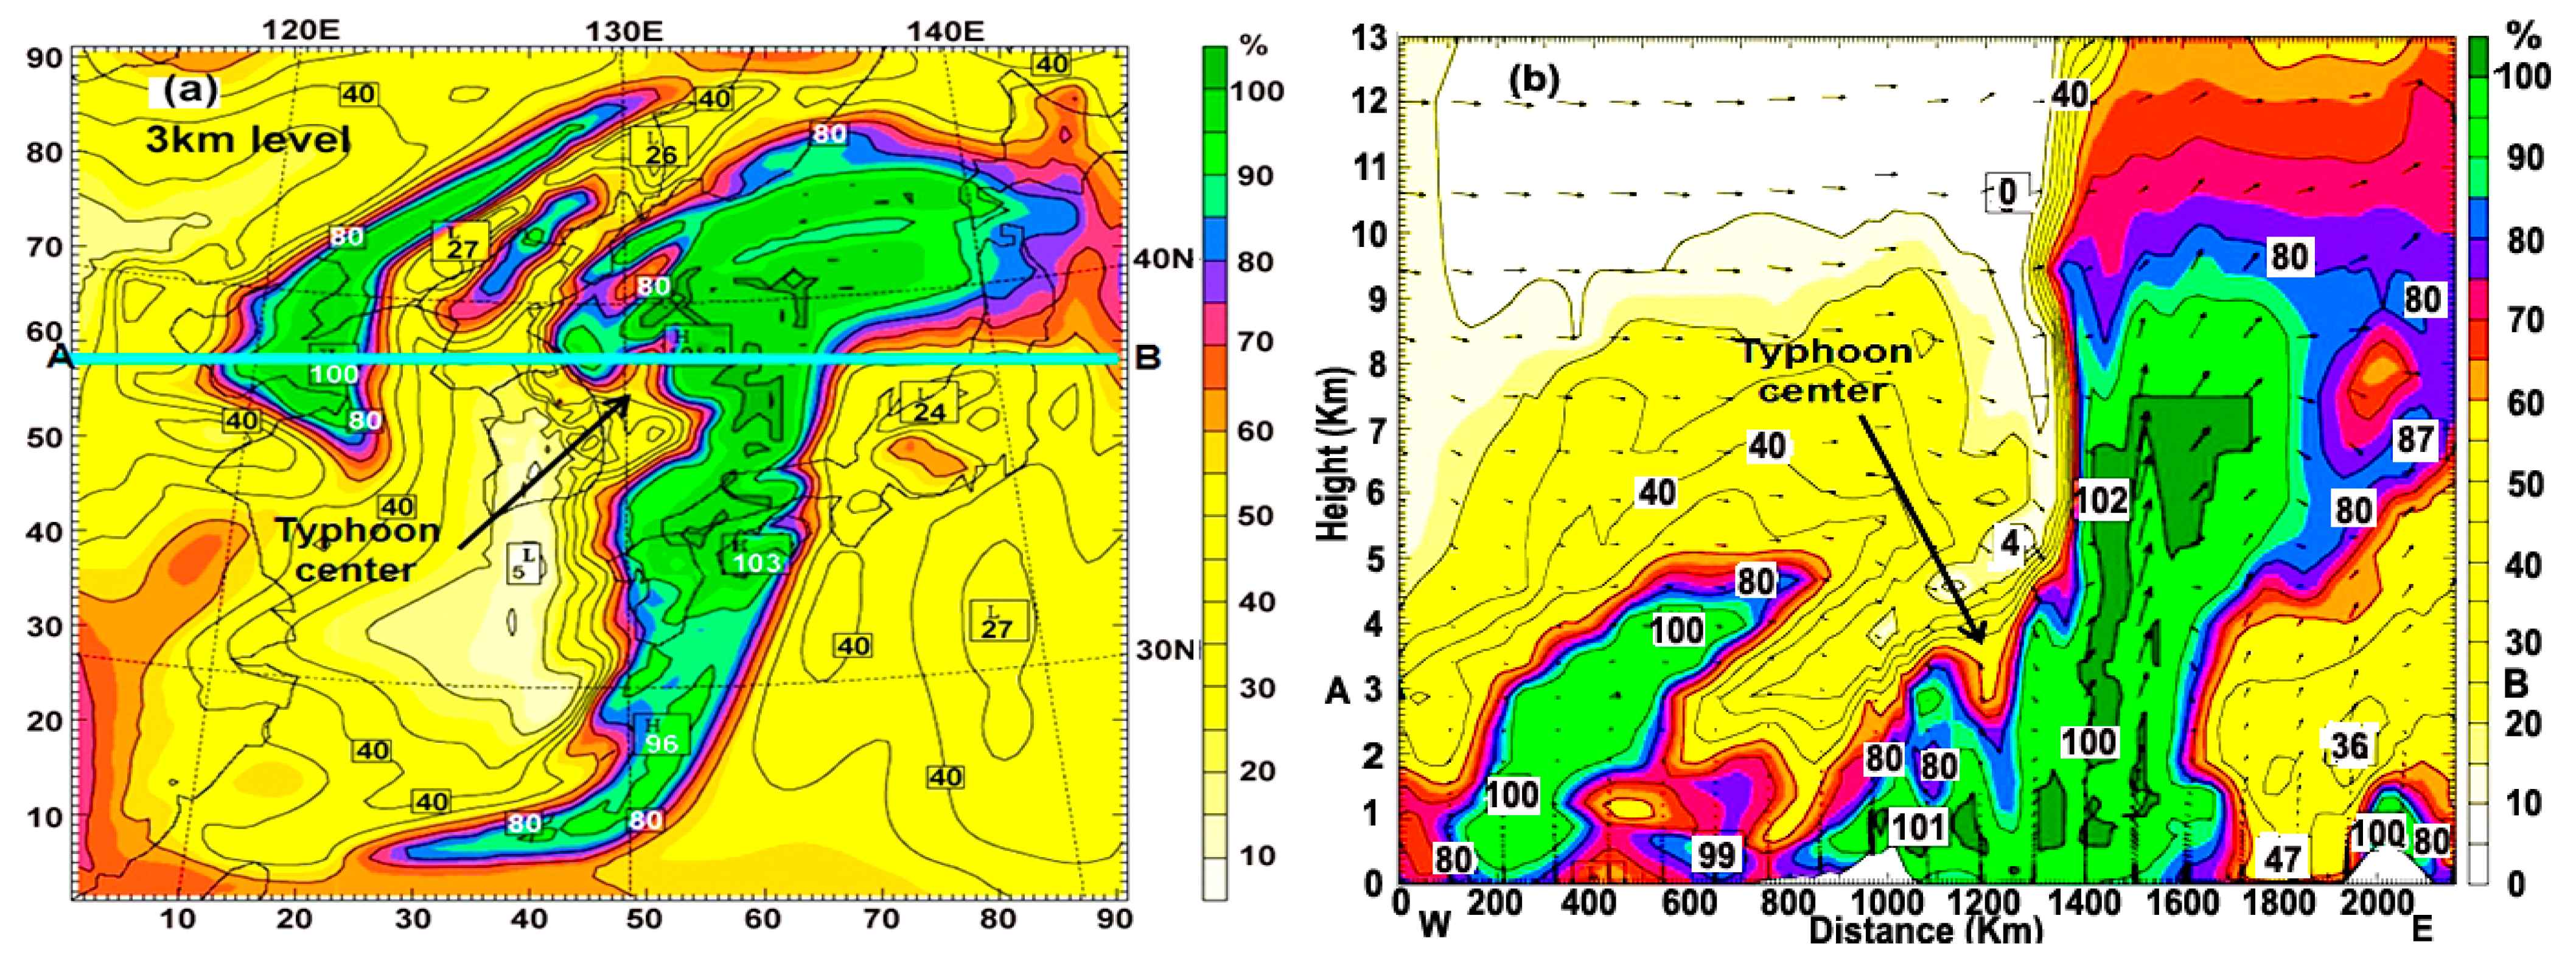
Figure 15a,b display horizontal relative humidity (%) at a 3 km height and vertical relative humidity (%) with wind (m/s) from 0 m to 13 km height along a line A–B in Figure 13a at 21:00 LST. The horizontal relative humidity (%) at a 3 km height and its vertical distributions correspond to the wind fields in Figure 13b and Figure 14b.
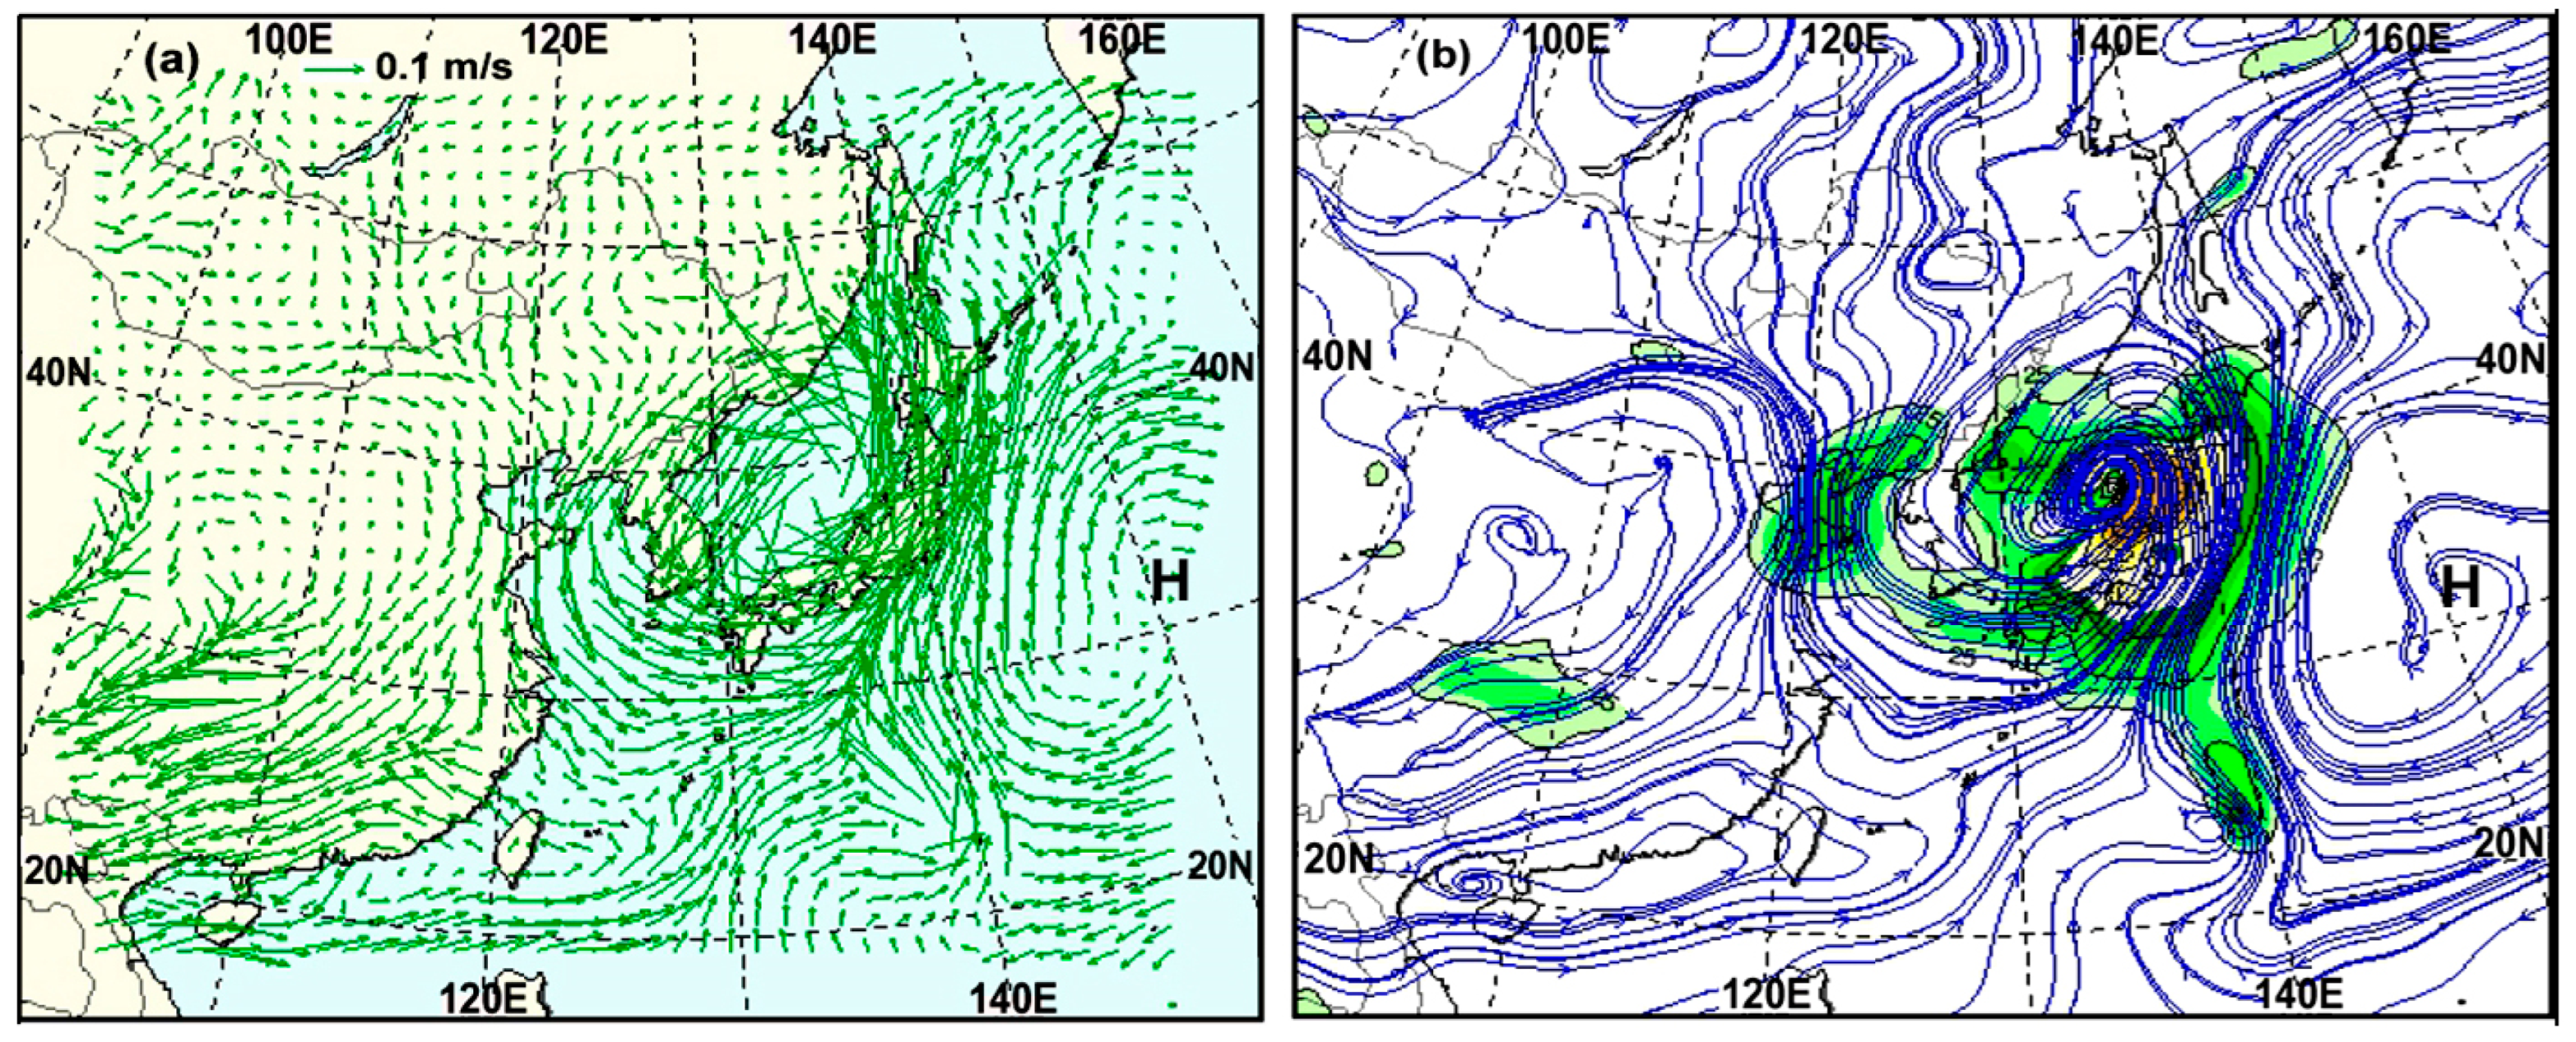
As shown in Figure 16, major moisture flux and streamline at a 1.5 km height occurred in the right quadrant of the typhoon center from its tail toward the right of Kyushu Island, Japan, pulling significant moisture via mutual interactions between the cyclonic TY Songda and the anti-cyclonic North Pacific High pressure (H) from 40 N to 20 N. Thus, the combination of the moisture transported by the typhoon itself and the moisture evaporated from the sea was cooled to form large clouds to its right, and the significant latent heat released from the clouds was converted into kinetic energy to drive its circulation intensification and the asymmetric structures of wind and moisture.
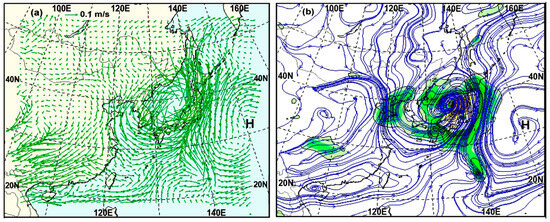
Figure 16.
(a) Moist flux (0.1 m/s); (b) streamline and isotach (wind speed > 25 kt (green color) and 50 kt (yellow color) at 850 (hPa; about 1.5 km height) based on the UK-KMA model at 21:00 LST. Strong moisture flux between the cyclonic typhoon and the anti-cyclonic North Pacific High pressure (H) occurred from south to north.
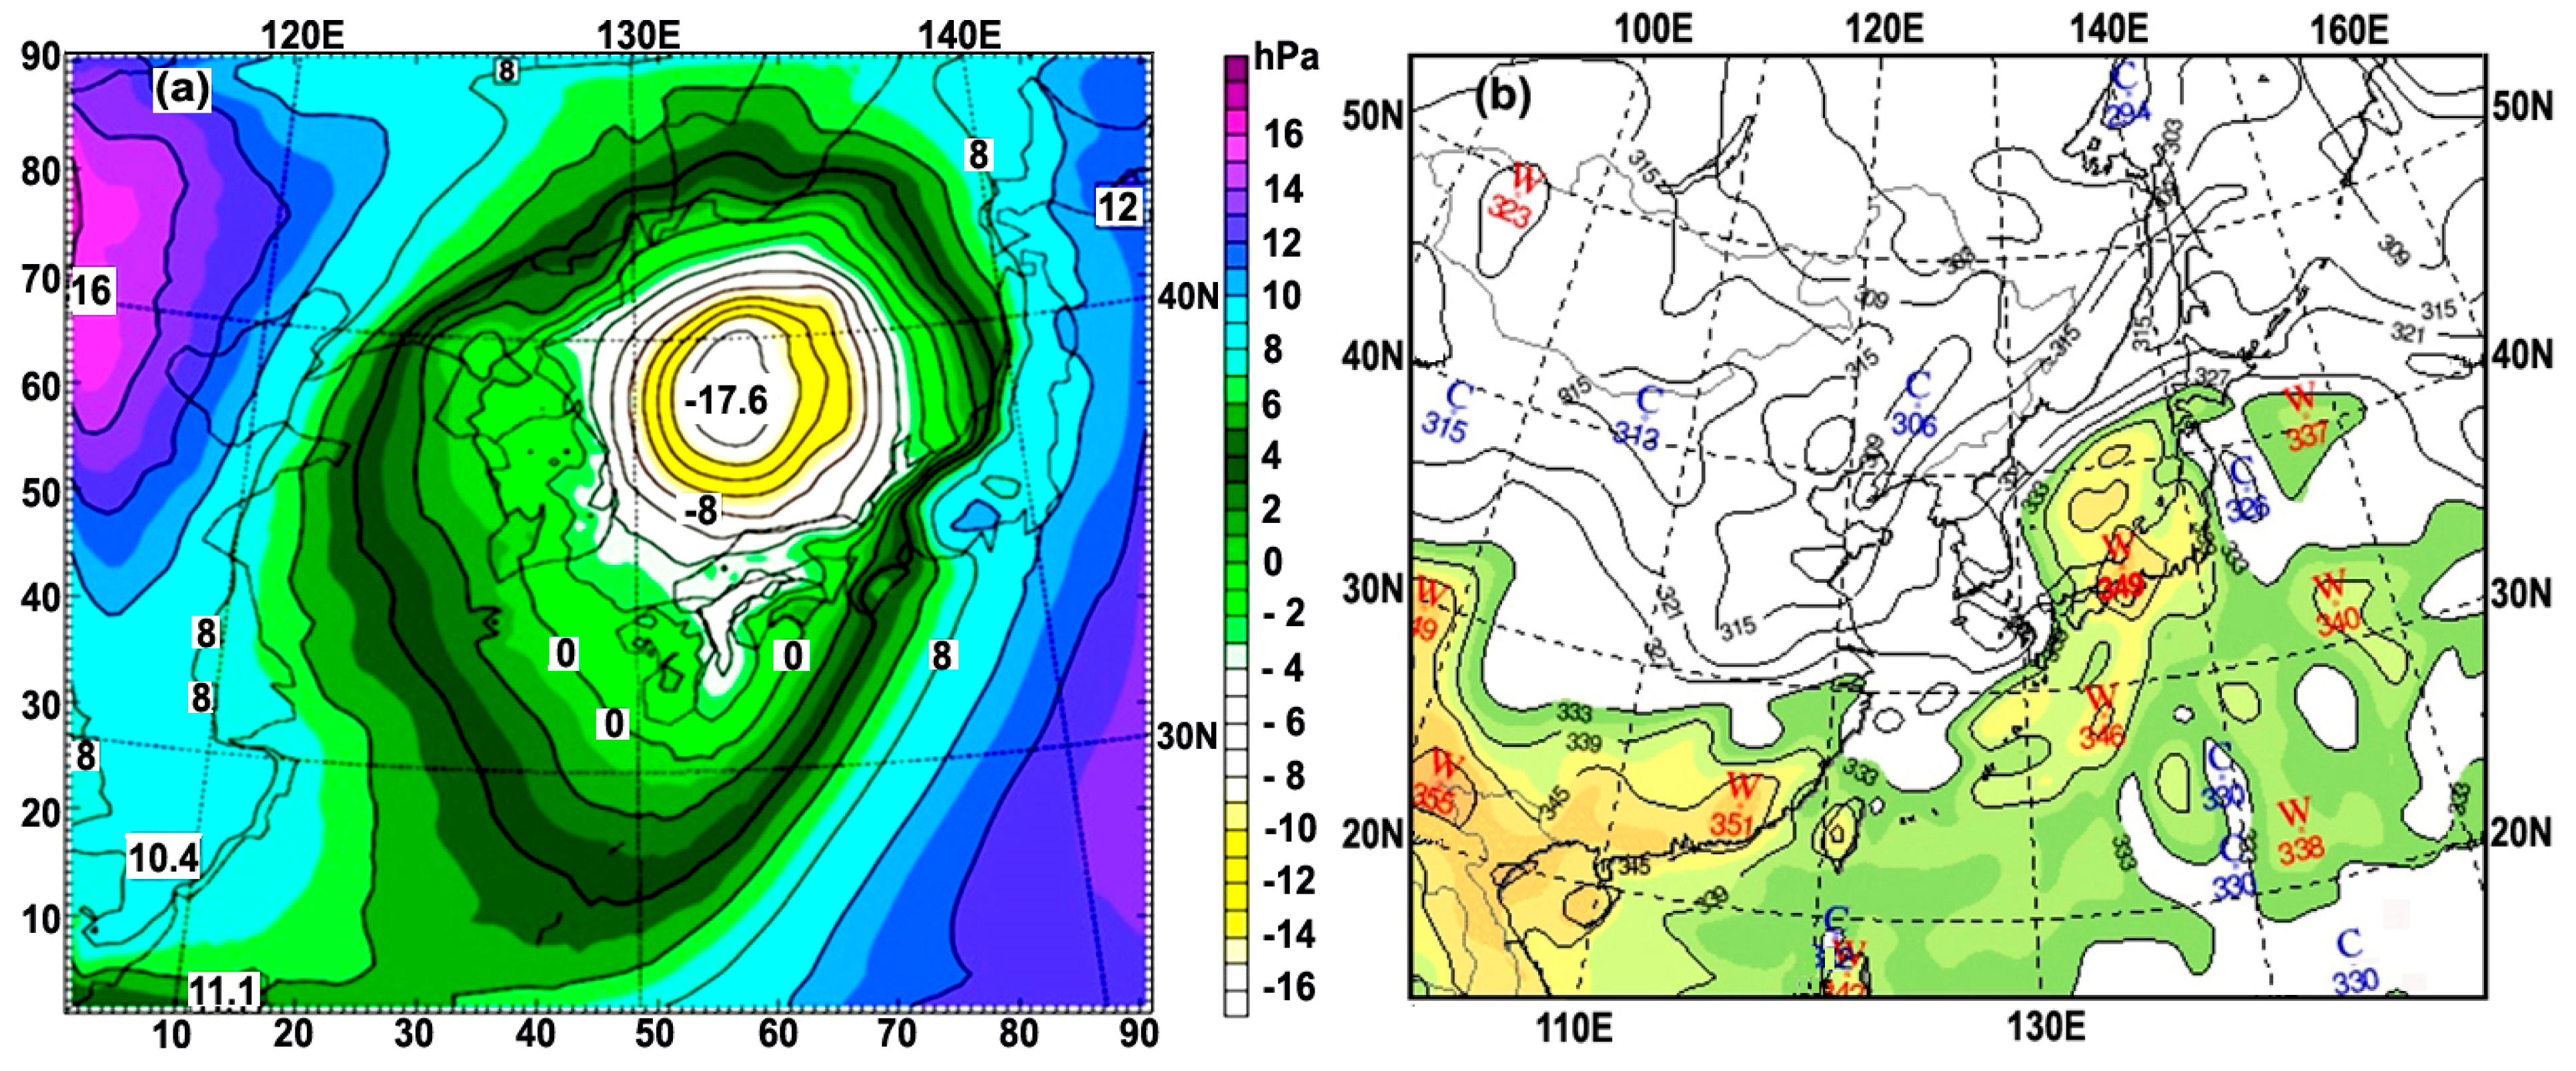
In Figure 17, the deepened negative change in atmospheric pressure with time (isallobar) had from −8.1 hPa/day to −17.6 hPa/day for 12 h at the typhoon center, enhancing the convergence of moist air rising up and causing the formation of large clouds and rain. As the pressure tendency deepens, severe weather like typhoons can develop.
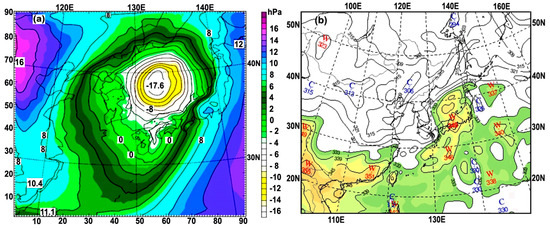
Figure 17.
(a) Surface pressure tendency (hPa/day) at 10 m height based on WRF model simulation; (b) equivalent potential temperature (EPT; K) at a 1.5 km height (850 hPa) based on UM-KMA model simulation at 21:00 LST. The typhoon center corresponds to the area of −17.6 hPa/day and 349 K.
At the same time, the reformed typhoon center was detected at a high equivalent potential temperature (349 K), which contained significant amounts of moisture to be cooled down to form clouds, and the latent heat leased from the cloud could be converted into kinetic energy to induce the intensification of its circulation. The typhoon center in the SJ was closer to the west of Honshu Island, Japan, along which the Tsushima Warm Current had a higher SST than the east of the Korean peninsula, as shown in Figure 1d and Figure 18a–c.

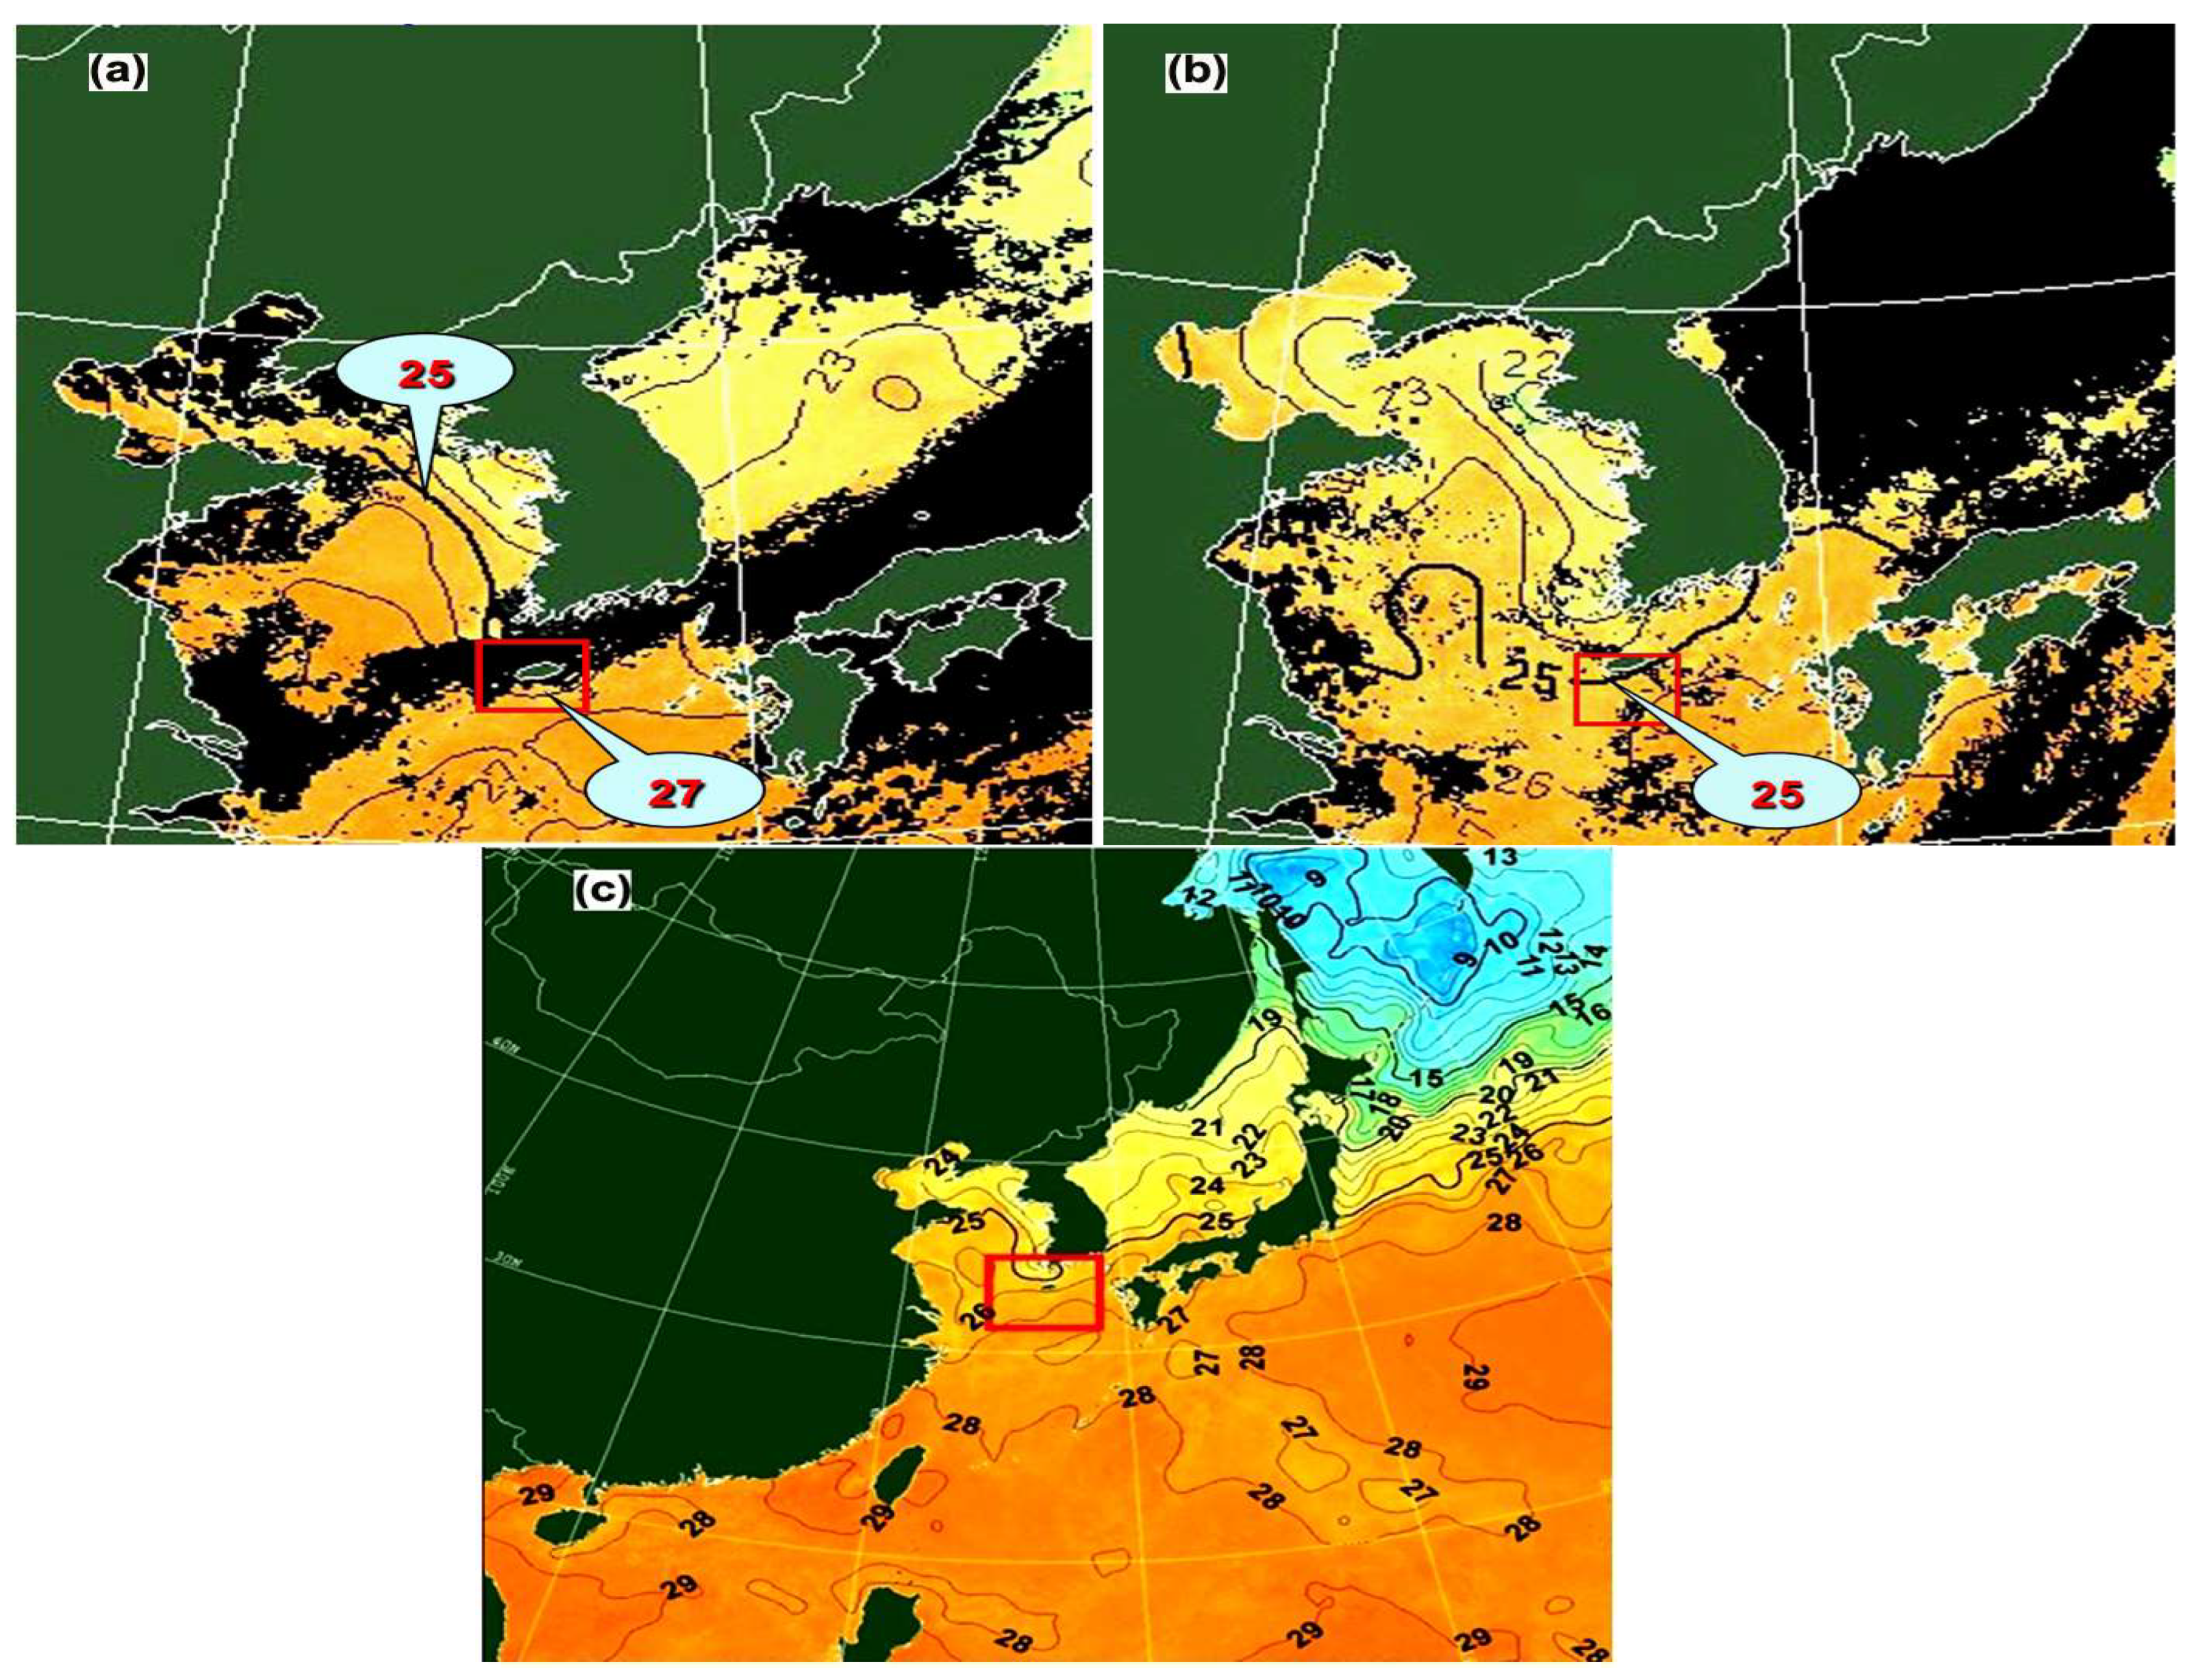
Figure 18.
(a) Daily mean sea surface temperature (SST; °C) (GOES-9 MCSST) near the Korean peninsula on 4 September; (b) 7 September, and (c) weekly mean SST (1 to 7 September). The red square includes Jeju Island. The typhoon center corresponds to 24 °C area near the SJ center, closer to the Tsushima Warm Current in Figure 18c. The northeastward Kuroshio Warm Current flows from the eastern seas of Philippine and Taiwan toward the southern and eastern seas of Japan Island (28 °C) in Figure 18c.
Figure 18 shows the daily and weekly mean sea surface temperatures (SST; °C) in the vicinity of the Korean peninsula on 4 and 7 September. The SSTs on 4 September before Typhoon Songda moved into the Sea of Japan (SJ) were higher than the ones on 7 September after it entered. Typhoon Songda, following the Kuroshio Warm Current and passing by the East China Sea, could be continuously developed until 5 September. In particular, on 7 September, the SSTs in the Yellow Sea and the East China Sea were higher than ones in the SJ, but high SSTs existed in the path of the Tsushima Warm Current in the west coast of Honshu Island, shown in Figure 1c (ocean current map).
Thus, the split typhoon located between the East Korea Warm Current along the eastern coast of Korea and the Tsushima Warm Current along the west coast of Honshu Island could be developed through the thermal convection of moist air parcels, resulting in significant amounts of kinetic energy being converted from latent heat through the cloud condensation process with significant moisture. In Figure 18c, the weekly mean SSTs in the Yellow Sea and the East China Sea from Sept 1 to 7 were higher than ones in the SJ, but the SSTs were near the Tsushima Warm Current flowing along the west coast of Honshu Island compared the northeastern sea of the SJ. Thus, the intensification of the split typhoon in the SJ was greatly attributed to thermal convection over the warm currents, as shown in Figure 1c.
5. Conclusions
In summary, the change in intensity of a split typhoon originating from TY-Songda was investigated in the vicinity of the semi-enclosed Sea of Japan (SJ) using 3D-WRF-3.6.1 and UM-KMA numerical models, GOES-IR satellite images, and sea surface temperature distribution. This research provided the following results.
- (1)
- After the typhoon developed in the Western Pacific Ocean in late August, it moved to the East China Sea along the northward Kuroshio Warm Current. It continuously developed, showing horizontally and vertically asymmetrical wind patterns on 5 September.
- (2)
- As it turned to the northeast to the west of Kyushu Island, Japan on 6 September, it began to weaken, owing to the increased friction due to both the shallower seafloor of the East China Sea and the surrounding topography (China, Korea, and Japan), resulting in a tropical depression.
- (3)
- As the typhoon approached Kyushu Island, it was deformed into three divided wind fields over the Yellow Sea (I), the South Sea near Japan (II), and the SJ (III) near the surface, unique from its circular shape at a 1 km altitude.
- (4)
- As the split typhoon (III) from Typhoon Songda entered the SJ and changed into a small circle-shaped typhoon between the East Korea Warm Current and Tsushima Warm Current, it was located in an area of very high equivalent potential temperature of the air parcel, with significant amounts of kinetic energy being converted from the latent heat released from the cloud condensation process of water vapors evaporated from the warm current surface. The moisture was accompanied by the typhoon itself, from its tail to the SJ and the Russian Sakhalin Island.
- (5)
- The majority of moisture flux and streamline occurred in the right quadrant of the typhoon center, from its tail toward the right of Kyushu Island, Japan, pulling significant moisture via mutual interactions between the cyclonic TY Songda and the anti-cyclonic North Pacific High pressure (H) on 40 N to 20 N.
- (6)
- The significantly deepened atmospheric pressure tendency in the typhoon center can cause a convergence of air, which can induce its ascension, forming large clouds and generating severe weather such as the development of a typhoon.
- (7)
- Simultaneously, as the strong downslope winds from the surrounding high mountains of the SJ into its center were deformed by the Coriolis force to cyclonic winds, the circulation of the split Songda inside the SJ could be intensified until 21:00 LST, 7 September.
Author Contributions
Conceptualization, S.-M.C. and H.C.; methodology, S.-M.C. and H.C.; software, S.-M.C. and H.C.; validation, S.-M.C. and H.C.; formal analysis, S.-M.C. and H.C.; investigation, S.-M.C. and H.C.; resources, S.-M.C. and H.C.; data curation, S.-M.C. and H.C.; writing—original draft preparation, S.-M.C. and H.C.; writing—review and editing, S.-M.C. and H.C.; visualization, S.-M.C. and H.C.; supervision, H.C.; project administration, H.C. All authors have read and agreed to the published version of the manuscript.
Funding
This research received no external funding.
Institutional Review Board Statement
Not applicable.
Informed Consent Statement
Not applicable.
Data Availability Statement
The surface weather charts, satellite images, and auxiliary analysis charts were obtained from the Korean Meteorological Administration: http://www.kma.go.kr (accessed on 10 August 2005).
Acknowledgments
The authors would like to thank the Korean Meteorological Administration for access to the surface weather charts, satellite images, and auxiliary analysis charts.
Conflicts of Interest
The authors declare no conflicts of interest.
References
- Anthes, R.A.; Chang, S.W. Response of the hurricane boundary layer to changes in sea surface temperature in a numerical model. J. Atmos. Sci. 1978, 35, 1240–1255. [Google Scholar] [CrossRef]
- Cheung, T.C.; Chan, P.W. Improving wind and rain simulations for tropical cyclones with the assimilation of Doppler radar data. In Proceeding of the 10th Annual WRF Users’ Workshop, Boulder, CO, USA, 23–26 June 2009; pp. 1–835. [Google Scholar]
- Hong Kong Meteorological Observatory (HKO). Classification of Tropical Cyclones. 2012. Available online: https://www.hko.gov.hk/tc/index.html (accessed on 20 December 2012).
- World Meteorological Organization (WMO). Guidelines for Converting between Various Wind Averaging Periods in Tropical Cyclone Conditions. 2010, pp. 1–63. Available online: https://library.wmo.int/index.php?lvl=notice_display&id=135#.ZDPa33ZByUk (accessed on 20 September 2011).
- Korean Meteorological Administration (KMA). Typhoon. 2003. Available online: https://www.kma.go.kr/neng/typhoon/typhoon-images.do (accessed on 20 September 2005).
- Monaldo, F.M.; Sikora, T.D.; Babin, S.M.; Sterner, R.E. Satellite imagery of sea surface temperature cooling in the wake of Hurricane Edouard. Mon. Weather. Rev. 1997, 125, 2716–2721. [Google Scholar] [CrossRef]
- Cione, J.J.; Uhlhorn, E.W. Sea surface temperature variablilty in hurricanes: Implications with respect to intensity change. Mon. Weather. Rev. 2003, 131, 1783–1796. [Google Scholar] [CrossRef]
- Knauss, J.A.; Garfield, N. Introduction to Physical Oceanography, 2nd ed.; Waveland Press, Inc.: Long Grove, IL, USA, 2005; pp. 1–310. [Google Scholar]
- Gilbes, F.; Armstrong, R.A.; Webb, R.M.T.; Muller-Karger, F.E. SeaWiFs helps assess hurricane impact on phytoplankton in Caribbean Sea, Eos, Transactions. Eos Trans. Am. Geophys. Union 2001, 82, 529–533. [Google Scholar] [CrossRef]
- Babin, S.M.; Carton, J.A.; Dickey, T.D.; Wiggert, J.D. Hurricane-induced phytoplankton blooms in the Sargasso Sea. In Proceeding of the 2002 AGU/ASLO Ocean Sciences Meeting, Honolulu, HI, USA, 11–15 February 2002. [Google Scholar]
- Willoughby, H.E.; Jin, H.L.; Lord, S.J.; Piotrowicz, J.M. Hurricane structure and evolution as simulated by an axisymmetric, non-hydrostatic numerical model. J. Atmos. Sci. 1984, 41, 1169–1186. [Google Scholar] [CrossRef]
- Marks, F.D.; Houze, R.A., Jr.; Gamache, J.F. Dual-aircraft investigation of the inner core of Hurricane Norbert. Part I: Kinematic Structure. J. Atmos. Sci. 1992, 49, 919–942. [Google Scholar] [CrossRef]
- Franklin, J.L.; Lord, S.J.; Marks, F.D., Jr. The kinematic structure of Hurricane Gloria (1985) determined from nested analyses of dropwindsonde and Doppler radar data. Mon. Weather. Rev. 1993, 121, 2433–2451. [Google Scholar] [CrossRef]
- Bender, M.A. The Effect of Relative Flow on the Asymmetric Structure in the Interior of Hurricanes. J. Atmos. Sci. 1997, 54, 703–724. [Google Scholar] [CrossRef]
- Elsner, J.B. Tracking hurricanes. Bull. Am. Meteorol. Soc. 2003, 84, 353–356. [Google Scholar] [CrossRef]
- Jian, G.J.; Wu, C.C. A numerical study of the track deflection of Super typhoon Haitang (2005) prior to its landfall in Taiwan. Mon. Weather. Rev. 2008, 136, 598–615. [Google Scholar] [CrossRef]
- Choi, H.; Lee, M.S.; Choi, S.M. Cold sea surface temperature near Cheju Island responding to strong cyclonic wind cyclonic wind and positive geopotential tendency behind a typhoon center along its track. J. Mar. Sci. Tech. 2012, 20, 684–692. [Google Scholar] [CrossRef]
- Shen, B.W.; Tao, W.K.; Lau, W.K.; Atlas, R. Predicting tropical cyclogenesis with a global mesoscale model: Hierarchical multiscale interactions during the formation of tropical cyclone Nargis (2008). J. Geophys. Res. Atmos. 2010, 115, D14102. [Google Scholar] [CrossRef]
- Xu, H.; Zhang, X.; Xu, X. Impact of Tropical Storm Bopha on the Intensity Change of Super Typhoon Saomai in the 2006 Typhoon Season. Adv. Meteorol. 2013, 2013, 487010. [Google Scholar] [CrossRef]
- Fujiwhara, S. The natural tendency towards symmetry of motion and its application as a principle in meteorology. Q. J. R. Meteorol. Soc. 1921, 47, 287–292. [Google Scholar] [CrossRef]
- Choi, S.-M.; Choi, H. Influence of multiple interactions of three typhoons and a mid-latitude cloud band associated trough in the North West Pacific upon severe tropical storm Linfa. Remote Sens. 2023, 15, 2170. [Google Scholar] [CrossRef]
- Yamasaki, M. A study on the effect of the ice microphysics on tropical cyclones. Adv. Meteorol. 2013, 2013, 573786. [Google Scholar] [CrossRef]
- Bu, Y.P.; Fovell, R.G.; Corbosiero, K.L. The influences of boundary layer and cloud-radiative forcing on tropical cyclone size. J. Atmos. Sci. 2017, 74, 1273–1292. [Google Scholar] [CrossRef]
- Wu, S.-N.; Soden, B.J.; Alaka Jr, G.J. Ice water content as a precursor to tropical cyclone rapid intensification. Geophys. Res. Lett. 2020, 47, 32020GL089669. [Google Scholar] [CrossRef]
- Wu, Z.; Zhang, Y.; Zhnag, L.; Zheng, H. Interaction of cloud dynamics and microphysics during the rapid intensification of super-typhoon Nanmadol (2022) based on multi-satellite observations. Geophys. Res. Lett. 2023, 50, e2023GGL104541. [Google Scholar] [CrossRef]
- Su, H.; Wu, L.; Jiang, J.H.; Pai, R.; Liu, A.; Zhai, A.J.; Tavallali, P.; DeMaria, M. Applying satellite observations of tropical cyclone internal structure to rapid intensification forecast with machine learning. Geophys. Res. Lett. 2020, 47, e2020GL089102. [Google Scholar] [CrossRef]
- Tapiador, F.J.; Navarro, A.; Martin, R.; Hristova-Veleva, S.; Haddad, Z. Predicting tropical cyclone rapid intensification from satellite microwave data and neural networks. IEEE Trans. Geosci. Remote Sens. 2021, 60, 4205213. [Google Scholar] [CrossRef]
- Bruneau, N.; Wang, S.; Toumi, R. Long memory impact of ocean mesoscale temperature anomalies on tropical cyclone size. Geophys. Res. Lett. 2020, 47, e2019GL086165. [Google Scholar] [CrossRef]
- American Meteorological Society (AMS). Equivalent Potential Temperature. AMS Glossary of Meteorology. 2020. Available online: https://glossary.ametsoc.org/wiki/Equivalent_potential_temperature (accessed on 3 November 2020).
- Tamamadin, M.; Lee, C.; Kee, S.-H.; Yee, J.-J. Prediction of convective available potential energy and equivalent potential temperature using a coupled WRF and deep learning for typhoon intensification. IOP Conf. Ser. Earth Environ. Sci. 2023, 1245, 012034. [Google Scholar] [CrossRef]
- Lee, S.W. Introduction to Physical Oceanography; Jipmoondang Company: Seoul, Republic of Korea, 1983; pp. 1–268. [Google Scholar]
- WRF-3.6.1. User’s Guide for the Advanced Research WRF (ARW) Modeling System, Version 3.6.1. 2014. Available online: https://www2.mmm.ucar.edu/wrf/users/docs/user_guide_V3/user_guide_V3.6/contents.html (accessed on 1 January 2020).
- National Centers for Environmental Prediction/National Weather Service/NOAA/U.S. Department of Commerce. 2000, Updated Daily. NCEP FNL Operational Model Global Tropospheric Analyses, Continuing from July 1999. Research Data Archive at the National Center for Atmospheric Research, Computational and Information Systems Laboratory. Available online: https://rda.ucar.edu/datasets/d083002/ (accessed on 16 September 2021).
- UM-KMA. The British Unified Model (UM) Adopted by Korean Meteorological Administration. 2015. Available online: https://www.kma.go.kr/neng/image/chart/analysis-chart.do (accessed on 20 September 2020).
- Hesselberg, T. Uber eine Beziehung zwischen Druckgradient, Wind und Gradienanderungen. Veroeff. Geophys. Inst. Univ. Leipzig 1915, 1, 207–216. [Google Scholar]
- Brunt, D.; Douglas, C.K.M. The modification of the strophic balance for changing pressure distribution and its effect on rainfall. Mem. Roy. Meteorol. Soc. 1928, 3, 29–51. [Google Scholar]
- Haurwitz, B. Dynamic Meteorology; McGraw Hill Book Company, Inc.: New York, NY, USA, 1941; pp. 155–159. [Google Scholar]
- Gill, A.E. Atmosphere-Ocean Dynamics; Academic Press: New York, NY, USA, 1982; pp. 1–662. [Google Scholar]
- Choi, H. Prediction of marine surface wind and sea surface elevation in the East Sea of Korea. J. Kor. Meteorol. Soc. 1996, 32, 71–83. [Google Scholar]
- American Meteorological Society (AMS). Isallobaric Wind. AMS Glossary of Meteorology. 2012. Available online: https://glossary.ametsoc.org/wiki/Isallobaric_wind (accessed on 5 August 2014).


Disclaimer/Publisher’s Note: The statements, opinions and data contained in all publications are solely those of the individual author(s) and contributor(s) and not of MDPI and/or the editor(s). MDPI and/or the editor(s) disclaim responsibility for any injury to people or property resulting from any ideas, methods, instructions or products referred to in the content. |
© 2024 by the authors. Licensee MDPI, Basel, Switzerland. This article is an open access article distributed under the terms and conditions of the Creative Commons Attribution (CC BY) license (https://creativecommons.org/licenses/by/4.0/).