Article

Temporal Scales of Mass Wasting Sedimentation across the Mississippi River Delta Front Delineated by 210Pb/137Cs Geochronology

by
Jeffrey Duxbury
1,2,*,
Samuel J. Bentley
1,2,
Kehui Xu
2,3 and
Navid H. Jafari
2,4
1
Department of Geology and Geophysics, Louisiana State University, Baton Rouge, LA 70803, USA
2
Coastal Studies Institute, Louisiana State University, Baton Rouge, LA 70803, USA
3
Department of Oceanography and Coastal Studies, Louisiana State University, Baton Rouge, LA 70803, USA
4
Department of Civil and Environmental Engineering, Louisiana State University, Baton Rouge, LA 70803, USA
*
Author to whom correspondence should be addressed.
J. Mar. Sci. Eng. 2024, 12(9), 1644; https://doi.org/10.3390/jmse12091644
Submission received: 1 August 2024 / Revised: 21 August 2024 / Accepted: 22 August 2024 / Published: 13 September 2024

Abstract

:
The Mississippi River Delta Front (MRDF) is a subaqueous apron of rapidly deposited and weakly consolidated sediment extending from the subaerial portions of the Birdsfoot Delta of the Mississippi River, long characterized by mass-wasting sediment transport. Four (4) depositional environments dominate regionally (an undisturbed topset apron, mudflow gully, mudflow lobe, and prodelta), centering around mudflow distribution initiated by a variety of factors (hurricanes, storms, and fluid pressure). To better understand the spatiotemporal scales of the events as well as the controlling processes, eight cores (5.8–8.0 m long) taken offshore from the South Pass (SP) and the Southwest Pass (SWP) were analyzed for gamma density, grain size, sediment fabric (X-radiography), and geochronology (210Pb/137Cs radionuclides). Previous work has focused on the deposition of individual passes and has been restricted to <3 m core penetration, limiting its geochronologic completeness. Building on other recent studies, within the mudflow gully and lobe cores, the homogeneous stepped profiles of 210Pb activities and the corresponding decreased gamma density indicate the presence of gravity-driven mass failures. 210Pb/137Cs indicates that gully sedimentary sediment accumulation since 1953 is greater than 580 cm (sediment accumulation rate [SAR] of 12.8 cm/y) in the southwest pass site, and a lower SAR of the South Pass gully sites (2.6 cm/y). This study shows that (1) recent dated mudflow deposits are identifiable in both the SWP and SP; (2) SWP mudflows have return periods of 10.7 y, six times more frequent than at the SP (66.7 y); (3) 210Pb inventories display higher levels in the SWP area, with the highest focusing factors in proximal/gully sedimentation, and (4) submarine landslides in both study areas remain important for sediment transport despite the differences in sediment delivery and discharge source proximity.
1. Introduction

1.1. The Mississippi River Delta Front (MRDF)

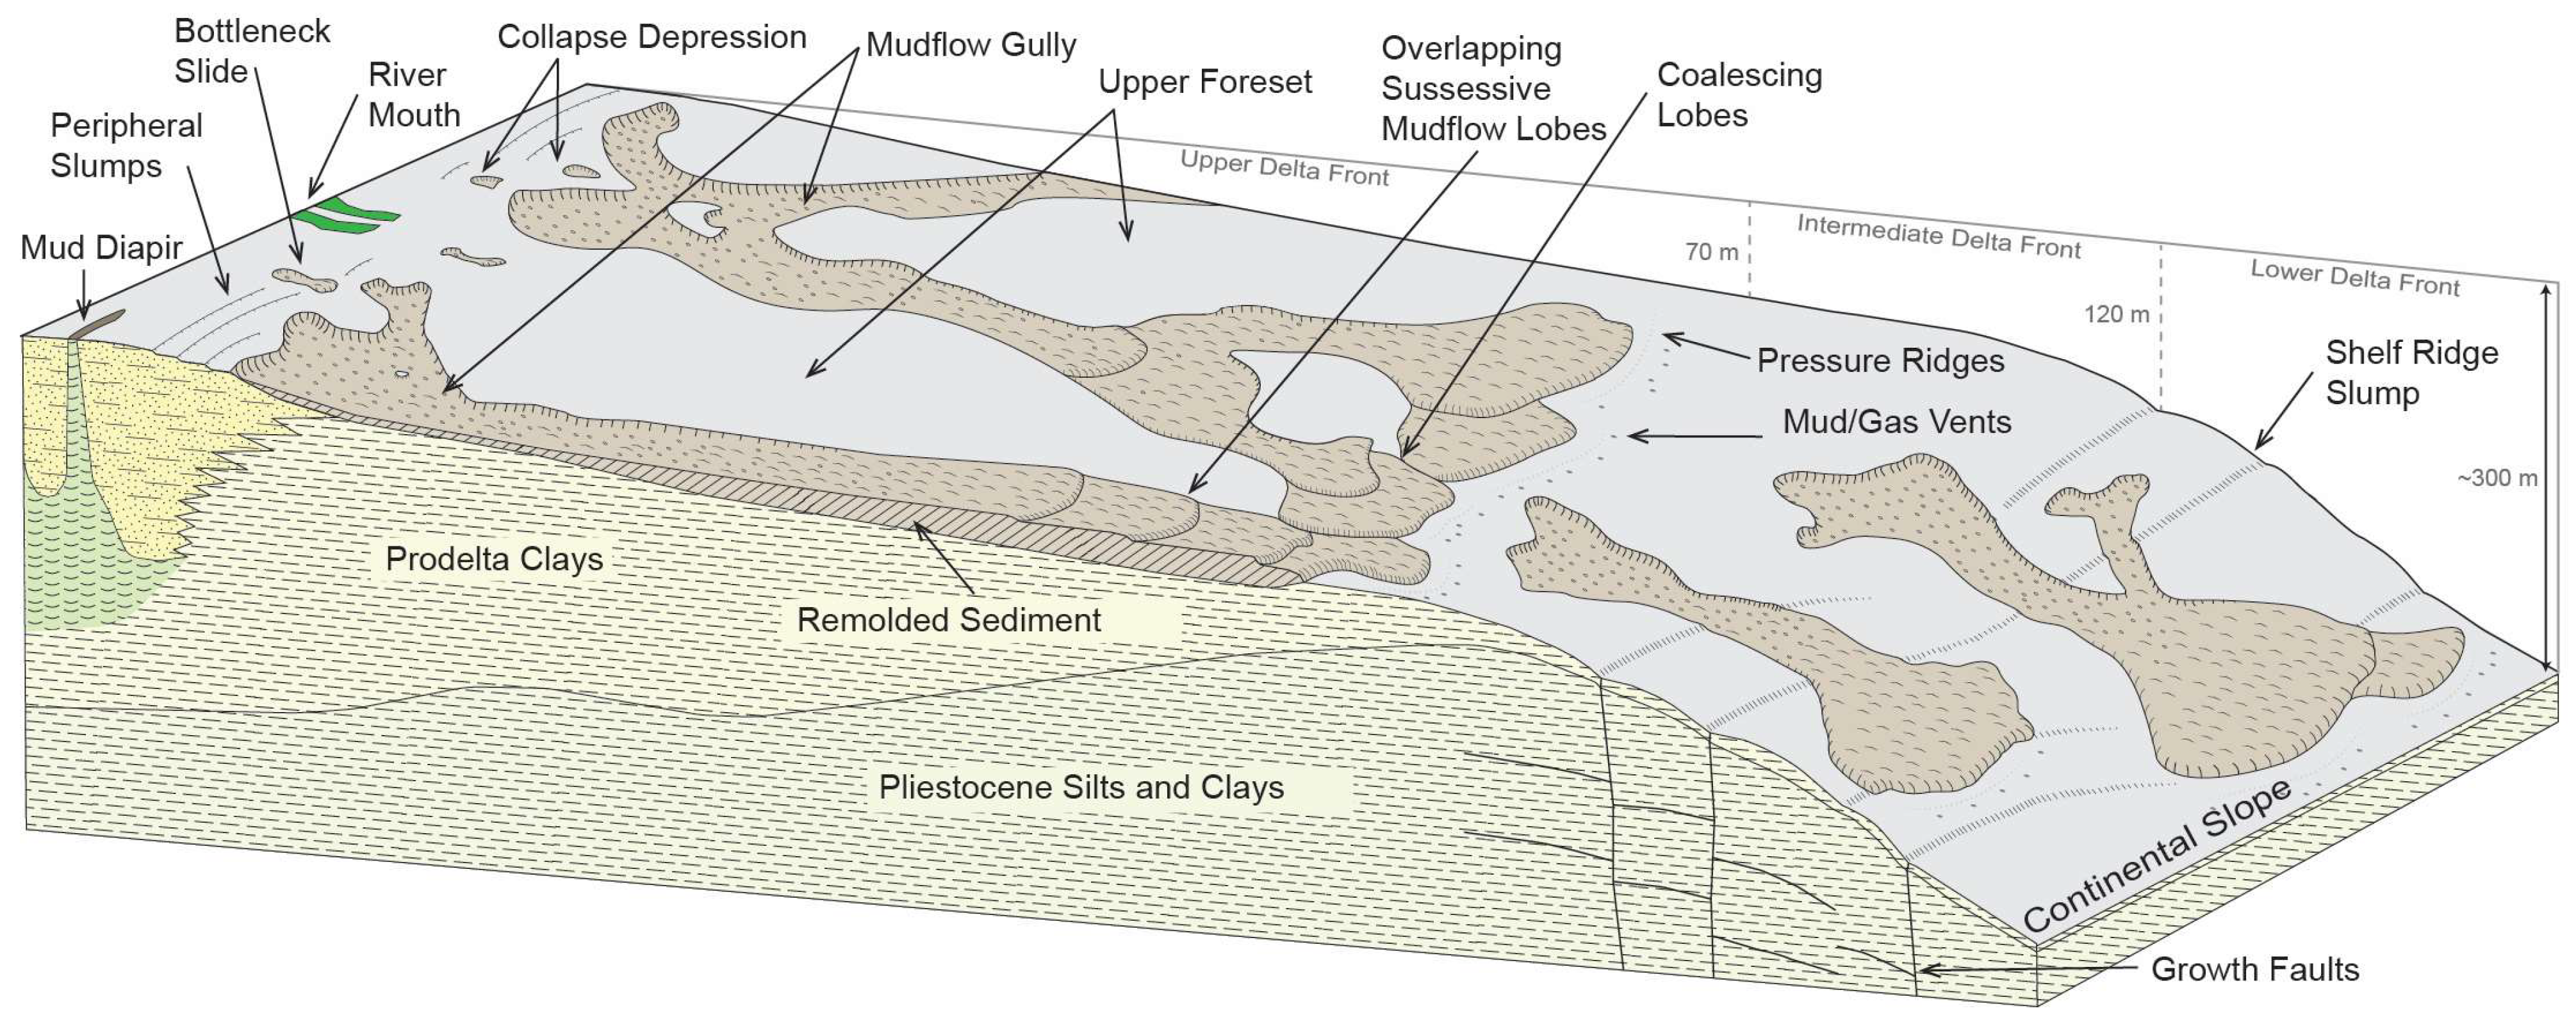
The Mississippi River Delta Front (MRDF) is a subaqueous apron of fine sediments extending offshore from the subaerial Birdsfoot Delta of the Mississippi River. It is characterized by deeply channeled gullies cutting though rapidly deposited, poorly consolidated silts and clays. Gravity-driven sediment discharge from the gullies coalesces downslope into large sediment lobes [1,2,3] (Figure 1). The MRDF, like many other fine-grained subaqueous clinothems that form in conjunction with river-dominated deltas, owes its significant source-to-sink sediment movement to subaqueous landslides in addition to more widely recognized sedimentation from river plumes (Figure 2). Such gravity-driven flows operating on subaqueous deltas can transport massive amounts of sediment in a short period of time, up to 40% of the total sediment transport [4,5]). The mudflows of the MRDF are characterized as gravity-driven mass movements supported internally by the strength of the matrix, creating a soft solid in which no deformation takes place until a specified threshold of shear stress is applied [6,7]. These flows are supported by their own poorly sorted mud/fluid matrix with sediment concentrations sufficient to prevent the hydrodynamic sorting and stratification of sediments, compared to more fluid and less viscous subaqueous mass transport phenomena such as turbidity currents. However, this cohesion is not enough to prevent downslope flow, even in very low slope environments such as the areas of the MRDF at 0.5–1.5° [8].
The interacting processes of hydrodynamic sediment transport (including initial plume sedimentation and subsequent wave–current reworking) and gravity-driven sediment transport produce four distinct depositional environments within the MRDF (after [1]): (1) an undisturbed topset apron incised by (2) mudflow gullies forming channels (negative relief) acting as conduits of sediment downslope, (3) feeding mudflow lobes with positive relief that coalesces from the gully outflow, and (4) the prodelta extending beyond the runout of mass-transport deposits (Figure 2). Within the undisturbed topset, collapse depressions and bottleneck slides may develop as the initial stages of sediment failure (Figure 2), leading to gullies and lobes downsloping. Stratigraphy within the mudflow gullies extending into the corresponding lobes shows convolute and irregular bedding with visible unconformities at the base of event layers, in contrast to the neighboring undisturbed and prodelta environments in which hydrodynamic sorting produces mostly horizontal strata that are faintly bedded and deposited from hypopycnal river plumes [2,9]. These depositional environments are described in more detail below.
The proximal nature of these failures to the coastline (≤20 km of the coast) put them in the vicinity of the economically critical petroleum industry substructure, including pipelines and platforms, producing significant threats to infrastructure and ecosystems, as seen in the Taylor Platform collapse in 2006. Although previous research has been conducted on large mudflows driven by major hurricanes [10,11,12], recent research has shown that movement also occurs with less powerful forces on annual timescales [8]. However, within the MRDF, relatively little is known regarding the more frequent, less massive mudflows (0.5–3 m thick) and their triggering mechanisms. The major goal of this study was to constrain the return periods of gravity-driven mudflows temporally and spatially within the MRDF, through the combined application of geological and geochronological core analysis within a well-defined geomorphic framework based on recent geoacoustic mapping [3,13].
Figure 2. Delta front seafloor diagram (adapted from Coleman et al. 1980 [1]) outlining major morphological features of the study sites. Upper, intermediate, and lower zones of the environment range from 20 to 300 m in depth and feature incising gullies coalescing into mudflow lobes downslope overlying earlier, Holocene-aged deposits [14].
Jmse 12 01644 g002

1.2. Background

1.2.1. Depositional Setting

The Mississippi River drains over one third of the continental United States, covering over 4,817,000 km2, draining from six (6) major tributary rivers and flowing into the Mississippi River Delta on the northern margins of the Gulf of Mexico [15,16]. The currently active shelf–delta complex (referred to as the Balize and also the Birdsfoot Delta) forms the only true shelf delta in the world [4], with three major outlets at the southern terminus (Southwest Pass (SWP), South Pass (SP), and Pass a Loutre (PL)) (Figure 1), and other exits farther upstream. The SWP and SP are the focal areas for this study. The SWP encompasses the majority of the fluvial discharge/sediment load (43 × 1010 m3/y, 20.8 × 10⁶ tons/y, as well as being the primary marine transport route for ports from New Orleans to St. Louis and navigable upstream tributaries [17]. The South Pass and Pass a Loutre have more modest water and sediment discharges (14.3 × 10¹⁰ m3/y, 46.9 × 10⁶ tons/y for the SW and 12.9 × 10¹⁰ m3/y, 47.8 × 10⁶ tons/y for the PL) and are not navigable for large vessels [17]. Twelve additional passes exist north of the Head of Passes, with a total discharge comparable to the combined flows of the SWP, SP, and PL [16,17,18]. During the last several decades, the subaqueous Birdsfoot Delta has begun to retreat, reversing centuries of seaward progradation; this shift is attributed to the increasing relative sea level and anthropogenic alteration, which reduced the sediment load to these passes [15,18].

1.2.2. Sediment Failure

One of the primary environmental preconditions for mudflow initiation is the rapid deposition of poorly consolidated, fine-grained sediment [19]. These under-consolidated sediments have low yield stresses, increasing their susceptibility to gravity flow initiation. The structure within a mudflow that extends out into (in the case of the Mississippi Delta) coalescing mudflow lobes is composed of two distinct zones within the flow, with a shear zone at the base and a plug zone in the larger slides [4]. The basal shear area (cm scale) is dominated by a frictional interaction with the underlying sediment. As a result, it manifests in a deformed and sheared sediment package that undergoes decreasing shear stress with increasing distance from the detachment plane. The plug zone is present where the shear stress is lower than the yield stress, minimizing deformation [7]. As displayed in Figure 2 [1,20], mass wasting is a primary mover of sediment downslope via mud flows within the delta front [13].
The MRDF system, described in more detail below, follows a series of factors that drive this system of gravity-driven accumulation to destabilization, triggering, and collapse [4,12],
  • Fine sediment is transported seaward by river plumes with highest discharge at the SWP (20.8 Mt/y), and less so from the SP (4.7 Mt/y) and PL (4.8 Mt/y) [17]; this produces rapid sedimentation from plumes offshore of the river mouth, in spite of the historically declining sediment discharge overall [20]. Sediment deposits appear homogenous to finely stratified, and are comprised mostly of clay and silt, except for the uncommon sand-rich beds associated with layers from a hurricane event [21,22,23];
  • Underconsolidated fine-grained deposits commonly develop excess fluid pressure, preconditioning sediments to slope failure [4,24];
  • Biogenic gas is produced by the decay of sedimentary organic matter and collects within the sediment, further increasing the excess fluid pressure and slope failure preconditioning [8,25,26];
  • Storm-generated surface gravity wave events create cyclic loading of the seabed at depths shallower than the wave base, which varies according to the height and period of the wave. Cyclic loading causes both compression and dilation of free gas where present [25], producing direct lateral pressure gradients between the wave crests and troughs [25]. Historically, most research on mass transport initiation has focused on waves generated by tropical cyclones studied in response to a loss of oil platforms and pipelines [15]. Recent work [8,13] shows that mass transport also occurs in the absence of hurricanes, although direct measurements of seabed motion are deficient [12,19,22,24,27].

1.2.3. Delta Front Morphology

The region defined as the MRDF (Figure 1) is a subaqueous clinothem incised by submarine gullies from which coalescing flows form distinct sediment lobes. We define the specific depositional environments as the undisturbed topset apron, mudflow gully, mudflow lobe, and prodelta (Figure 2) [1,21,28,29,30].
The undisturbed topset apron (und) setting is comprised of fine sediments deposited from river plume sedimentation relatively close to the river mouth, which do not show evidence of mass transport failure. These strata are similar in morphology to conventional proximal subaqueous deltaic clinothems [31]. The stratigraphy in these deposits is generally characterized by horizontally bedded strata deposited from river plumes and wave–current reworking [1,23].
The mudflow gully (mg) setting is comprised of gullies incised up to ~20 m deep, extending up to ~10 km from the failure initiation [1,2,4,32]. Flows within the gullies can contain discrete blocks of muddy sediment that have been shown to flow at rates of 5–25 m/y [13].
Mudflows exiting gullies may coalesce into mudflow lobes (ml) that exhibit positive topographic relief >10 m above the ambient seafloor. Lobe sediments show similar internal stratigraphy to mudflow gullies and contain homogeneous to faintly layered/contorted bedding, with rafted relict bedding transported from upslope [1,19,23].
Some lobes terminate on the prodelta (pro), comprised of distal near-horizontal layers deposited from distal river plumes, analogous to clinothem bottomset beds [31,32] (Figure 1). Prodelta deposits are predominantly bioturbated clay and fine silt, with larger scale stratification evident in the high-frequency sub-bottom seismic profiles [13,25,33,34].
Previous research focuses on the specific SAR at offshore of the SP, limited to cores <3 m deep [2,21,32] or to regional bathymetry/sediment distribution trends [8,14,31]. The overall goal of this study was to develop a budget for the sedimentary contributions of different depositional/sediment transport processes that create the sediment accumulating on the MRDF, including the plume sedimentation, hydrodynamic event-layer formation, and mass-transport processes. This will be achieved using ~5–9 m cores covering both the SWP and SP study areas to create a regional depositional assessment. We hypothesize that each type of deposit can be recognized from an analysis of gamma (bulk) density, sedimentary fabric, and radioisotope distribution, allowing the development of a budget reflecting the contributions from each process.

2. Materials and Methods

2.1. Field Work/Core Processing

The eight piston cores analyzed here are from set of 28 piston cores (length 5.8–8.6 m) collected from the R/V Point Sur in 2017 off the SW, S, and PL outlets of the MRDF. The core sites were selected based on the sub-bottom and bathymetric mapping by the 2017 United States Geological Survey [3,13] to encompass regional seabed variations and depositional settings described above near the SWP and SP (undisturbed topset apron, mudflow gully, lobe, and prodelta). The sediment cores were returned to LSU, logged using a Geotek Multi-Sensor Core Logger (MSCL), then refrigerated until splitting. The cores for this study were split longitudinally into working and archive halves. The working halves were then subsampled at 6 or 12 cm increments for grain size and radiochemical analyses. Coarser sampling was used for the cores showing less variability in the properties analyzed below. The archive halves were imaged X-radiographically.

2.2. Gamma Density/Porosity

The Geotek MSCL (Geotek Ltd., Daventry, UK) was utilized to obtain the gamma density and porosity profiles on the whole sediment cores (Figure 3). Strong local variations in the density observed in a core could correlate to the variations in grain size, as well as the degree of consolidation [35]. The porosity can be utilized to derive the fluid pressure, which is a geotechnically useful metric for characterizing failure [36,37].

2.3. Grain Size

Small samples (0.5–1 cm3) of wet sediment were sieved through 1 mm mesh to remove large organic material and deflocculated using a 0.05% sodium metaphosphate solution. Fine organics were then removed via hydrogen peroxide digestion. Sample grain size was then measured with a Beckman-Coulter LS13-320 (Danaher Corporation, Washington DC, USA) laser diffraction particle size analyzer, shown here as profiles of mean grain size and plotted with the standard deviation (Figure 3).

2.4. X-Radiographic Imaging

X-radiography was used to analyze the core stratigraphy and sedimentary fabric. Images were captured using a Samsung Model SP501 detector (Samsung, Seoul, Republic of Korea) panel illuminated with a Min-X-ray HF-8015+dlp X-ray generator (MTM Medical Tronik, Laval, QC, Canada). An aluminum compensator plate a with parabolic cross-section [38] was used to balance the exposure in semi-cylindrical core sections. ImageJ ver. 1.32® was used for subsequent image processing and visualization. Images were scaled to show the high-density sedimentary strata in dark shades (examples include coarse-grained beds and more consolidated sediments with lower porosity), while the lower density portions (including high porosity mud, open burrows, and gas voids) appear in light shades. (Figure 4). The areas of interest determined by radionuclide and gamma density testing were imaged accordingly. X-radiography aided in the recognition of unique sedimentary fabrics by their depositional setting and the identification of diagnostic structures in the mudflow strata.

2.5. Radionuclide Analysis

Chronostratigraphic control in this study was provided by 210Pb/137Cs geochronology via gamma-ray spectrometry, widely used in the study of fine-grained aquatic sediments [39,40,41,42,43,44,45,46,47]. All samples were analyzed with Canberra/Mirion germanium detectors with detector surface areas of 3800 mm2 and thicknesses of 25 mm. All activities were reported in units of decay per minute (dpm), for which 60 Bq = 1 dpm, with uncertainty represented as counting errors propagated through calculations (Figure 5). Each sample was counted for 24 h, which restricted our ability to analyze at higher spatial resolution in the cores due to the time involved for further analyses.
137Cs is generated through nuclear fission of 235U and has a half-life of 30.08 years. The presence of 137Cs in sediment can be used to identify sediments deposited more recently than the year 1953 (the beginning of hydrogen bomb atmospheric testing) [48,49]. In some settings, an additional marker for peak activity of 137Cs in the year 1963 can be identified (when atmospheric bomb testing was most extensive), but no such peaks were evident in our data. The activities of 137Cs were measured using the 661 KeV gamma peak for this radioisotope, with a detection limit of 0.05 dpm/g.
210Pb is a part of the decay series of 238U and is found naturally within sediments worldwide. 210Pb has a half-life of 22.3 years, and due to natural radioactive decay it can be utilized to reliably study depositional rates over ~five half-lives or ~110 years. 210Pb’s parent isotope, 222Rn, is created by the decay of 226Ra, which is the daughter isotope of 238U. 210Pb in sediment is derived from two separate sources, supported and unsupported (or excess) 210Pb. Supported 210Pb is generated continuously within mineral grains from U-series decay. 222Rn decay in the atmosphere or in aquatic environment yields another 210Pb source which can adsorb onto particle surfaces, referred to as “excess” [40], which is used for this geochronological approach. Total 210Pb activity (the sum of excess and supported activity) is measured here by gamma spectrometric analysis of the 46.5 KeV peak for 210Pb, accounting for gamma photon self-absorption using the transmission method [50], and excess activity is determined by subtracting the supported activity (estimated from activity of 214Bi and 214Pb grandparents) from total the activity. Depth profiles of excess 210Pb were produced, and SARs were calculated via nonlinear regression, utilizing Sigmaplot © and Equation (1) [51,52].
A z = A 0 e S λ z
where A(z) is the activity at the given depth z (dpm/g), A(0) is the sediment surface activity (dpm/g), S the sediment accumulation rate (SAR), and λ is the decay constant of 210Pb 0.0331 (y–1). For both 137Cs and 210Pb, bioturbation can play a role in shaping the sediment profiles where the depth of bioturbation is of a comparable order to the penetration depth of 137Cs or 210Pb [51]. In this study, both radioisotopes are found at much greater depths (meters) than the depth of bioturbation (centimeters), so the effects of bioturbation can be ignored for core-averaged SARs (Equation (2)).
Excess 210Pb inventories (dpm cm−2) for each core are calculated from
I = Σ𝜌s Δz (1 − φ) Ai
where I is the inventory (dpm/cm2), ρs is the mineral density (2.7 g/cm3), ∆z is the layer thickness (cm) of the measured section (12 cm), φ is the porosity (0–1, dimensionless), and A is the excess 210Pb activity of the sample (dpm/g) [52]. For some SWP cores, excess 210Pb activity extends to the base of the core, so those inventories have minimum values. Theoretical sediment inventories were calculated for each core location, based on the estimated 210Pb flux from the water column [53,54] and the atmosphere in Tampa, FL and Galveston, TX [55]. A focusing factor can then be calculated from
R = I/IIT
where I is the isotope inventory observed, IIT is the calculated theoretical inventory, and the output (F) is the focusing factor [21,52]. A value of F > 1 indicates sediment focusing, and F < 1 suggests some combination of sediment erosion or bypass.

2.6. Multibeam Bathymetry and CHIRP Seismic Profiles

Multibeam bathymetry (Figure 1) and CHIRP shallow seismic profiles from 2017 (Figure 6) are used here for additional geomorphic and stratigraphic characterization [3,13]. Preliminary versions of these data were made available to the authors of this study prior to the 2017 core collection to target the core locations. Vertical penetration in selected lines ranged from 20 to 30 m below the seabed, with sub-meter vertical resolution. Profiles from Baldwin et al. (2018) [3] were visualized using Petrel™ (v. 2023). Line references were obtained from GPS coordinates from both seismic track lines and selected for the core sites (Figure 6).

3. Results

3.1. Physical Properties (Gamma Density/Porosity)

Figure 3 displays the piston core gamma density profiles for the SWP and SP, organized by depositional environment. Whole-core gamma density averages varied by 0.14 g/cm3 (Table 1) and all values ranged between 1.0 and 2.0 g/cm3. Overall, the gamma density profiles are characterized by cm-scale sawtooth variations on the order of 0.1 g/cm3. Decimeter-to-meter-scale density variations occur as both gradual downward increases (uppermost meter of PS-17-07 and PS17-24), stair step downward increases (PS17-06 near 350 cm depth), and decreases (PS17-06 near 200 cm depth and PS17-38 near 350 cm depth). A more detailed core-by-core review of the combined gamma density, grain size, and 210Pb/137Cs geochronology is provided below. The porosity (Figure 3) displays whole core averages which broadly vary by 0.16 (Table 1), with all values ranging between 0.61 and 0.77. Profiles display cm-scale sawtooth variation with dm- to m-scale variations reciprocal to the gamma density.
Lower porosity was observed in the PS17-38 prodelta core (0.61) and when removed, the lower extreme reduces the variability in the remaining cores to 0.08.

3.2. Grain Size Analysis

The grain size profiles (Figure 3) and the Table 1 summary show sediments with a mean grain size of ~6–8 ɸ, which are slightly coarser (near 7 ɸ, PS17-03) in shallow water near the SWP and slightly finer (near 8 ɸ, PS17-38) in the deeper water off the SP. Centimeter-scale coarsening of <0.5 ɸ occured in all cores, sometimes coinciding with the cm-scale increases in gamma density in the SWP (upper 100 cm of PS17-03 and PS17-09) and once in the SP (around 150 cm PS17-24). However, the sampling resolution for grain size is coarser (6–12 cm) than that of gamma density (1 cm), limiting bed-by-bed comparisons. These variations peak at approximately 5.5 ɸ and include some very fine sand. However, the overall values in the remainder of the cores do not exceed the 6.5–8.5 ɸ range and the overall averages vary between 6.9–7.9 ɸ (∆1.2 ɸ), split between fine to very fine silt and clay.

3.3. X-Radiography

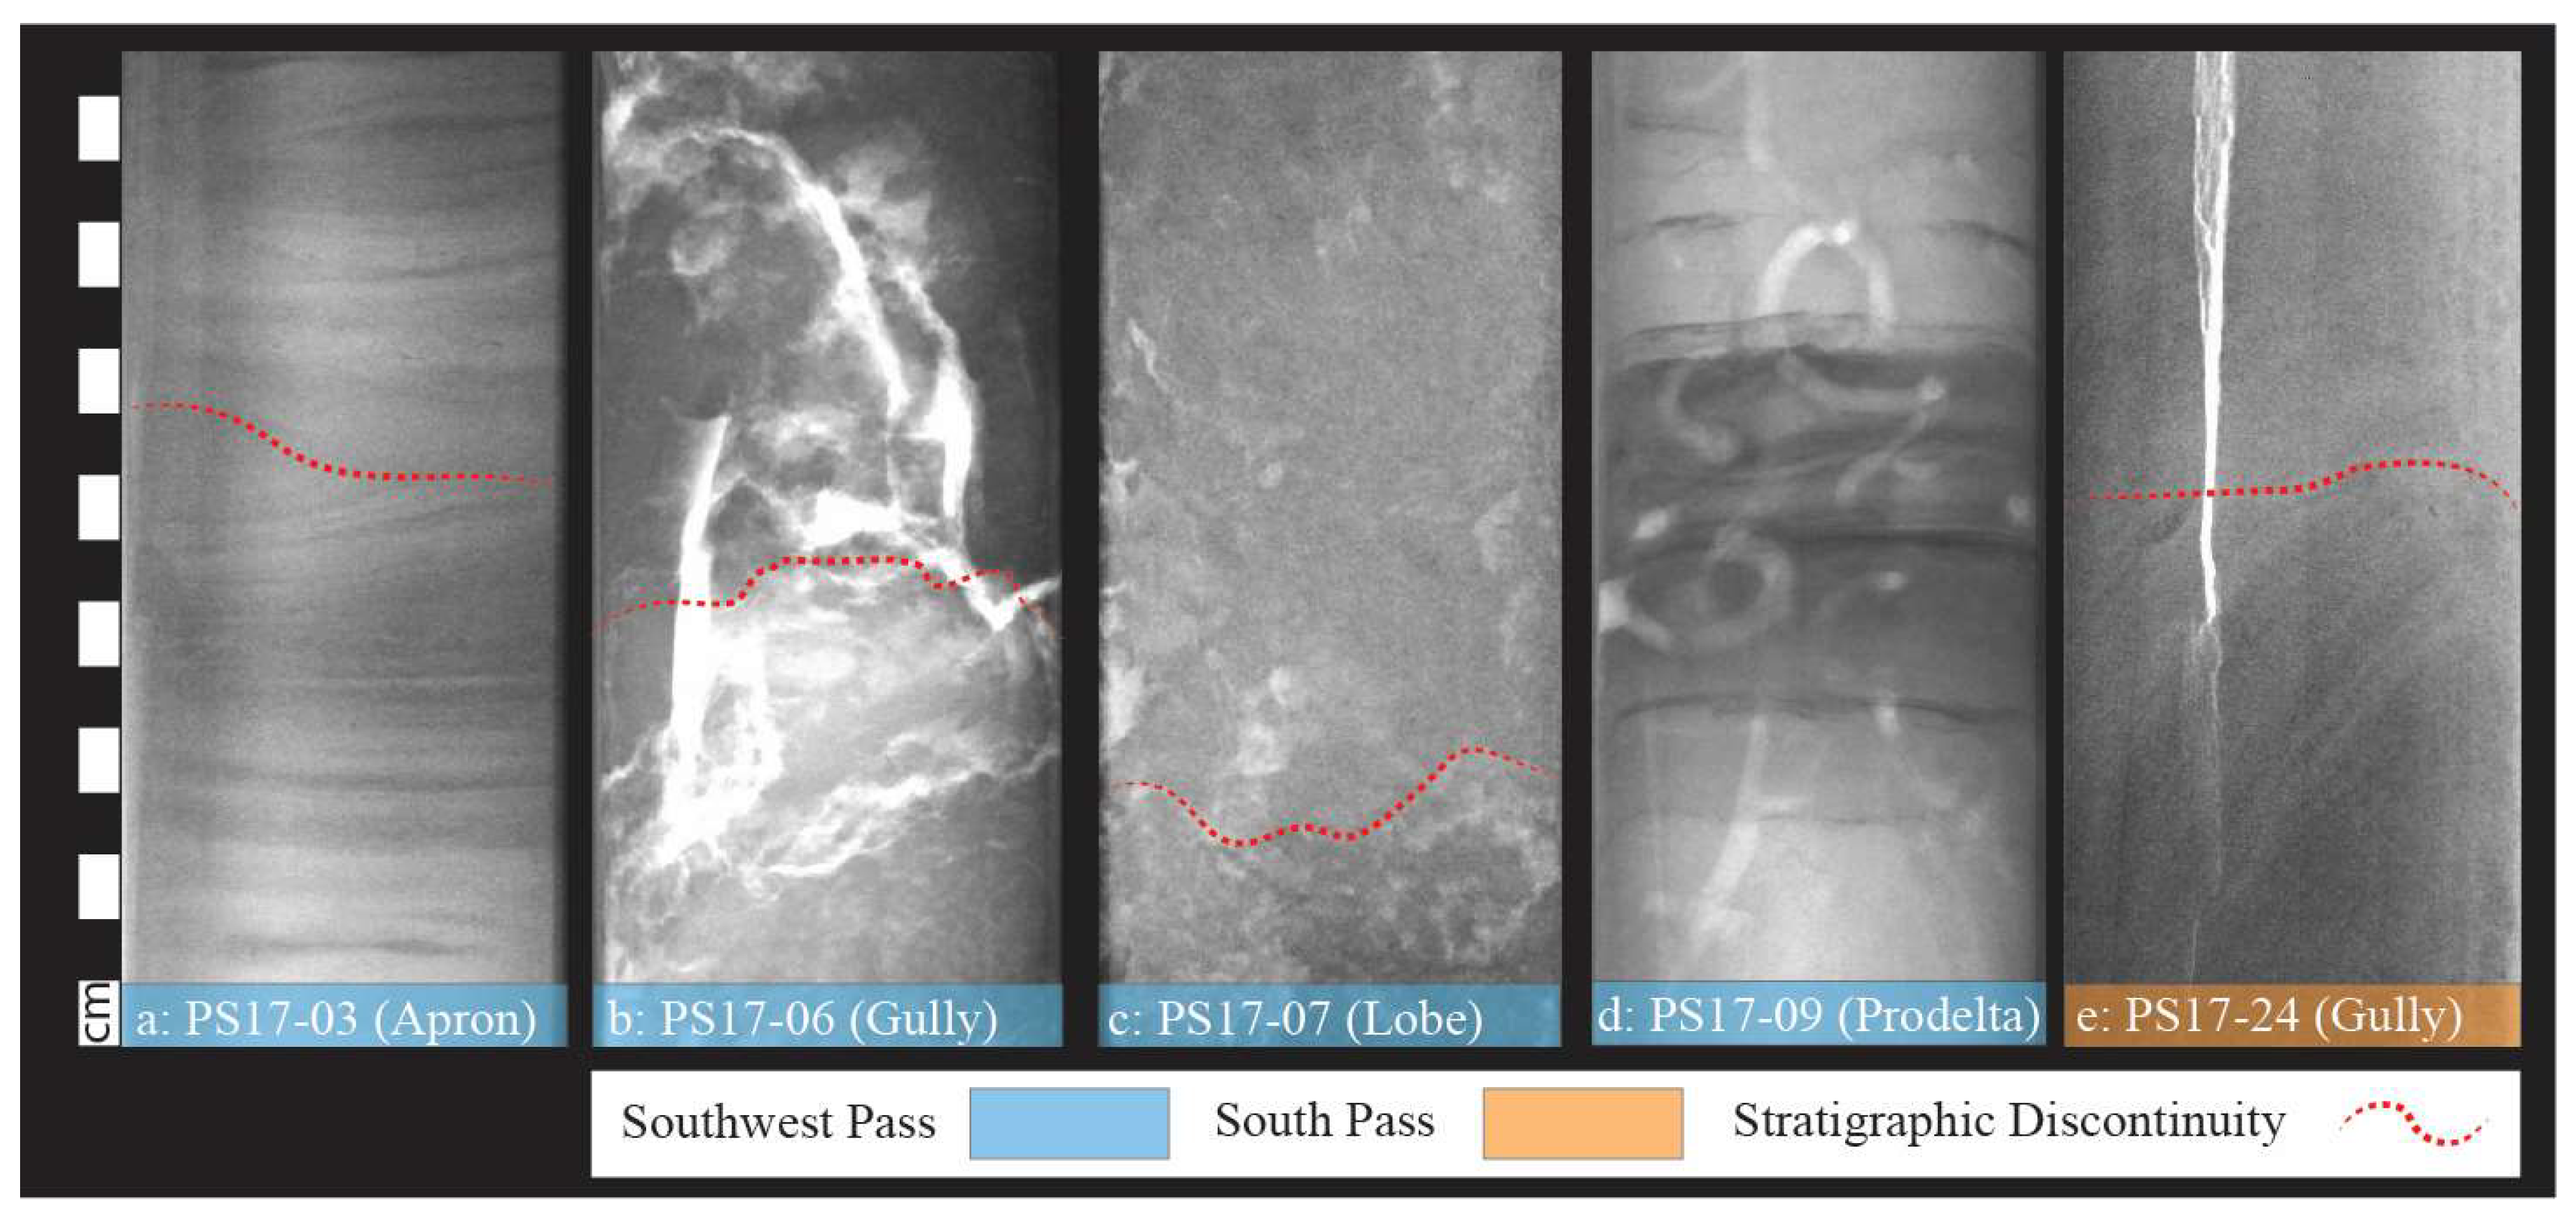
X-ray imaging of the core half-sections (Figure 4) showed generally faint bedding at predominantly cm- to dm-scales, mostly with poor contrast between layers. An exception to this is the SWP undisturbed topset apron core (Figure 4a), which contains well-defined, sub-cm laminations present in the upper 2 m of core. Relatively homogenous lithologic and depositional characteristics display a poor contrast, with higher-contrast sections exhibiting apparent sandy-silt layers as variations in density visible in X-ray imaging, such as in the upper 50 cm in the PS17-03 and PS17-09 (Figure 4). Angular unconformities are also present at the same scales and range of contrast, e.g., the unconformity in Figure 4e (PS17-24) vs the more homogenous/poorly contrasted boundary in Figure 4b (PS17-06). Bioturbation is also present at varied intervals concentrated around the top 25 cm of each core with relict bioturbation up to 200 cm deep, as indicated by superimposed structures over the fabric (Figure 4d). This corresponds with the Droser and Bottjer (1986) [56] bioturbation rating of 1–3 (corelating with approximately 0–40% biogenic sediment disturbance), equivalent to the bioturbation found by Keller et al. (2017) [2] in a study of the same site (Figure 4e). Meter-scale layers of 1–5 mm gas voids are also present, which are visible on X-ray and begin/terminate at relatively sharp contacts (Figure 4c).

3.4. Radioisotope Geochronology

Radioisotope activity profiles are shown in Figure 5, and the SARs derived from radioisotope data, shown in Table 1, are averaged for the entire profiles each of 137Cs and 210Pb. Profiles of excess 210Pb show high variability in their profile shape, from steady log-linear downward declines with increasing depth (e.g., the upper half meter of PS17-03) to sections with no vertical change (e.g., PS17-07) and stair step-like downward decreases. In many cases, abrupt downward changes in excess 210Pb are associated with same-depth changes in gamma density and/or grain size (e.g., PS17-06 near 300 cm depth). The penetration depths of 137Cs and excess 210Pb range from several decimeters to several meters, producing average SARs that span 0.04–0.98 m/decade (Table 1). Estimated ages for the base of all cores based on SARs are show in Table 1, spanning ≥64 to 775 years and generally increasing in age (and lower SAR) when farther from river outlets and in deeper water.
Three cores (PS17-07 from the SWP, and PS17-24 and PS17-30 from the SP) show near-vertical 210Pb gradients defined by the top-most 3–4 samples analyzed, or from 0 to 12–24 cm depth. The conventional approach to understanding such vertical gradients near the sediment–water interface in open marine systems ascribes this to the effects of bioturbation [51]. If these patterns were produced by rapid deposition, then physical stratification would likely dominate the sedimentary fabric evident in the X-radiographs [51]; instead, the bioturbation effects are visible in most X-radiographs near the sediment–water interface.
For all cores except PS17-06 (Figure 5), a change in the 210Pb gradient is evident in the uppermost 10–90 cm (and below the possible bioturbated zone described in the previous paragraph), from more vertical (below) to less vertical (near the sediment surface). Assuming that this change is related to the SAR rather than the effects of bioturbation (which would tend to make the profiles more vertical near the sediment surface), the apparent ages of these inflection points are shown in Table 1, calculated by solving Equation (1) for the apparent year at the depth of the inflection points (from Equation (1), age (y) = depth (cm)/SAR (cm/y)).

3.4.1. Southwest Pass Cores

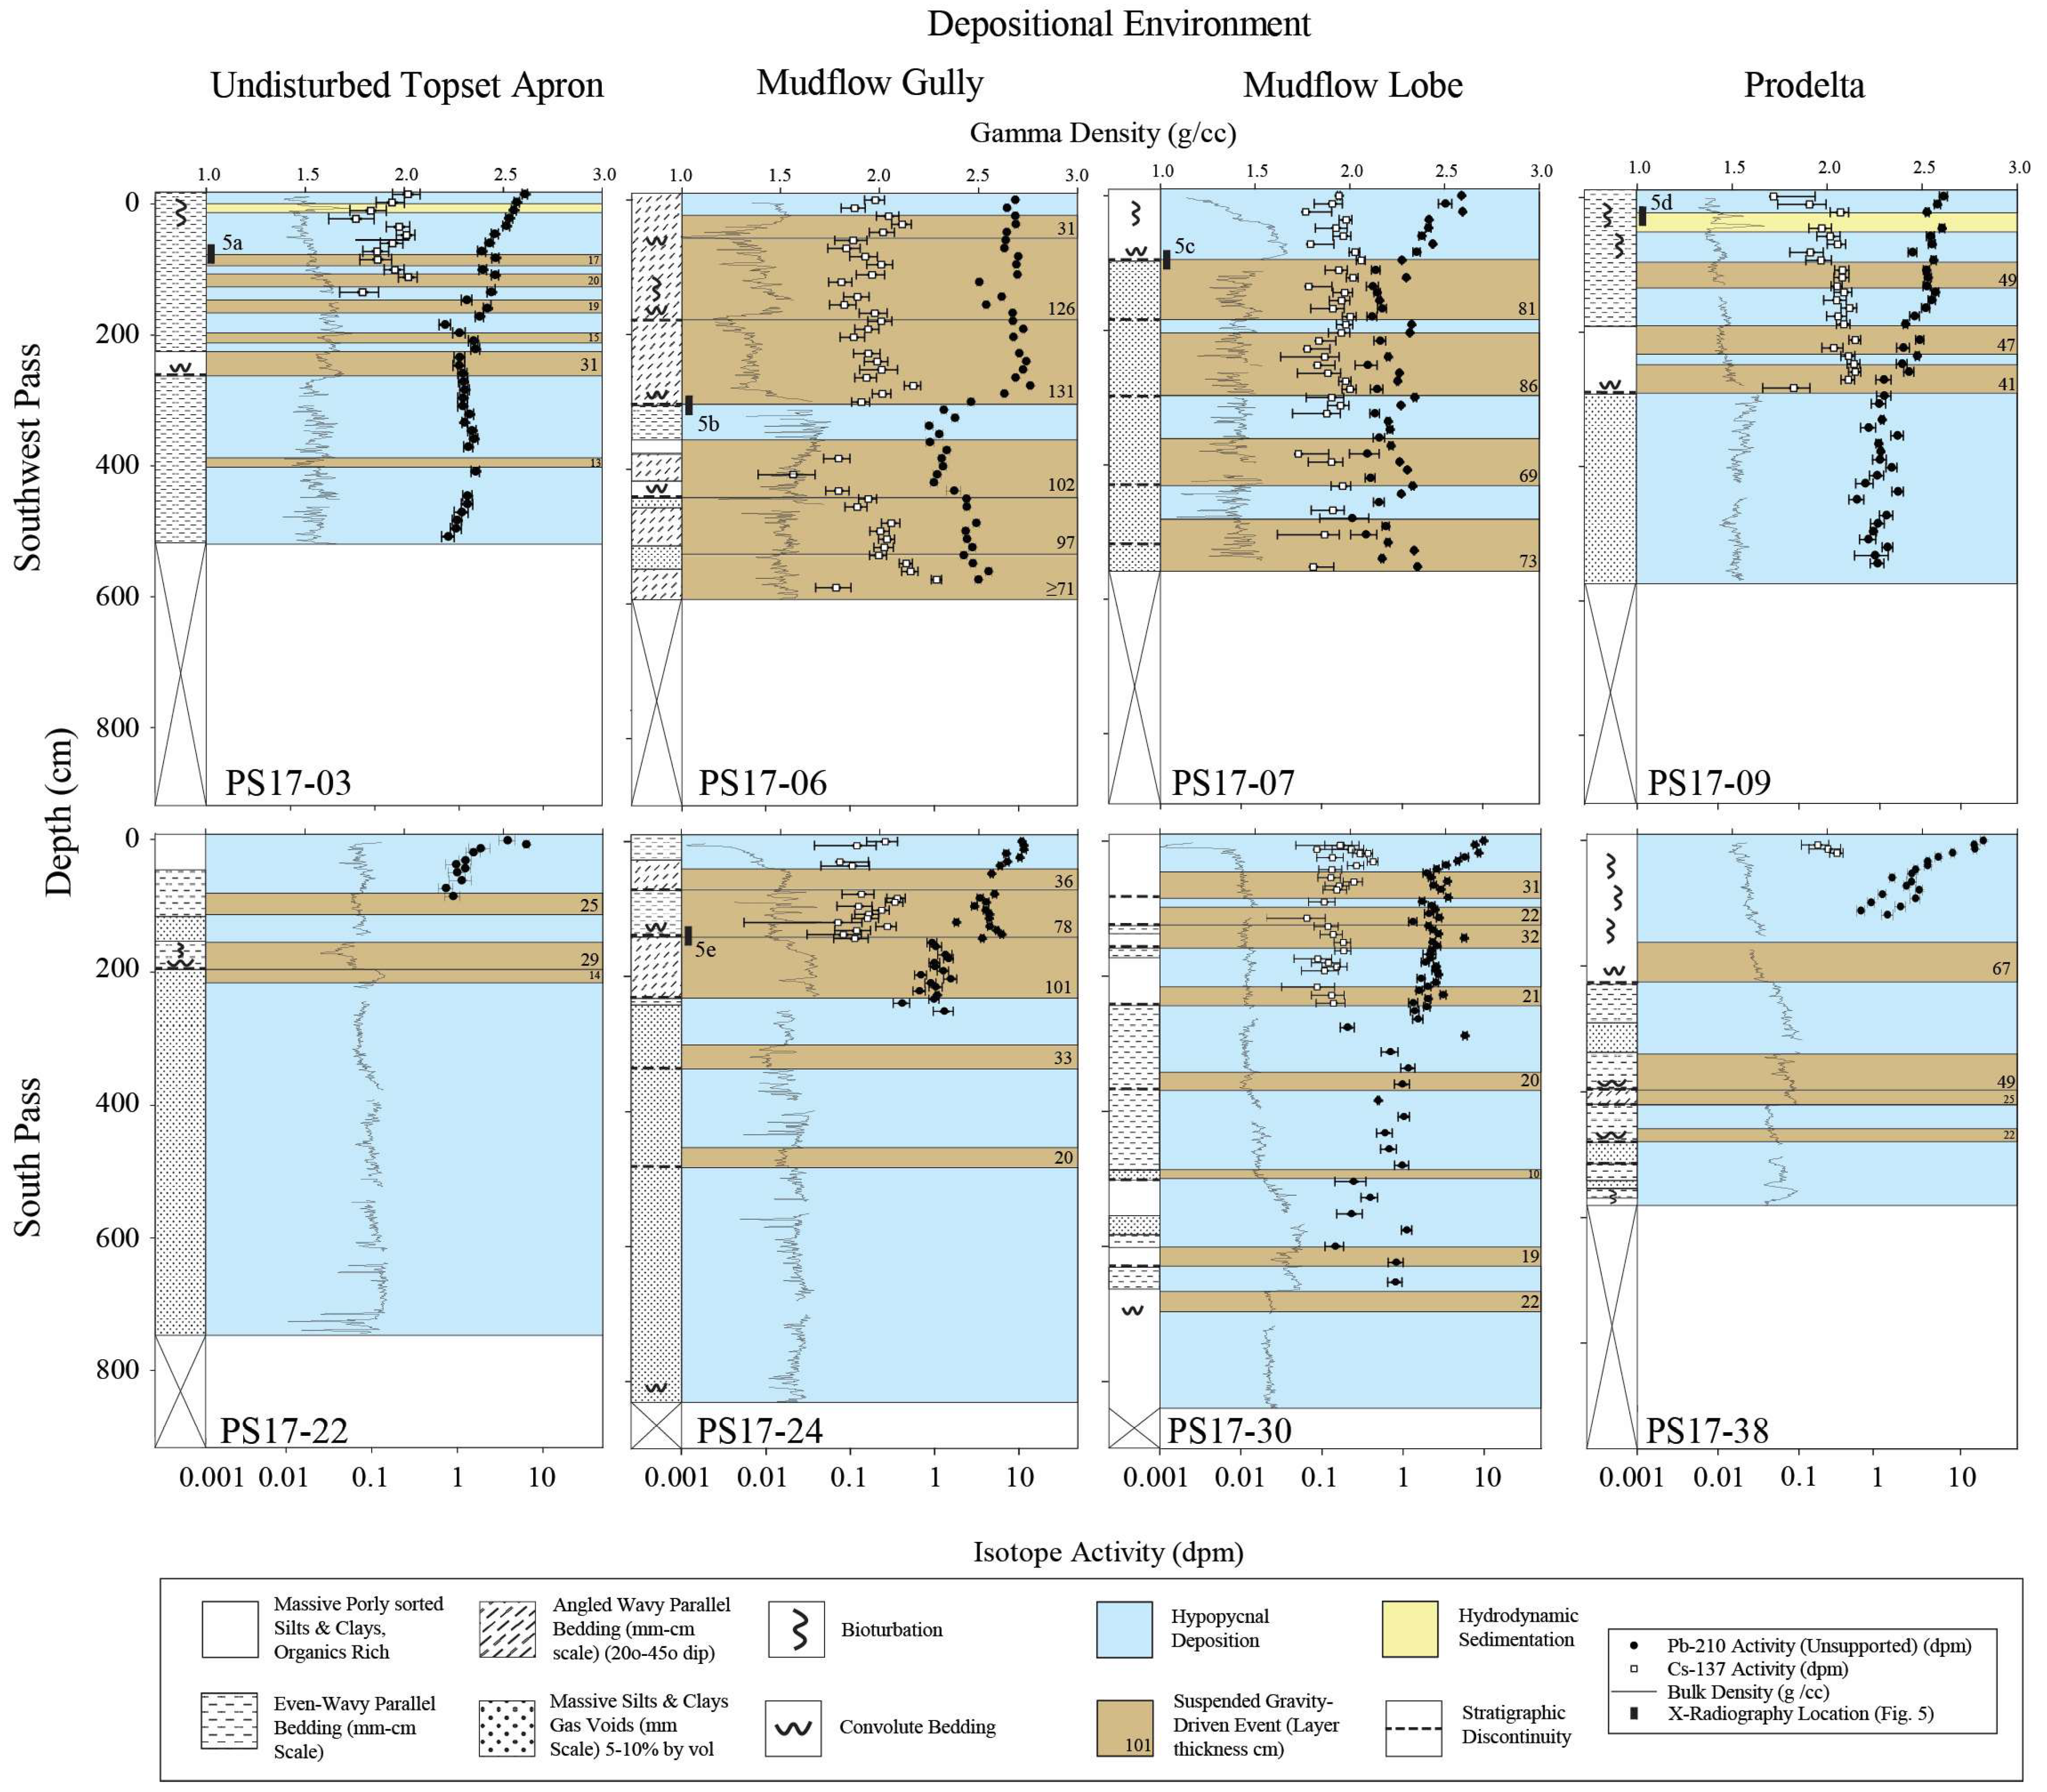
PS17-03-PC (undisturbed topset apron): The 210Pb activity steadily declines with depth to about 75 cm, followed by a more vertical but still decreasing profile to about 250 cm. A vertical profile continues downcore to 400 cm, then resumes a decay profile to the base of the core. The 137Cs showed a 144 cm basement ceasing at the base of a gamma density reduction and 210Pb shift. The gamma density steadily increases down to 144 cm, displaying (~1.5 g/cm3) a low magnitude sawtooth pattern with a subsequent reduction profile to the base of the core (~1.7–1.5 g/cm3), with an increased magnitude sawtooth.
PS17-06-PC (mudflow gully): 210Pb shows a stepped profile at ~meter scale containing four distinct segments and a major activity reduction at ~330 cm, with 137Cs continuing to the base of the core at 5.98 m. The gamma density follows the same ~100 cm mostly vertical packages, increasing at the ~330 cm section from 1.2–1.5 g/cm3.
PS17-07-PC (mudflow lobe): The 210Pb profile indicates a steady decrease at the top 94 cm of the core, followed by 30–50 cm thick tiers, roughly corresponding to similar scale variations in the gamma density with a 137Cs basement at the base of the core (551 cm). Gamma density follows a cm-scale sawtooth pattern consolidation profile down to 94 cm, rapidly dropping off to a higher magnitude cm-scale sawtooth associated with the observed presence of biogenic gas (inferred from voids present in core).
PS17-09-PC (prodelta): The radioactivity profile shows a gradual decrease in 210Pb corresponding generally to gamma which remains relatively steep until around 194 cm, with a brief activity decrease down to 270 cm, resuming a vertical profile until the base of the core (585 cm). 137Cs extended to a ~270 cm coeval with the resumption of 210Pb steepening. The gamma density gradually increases (1.4–1.7 g/cm3), displaying cm-scale sawtooth variation until a peak at ~270 cm with a subsequent vertical profile to the base.

3.4.2. South Pass Cores

PS17-22-PC (undisturbed topset apron): The S Pass core PS17-22 follows a slow 210Pb profile of decay until a depth of ~24 cm, with subsequent steepening down to a relatively shallow activity basement (~100 cm) with no observable 137Cs. Gamma density begins at 1.5 g/cm3 with no unconsolidated ramp displaying cm-scale sawtooth variation with interval variation at ~83 cm, ~197 cm, and ~215 cm.
PS17-24-PC (mudflow gully): 210Pb displays three distinct steps at ~50 cm intervals to a depth of ~78 cm, ~144 cm, and ~225 cm, with a 137Cs basement at 144 cm. Three steps are displayed at corresponding scales to the radioactivity (roughly half the scale of the SW Pass core with a similar profile), comprising cm-scale sawtooth variation in the activity below 144 cm. The gamma density follows a corresponding profile to 210Pb, displaying increased sawtooth variation below ~225 cm.
PS17-30-PC (mudflow lobe): 210Pb initially slowly decays to a depth of ~48 cm, with subsequent steepening down to ~690 cm with fluctuations that increase in magnitude with depth (starting at 255 cm). 137Cs is present down to ~240 cm, corresponding to the fluctuation of 210Pb. Gamma density generally follows a consolidation profile with a meter scale variation at ~500 cm with cm-scale sawtooth variation throughout.
PS17-38-PC (prodelta): 210Pb comprises a gradual decay to ~24 cm, continuing with a more rapid decay through extensive bioturbation observed at a shallow activity basement (~110 cm). 137Cs is present from ~12–36 cm to with no associated gamma density or 210Pb fluctuation. The gamma density follows a consolidation profile with distinct reduction at a ~30 cm scale (~155 cm, ~368 cm, ~400 cm, and ~470 cm).

3.5. Excess 210Pb Inventories and Focusing Factors

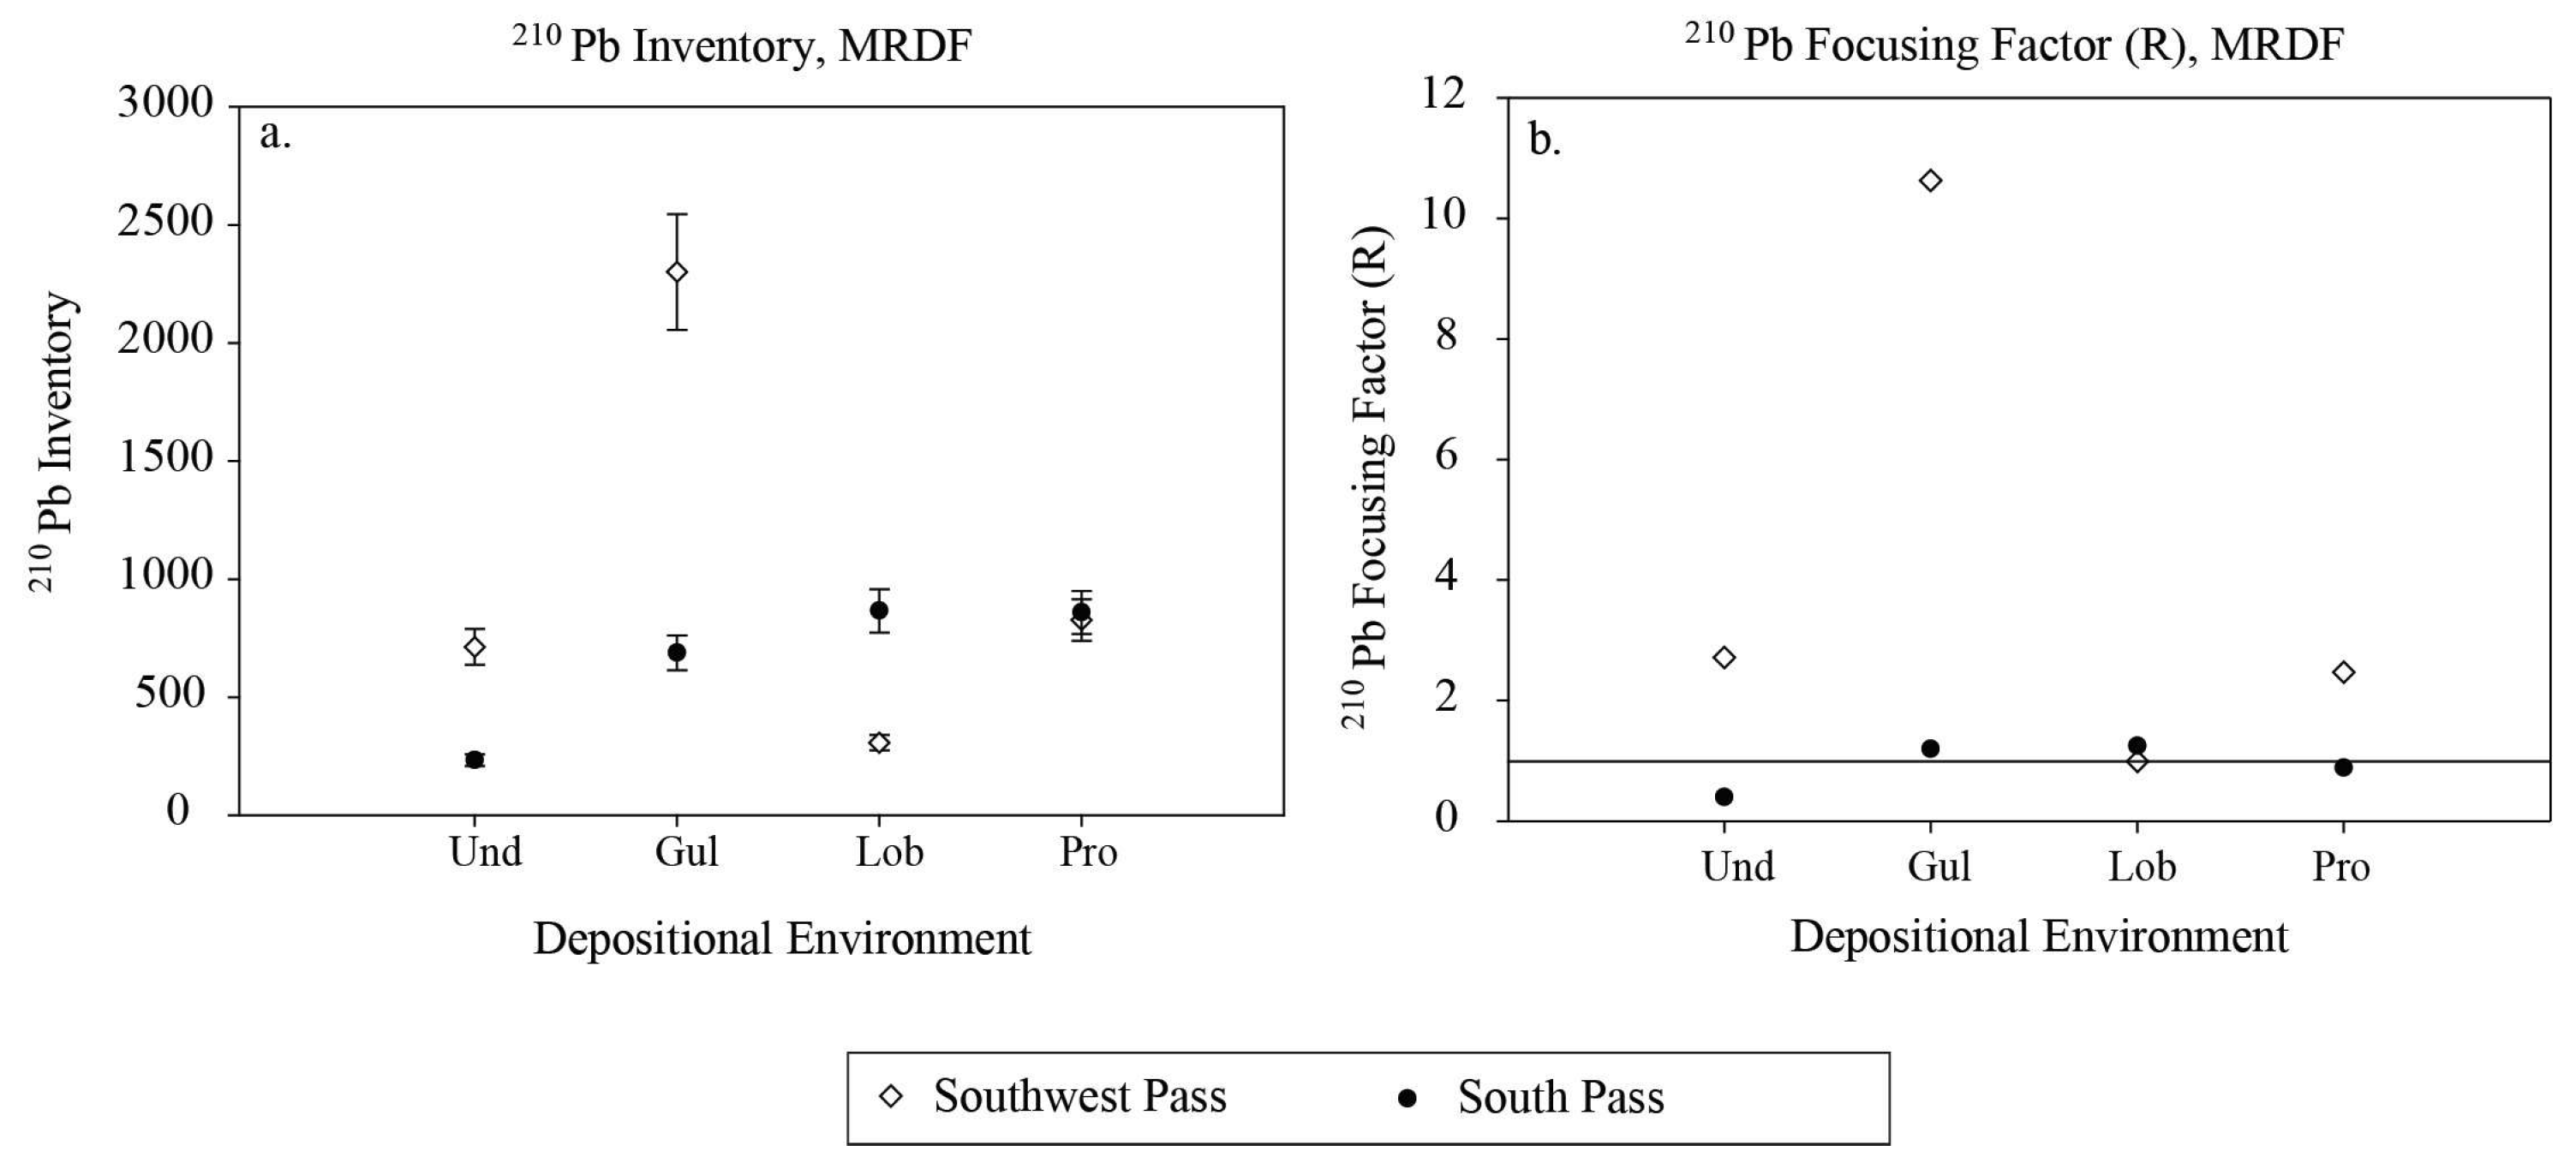
Excess 210Pb inventories and focusing factors are shown in Table 2 and Figure 7. Excess 210Pb inventories are <800 dpm/cm2, except for PS17-06 (SW Pass gully core, 2301 dpm/cm2). Plots of inventory versus depth or channel proximity do not show systematic variations and are not included here. Focusing factors show R ≥ 1 values for the SW Pass cores (1 < R < 10) and R ≤ 1.1 for the S Pass, indicating near equilibrium to slight depletion for the SP locations. Focusing factors show that the topset apron and gully cores in the SWP indicate the highest sediment focusing.

3.6. CHIRP Seismic Survey

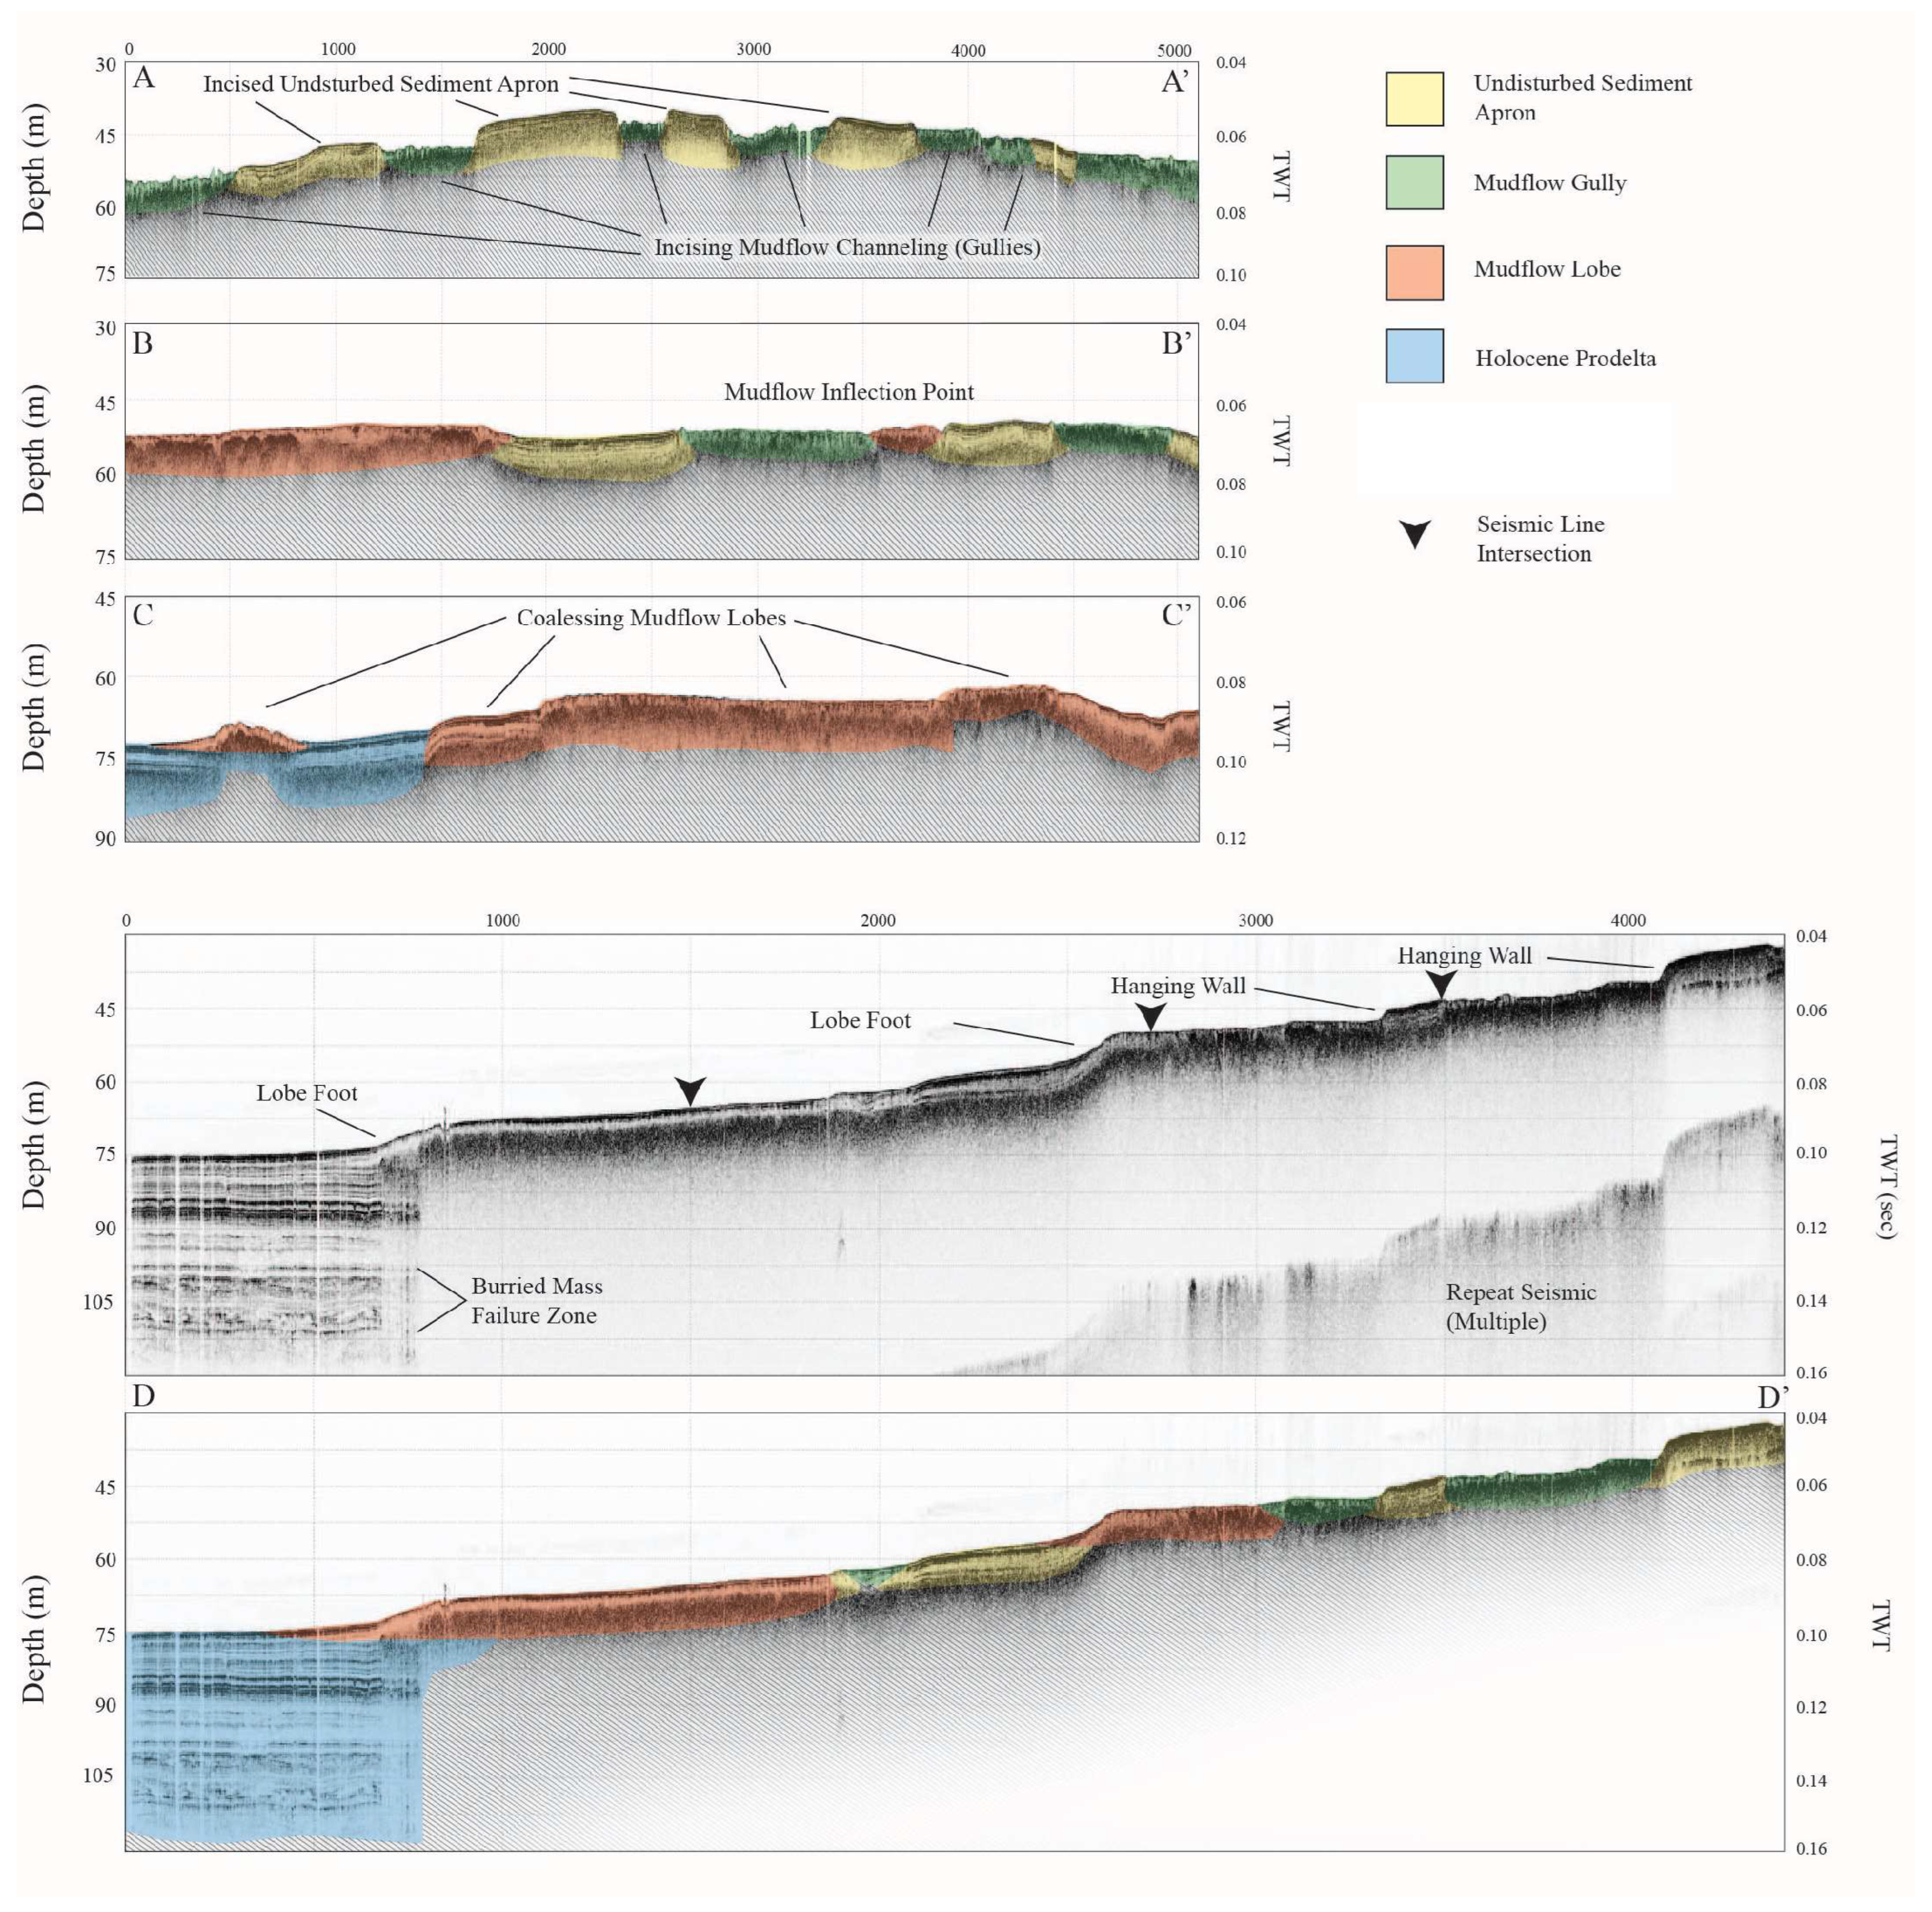
CHIRP Survey lines (Figure 6, data from Ballwin et al., 2018 [3]) from the SWP, perpendicular to the shore, show roughly sigmoidal clinoform geometry with a stair step morphology (500–700 m run to 5–7 m drop) downlapping onto Holocene prodelta sediment (Figure 6D). Seismic obscuration resulting from biogenic gas blanking encompasses the majority of the delta front sediment, with an unobstructed 10–20 m seismic basement in the distal prodelta sediments. The parallel to shore transects show the channeled systems with bathymetric highs and lows (300–600 m wide, 5–10 m deep), showing a smooth seabed profile on the highs with a mottled mudline on the lows (Figure 6A–C). Seismic basements alternate between 1–3 m highs and are non-existent on the gullies, resulting from biogenic gas blanking throughout the delta front. Prodelta images in the distal tracts show increased seismic penetration from 5–20 m in depth below the mudline. Biogenic gas plumes are also sporadically present in the distal profiles extending ~10 m above the mudline from a bathymetric divot. The clinoform structure downlaps onto the prodelta 21–30 km from the channel outlet. Transects from the South Pass show an smaller channel size overall with less biogenic gas obscuration present, resulting in higher seismic penetration (10–40 m). The lack of gas obscuration allows visualization of the coalescing mudflow lobe stratigraphy.

4. Discussion

4.1. Systematic Variations of Geological and Geochronological Parameters

The results for most cores show systematic variations in gamma density, grain size, and sedimentary fabrics on X-radiography, which appear to be related to beds defined by these properties in each core (Table 3). For example, beds in cores PS17-03 (55 cm depth), PS17-07 (60 cm depth), and PS17-08 (30 cm) each show gradual downward increases in gamma density, no appreciable grain size variation, log-linear downward declines in excess 210Pb, and laminated to massive sedimentary fabrics. A second grouping includes beds in cores PS17-03 (20 cm) and PS17-09 (52 cm), which show large gamma density increases in grain coarsening by ~0.6 ɸ, low 210Pb and 137Cs activity, with beds that appear to contain normal grading with sharp lower contacts in the X-radiographs (with occasional convolute bedding). A third pattern of systematic variation includes beds in cores PS17-06 (315 cm), PS17-07 (115 cm), and PS17-24 (162 cm), which display stair step gamma density profiles and associated changes in grain size, stair step excess 210Pb profiles, possible fragments of organic matter (low-density particles), and unconformable bases [57]. Table 4 proposes that these individual bed types are associated with genetic sedimentary processes. If this is indeed the case, then sedimentary budgets based on geological and geochronological interpretations can be developed for each process and its contribution to the formation of the recent sedimentary strata observed in the cores described above.

4.2. Depositional Processes and Associated Diagnostic Depositional Features

Previous studies [1,2,23] have identied three major depositional processes within the MRDF system that are generally consistent with our interpretation of the bed properties described in Table 3 and below, with diagnostic recognition criteria and an inferred depositional process. Below we merge the descriptions of diagnostic bedding properties and depositional processes, analogous to the development of facies recognition criteria. Using this classification scheme will allow an estimation of the relative contributions of each depositional process to the overall sediment budget (Table 4, based on the interpretations in Figure 8 and Table 3).
  • Hypopycnal fluvial sedimentation: The sediment deposits are out of suspension from the hypopycnal (buoyant) river discharge plumes [1,53,54]. Undisturbed sediment in the surrounding delta front (non-gully) floor has a linearly increasing gamma density profile with increasing depth (approx. 1.51 g/cm3 to 1.60 g/cm3). The grain size associated with this process is ~6.5 to 7.5 ɸ with sawtooth patterns at a 0.2 ɸ scale. Where continuous hypopycnal sedimentation is present (primarily in the undisturbed topset apron and the prodelta), 210Pb activity displays a log-linear downward decline with high r2 linear regression values and relatively low depositional rates, as listed in Table 1(PS17-03: r, 0.76; SAR, 4.20 cm/y; PS17-38: r2, 0.92; SAR, 0.80 cm/y) (Table 1 and Table 2). On X-radiography sediment fabrics (Figure 4) display laminations associated with hypopycnal depositions in PS17-03, with PS17-38 showing faint and partially bioturbated laminations.
  • Hydrodynamic sedimentation event: The sediment was resuspended by elevated wave–current shear stresses producing an erosional base and normal graded bedding with coarser layers that are sufficiently thick to produce elevated gamma density (0.4–1.0 g/cm3 increase) [2,11,32,58,59]. Examples of this occur in PS17-03 (~20 cm depth) and PS17-09 (~50 cm depth). The GS increases with these events to ~5.8 ɸ (Figure 3) from an ambient GS of ~7 ± 0.5 ɸ [22,53]). 210Pb and 137Cs were analyzed at 6–12 cm spacing and do not show any obvious variation in the event layers, possibly because of the low spatial resolution for radioisotope analyses. X-radiography shows that event layers are subject to bioturbation, such as in PS17-09 (Figure 4d). Hydrodynamic events are evident in the topset apron and prodelta of the SW pass (PS17-03; PS17-09), and in the SP apron with its modest gamma density increase. X-radiographic images display clear cm- to mm-scale layering, such as in core PS17-09, possibly due to the event cycles (Figure 4d).
  • Gravity-driven sedimentation event (mudflow): Gravity-driven mudflows initiated by a range of processes produce poorly consolidated homogenous sediment containing higher concentrations of biogenic gas voids [1,12,60]. Submarine landslide facies can be identified by a tiered/stair-stepped 210Pb profile collocated with abrupt changes in gamma density and sediment fabric changes, as well as being basally bounded by convolute bedding and a discontinuity visible in X-radiographs [2]. Beds with these properties are prevalent in the mudflow gully and lobe cores. The GS profiles show varied fluctuations within the gravity-driven sections, with GS mirroring the gamma density in some cases (370 to 500 cm in PS17-06) and increasing abruptly at the base of the mudflow layer in others (200 to 360 cm in PS17-06). 210Pb profiles indicate the clearest boundaries between events with clearly defined stair steps in PS17-06 and PS17-24 (mudflow gully cores), with vertical profiles indicating homogenized sediment flowing downslope. Less distinctive profiles are also present in both mudflow lobe cores (PS17-07; PS17-30) in smaller, dm-scale repeating packages. The 137Cs basement in PS17-24 corelates to both the gamma density and 210Pb stair step, indicating newer sediment sliding over older pre-1953 deposits, supported by a possible erosional unconformity observed at the base of the stair step (Figure 4e). This directly overlies the sediment which resumes a typical gamma density consolidation profile, as seen in adjacent apron cores.
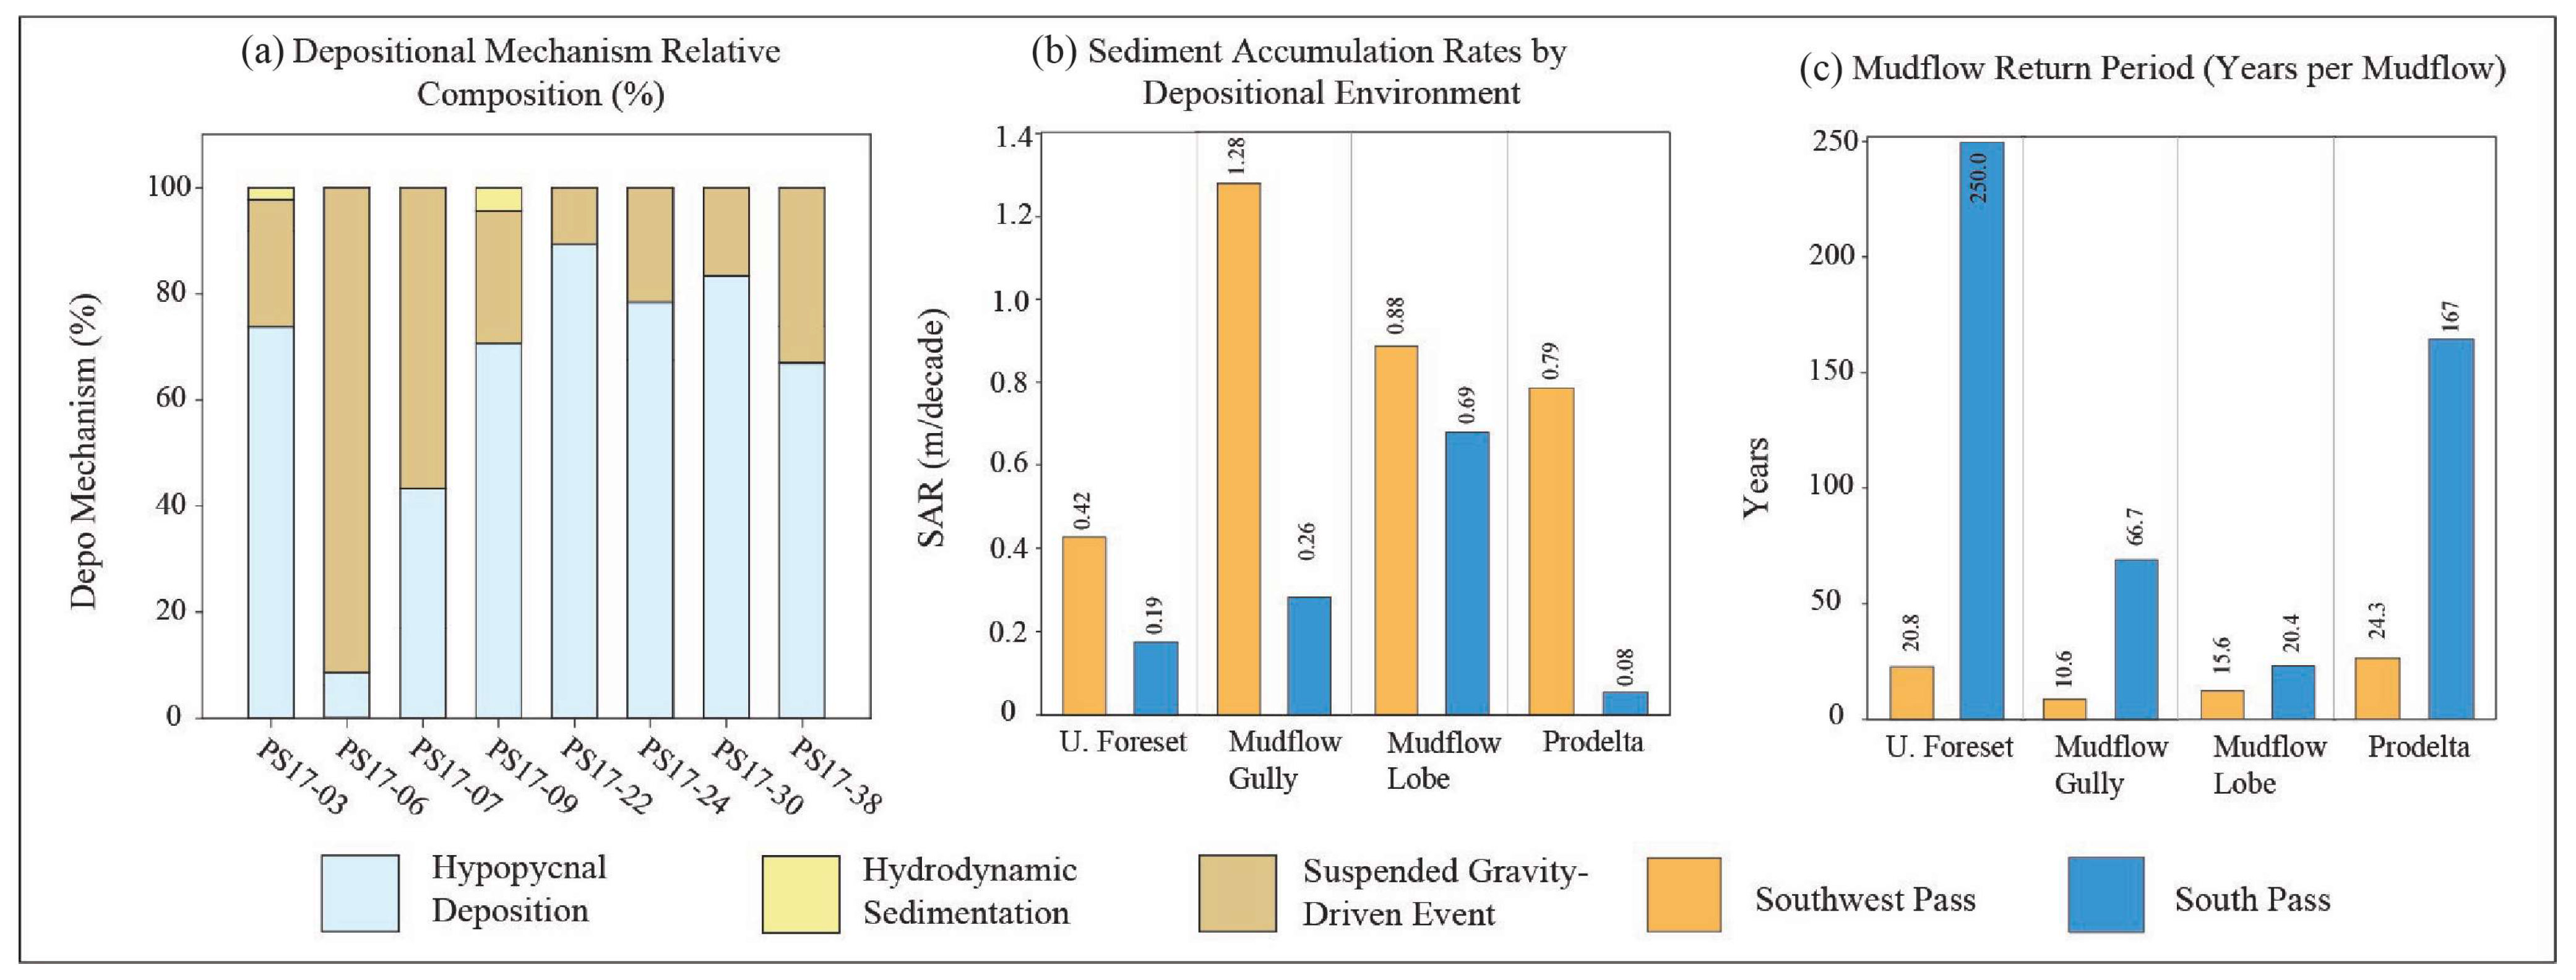
Figure 8 shows the sediment layers attributed to the depositional processes above (Table 3), and the percentage of the sediments in each core that are attributable to these processes are shown in Table 4, assuming our interpretations are correct. The dominant bed types are plume sedimentation (36%) and mudflows (63%) over event layers (1%) (Figure 6 and Figure 8, Table 4). For the SWP cores, the plume sedimentation (50%) and mudflow (48%) deposits are nearly equal, with event layers observed (2%). The SP is dominated by plume sedimentation (77%), with a minority of mudflow sedimentation by volume (23%) and no event layers observed (Figure 5). The undisturbed apron environments and prodelta have similar depositional mechanism percentages in both passes, (70–91% for plume sedimentation, 9–30% for mudflow, 0–2% for the event layers). Within the gully and lobe cores, the percentages skew wider between the passes (8–68% plume sedimentation, 32–92% mudflow, 0% event layers), with mudflow sediment leading the SWP and plume sedimentation dominating the SP.
Factors such as channel proximity, sediment accumulation, and depth may influence these disparities. Fluvial sedimentation sections are present in all the cores sampled, which could represent the continuing deposition of sediment hypopycnally during a hiatus of other depositional processes. PS17-07 shows fluvial sedimentation overlying a series of gravity-driven events, indicated by the 210Pb masked stratigraphically by the distorting effects of high gas presence and evident as voids (Figure 4).
Spatial scales of mudflow total thickness average 60 cm in the SWP and 35 cm in the SP, with the maintained ratio for gully cores with 98 cm (SWP) and 53 cm (SP) (Table 1). Though focused in the gully and lobe cores, suspected gravity-driven sediments were observed in all cores independent of the depositional environment, indicating the ubiquitous nature of mudflows to regional sedimentation.
PS17-22 (topset apron in the SP) did not display detectable 137Cs in the geochronologic analysis, and the sampling resolution was increased to a 3 cm sampling scale in the upper 1 m of core to confirm. The absence of 137Cs could be a result of the erosional removal of surface 137Cs bearing sediment, the decay of 137Cs below detection limits, or non-recovery during piston coring. Erosion or non-recovery of surface sediments is consistent with the low 210Pb activity, the absence of a low gamma density surface layer typically present at the top of fine-grained cores, and the 210Pb/137Cs piston core geochronologies from Figueredo et al. (2024) [38] collected nearby on the MRDF.

4.3. Return Periods within Gullies

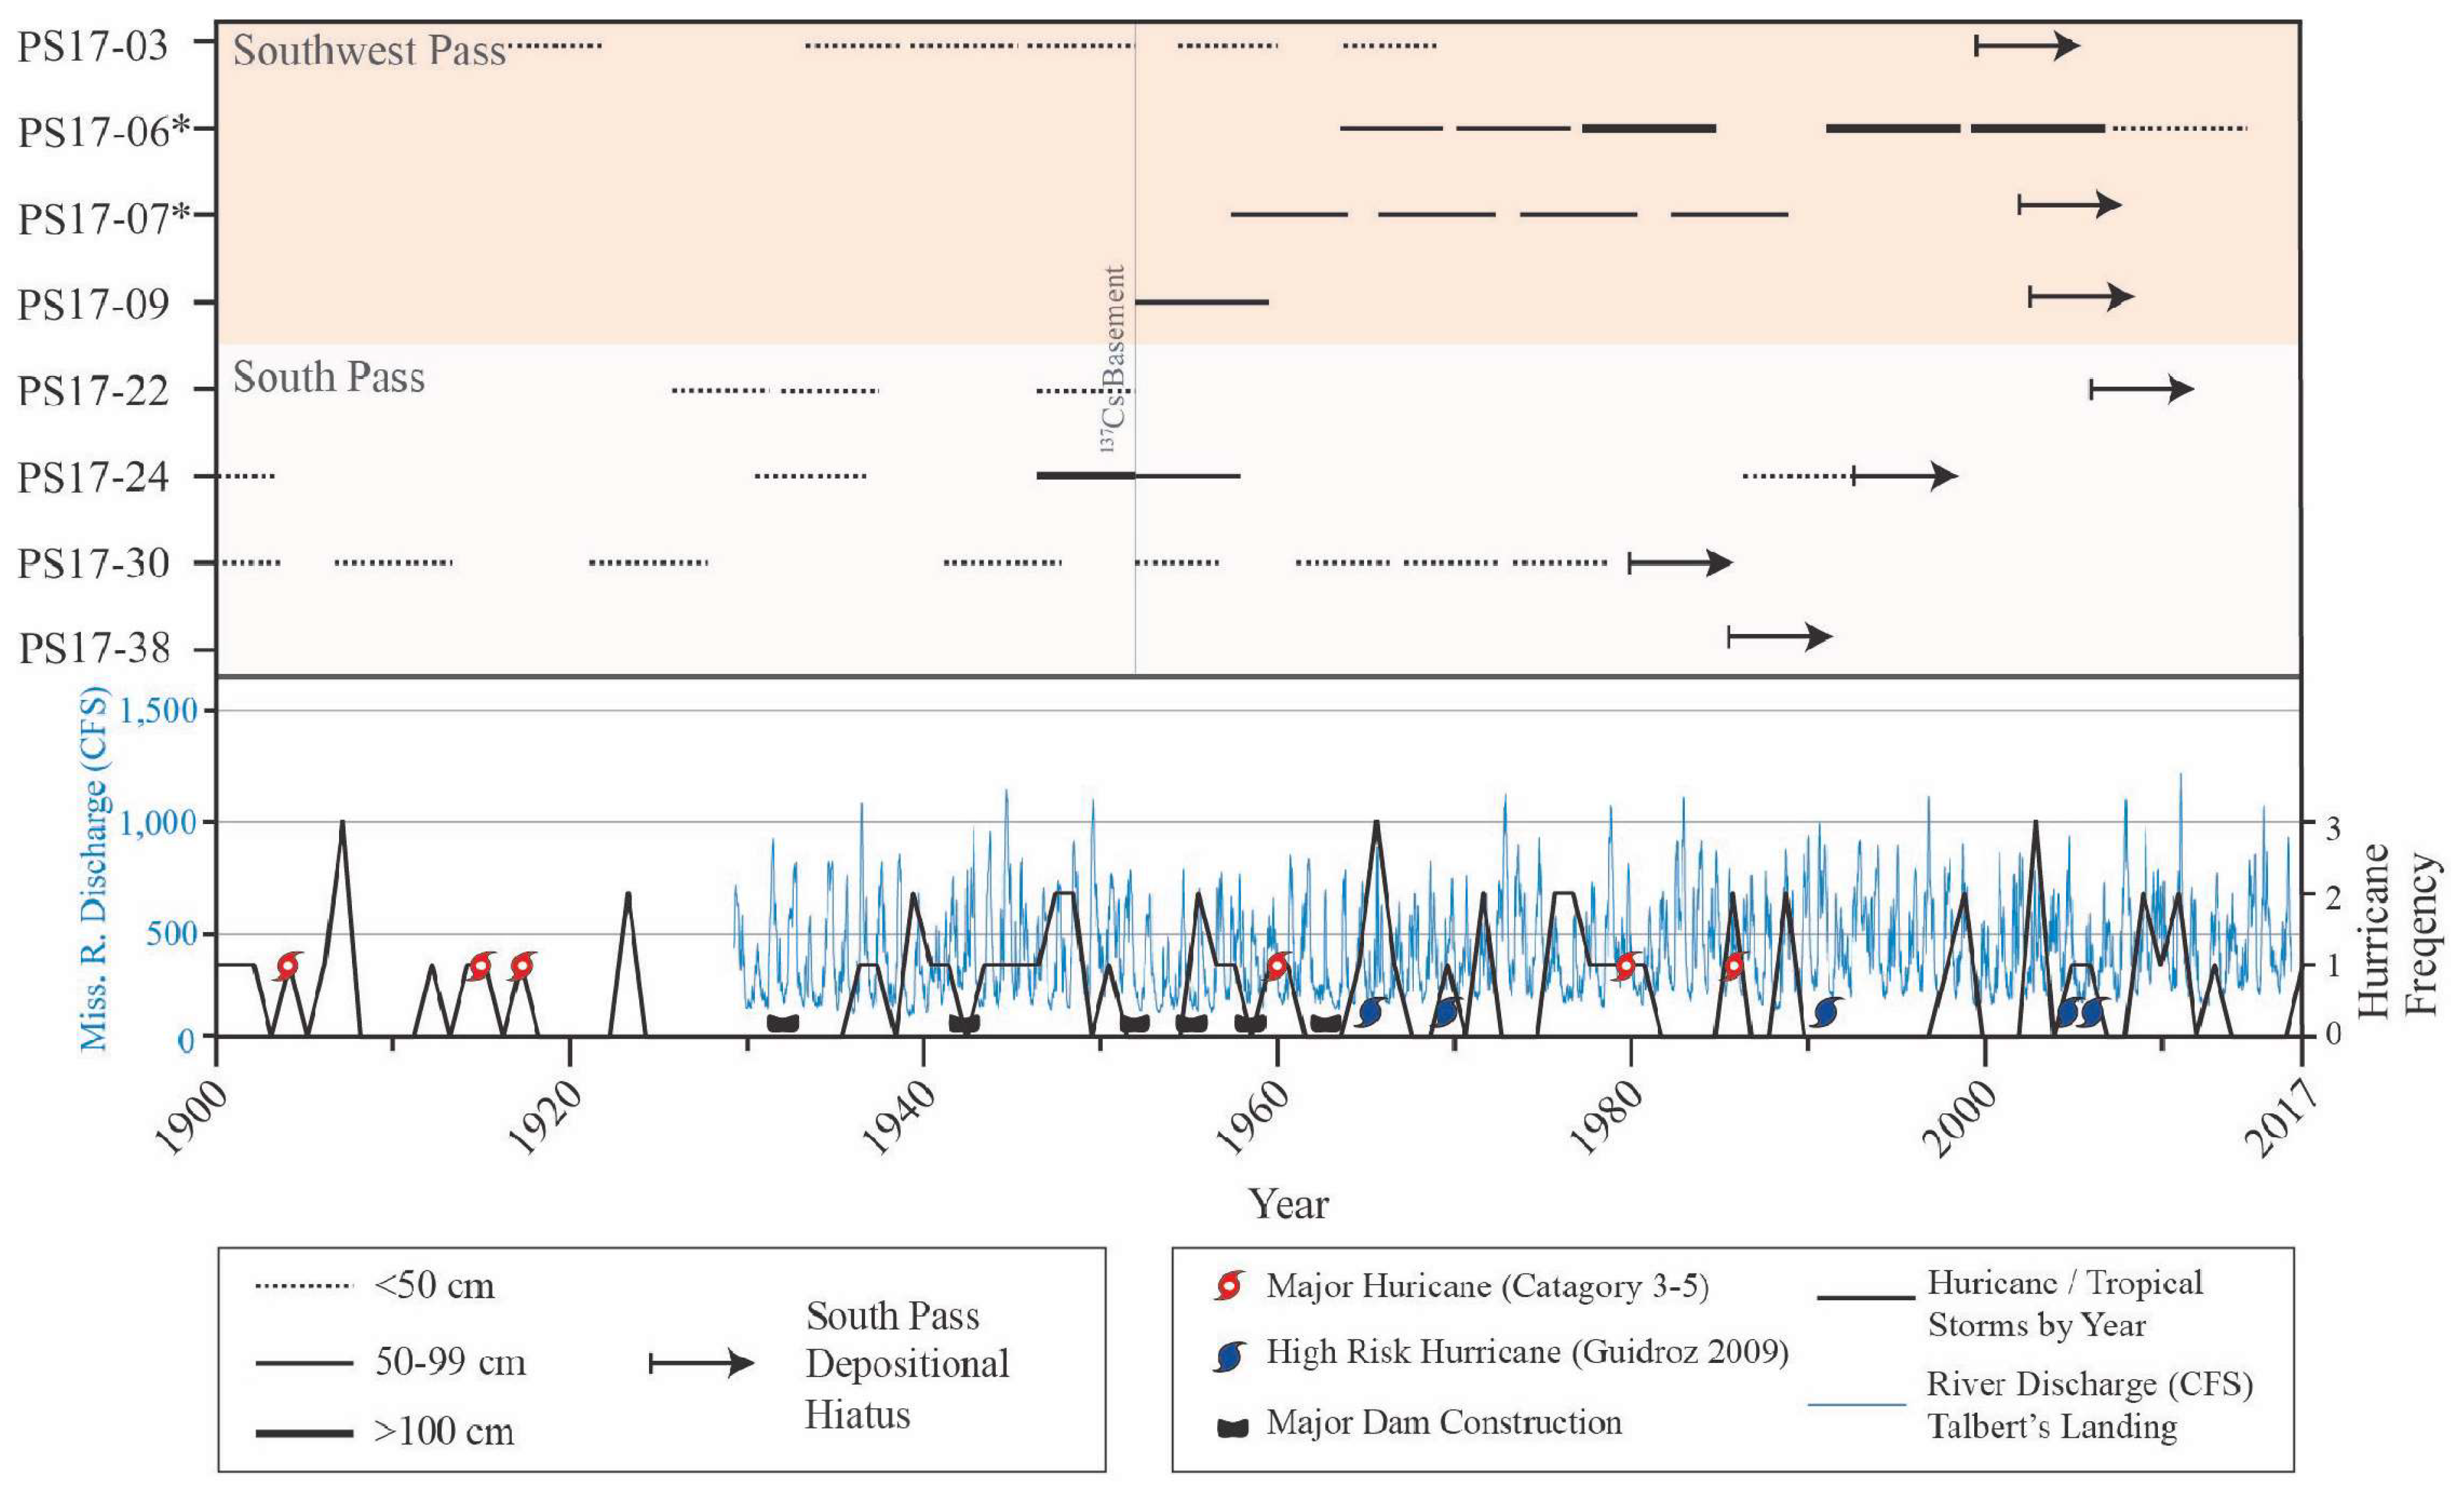
The ages of the mudflow occurrences (Figure 5 and Figure 9, Table 4) were dated using the upper boundary of the mudflow layer, calculated with SARPb using the 1953 basal age for 137Cs dating. This is pertinent to cores PS17-03, PS17-24, and PS17-30, where the 210Pb dating indicates a more rapid SAR than that correlated with the 137Cs-derived SAR. Stratigraphic discontinuities are present on X-radiography at the mudflow base, indicating a possible hiatus or erosion associated with a 210Pb profile discontinuity. Many of the gravity-driven mudflows identified have a lower boundary that is observable on X-radiography (Figure 4).
These discontinuities are visible as angular contacts within the laminated sections in cores PS17-03 and PS17-24, and as a separation of distinct massive sediments as shown in PS17-06 and PS17-07, all of which corelated with an atypical 210Pb “stair step” fluctuation and rapid gamma density fluctuation (Figure 5). This indicates possible erosion associated with the downslope movement of gravity-driven flows and sediment cannibalization in a similar fashion to that observed within the turbidity-driven stratigraphy [61]. Previous work indicates that mudflows can produce erosional processes at their base [2,62,63], also occurring with smaller (mm-scale) mudflows [23].
Mudflow deposits are the primary builders of delta front stratigraphy and make up 32–92% of the observed depositions (Figure 8). The return periods of these events were calculated using the total core depth to establish age. The mudflows were identified and enumerated by core vs. the age in order to determine their proportional component to the overall section (years between mudflows). For the SWP, this resulted in a decadal return period (≤10.7 y) for the PS17-06 (gully). Longer return periods were calculated for PS17-03 (apron), PS17-07 lobe), and PS17-09 (prodelta) at approximately 20.8, ≤15.6, and 24.3 years, respectively.
This means that, on average, gully and lobe environments experience more frequent mudflows than topset apron and prodelta settings. The calculated return periods for the SP are ~20 y for PS17-30 (lobe) and 22.5–66.7 y for PS17-24 (gully), with PS17-30 displaying a deeper 137Cs penetration (240 cm). PS17-22 (apron) and PS17-38 (prodelta) mudflow thickness are influenced by having a lower SAR than in the SWP strata, resulting in long return periods of 250 years and 167 years, respectively. The SWP return periods are slightly shorter in mudflow-prone gully/lobe cores compared to the less active apron/prodelta (20.8 y: 24.3 y). The apron/prodelta return periods are longer for the SP area (250 y: 167 y) and the return periods are much shorter in gullies and lobes (66.7/20.4 y), suggesting that the SP sedimentary processes concentrate sediment in gullies more intensely than in other local settings.
The SP study site is oriented in the intermediate to lower delta front areas, and the SWP site is completely in the upper delta front area (Figure 2), creating sediment delivery variations that influence the morphology between the sites, as indicated by the SAR, 210Pb activity inventories, and the variations in depositional composition [1,14]. The SARs for the SP (Table 1), as well as the total activity inventories (Figure 6), are lower on average (64% and 36%, respectively), corresponding with previous research indicating a winnowing of activity with added distance from channel outlets [52]. This is further supported by two major concentrations of 210Pb activity, PS17-03 and PS17-06, at the closest distance to their corresponding channel outlets (SWP) at 12.5 km and 10 km (Figure 6).
The greater SWP accumulation rates compared to the SP could have resulted from multiple factors, as channel proximity and higher channel discharge at the SWP compared to the SP create conditions for rapid sedimentation. As a result, larger concentrations of poorly consolidated sediment occur at shallower depths, increasing the exposure to a wave base that influences mudflow initiation and resulting in a much higher mudflow rate (10.6 y SWP vs. 66.7 y SP) (Figure 7).
The calculation of return periods for sediment gravity flows and event layers is routinely conducted in other settings, including the Cascadia subduction zone [64] and hurricane event layers in coastal settings [65]. Unlike the Cascadia sediment gravity flows with return periods of centuries, the MRDF mudflows appear to be commonly triggered by waves from winter storms [8] and tropical cyclones [22,59] rather than earthquakes, so they have correspondingly shorter return periods comparable to the coastal hurricane event layers created by sediment resuspension from tropical cyclone waves and currents, with return periods of decades.

4.4. Mudflow Preconditioning and Potential Triggers

Important preconditions for MRDF mudflows include the rapid deposition of weak and under-consolidated sediments, and the generation of excess fluid pressures from both hindered consolidation and the formation of free biogenic gas in sediments [1,66]. Calculation of in situ fluid pressures within shallow, poorly consolidated sediments is difficult, but core porosity (Figure 3) is a possible method for future research. We present evidence here of the reduction of SARs within the past several decades (Table 1, right-most column), which could eventually reduce the magnitudes for this mudflow precondition, although thresholds for SAR reduction that might limit mudflow production are not known.
The only in situ evidence we present for the presence of gas takes the form of acoustic wipeouts in the CHIRP profiles (Figure 6). Gas voids are evident in most cores but may be the result of degassing the previously dissolved biogenic gas during core recovery. As a result, the number of voids present in the cores at surface pressures and temperatures would be an approximate indicator of the maximum distribution of free gas under in situ conditions.

4.5. Trigger Events and Return Periods

Storm-generated surface gravity waves are a primary driver of MRDF mudflows [1,8,15]. Major hurricanes provide important forces for mudflow initiation, and can produce catastrophic mudflows [67,68,69]. Within this research, WS Guidroz (2009) [12] formulated a vulnerability matrix outlining a storm’s likelihood of mudflow initiation, including significant wave heights, wave periods, time, morphology, slope, sedimentation rate, and surficial elements. Three (3) hurricanes meet the criteria specified by Guidroz [12] for catastrophic mudflow generation, affecting both the SWP and SP: Camille 1969, Ivan 2004, Katrina 2005. These hurricanes, as well as all category 3+ hurricanes within 70 miles, are plotted on Figure 9 against the calculated mudflows from our study sites. Hurricane Camille (1969) indicated a possible initiation of mudflows on both the SP and SWP lobes (total age of PS17-06 is younger than 1969, no data). Ivan (2004) and Katrina (2005) both occured in proximity to mudflows within the SWP gully and lobe depositional environments, and occurred within the age of the sediment collected in the SWP cores. The average return period for these three major hurricanes since 1969 is 16 years, near the low end of the mudflow return periods shown in Table 4. Obelcz et al. (2017) [8] determined that mudflows can occur under less intense conditions than major hurricanes, suggesting that our stratigraphic analysis of cores (Table 4, Figure 5 and Figure 9) does not capture the full spectrum of MRDF mudflow events, at least in the shallower waters nearshore, as for the SWP. Other possibilities include (1) the flows having detachment planes that are too deep to be penetrated by piston cores and (2) some mudflows not creating (or not being aspreserved as) recognizable event stratigraphy, so they cannot be identified with our approach.

4.6. Apparent Decline in Recent SARs

The SAR results discussed above (Table 1 and Figure 5) suggest a regional decline in the SAR during the last decades ranging from 1965 to 2007. The timeframe encompassing this shift is broadly synchronous with an upstream retreat of river discharge from the lowermost outlets to above the Head of Passes that was initiated at least by ca. 1960 [16], and the initiation of an MRDF subaqueous delta retreat identified by Maloney et al. (2018) [15] in the late 20th century following centuries of subaqueous delta progradation. Similar reductions in the SAR observations were identified during the same time frame by Figueredo et al. (2024) [38] in a region between our SP and SWP study areas. These changes are likely associated with sediment load reductions in the Missouri River tributary of the Mississippi River following mid-20th century dam construction [70], along with recent retreat of major water and sediment discharge to upstream outlets [18]. We suggest that the recent reduction in SARs is a manifestation of the changing source-to-sink mass transfer also reported in other studies.

4.7. Radioisotope Inventories

The focusing factor distribution between the passes shows that the SWP has greater inventory accumulation values than the SP cores, particularly in mudflow gully environments (Figure 8). Depositional factors such as the 1:2 ratio of SWP to SP depth/distances from the discharge point and a 4:1 sediment discharge ratio between the SWP and SP could possibly influence the activity inventory, as was found by [52] in deeper sedimentary regimes. In addition, the lower rate of recent mudflow activity in the SP may throttle the distal transport of sediment from higher inventory, upper delta front zones to the middle and lower delta front zones, as is present in the SP site.

5. Conclusions

In conclusion, this study provides insights to the geochronological and stratigraphic traits of mudflows in the MRDF and their proximal to distal variation. The analysis of depositional mechanisms in four key delta front environments provides insights into the building blocks of the delta, and their relative contributions. Future work will focus on developing more extensive geochronological observations to support a source-to-sink sediment mass balance for this delta and show where, when, and how river sediments are depositing, moving, and eroding on the shelf. More broadly, we hope that this coupled geochronological/process-based approach can inform the key mechanisms for offshore sediment transport near river-dominated deltas elsewhere. The key findings from this study are detailed below.
  • The mass movement and subsequent deposition within gully flows are identifiable up to a 6 m depth with 210Pb stair step profiles and corresponding gamma density fluctuation, as well as basement of 137Cs activity. This corelates with previous work by Keller et al. (2017) [2] and is further supported by the stratigraphic unconformities (possibly erosional) observed at the base of event layers.
  • The mudflow gully event return periods within the SWP and SP are roughly decadal (10.7 years between events) and multi-decadal (66.7 y), respectively. The average return periods for all depositional environments in the SWP (17.8 y) are nearly seven times more frequent than those of the deeper, more distal SP (126 y). This supports its role in the formation of proximal-accumulation-dominated subaqueous depocenters [31] such as the MRDF.
  • 210Pb Inventories and focusing factors display higher levels in the SWP overall with focusing factors centering around the SWP gully, indicating the preferential loading of sedimentation onto proximal environments and the distal transport via mudflow gullies. Deeper, more distal environments such as the SWP lobes and the prodelta, as well as all of the SP environments, show equilibrium to depleted sediment focusing in comparison.
  • Recently dated mudflow deposits of varied scale are present in both the SP and SWP despite the former having a fraction of the sediment load and discharge, as well as a doubling of the depth and distance from its respective channel outlet. Moreover, the presence of a depositional shift to lower SARs in most cores, dated to after the construction of Mississippi River distributary dams, shows the visible impact of anthropogenic river engineering on the relative sediment delivery into the receiving basin.

Author Contributions

Conceptualization, J.D. and S.J.B.; Methodology, S.J.B., K.X. and N.H.J.; Investigation, J.D.; Resources, K.X. and N.H.J.; Data curation, J.D. and N.H.J.; Writing—original draft, J.D.; Writing—review & editing, S.J.B., K.X. and N.H.J.; Visualization, J.D. and K.X.; Supervision, S.J.B.; Project administration, S.J.B.; Funding acquisition, S.J.B. All authors have read and agreed to the published version of the manuscript.

Funding

This study was funded by the Department of Interior Bureau of Ocean Energy Management, under the cooperative agreement M13AC00013.

Institutional Review Board Statement

Not applicable.

Informed Consent Statement

Not applicable.

Data Availability Statement

Data are contained within the article.

Acknowledgments

We would like to thank the field support group of the Coastal Studies Institute of Louisiana State University for their invaluable help during field operations, as well as all others who assisted. This manuscript has been improved through the recommendations of three anonymous reviewers.

Conflicts of Interest

The authors declare no conflicts of interest.

References

  1. Coleman, J.M.; Walker, H.J.; Grabau, W.E. Sediment instability in the Mississippi River delta. J. Coastal Res. 1998, 872–881. [Google Scholar]
  2. Keller, G.; Bentley, S.J.; Georgiou, I.Y.; Maloney, J.; Miner, M.D.; Xu, K. River-plume sedimentation and 210Pb/7Be sea-bed delivery on the Mississippi River delta front. Geo-Mar. Lett. 2017, 37, 259–272. [Google Scholar] [CrossRef]
  3. Baldwin, W.E.; Ackerman, S.D.; Worley, C.R.; Danforth, W.W.; Chaytor, J.D. High-resolution geophysical data collected along the Mississippi River Delta front offshore of southeastern Louisiana. U.S. Geol. Surv. Field Act. 2018. [Google Scholar] [CrossRef]
  4. Coleman, J.M.; Roberts, H.H.; Stone, G.W. Mississippi River delta: An overview. J. Coastal Res. 1998, 699–716. [Google Scholar]
  5. Talling, P.J. On the triggers, resulting flow types and frequencies of subaqueous sediment density flows in different settings. Mar. Geol. 2014, 352, 155–182. [Google Scholar] [CrossRef]
  6. Nardin, T.R.; Hein, F.J.; Gorsline, D.S.; Edwards, B.D. A review of mass movement processes, sediment and acoustic characteristics, and contrasts in slope and base-of-slope systems versus canyon-fan-basin floor systems. Geo-Mar. Lett. 1979, 27, 61–73. [Google Scholar]
  7. Jiang, L.; LeBlond, P.H. Numerical modeling of an underwater Bingham plastic mudslide and the waves which it generates. J. Geophys. Res. Ocean 1993, 98, 10303–10317. [Google Scholar] [CrossRef]
  8. Obelcz, J.; Xu, K.; Georgiou, I.Y.; Maloney, J.; Bentley, S.J.; Miner, M.D. Sub-decadal submarine landslides are important drivers of deltaic sediment flux: Insights from the Mississippi River Delta Front. Geology 2017, 45, 703–706. [Google Scholar] [CrossRef]
  9. Allison, M.A.; Bianchi, T.S.; McKee, B.A.; Sampere, T.P. Carbon burial on river-dominated continental shelves: Impact of historical changes in sediment loading adjacent to the Mississippi River. Geophys. Res. Lett. 2007, 34–40, 34–40. [Google Scholar] [CrossRef]
  10. MMS Press Release MMS Updates Damage Assessment from Hurricane Ivan. MMS Updates Damage Assessment from Hurricane Ivan, U.S. Department of the Interior’s Minerals Management Service (MMS), 8 October 2004. Available online: https://www.bsee.gov/sites/bsee.gov/files/news/news-item/mms-press-release-1008a.pdf (accessed on 21 December 2022).
  11. Goni, M.A.; Alleau, Y.; Corbett, R.; Walsh, J.P.; Mallinson, D.; Allison, M.A.; Dellapenna, T.M. The effects of Hurricanes Katrina and Rita on the seabed of the Louisiana shelf. Sediment. Rec. 2007, 5, 4–9. [Google Scholar] [CrossRef]
  12. Guidroz, W.S. Subaqueous, Hurricane-Initiated Shelf Failure Morphodynamics along the Mississippi River Delta Front, North-central Gulf of Mexico. Ph.D. Thesis, Louisiana State University and Agricultural & Mechanical College, Baton Rouge, LA, USA, 2009. [Google Scholar]
  13. Chaytor, J.D.; Baldwin, W.E.; Bentley, S.J.; Damour, M.; Jones, D.; Maloney, J.; Xu, K. Short- and long-term movement of mudflows of the Mississippi River Delta Front and their known and potential impacts on oil and gas infrastructure. Geol. Soc. Lond. Spec. Publ. 2020, 500, 587–604. [Google Scholar] [CrossRef]
  14. Maloney, J.M.; Bentley, S.J.; Xu, K.; Obelcz, J.; Georgiou, I.Y.; Miner, M.D. Mississippi River subaqueous delta is entering a stage of retrogradation. Mar. Geol. 2018, 400, 12–23. [Google Scholar] [CrossRef]
  15. Anderson, J.B.; Wallace, D.J.; Simms, A.R.; Rodriguez, A.B.; Weight, R.W.; Taha, Z.P. Recycling sediments between source and sink during a eustatic cycle: Systems of late Quaternary northwestern Gulf of Mexico Basin. Earth-Sci. Rev. 2016, 153, 111–138. [Google Scholar] [CrossRef]
  16. Bentley Sr, S.J.; Blum, M.D.; Maloney, J.; Pond, L.; Paulsell, R. The Mississippi River source-to-sink system: Perspectives on tectonic, climatic, and anthropogenic influences, Miocene to Anthropocene. Earth-Sci. Rev. 2016, 153, 139–174. [Google Scholar] [CrossRef]
  17. Allison, M.A.; Meselhe, E.A. The use of large water and sediment diversions in the lower Mississippi River (Louisiana) for coastal restoration. J. Hydrol. 2010, 387, 346–360. [Google Scholar] [CrossRef]
  18. Allison, M.A.; Meselhe, E.A.; Kleiss, B.A.; Duffy, S.M. Impact of water loss on sustainability of the Mississippi River channel in its Deltaic Reach. Hydrol. Process. 2023, 37, e15004. [Google Scholar] [CrossRef]
  19. Jakob, M.; Hungr, O.; Jakob, D.M. Debris-Flow Hazards and Related Phenomena; Springer: Berlin/Heidelberg, Germany, 2005; Volume 739. [Google Scholar]
  20. Allen, J.R.L. The Bouma division A and the possible duration of turbidity currents. J. Sediment. Res. 1991, 61, 291–295. [Google Scholar]
  21. Courtois, A.; Bentley, S.; Maloney, J.; Xu, K.; Chaytor, J.; Georgiou, I.Y.; Damour, M. Short-Term Sediment Dispersal on a Large Retreating Coastal River Delta via 234Th and 7Be Sediment Geochronology: The Mississippi River Delta Front. Water 2024, 16, 463. [Google Scholar] [CrossRef]
  22. Dail, M.B.; Corbett, D.R.; Walsh, J.P. Assessing the importance of tropical cyclones on continental margin sedimentation in the Mississippi delta region. Cont. Shelf Res. 2007, 27, 1857–1874. [Google Scholar] [CrossRef]
  23. Walsh, J.P.; Corbett, R.; Mallinson, D.; Goni, M.; Dail, M.; Loewy, C.; Tesi, T. Mississippi delta mudflow activity and 2005 Gulf hurricanes. EOS Trans. Am. Geophys. Union 2006, 87, 477–478. [Google Scholar] [CrossRef]
  24. Bennett, R.H. Pore-water pressure measurements: Mississippi delta submarine sediments. Mar. Georesour. Geotechnol. 1977, 2, 177–189. [Google Scholar] [CrossRef]
  25. Anderson, A.L.; Bryant, W.R. Gassy sediment occurrence and properties: Northern Gulf of Mexico. Geo-Mar. Lett. 1990, 10, 209–220. [Google Scholar] [CrossRef]
  26. Chillarige, A.V.; Morgenstern, N.R.; Robertson, P.K.; Christian, H.A. Seabed instability due to flow liquefaction in the Fraser River delta. Can. Geotech. J. 1997, 34, 520–533. [Google Scholar] [CrossRef]
  27. Denommee, K.C.; Bentley Sr, S.J.; Harazim, D. Mechanisms of muddy clinothem progradation on the Southwest Louisi-ana Chenier Plain inner shelf. Geo-Mar. Lett. 2018, 38, 273–285. [Google Scholar] [CrossRef]
  28. Shanmugam, G. The Bouma sequence and the turbidite mind set. Earth-Sci. Rev. 1997, 42, 201–229. [Google Scholar] [CrossRef]
  29. Lindsay, J.F.; Prior, D.B.; Coleman, J.M. Distributary-mouth bar development and role of submarine landslides in delta growth, South Pass, Mississippi Delta. AAPG Bull. 1984, 68, 1732–1743. [Google Scholar]
  30. Hampton, M.A.; Lee, H.J.; Locat, J. Submarine landslides. Rev. Geophys. 1996, 34, 33–59. [Google Scholar] [CrossRef]
  31. Walsh, J.P.; Nittrouer, C.A. Understanding fine-grained river-sediment dispersal on continental margins. Mar. Geol. 2009, 263, 34–45. [Google Scholar] [CrossRef]
  32. Denommee, K.C.; Bentley, S.J.; Harazim, D.; Macquaker, J.H. Hydrodynamic controls on muddy sedimentary-fabric de-velopment on the Southwest Louisiana subaqueous delta. Mar. Geol. 2016, 377, 24–36. [Google Scholar]
  33. Bianchi, T.S.; Allison, M.A. Large river deltas and the carbon cycle: A review of the role of deltas in the global carbon cycle and implications for future climate change. Rev. Geophys. 2009, 47, 20. [Google Scholar]
  34. Neill, C.F.; Allison, M.A. Subaqueous deltaic formation on the Atchafalaya Shelf, Louisiana. Mar. Geol. 2005, 214, 411–430. [Google Scholar] [CrossRef]
  35. Septama, E.; Bentley, S.J., Sr. Late Quaternary geomorphology, seabed evolution, and terrigenous sediment delivery to the Pandora and Moresby Troughs, Gulf of Papua. Mar. Geol. 2016, 379, 208–223. [Google Scholar] [CrossRef]
  36. Bolton, A.; Maltman, A. Fluid-flow pathways in actively deforming sediments: The role of pore fluid pressures and volume change. Mar. Petrol. Geol. 1998, 15, 281–297. [Google Scholar] [CrossRef]
  37. Swarbrick, R.E. Pore-pressure prediction: Pitfalls in using porosity. In Proceedings of the Offshore Technology Conference, Houston, TX, USA, 30 April–3 May 2001. [Google Scholar]
  38. Figueredo, N.; Bentley, S.J.; Chaytor, J.D.; Xu, K.; Jafari, N.; Georgiou, I.Y.; Maloney, J. Sedimentary processes and instability on the Mississippi River Delta Front near the Shipwreck of the SS Virginia. Water 2024, 16, 421. [Google Scholar] [CrossRef]
  39. Fitzgerald, S.A.; Klump, J.V.; Swarzenski, P.W.; Mackenzie, R.A.; Richards, K.D. Beryllium-7 as a tracer of short-term sediment deposition and resuspension in the Fox River, Wisconsin. Environ. Sci. Technol. 2001, 35, 300–305. [Google Scholar] [CrossRef] [PubMed]
  40. Corbett, D.R.; Walsh, J.P. 210Lead and 137Cesium: Establishing a chronology for the last century. In Handbook of Sea-Level Research; John Wiley & Sons, Ltd.: Hoboken, NJ, USA, 2015; pp. 361–372. [Google Scholar]
  41. Guzmán, G.; Quinton, J.N.; Nearing, M.A.; Mabit, L.; Gómez, J.A. Sediment tracers in water erosion studies: Current approaches and challenges. J. Soils Sediment 1986, 13, 816–833. [Google Scholar] [CrossRef]
  42. Hülse, P.; Bentley Sr, S.J. A 210Pb sediment budget and granulometric record of sediment fluxes in a subarctic deltaic system: The Great Whale River, Canada. Estuar. Coast. Shelf Sci. 2012, 109, 41–52. [Google Scholar] [CrossRef]
  43. Olley, J.; Burton, J.; Smolders, K.; Pantus, F.; Pietsch, T. The application of fallout radionuclides to determine the dominant erosion process in water supply catchments of subtropical South-east Queensland, Australia. Hydrol. Process. 2013, 27, 885–895. [Google Scholar] [CrossRef]
  44. Blake, W.H.; Walling, D.E.; He, Q. Using cosmogenic beryllium–7 as a tracer in sediment budget investigations. Geogr. Ann. A Phys. Geogr. 2002, 84, 89–102. [Google Scholar] [CrossRef]
  45. Porto, P.; Walling, D.E.; Callegari, G. Using 137Cs and 210Pbex measurements to investigate the sediment budget of a small forested catchment in southern Italy. Hydrol. Process. 2013, 27, 795–806. [Google Scholar] [CrossRef]
  46. Walling, D.E. Beryllium-7: The Cinderella of fallout radionuclide sediment tracers? Hydrol. Process. 2013, 27, 830–844. [Google Scholar] [CrossRef]
  47. Corbett, D.R.; McKee, B.; Allison, M. Nature of decadal-scale sediment accumulation on the western shelf of the Mississippi River delta. Cont. Shelf Res. 2006, 26, 2125–2140. [Google Scholar] [CrossRef]
  48. Charles, M. UNSCEAR Report 2000: Sources and Effects of Ionizing Radiation; United Nations Publication: New York, NY, USA, 2000. [Google Scholar]
  49. Cochran, J.K.; Masqué, P. Short-lived U/Th series radionuclides in the ocean: Tracers for scavenging rates, export fluxes and particle dynamics. Rev. Mineral. Geochem. 2003, 52, 461–492. [Google Scholar] [CrossRef]
  50. Nittrouer, C.A.; Sternberg, R.W. The formation of sedimentary strata in an allochthonous shelf environment: The Washington continental shelf. In Developments in Sedimentology; Elsevier: Amsterdam, The Netherlands, 1981; Volume 32, pp. 201–232. [Google Scholar]
  51. Muhammad, Z.; Bentley, S.J.; Febo, L.A.; Droxler, A.W.; Dickens, G.R.; Peterson, L.C.; Opdyke, B.N. Excess 210Pb in-ventories and fluxes along the continental slope and basins of the Gulf of Papua. J. Geophys. Res. Earth Surf. 2008, 113, F1. [Google Scholar] [CrossRef]
  52. Moore, W.S.; Krest, J. Distribution of 223Ra and 224Ra in the plumes of the Mississippi and Atchafalaya Rivers and the Gulf of Mexico. Mar. Chem. 2004, 86, 105–119. [Google Scholar] [CrossRef]
  53. Baskaran, M.; Swarzenski, P.W. Seasonal variations on the residence times and partitioning of short-lived radionuclides (234Th, 7Be and 210Pb) and depositional fluxes of 7Be and 210Pb in Tampa Bay, Florida. Mar. Chem. 2007, 104, 27–42. [Google Scholar] [CrossRef]
  54. Zhang, Y.; Xu, M.; Wu, T.; Li, Z.; Liu, Q.; Wang, X.; Hou, G. Sources of fine-sediment reservoir deposits from contrasting lithological zones in a medium-sized catchment over the past 60 years. J. Hydrol. 2021, 603, 127159. [Google Scholar] [CrossRef]
  55. Droser, M.L.; Bottjer, D.J. A semiquantitative field classification of ichnofabric. J. Sediment. Res. 1986, 56, 558–559. [Google Scholar] [CrossRef]
  56. Gerland, S.; Villinger, H. Nondestructive density determination on marine sediment cores from gamma-ray attenuation measurements. Geo-Mar. Lett. 1995, 15, 111–118. [Google Scholar] [CrossRef]
  57. Keen, T.R.; Slingerland, R.L.; Bentley, S.J.; Furukawa, Y.; Teague, W.J.; Dykes, J.D. Sediment transport on continental shelves: Storm bed formation and preservation in heterogeneous sediments. In Sediments, Morphology and Sedimentary Processes on Continental Shelves: Advances in Technologies, Research, and Applications; John Wiley & Sons, Ltd.: Hoboken, NJ, USA, 2012; pp. 295–310. [Google Scholar]
  58. Allison, M.A.; Sheremet, A.; Goñi, M.A.; Stone, G.W. Storm layer deposition on the Mississippi–Atchafalaya subaqueous delta generated by Hurricane Lili in 2002. Cont. Shelf Res. 2005, 25, 2213–2232. [Google Scholar] [CrossRef]
  59. Cadigan, J.A.; Jafari, N.H.; Georgiou, I.Y. Mobilized shear strengths of Mississippi River Delta Front sediments during submarine landslides. Geo-Mar. Lett. 2022, 42, 8. [Google Scholar] [CrossRef]
  60. Ge, Z.; Nemec, W.; Vellinga, A.J.; Gawthorpe, R.L. How is a turbidite actually deposited? Sci. Adv. 2022, 8, eabl9124. [Google Scholar] [CrossRef]
  61. Wright, L.D.; Nittrouer, C.A. Dispersal of river sediments in coastal seas: Six contrasting cases. Estuaries 1995, 18, 494–508. [Google Scholar] [CrossRef]
  62. Sommerfield, C.K.; Nittrouer, C.A. Modern accumulation rates and a sediment budget for the Eel shelf: A flood-dominated depositional environment. Mar. Geol. 1999, 154, 227–241. [Google Scholar] [CrossRef]
  63. Clague, J.J. Evidence for large earthquakes at the Cascadia subduction zone. Rev. Geophys. 1997, 35, 439–460. [Google Scholar] [CrossRef]
  64. Donnelly, J.P.; Roll, S.; Wengren, M.; Butler, J.; Lederer, R.; Webb, T., III. Sedimentary evidence of intense hurricane strikes from New Jersey. Geology 2001, 29, 615–618. [Google Scholar] [CrossRef]
  65. Maloney, J.M.; Bentley, S.J.; Xu, K.; Obelcz, J.; Georgiou, I.Y.; Jafari, N.H.; Miner, M.D. Mass wasting on the Mississippi River subaqueous delta. Earth-Sci. Rev. 2020, 200, 103001. [Google Scholar] [CrossRef]
  66. Coleman, J.M. Dynamic changes and processes in the Mississippi River delta. Geol. Soc. Am. Bull. 1988, 100, 999–1015. [Google Scholar] [CrossRef]
  67. Donnelly, J.P.; Giosan, L. Tempestuous highs and lows in the Gulf of Mexico. Geology 2008, 36, 751–752. [Google Scholar] [CrossRef]
  68. Denommee, K.C.; Bentley, S.J.; Droxler, A.W. Climatic controls on hurricane patterns: A 1200-y near-annual record from Lighthouse Reef, Belize. Sci. Rep. 2014, 4, 3876. [Google Scholar] [CrossRef]
  69. Blum, M.D.; Roberts, H.H. Drowning of the Mississippi Delta due to insufficient sediment supply and global sea-level rise. Nat. Geosci. 2009, 2, 488–491. [Google Scholar] [CrossRef]
  70. Xu, K.; Bentley, S.J.; Day, J.W.; Freeman, A.M. A review of sediment diversion in the Mississippi River Deltaic Plain. Estuarine Coastal Shelf Sci. 2019, 225, 106241. [Google Scholar] [CrossRef]
Figure 1. Map outlining the Mississippi River Delta Front (MRDF) study site in vicinity of the “birds’ foot”, (a) displaying the subaerial and subaqueous bathymetry with study sites outlined in red. (b) The Southwest Pass and (c) the South Pass display piston core locations, with black dots and dotted lines outlining a select gully–lobe complex within each. Bathymetry is from Baldwin et al. (2018) [3], imagery is open source “world imagery” from ESRI.
Jmse 12 01644 g001
Figure 3. Downcore physical property profiles for piston cores. Gamma density (solid), porosity (dashed), and mean grain size (phi units in black dots with error bars showing standard deviation) are laid out for the Southwest Pass (top) and South Pass (bottom), ordered by depositional environment.
Jmse 12 01644 g003
Figure 4. Diagnostic X-radiography for each of the depositional environments showing common fabrics present within cores. Red lines indicate possible unconformity locations. By core, (a) PS17-03 undisturbed topset apron with laminated bedding present throughout; (b) PS17-06, a mudflow gully core with large amounts of biogenic gas expansion exacerbated by desiccation with no visible bedding beside an unconformity separating two homogenous layers; (c) mudflow lobe core PS17-07, showing biogenic gas voids below an unconformity; (d) prodelta core PS17-09, with cm-scale sandy layers and abundant burrowing throughout; (e) PS17-24, a mudflow gully core from the South Pass showing a possible unconformity with angled bedding below and homogenous above.
Jmse 12 01644 g004
Figure 5. Depositional mechanism interpretation displayed over stratigraphic profile, gamma density, and 210Pb/137Cs profiles by pass.
Jmse 12 01644 g005
Figure 6. CHIRP seismic profiles parallel to shore, progressing distally (AC) and perpendicular (D), outlined as tracts with corresponding A’–D’ in Figure 1. Identified depositional environments are listed on each transect down to observable seismic basement.
Jmse 12 01644 g006
Figure 7. Depositional environment analysis. (a) Relative composition of cores by sedimentation mechanism, (b) accumulation rates by depositional environments, (c) calculated mudflow return period (years) by depositional environment.
Jmse 12 01644 g007
Figure 8. Site-wide radioisotope analysis with (a) 210Pb radioisotope inventories (top) and (b) 210Pb index analysis by depositional environment. Concentrations of 210Pb show preferential deposition in the undisturbed and gully cores of the Southwest Pass.
Jmse 12 01644 g008
Figure 9. Timeseries of major forcing events (floods/hurricanes/dams) plotted along estimated mudflow occurrence dates by core. Major hurricane occurrences were referenced from the NOAA Historical Hurricane Tracker as category 3+ hurricanes with tracks within 70 miles of the Head of Passes. High-risk hurricanes are those described by Guidroz (2009) [12], and other focused river discharge (Talbert’s Landing) are referenced from the River Gauges Database (USACE). The first occurrence of 137Cs (1953) forms a backstop for cores PS17-09, PS17-24, and PS17-30 and a forestop in PS17-03. The arrows indicate the South Pass depositional hiatus of hypopycnal deposition at much lower rates to the base of the core (listed in Table 1). Asterix (*) indicates calculation based off of 137Cs due to the full penetration.
Jmse 12 01644 g009
Table 1. Core diagnostic information with associated 137Cs/210Pb observations, sediment accumulation rates (SARs), and calculated age of the deposits. Southwest Pass cores indicate a much younger age, a more rapid rate of deposition averaging 82 years in age, and a 0.84 m/decade SAR. In comparison to the South pass average age of 485 years and the 0.30 m/decade SAR, this indicates a much more active source-to-sink delivery for the SWP. “ND” represents cores in which 137Cs was not detected.
Location (Pass)StationFaciesDistance from Pass (km)Depth (m)Average137Cs Penetration Depth (cm ± 6)137Cs SAR (m/decade)210PbAge of Deposit (years)Year of Recent SAR Shift
Gamma Density (g/cm3)PorosityGrainsize (Φ)SAR (m/decade)R2 (Equation (1))
South West PassPS17-03Und12.4867.71.560.697.11440.270.420.76125 ± 2.91999 ± 2.9
PS17-06Gul10.0555.81.450.756.91552≥0.941.280.45≥64 ± 0.9N/A
PS17-07Lob11.9980.51.420.777.44576≥0.860.880.61≥64 ± 1.12007 ± 1.1
PS17-09Pro15.8986.31.490.737.582880.540.790.674 ± 1.52006 ± 1.5
Average 12.672.51.480.747.263900.650.840.6182
South PassPS17-22Und16.73154.21.520.717.64NDND0.190.72775 ± 6.182005 ± 6.18
PS17-24Gul17.02149.41.540.77.421440.280.260.61329 ± 2.341993 ± 2.34
PS17-30Lob18.4179.51.520.717.722400.460.570.55161 ± 1.131980 ± 1.13
PS17-38Pro22.122521.690.617.94180.040.080.92673 ± 7.51985 ± 7.5
Average 18.57183.81.570.687.681340.260.30.69485
Table 2. Radioisotope inventories calculated from Muhammed et al. (2008) [52], organized by pass and depositional environment. Southwest Pass cores show approximately 1.5 times the activity of the South Pass, with a focusing factor in the vicinity of the Southwest Pass cores existing at four (4) times that of the South Pass.
Location (Pass)StationFacies210Pb Inventory210Pb Focusing Index (R)
South West PassPS17-03Und7132.72
PS17-06Gul230010.6
PS17-07Lob3080.99
PS17-09Pro8272.47
Total 4149
Average 10374.2
South PassPS17-22Und2340.39
PS17-24Gul6891.19
PS17-30Lob8661.25
PS17-38Pro8590.88
Total 2650
Average 6620.93
Table 3. Depositional environment interpretations and mudflow return period by depositional environment and Pass.
Location (Pass)StationFaciesDistance from Pass (km)Depth (m)Depositional Environment (%)SAR (m/decade)Mudflow
HypopycnalGravity DrivenHydrodynamicQuantity Per CoreThickness Ave. (cm)Event Return Period (Years)
South West PassPS17-03Und12.567.775.921.92.10.4619.221
PS17-06Gul10.055.87.792.301.369811
PS17-07Lob12.080.543.956.000.9477.316
PS17-09Pro15.986.371.023.45.50.8345.724
Average 12.672.549.648.41.90.84.860.018
South PassPS17-22Und16.715490.29.000.2322.7250
PS17-24Gul17.014966.731.700.3553.667
PS17-30Lob18.417979.020.800.6822.120
PS17-38Pro22.125274.330.300.1440.8167
Average 18.618477.623.000.3534.8126
Table 4. Diagnostic sediment properties for depositional environments within the MDRF.
Depositional MechanismDiagnostic CharacteristicsOccurrence (2017 Study)
Gamma Density/Grain Size210Pb/137Cs GeochronologyFabrics (X-Radiography)
Hypopycnal Fluvial SedimentationGradual increase in gamma density with depth due to consolidation (1.0–1.6 g/cc); No appreciable varriation in GS downcore210Pb shows exponensial regression with undisturbed, gradually deposited sediment; 137Cs shows no corelation with Hypopyccal seimentary structures Fabrics show laminated to massive bedding generally lacking gas voids at the surface with gas voids present down core (below ~300 cm)PS17-03 55 cm (Apron) PS17-07 60 cm (Lobe) PS17-38 30 cm (Prodelta)
Hydrodynamic Sedimentation EventIncreased magnetude spike surpassing bckground sawtooth fluctuation with excursions of ≥2.0 g/cc (cm scale); GS fluctiuation ≤6 ɸReduction in 210Pb/137Cs activity due to scavenging occuring. Nature of cm scale event layers limit geochronology indicatorsEvent layers show a contact with higher contrast sand layers present. Both planar and convolute bedding differentially effected by local bioturbationPS17-03 20 cm (Apron) PS17-09 52 cm (Prodelta)
Gravity Driven Sedimentation“Stairstep Profile” Marked decrease (0.2–0.5 g/cc) from overlying profile with a sharp boundary on the lower sediment contact: GS following generally at lower magnetude "Stairstep Profile" Marked decrease in unsupported 210Pb with a sharp boundary on the lower contact; 137Cs though not a direct indicator, is cut off at the lower 210Pb mudflow baseFabrics show high constituents of organic material (mm scale) through the sediment layer with a sharp unconformity present at the base PS17-06 315 cm (Gully) PS17-07 115 cm (Prodelta) PS17-24 162 cm (Gully)
Disclaimer/Publisher’s Note: The statements, opinions and data contained in all publications are solely those of the individual author(s) and contributor(s) and not of MDPI and/or the editor(s). MDPI and/or the editor(s) disclaim responsibility for any injury to people or property resulting from any ideas, methods, instructions or products referred to in the content.