Abstract
Salt marshes are declining due to the dual pressures of coastal erosion and land reclamation. However, there remains a lack of quantitative analysis regarding this reduction process and its driving mechanisms. This study examines the dynamics and influencing factors of salt marsh vegetation along the eroding coastline of Sheyang County, Jiangsu Province, China, between 1985 and 2020, using remote sensing to analyze changes in artificial coastlines, water boundaries, vegetation front edge, and its topography. Our results showed an extensive seaward movement of artificial coastlines due to reclamation, coupled with severe reductions in salt marsh area and width. Coastal erosion further caused a 10.5% decline in vegetation elevation and a 46.7% increase in slope steepness, amplifying vulnerability to wave action. Native species were largely replaced by Spartina alterniflora, reducing ecological diversity. Currently, human pressure on the landward side has been alleviated; thus, addressing coastal erosion is vital to preventing the further loss of salt marshes. Sediment retention engineering and native vegetation restoration efforts can gradually facilitate the recovery of salt marshes. This study provided critical insights for sustainable coastal management under bidirectional pressures.
1. Introduction
Coastal salt marshes are wetland ecosystems covered by salt-tolerant herbaceous or low shrub vegetation at the land and sea interface [1]. Salt marsh communities are distributed in the upper intertidal zone, with high species richness. There are approximately 500 species of salt marsh organisms [1]. Wetlands are not only covered with common coastal plants but also rich in benthic organisms in the intertidal zone, which are important parts of the “blue carbon” ecosystem. Salt marsh wetlands play important roles in protecting biodiversity, attenuating waves, and improving water quality and carbon storage [2,3,4].
Salt marshes are characterized by periodic tidal inundation, complex biogeomorphic dynamics, and fragile ecosystems [5,6]. They are gradually degraded and disappear under the bidirectional “coastal squeeze” pressure of humans and nature [7,8,9]. Globally, there was a net salt marsh loss of 1452.84 km2 from 2000 to 2019, primarily driven by hurricanes and coastal erosion [10]. From the 1980s to the 2010s, 59% of salt marshes in China were lost with the main threat of reclamation [11]. On the one hand, under the influence of human activities such as mudflat reclamation and aquaculture, the artificial coastline gradually pushed seaward, and a large number of salt marsh wetlands were occupied and lost [12,13]. On the other hand, about 7.3% of China’s muddy coasts are affected by natural erosion [14], leading to sediment loss, coastline retreat, and beach undercutting. These processes often force salt marsh plants to migrate inland [15]. Furthermore, rising sea levels exacerbate these challenges by increasing inundation and altering sediment dynamics. Studies indicated that 40% to 95% of global salt marshes could be submerged under predicted rates of sea level rise [16], resulting in significant habitat loss and shrifts toward lower-elevation marsh species or open water environments [17]. This submersion not only affects vegetation zonation but also reduces marsh sediment trapping capacity, further compromising their resilience to sea level rise [18]. Although landward migration of salt marsh plants is a natural response to rising sea levels, the process is impeded by hard infrastructure, such as reclamation projects and seawalls, which disrupt hydrological and biological pathways. This fragmentation compromises wetland continuity and leads to a more patchy and isolated distribution [19,20]. This bidirectional “squeeze” effect on coastal salt marshes is particularly obvious in the nearshore coastal areas, especially in salt marshes where coastal erosion occurs [8]. Therefore, understanding the losses of coastal salt marshes caused by coastal squeeze is crucial for the protection of salt marshes.
Current research on the loss of coastal salt marshes caused by reclamation mainly focuses on reduction in vegetation area, changes in species composition, and succession processes [13,20,21,22,23,24]. The impacts of erosion are often analyzed using remote sensing to track coastline changes and investigate their driving mechanisms, as well as to assess the effects of coastline changes on vegetation area [15,24]. At a finer scale, studies examine the responses of salt marsh edge morphology and mudflat topography to erosion through field measurements or physical model experiments, revealing the interactions between physical factors, such as waves, and biological factors, including plants and sediments, during the erosion process [25,26,27,28].
Research on the bidirectional “squeeze” of coastal salt marshes by both natural and human factors remains relatively limited. Existing studies mainly focus on the changes and loss rates of salt marsh areas under bidirectional pressures [20], alterations in tidal channel networks and tidal connectivity [29], as well as the width thresholds and migration trajectory of vegetation zones under coastal squeeze [30,31]. However, due to the complexity of salt marsh ecosystems, the rates of coastal squeeze and salt marsh degradation do not exhibit synchronous patterns. Most previous studies have concentrated on quantitative changes and their impacts on species distribution. There remains a lack of research on the specific degradation processes of salt marsh wetlands under the coastal squeeze, as well as the spatial and topographic characteristics of degraded areas. Furthermore, the coupling relationships among reclamation, erosion, and vegetation dynamics remain unclear, representing a critical challenge for future research.
This study selected the typical eroded coastal zone of Sheyang County, Jiangsu Province, China, as a research area. Through remote sensing interpretation of vegetation front edge, water boundary, artificial coastline, and topographic changes from 1985 to 2020, this study explores the process of coastal erosion and reclamation, as well as their bidirectional “squeeze” effects on salt marsh vegetation zones. This study will provide technical support for the ecological protection and restoration of salt marshes along the eroded coast.
2. Methods
2.1. Study Areas
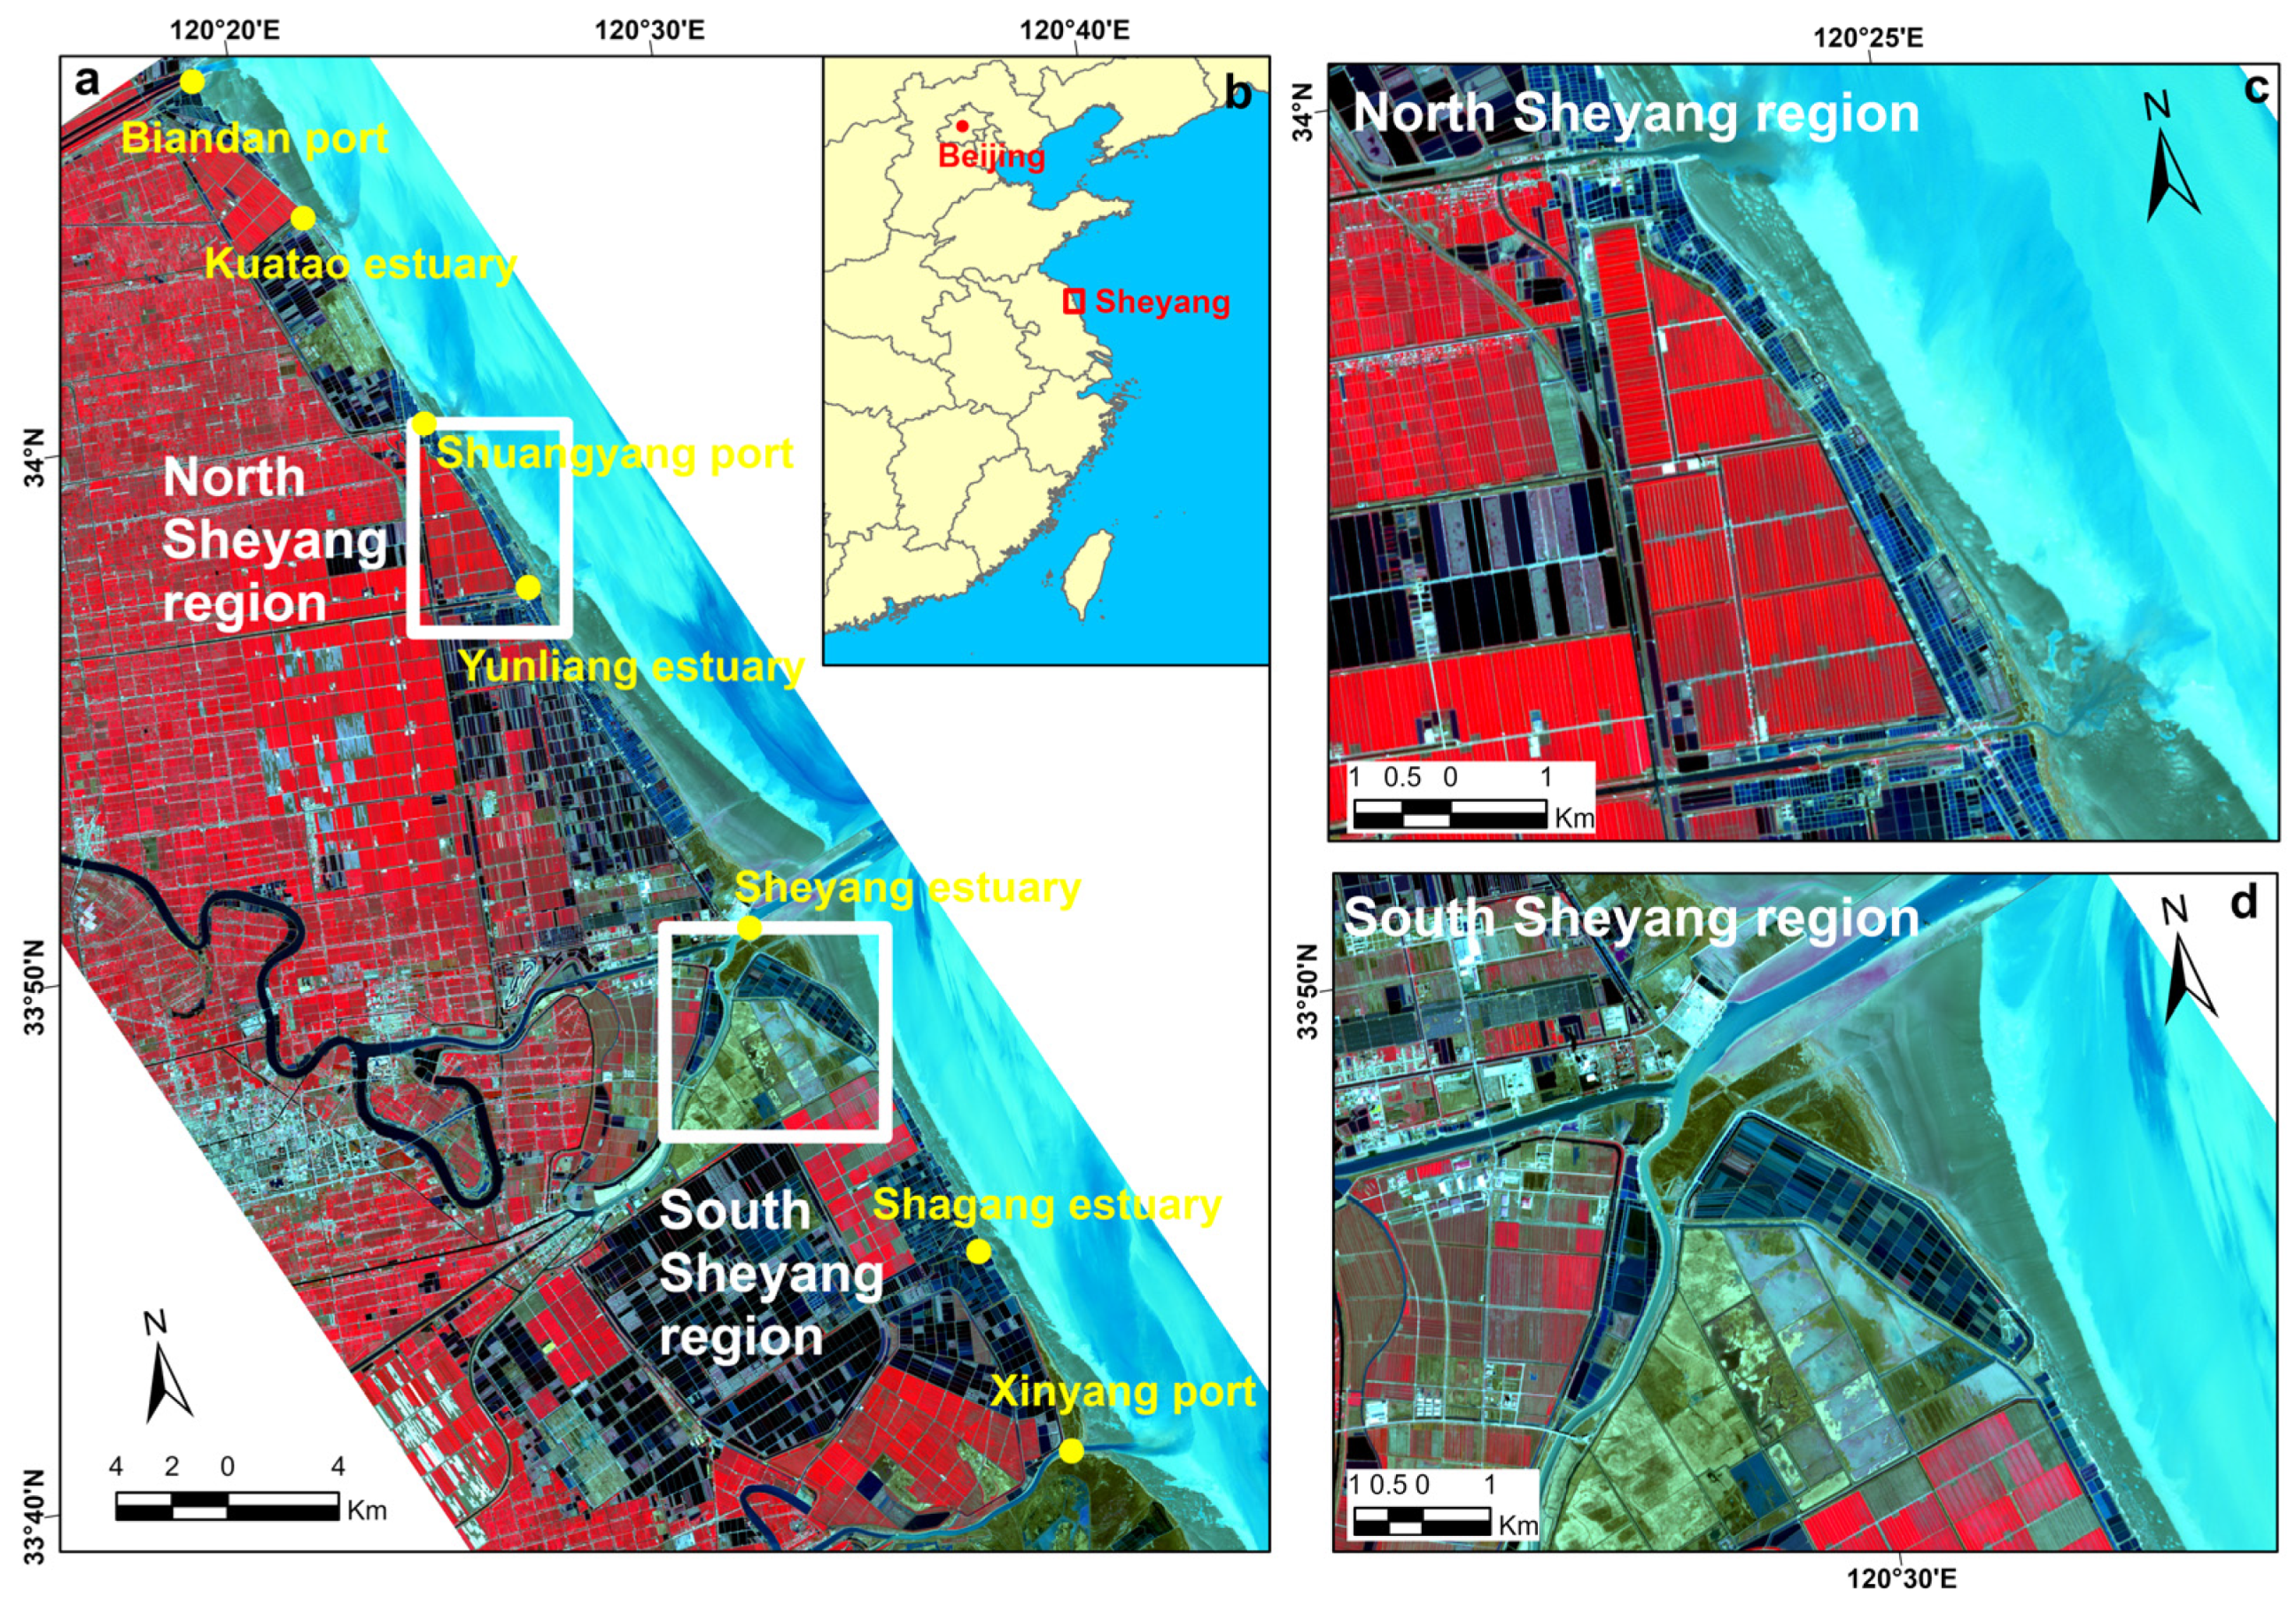
The study area is located in Sheyang County, Jiangsu Province, China (Figure 1). The Sheyang coastal zone is a typical erosive, muddy coast in China. The tidal range gradually increases from north to south, ranging from 1.8 m to 2.7 m, and belongs to the open coast dominated by medium and strong tides. Under the influence of the Yellow River diversion, the source of sediment is reduced, and the coastal zone suffers obvious coastal erosion under wave action. At the same time, extensive reclamation activities were conducted in the Sheyang coastal zone. From 1980 to 2014, the reclamation area in Sheyang County has been on the rise, with a total area of approximately 307 km2 [32]. In 2009, the coastal development of Jiangsu was upgraded to a national strategy, and the functional positioning of different coastal regions was gradually clarified. The coastal area of Sheyang County was designated as a key marine ecological functional zone, and development activities that did not comply with the protection objectives were highly restricted, resulting in a decline in reclamation rates. By 2010, the artificial coastline had almost stabilized, except for small changes in some sections. Sheyang County’s coastline has long been subjected to simultaneous coastal squeeze impacts from erosion and reclamation, making it an ideal case for studying the response of salt marsh vegetation to this phenomenon.
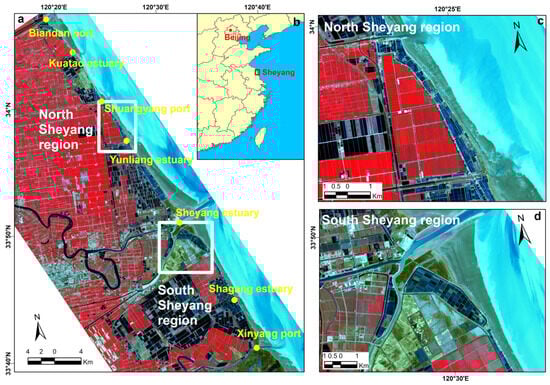
Figure 1.
Location of the research area ((a): Location of Sheyang County and various ports/estuaries, (b): Location of Sheyang County along the coast of China, (c): North Sheyang Region, (d): South Sheyang Region. The base map is a Sentinel-2 image acquired on 5 August 2020, and the false color composition is based on bands 7, 4, and 3).
2.2. Remote Sensing Analysis
Landsat/Sentinel remote sensing images were selected from 1985 to 2020 (at 5-year intervals) to study the variation of land artificial coastline, water boundary, and vegetation front edge. The details of the acquired images used in this study are listed in Table S1. The land artificial coastline was obtained in ArcGIS 10.8 (https://www.esri.com/zh-cn/arcgis/products/arcgis-desktop/resources, accessed on 24 November 2024) by visually interpreting the satellite images of corresponding years, which were mainly the peripheral lines of dams and ponds. The water boundary was obtained by visual interpretation based on the instantaneous water boundary line at the mean lowest tide. The landward or seaward movement of water boundary was used to characterize coastal siltation or erosion in this study. The vegetation interpretation method is a supervised classification method based on a support vector machine to obtain the species and area distribution of salt marsh vegetation beyond the artificial coastline; the details of the salt marsh classification method can refer to Chen et al. and Gu et al. [9,21]. The vegetation front edge is clarified as a seaward boundary of salt marsh vegetation.
The analysis of changes in the land’s artificial coastline, water boundary, and vegetation front edge adopted the Digital Shoreline Analysis System (DSAS) v5.0 (https://www.usgs.gov/software/digital-shoreline-analysis-system, accessed on 24 November 2024) plug-in in ArcGIS 10.8 [33]. A total of 689 sections with 100-m intervals were defined along the coastline. The section range of the Sheyang County coastline was from 10 to 593. The offshore distances of the land artificial coastline, water boundary, and vegetation front edge were calculated based on the land artificial coastline in 1985. The average annual change rate of the coastline was calculated using the DSAS linear regression algorithm, with the consideration of multiple year periods. To quantitatively characterize the impact of erosion, the analysis was conducted during the relatively stable period of artificial coastline from 2010 to 2020.
North Sheyang (Shuangyang port to Yunliang estuary) and South Sheyang (south side of the Sheyang estuary) coastal areas were selected for interpreting the erosion terrain change (Figure 1), and the elevation data interpreted from Landsat remote sensing images were used to obtain the terrain change at the junction of salt marsh vegetation and intertidal mudflats from 2000 to 2020 (at 5-year intervals).
3. Results
3.1. Changes in Artificial Coastlines
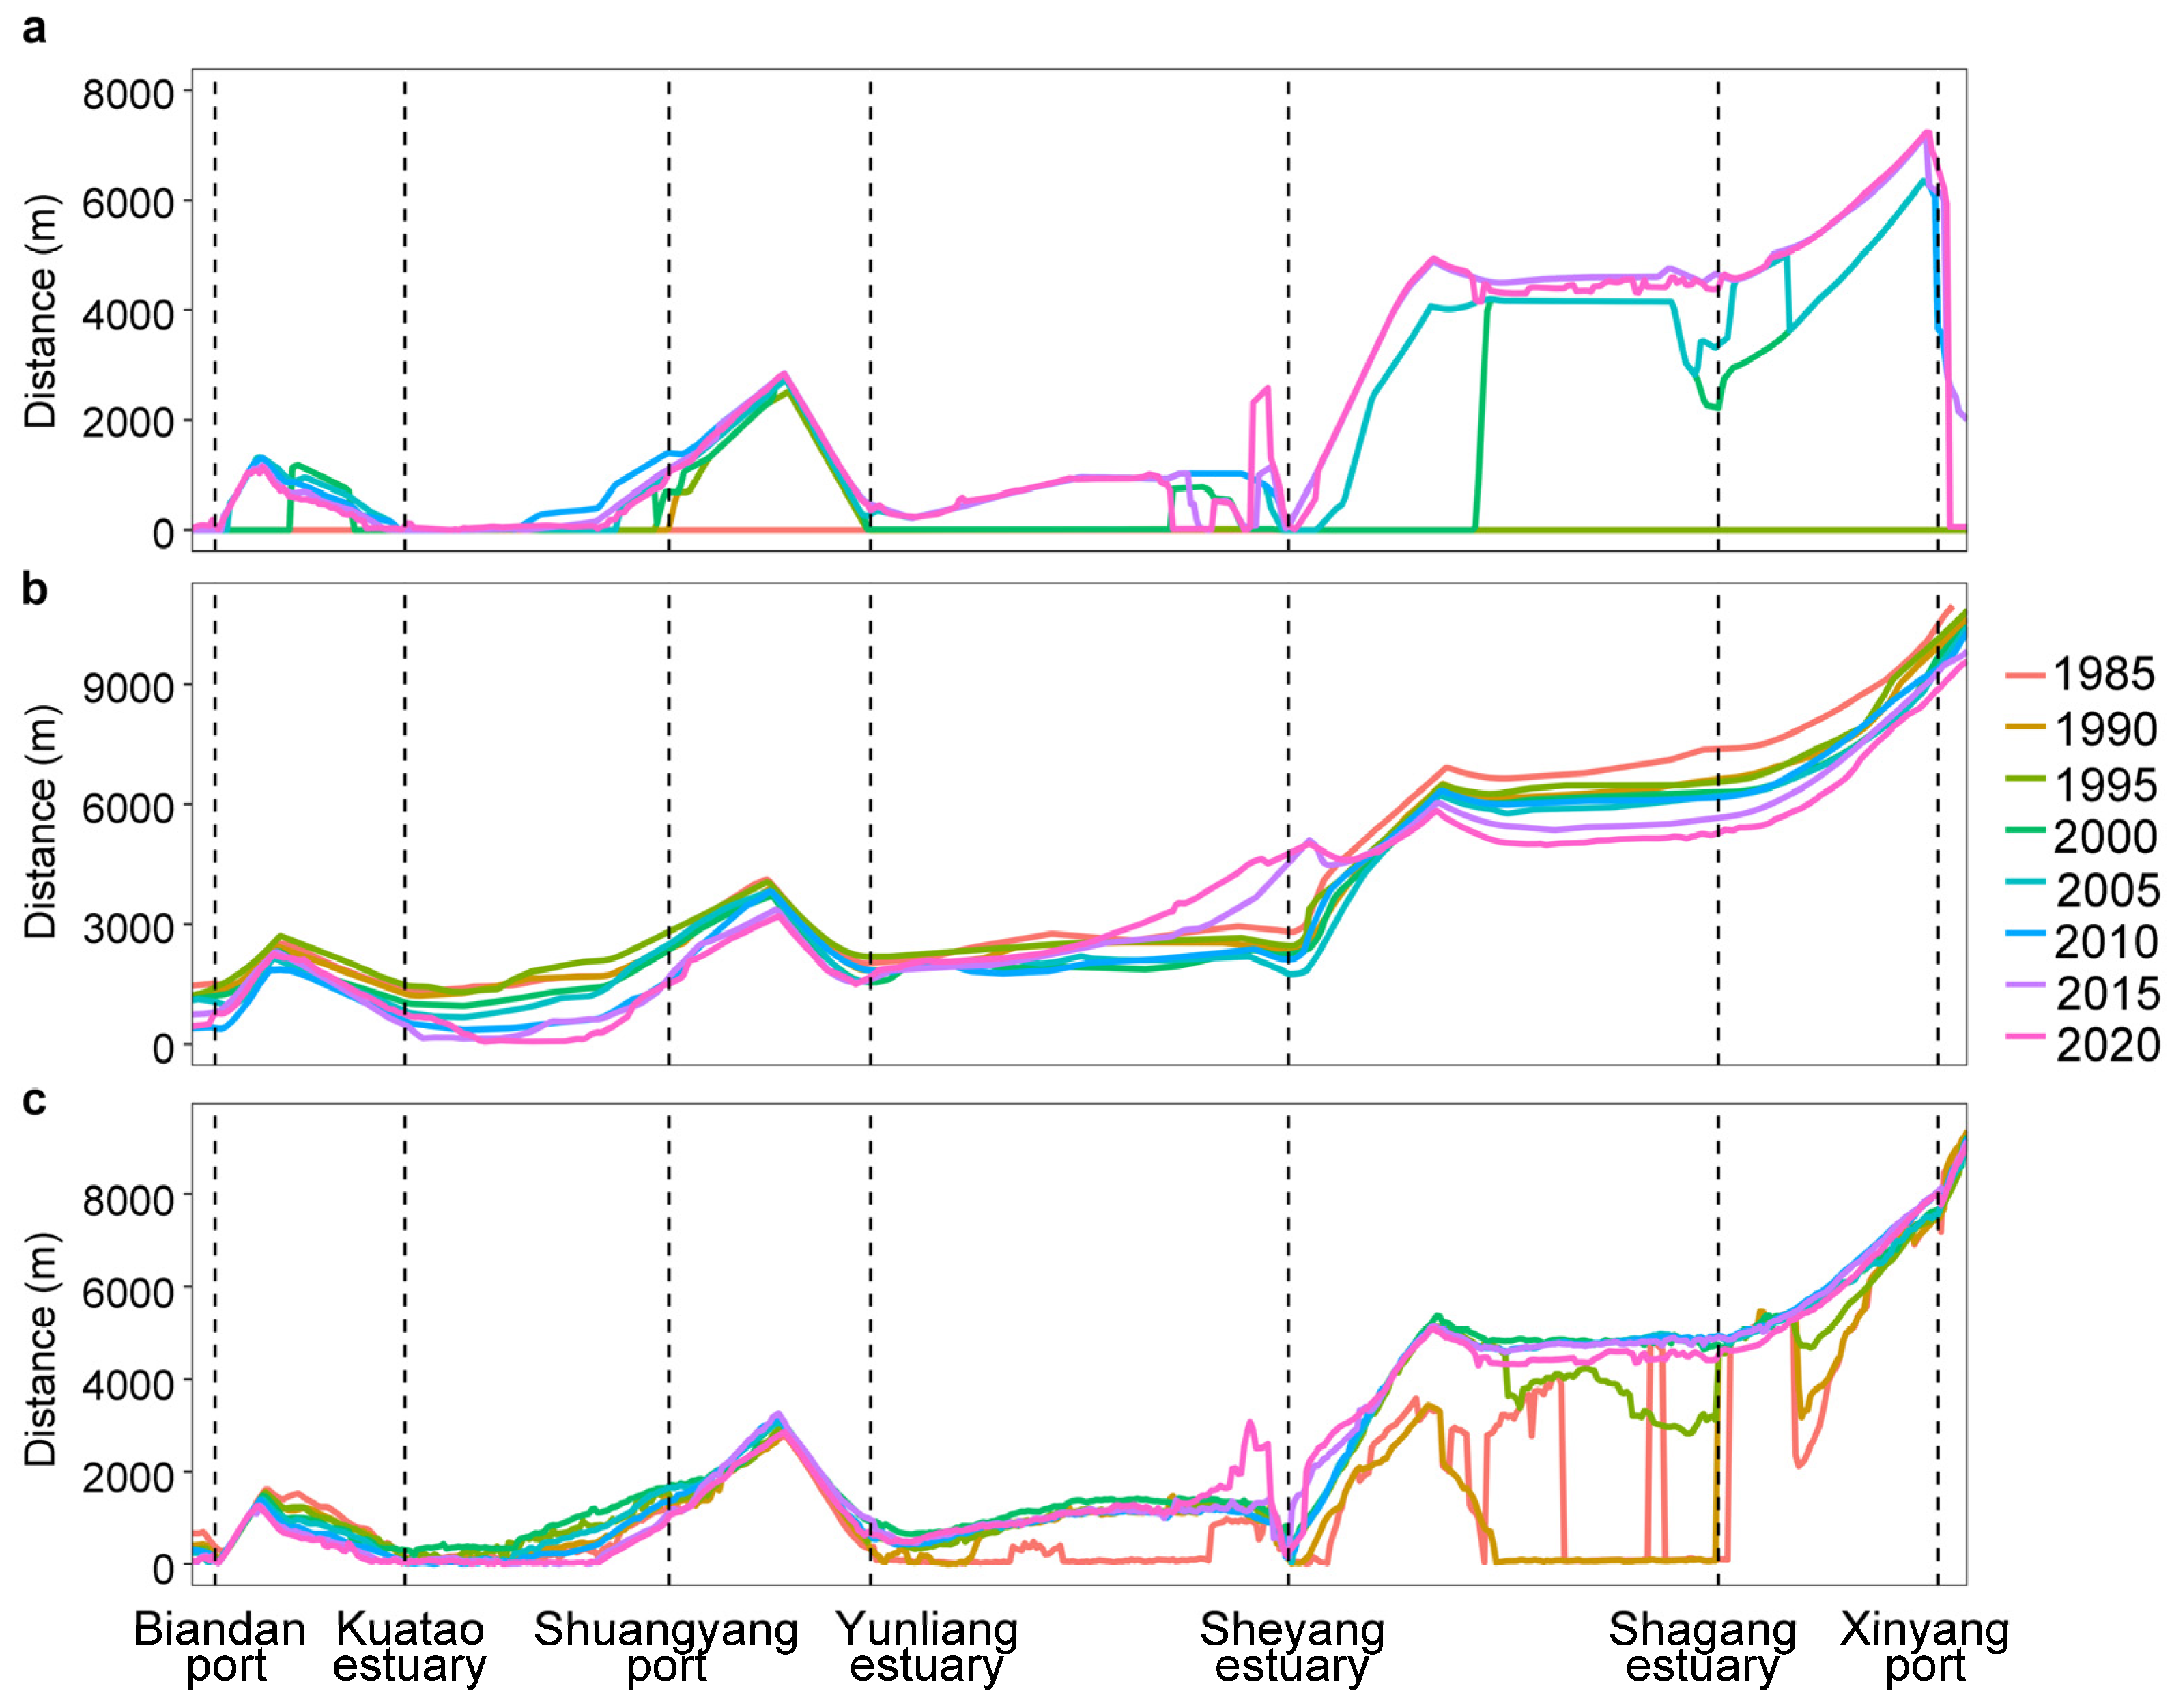
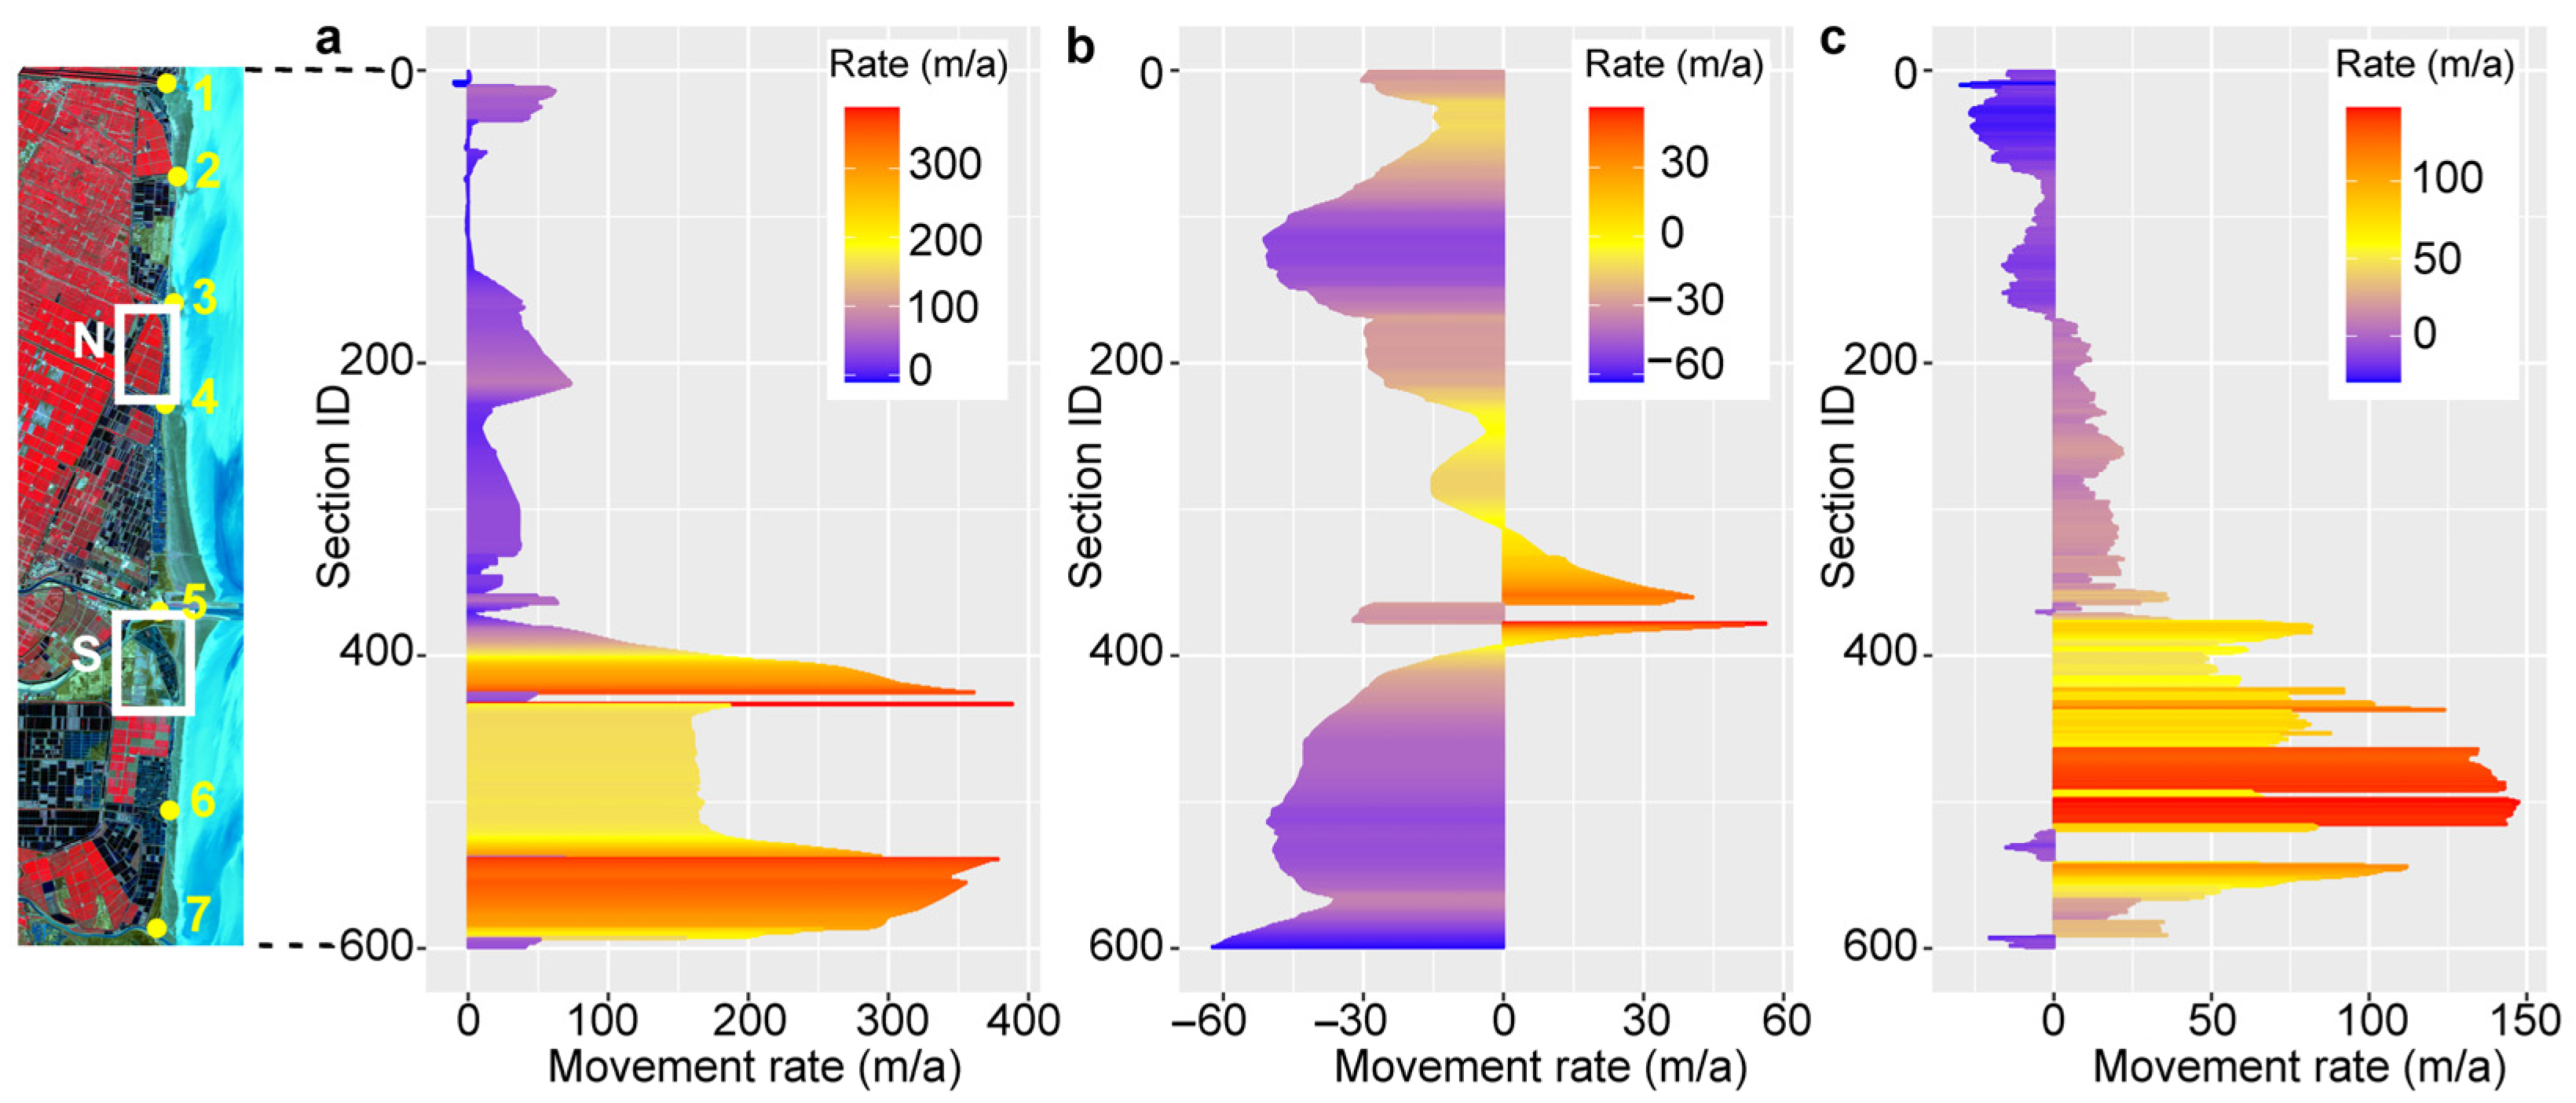
From 1985 to 2020, the maximum movement distance of the artificial coastline in Sheyang County ranged from 2 to 10,511 m, with an average maximum movement distance of 2681 ± 2700 m (Figure 2a). The average annual rate of movement ranged from −10 to 389 m/a, with a mean rate of 85 m/a (Table 1). Overall, the artificial coastline exhibited a trend of seaward advancement during this period (Figure 3a).
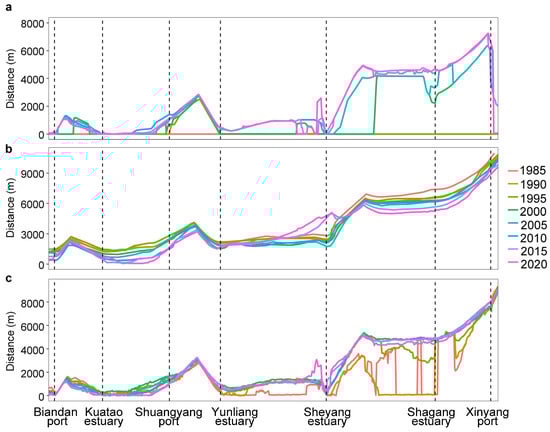
Figure 2.
Interannual variation of offshore distance with different boundary lines (based on the 1985 land artificial coastline, (a): land artificial coastline, (b): water boundary, (c): vegetation front edge).

Table 1.
Changes in the artificial coastline, water boundary, and vegetation front edge along the Sheyang coast and two subregions (AC: artificial coastline, WB: water boundary, VFE: vegetation front edge. The numbers in parentheses are averages ± std).
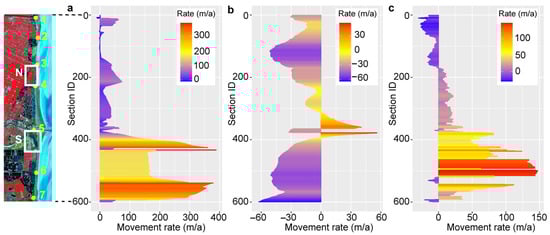
Figure 3.
Average movement rate of different boundary lines from 1985 to 2020 (The left map is a Sentinel-2 image acquired on 5 August 2020, and false color composition is based on bands 7, 4, and 3. Numbers 1 to 7 represent the Biandan port, Kuatao estuary, Shuangyang port, Yunliang estuary, Sheyang estuary, Shagang estuary, and Xinyang port, respectively. Rectangles N and S represent the North Sheyang region and the South Sheyang region. Section ID from small to large represents the Sheyang section from north to south, (a) land artificial shoreline, (b) water boundary, and (c) vegetation front edge).
From 1985 to 2020, the maximum movement distance of the artificial coastline in North Sheyang (section 162 to 226) ranged from 1238 to 3748 m, with an average maximum movement distance of 2523 ± 722 m. The average annual movement rate ranged from 31 to 73 m/a, with a mean rate of 51 m/a. In contrast, the maximum movement distance of the artificial coastline in South Sheyang (section 380 to 436) ranged from 564 to 10,239 m, with an average maximum movement distance of 4874 ± 2788 m. The average annual movement rate in this region ranged from 34 to 389 m/a, with a mean annual rate of 184 m/a (Table 1). The rate of seaward expansion of the artificial coastline in South Sheyang was approximately 3.6 times that of North Sheyang. Additionally, the artificial coastline of Sheyang County showed signs of stabilization after 2010.
3.2. Changes in Water Boundary
Between 1985 and 2020, the maximum movement distance of the water boundary in Sheyang County ranged from 345 to 3295 m, with an average maximum movement distance of 1382 ± 533 m (Figure 2b). The average annual movement rate ranged from −55 to 56 m/a, with a mean rate of −25 m/a, indicating an overall state of coastline erosion (Table 1, Figure 3b). Except for the sections near the Sheyang estuary, most other areas were subject to erosion.
In North Sheyang, the maximum movement distance of the water boundary ranged from 683 to 1438 m, with an average maximum movement distance of 1070 ± 156 m. The average annual movement rate ranged from −35 to −15 m/a, with a mean rate of −27 m/a. In contrast, in South Sheyang, the maximum movement distance ranged from 866 to 3007 m, with an average maximum movement distance of 1362 ± 485 m. The average annual movement rate ranged from −34 to 46 m/a, with a mean rate of −13 m/a (Table 1). The erosion rate in North Sheyang was approximately 2.1 times higher than that in South Sheyang.
To eliminate the potential influence of artificial coastline variation, further analysis was conducted on the changes in the water boundary between 2010 and 2020 after the artificial coastline had stabilized. During this period, the average movement distance of the water boundary in North Sheyang was −554 ± 240 m, with an average annual movement rate of −55 m/a. In South Sheyang, the water boundary exhibited both seaward siltation and landward erosion. The average movement distance of the seaward siltation sections (cross-section 380 to 399) was 672 ± 561 m, with an average annual siltation rate of 67 m/a. Meanwhile, the landward erosion sections (section 400 to 436) experienced an average movement distance of −505 ± 436 m, with an average annual erosion rate of −50 m/a.
3.3. Changes in Vegetation Front Edge
From 1985 to 2020, the maximum movement distance of the vegetation front edge in Sheyang County ranged from 202 to 9123 m, with an average maximum movement distance of 2074 ± 2123 m (Figure 2c). The average annual movement rate ranged from −30 to 358 m/a, with a mean rate of 41 m/a, showing an overall trend of seaward advancement (Table 1, Figure 3c).
In North Sheyang, the maximum movement distance of the vegetation front edge ranged from 288 to 837 m, with an average maximum movement distance of 574 ± 133 m. The average annual movement rate ranged from −8 to 13 m/a, with a mean rate of 7 m/a. In contrast, in South Sheyang, the maximum movement distance ranged from 1737 to 4502 m, with an average maximum movement distance of 2697 ± 763 m. The average maximum movement rate ranged from 46 to 113 m/a, with a mean rate of 65 m/a (Table 1). The rate of seaward vegetation expansion in South Sheyang was approximately 9.3 times higher than that in North Sheyang.
Given the dominant anthropogenic influences on Sheyang County’s coastline, which resulted in frequent changes to the artificial coastline, the vegetation front edge was also affected. To better understand these dynamics, further analysis was conducted on changes in the vegetation front edge under relatively stable artificial shoreline conditions from 2010 to 2020.
During this period, the vegetation front edge in North Sheyang exhibited a landward retreat, with an average movement distance of −241 ± 138 m and an average annual retreat rate of −24 m/a. In South Sheyang, both seaward expansion and landward retreat trends were observed. The seaward expansion sections (section 380 to 401) showed an average movement distance of 814 ± 478 m, with an average annual expansion rate of 81 m/a. Conversely, the landward retreat sections (section 402 to 436) had an average movement distance of −101 ± 73 m, with an average annual retreat rate of −10 m/a.
3.4. Salt Marsh Vegetation and Its Topographic Variations
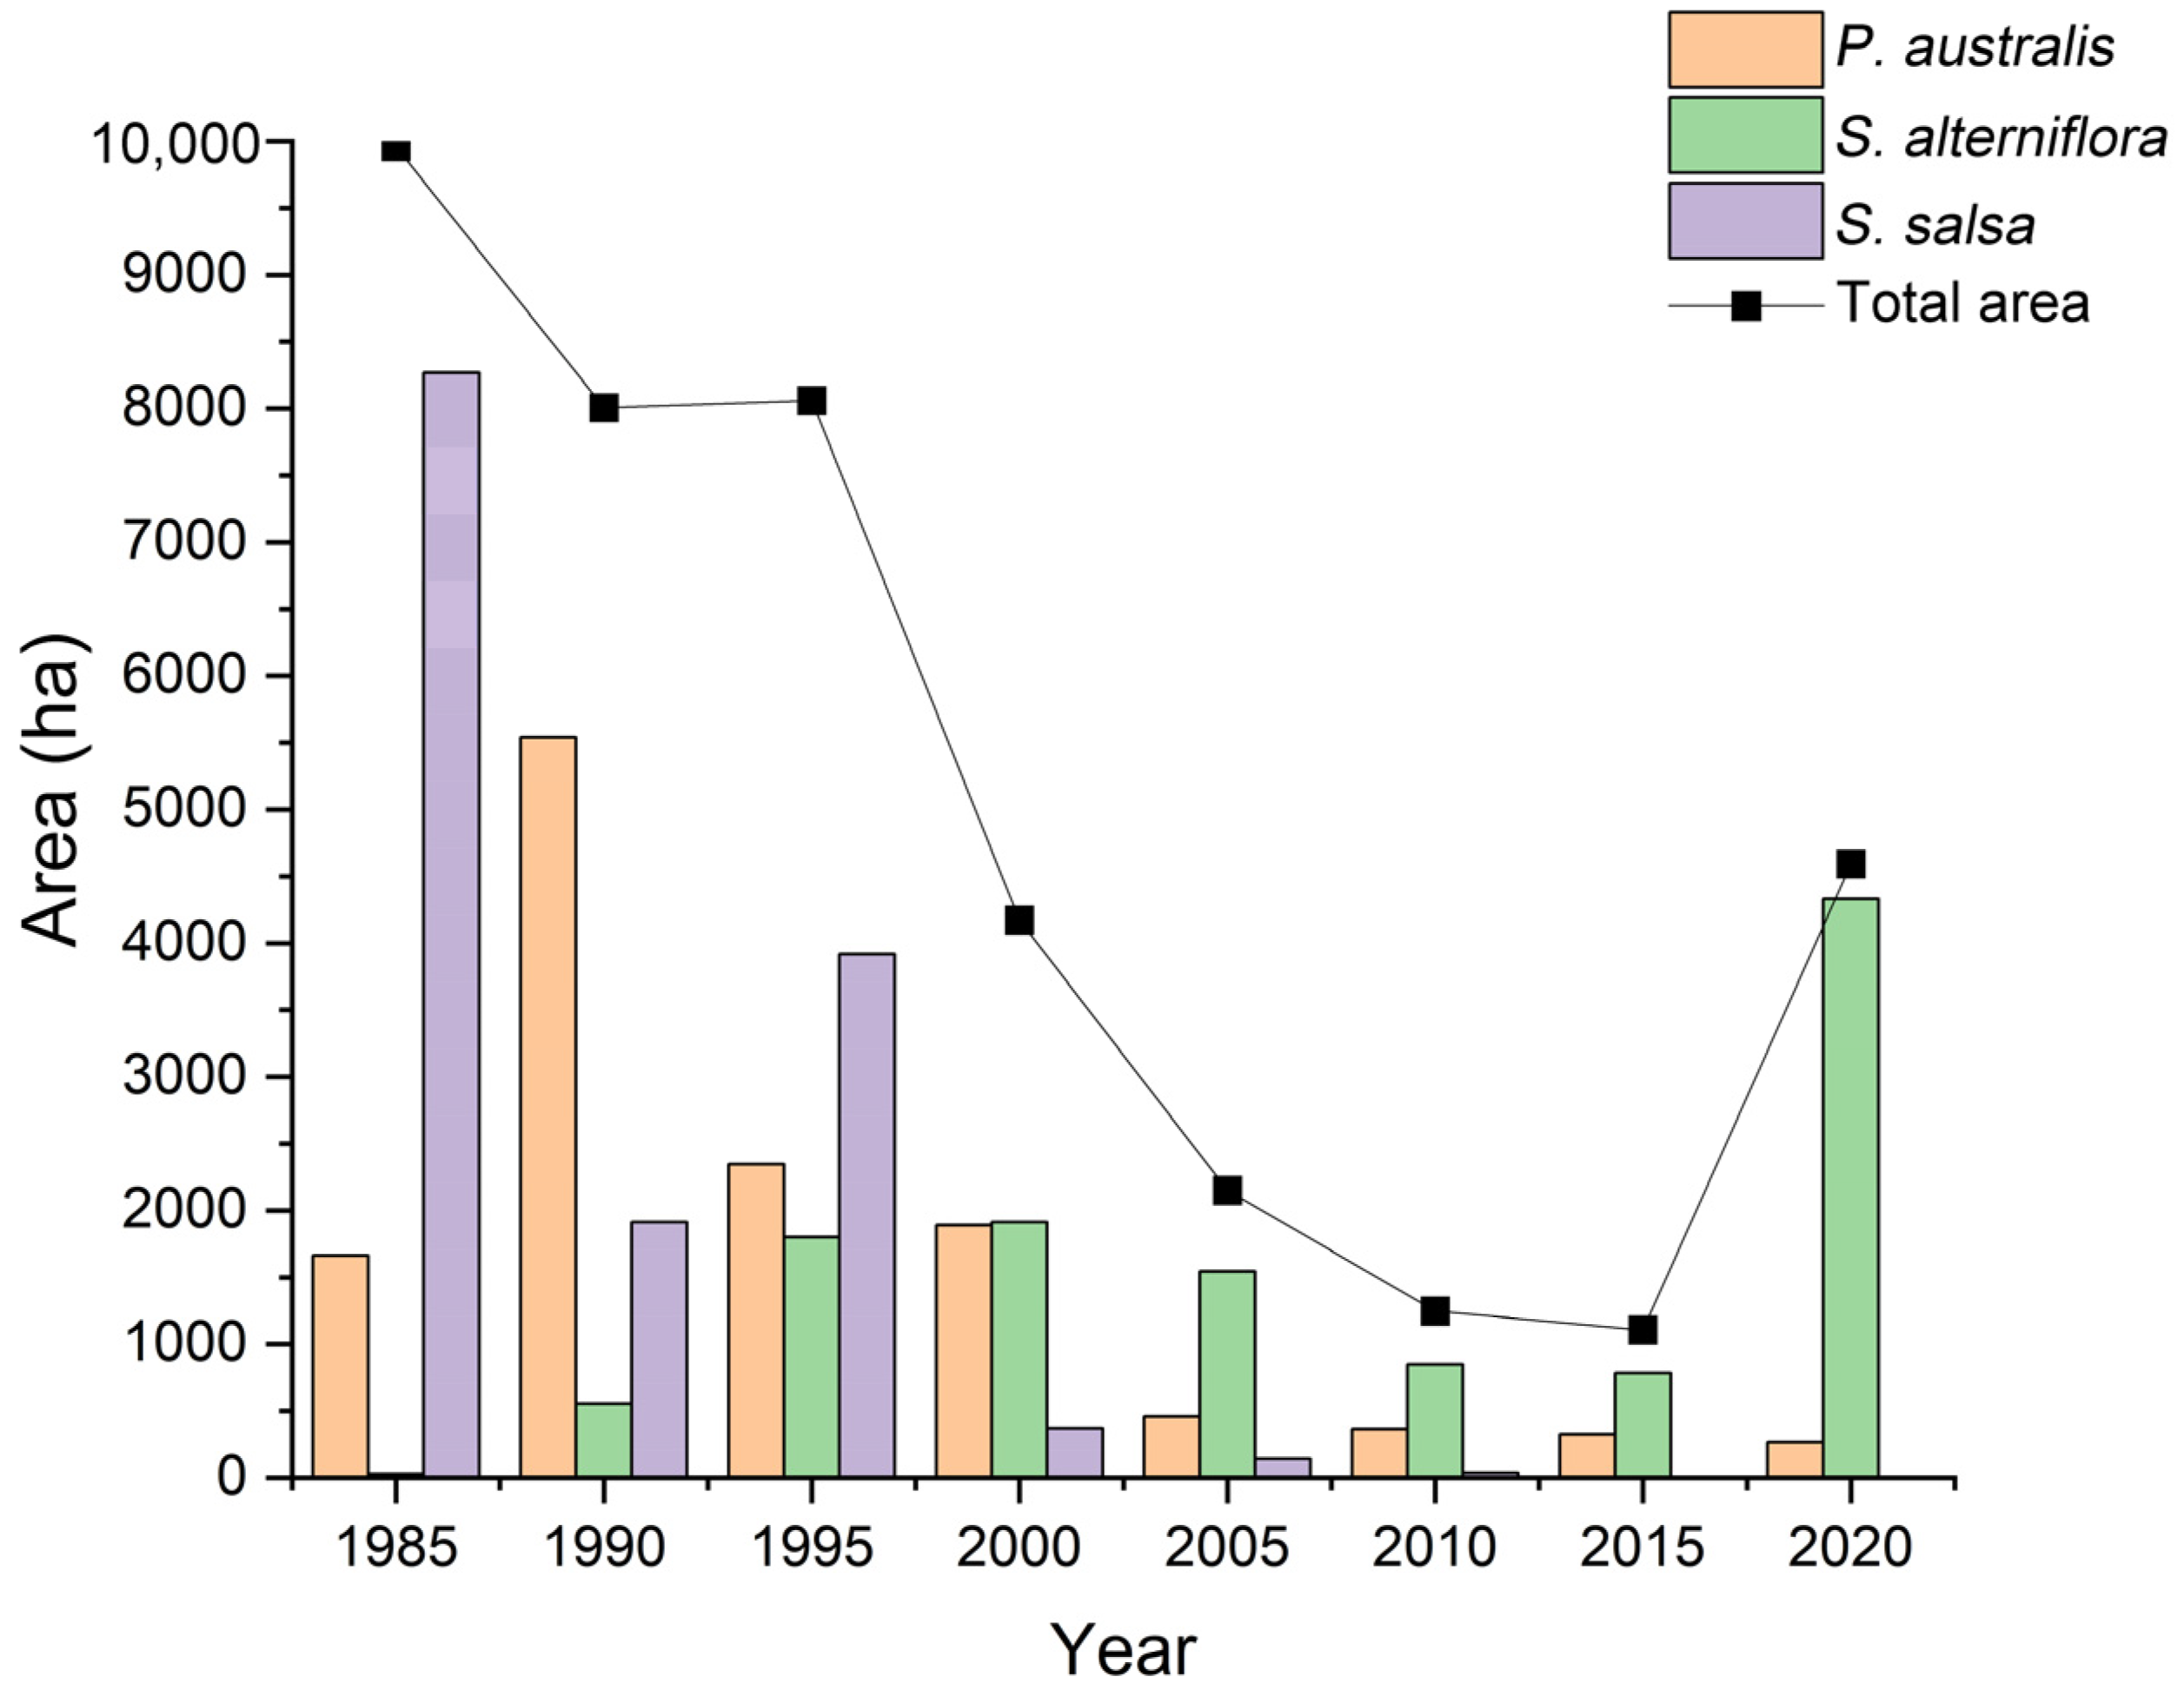
Between 1985 and 2020, the total area of salt marsh vegetation in Sheyang County showed a decreasing trend. However, from 2015 to 2020, the total area showed a slight increase, primarily driven by the rapid expansion of Spartina alterniflora. Prior to 1995, Phragmites australis and Suaeda salsa were the dominant salt marsh species in Sheyang County. Their areas declined sharply after 1995 due to extensive reclamation activities and the aggressive spread of Spartina alterniflora (Figure 4). At present, the salt marshes in Sheyang County are predominantly composed of Spartina alterniflora.
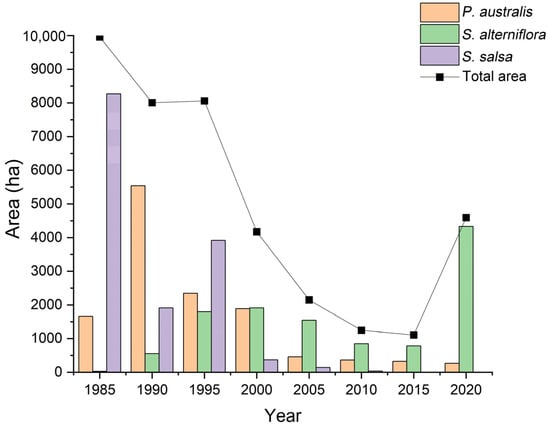
Figure 4.
Changes in vegetation area of salt marshes outside the artificial coastline in Sheyang County.
Over the past 35 years, the distribution width of vegetation outside the artificial coastline in Sheyang County decreased by 83%. From 1985 to 2010, the average vegetation width continuously declined from 1945 to 253 m, representing an 87% reduction. However, between 2010 and 2020, the average width slightly increased, reaching 329 m in 2020. This increase was mainly attributed to mudflat expansion and the spread of Spartina alterniflora, facilitated by the construction of double dikes at the Sheyang estuary.
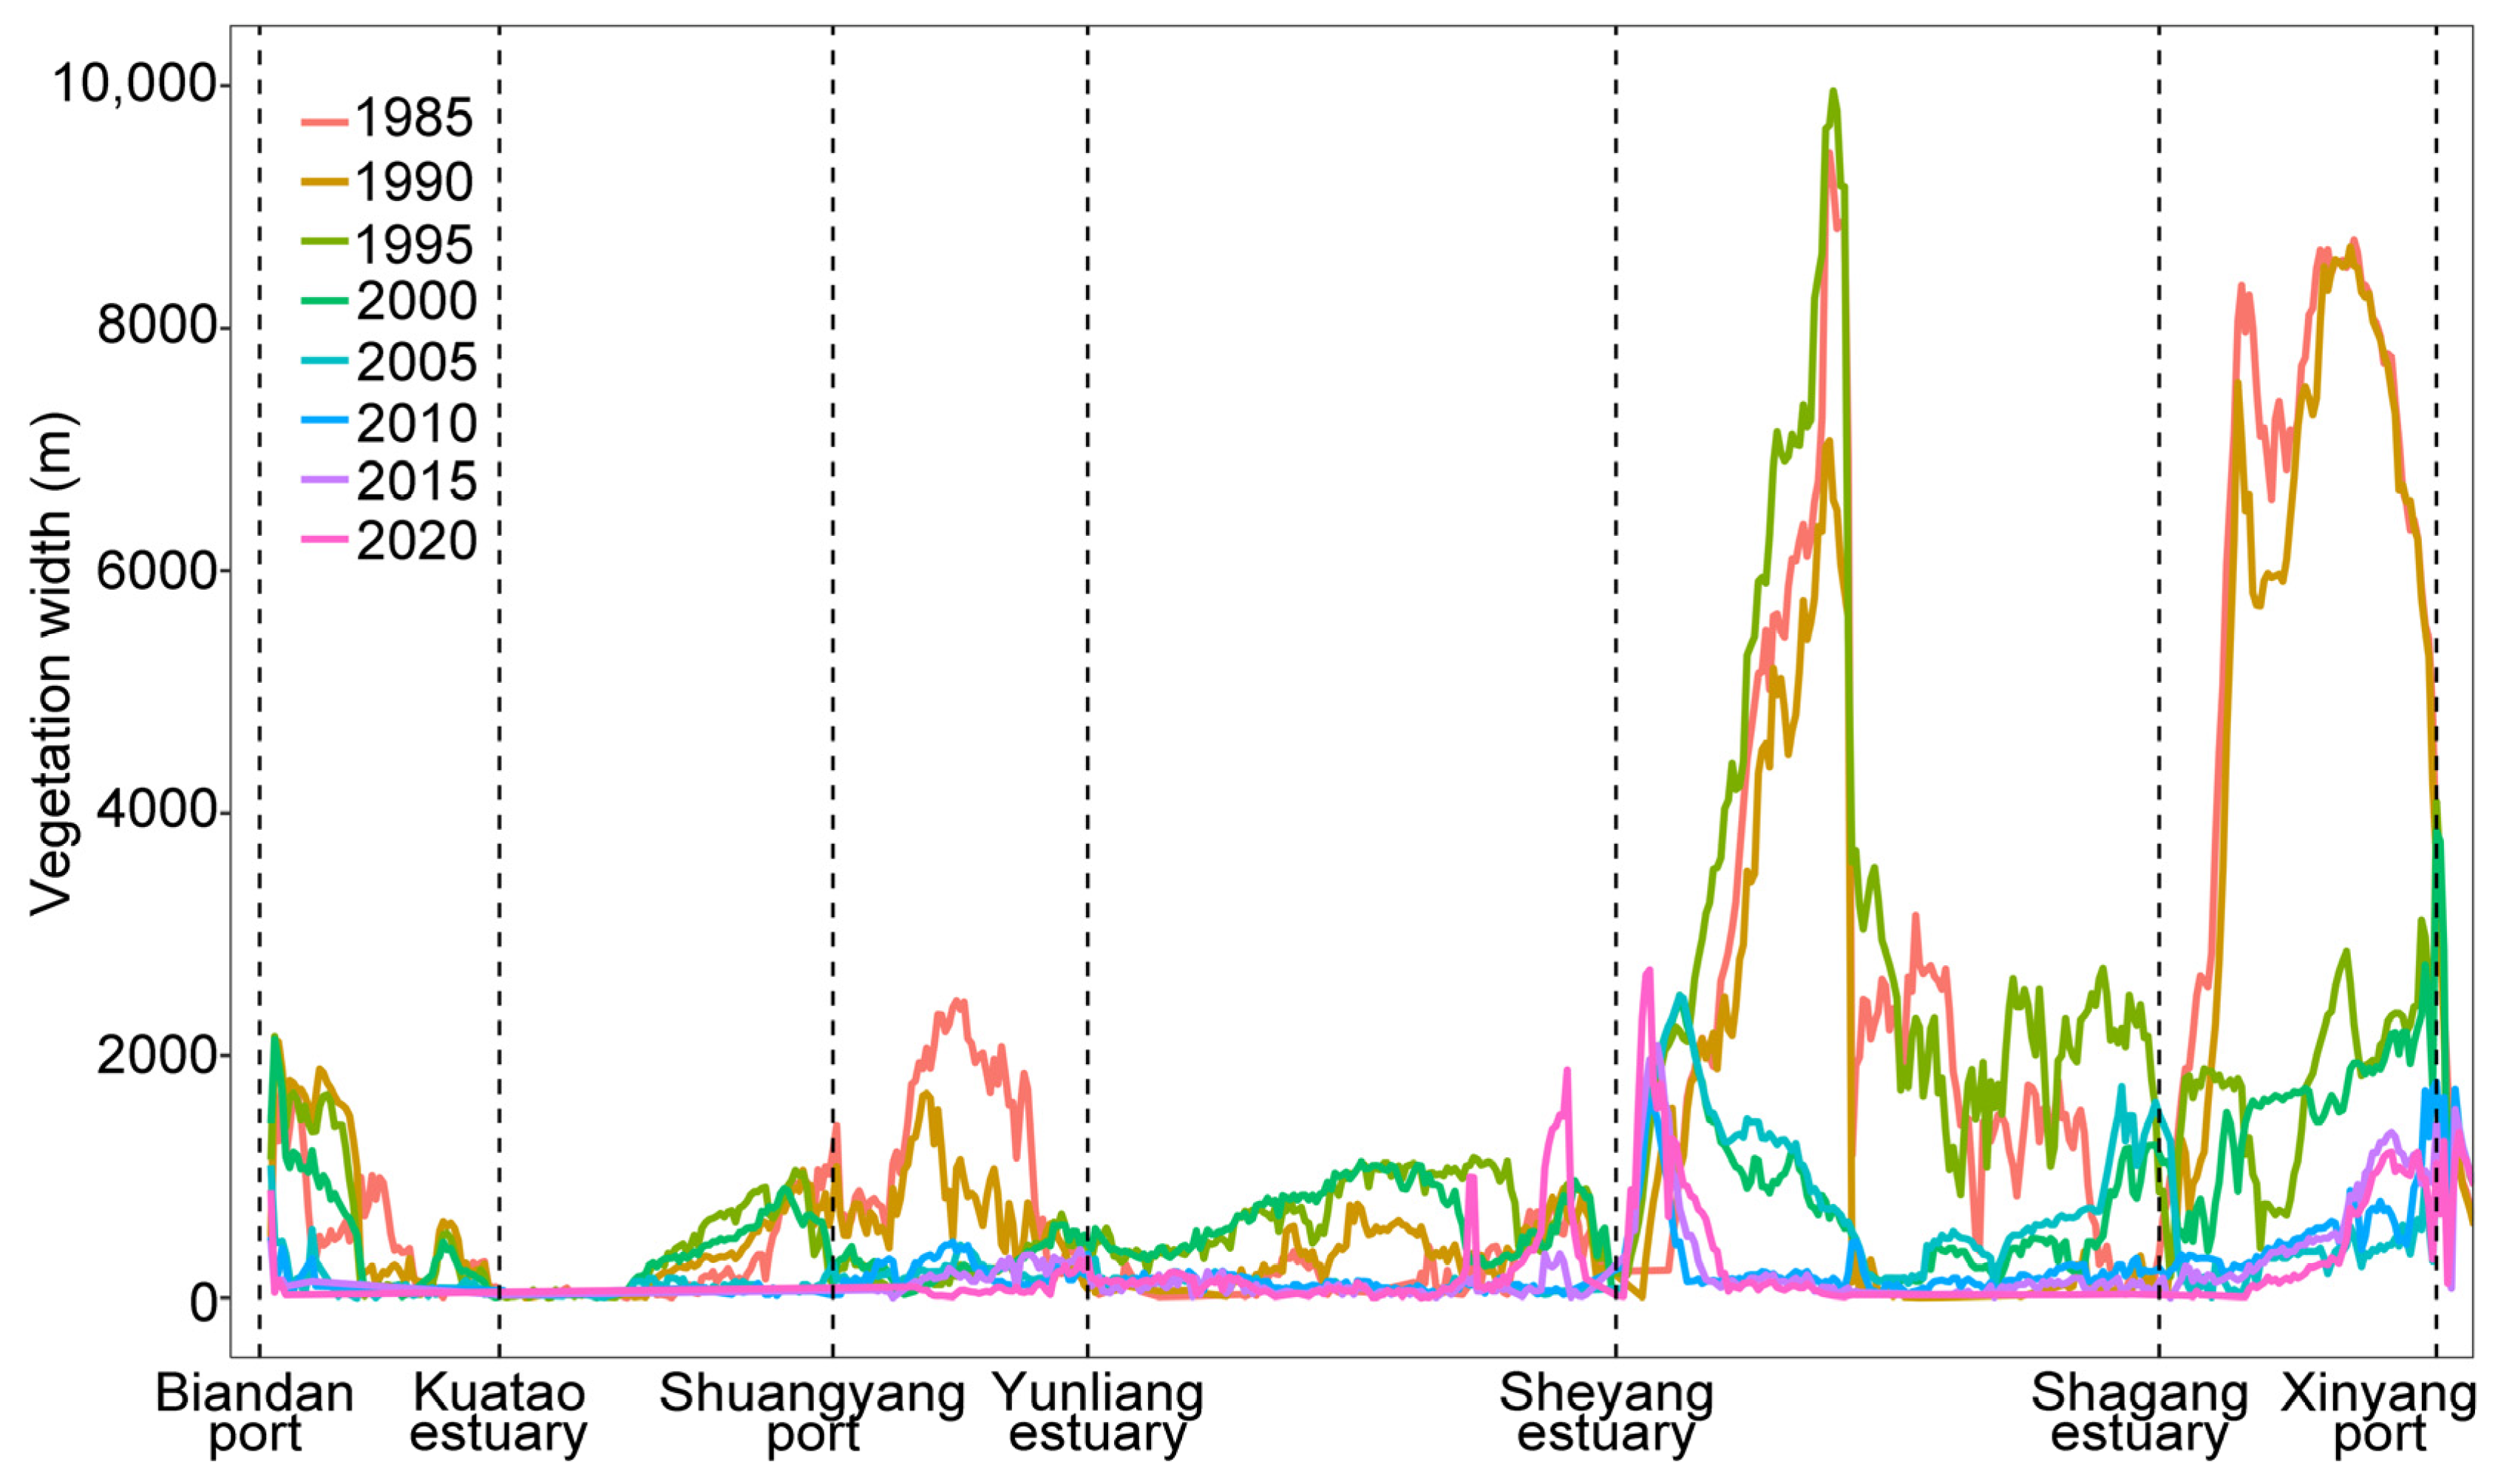
The vegetation width distribution from Biandan port to Sheyang estuary was relatively narrow, generally below 2000 m, and exhibited a trend of initial increase followed by a decline over time. The widest distribution occurred around the year 2000. From Shuangyang port to Yunliang estuary, the vegetation width showed a decreasing trend, with a particularly sharp reduction observed from 1985 to 1995. In contrast, the vegetation width from Sheyang estuary to Xinyang port was relatively larger, with most areas exceeding 2000 m prior to 1995. However, the vegetation distribution width from the Sheyang estuary to the Shagang estuary displayed an increasing trend from 1985 to 1995, followed by a decline thereafter. Similarly, the vegetation distribution width from Shagang estuary to Xinyang port decreased over time, with a notable reduction occurring from 1990 to 1995 (Figure 5).
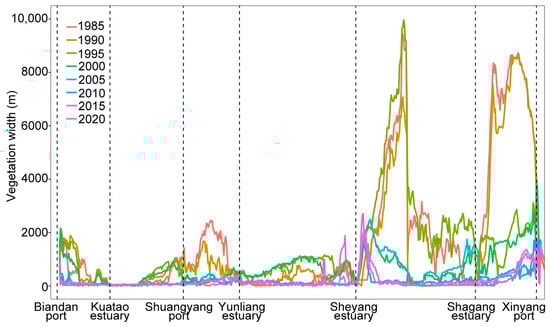
Figure 5.
Changes in vegetation width outside the embankment in Sheyang County.
The coupling effect of salt marsh vegetation growth and geomorphic development was characterized by the topographic changes at the junction of salt marsh vegetation and intertidal bare flats. Overall, the elevation of the salt marsh vegetation front edge decreased from 2000 to 2020, with a severe decline in the southern part of the Sheyang estuary between 2015 and 2020 (Table 2).
Table 2.
Changes of elevation and slope at the edge of salt marshes along the Sheyang coast.
From 2000 to 2020, the average elevation of vegetation front edges in the section from Shuangyang port to Yunliang estuary (including North Sheyang sections) decreased from 1.236 to 1.119 m, a reduction of approximately 9.5%. Concurrently, the average slope of the vegetation edge increased from 0.262° in 2000 to 0.309° in 2020, an increase of approximately 17.9%. During this period, the average offshore distance of vegetation edges continued to decrease, indicating a landward retreat of salt marsh vegetation. This retreat was accompanied by ground subsidence and the steepening of the slope, highlighting an obvious coastal erosion process.
The average elevation of vegetation front edges in the south of Sheyang estuary (including South Sheyang sections) fluctuated and decreased between 2000 and 2020, with a large decline occurring from 2005 to 2010 and 2015 to 2020. The overall elevation decreased from 1.242 m in 2000 to 1.030 m in 2020, a reduction of approximately 17.1%. Concurrently, the average slope of vegetation edges increased from 0.257° in 2000 to 0.483° in 2020, an increase of approximately 87.9%.
While the average offshore distance of vegetation edges fluctuated during this period, the overall variation was relatively small (up to about 166 m). The vegetation distribution showed a general landward retreat between 2000 and 2010 and 2015 and 2020, whereas, between 2010 and 2015, it advanced seaward due to siltation. During the landward retreat period, the vegetation front edge experienced a decrease in elevation and a slight increase in slope and exhibited clear characteristics of coastal erosion.
4. Discussion
4.1. Response of Salt Marsh Vegetation to Coastal Erosion
The development of salt marshes is a dynamic self-organizing process, and the salt marshes’ front edge is influenced by waves, sediment supply, and biogeographic feedback to expand or contract over time [34,35]. In this study, the response of salt marsh vegetation front edge to coastal erosion was characterized by changes in three key aspects, namely vegetation distribution width, vegetation front edge movement rate, and geomorphic elevation. Under conditions of coastal erosion and with a relatively stable artificial coastline, the vegetation front edge moved in the same direction as the water boundary. This process was accompanied by a reduction in the distribution width of salt marsh vegetation, a decline in the elevation of vegetation front edge, and an increase in slope steepness, indicating a clear response to erosional forces.
4.1.1. Reduction in Salt Marsh Distribution Width
The severe reduction in salt marsh vegetation width is a direct response to coastal erosion. In Sheyang County, the width of salt marsh vegetation decreased by 83% between 1985 and 2020. This trend is primarily attributed to reduced sediment supply, intensified wave erosion, and human activity. Sheyang County is located in the northern part of Jiangsu Province, with sediment primarily originating from the ancient Yellow River and Yangtze River. The sediment deposition was jointly controlled by the advancing waves of the East China Sea and the rotating waves of the Yellow Sea, forming a special “north erosion and south deposition” tidal flat pattern [35]. Therefore, the distribution of salt marsh vegetation in different periods follows a “narrow in the north and wide in the south” pattern. This disparity can be explained by two main factors: first, the diversion of the Yellow River has reduced sediment input, causing the boundary point between erosion and siltation to gradually shift southward to an area beyond the Sheyang estuary [36], leaving the northern regions sediment-starved and unable to sustain marsh expansion. Second, the construction of a double embankment at the Sheyang estuary mitigated erosion pressures and provided relatively stable conditions for vegetation expansion.
The mechanism behind the reduction in salt marsh width is rooted in edge erosion caused by waves and tidal currents. Waves erode the edges of salt marshes, leading to sediment loss from vegetated areas. Moreover, as the width of the vegetation zone narrows, its ability to attenuate wave energy diminishes, further accelerating the erosion process. In this study, the average width of salt marsh vegetation in the northern of Sheyang was less than 200 m, narrower than the width of 900~1000 m needed for Spartina alterniflora to effectively protect the coast by modifying sediment dynamics [37,38]. Therefore, the narrow-distributed vegetation did not effectively reduce wave-induced erosion at the salt marsh edge, resulting in the loss of wetland substrate. However, the difference in the erosion rate between the North Sheyang and South Sheyang regions further proved the mitigating effect of salt marsh vegetation on coastal erosion; that is, the larger the vegetation distribution width, the more pronounced the mitigating effect. This observation aligns with findings from other studies, such as Möller et al., which demonstrated that the narrower the vegetation belt, the less effective it was at dissipating wave energy [39]. Vegetation could cover and protect mudflat, dissipate wave and tide forces, reduce shear stress, and thus reduce erosion [40].
4.1.2. Decline in Elevation of Salt Marsh Edge
The continuous decline in the elevation of salt marsh edges is another significant response to coastal erosion. From 2000 to 2020, the average elevation of the salt marsh edge in Sheyang decreased by 10.5%. This decline was driven by insufficient vertical sediment accretion and enhanced erosion.
Elevation determines the frequency and time of inundation, changes the soil conditions, and then affects the productivity and spatial pattern of salt marshes [27]. Thus, salt marsh formation and maintenance depend on sediment accumulation. However, the diversion of the Yellow River reduced sediment supply [36], and strong hydrodynamic forces exacerbated erosion, preventing sufficient vertical accretion to counterbalance the relative sea-level rise [41]. Consequently, coastal salt marshes were degraded by permanent inundation due to an insufficient accumulation of vertical sediments to form an elevation suitable for their growth [42,43]. This was the reason that, to some extent, explained the reduction of salt marsh distribution width along with the decline in elevation at the vegetation edge. Furthermore, the decline in elevation reflects spatial differences in erosion effects. The northern areas of Sheyang, having experienced earlier erosion, exhibited smaller declines in elevation compared to the southern areas. This is likely due to the late-stage erosion characteristics in the north, where vertical erosion weakens, but the lateral retreat of the vegetation edge becomes more pronounced
4.1.3. Increase in Slope Steepness of Salt Marsh Edge
The steepening of salt marsh edge slopes is a comprehensive manifestation of coastal erosion. The average slope at the salt marsh edge in Sheyang increased from 0.30°to 0.44°, an increase of 46.7%. This phenomenon was driven by hydrodynamic-induced erosion and sediment redistribution [44]. First, waves and tidal currents intensify sediment loss at the marsh edge, particularly during high tides, when strong hydrodynamic forces transport fine sediments outward, forming a seaward-convex morphology. The slope above the convex point was gentle, while below it, the slope gradually steepened [45]. Second, under sustained erosive pressures, the salt marsh edge progressively retreats landward, resulting in the development of steeper edge slopes. The observation of salt marsh edge cliffs at Sheyang coast proved the effects of erosion on steepening slopes.
The degree of slope steepening also exhibited notable regional differences. In northern Sheyang, the slope change was less pronounced compared to the south, which can be attributed to the late-stage erosion characteristics in the north. In the south, where erosion was in an earlier stage, vertical erosion was more prominent, leading to steeper edge slopes. This spatial variation highlighted the temporal evolution of erosion processes, transitioning from vertical to horizontal erosion.
4.2. Response of Salt Marsh Vegetation to Reclamation
Salt marshes are affected by human activities, especially the coastal reclamation during development. Our results indicated that the frequent and intense reclamation activities led to three major changes in coastal salt marshes: a seaward movement in the front edge of salt marsh vegetation, a reduction in the width and area of vegetation distribution, and alterations in plant species composition.
4.2.1. Seaward Movement of Vegetation Front Edge
The seaward movement of the salt marsh vegetation front edge is a direct response to the expansion of the artificial coastline. Our study found that from 1985 to 2020, the artificial coastline in Sheyang County moved seaward by an average of 2313 m, with the vegetation front edge advancing 1370 m on average. This movement was primarily driven by the reclamation-induced alteration of coastal dynamics. The coast of Sheyang County was once a silty coast with abundant mudflat resources [46]. In consideration of economic development, the coastal mudflats have been reclaimed into aquaculture ponds, cultivated land, and construction land, and the natural coastline has an obvious artificial trend [34,44]. As reclamation activities modify the physical structure of the coastline—such as through embankment construction and sediment deposition—salt marsh vegetation tends to follow the changes in the landscape. The lower boundary of reclamation expanded from the average high tide level to the outer edge of salt marshes and was constantly advancing toward the sea [47,48]. The seaward expansion of the artificial coastline altered the boundary conditions for vegetation, shifting the marsh’s edge outward.
As reclamation projects altered the hydrodynamics of the area, sediment accumulation was enhanced, leading to higher elevation in areas outside the embankments [49]. In turn, salt marsh vegetation, which thrived on sediment deposition, extended outward in response to the increasing mudflat elevation [50]. This process illustrated the cyclical pattern of “reclamation fostering expansion beyond the embankment” observed in the salt marsh vegetation along the Sheyang coast.
4.2.2. Reduction in Vegetation Area and Width
Although the salt marsh front edge extended outward in response to coastal reclamation, the overall area and width of salt marshes decreased. Results showed that the total area of salt marsh vegetation in Sheyang County had decreased by approximately 89% compared to 1985, with the average width of vegetation distribution declining by up to 87%. The primary factor driving this reduction was the alteration of the upper boundary of the salt marshes due to reclamation activities. Prior to reclamation, the upper boundary of salt marshes was determined by the highest tidal levels, which allowed salt marshes to extend further inland, particularly during large storm surges. After reclamation, however, the upper limit of salt marshes was constrained to the area along the seawalls, thus reducing the total area available for salt marshes.
Reclamation not only reduced the physical space for salt marshes but also altered the sediment dynamics. Results showed that in Sheyang County, the artificial coastline expansion (average rate of 85 m/a) was much faster than the rate of vegetation front movement (average rate of 41 m/a), suggesting the rate of reclamation far outpaced the natural sedimentation and recovery of salt marsh vegetation processes. As a result, reclamation often led to a zonal distribution of salt marsh vegetation parallel to the coastline, creating narrow strips of vegetation with limited space for ecological processes. This reduction in spatial extent severely impacted the ecological function of salt marshes, which were vital for coastal protection, biodiversity, and carbon sequestration [51].
4.2.3. Changes in Plant Species Composition
Reclamation has also led to considerable changes in the species composition of salt marshes. In Sheyang County, the natural vegetation community, which was dominated by species such as Phragmites australis and Suaeda salsa, had been largely replaced by Spartina alterniflora, a species introduced for its ability to stabilize mudflats and enhance sedimentation [52]. After reclamation, the elevation outside the seawall was lower, and the tidal disturbance was frequent. Compared with native salt marsh species, Spartina alterniflora had stronger adaptability to salinity and flooding. Thus, the tidal flats outside the artificial coastline were gradually occupied by Spartina alterniflora [53], leading to a reduction in plant diversity.
Within the reclamation area, the reclamation of coastal wetlands for aquaculture and agricultural use had exacerbated species loss. By converting areas traditionally dominated by salt marsh vegetation into agricultural land or aquaculture ponds, the ecological conditions for native species were disrupted. The reduced elevation and increased tidal disturbance in reclaimed areas created unfavorable conditions for the survival of native salt marsh species. As a result, Spartina alterniflora had become the dominant species in the area, reflecting a shift in the ecological function of the salt marsh from a diverse, native ecosystem to one dominated by a single, non-native species along Sheyang coast, which was consistent with other studies [22].
4.3. Mitigation Strategies to Coastal Squeeze
Salt marshes, as dynamic ecosystems located at the interface of land and sea, are increasingly impacted by bidirectional coastal squeeze driven by coastal erosion and landward reclamation. Coastal erosion subjected salt marshes to physical loss at their seaward boundary while reclamation activities encroached on their landward extent. Together, these processes restricted the spatial extent and altered the geomorphology of salt marshes, compromising their ecological integrity and functionality [51].
The impacts of a bidirectional coastal squeeze on salt marshes were different. Coastal erosion was a slow and long-lasting process, resulting in progressive salt marsh degradation in the seaward direction. In contrast, reclamation was a large-scale and short-term activity, often leading to the sudden destruction of salt marshes in the landward direction. Since China has now implemented strict control policies on reclamation [54], anthropogenic impacts are being mitigated. This will stabilize the upper boundary of salt marshes, reduce landward pressure, and consequently lessen the overall impact of coastal squeeze.
Currently, to maintain the stability of salt marsh areas and mitigate degradation, targeted measures should be adopted at the lower boundary of salt marshes. Engineering solutions, such as submerged dams, can effectively reduce wave-induced erosion and enhance sediment retention, stabilizing the seaward edge of salt marshes [39,41]. Simultaneously, it is essential to establish designed protection zones within reclaimed areas to preserve natural wetlands. Measures such as reconnecting hydrological systems to reintroduce seawater flow, combined with vegetation planting using native species like Phragmites australis and Suaeda salsa, can gradually restore the degraded salt marsh wetlands. Such restoration activities alleviate the impacts of coastal squeeze by enhancing sediment accretion, increasing elevation, and promoting ecological resilience [55].
5. Conclusions
This study investigated the bidirectional “coastal squeeze” effects of human reclamation and natural erosion on coastal salt marshes in Sheyang County, Jiangsu Province, China, between 1985 and 2020. Our findings highlighted major ecological and geomorphic transformations driven by these dual pressures, including the reduction of salt marsh spatial extent, the decline of vegetation edge elevation, the increase of edge slope, and the disruption of species composition, with native vegetation being largely replaced by Spartina alterniflora. These changes compromised the ecological functions of salt marshes, including carbon sequestration, wave attenuation, and biodiversity support.
To mitigate these impacts, this study underscored the importance of stabilizing salt marsh boundaries through engineering solutions, such as submerged dams and restoring degraded wetlands via hydrological reconnection and native vegetation planting. These strategies aim to enhance sediment retention, promote ecological resilience, and preserve salt marsh functions in the face of continued coastal squeeze, particularly for seaward pressure derived from coastal erosion. These findings provided critical insights for managing salt marsh ecosystems under bidirectional “coastal squeeze” pressures, offering a scientific basis for conservation policies and sustainable coastal development.
Supplementary Materials
The following supporting information can be downloaded at https://www.mdpi.com/article/10.3390/jmse13010017/s1: Table S1. Image acquisition details of satellite images used in this study.
Author Contributions
Conceptualization, G.Z. and J.G.; methodology, G.Z. and J.G.; formal analysis, J.G., L.L. and H.H.; investigation, G.Z., L.L. and J.G.; writing—original draft preparation, J.G., H.H., W.D. and J.S.; writing—review and editing, G.Z., M.S., L.L., J.Z. and J.G.; supervision, J.Z. and M.S.; funding acquisition, G.Z. and J.S. All authors have read and agreed to the published version of the manuscript.
Funding
This research was funded by the National Key Research and Development Program of China (Ministry of Science and Technology of the People’s Republic of China, 2022YFC3106201), Zhejiang Basic Public Welfare Research Program (Department of Science and Technology of Zhejiang Province, LZJWZ22E090005, LZJWZ23E090005), Natural Resources Science and Technology Project (Department of Natural Resources of Zhejiang Province, 2024ZJHY005) and Zhejiang Province Water Conservancy Science and Technology Project (Department of Water Resources of Zhejiang Province, RC2148 and RC2246).
Institutional Review Board Statement
Not applicable.
Informed Consent Statement
Not applicable.
Data Availability Statement
Data will be made available on request.
Conflicts of Interest
The authors declare no conflicts of interest.
References
- Silliman, B.R. Salt marshes. Curr. Biol. 2014, 24, 348–350. [Google Scholar] [CrossRef] [PubMed]
- Barbier, E.B.; Hacker, S.D.; Kennedy, C.; Koch, E.W.; Stier, A.C.; Silliman, B.R. The value of estuarine and coastal ecosystem services. Ecol. Monogr. 2011, 81, 169–193. [Google Scholar] [CrossRef]
- Boorman, L.A. Salt Marsh Review: An Overview of Coastal Saltmarshes, Their Dynamic and Sensitivity Characteristics for Conservation and Management; JNCC Report; JNCC: Peterborough, UK, 2003. [Google Scholar]
- Fagherazzi, S.; FitzGerald, D.M.; Fulweiler, R.W.; Hughes, Z.; Wiberg, P.L.; McGlathery, K.J.; Morris, J.T.; Tolhurst, T.J.; Deegan, L.A.; Johnson, D.S.; et al. Ecogeomorphology of Salt Marshes. In Treatise on Geomorphology, 2nd ed.; Shroder, J.F., Ed.; Academic Press: Palm Bay, FL, USA, 2022; Volume 8, pp. 445–464. [Google Scholar]
- D’Alpaos, A. The mutual influence of biotic and abiotic components on the long-term ecomorphodynamic evolution of salt-marsh ecosystems. Geomorphology 2011, 126, 269–278. [Google Scholar] [CrossRef]
- Silvestri, S.; Marani, M.; Marani, A. Hyperspectral remote sensing of salt marsh vegetation, morphology and soil topography. Phys. Chem. Earth Parts A/B/C 2003, 28, 15–25. [Google Scholar] [CrossRef]
- Pontee, N. Defining coastal squeeze: A discussion. Ocean Coast. Manag. 2013, 84, 204–207. [Google Scholar] [CrossRef]
- Leo, K.L.; Gillies, C.L.; Fitzsimons, J.A.; Hale, L.Z.; Beck, M.W. Coastal habitat squeeze: A review of adaptation solutions for saltmarsh, mangrove and beach habitats. Ocean Coast. Manag. 2019, 175, 180–190. [Google Scholar] [CrossRef]
- Chen, G.W.; Jin, R.J.; Ye, Z.J.; Li, Q.; Gu, J.L.; Luo, M.; Luo, Y.M.; Christakos, G.; Morris, J.; He, J.Y.; et al. Spatiotemporal mapping of salt marshes in the intertidal zone of China during 1985–2019. J. Remote Sens. 2022, 2022, 9793626. [Google Scholar] [CrossRef]
- Campbell, A.D.; Fatoyinbo, L.; Goldberg, L.; Lagomasino, D. Global hotspots of salt marsh change and carbon emissions. Nature 2022, 612, 701–706. [Google Scholar] [CrossRef]
- Gu, J.L.; Luo, M.; Zhang, X.J.; Christakos, G.; Agusti, S.; Duarte, C.M.; Wu, J.P. Losses of salt marsh in China: Trends, threats and management. Estuar. Coast. Shelf Sci. 2018, 214, 98–109. [Google Scholar] [CrossRef]
- Sun, Z.G.; Sun, W.G.; Tong, C.; Zeng, C.S.; Yu, X.; Mou, X.J. China’s coastal wetlands: Conservation history, implementation efforts, existing issues and strategies for future improvement. Environ. Int. 2015, 79, 25–41. [Google Scholar] [CrossRef]
- Sengupta, D.; Choi, Y.R.; Tian, B.; Brown, S.; Meadows, M.; Hackney, C.R.; Banerjee, A.; Li, Y.J.; Chen, R.S.; Zhou, Y.X. Mapping 21st century global coastal land reclamation. Earths Future 2023, 11, e2022EF002927. [Google Scholar] [CrossRef]
- Third Institute of Oceanography, Ministry of Natural Resources. The Special Results of China’s Coastal Marine Comprehensive Investigation and Evaluation—The General Report on the Evaluation of the Current Situation of Coastal Erosion and the Research on Prevention and Control Technology; Third Institute of Oceanography, Ministry of Natural Resources: Xiamen, China, 2010. (In Chinese) [Google Scholar]
- DaSilva, M.D.; Hesp, P.A.; Bruce, D.; Downes, J.; da Silva, G.M. Coastal transgressive dunefield evolution as a response to multi-decadal shoreline erosion. Geomorphology 2024, 455, 109165. [Google Scholar] [CrossRef]
- Valiela, I.; Lloret, J.; Bowyer, T.; Miner, S.; Remsen, D.; Elmstrom, E.; Cogswell, C.; Thieler, E.R. Transient coastal landscapes: Rising sea level threatens salt marshes. Sci. Total Environ. 2018, 640, 1148–1156. [Google Scholar] [CrossRef] [PubMed]
- Raposa, K.B.; Weber, R.L.J.; Ekberg, M.C.; Ferguson, W. Vegetation dynamics in Rhode Island salt marshes during a period of accelerating sea level rise and extreme sea level events. Estuaries Coasts 2017, 40, 640–650. [Google Scholar] [CrossRef]
- Donatelli, C.; Ganju, N.K.; Zhang, X.; Fagherazzi, S.; Leonardi, N. Salt marsh loss affects tides and the sediment budget in shallow bays. J. Geophys. Res. Earth Surf. 2018, 123, 2647–2662. [Google Scholar] [CrossRef]
- Luo, S.X.; Shao, D.D.; Long, W.; Liu, Y.J.; Sun, T.; Cui, B.S. Assessing ‘coastal squeeze’ of wetlands at the Yellow River Delta in China: A case study. Ocean Coast. Manag. 2018, 153, 193–202. [Google Scholar] [CrossRef]
- Wu, W.T.; Zhi, C.; Gao, Y.W.; Chen, C.P.; Chen, Z.Q.; Su, H.; Lu, W.F.; Tian, B. Increasing fragmentation and squeezing of coastal wetlands: Status, drivers, and sustainable protection from the perspective of remote sensing. Sci. Total Environ. 2022, 811, 152339. [Google Scholar] [CrossRef] [PubMed]
- Gu, J.L.; Jin, R.J.; Chen, G.W.; Ye, Z.J.; Li, Q.; Wang, H.W.; Li, D.; Christakos, G.; Agusti, S.; Duarte, C.M.; et al. Areal extent, species composition, and spatial distribution of coastal saltmarshes in China. IEEE J. Sel. Top. Appl. Earth Obs. Remote Sens. 2021, 14, 7085–7094. [Google Scholar] [CrossRef]
- Sun, C.; Li, J.L.; Liu, Y.C.; Zhao, S.S.; Zheng, J.H.; Zhang, S. Tracking annual changes in the distribution and composition of saltmarsh vegetation on the Jiangsu coast of China using Landsat time series-based phenological parameters. Remote Sens. Environ. 2023, 284, 113370. [Google Scholar] [CrossRef]
- Lin, S.W.; Li, X.Z.; Yang, B.; Ma, Y.X.; Jiang, C.; Xue, L.M.; Wang, J.J.; Yan, Z.Z. Systematic assessments of tidal wetlands loss and degradation in Shanghai, China: From the perspectives of area, composition and quality. Glob. Ecol. Conserv. 2021, 25, e01450. [Google Scholar] [CrossRef]
- Liu, Y.C.; Li, J.L.; Sun, C.; Wang, X.X.; Tian, P.; Chen, L.M.; Zhang, H.T.; Yang, X.D.; He, G.L. Thirty-year changes of the coastlines, wetlands, and ecosystem services in the Asia major deltas. J. Environ. Manag. 2023, 326, 116675. [Google Scholar] [CrossRef]
- Schuerch, M.; Spencer, T.; Evans, B. Coupling between tidal mudflats and salt marshes affects marsh morphology. Mar. Geol. 2019, 412, 95–106. [Google Scholar] [CrossRef]
- Goodwin, G.C.H.; Mudd, S.M. Detecting the morphology of prograding and retreating marsh margins-Example of a mega-tidal bay. Remote Sens. 2020, 12, 13. [Google Scholar] [CrossRef]
- Zhou, Z.; Liang, M.J.; Chen, L.; Xu, M.P.; Chen, X.; Geng, G.; Li, H.; Serrano, D.; Zhang, H.Y.; Gong, Z.; et al. Processes, feedbacks, and morphodynamic evolution of tidal flat–marsh systems: Progress and challenges. Water Sci. Eng. 2022, 15, 89–102. [Google Scholar] [CrossRef]
- Bouma, T.J.; van Belzen, J.; Balke, T.; van Dalen, J.; Klaassen, P.; Hartog, A.M.; Callaghan, D.P.; Hu, Z.; Stive, M.J.F.; Temmerman, S.; et al. Short-term mudflat dynamics drive long-term cyclic salt marsh dynamics. Limnol. Oceanogr. 2016, 61, 2261–2275. [Google Scholar] [CrossRef]
- Fan, X.Z.; Huang, H.M.; Zhang, Q.L.; Sun, N.; Wang, Y.G. Response of tidal creek networks and tidal connectivity to coastal squeeze of saltmarshes in the southern Bohai Bay. N. Z. J. Mar. Freshw. Res. 2022, 56, 617–631. [Google Scholar] [CrossRef]
- Phan, L.K.; van Thiel de Vries, J.S.M.; Stive, M.J.F. Coastal mangrove squeeze in the Mekong Delta. J. Coast. Res. 2015, 31, 233–243. [Google Scholar] [CrossRef]
- Zhong, J.Q.; Liang, C.Q.; Zhao, Y.Q.; Wang, Y.Q.; Yan, X.L. Identifying loss threshold and migration trajectory in the management of Suaeda salsa wetland under coastal squeeze. Mar. Environ. Res. 2024, 194, 106329. [Google Scholar] [CrossRef] [PubMed]
- Zhou, Y. Study on evolution characteristics and driving mechanism of tideland reclamation in Jiangsu from 1980 to 2014. Hei Long Jiang Environ. J. 2023, 36, 8–11. (In Chinese) [Google Scholar]
- Himmelstoss, E.A.; Henderson, R.E.; Farris, A.S.; Kratzmann, M.G.; Bartlett, M.K.; Ergul, A.; McAndrews, J.; Cibaj, R.; Zichichi, J.L.; Thieler, E.R. Digital Shoreline Analysis System; Version 6.0; U.S. Geological Survey Software Release; U.S. Geological Survey: Asheville, NC, USA, 2024. [Google Scholar] [CrossRef]
- Allen, J.R.L. Morphodynamics of Holocene salt marshes: A review sketch from the Atlantic and southern North Sea coasts of Europe. Quat. Sci. Rev. 2000, 19, 1155–1231. [Google Scholar] [CrossRef]
- Zhou, L.; Liu, J.; Saito, Y.; Zhang, Z.; Chu, H.; Hu, G. Coastal erosion as a major sediment supplier to continental shelves: Example from the abandoned Old Huanghe (Yellow River) delta. Cont. Shelf Res. 2014, 82, 43–59. [Google Scholar] [CrossRef]
- Xu, H.; Shi, F.; Song, X.; Bai, Y. Quantifying spatiotemporal variations in tidal flats and coastal land use in Jiangsu Radial Sandbars through remote sensing. Reg. Stud. Mar. Sci. 2024, 74, 103539. [Google Scholar] [CrossRef]
- Zhu, D.; Gao, S. The expansion of Spartina alterniflora marsh in response to tidal flat reclamation, central Jiangsu coast, eastern China. Geogr. Res. 2014, 33, 2382–2392. (In Chinese) [Google Scholar]
- Feagin, R.A.; Lozada-Bernard, S.M.; Ravens, T.M.; Möller, I.; Yeager, K.M.; Baird, A.H. Does vegetation prevent wave erosion of salt marsh edges? Proc. Natl. Acad. Sci. USA 2009, 106, 10109–10113. [Google Scholar] [CrossRef] [PubMed]
- Möller, I.; Kudella, M.; Rupprecht, F.; Spencer, T.; Paul, M.; van Wesenbeeck, B.K.; Wolters, G.; Jensen, K.; Bouma, T.J.; Miranda-Lange, M.; et al. Wave attenuation over coastal salt marshes under storm surge conditions. Nat. Geosci. 2014, 7, 727–731. [Google Scholar] [CrossRef]
- Nepf, H.M.; Vivoni, E.R. Flow structure in depth-limited, vegetated flow. J. Geophys. Res.-Oceans 2000, 105, 28547–28557. [Google Scholar] [CrossRef]
- Kirwan, M.L.; Megonigal, J.P. Tidal wetland stability in the face of human impacts and sea-level rise. Nature 2013, 504, 53–60. [Google Scholar] [CrossRef] [PubMed]
- Stevenson, J.C.; Ward, L.G.; Kearney, M.S. Vertical accretion in marshes with varying rates of sea level rise. In Estuarine Variability; Wolfe, D.A., Ed.; Academic Press: Palm Bay, FL, USA, 1986; pp. 241–259. [Google Scholar]
- Crosby, S.C.; Sax, D.F.; Palmer, M.E.; Booth, H.S.; Deegan, L.A.; Bertness, M.D.; Leslie, H.M. Salt marsh persistence is threatened by predicted sea-level rise. Estuar. Coast. Shelf Sci. 2016, 181, 93–99. [Google Scholar] [CrossRef]
- Fagherazzi, S.; Kirwan, M.L.; Mudd, S.M.; Guntenspergen, G.R.; Temmerman, S.; D’Alpaos, A.; Koppel, J.V.D.; Rybczyk, J.M.; Reyes, E.; Craft, C.; et al. Numerical models of salt marsh evolution: Ecological, geomorphic, and climatic factors. Rev. Geophys. 2012, 50, 1–28. [Google Scholar] [CrossRef]
- Zhang, C.; Huang, T.; Tao, J.; Ni, L. Response relationship of tidal flat profile and dynamic sediment along Jiangsu coast. J. Hohai Univ. (Nat. Sci.) 2020, 48, 245–251. (In Chinese) [Google Scholar]
- Wu, X.; Wang, A.; Zhang, J. Development and utilization of tidal mudflat resource of Sheyang County. Econ. Geogr. 2004, 2, 268–271. (In Chinese) [Google Scholar]
- Zhang, X.; Xiao, X.; Wang, X.; Xu, X.; Qiu, S.; Pan, L.; Ma, J.; Ju, R.; Wu, J.; Li, B. Continual expansion of Spartina alterniflora in the temperate and subtropical coastal zones of China during 1985–2020. Int. J. Appl. Earth Obs. 2023, 117, 103192. [Google Scholar] [CrossRef]
- Mao, D.; Liu, M.; Wang, Z.; Li, L.; Man, W.; Jia, M.; Zhang, Y. Rapid invasion of spartina alterniflora in the coastal zone of Mainland China: Spatiotemporal patterns and human prevention. Sensors 2019, 19, 2308. [Google Scholar] [CrossRef] [PubMed]
- Wang, Y.P.; Gao, S.; Jia, J.J.; Thompson, C.E.L.; Gao, J.H.; Yang, Y. Sediment transport over an accretional intertidal flat with influences of reclamation, Jiangsu coast, China. Mar. Geol. 2012, 291–294, 147–161. [Google Scholar] [CrossRef]
- Huang, S.L.; Chen, Y.N.; Li, Y. Spatial dynamic patterns of saltmarsh vegetation in southern Hangzhou Bay: Exotic and native species. Water Sci. Eng. 2020, 13, 34–44. [Google Scholar] [CrossRef]
- Feng, X.; Li, Y.; Lin, X. Protect China’s coastal salt marshes. Nature 2024, 386, 629–630. [Google Scholar] [CrossRef] [PubMed]
- Jiang, C.; Jia, J.; Yang, Y.; Sheng, R.; Ren, L.; Ji, H.; Ye, S. Forty years of Spartina alterniflora in China: Cognitive revolution and governance strategies. Acta Ecol. Sin. 2024, 44, 8944–8956. (In Chinese) [Google Scholar]
- Chung, C.H. Forty years of ecological engineering with Spartina plantations in China. Ecol. Eng. 2006, 27, 49–57. [Google Scholar] [CrossRef]
- Miao, D.; Xue, Z. The current developments and impact of land reclamation control in China. Mar. Policy 2021, 134, 104782. [Google Scholar] [CrossRef]
- Temmerman, S.; Meire, P.; Bouma, T.J.; Herman, P.M.J.; Ysebaert, T.; Vriend, H.J.D. Ecosystem-based coastal defence in the face of global change. Nature 2013, 504, 79–83. [Google Scholar] [CrossRef]
Disclaimer/Publisher’s Note: The statements, opinions, and data contained in all publications are solely those of the individual author(s) and contributor(s) and not of MDPI and/or the editor(s). MDPI and/or the editor(s) disclaim responsibility for any injury to people or property resulting from any ideas, methods, instructions, or products referred to in the content. |
Disclaimer/Publisher’s Note: The statements, opinions and data contained in all publications are solely those of the individual author(s) and contributor(s) and not of MDPI and/or the editor(s). MDPI and/or the editor(s) disclaim responsibility for any injury to people or property resulting from any ideas, methods, instructions or products referred to in the content. |
© 2024 by the authors. Licensee MDPI, Basel, Switzerland. This article is an open access article distributed under the terms and conditions of the Creative Commons Attribution (CC BY) license (https://creativecommons.org/licenses/by/4.0/).