Article

Time-Domain Simulation of Coupled Motions for Five Fishing Vessels Moored Side-by-Side in a Harbor

1
School of Naval Architecture and Port Engineering, Shandong Jiaotong University, Weihai 264209, China
2
School of Naval Architecture and Maritime, Zhejiang Ocean University, Zhoushan 316000, China
*
Authors to whom correspondence should be addressed.
J. Mar. Sci. Eng. 2025, 13(2), 307; https://doi.org/10.3390/jmse13020307
Submission received: 13 January 2025 / Revised: 1 February 2025 / Accepted: 5 February 2025 / Published: 7 February 2025
(This article belongs to the Section Ocean Engineering)

Abstract

:
With the rapid development and accelerated utilization of marine resources, multi-body floating systems have become extensively used in practical applications. This study examines the coupled motions of a side-by-side anchoring system for five fishing vessels in a harbor using ANSYS-AQWA. The system is connected by hawsers and equipped with fenders to reduce collisions between the vessels. It is designed to operate in the sheltered wind-wave combined environment within Ningbo Zhoushan Port, China. Considering the diverse types and quantities of fishing vessels in the anchorage area, this paper proposes a mixed arrangement of three large-scale fishing vessels in the middle and two small-scale vessels on both sides. The time-domain analysis is performed on this system under the combined effects of wind and waves, calculating the motion responses of the five fishing vessels along with the mechanical loads at the hawsers, fenders, and moorings. The results indicate that the maximum loads on these mechanical components remain well within the safe working limits, ensuring reliable operation. In addition, the impact of varying wind-wave angles on the coupled motions of the fishing vessel system are studied. As the wind-wave angle increases, the surge motion of the fishing vessels gradually decreases, while the sway motion intensifies. The forces on the hawsers, fenders, and mooring system exhibit distinct characteristics at different angles.

1. Introduction

With the growth in global fisheries and port economies, the demand for fishing vessel mooring in port areas is steadily increasing. Especially in high-density port areas, side-by-side mooring of multiple fishing vessels is a common scenario [1,2]. The design of the mooring system not only affects the operational efficiency of the fishing vessels but also relates to the safety of the port area and the stability of the vessels. Traditional mooring methods have predominantly been based on empirical designs [3]. While these methods are effective in straightforward scenarios, they often prove inadequate for addressing the complexities of modern port environments. This shortfall becomes particularly evident under dynamic hydrodynamic conditions, such as strong tidal currents, high waves, and fluctuating wind loads, as well as during extreme weather events like typhoons. These conditions exacerbate the challenges to the safety and stability of fishing vessels. Side-by-side fishing vessels in a port form a multi-body system, and traditional hydrodynamic analysis of single-body systems fails to accurately capture the coupling effects of multi-body interactions. These coupling effects can lead to amplified motion, overloading of the mooring system, and even pose risks such as collisions [4]. This has always been a key issue in shipbuilding and offshore engineering.
At present, investigations into multi-body systems generally fall into two areas: experimental studies [5,6] and simulation modeling [7,8,9]. With the advancement in computer technology, numerical methods have gradually become an essential tool for studying multi-body systems, with the theoretical foundation primarily based on potential flow theory. Current investigations on the interaction between waves and side-by-side vessels primarily focus on the two-ship side-by-side mooring of large commercial vessels. Pessoa et al. [10] studied the coupled motion response of two liquefied natural gas (LNG) tankers moored side-by-side in waves, comparing the motion characteristics and forces in different mooring configurations. The results showed that the motion response and mooring line tension of a large floating liquefied natural gas (FLNG) system and a shuttle tanker in deep water are nearly linear in the test sea state. While the numerical method accurately predicts the overall response, some discrepancies are observed in the bow rocking motions and high-frequency responses. The same authors [11] conducted a subsequent numerical and experimental study under low-frequency wave motion conditions in the same system. The study revealed that second-order, low-frequency loads should not be ignored when calculating the tension in a side-by-side mooring system. Ganesan et al. [12] investigated the interaction between two side-by-side fixed/floating bodies and nonlinear waves using a direct time-domain approach, focusing on FLNG systems, FPSO (Floating Production Storage and Offloading) vessels, and shuttle tankers. Zhou et al. [13] conducted a time-domain analysis of the relative motions between an FLNG system and a liquefied natural gas carrier (LNGC) under the influence of oblique waves. The study results indicated that the wave direction had a significant impact on the relative motions of sway, roll, and pitch. Yue et al. [14] studied the dynamic response of the FSRU (Floating Storage and Regasification Unit)-LNGC side-by-side mooring system under the combined effects of wind, waves, and currents. They proposed a mooring system configuration, corrected the hydrodynamic coefficients using the damping cover method, and analyzed the system’s motion response, as well as the forces on the hawsers and fenders, through numerical simulations and model tests. The feasibility of the numerical method and the selected damping coefficients were validated through model testing. Ok et al. [15] utilized Open-FOAM to simulate the motion of a single vessel and two side-by-side vessels (FPSO vessels) in regular waves, taking into account viscous damping and vortex shedding effects. The accuracy of the computational fluid dynamics (CFD) code was validated by the comparisons with experimental results and the predictions from linear potential flow theory. Hong et al. [16] employed the high-order boundary element method (HOBEM) combined with the generalized modal method to numerically and experimentally investigate the hydrodynamic interaction of FPSO and LNGC vessels, analyzing their motion responses and drift forces. Good agreement was shown between the numerical and experimental results in terms of global and local motion responses and drift forces, while discrepancies existed in the very narrow frequency region of wave drift force due to Helmholtz resonance.
AQWA has become an indispensable tool in this field, owing to its extensive applications in both frequency-domain and time-domain analyses, as well as its robust modeling capabilities for wave dynamics, fluid interactions, and floating body coupling. Naciri et al. [17] used three tools—AQWA, LIFSIM, and aNySIM—to perform time-domain simulations of LNGC and FSRU side-by-side mooring and unloading operations. The study focused on the dynamic characteristics under various environmental conditions, including vessel motion, mooring line tension, and fender load. By comparing the results of the simulations, the accuracy of AQWA was validated. Jin et al. [18] investigated the hydrodynamic characteristics of a side-by-side FLNG-LNG offloading system using AQWA. By comparing the results with experimental data, the computational method was found to be effective in predicting wave-frequency loads and second-order wave drift forces. Patel et al. [19] studied the kinematic response of FPSO vessels and shuttle tankers under regular wave conditions, where the failure of one mooring line induces vibrations in other lines, leading to a dramatic increase in the tension of the entire mooring system.
The aforementioned studies primarily focus on the motion and drift force analysis of multi-vessel side-by-side mooring systems, including FPSO vessels, LNGCs, FSRUs, and shuttle tankers. Additionally, some research addresses the operational dynamics of offshore platforms. Tong et al. [20] investigated the hydrodynamic interaction effects of the side-by-side operation of tender assisted drilling (TAD) and tension leg platform (TLP) platforms, as well as the influence of the nonlinear mooring system, using frequency and time-domain analysis methods. The results showed that, in the TLP-TAD system, the hydrodynamic interaction for the first-order motions of the TAD system was weak, but the mean drift force was significant. Xu et al. [21] studied the hydrodynamic response of three side-by-side moored barges in floating drilling platform operations. They employed the damping lip method to improve the hydrodynamic coefficients in the frequency domain. The time-domain computing program is based on potential flow and impulse theories, considering hydrodynamic interactions as well as the forces on the mooring lines and fenders. Model test validation showed that in the frequency-domain calculations, the hydrodynamic coefficients obtained from traditional potential flow theory were overestimated due to multi-barge interactions, leading to exaggerated motion in the time-domain simulations. The damping cap method effectively mitigated this overestimation.
Gap resonance is also a very important influence in the study of hydrodynamic performance of multi-float side-by-side moorings. Chen et al. [22] introduced a damping correction to analyze the effects of floating body number, gap width, and damping ratio on the system’s hydrodynamic and dynamic behavior. The results indicated that the hydrodynamic interactions between floating bodies depend on both the gap width and the body width, with resonance modes shifting as the gap narrows. Additionally, the number of floating bodies influences the pitch response. The inclusion of damping effectively suppresses the resonance effect, enhances simulation accuracy, and reduces relative motion and connection loads. Zou et al. [23] analyzed the gap resonance phenomenon between two side-by-side moored barges using both experimental data and numerical simulations. The findings showed that, due to the small ratio of gap width to barge width, the gap resonance response is particularly sensitive to the applied damping. Wang et al. [24] demonstrated the positive impact of gap resonance on the wave attenuation capacity of coastal structures, as well as the limitations of numerical tools in providing accurate values for this region.
In summary, significant progress has been achieved in the research on coupled motions in multi-float systems, which includes comprehensive analyses of multi-float motion responses, mooring forces, and the impacts of wave-frequency and low-frequency loads, employing both experimental and numerical methods. Most current studies on multi-float systems focus on large commercial vessels, typically examining configurations involving two floating bodies. The available studies on small-scale fishing vessels have focused on vessel safety accidents [25,26], energy conservation and emission reduction [27,28], structural design [29,30], management and maintenance [31,32], and vessel type optimization [33,34,35]. Overall, most of the existing literature focuses on the performance analysis of single vessels, with less emphasis on the study of multi-vessel systems and the interactions between groups of fishing vessels, which provides an important research gap for this study. The main reasons are as follows [36]: First, compared to large commercial vessels, small-scale ships exhibit greater flexibility but lower stability, which imposes more stringent requirements on the conditions for physical model testing and the boundary conditions for numerical simulations. Second, with the development of the economy, the number of commercial vessels has been steadily increasing, while the application range of small-scale fishing vessels remains relatively limited. Additionally, since the research on fishing vessels is often non-profit-oriented, this has led to a growing tendency for research investments to focus more on large commercial vessels.
China is a leading global fishery nation. According to the 2024 China Fishery Statistical Yearbook [37], by the end of 2023, China had 338,817 motorized fishing vessels, with 89.62% of them measuring less than 24 m in length. Since Zhoushan is a significant fishery base in China, its harbors need to accommodate various types of fishing vessels. Without piers or other supporting structures, fishing vessels seeking shelter from the wind in the harbor typically adopt a side-by-side mooring arrangement. These vessels exhibit considerable variations in length and breadth. The mooring areas in fishing harbors are usually crowded, accommodating numerous vessels of varying sizes, while the available mooring space is limited. To optimize space utilization and adapt to the complexities of the mooring environment, vessels can be anchored in an alternating pattern of small and large fishing vessels. During the peak fishing season, the number of fishing vessels increases significantly, exacerbating the challenges of limited mooring space. The mixed mooring arrangement of large- and small-scale vessels effectively addresses diverse vessel requirements under these constraints.
This research is supported by the Science and Technology Tackling Project of the Zhejiang Provincial Department of Emergency Management, aiming to investigate the coupled motions of five fishing vessels moored side-by-side in the Ningbo Zhoushan Port. Numerical simulations of a system with three large-scale fishing vessels in the middle and two small-scale vessels on both sides, in an S-L-S arrangement, were conducted using AQWA (2022 R1). The motion responses of the vessel system under combined wind and wave conditions are comprehensively analyzed, with a particular focus on the effects of hawsers, fenders, and mooring loads. Additionally, the coupled motions of the side-by-side mooring system are compared under conditions with different wind-wave angles. The study takes into account the interactions between wind, waves, and fishing vessels, aiming to reveal the influence of various factors on mooring stability. This research provides a theoretical foundation for optimizing fishing vessel mooring systems and contributes to improving port management and the safety of fishing vessel operations. This work is organized as follows: The basic theory of the numerical model is presented in Section 2. Section 3 introduces the mooring model for side-by-side fishing vessels and environmental conditions, and Section 4 presents the calculation results and discussions. Finally, the conclusions are provided in Section 5.

2. Theoretical Background

2.1. Wind Load

The simulation of wind speed at any point in the wind field can be divided into mean wind speed and fluctuating wind speed. Globally, reference values are typically taken as the mean wind speed at a height of 10 m. In this study, the NPD wind spectrum is used to describe the fluctuating wind speed. The NPD wind spectrum expression is as follows:
S NPD ( f ) = 320 ( u 10 10 ) 2 ( z 10 ) 0.45 ( 1 + f ˜ 0.468 ) 3.561
where SNPD(f) is the energy spectral density at frequency of f, with units of m2/s. f is the frequency, with units of Hz; u10 refers to the 1 h average wind speed at a height of 10 m above the sea surface.  f ˜  is as follows:
f ˜ = 172 f ( z 10 ) 2 / 3 ( u 10 10 ) 0.75
The magnitude of the wind load is influenced by the shape coefficient, height coefficient, and the windward area of the structure. The wind load acting on the fishing vessel can be calculated using the following formula:
F = 0.613 C h C S S ν 2
where v is the design wind speed; Ch is the height coefficient; Cs denotes the shape coefficient; and S stands for the projected area of the wind-exposed component, also known as the windward area. More details about the wind loads can be found in reference [38].

2.2. Hydrodynamic Wave Loads

In this study, the hydrodynamic forces on the fishing vessel system are analyzed using potential flow theory and three-dimensional radiation/diffraction theory. Potential flow theory models the fluid as incompressible, inviscid, and irrotational while neglecting surface tension effects. The velocity potential is obtained by solving the Laplace equation and boundary conditions using the boundary element method (BEM). Hydrodynamic pressure is then derived from the wave velocity potentials and the linearized Bernoulli equation, with forces calculated by integrating pressure over the wetted surface. AQWA combines diffraction panel methods for large-volume components and Morison elements for small cross-section structures like mooring lines to estimate wave forces. The total velocity potential in the flow field around the fishing vessel system can be represented as the sum of the incident potential
φ x , y , z , t = φ I x , y , z , t + φ D x , y , z , t + φ R x , y , z , t
where φI is the incident wave velocity potential, representing the velocity distribution in the flow field; φD denotes the diffraction potential, indicating the effect of the structure on the velocity in the flow field; and φR stands for the radiation potential, which reflects the influence of the 6 degree of freedom (DOF) motion of the structure on the flow field.
The hydrodynamic wave loads, including incident, diffraction, radiation, and second-order wave forces, are determined by integrating the pressure over the wetted surface of the body and expressed through the velocity potentials corresponding to these wave components:
F = F I + F D + F R + F 2 n d
where FI is the incident wave load, FD is the diffraction wave load, FR is the radiation wave load, and F2nd is the second order wave forces.

2.3. Dynamic Catenary Mooring Line Model

Fishing vessel moorings were simulated using dynamic cable, discretized along the length of the cable. Each dynamic cable was modeled as a chain of Morison-type elements, connected by springs and subjected to various external forces. The forces acting on the cable element include both external hydrodynamic and inertial structural loads, but torsional deformations were not considered in the dynamic cable analysis. The equation of motion for the cable element is as follows:
T S e + V S e + w + F m = m 2 R t 2
M S e + R S e × w = q
where m is the mass of the element,  R  is the position vector, and Se is the length of the element.  q  and  w  are the distributed moment and weight load of the element, respectively.  T  is the tension vector at the first node of the element,  M  is the bending moment vector at the first node of the element, and  V  is the shear force vector at the first node of the element. In addition,  F m  represents the hydrodynamic load. For more details about the simulation of cable dynamics, refer to the theory manual [39].

2.4. Fender Load

The fender exhibits nonlinear characteristics in stiffness, friction, and damping when subjected to compression. Its mechanism of action is effective only in the compressive direction between two contact points of the structures. L0 denotes the fender initial uncompressed size, and Ld is the distance between the two contact points of the fender. When ∆L ≤ 0, the axial compressive force T is zero. When ∆L > 0, the axial compressive force can be expressed as a polynomial function of the compression, as follows:
T = k 1 Δ L + k 2 ( Δ L ) 2 + k 3 ( Δ L ) 3 + k 4 ( Δ L ) 4 + k 5 ( Δ L ) 5
where ∆L = L0Ld, and kj (j = 1 − 5) are the coefficients of the polynomial function. For more details about the fender load, refer to the theory manual [39].

2.5. Time-Domain Motion Control Equation

The coupling effect between the side-by-side fishing vessels and the mooring system was simulated through time-domain analysis. The equations of motion for the side-by-side fishing vessel mooring system are as follows:
M + Δ M X ¨ + B X ˙ + K X + 0 t R t τ X ˙ τ d τ = F wind + F wave + F mooring + F fender
where M is the structural mass matrix of the fishing vessel, and ∆M is the added mass matrix. B is the damping stiffness matrix excluding the linear radiation damping effects due to diffraction panels. K is the hydrostatic stiffness matrix, R is the velocity impulse function matrix, and F represents the loading force. The theory manual [39] and references [40,41] provide more details on this theory.

3. Side-by-Side Moored Model for Fishing Vessels in the Harbor

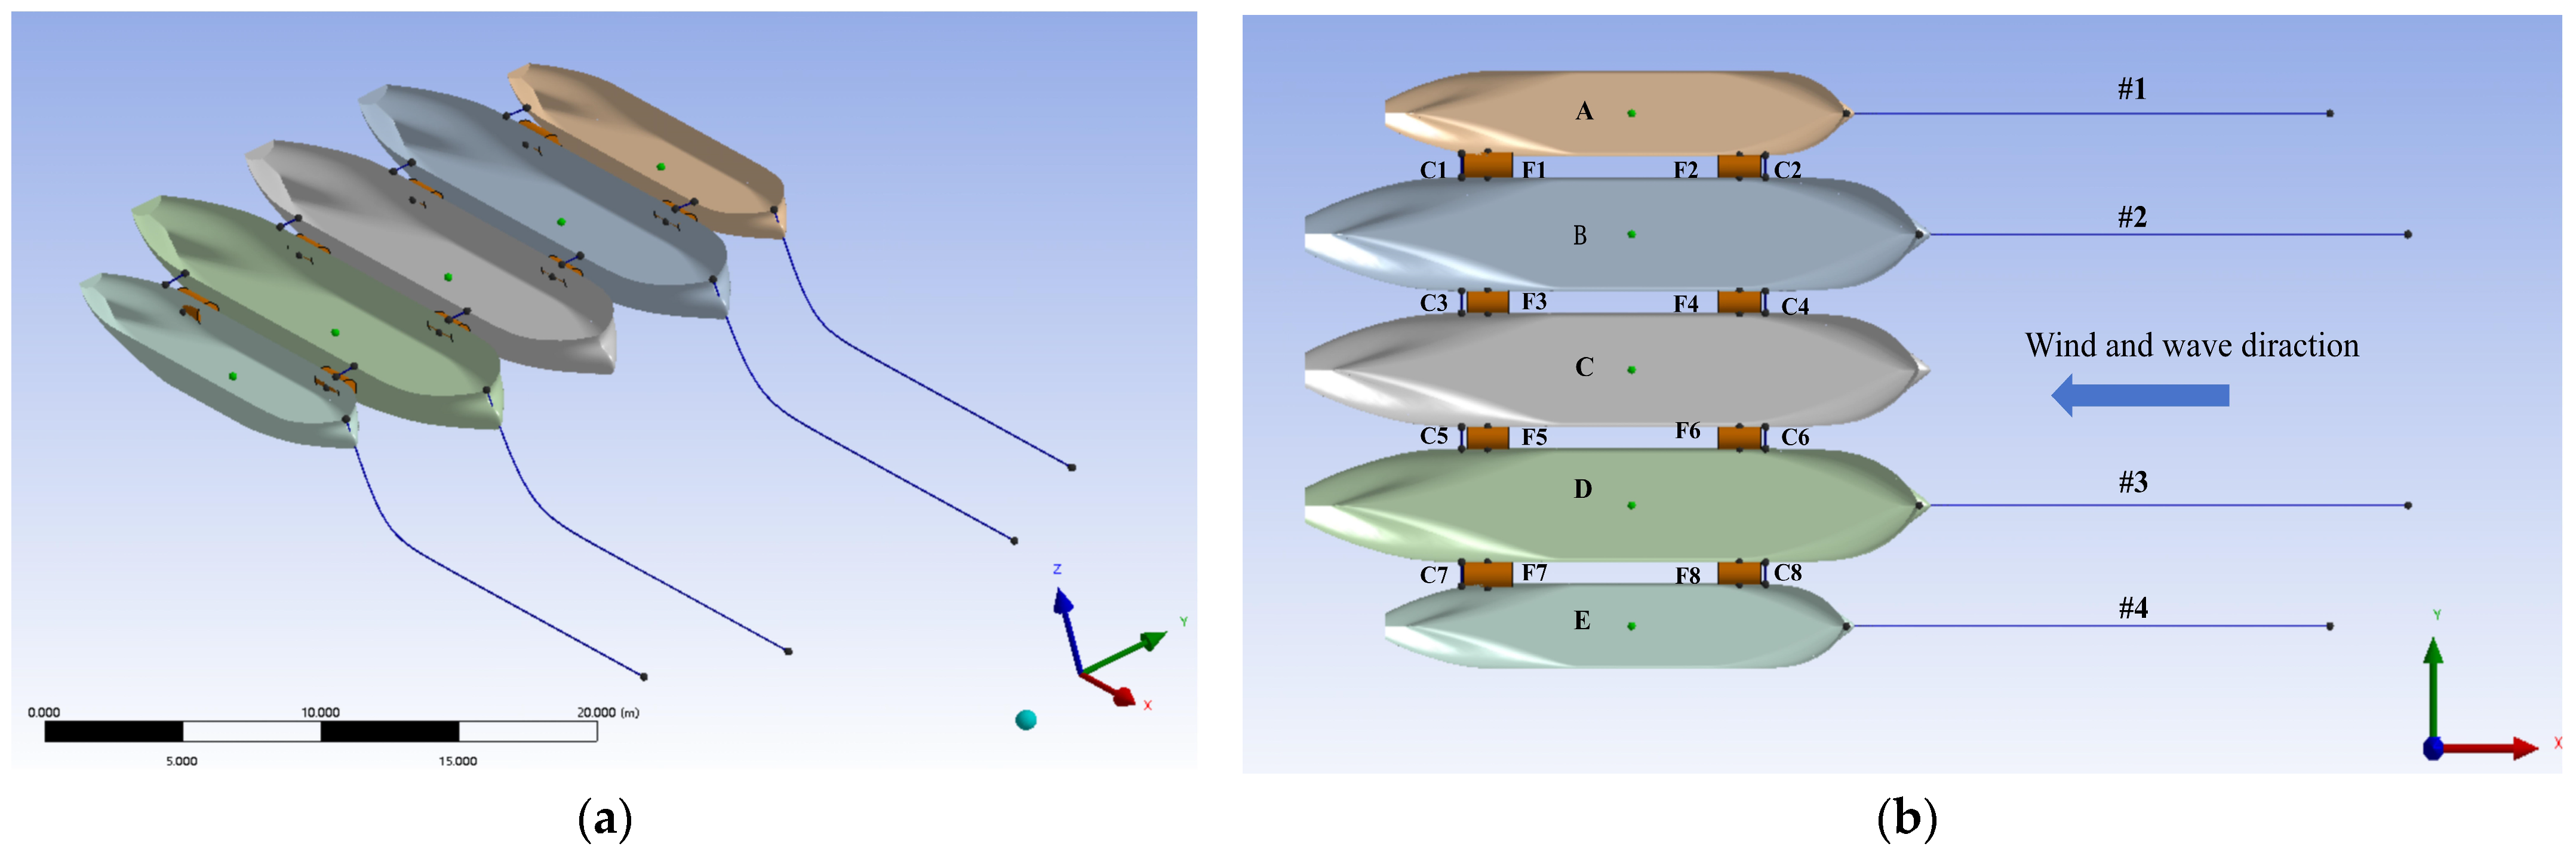
3.1. Fishing Vessel Parameters and Arrangements

In this study, fishing vessels 24 m in length are classified as large-scale vessels, while those 18 m in length are categorized as small-scale vessels. Table 1 presents the primary parameters of the large-scale and small-scale fishing vessel models. The hull models were developed in SolidWorks (2020) based on the seine fishing vessel line drawings provided by Huanghai Shipbuilding in China. Although the superstructure of the fishing vessels was not modeled, its effects were considered in the computational analysis. Initial calculations indicate that the risk of collision increases significantly when the spacing is less than 0.8m. To ensure the safety of the fishing vessels, this study adopts 0.8 m as the safe spacing between the fishing vessels for subsequent analysis and calculation. As shown in Figure 1, C1–C8 represent the inter-vessel hawsers, and F1–F8 denote the inter-vessel fender.

3.2. Fishing Vessel Configuration

The fishing vessel system utilizes a single-point mooring configuration, with all vessels moored at the bow. This system includes the anchoring of four vessels, reducing the number of anchor chains used by each vessel while ensuring safety between the vessels. Initial calculations show that when the mooring line diameter is less than 54 mm, the maximum tension is close to the breaking strength. Therefore, the mooring lines follow a catenary configuration and are made of a 54 mm steel-core steel cable. A pre-tension of 2.019 × 10⁵ N is applied to the top of each mooring line [42]. The details of the mooring configuration are provided in Table 2. The mooring system of the fishing vessel consists of eight polypropylene hawsers and eight fenders connected side-by-side. Each hawser has a breaking strength of 224 kN and a nonlinear stiffness coefficient of 2750 kN/m [43]. The length of the inter-vessel hawsers is greater than the spacing between the vessels, which is 0.85 m. The inter-vessel fenders are of the floating type, with a diameter of 0.8 m, a damping coefficient and a coefficient of friction of 0.1, and a nonlinear stiffness coefficient of 270 kN/m [44], and fenders are set up in the bow and the stern of the vessel.

3.3. Environmental Conditions

Ningbo Zhoushan Port in Ningbo, Zhoushan City, in Zhejiang Province, China, is situated along the central coastline of China’s mainland and on the southern flank of the Yangtze River Economic Belt. It is a first-class open port in China. The harbor area of Shen Jiamen Fishing Port, located on the southeastern side of the Zhoushan Islands in Zhejiang Province, serves as a natural sheltered harbor and is the largest natural fishing harbor in China. The region is prone to typhoons from July to September each year, with the impact of a tropical storm typically lasting around 2 to 3 days at most. Based on the measured data from the Zhoushan coastal waters during Typhoon “Gaemi” as reported by the Zhejiang Marine Monitoring and Forecasting Center [45], the environmental conditions for this study are defined as follows: the water depth of the port is 4m, with a wind speed of 28.5 m/s, significant wave height of 1.8 m, and a wave period of 4s. The simulation utilized the NPD wind spectrum to generate turbulent wind and the JONSWAP spectrum to generate irregular waves. Both wind and wave directions were set to 180°, with the horizontal direction aligned along the stern of the vessel, as shown in Figure 1. A time-domain analysis of five vessels side-by-side in a moored system was performed to simulate the variation in the dynamic sea state over a three-hour period. The simulation lasted for 10,800 s, with a time step of 0.1 s. The results from the final 2000 s of the simulation were extracted for analysis.

4. Results and Discussion

4.1. Coupled Motions Analysis of S-L-S Side-by-Side Mooring System

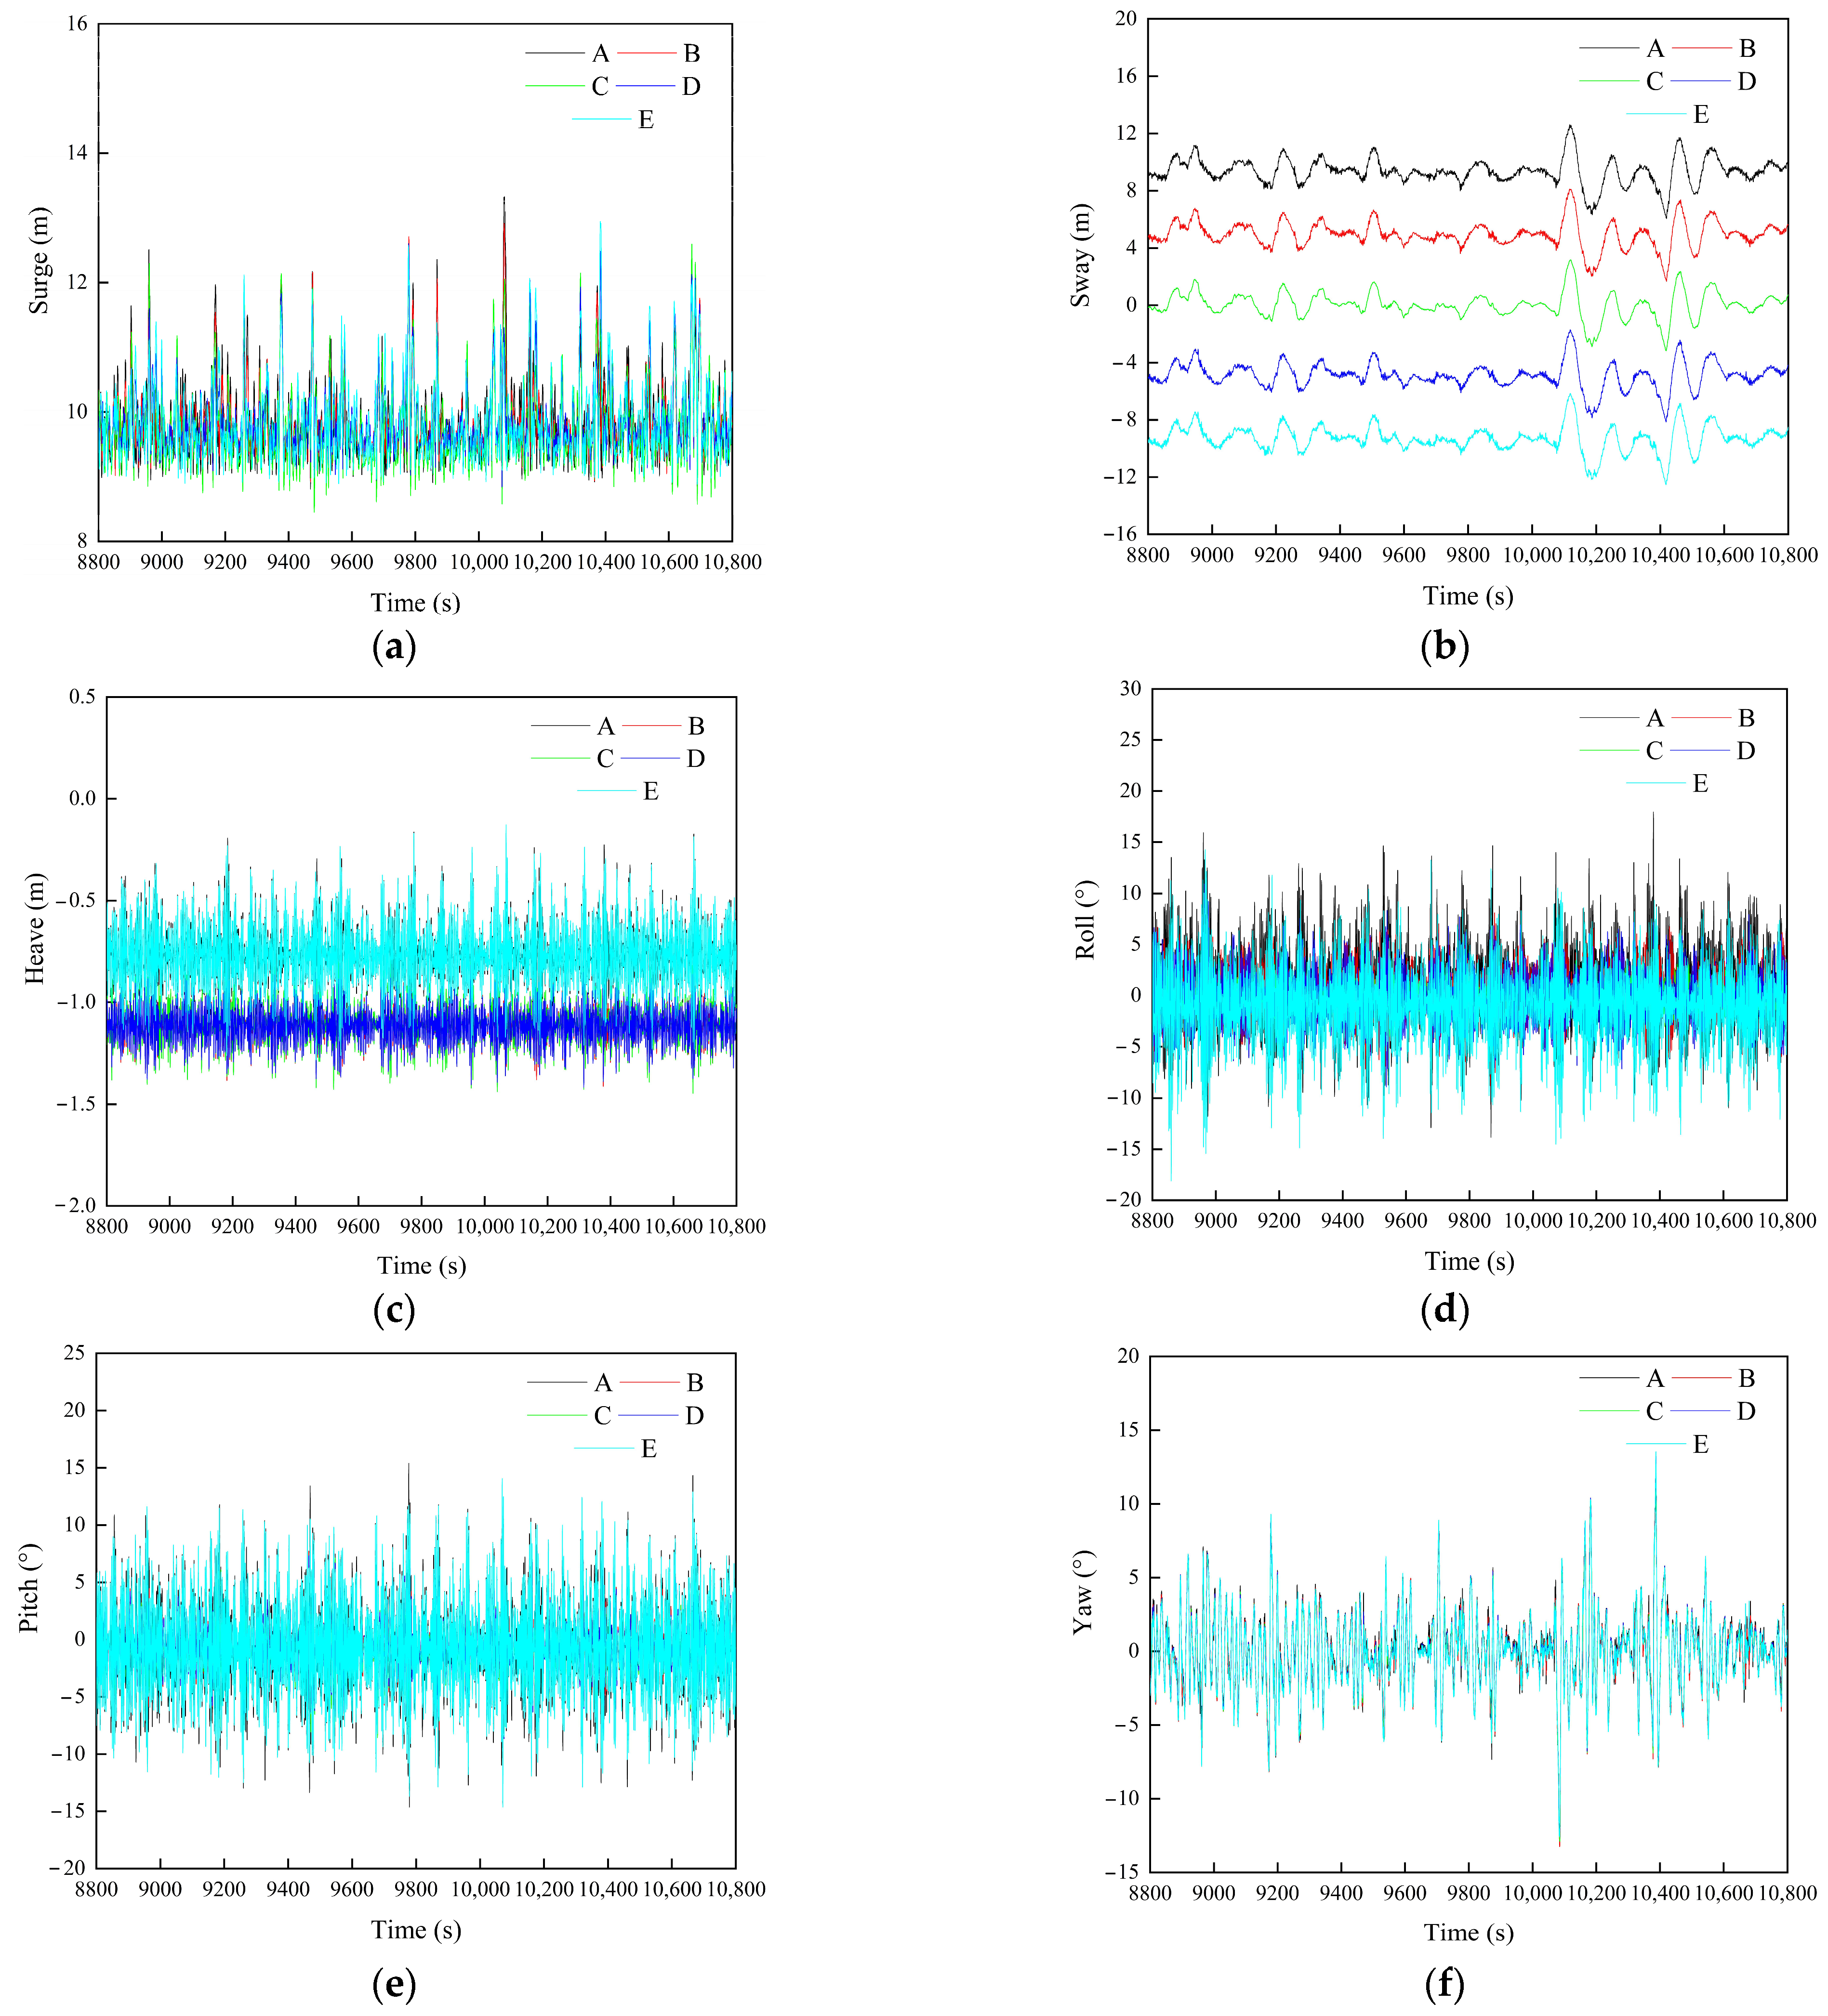
4.1.1. Analysis of Motion Responses

The time-domain prediction of the motion response for the S-L-S side-by-side system is shown in Figure 2, with the environmental conditions described in Section 3.3. It is observed that all five fishing vessels experience low-frequency motions, particularly in the sway direction, as shown in Figure 2b. Additionally, the 6DOF motion responses of the fishing vessels are mainly dominated by first-order wave-frequency motions, as illustrated in Figure 2c–e. The heave motion responses of vessels A and E are significantly greater than those of vessels B, C, and D. The sway motion responses of each fishing vessel fluctuated around its respective center of gravity (COG), which can also be observed in Figure 2b. Table 3 further presents the 6DOF motion responses of the five fishing vessels, with the corresponding COG positions indicated. The relative motion (RM) value represents the difference between the mean translational motion (surge, sway, and heave) of the vessel and the initial COG position of the same vessel. In the 6DOF motion responses of this system, the surge, pitch, and roll motions exhibit larger responses, while the responses of the other motions are comparatively smaller. From the RM values of the translational motions, it can be found that the surge RM values for the five fishing vessels are similar, approximately 2.80 m. The RM value for sway motion of vessel C is greater than the other four vessels, measuring 0.63 m. The heave RM value for both small-scale fishing vessels is 0.57 m, which is smaller than the 0.66 m obtained for all three large-scale vessels. In the rotational motions of the system, significant differences are observed between the roll and pitch motions. The roll and pitch angles of vessels A and E are notably larger compared to the other three vessels, with vessel C exhibiting the smallest roll angle. Vessels B and D have the smallest pitch angles, while the yaw angles of the five vessels are relatively similar.

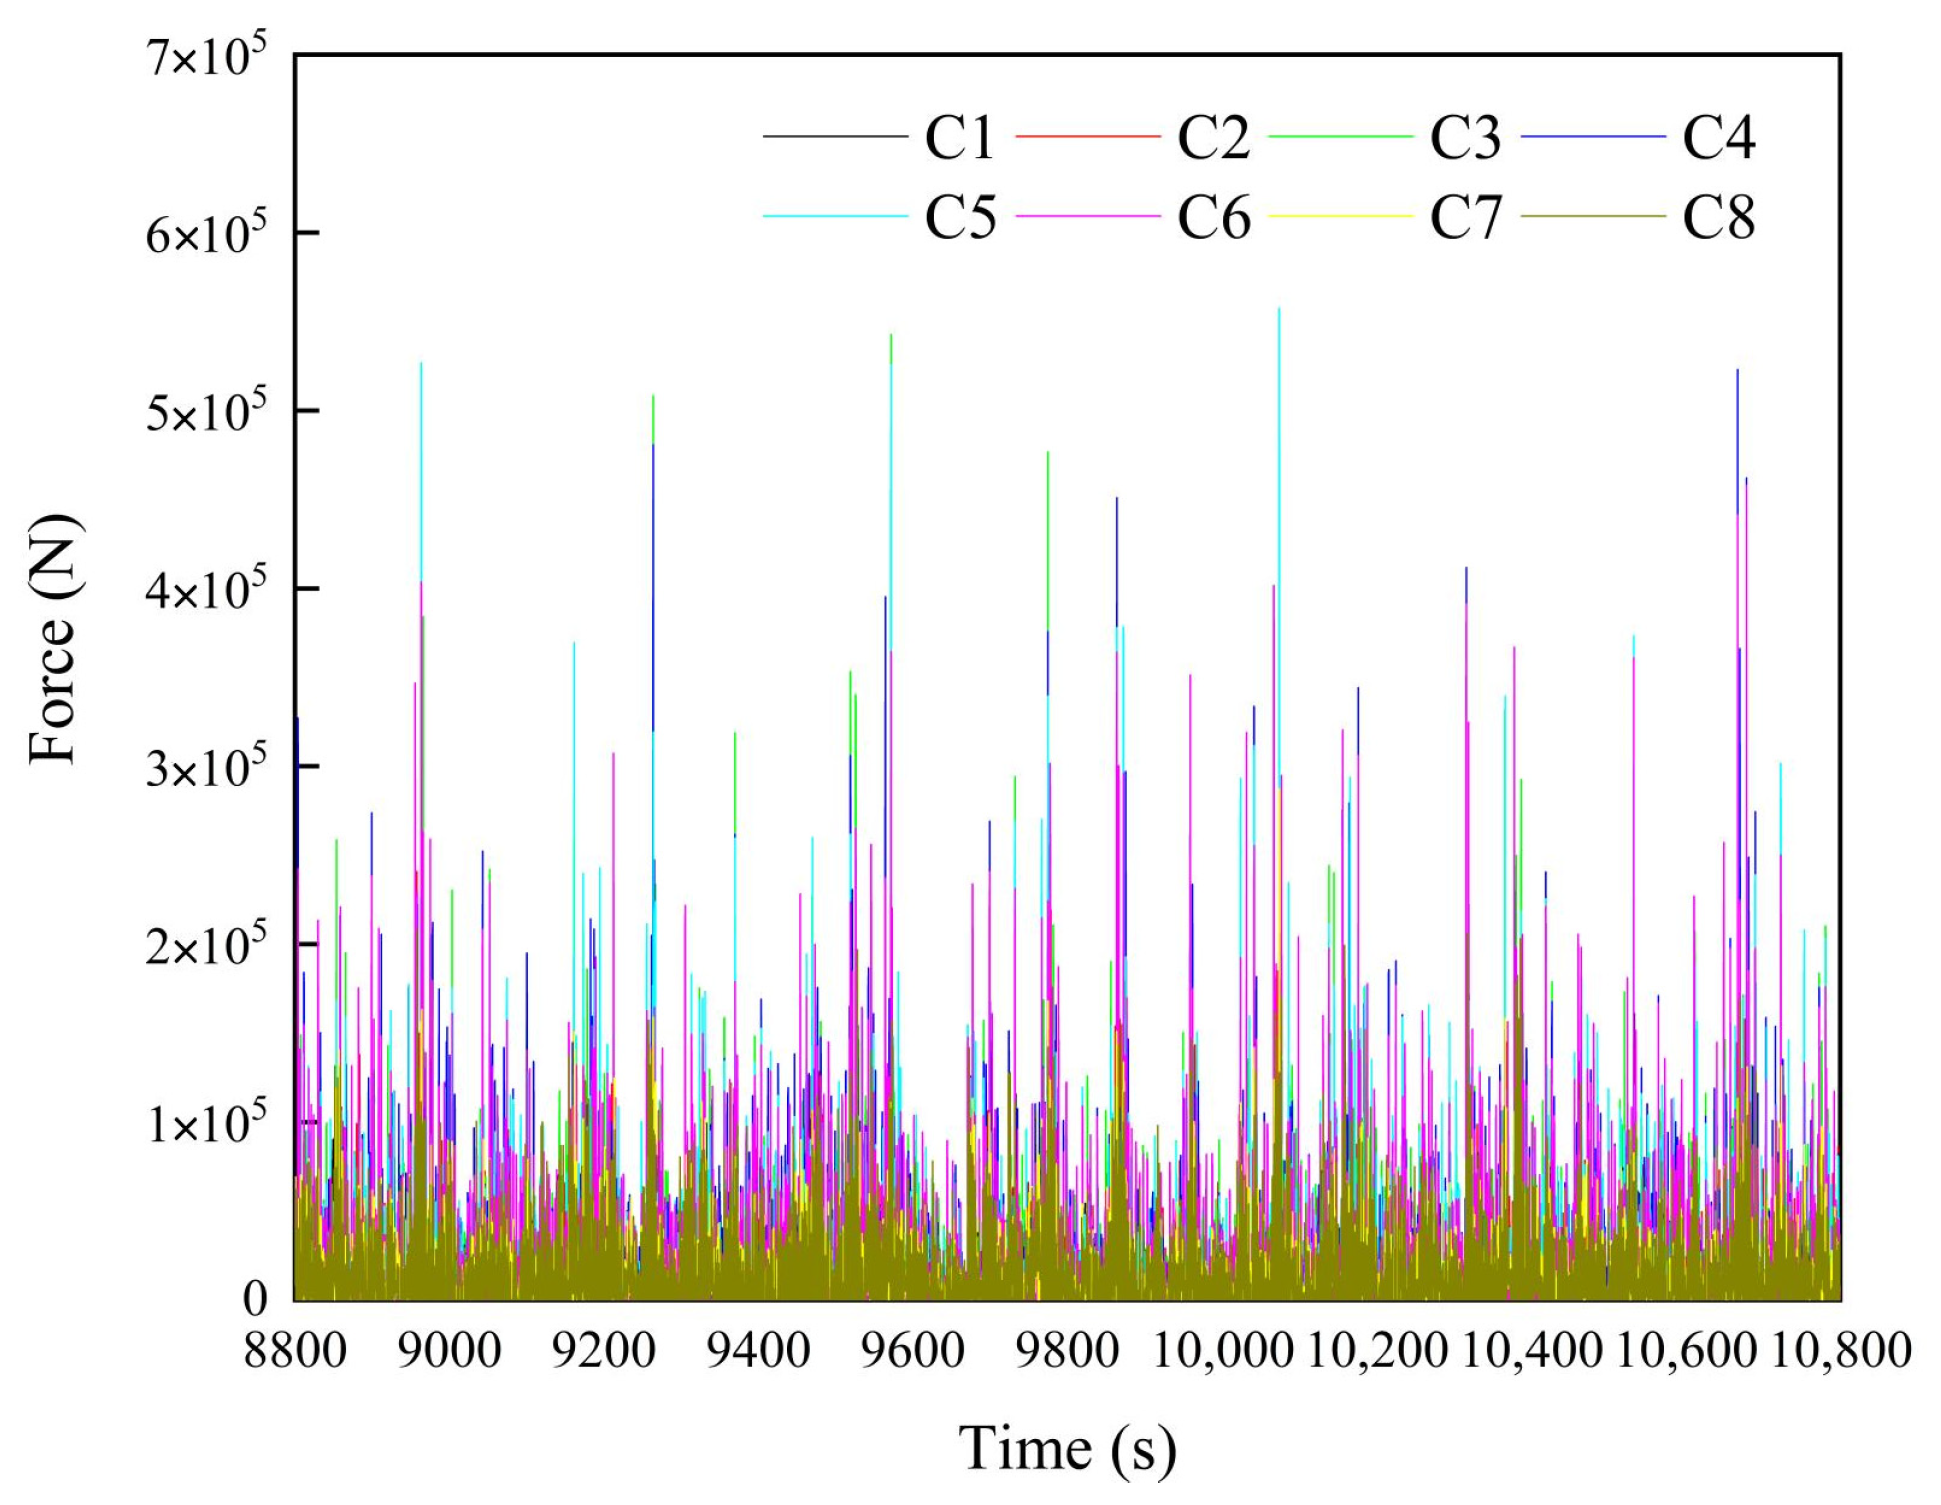
4.1.2. Analysis of Hawsers, Fenders, and Mooring Loads

In addition to the motion responses of the S-L-S side-by-side system, this study analyzes the mechanical loads on the hawsers, fenders, and mooring system. The results in Figure 3 indicate that the load variation curve of the hawsers closely aligns with the surge motion response curve, highlighting a strong correlation with the surge motion of the system. Table 4 summarizes the average and maximum hawser loads at various positions. The load on the hawsers at the stern is significantly higher than that at the bow, suggesting that the stern is subjected to greater dynamic pressure.
Figure 4 presents the time-domain curves of fender collision forces, represented as impulse loads. Table 5 summarizes the average and maximum fender forces at various locations. Due to the smaller displacement of the small-scale fishing vessels, the fenders at the stern of vessels A and B, as well as D and E, experience more collisions than those at the bow. In contrast, the fenders at the bow of vessel C endure more collisions than those at the stern when connected to vessels B and D.
The mooring loads applied at the bow connection of the S-L-S side-by-side system are shown in Figure 5. The results show that the mooring lines are under tension conditions due to their own weights, with low-frequency force components being dominant. While low-frequency fluctuations prevail, some high-frequency oscillations are also observed, characterized by rapid changes in tension over a relatively short period. The tension values for the different mooring lines are presented in Table 6. It can be observed that the average loads on mooring lines #2 and #3 are almost the same, as well as the average loads on mooring lines #1 and #4. This helps explain the relatively small responses in the roll and pitch motion of vessels B and D in Figure 2d,e.
The maximum loads of the components, as shown in Table 4, Table 5 and Table 6, are within their safe working load limits, indicating that this configuration is feasible and ensures safe operation.

4.2. Coupled Motions Analysis of the S-L-S Side-by-Side System at Different Wind Direction Angles

In this section, the effect of different wind angles on the coupled motions of the S-L-S side-by-side system is considered. The wave incidence angle is 180°, and the wind incidence angle ranges from 185° to 220° in 5° intervals. The wind-wave angle combinations considered are 5°, 10°, 15°, 20°, 25°, 30°, 35°, and 40°. As shown in Figure 6, the environmental conditions remain consistent with those previously described. The wind forces acting on both large-scale and small-scale fishing vessels in the X and Y directions at varying wind-wave angles are presented in Figure 7 and Figure 8. It is evident that as the wind-wave angle increases, the wind force in the X-direction decreases, while the wind force in the Y-direction increases. Due to the smaller windage area of the small-scale fishing vessels, the wind forces acting on them are lower compared to those on the large-scale vessels.

4.2.1. Analysis of the Motion Responses

Table 7 summarizes the mean values of the 6DOF relative motions of the S-L-S side-by-side system at different wind-wave angles. It can be found that as the wind-wave angle increases, the surge motion of the vessels decreases gradually, while the sway motion increases. This is due to the reduction in the wind force acting on the fishing vessels in the X-direction, coupled with the increase in the wind force in the Y-direction. The impact of the wind-wave angle on the heave and pitch motions is minimal. As the wind-wave angle increases, the yaw motion of the vessels gradually increases, while the roll motion initially increases and then decreases. The roll angle of vessels A and E reaches its maximum at a wind-wave angle of 10°, while vessels B and D exhibit the maximum roll angle at 5°. Vessel C experiences the maximum roll angle at a wind-wave angle of 35°.

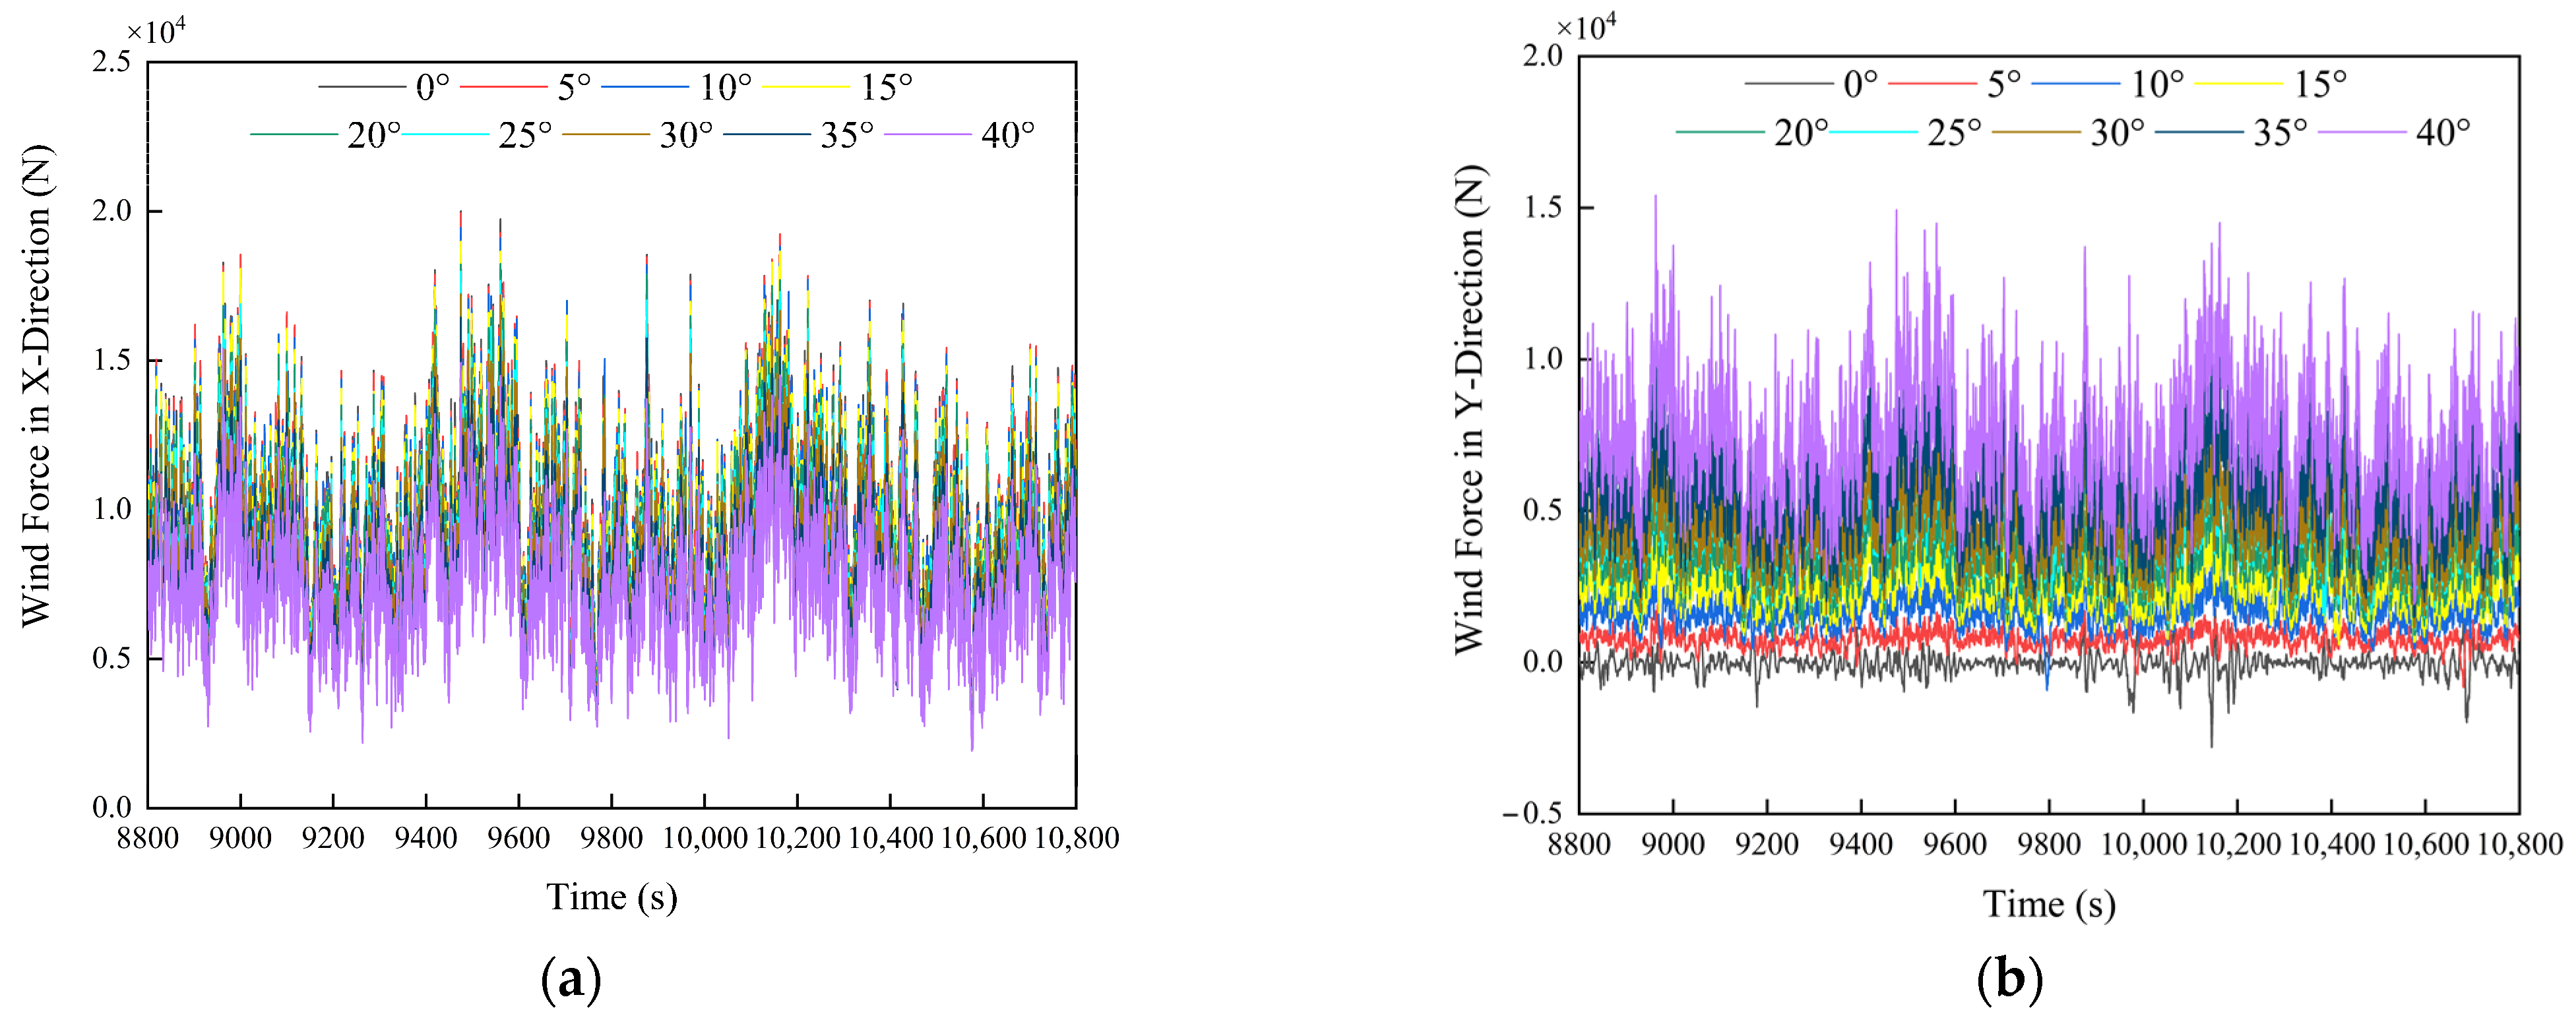
4.2.2. Analysis of Hawsers, Fenders, and Mooring Loads

Figure 9 shows the average tension force curves of the hawsers at different wind-wave angles. The tension in C1 is relatively small and remains largely stable with minimal fluctuation as the wind-wave angle increases. In contrast, the tension in C2 exhibits lower values with slight fluctuations at smaller angles (0–15°) but increases significantly as the wind-wave angle reaches 40°, demonstrating a clear sensitivity to the angle. As the wind-wave angle increases, the tensions in the hawsers at positions C3 and C4 both show a steady linear increase, with a significant rise in the force at C4. The tensions at positions C5 and C6 both initially decrease and then increase. The tension at C5 starts to rise after 20°, while the tension at C6 increases after 25°, with both showing noticeable changes. For positions C7 and C8, the tensions increase gradually in the initial stages as the wind-wave angle increases but decrease after reaching 30°, indicating their sensitivities to angle variations and nonlinear response characteristics.
Figure 10 illustrates the trend of the mean fender forces at different wind-wave angles. It is obvious that with the increase in wind-wave angles, the force on F3 increases significantly, demonstrating high sensitivity to angle variations. In contrast, the force on the fenders at other positions shows relatively small variations. The forces on F1 and F2 remain stable between 0° and 20° and then generally increase as the angle exceeds 20°. At position F4, a slight increase in force is observed when the wind-wave angle is below 20°, indicating its adaptability to smaller angles. However, when the angle exceeds 20°, the force increases progressively, reaching a peak at 35°, and then slightly diminishes as the angle approaches 40°. At position F6, the force decreases gradually up to a wind-wave angle of 15°, after which it stabilizes with further increases in the angle. For position F5, the force first decreases and then increases, with the minimum force observed at a wind-wave angle of 25°. The forces on F7 and F8 show relatively small variations, but slight fluctuations are observed at different angles. Overall, the fender at F3 is likely to experience larger dynamic impact forces when exposed to wind and waves, while the force variations at other positions are relatively small, indicating different loading characteristics.
Figure 11 presents the mean tension curves of the mooring lines at different wind-wave angles. The mean tension values of the mooring lines behave differently at different wind-wave angles. For mooring lines #3 and #4, the tension decreases progressively with increasing wind-wave angles, following a linear pattern, reaching its lowest at 40° and highest at 0°. In contrast, the tension in mooring line #1 increases steadily with the wind-wave angle, also exhibiting a linear trend, peaking at 40°. Meanwhile, the tension in mooring line #2 first rises and then drops, peaking at 20°.

5. Conclusions

In this study, AQWA (2022 R1) was used to analyze the coupled motions of the side-by-side anchoring system consisting of five fishing vessels sheltering in Ningbo Zhoushan Port under typhoon conditions. Typhoons often bring strong winds and high waves, posing significant challenges to the safety of fishing vessels. In the absence of piers or other supporting structures, ensuring effective wind protection and vessel stability becomes particularly critical. In this context, this paper examines an arrangement consisting of three large-scale fishing vessels in the middle and two small-scale vessels on both sides (S-L-S). The study investigates the motion response of the side-by-side vessel system, as well as the forces acting on the hawsers, fenders, and mooring system. Finally, a comparison of the overall performance of the S-L-S system at different wind-wave angles is presented. The main conclusions drawn are as follows:
  • In the 6DOF motion of the S-L-S side-by-side system, the surge, roll, and pitch responses are relatively large, while the other motion responses are smaller. The roll and pitch angles of two small-scale vessels on both sides are significantly higher than those of the other vessels, indicating that their dynamic responses are more pronounced;
  • The forces acting on the hawsers, fenders, and mooring system are all represented as impulse loads. Under combined wind and wave conditions, collisions between the fishing vessels are relatively intense. The maximum loads on these mechanical components remain below their safe working limits, ensuring that they can operate safely;
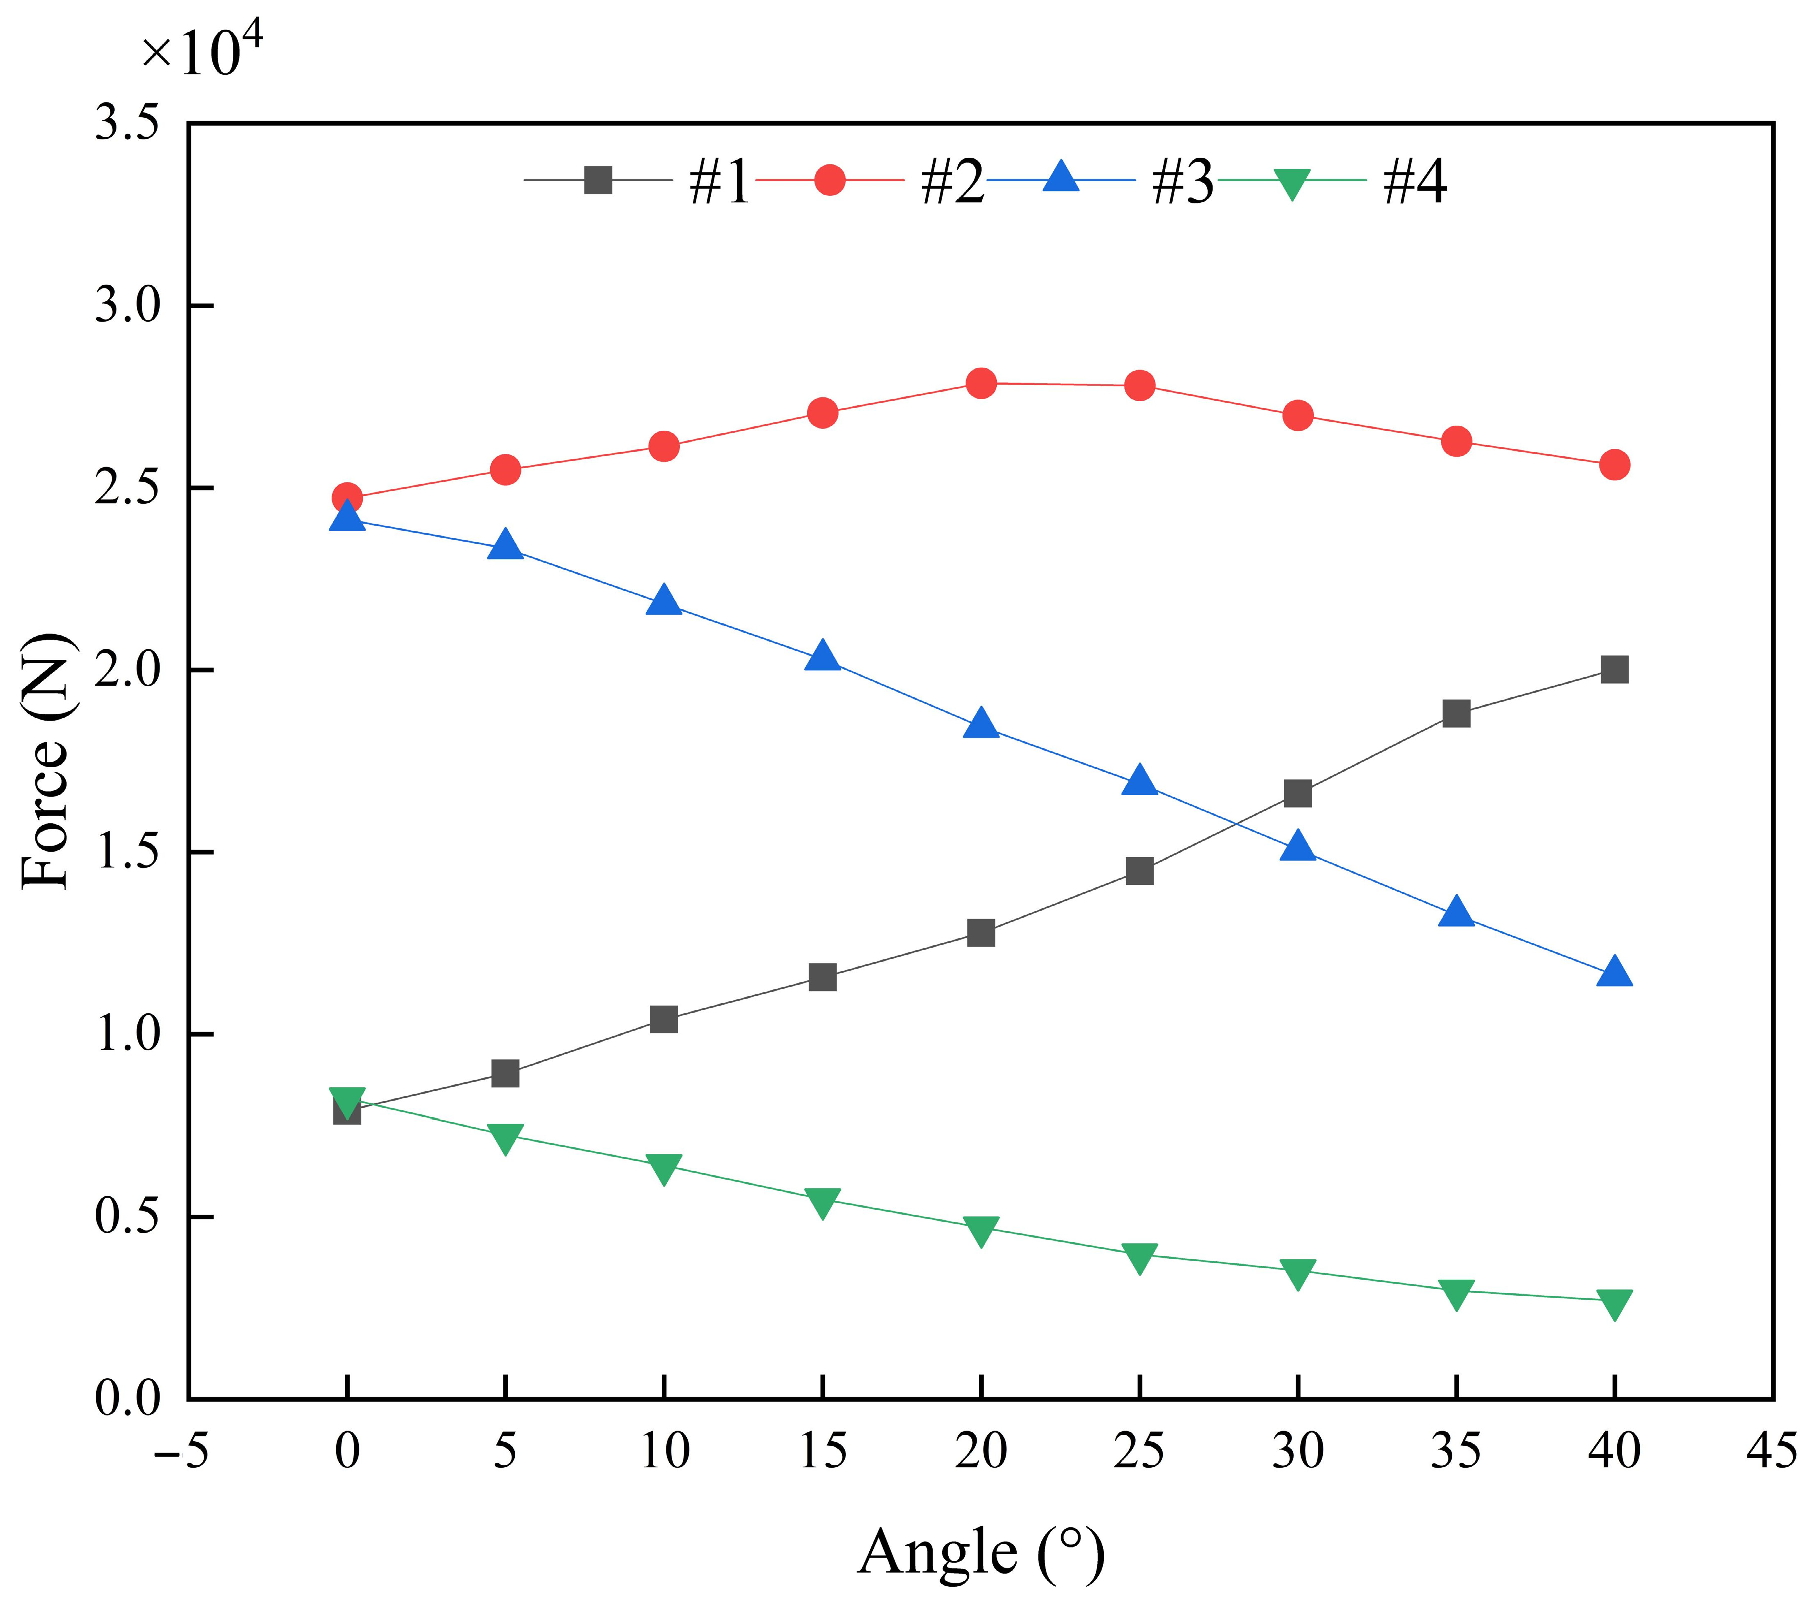
  • With the increase in the wind-wave angles, the surge relative motion of the fishing vessels gradually decreases, while the sway relative motion increases. The wind-wave angle has minimal impact on the heave and pitch motion responses. The forces acting on the hawsers, fenders, and mooring system exhibit distinct characteristics at different angles.
This study primarily focuses on the time-domain analysis of the coupled motions of the side-by-side fishing vessel system. This configuration plays a critical role in influencing the motion characteristics of the vessels and ensuring the safety of the mooring system. It should be noted that the limitation of this study is the lack of consideration for the shielding effect of lee vessels by luff vessels with varying wind directions. This may result in some deviation from actual values, but the approach employed helps to maximize the safety of the fishing vessels. Future research will primarily focus on the resonance between fishing vessel systems, incorporating experimental data to conduct a more comprehensive investigation into the long-term stability and safety of the systems under fluctuating environmental conditions.

Author Contributions

Conceptualization, X.M., J.H. and B.J.; Formal analysis, X.M. and J.H.; Data curation, X.M. and J.H.; Funding acquisition, G.Z. and X.M.; Investigation, J.H. and B.J.; Writing—original draft, X.M.; Writing—review and editing, B.J., G.Z., H.L. and H.S. All authors have read and agreed to the published version of the manuscript.

Funding

This research was funded by Zhejiang Provincial Department of Emergency Management (grant number ZYJ-2023-053) and the Graduate’s Scientific Research Foundation of Shandong Jiaotong University (grant number 2024YK105).

Institutional Review Board Statement

Not applicable.

Informed Consent Statement

Not applicable.

Data Availability Statement

The data presented in this study are available on request from the corresponding author.

Conflicts of Interest

The authors declare no conflicts of interest.

References

  1. Sun, Y.; Yu, D.; Xiong, Y.; Wang, G.; Li, X. Experimental Investigations on the Roll Motion Characteristics of Multi-Fishing Boats Anchored Side by Side. China Ocean Eng. 2024, 38, 1071–1081. [Google Scholar] [CrossRef]
  2. Hou, W.; Zhang, R.; Zhang, P.; Xi, Y.; Ma, Q. Wave characteristics and berthing capacity evaluation of the offshore fishing port under the influence of typhoons. Appl. Ocean Res. 2021, 106, 102447. [Google Scholar] [CrossRef]
  3. Ma, K.-T.; Luo, Y.; Kwan, C.-T.T.; Wu, Y. Mooring System Engineering for Offshore Structures; Gulf Professional Publishing: Houston, TX, USA, 2019. [Google Scholar]
  4. Feng, X.; Bai, W. Hydrodynamic analysis of marine multibody systems by a nonlinear coupled model. J. Fluids Struct. 2017, 70, 72–101. [Google Scholar] [CrossRef]
  5. Sun, S.; Li, W. Experimental investigation on the coupling response of a multi-floating side-by-side system between a single-point mooring carrier and an articulated floating platform. Ocean Eng. 2023, 281, 114700. [Google Scholar] [CrossRef]
  6. Bai, X.; Luo, H.; Xie, P. Experimental investigation on hydrodynamic performance of side-by-side three barges in topsides floatover installation in beam seas. Ocean Eng. 2021, 236, 109516. [Google Scholar] [CrossRef]
  7. Dong, Q.; Yang, J.; Lu, H.; Li, X.; Lu, W.; Liu, L. Dynamic Response of a Gangway Between Two Floating Bodies in a Side-by-Side Configuration. In Proceedings of the International Conference on Offshore Mechanics and Arctic Engineering, Glasgow, UK, 9–14 June 2019; p. V07AT06A027. [Google Scholar]
  8. Mirzaei, M.; Shafieefar, M.; Moharrami, M.R. Hull-Mooring Coupled Dynamic Analysis of Two Side-by-Side Operating Vessels. In Proceedings of the International Conference on Offshore Mechanics and Arctic Engineering, Shanghai, China, 6–11 June 2010; pp. 639–644. [Google Scholar]
  9. Chitrapu, A.M.; Mordfin, T.G.; Chance, H.M. Efficient time-domain simulation of side-by-side moored vessels advancing in waves. In Proceedings of the International Conference on Offshore Mechanics and Arctic Engineering, San Diego, CA, USA, 10–15 June 2007; pp. 871–879. [Google Scholar]
  10. Pessoa, J.; Fonseca, N.; Soares, C.G. Numerical study of the coupled motion responses in waves of side-by-side LNG floating systems. Appl. Ocean Res. 2015, 51, 350–366. [Google Scholar] [CrossRef]
  11. Pessoa, J.; Fonseca, N.; Soares, C.G. Side-by-side FLNG and shuttle tanker linear and second order low frequency wave induced dynamics. Ocean Eng. 2016, 111, 234–253. [Google Scholar] [CrossRef]
  12. Sen, D. Time domain simulation of side-by-side floating bodies using a 3D numerical wave tank approach. Appl. Ocean Res. 2016, 58, 189–217. [Google Scholar]
  13. Zhou, K.; Hu, Z.; Zhao, D. Time-domain analysis of the relative motions between side-by-side FLNG and LNGC under oblique waves. J. Mar. Sci. Appl. 2018, 17, 519–530. [Google Scholar] [CrossRef]
  14. Yue, J.; Kang, W.; Mao, W.; Chen, P.; Wang, X. Prediction of dynamic responses of FSRU-LNGC side-by-side mooring system. Ocean Eng. 2020, 195, 106731. [Google Scholar] [CrossRef]
  15. Ok, H.; Lee, S.; Choi, J. Numerical simulation of motion of single and side-by-side vessels in regular waves using OpenFOAM. Ships Offshore Struct. 2017, 12, 793–803. [Google Scholar] [CrossRef]
  16. Hong, S.; Kim, J.; Cho, S.; Choi, Y.; Kim, Y. Numerical and experimental study on hydrodynamic interaction of side-by-side moored multiple vessels. Ocean Eng. 2005, 32, 783–801. [Google Scholar] [CrossRef]
  17. Naciri, M.; Waals, O.; de Wilde, J. Time domain simulations of side-by-side moored vessels: Lessons learnt from a benchmark test. In Proceedings of the International Conference on Offshore Mechanics and Arctic Engineering, San Diego, CA, USA, 10–15 June 2007; pp. 801–811. [Google Scholar]
  18. Jin, Y.; Chai, S.; Duffy, J.; Chin, C.; Bose, N. Hydrodynamics of a conceptual FLNG system in side-by-side offloading operation. Ships Offshore Struct. 2019, 14, 104–124. [Google Scholar] [CrossRef]
  19. Patel, M.; Liew, M.; Mustaffa, Z.; Al-Yacouby, A.; Abdurrasheed, A.S.; Whyte, A. Downtime cost analysis of offloading operations considering vessel motions and mooring responses in Malaysian waters. In Proceedings of the 2019 IEEE student conference on research and development (SCOReD), Bandar Seri Iskandar, Malaysia, 15–17 October 2019; pp. 63–68. [Google Scholar]
  20. Tong, B.; Chang, R.; Kang, Z.; Sui, H.; Li, S. A Numerical Study of TAD and TLP Platforms Operating Side by Side. In Proceedings of the International Conference on Offshore Mechanics and Arctic Engineering, Virtual, 3–7 August 2020; p. V06AT06A031. [Google Scholar]
  21. Xu, X.; Yang, J.-m.; Li, X.; Xu, L.-y. Time-domain simulation for coupled motions of three barges moored side-by-side in floatover operation. China Ocean Eng. 2015, 29, 155–168. [Google Scholar] [CrossRef]
  22. Chen, M.; Guo, H.; Wang, R.; Tao, R.; Cheng, N. Effects of gap resonance on the hydrodynamics and dynamics of a multi-module floating system with narrow gaps. J. Mar. Sci. Eng. 2021, 9, 1256. [Google Scholar] [CrossRef]
  23. Zou, M.Y.; Chen, M.S.; Zhu, L.; Yun, Q.H.; Zhao, W.H.; Liang, Q.Y.; Zhao, Y.J. Experimental and numerical investigation of gap resonances between side-by-side fixed barges under beam sea excitation. Ocean Eng. 2024, 297, 117150. [Google Scholar] [CrossRef]
  24. Wang, G.; Bar, D.; Schreier, S. The potential of end-of-life ships as a floating seawall and the methodical use of gap resonance for wave attenuation. Ocean Eng. 2024, 298, 117246. [Google Scholar] [CrossRef]
  25. Zhou, H.X.; Wang, F.; Hu, W.L.; Grifoll, M.; Liu, J.; Du, W.J.; Zheng, P.J. A Novel Framework for Identifying Major Fishing Vessel Accidents and Their Key Influencing Factors. Sustainability 2024, 16, 8246. [Google Scholar] [CrossRef]
  26. Lee, D.; Kim, H.; Koo, K.; Kwon, S. Human Reliability Analysis for Fishing Vessels in Korea Using Cognitive Reliability and Error Analysis Method (CREAM). Sustainability 2024, 16, 3780. [Google Scholar] [CrossRef]
  27. Palomba, V.; Dino, G.E.; Ghirlando, R.; Micallef, C.; Frazzica, A. Decarbonising the Shipping Sector: A Critical Analysis on the Application of Waste Heat for Refrigeration in Fishing Vessels. Appl. Sci. 2019, 9, 5143. [Google Scholar] [CrossRef]
  28. Notti, E.; Figari, M.; Sala, A.; Martelli, M. Experimental assessment of the fouling control coating effect on the fuel consumption rate. Ocean Eng. 2019, 188, 106233. [Google Scholar] [CrossRef]
  29. Zhang, X.; Lv, J.J.; He, D.C.; Wang, K.; Liu, Y.; Zhi, J. Hydrodynamic characteristics and internal flow field of a perforated fishing vessel under wave conditions. Ocean Eng. 2024, 314, 119611. [Google Scholar] [CrossRef]
  30. Zhang, F.; Cui, M.C.; Liu, H.; Zhang, C. The Effect of Corner Structure on the Optimisation of Fishable Flow Field in Aquaculture Tanks. J. Mar. Sci. Eng. 2024, 12, 1185. [Google Scholar] [CrossRef]
  31. Standal, D.; Ahlquist, I.H. Transforming coastal fisheries in Norway: Institutional implications of green technology implementation. Mar. Policy. 2025, 171, 106471. [Google Scholar] [CrossRef]
  32. Jankowsky, M.; Morroni, D.A.; Mendonca, J.T. Importance of fishing permits in no-take marine protected area overlapping with fishing grounds. Bol. Inst. Pesca 2024, 50, e824. [Google Scholar] [CrossRef]
  33. Chureev, E.A. Study of the Geometric Shape of A Small Fishing Trawler In An Effort to Improve Its Sea-Keeping Characterisics. Mar. Intellect. Technol. 2018, 3, 36–43. [Google Scholar]
  34. Jonsson, I.M.; Leifsson, L.; Koziel, S.; Tesfahunegn, Y.A.; Bekasiewicz, A. Shape Optimization of Trawl-Doors Using Variable-Fidelity Models and Space Mapping. In Proceedings of the 15th Annual International Conference on Computational Science (ICCS), Reykjavik, Iceland, 1–3 June 2015; pp. 905–913. [Google Scholar]
  35. Gammon, M.A. Optimization of fishing vessels using a Multi-Objective Genetic Algorithm. Ocean Eng. 2011, 38, 1054–1064. [Google Scholar] [CrossRef]
  36. Sun, Y.Y.; Xiong, Y.Z.; An, X.T.; Yu, D.S.; Wang, G. Experimental study on roll motion of small-scale multi-vessel anchored side by side in waves. Ocean Eng. 2024, 42, 130–140. (In Chinese) [Google Scholar]
  37. Liu, X. China Fishery Statistical Yearbook; China Agriculture Press: Beijing, China, 2024. (In Chinese) [Google Scholar]
  38. Wang, K.; Chu, Y.; Huang, S.; Liu, Y. Preliminary design and dynamic analysis of constant tension mooring system on a 15 MW semi-submersible wind turbine for extreme conditions in shallow water. Ocean Eng. 2023, 283, 115089. [Google Scholar] [CrossRef]
  39. ANSYS, Inc. AQWA Theory Manual; ANSYS, Inc.: Canonsburg, PA, USA, 2021. [Google Scholar]
  40. Mohapatra, S.C.; Amouzadrad, P.; Bispo, I.B.d.S.; Guedes Soares, C. Hydrodynamic Response to Current and Wind on a Large Floating Interconnected Structure. J. Mar. Sci. Eng. 2025, 13, 63. [Google Scholar] [CrossRef]
  41. Neisi, A.; Ghassemi, H.; Iranmanesh, M.; He, G. Effect of the multi-segment mooring system by buoy and clump weights on the dynamic motions of the floating platform. Ocean Eng. 2022, 260, 111990. [Google Scholar] [CrossRef]
  42. GB/T 20848-2017; Mooring Chain; China State Shipbuilding Corporayion Limted. Standardization Administration of the People’s Republic of China: Beijing, China, 2017. (In Chinese)
  43. Q/ZJSX 001-2016; Polypropylene Rope for Ships. Zhejiang Four Brothers Rope Co., Ltd.: Beijing, China, 2016. (In Chinese)
  44. T/CNASI 31-2020; Type Selection and Installation Requirements of Marine Rubber Fender; CSSC Huangpu Wenchong Shipbuilding Company Limted. China Association of the National Shipbuilding Industry: Beijing, China, 2020. (In Chinese)
  45. Zhoushan Maritime Safety Administration Has Initiated a Level IV Maritime Typhoon Emergency Response. Available online: https://news.qq.com/rain/a/20240721A03XV700 (accessed on 9 January 2025). (In Chinese).
Figure 1. Schematic diagram of five fishing vessels moored side-by-side in the harbor with an S-L-S arrangement. (a) Three-dimensional schematic; (b) labels for vessels, hawsers, fenders, and moorings.
Jmse 13 00307 g001
Figure 2. Time series of 6DOF motion responses for five fishing vessels: (a) surge; (b) sway; (c) heave; (d) roll; (e) pitch; (f) yaw.
Jmse 13 00307 g002
Figure 3. Time history of the forces acting on different hawsers.
Jmse 13 00307 g003
Figure 4. Time history of the forces acting on different fenders.
Jmse 13 00307 g004
Figure 5. Time history of tension in different mooring lines.
Jmse 13 00307 g005
Figure 6. Schematic of the wind and wave direction.
Jmse 13 00307 g006
Figure 7. Wind forces on large-scale fishing vessels: (a) X-direction; (b) Y-direction.
Jmse 13 00307 g007
Figure 8. Wind forces on small-scale fishing vessels: (a) X-direction; (b) Y-direction.
Jmse 13 00307 g008
Figure 9. Mean forces acting on different hawsers at various wind-wave angles.
Jmse 13 00307 g009
Figure 10. Mean forces acting on different fenders at various wind-wave angles.
Jmse 13 00307 g010
Figure 11. Mean forces acting on different mooring lines at various wind-wave angles.
Jmse 13 00307 g011
Table 1. Main model parameters for the fishing vessels.
Parameter Large-Scale Fishing VesselSmall-Scale Fishing Vessel
length/m2418
beam/m4.183.14
depth/m1.81.35
draft/m10.75
displacement/t102.8343.45
Table 2. Main parameters of the 54 mm steel-core mooring line [42].
ParameterValue
mass/unit length10.53 kg/m
axial stiffness1.18 × 108 N
initial tension2.019 × 105 N
added mass coefficient1.0
drag coefficient1.2
axial drag coefficient0.4
diameter0.054 m
length22 m
Table 3. Quantitative summary of the motion responses of five fishing vessels.
Vessel and COG Surge (m)Sway (m)Heave (m)Roll (°)Pitch (°)Yaw (°)
A
(12.15, 9.41, −0.2)
Max13.3312.57−0.1611.989.539.52
Min9.006.32−1.28−13.83−14.63−13.15
Mean9.859.37−0.772.983.411.86
RM2.300.040.57---------
B
(12.15, 4.97, −0.45)
Max12.708.07−0.818.048.7010.38
Min9.021.86−1.42−8.79−10.71−13.25
Mean9.884.96−1.111.962.271.84
RM2.270.010.66---------
C
(12.15, 0, −0.45)
Max12.032.23−0.772.507.947.59
Min8.84−3.18−1.45−4.01−9.72−12.90
Mean9.770.63−1.110.822.331.82
RM2.380.630.66---------
D
(12.15, −4.97, −0.45)
Max11.90−1.70−0.7910.516.638.99
Min9.06−8.15−1.42−8.90−10.69−12.60
Mean9.88−4.89−1.112.002.291.83
RM2.270.080.66---------
E
(12.15, −9.41, −0.2)
Max12.85−6.15−0.138.1210.8311.39
Min8.97−12.52−1.28−18.10−14.63−12.60
Mean9.84−9.30−0.772.993.381.84
RM2.310.110.57---------
Table 4. Quantitative summary of hawser loads.
Stern HawsersBow Hawsers
C1C3C5C7C2C4C6C8
Max (kN)213.95542.73557.60287.61256.03523.122457.98208.06
Mean (kN)15.0217.7818.4514.6812.4716.7216.3411.99
Table 5. Quantitative summary of fender loads.
Stern FendersBow Fenders
F1F2F3F4F5F6F7F8
Max (kN)106.0197.57146.55152.60155.49166.01109.96111.29
Mean (kN)14.0111.5315.1617.8514.6518.3313.7911.19
Table 6. Quantitative summary of mooring loads.
#1#2#3#4
Max (kN)588.951070.171281.20584.65
Mean (kN)8.1425.0624.488.48
Table 7. Quantitative summary of the relative motions of five fishing vessels at different wind angles.
DOF10°15°20°25°30°35°40°
ASurge (m)2.322.312.302.141.991.751.441.120.96
Sway (m)0.691.252.323.684.816.097.278.419.12
Heave (m)0.570.570.570.570.570.570.570.570.57
Roll (°)3.033.113.213.083.092.962.952.982.87
Pitch (°)3.343.373.353.313.283.263.243.223.19
Yaw (°)1.892.112.542.903.143.674.254.644.90
BSurge (m)2.272.262.242.041.901.651.311.010.88
Sway (m)0.641.232.263.604.846.017.188.339.07
Heave (m)0.670.670.670.670.670.670.670.670.67
Roll (°)1.962.052.021.861.881.971.831.891.79
Pitch (°)2.272.252.242.242.232.242.272.282.27
Yaw (°)1.831.942.412.853.063.584.144.704.72
CSurge (m)2.402.362.282.081.901.621.230.940.83
Sway (m)0.681.192.253.614.746.027.198.329.04
Heave (m)0.660.660.660.660.660.660.660.660.66
Roll (°)0.840.880.981.051.061.171.181.281.25
Pitch (°)2.322.332.332.332.322.322.332.342.34
Yaw (°)1.852.062.482.803.013.534.014.454.70
DSurge (m)2.282.222.141.931.741.461.120.850.81
Sway (m)0.681.162.203.574.705.987.158.289.00
Heave (m)0.660.660.670.670.660.660.660.660.66
Roll (°)2.012.102.031.931.821.821.761.731.77
Pitch (°)2.272.302.322.352.362.372.402.432.44
Yaw (°)1.862.082.522.853.063.594.154.504.75
ESurge (m)2.312.252.141.911.691.401.090.870.83
Sway (m)0.691.142.173.544.675.947.118.248.96
Heave (m)0.570.570.560.560.560.560.560.560.56
Roll (°)3.113.203.273.143.183.153.083.012.97
Pitch (°)3.353.413.423.463.463.463.483.503.50
Yaw (°)1.872.062.462.762.953.464.014.364.60
Disclaimer/Publisher’s Note: The statements, opinions and data contained in all publications are solely those of the individual author(s) and contributor(s) and not of MDPI and/or the editor(s). MDPI and/or the editor(s) disclaim responsibility for any injury to people or property resulting from any ideas, methods, instructions or products referred to in the content.

