
Artificial Fish Reef Site Evaluation Based on Multi-Source High-Resolution Acoustic Images


Abstract
:1. Introduction
2. Materials and Methods
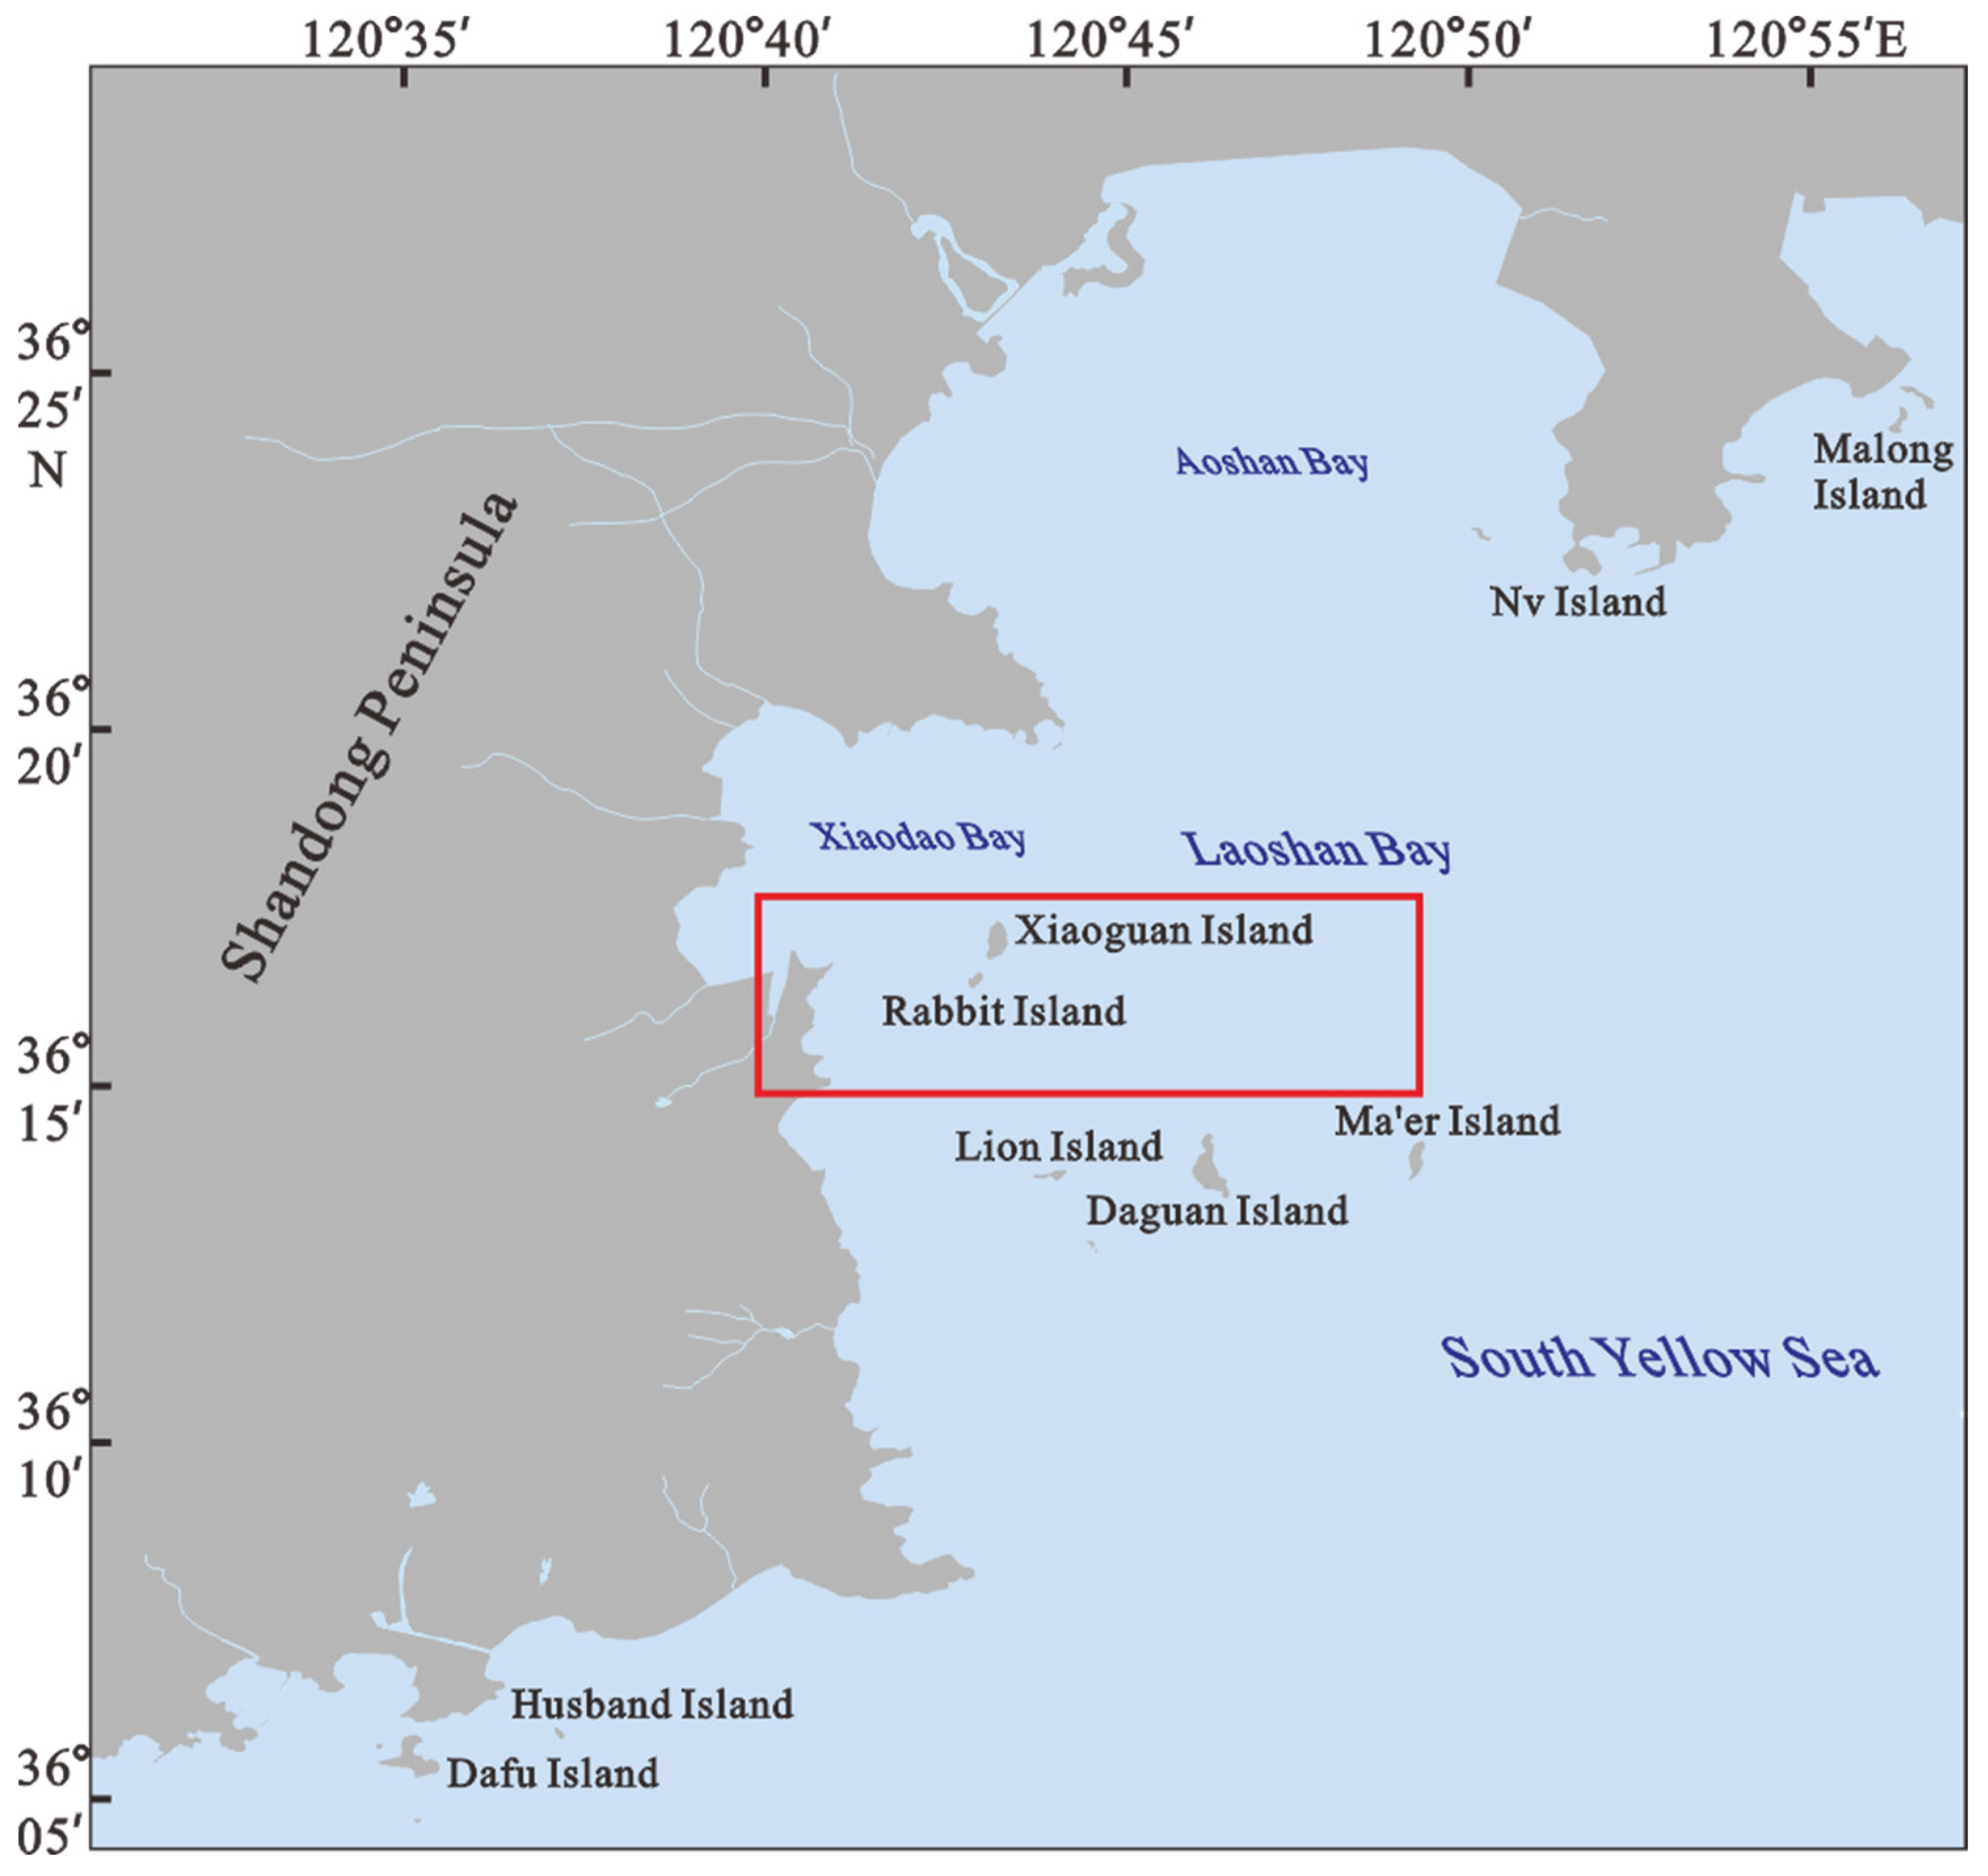
2.1. Geological Setting
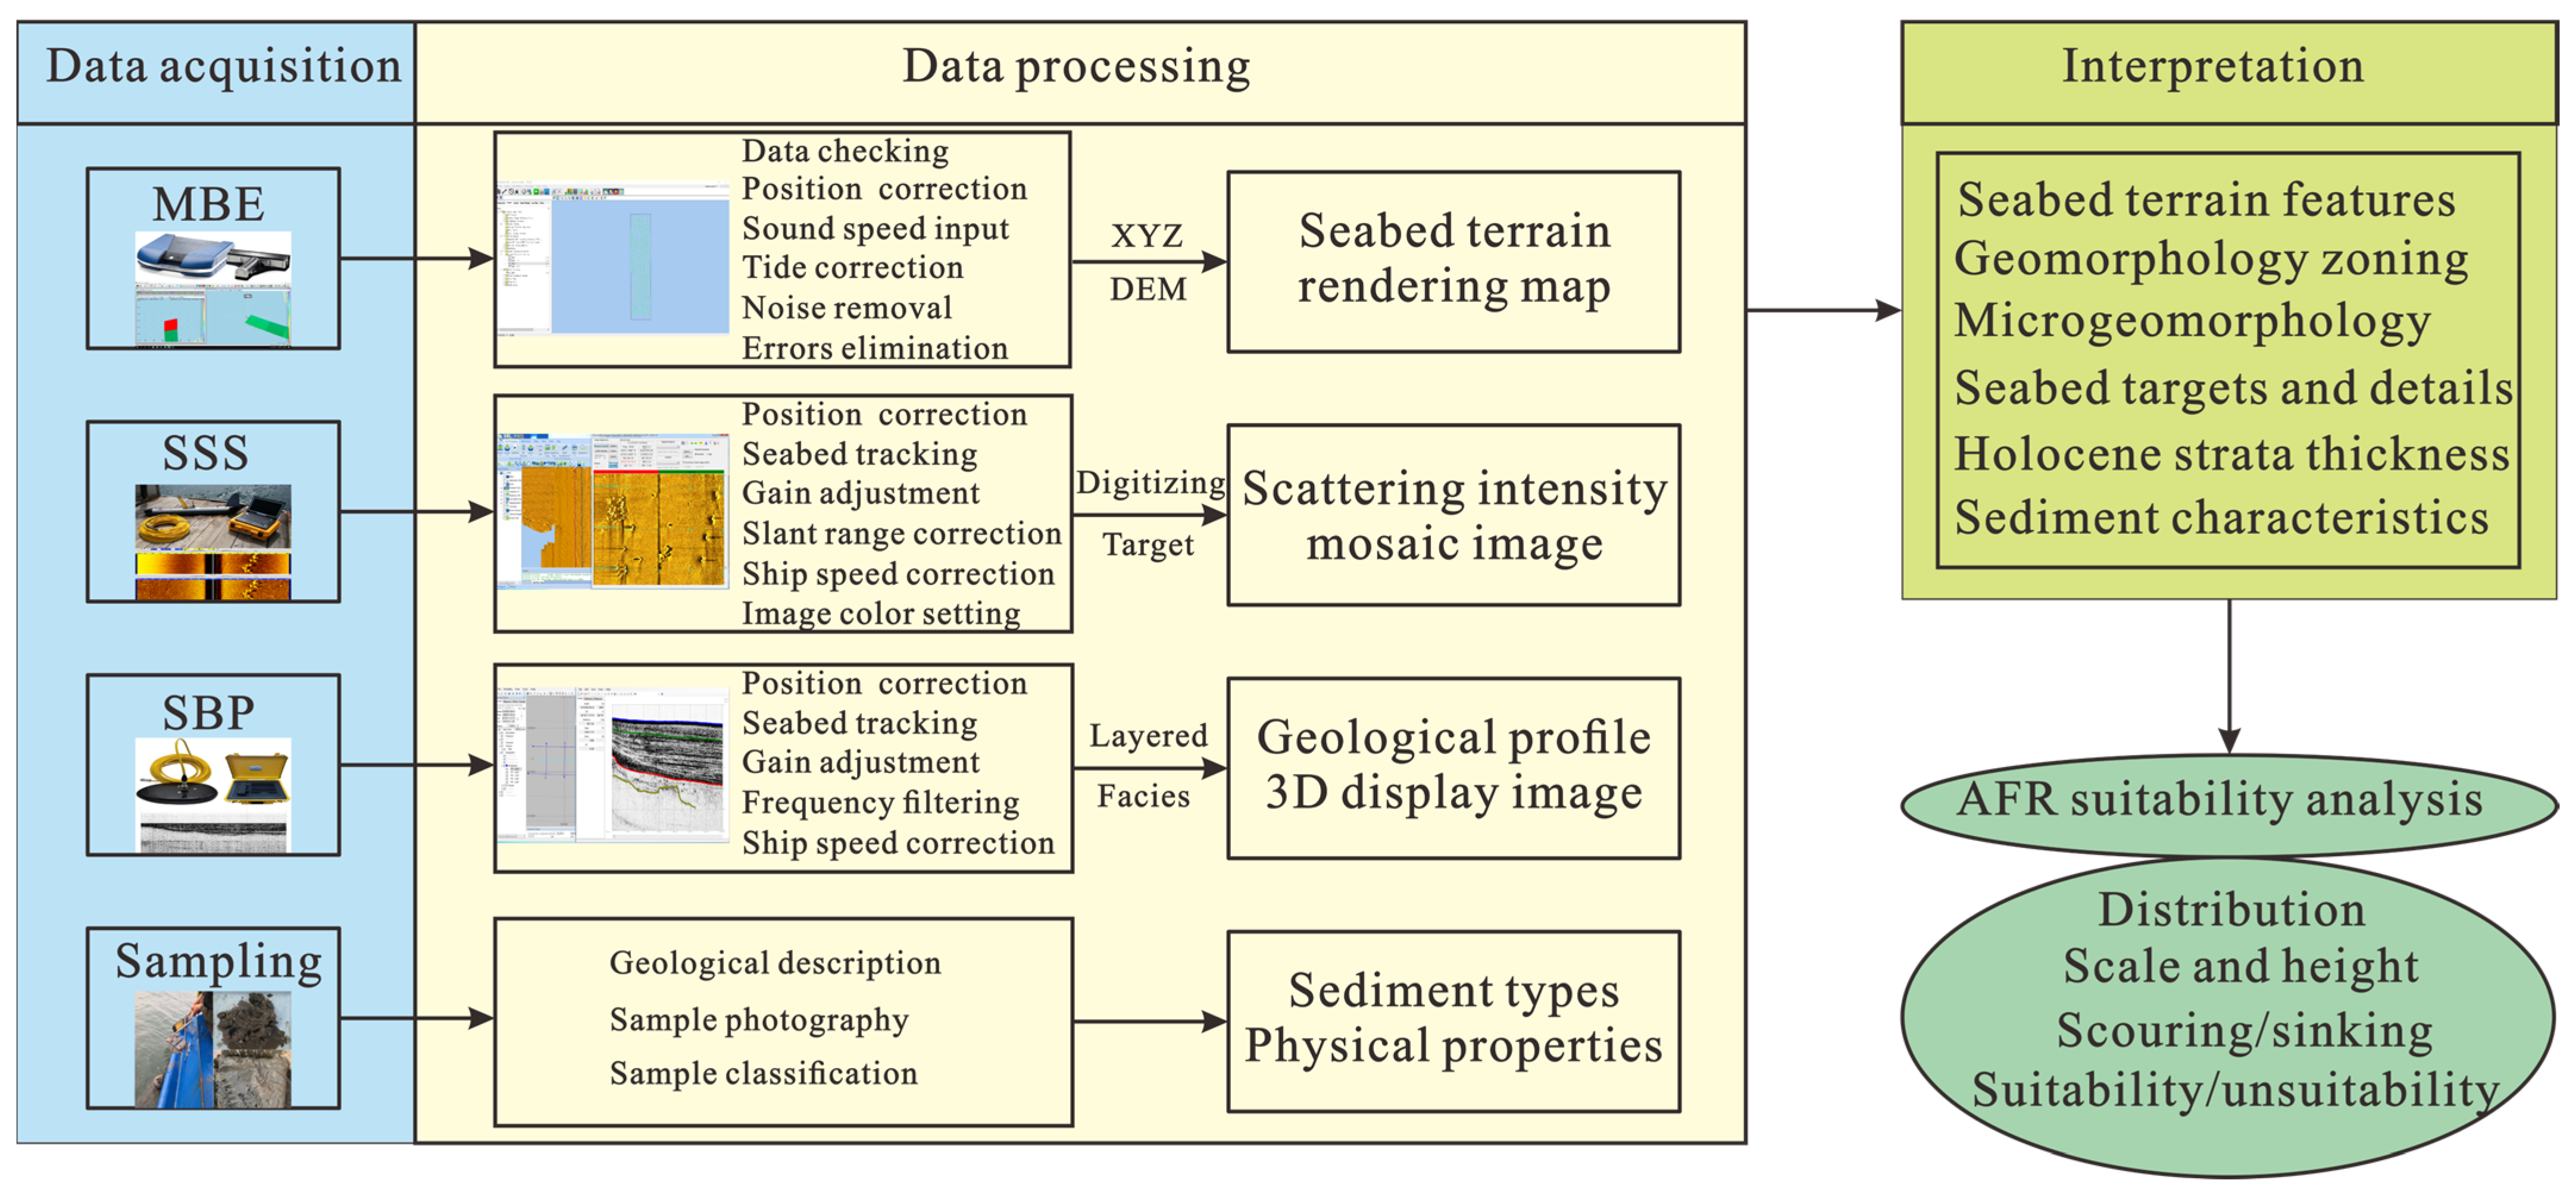
2.2. MBE Survey
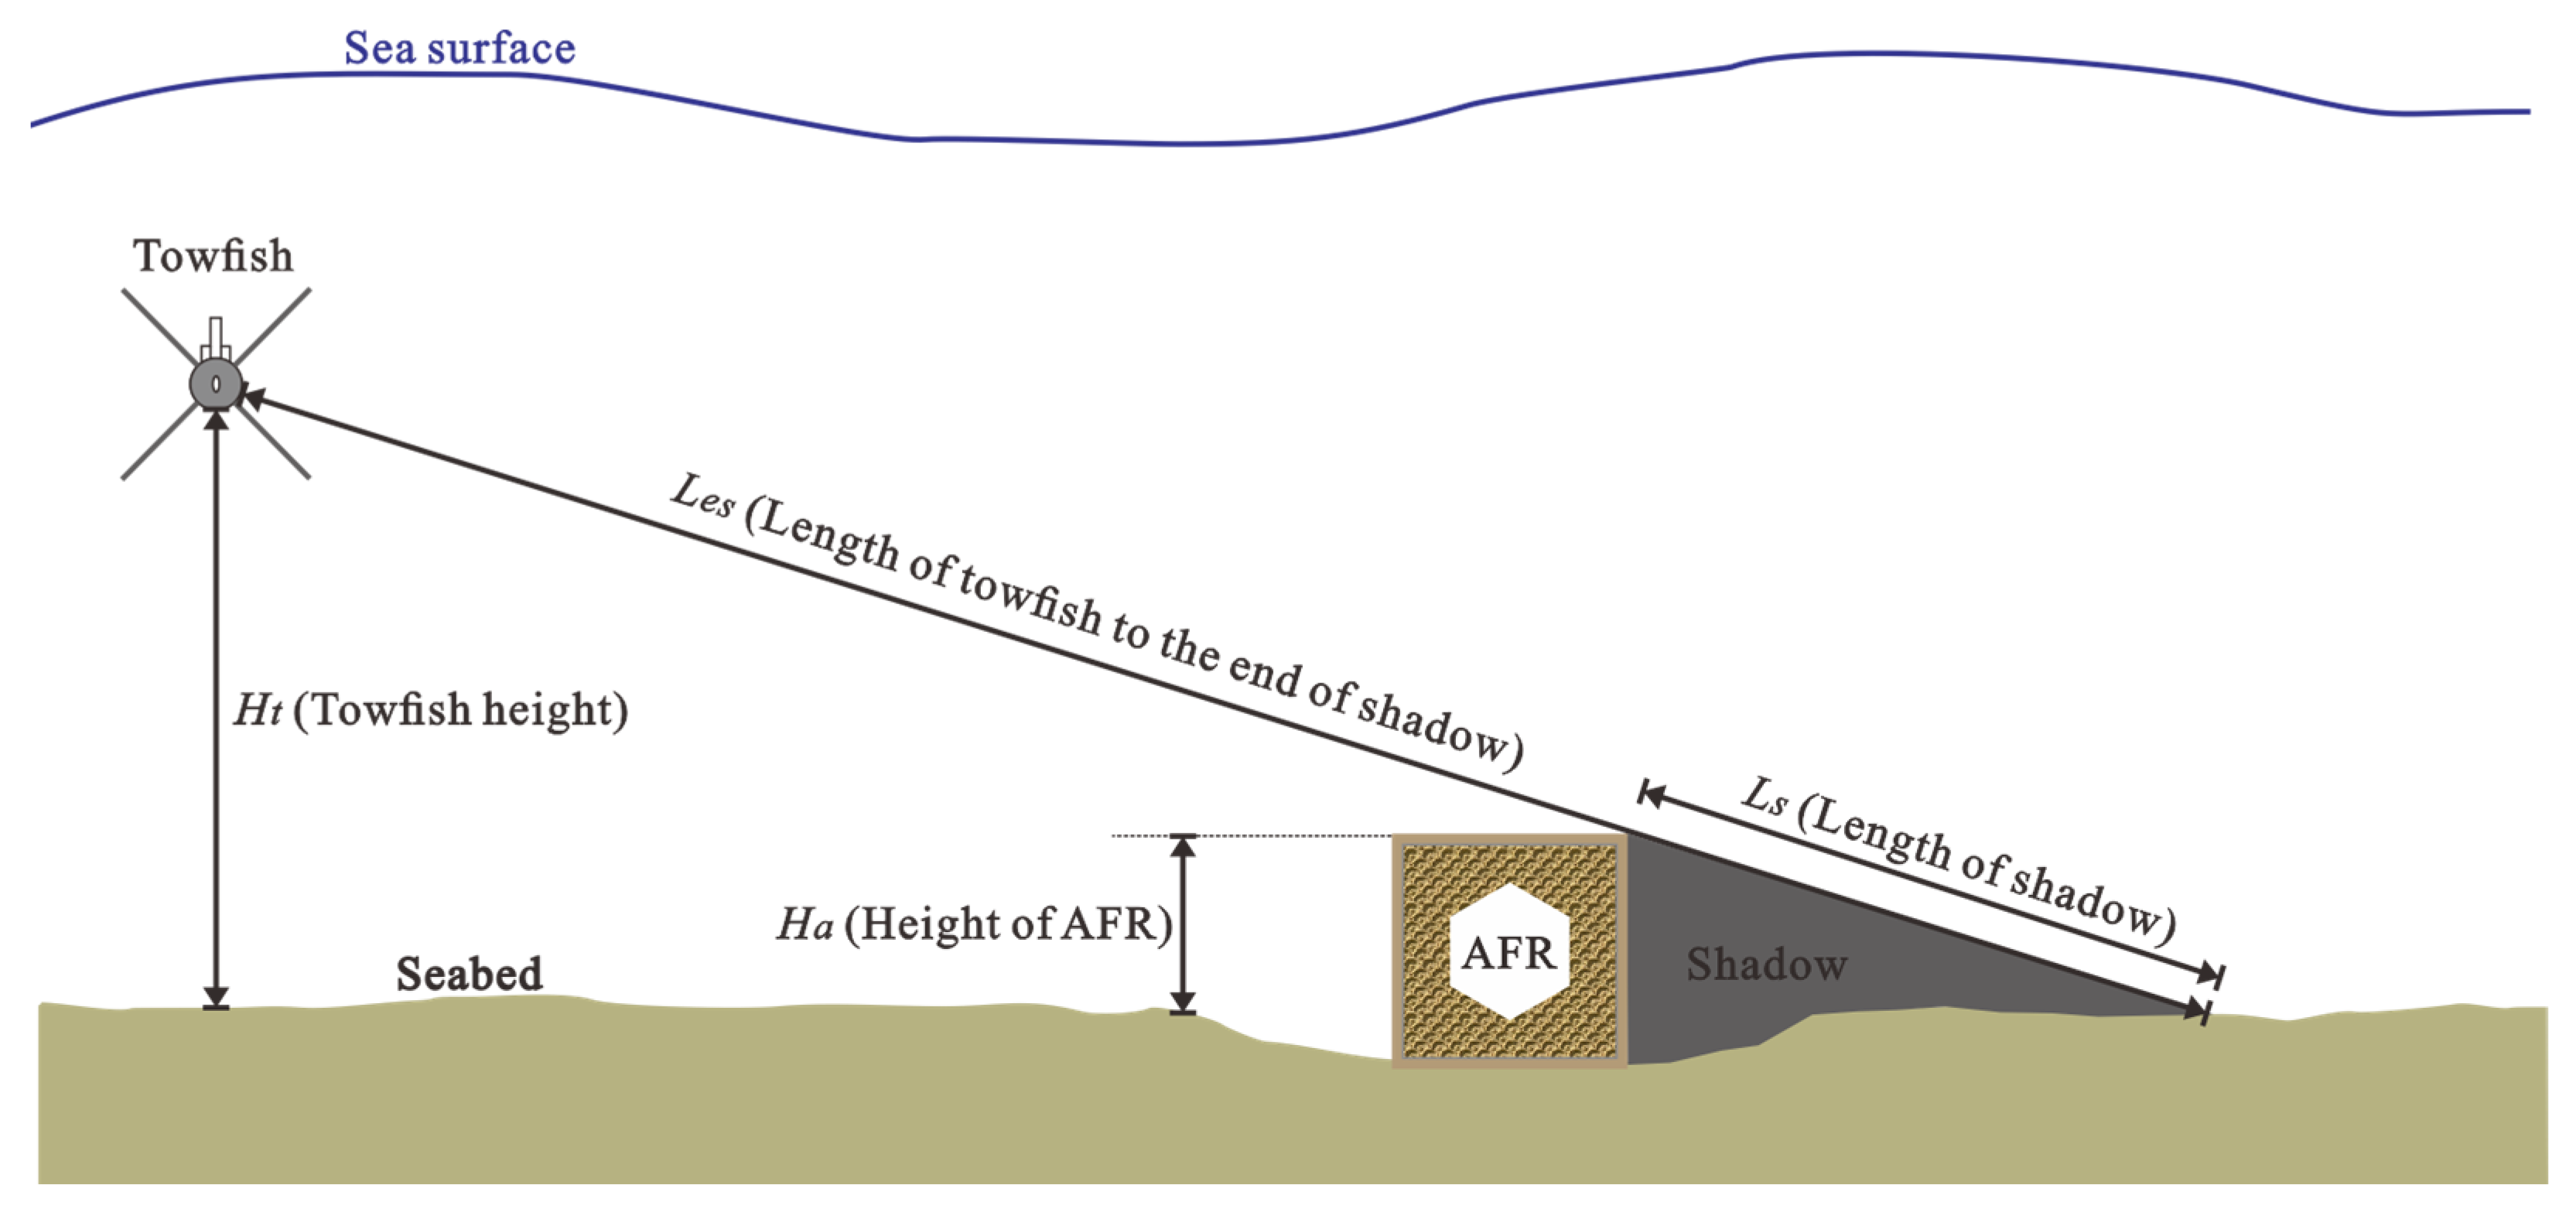
2.3. SSS Survey
2.4. SBP Survey
2.5. Sediment Survey
3. Results
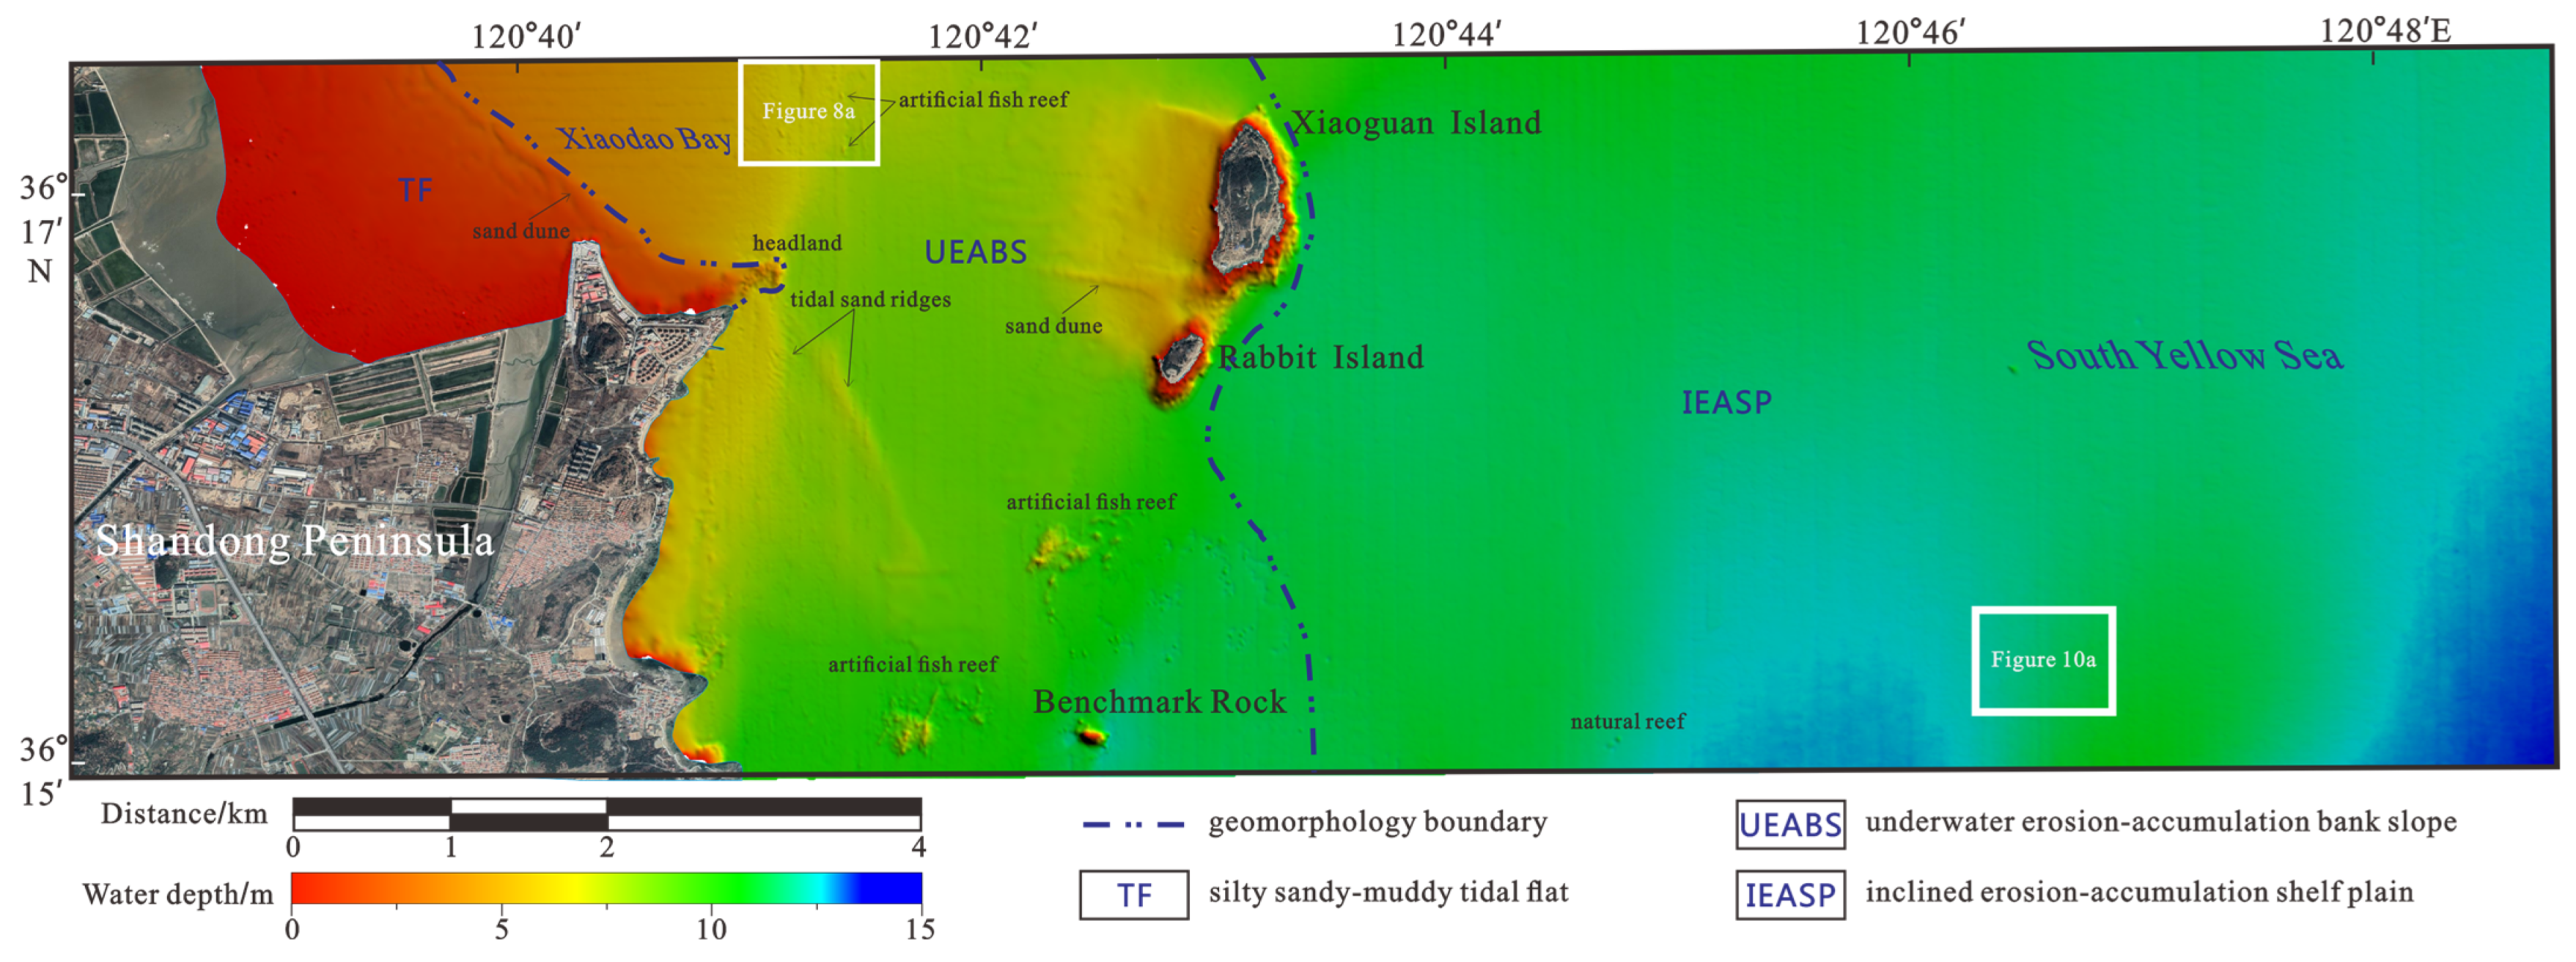
3.1. Geomorphology Types
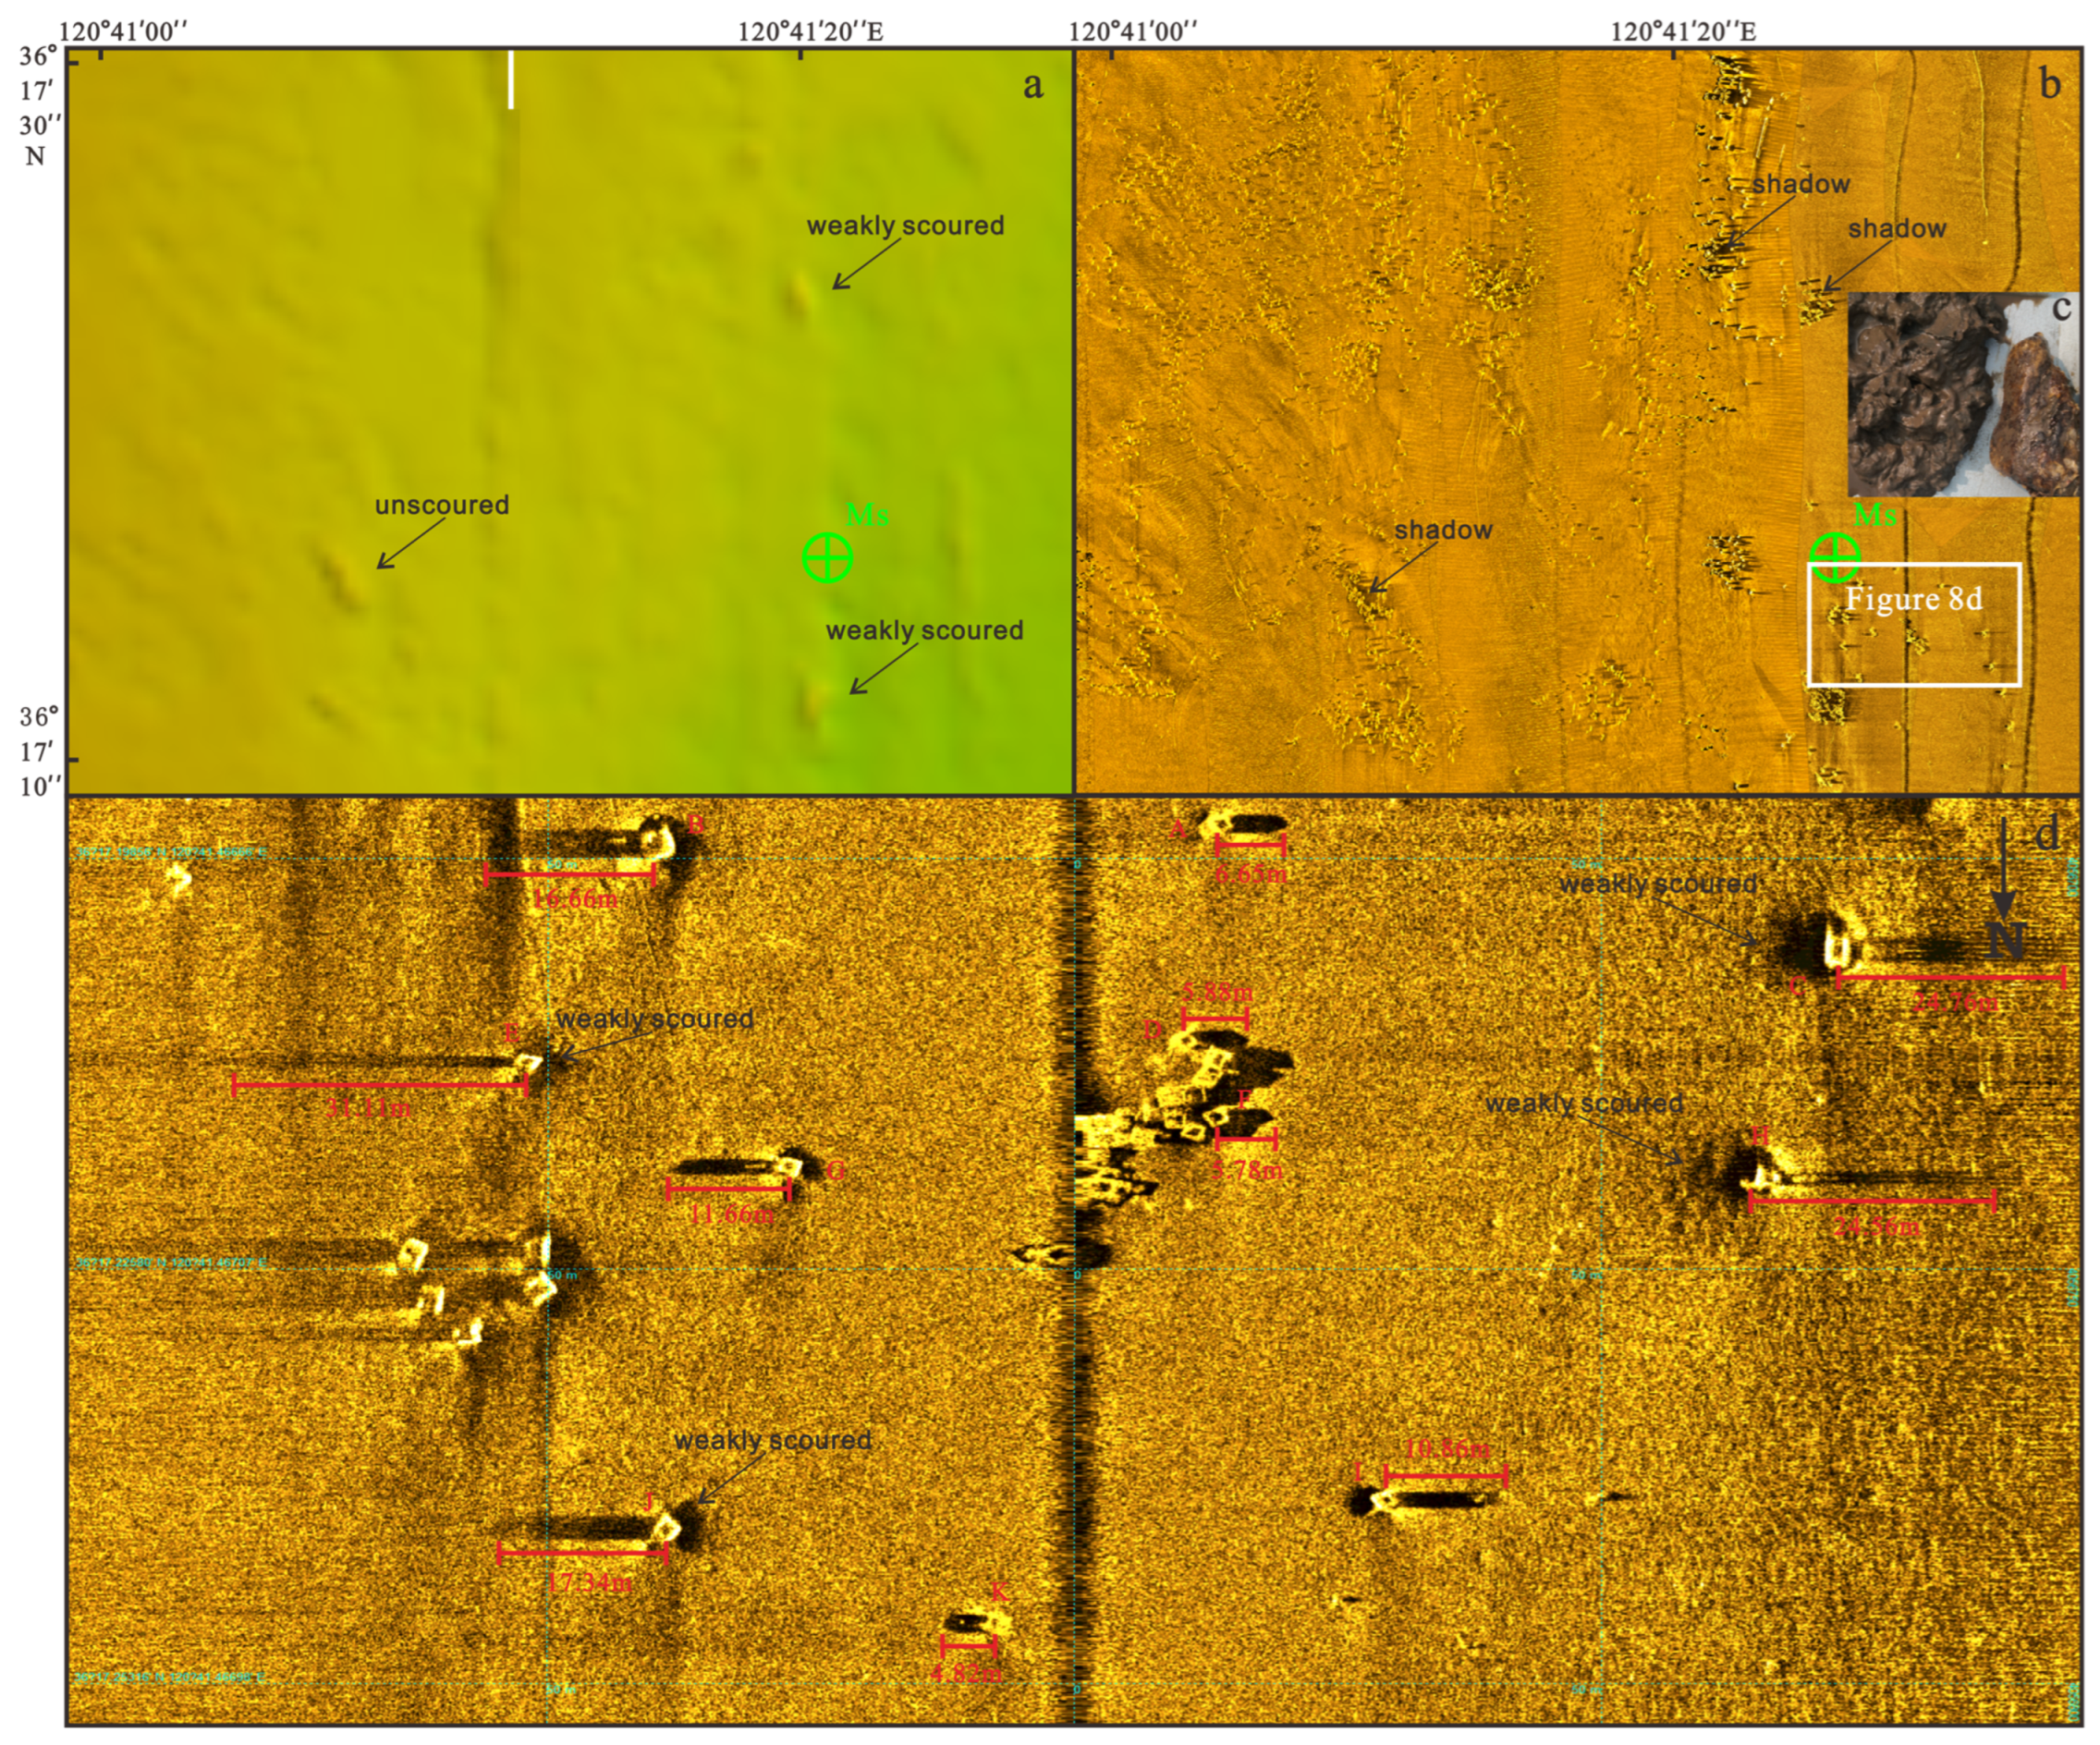
3.2. Microgeomorphology Features
3.3. Holocene Strata
4. Discussions
4.1. Data Accuracy and Limitation Analysis
4.1.1. Data Accuracy
4.1.2. Data Limitation
4.2. Suitability Evaluation of AFR Construction
4.2.1. UEABS Experimental Zone
4.2.2. IEASP Experimental Zone
5. Conclusions
Author Contributions
Funding
Institutional Review Board Statement
Informed Consent Statement
Data Availability Statement
Acknowledgments
Conflicts of Interest
References
- Liu, X.; Chen, Y.; Liu, C.; Tang, Q.; Wang, Y.; Gao, S. Detailed seafloor geomorphology of the western region of the North Yellow Sea, China: The result of Holocene erosional and depositional processes sculpting the offshore continental shelf. Acta Oceanol. Sin. 2022, 41, 38–47. [Google Scholar] [CrossRef]
- Budillon, F.; Firetto Carlino, M.; Innangi, S.; Passaro, S.; Tonielli, R.; Trincardi, F.; Sprovieri, M. The Anthropogenic Footprint of Physical Harm on the Seabed of Augusta Bay (Western Ionian Sea); A Geophysical Investigation. J. Mar. Sci. Eng. 2022, 10, 1737. [Google Scholar] [CrossRef]
- Leone, M.; Warren, J.D. Passive acoustic monitoring of artificial reefs south of Long Island, New York provides novel insights on fish, marine mammal, and post-pandemic human activity occurring in nearshore coastal habitats. J. Acoust. Soc. Am. 2023, 154, A215. [Google Scholar] [CrossRef]
- Grimes, C.E.; Morley, J.W.; Richie, D.N.; McMains, A.R. Fish abundance is enhanced within a network of artificial reefs in a large estuary. Front. Mar. Sci. 2024, 11, 1459277. [Google Scholar] [CrossRef]
- Paxton, A.B.; Steward, D.a.N.; Mille, K.J.; Renchen, J.; Harrison, Z.H.; Byrum, J.S.; Brinton, C.; Nelson, A.; Simpson, E.; Clarke, P.J. Artificial reef footprint in the United States ocean. Nat. Sustain. 2024, 7, 140–147. [Google Scholar] [CrossRef]
- Gardner, J.V.; Dartnell, P.; Mayer, L.A.; Clarke, J.E.H. Geomorphology, acoustic backscatter, and processes in Santa Monica Bay from multibeam mapping. Mar. Environ. Res. 2003, 56, 15–46. [Google Scholar] [CrossRef]
- Howe, J.A.; Anderton, R.; Arosio, R.; Dove, D. The seabed geomorphology and geological structure of the Firth of Lorn, western Scotland, UK, as revealed by multibeam echo-sounder survey. Earth Environ. Sci. Trans. R. Soc. Edinb. 2015, 105, 273–284. [Google Scholar] [CrossRef]
- Wille, P.C. Sound Images of the Ocean in Research and Monitoring; Springer: Berlin/Heidelberg, Germany, 2005; p. 504. [Google Scholar]
- Marshall, N.; Norall, T.; Grove, R.S.; Elwany, M.H.S. Artificial reef site selection: Geophysical surveys for San Clemente Kelp reef. In Proceedings of the Oceans 2003, San Diego, CA, USA, 22–26 September 2003; pp. 793–803. [Google Scholar] [CrossRef]
- Katrasov, S.V.; Bugaets, A.N.; Zharikov, V.V.; Ganzei, K.S.; Gonchukova, L.V. Site selection for marine aquaculture using hydrodynamic simulation. Oceanology 2021, 61, 380–389. [Google Scholar] [CrossRef]
- Ali, A.; Abdullah, M.R.; Safuan, C.D.M.; Afiq-Firdaus, A.M.; Bachok, Z.; Akhir, M.F.M.; Latif, R.; Muhamad, A.; Seng, T.H.; Roslee, A.; et al. Side-Scan Sonar Coupled with Scuba Diving Observation for Enhanced Monitoring of Benthic Artificial Reefs along the Coast of Terengganu, Peninsular Malaysia. J. Mar. Sci. Eng. 2022, 10, 1309. [Google Scholar] [CrossRef]
- Zeng, L.; Tang, Z.; Chen, P.; Hou, C.; Chen, G. Bioacoustic application on fisheries management in an artificial reefs’ ecological reserve of Bohai Gulf China. Environ. Earth. Sci. 2018, 77, 728. [Google Scholar] [CrossRef]
- Baine, M. Artificial reefs: A review of their design, application, management and performance. Ocean. Coast. Manag. 2001, 44, 241–259. [Google Scholar] [CrossRef]
- Kang, M.; Nakamura, T.; Hamano, A. A methodology for acoustic and geospatial analysis of diverse artificial-reef datasets. ICES J. Mar. Sci. 2011, 68, 2210–2221. [Google Scholar] [CrossRef]
- Nguyen, T.-N.; Yun, D.-H.; Kim, Y.-T. Measurement and prediction of scour volume around a cubic artificial reef under steady flow conditions using stereo vision. Ocean Eng. 2024, 313, 119635. [Google Scholar] [CrossRef]
- Trembanis, A.; Abla, A.; Haulsee, K.; DuVal, C. Benthic habitat Morphodynamics-using remote sensing to quantify storm-induced changes in Nearshore bathymetry and surface sediment texture at Assateague National Seashore. J. Mar. Sci. Eng. 2019, 7, 371. [Google Scholar] [CrossRef]
- Sibley, E.C.; Madgett, A.S.; Lawrence, J.; Elsdon, T.S.; Marnane, M.J.; Fernandes, P.G. Quantifying the ability of imaging sonar to identify fish species at a subtropical artificial reef. ICES J. Mar. Sci. 2024, 81, 1478–1490. [Google Scholar] [CrossRef]
- Bao, H.; Nikolaeva, A.; Xia, J.; Ma, F. Evolution Trends and Future Prospects in Artificial Marine Reef Research: A 28-Year Bibliometric Analysis. Sustainability 2025, 17, 184. [Google Scholar] [CrossRef]
- Tsai, C.-C.; Lin, C.-H. Review and future perspective of geophysical methods applied in nearshore site characterization. J. Mar. Sci. Eng. 2022, 10, 344. [Google Scholar] [CrossRef]
- Manley, P.L.; Singer, J.K. Assessment of sedimentation processes determined from side-scan sonar surveys in the Buffalo River, New York, USA. Environ. Geol. 2007, 55, 1587–1599. [Google Scholar] [CrossRef]
- Septama, E.; Samuel, B.S. Late Quaternary geomorphology, seabed evolution, and terrigenous sediment delivery to the Pandora and Moresby Troughs, Gulf of Papua. Mar. Geol. 2016, 379, 208–223. [Google Scholar] [CrossRef]
- Siddique, M.F.; Ahmad, Z.; Kim, J.M. Pipeline leak diagnosis based on leak-augmented scalograms and deep learning. Eng. Appl. Comp. Fluid. 2023, 17, 2225577. [Google Scholar] [CrossRef]
- Hughes Clarke, J.E. Multibeam Echosounders. In Submarine Geomorphology; Micallef, A., Krastel, S., Savini, A., Eds.; Springer International Publishing: Cham, Switzerland, 2018; pp. 25–41. [Google Scholar] [CrossRef]
- Klaucke, I. Sidescan Sonar. In Submarine Geomorphology; Micallef, A., Krastel, S., Savini, A., Eds.; Springer International Publishing: Cham, Switzerland, 2018; pp. 13–24. [Google Scholar] [CrossRef]
- Wang, F.; Dong, L.; Ding, J.; Zhou, X.; Tao, C.; Lin, X.; Liang, G. An Experiment of the Actual Vertical Resolution of the Sub-bottom Profiler in an Anechoic Tank. Arch. Acoust. 2019, 44, 185–194. [Google Scholar] [CrossRef]
- Thébaudeau, B.; Monteys, X.; McCarron, S.; O’Toole, R.; Caloca, S. Seabed geomorphology of the Porcupine Bank, West of Ireland. J. Maps. 2016, 12, 947–958. [Google Scholar] [CrossRef]
- Qin, Y.; Zhao, Y.; Chen, L.; Zhao, S. Geology of the Yellow Sea; China Ocean Press: Beijing, China, 1989. [Google Scholar]
- Kong, X.; Lu, K.; Xu, X.; Yang, H.; Zhang, Y.; Shang, L. A study on the characteristics and its cause of topography and geomorphology of the South Yellow Sea. Mar. Geol. Quat. Geol. 2022, 42, 21–31. [Google Scholar] [CrossRef]
- Grelowska, G.; Kozaczka, E. Underwater Acoustic Imaging of the Sea. Arch. Acoust. 2014, 39, 439–452. [Google Scholar] [CrossRef]
- Schrottke, K.; Becker, M.; Bartholomä, A.; Flemming, B.W.; Hebbeln, D. Fluid mud dynamics in the Weser estuary turbidity zone tracked by high-resolution side-scan sonar and parametric sub-bottom profiler. Geo-Mar. Lett. 2006, 26, 185–198. [Google Scholar] [CrossRef]
- Kozaczka, E.; Grelowska, G.; Kozaczka, S.; Szymczak, W. Detection of objects buried in the sea bottom with the use of parametric echosounder. Arch. Acoust. 2013, 38, 99–104. [Google Scholar] [CrossRef]
- Li, B.; Zhuang, Z.; Cao, L.; Du, F. Application of the Static Headland-Bay Beach Concept to a Sandy Beach: A New Elliptical Model. J. Ocean. Univ. China 2020, 19, 81–89. [Google Scholar] [CrossRef]
- Leont’Yev, I.O. On the mechanisms generating nearshore bars on a sandy coastal slope. Oceanology 2023, 63, 467–474. [Google Scholar] [CrossRef]
- Lucchetti, A.; Sala, A. Impact and performance of Mediterranean fishing gear by side-scan sonar technology. Can. J. Fish. Aquat. Sci. 2012, 69, 1806–1816. [Google Scholar] [CrossRef]
- Hurst, S.D. Side-scan sonar along the north wall of the Hess Deep Rift: Processing, texture analysis, and geologic ground truth on an oceanic escarpment. J. Geophys. Res. Solid Earth 2004, 109, B02107. [Google Scholar] [CrossRef]
- Barrie, J.V.; Hill, P.R.; Conway, K.W.; Iwanoska, K.; Picard, K. Environmental marine geoscience 4: Georgia basin: Seabed features and marine geohazards. Geosci. Can. 2005, 32, 145–156. [Google Scholar] [CrossRef]
- Li, B.; Jia, Y.; Liu, J.P.; Su, J.; Liu, X.; Wen, M. The controlling factors of high suspended sediment concentration in the intertidal flat off the Huanghe River Estuary. Acta Oceanol. Sin. 2020, 39, 100–110. [Google Scholar] [CrossRef]
- Ambrose, R.F. Mitigating the effects of a coastal power plant on a kelp forest community: Rationale and requirements for an artificial reef. Bull. Mar. Sci. 1994, 55, 694–708. [Google Scholar]


| No. | Ht (m) | Ls (m) | Les (m) | Ha (m) | ∆Ha (m) |
|---|---|---|---|---|---|
| A | 4.9 | 6.65 | 19.94 | 1.63 | 0.37 |
| B | 5.0 | 16.66 | 56.34 | 1.48 | 0.52 |
| C | 4.8 | 24.76 | 97.57 | 1.22 | 0.78 |
| D | 4.7 | 5.88 | 16.29 | 1.70 | 0.30 |
| E | 4.7 | 31.11 | 83.02 | 1.76 | 0.24 |
| F | 4.9 | 5.78 | 19.07 | 1.49 | 0.51 |
| G | 4.9 | 11.66 | 38.82 | 1.47 | 0.53 |
| H | 4.9 | 24.56 | 90.43 | 1.33 | 0.67 |
| I | 4.6 | 10.86 | 40.08 | 1.25 | 0.75 |
| J | 4.7 | 17.34 | 56.15 | 1.45 | 0.55 |
| K | 4.7 | 4.82 | 12.24 | 1.85 | 0.15 |
Disclaimer/Publisher’s Note: The statements, opinions and data contained in all publications are solely those of the individual author(s) and contributor(s) and not of MDPI and/or the editor(s). MDPI and/or the editor(s) disclaim responsibility for any injury to people or property resulting from any ideas, methods, instructions or products referred to in the content. |
© 2025 by the authors. Licensee MDPI, Basel, Switzerland. This article is an open access article distributed under the terms and conditions of the Creative Commons Attribution (CC BY) license (https://creativecommons.org/licenses/by/4.0/).
Share and Cite
Wang, F.; Feng, Y.; Liu, S.; Chen, Y.; Ding, J. Artificial Fish Reef Site Evaluation Based on Multi-Source High-Resolution Acoustic Images. J. Mar. Sci. Eng. 2025, 13, 309. https://doi.org/10.3390/jmse13020309
Wang F, Feng Y, Liu S, Chen Y, Ding J. Artificial Fish Reef Site Evaluation Based on Multi-Source High-Resolution Acoustic Images. Journal of Marine Science and Engineering. 2025; 13(2):309. https://doi.org/10.3390/jmse13020309
Chicago/Turabian StyleWang, Fangqi, Yikai Feng, Senbo Liu, Yilan Chen, and Jisheng Ding. 2025. "Artificial Fish Reef Site Evaluation Based on Multi-Source High-Resolution Acoustic Images" Journal of Marine Science and Engineering 13, no. 2: 309. https://doi.org/10.3390/jmse13020309
APA StyleWang, F., Feng, Y., Liu, S., Chen, Y., & Ding, J. (2025). Artificial Fish Reef Site Evaluation Based on Multi-Source High-Resolution Acoustic Images. Journal of Marine Science and Engineering, 13(2), 309. https://doi.org/10.3390/jmse13020309