Article

A Numerical Study for the Self-Propulsion Performance of a Propulsion System Using the Coanda Effect

1
Department of Naval Architecture and Ocean Engineering, Inha University, Incheon 22201, Republic of Korea
2
Department of Naval Architecture and Ocean Engineering, Hongik University, Sejong 30016, Republic of Korea
*
Author to whom correspondence should be addressed.
J. Mar. Sci. Eng. 2025, 13(3), 437; https://doi.org/10.3390/jmse13030437
Submission received: 11 February 2025 / Revised: 17 February 2025 / Accepted: 24 February 2025 / Published: 25 February 2025
(This article belongs to the Special Issue Novelties in Marine Propulsion)

Abstract

:
This study evaluated the performance of a ship propeller numerically using the Coanda effect. The simulations applied a model based on a 6.5K DWT tanker and conducted self-propulsion assessments for three types of propellers: the original propeller, a normal propeller, and a Coanda propeller. The numerical simulations used the unsteady Reynolds-averaged Navier–Stokes (URANS) equations, incorporating the SST k–ω turbulence model. The influence of the additional thrust generated by the Coanda effect on the hull resistance and self-propulsion factors was analyzed. The key findings showed that the Coanda-based propeller achieved efficient propulsion performance by generating additional lift even at low rotational speeds. A self-propulsion analysis showed that the Coanda propeller required approximately 7.8% less delivered power than the original propeller. These results suggest that propulsion systems utilizing the Coanda effect offer superior efficiency and economic advantages over traditional technologies. This study provides critical baseline data for assessing the feasibility of a Coanda propeller, with further validation planned through full-scale ship simulations.

1. Introduction

With the recent tightening of environmental regulations by the International Maritime Organization (IMO) and the European Union (EU), there has been an urgent need for technological solutions to improve energy efficiency and reduce carbon emissions in shipping. Regulations such as the energy efficiency existing ship index (EEXI) and carbon intensity indicator (CII) introduced by the IMO are driving the development of various technologies to reduce fuel consumption and improve the efficiency of existing ships. The EU aims to accelerate the decarbonization of the maritime sector by implementing the ‘Fuel EU Maritime’ regulation starting in 2025. These regulations necessitate technological innovation to reduce fuel consumption and enhance energy efficiency, promoting new technologies across ship design and operations [1]. The Fuel EU Maritime regulation provides a foundational assessment of greenhouse gas reduction strategies and the economic feasibility of fuel transition in the shipping industry [2].
Traditional ship propulsion systems have undergone extensive development and optimization over a long period. Considerable research has focused on integrating additional devices, such as energy-saving devices (ESDs) [3,4,5], propeller boss cap fins (PBCFs) [6,7,8], and rudder bulbs, to reduce fuel consumption and enhance propulsion performance.
Su et al. [3] investigated an ESD consisting of a pre-swirl stator and a rudder bulb through experimental and numerical analyses on a cargo ship. They reported that the ESD positively influenced the propulsion performance by enhancing the interactions between the hull, rudder, propeller, and ESD. Improvements in the wake flow and homogenization of hub vortices were observed, highlighting the ability to improve the propulsion performance while maintaining stable operating conditions. Gaggero [6] used computational fluid dynamics (CFD) to improve the design of the propeller boss cap fin (PBCF) device. They showed that the improvements in efficiency were due primarily to the reduced hub vortex strength, minimization of net torque, and the effect of additional fins on the blade performance.
The limitations of existing technologies, including the limited applicability, design and installation complexity, and physical efficiency constraints, require adopting new design concepts and innovative technologies. This paper proposes a ship propulsion system utilizing the Coanda effect to solve these challenges. The Coanda effect, a phenomenon that leverages the behavior of a fluid flowing along a curved surface to control flow, has been proven effective across various industries, including the aerospace industry.
Xu et al. [9] investigated the application of the steady Coanda effect to reduce the aerodynamic drag of a ship using Large Eddy Simulation (LES). This study demonstrated that Coanda jet injection could effectively control the wake flow, resulting in drag reduction and improved energy efficiency.
Pfingsten and Radespiel [10] investigated jet blowing at the flap to delay the onset of wing stall and enhance lift performance. They also examined the changes in pressure distribution caused by variations in the jet injection rates and angles of attack, providing insights into the influence of jet flow on the aerodynamic behavior of the wing. Burnazzi et al. [11] conducted numerical simulations of a high-lift airfoil equipped with a Coanda flap to compare the lift and pressure based on the design parameters. They explored the effects of variations in the camber, thickness, droop nose, and jet momentum coefficients to identify the parameters effective for significant lift generation and stall delays in aerodynamic performance. Lee et al. [12] reported a novel type of unmanned aerial vehicle (UAV) using the Coanda effect for lift. Optimized surface geometries were designed by analyzing the flow around the body through experiments and simulations to maximize lift. The Coanda effect significantly reduced energy consumption compared to a conventional multicopter.
Jun et al. [13] examined how the Coanda effect affects the turning performance of a ship by applying it to the rudder. The effects of the rudder angle and jet momentum coefficient on the turning performance of a rudder using the Coanda effect were analyzed using model tests. The results revealed a tendency for advanced distance and turning diameter to decrease as the rudder angle and jet momentum coefficient increased. Furthermore, the turning performance of the rudder was most effective at specific coefficient values. Maltsev et al. [14] designed a hydrofoil capable of jet injection and conducted model experiments in a cavitation tunnel, confirming that the lift increased as the jet injection volume increased, achieving an up to threefold increase in lift. Their findings suggested the potential application of this technology to rudders. Furthermore, jet injection experiments with a rotor attached to the leading edge of the hydrofoil [15] and numerical analyses [16] showed that the rotation of the rotor enhanced the circulation flow of the jet, increasing the lift generated by the hydrofoil. In addition, previous studies confirmed that jet injections control cavitation and enhance hydrofoil lift [17,18,19,20].
Furthermore, a ship propulsion system using the Coanda effect was developed by initially implementing the concept on a two-dimensional hydrofoil that was subsequently extended to a three-dimensional propeller configuration for performance evaluation.
Eom et al. [21,22] aimed to improve the performance of hydrofoils by implementing jet injection based on the NACA0012. They confirmed that the lift increased at the same angle of attack because of the Coanda effect induced by jet injection. In addition, using a newly developed cross-sectional geometry, the effects of the slit height, tip height, and slit position on the performance of jet-injected hydrofoils were analyzed using model experiments and simulations. Lee et al. [23] extended the present study by designing a three-dimensional jet-injected propeller. They validated a numerical scheme using model tests and simulations and reported that additional thrust was generated due to the Coanda effect. In addition, torque was reduced, and propeller efficiency increased by approximately 8.7%. Lee et al. [24] focused on optimizing the slit geometry for jet injection using numerical simulations. The parameters defining the slit geometry (hydrofoil geometry, cover length, slit position, and slit height) and jet injection patterns (slit-tunnel area ratio and slit type) were defined. Performance analyses of thrust, torque, and efficiency across these parameters showed that the optimized slit geometry achieved approximately 10.8% and 2% efficiency improvement compared to the conventional propeller and initial model, respectively. In addition, a significant reduction in pressure drop regions was achieved compared to the initial design. Previous studies evaluated the performance under uniform flow conditions, which failed to capture the non-uniform wake (i.e., effective wake) flow characteristics generated behind the stern. Since ship propellers operate within these intricate wake environments, performance evaluations must consider such wake effects to ensure realistic propulsion efficiency assessments.
The performance evaluations must consider such wake effects to ensure realistic propulsion efficiency assessments. This study assessed the feasibility of a new ship propulsion system by applying a Coanda effect-based propeller to ship propulsion. The required power, propulsion efficiency, and potential of the Coanda propeller were evaluated and compared with those of the original propeller, providing insights into its practical implementation in future ship propulsion systems.

2. Numerical Set-Up

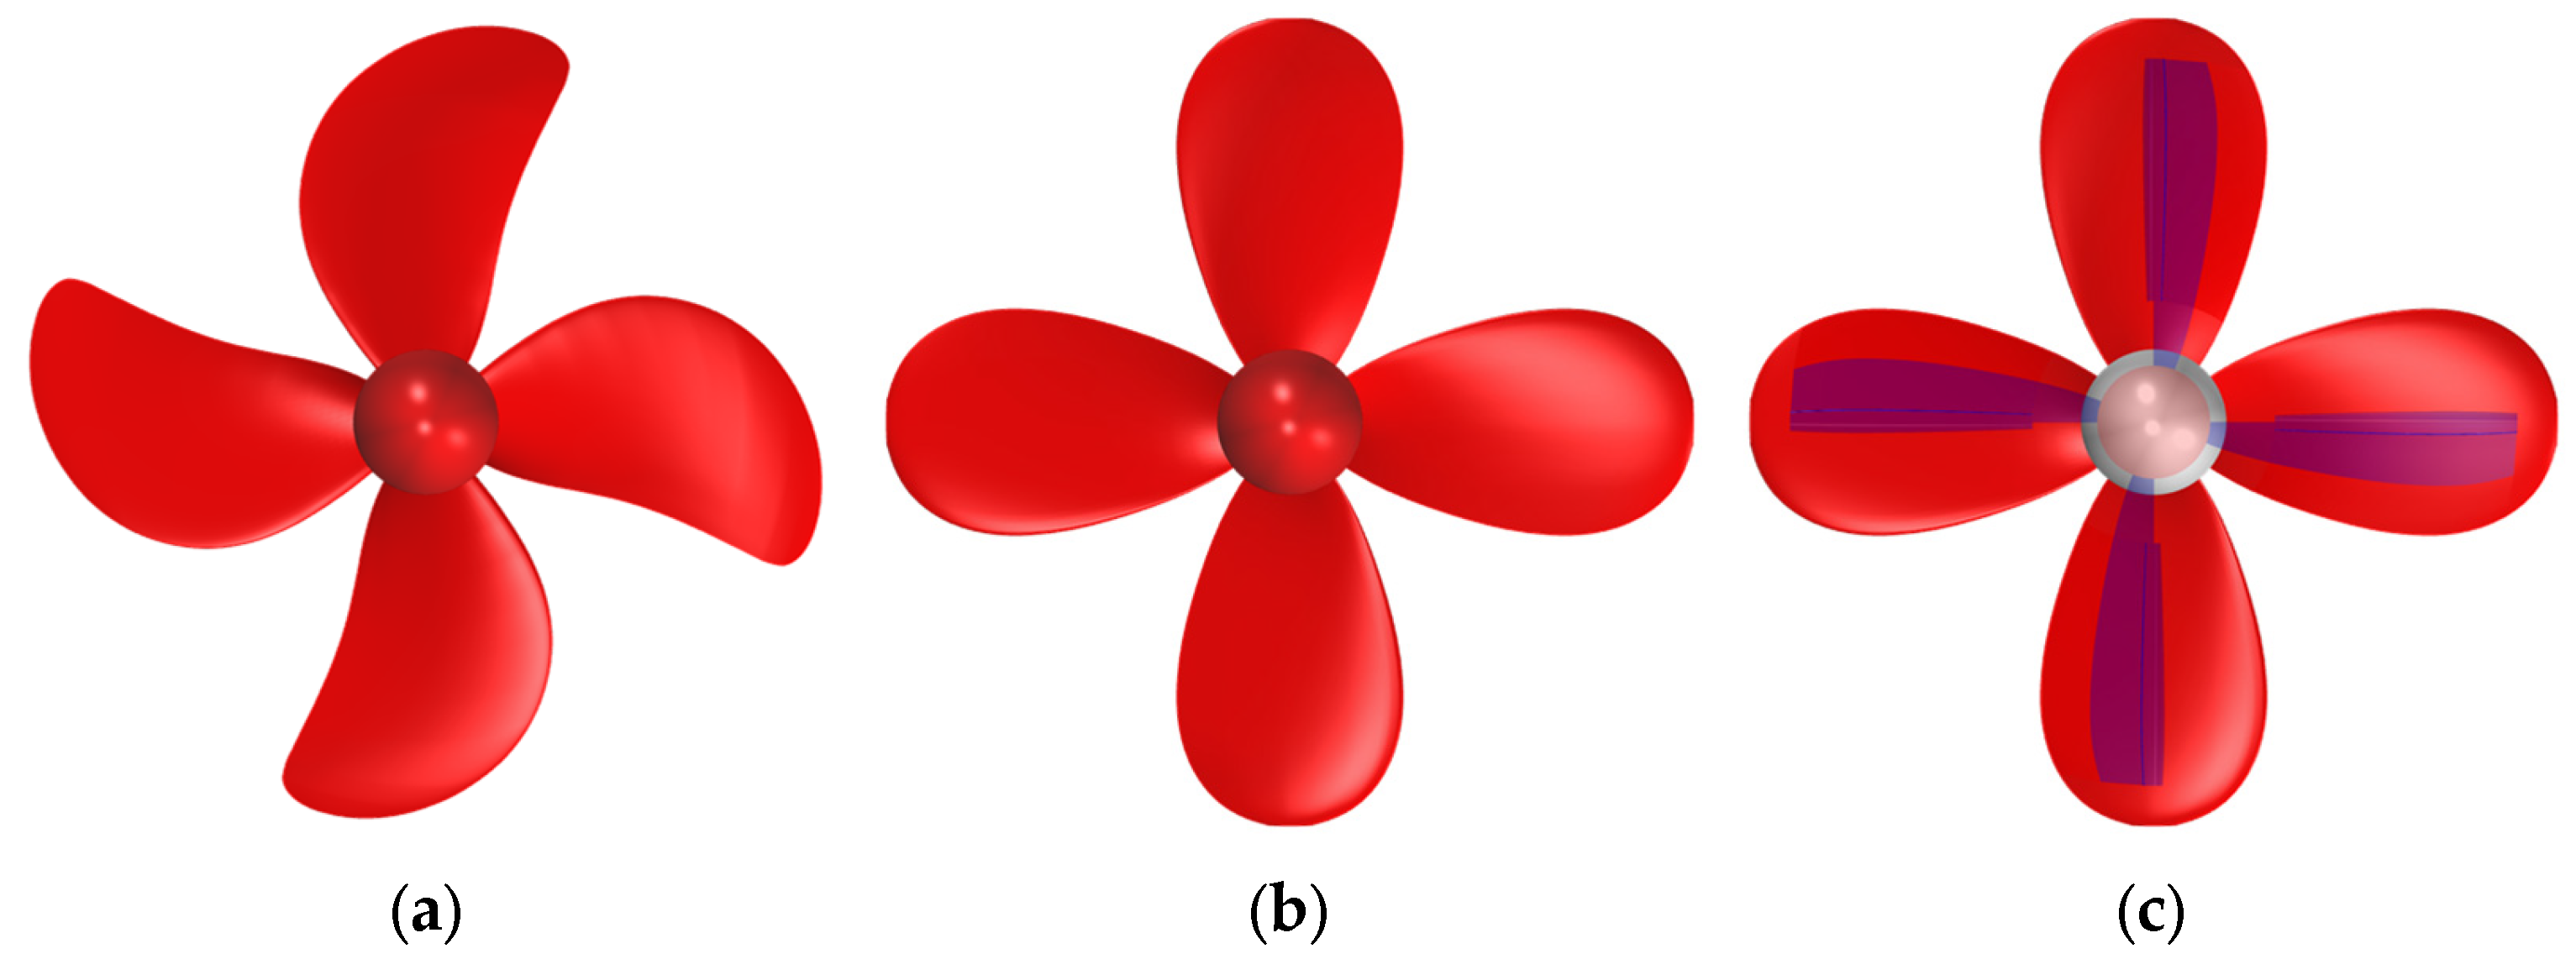
2.1. Geometries of Target Ship and Propellers

A 6.5K DWT tanker ship was used as the target ship, as shown in Figure 1. A scale ratio of 20 was used. Table 1 lists the main specifications. The length between perpendiculars (LPP) was 102 m, and the draft in design condition was 6.65 m. The target speed was 13.5 knots. The ship included a rudder bulb and flow control fin as energy-saving devices.
The target propeller was a KP1364 propeller with skew and rake, as listed in Table 2. The practicality of marine propellers utilizing the Coanda effect was investigated by applying a nozzle shape based on the geometric characteristics of the original propeller. Figure 2 shows the geometry of the propeller designed using the initial design. The initial design used a NACA 66-412 blade cross-section (Figure 3), maintaining the pitch and chord ratios of the original propeller design but developed without incorporating skew and rake. The KP1364 propeller of the target ship is referred to as the original propeller, which was used in the validation and verification study for the open-water test. The propeller without a nozzle slit is defined as the normal propeller, while the propeller with an applied nozzle slit is defined as the Coanda propeller.

2.2. Governing Equations

The simulations were carried out using version 16.06 of STAR-CCM+. The governing equations were based on the unsteady Reynolds averaged Navier–Stokes (URANS) equations to describe the flow field.
u - i x - i = 0
u - i t + u - j u - i x - j = 1 ρ p - x - j + 1 ρ 2 x - j μ u - i x - j ρ u i u j ¯
where ρ, ν, p, xi (x, y, z), and ui (u, v, w) represent the fluid density, kinematic coefficient, pressure, and the coordinates and the fluid velocity components in the direction of each coordinate axis, respectively.

2.3. Numerical Scheme

The volume of fluid (VOF) method was adopted to track the interface between the air and water phases. The shear stress transport (SST) k–ω method [25] was used for the turbulence model. All y+ treatments were used for the boundary layer. The SIMPLE algorithm was used for pressure–velocity coupling and second-order time implicit scheme to reach convergence for a given physical time. In the analysis, the under-relaxation factors of velocity and pressure of 0.6 and 0.4, respectively, were used.
The free motion of dynamic fluid–body interaction (DFBI) model was used to implement the ship motion. The simulation considered the 2DOF (free heave and pitch), and the overset mesh was used owing to ship motion. The sliding mesh was used in all simulations to model the actual propeller.

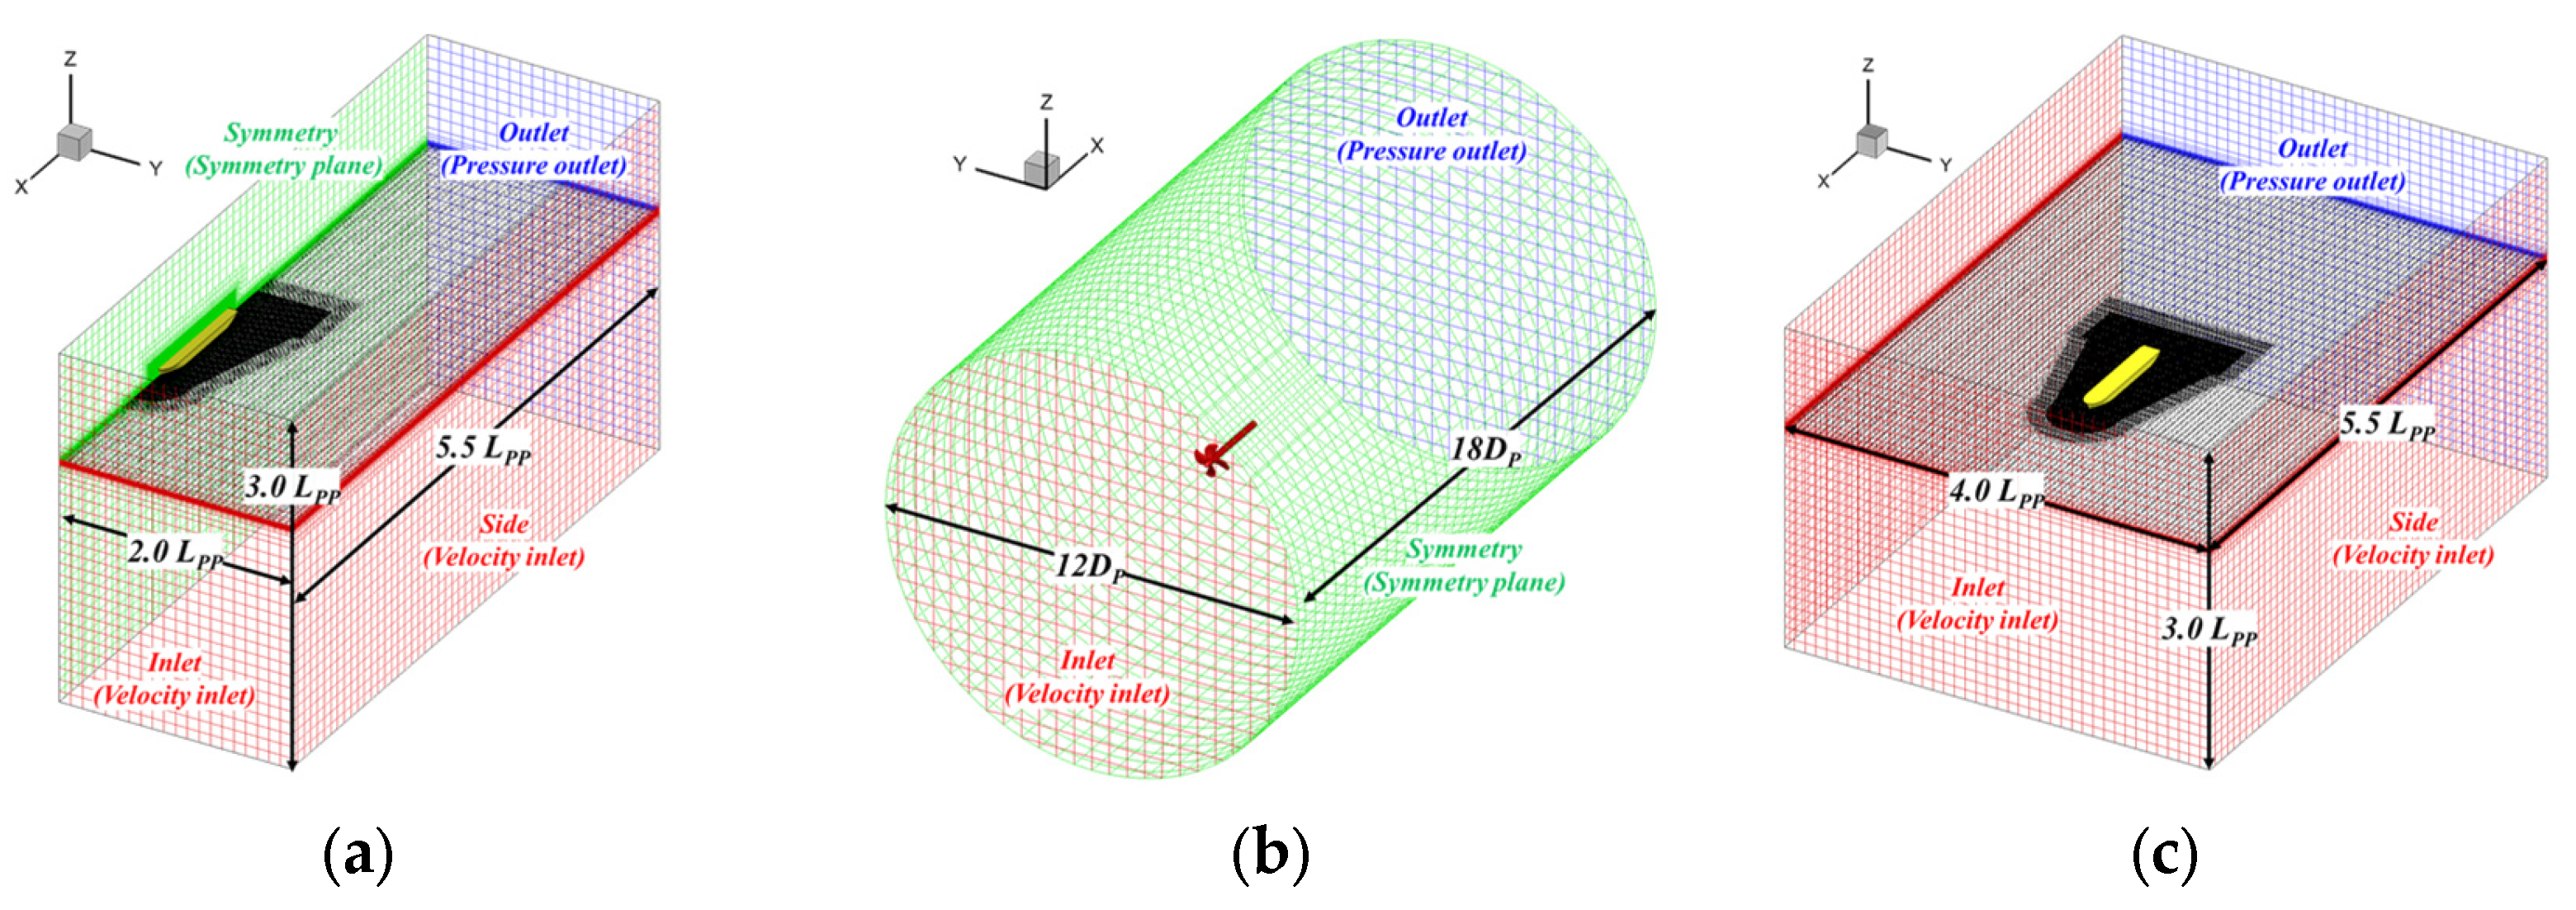
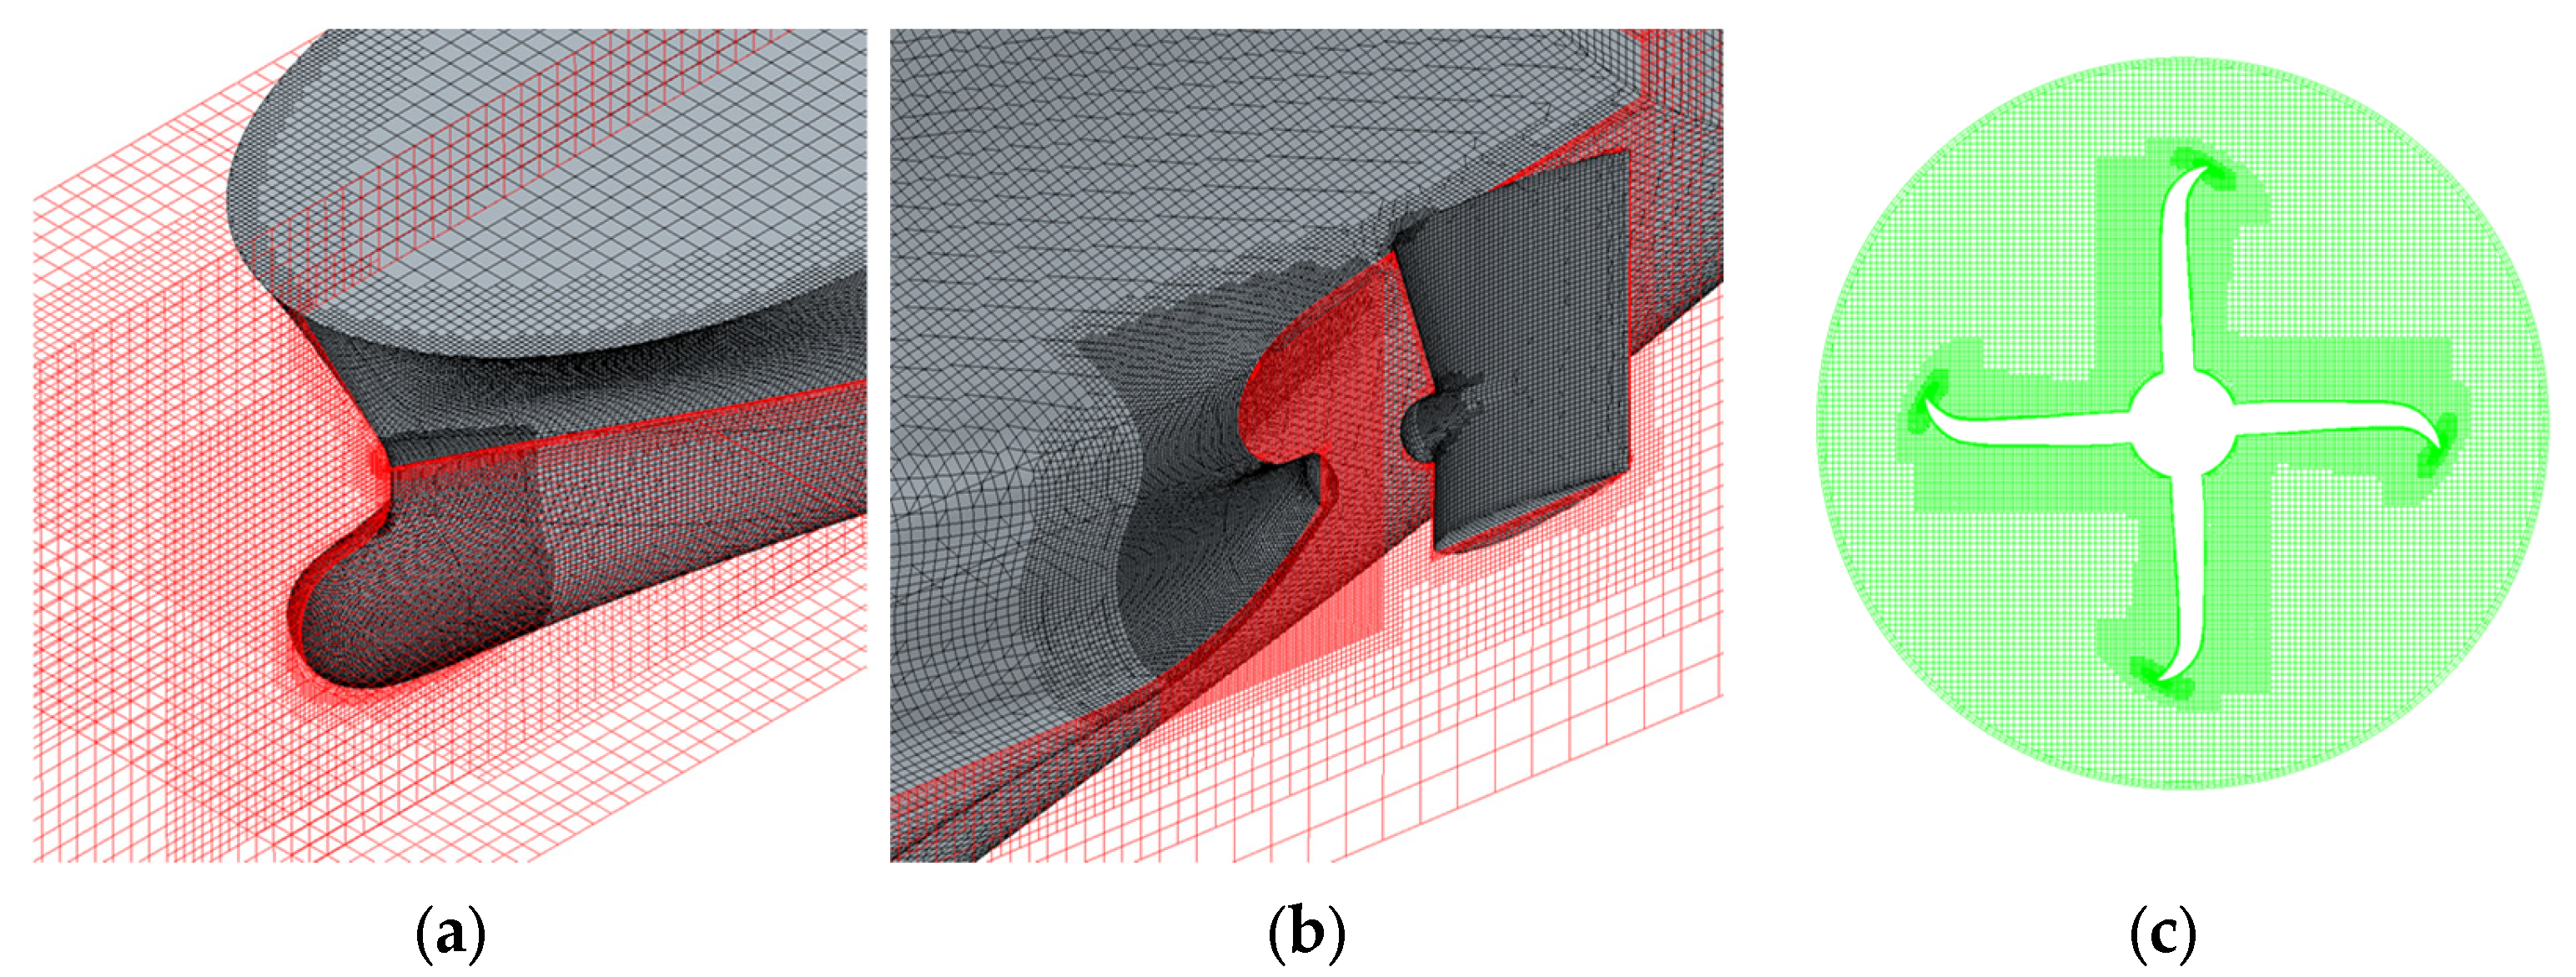
2.4. Computation Domain and Grid System

Figure 4 presents the computational domains for resistance, propeller open water (POW), and self-propulsion simulations. Computational domain size is recommended to minimize boundary effects in simulations [26,27].
The boundary conditions were set to the velocity inlet and pressure outlet. The wave damping method provided by STAR-CCM+ [28] was used to prevent wave reflections at the computational domain boundaries in the CFD simulation.
The half-width computational domain with symmetry boundary conditions was used for the resistance simulation, and the number of grids was 2.97 M. Because of the need to simulate the propeller directly, the self-propulsion simulation was used for the full body, and the number of grids was 12.3 M. In the POW simulation, 3.78 M grids were used. Figure 5 shows the grid distribution around the hull and propeller. The coordinate system used in the calculation, where x, y, and z are the bow direction, port side, and deck direction, was the positive direction. Three types of propellers were attached to the stern, with jet tubes positioned along the shaft, as shown in Figure 6.

2.5. Verification and Validation

2.5.1. Verification

A convergence test was performed to verify the results. The resistance and POW simulations were calculated independently. The evaluation was performed using the grid convergence index (GCI), which quantifies the degree of convergence in numerical analyses [29]. A convergence test based on the grid size was conducted, followed by an analysis of the time step conditions for the resistance simulation. The grid conditions for resistance were categorized as fine, medium, and coarse, corresponding to cell counts of 5,697,248, 2,976,710, and 1,553,994, respectively (Table 3). The grid condition for the POW test was set to cell counts of 7,068,215, 3,787,544, and 2,028,383.
The ratio of the differences in physical quantities, ε21 and ε32, was used to define the convergence ratio, Ri. r is the grid refinement ratio. The following evaluation criteria were applied based on the convergence ratio [29,30].
Ri = ε21/ε32
( i )       Monotonic   convergence :   0 < R i < 1 ( i i )     Oscillatory   convergence :   R i < 0 ( i i i )     Divergence :   R i > 1
As shown in Table 4, For the resistance test, the Ri,grid value for the grid test was 0.71; the Ri,time step value for the time step was 0.65, confirming monotonic convergence; and the GCI21 value was 3.63%, while that for the time step was 2.13%, both of which were within acceptable limits. For the POW test, the Ri,grid value for the grid test was 0.53, confirming monotonic convergence, and the GCI21 value was 2.07%, which is within acceptable limits. The medium grid condition and time step were selected considering the computational cost and GCI value.

2.5.2. Validation of Resistance Simulation

The calculation results were validated by comparing the total resistance coefficient with experiment data from towing tank model tests conducted at Pusan National University (PNU) using a model of the same scale. The dimensions of the tank are length, breadth, and depth of 100 m, 8.0 m, and 3.5 m, respectively. The resistance test and self-propulsion test were conducted under two conditions: loaded and ballast. The CFD simulation was compared at the loaded condition.
The comparison of the resistance performance in calm water without fin conditions indicated less than 2% error between the numerical calculations and the model tests, as shown in Table 5. Furthermore, resistance performance at various ship speeds for the with-fin condition was evaluated as shown in Table 6, confirming that the error in the total resistance coefficient from the model tests remained within 2%. Although absolute differences in sinkage and trim were observed, these variations were considered minor. Here, CTM, τ, and σ represent the total resistance coefficient, trim, and sinkage, respectively.
The wake distribution influenced by the fin was analyzed (Figure 7a). The target ship exhibited a hook-shaped wake distribution; the flow velocity entering the top of the propeller increased, leading to a decrease in the nominal wake. These phenomena were further illustrated by the flow behavior around the fin, as shown in Figure 7b. The concentrated flow around the hook was dispersed near the fin, decreasing the low-speed region.

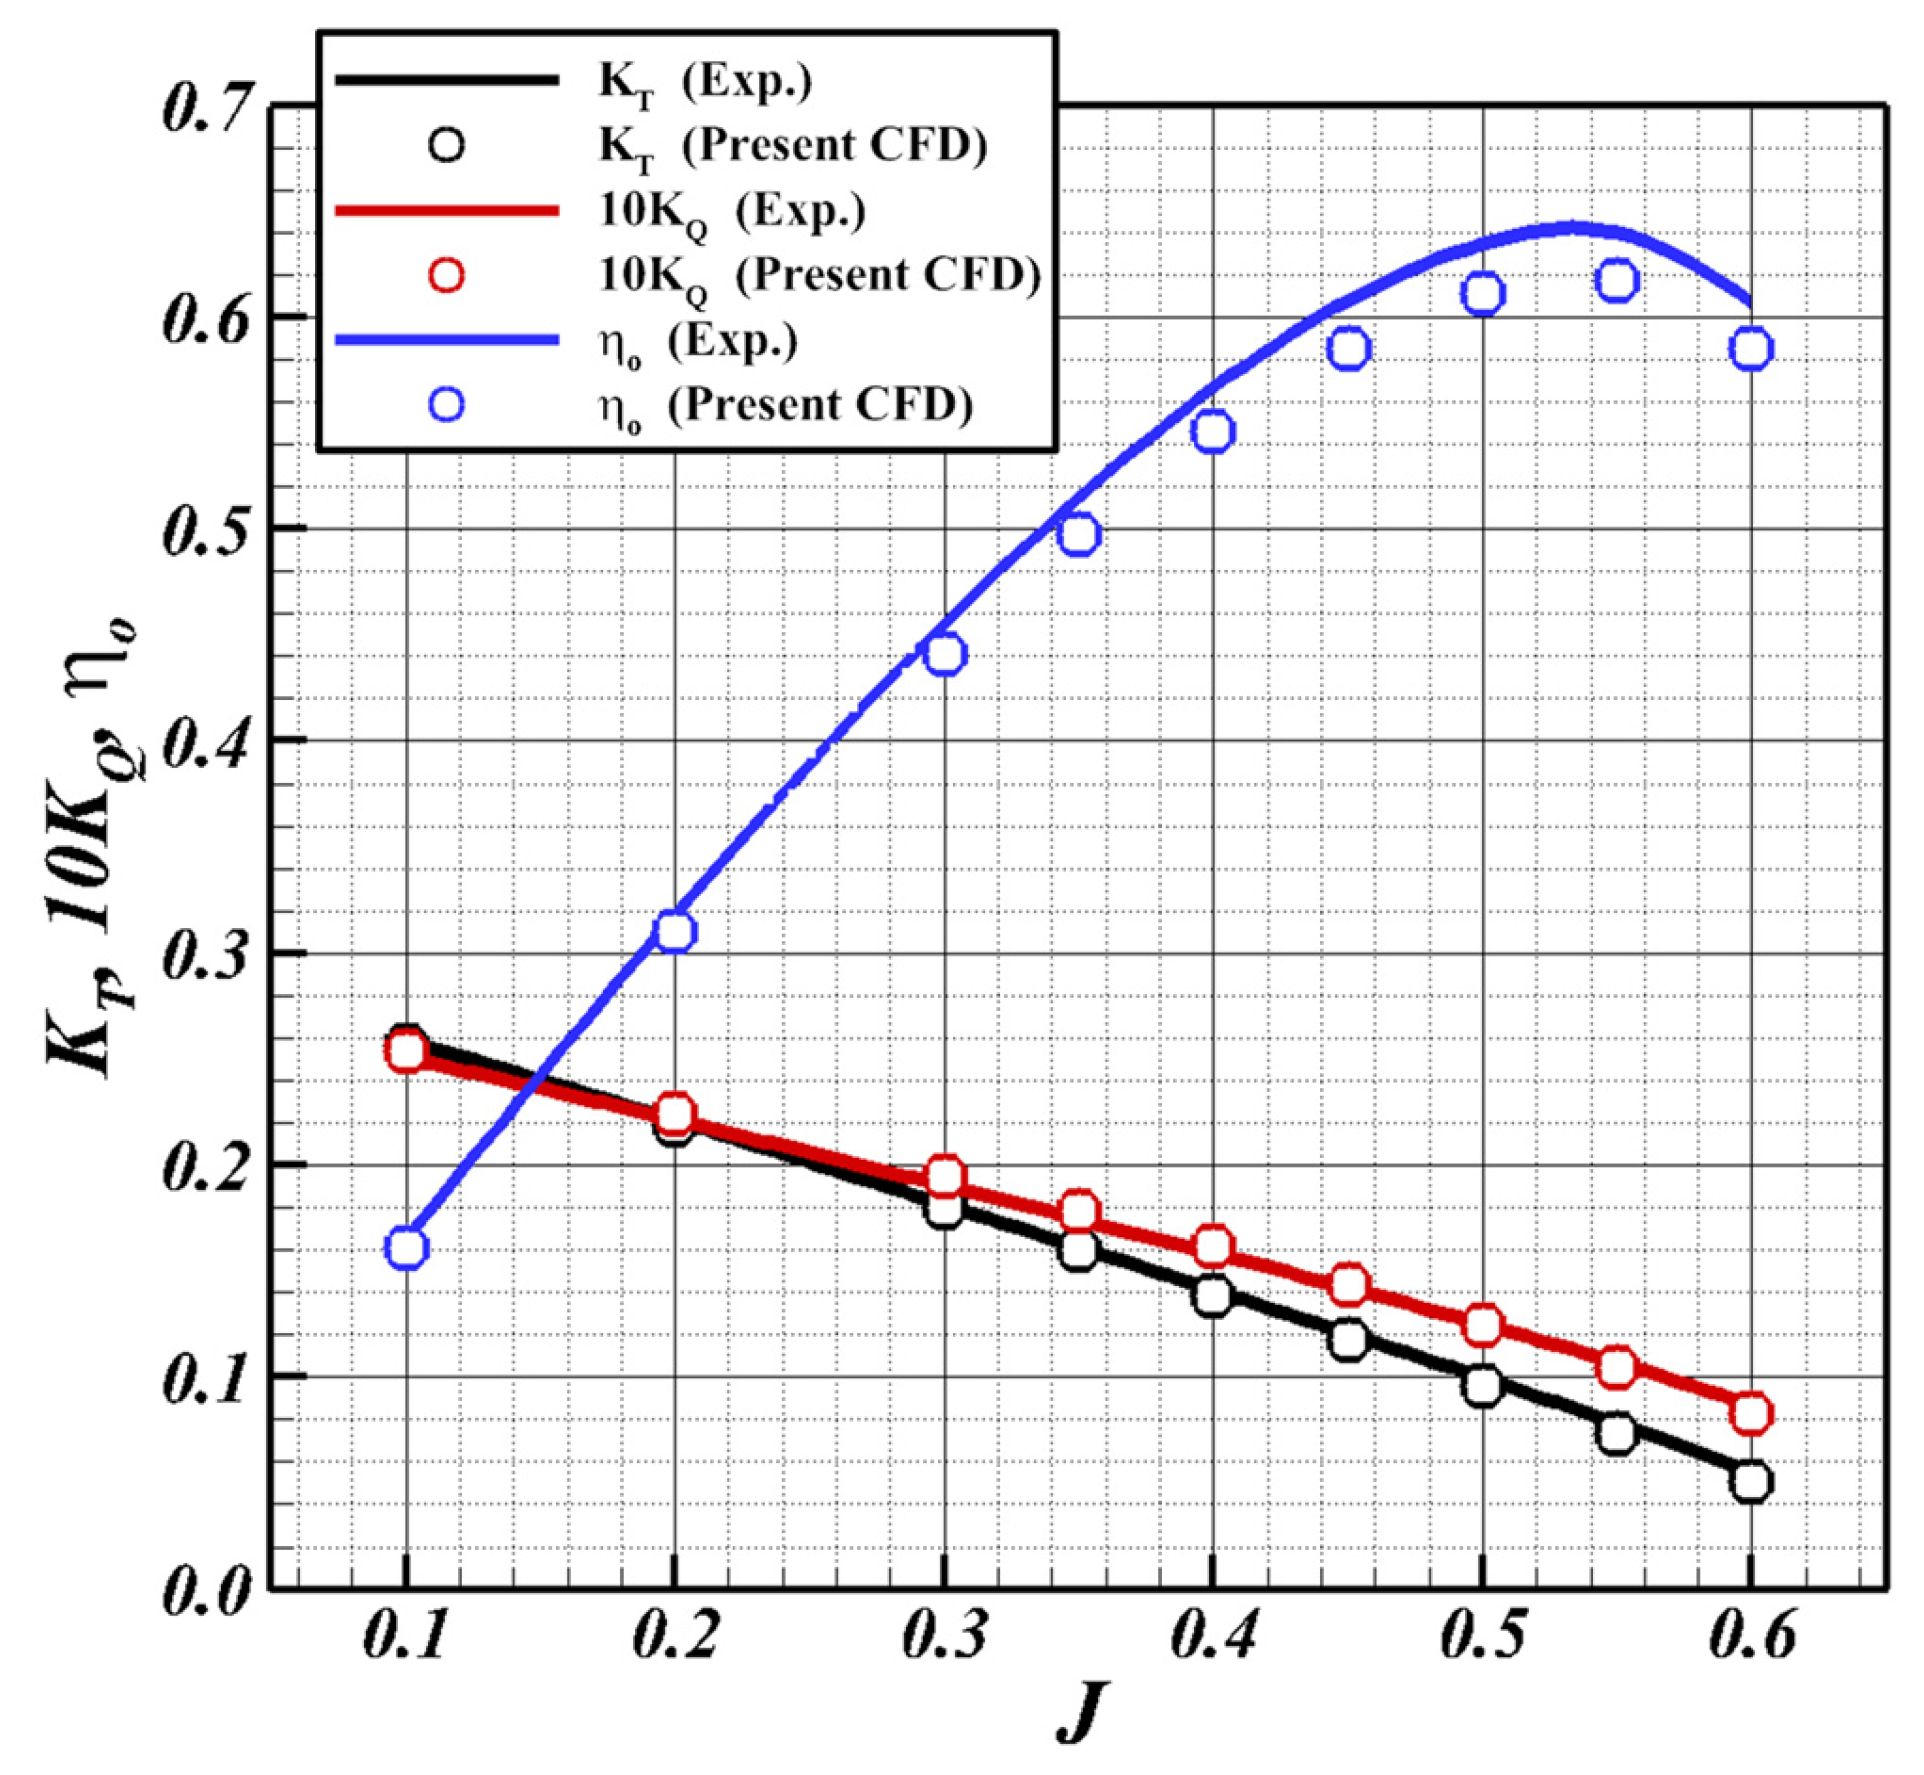
2.5.3. Validation of Propeller Open-Water Simulation

The numerical results were validated by comparing the propeller performance factors, including thrust coefficient (KT), torque coefficient (10KQ), and propeller open-water efficiency (ηO), with experiment data, as shown in Table 7. The open-water curves were generated by calculating the flow velocity corresponding to each advance ratio (J) at a fixed revolution per second (RPS), as shown in Figure 8. KT and 10KQ exhibited decreasing trends with an increasing advance ratio, showing reasonable agreement between the experimental and CFD results. Near the design advance ratio, the numerical predictions revealed average deviations in thrust and torque of 2.0% and 1.7%, respectively, compared to the experimental data. These findings confirmed the accuracy and reliability of the numerical approach for predicting propeller performance.

2.5.4. Validation of Self-Propulsion Simulation

The calculation results were validated by comparing the self-propulsion factors in calm water at the design velocity, as shown in Table 8. Instead of relying on the virtual disk theory commonly applied in numerical analysis, the propeller was modeled directly, and a self-propulsion simulation was conducted. The self-propulsion point was determined by balancing longitudinal forces, including the towing force, which is the skin friction correction force (SFC, FD). The self-propulsion factors were estimated using the ITTC 1978 method [31].
Among the self-propulsion factors, the relative rotation efficiency (ηR) showed a larger difference, while the hull efficiency (ηH) differed by 1.5%. The quasi-propulsive efficiency (ηD), representing the ratio of delivered power to effective power (PD), revealed a 2.0% difference, and the delivered power differed by 2.3%. These results showed reasonable agreement with the experimental data. Furthermore, trends consistent with the experimental results were confirmed through the numerical analysis validation conducted earlier, suggesting that the numerical scheme for this research has been established at a reliable level.

3. Methodology

3.1. Procedures for the Coanda Effect Performance Decision

Figure 9 shows the design point decision procedure for the Coanda propeller. The maximum efficiency was achieved when the torque became zero, following Newton’s third law. In a Coanda hydrofoil, thrust increases, and torque decreases due to jet injection [24] because the propeller slits are oriented opposite to the direction of rotation. The jet injection reduces the torque acting on the rotating propeller. Hence, zero torque suggests no power is required to rotate the propeller. Consequently, maximum efficiency is achieved when the torque reaches zero, a condition referred to as the Coanda design point.
The rotational speed must be adjusted because the amount of jet injections affects the torque and thrust. Accordingly, iterative calculations were carried out to maintain a constant thrust while ensuring the condition where the torque becomes zero is satisfied.
In general, a propulsion test involves installing a propeller on a model ship and evaluating the propulsion performance based on the thrust generated by the propeller. During this test, data are collected under various combinations of rotational speeds and velocity conditions to evaluate the efficiency and performance of the propeller. A self-propulsion test was conducted in a similar manner to the model test and was carried out at a corresponding speed that satisfies the similarity in the Froude number between the model and the full-scale ship. On the other hand, the Reynolds number similarity cannot be satisfied because of the scale difference between the model and the full-scale ship. Accordingly, a towing force was applied to the model to replicate the actual conditions of the full-scale ship. The conditions of Equation (5) were satisfied at this self-propulsion point.
When a Coanda propeller is used, the jet injection amount must be adjusted to achieve zero torque. Nevertheless, this adjustment directly affects the thrust, requiring the fluctuating thrust to be considered when determining the self-propulsion point (Equation (6)). Unlike conventional methods, self-propulsion tests with a Coanda propeller necessitate an iterative optimization process that accounts for the interaction between the jet injection amount and thrust. In this study, the point that satisfies these conditions was defined as the self-propulsion point of the Coanda propeller.
RTTFD = 0
RTTFDΔTinject = 0
where RT, T, FD, and ΔTinject represent the total resistance, propeller thrust, towing force, and the thrust generated by the Coanda effect, respectively.

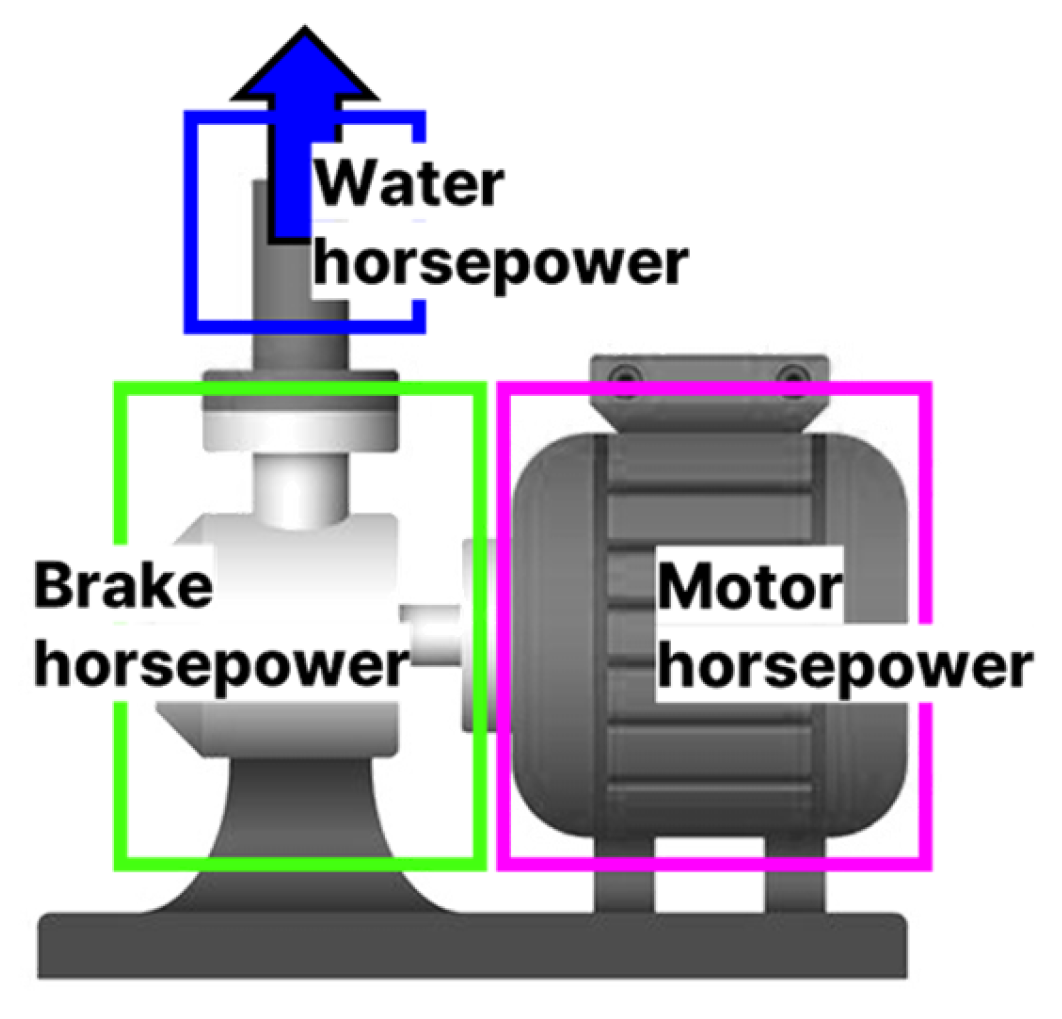
3.2. Procedures for Pump Performance

The Coanda propeller requires the inflow of fluid into its interior, necessitating using a pump to handle the intake of separate fluids. In this study, a centrifugal pump was chosen because of its widespread application in converting mechanical energy from an external source (e.g., an electric motor) into the kinetic energy of the fluid, facilitating efficient fluid transfer. The primary objective of the pump is to achieve the desired flow rate at the specified head. The power required by the pump is categorized into water horsepower (WHP, PW), brake horsepower (BHP, PB), and motor power (i.e., total required power, PM), as shown in Figure 10.
First, water horsepower refers to the power imparted to the fluid by the pump, determined by the total head and flow rate. The total head is the sum of the static head, velocity head, pressure head, and friction loss head. Second, brake horsepower refers to the power adjusted for the losses incurred during power transmission from the pump to the fluid, factoring in the pump efficiency. The pump efficiency is determined from a performance curve that relates the flow rate to specific impeller rotation speeds and size conditions. Finally, motor power is the power required to operate a motor, accounting for the brake horsepower and the transmission coefficient (i.e., margin rate). In this study, the power required to drive the pump was calculated using the formula provided in the technical guidelines of the Korea Occupational Safety and Health Agency (KOSHA), as expressed in Equation (7).
P W = γ   ×   Q   ×   H total = m ˙   ×   g   ×   H total   , P B = P W   ÷   η P   , P M = P B   ÷   η M
where γ, Q, Htotal, m ˙ , g, ηP, and η M represent the specific weight, volumetric flow rate, total head, mass flow rate, gravitational acceleration, pump efficiency, and motor efficiency including a margin, respectively.

4. Results of the Simulation

Three types of propellers were attached to the stern of a ship, and simulations were performed to compare the self-propulsion factors at the self-propulsion point on a model scale. In addition, this study explored the performance and practical application of propellers using the Coanda effect under stern wake conditions. The self-propulsion point on the model scale refers to the condition where the model ship achieves a specific forward speed under its propulsion. At this point, the thrust generated by the propeller equals the hull resistance, eliminating the need for additional towing force. Additional power components, such as pump power, cannot be extrapolated reliably to full-scale conditions because of the influence of the scale ratio. Consequently, this study compared the performance at the model-scale self-propulsion point. Future full-scale analyses will focus on evaluating the applicability of Coanda propellers to full-size ships and assessing their economic viability.
The water horsepower required for injection was incorporated into the propeller efficiency calculation, as shown in Equation (8) [23,24]. In this study, the pump efficiency and the motor margin were set to 50% and 25%, respectively. The relative rotational efficiency of the Coanda propeller was set to 1.0 because no torque acts on the propeller.
η O = T V A 2 π nQ + P W
η D = η H   ×   η O   ×   η R ×   η P ×   η M
In this study, the efficiency was evaluated from two perspectives. The first perspective focused on the propeller and ship efficiency, which followed a conventional definition used in existing propulsion systems. The second perspective considered the efficiency associated with the Coanda effect, which accounted for additional thrust not included in the conventional definition. This efficiency is expressed as the product of hull efficiency (ηH), propeller efficiency (ηO), relative rotational efficiency (ηR), pump efficiency (ηP), and motor efficiency (ηM) with margin rate, as expressed in Equation (9). Table 9 lists the self-propulsion simulations for different propellers, which compares the self-propulsion factors.
Additional thrust is generated because of the Coanda effect, allowing the Coanda propeller to produce similar thrust to other propellers even at lower rotation speeds. As a result, higher advance ratios were observed during operation. The lowest thrust deduction factor was observed in the Coanda propeller, suggesting that relatively lower resistance was experienced at the self-propulsion point than other propellers. Figure 11 compares the pressure distributions around the stern between the Coanda propeller and normal propeller. A wider high-pressure region near the stern was observed with the Coanda propeller compared to the normal propeller. This high-pressure region was attributed to the reduction in resistance achieved through the pressure recovery effect in the hull.
Figure 12 shows the wake vortices of the three propellers at Q = 1000 s−2. A complex vortex system was observed in the wake, which was induced by the tips and the hub. The Coanda propeller generated secondary vortices along the propeller plane as the jet was injected. Figure 13 shows the instantaneous vorticity magnitude in the XZ plane. Relatively organized vortex patterns are shown in the downstream region for the original and normal propellers, with the vortices originating from the blade tips and the hub. In contrast, irregular vortex shedding is observed in the Coanda propeller because of interactions between the jet and the tip and hub vortices. The distance at which the wake transitions to turbulence is reduced by the jet injection. Furthermore, the dissipation of vorticity over shorter distances is identified, showing the enhanced vortex dispersion characteristics caused by the Coanda effect.
The horsepower required by the three propellers was compared. The Coanda propeller required approximately 7.8% less power than the original propeller. These findings suggest that a reduction in required horsepower can be achieved using the Coanda propeller, showing a decrease in the energy or power needed for a ship to achieve a specific speed.
As a result, the Coanda propeller improves ship efficiency, showing its practical feasibility behind the ship. The findings, derived through horsepower comparisons, confirmed that the Coanda effect enhances performance compared to conventional propellers. These results provide essential baseline data for evaluating the applicability of Coanda effect-based propellers and are expected to be validated through full-scale analyses in future studies.

5. Conclusions

This study numerically investigated the self-propulsion performance of a propeller using the Coanda effect. A propeller incorporating a jet injection slit to implement the Coanda effect was designed, and its performance was compared with the original propeller. Validation was conducted by comparing the numerical results with the experimental data, and the results were verified using the GCI test. In addition, the self-propulsion performance at the model scale was analyzed, and the self-propulsion factors were compared to evaluate the performance of the Coanda propeller.
  • The Coanda propeller showed significant improvements in the self-propulsion performance compared to the normal and original propellers. The self-propulsion analysis indicated that the required power of the Coanda propeller was reduced by approximately 7.8% compared to the original propeller. These results suggest that additional force is generated on the suction side because of jet injection, enabling efficient propulsion even at lower rotational speeds.
  • The numerical scheme used in this study was based on the URANS equations and showed a correlation with the model experimental results. This approach effectively reproduced key flow phenomena and accurately modeled the flow characteristics of jet injection because of the Coanda effect, allowing precise thrust and torque calculations.
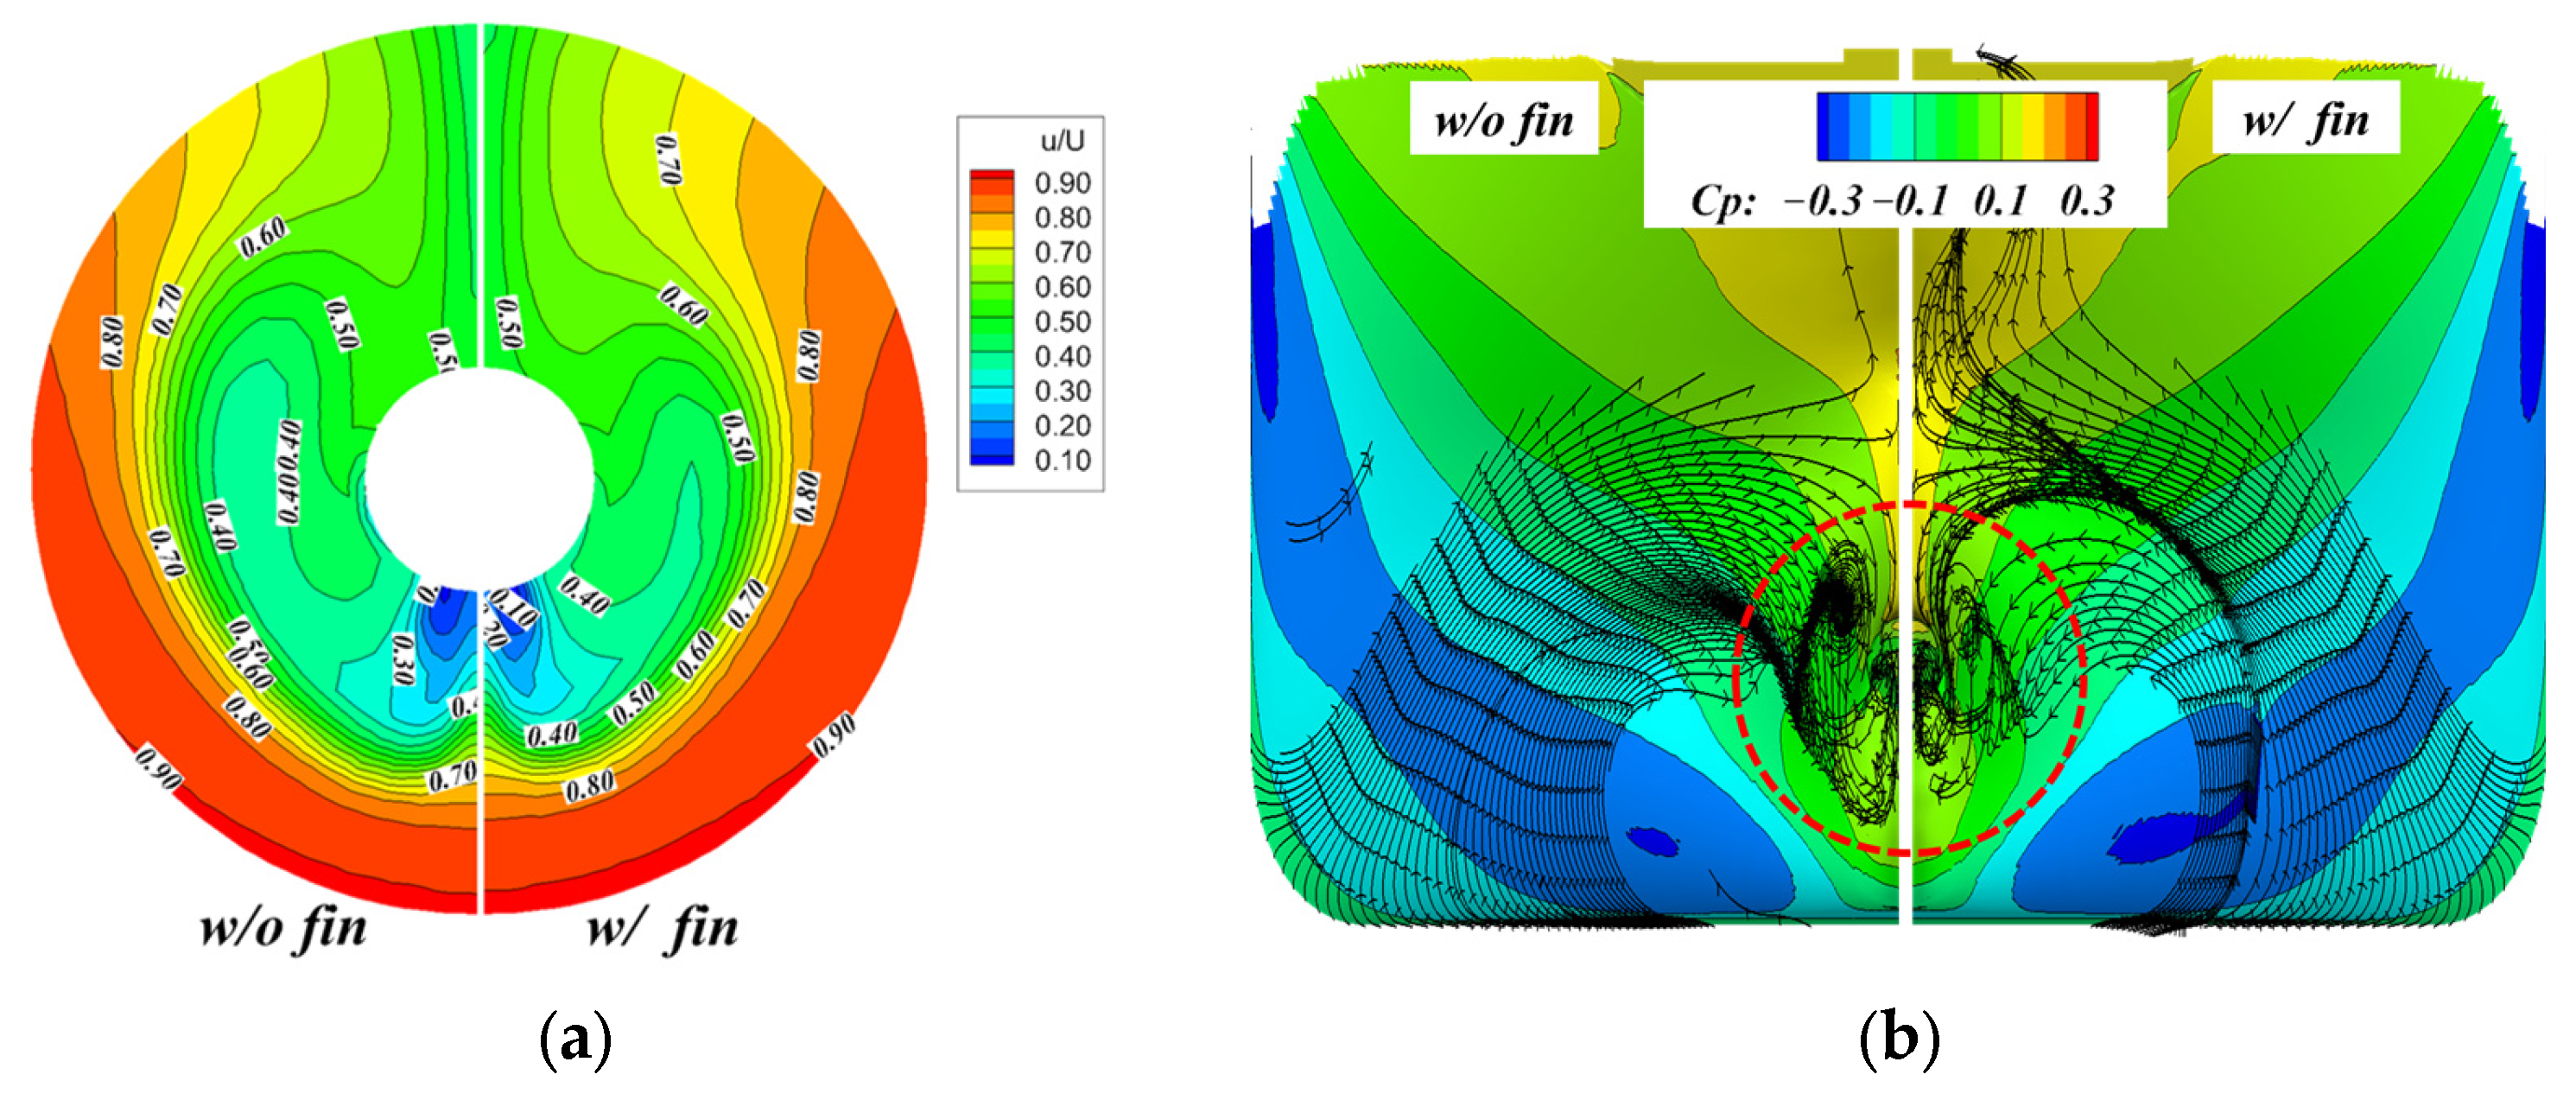
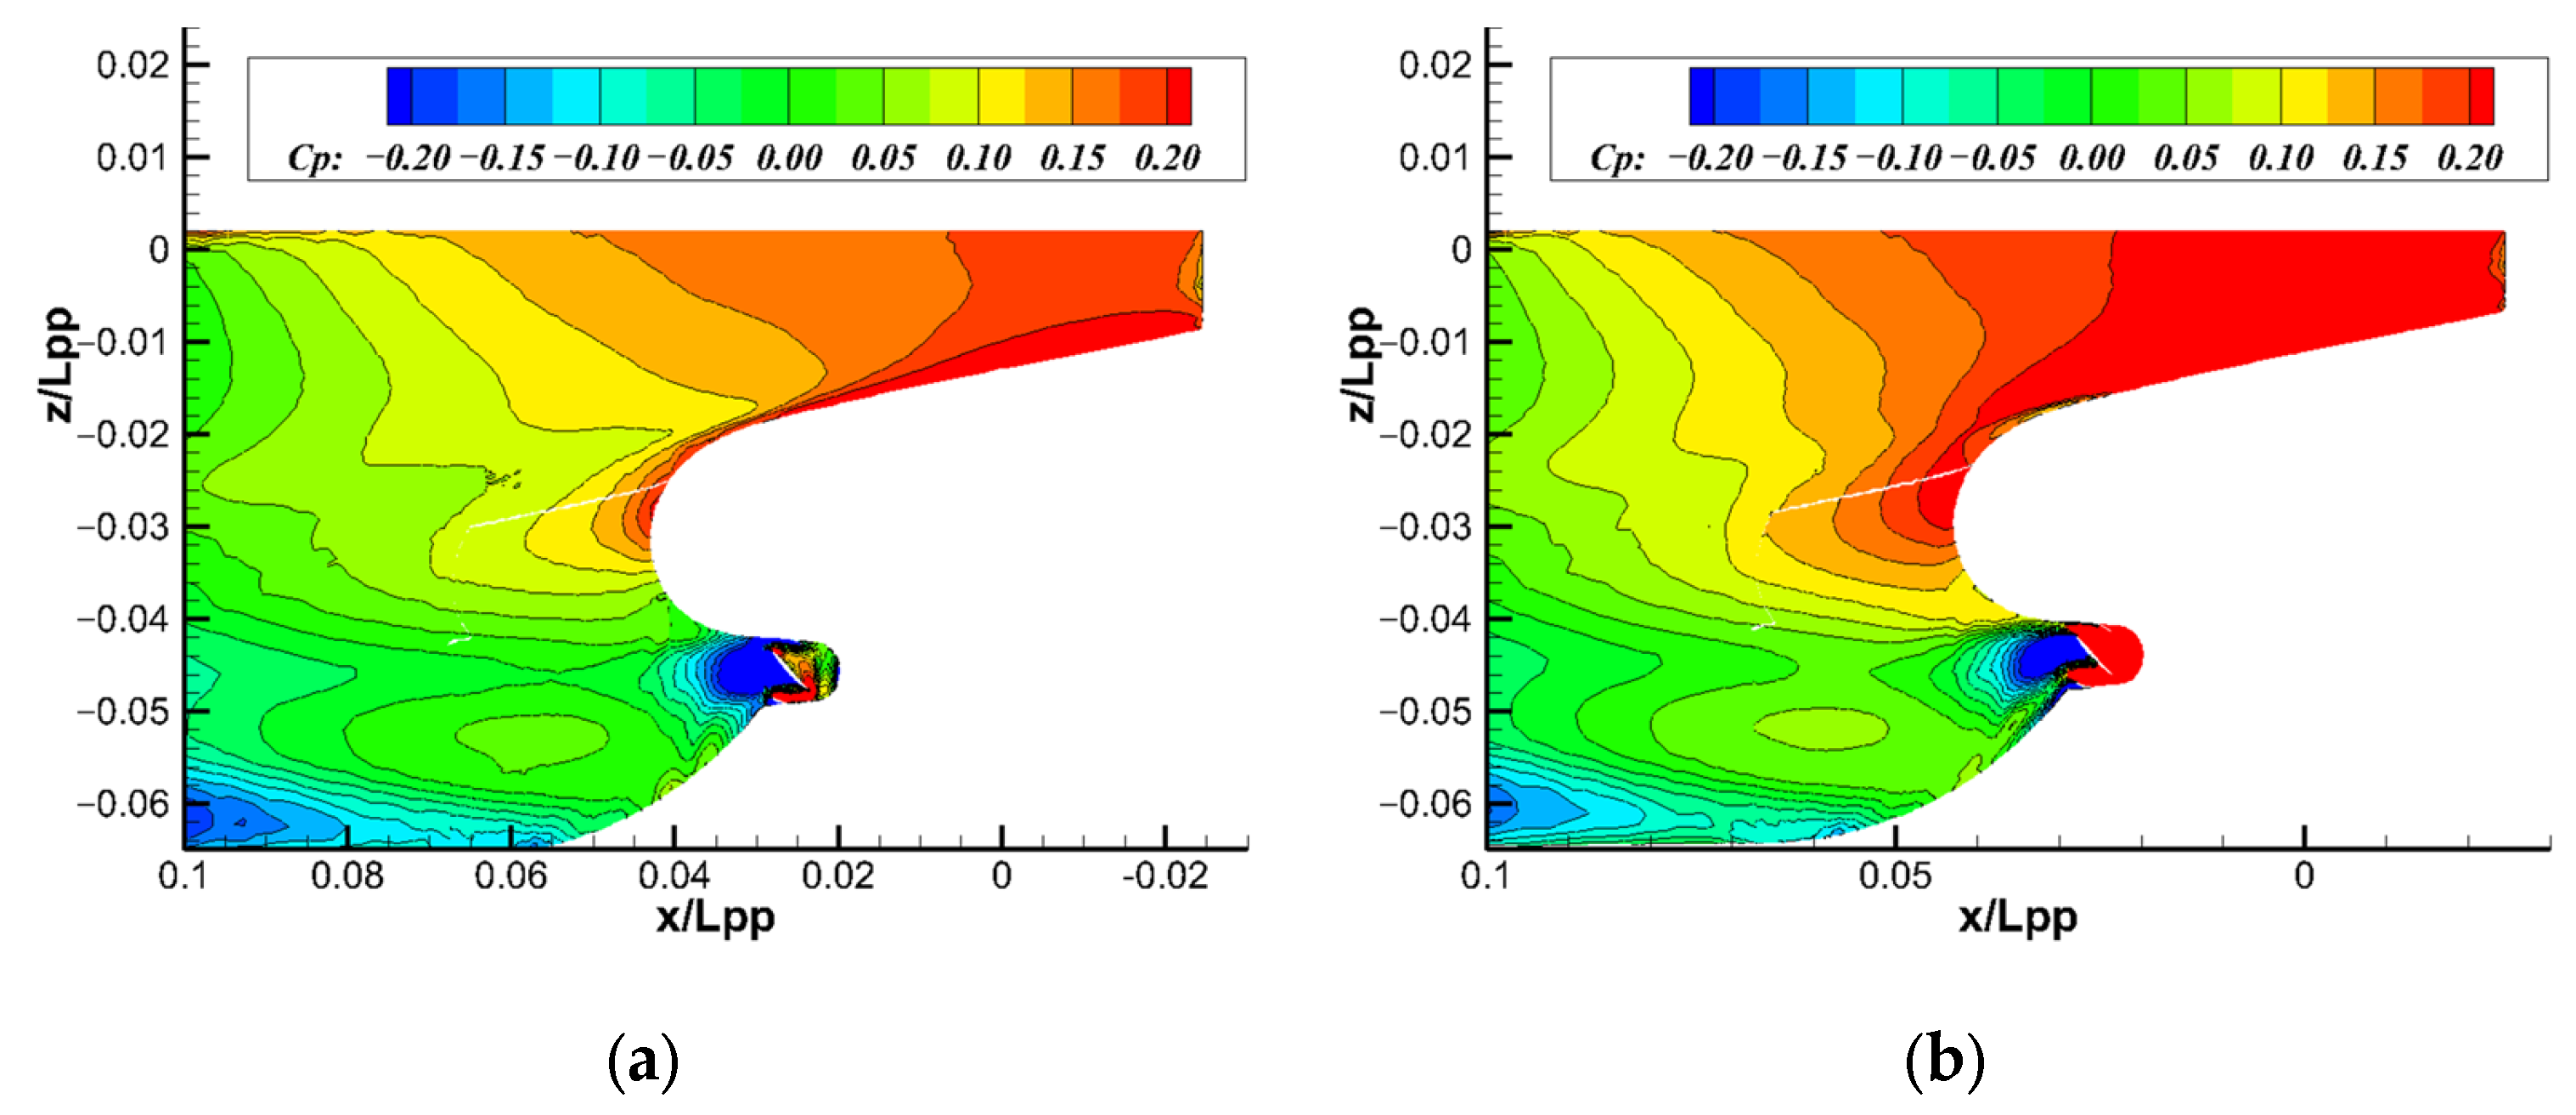
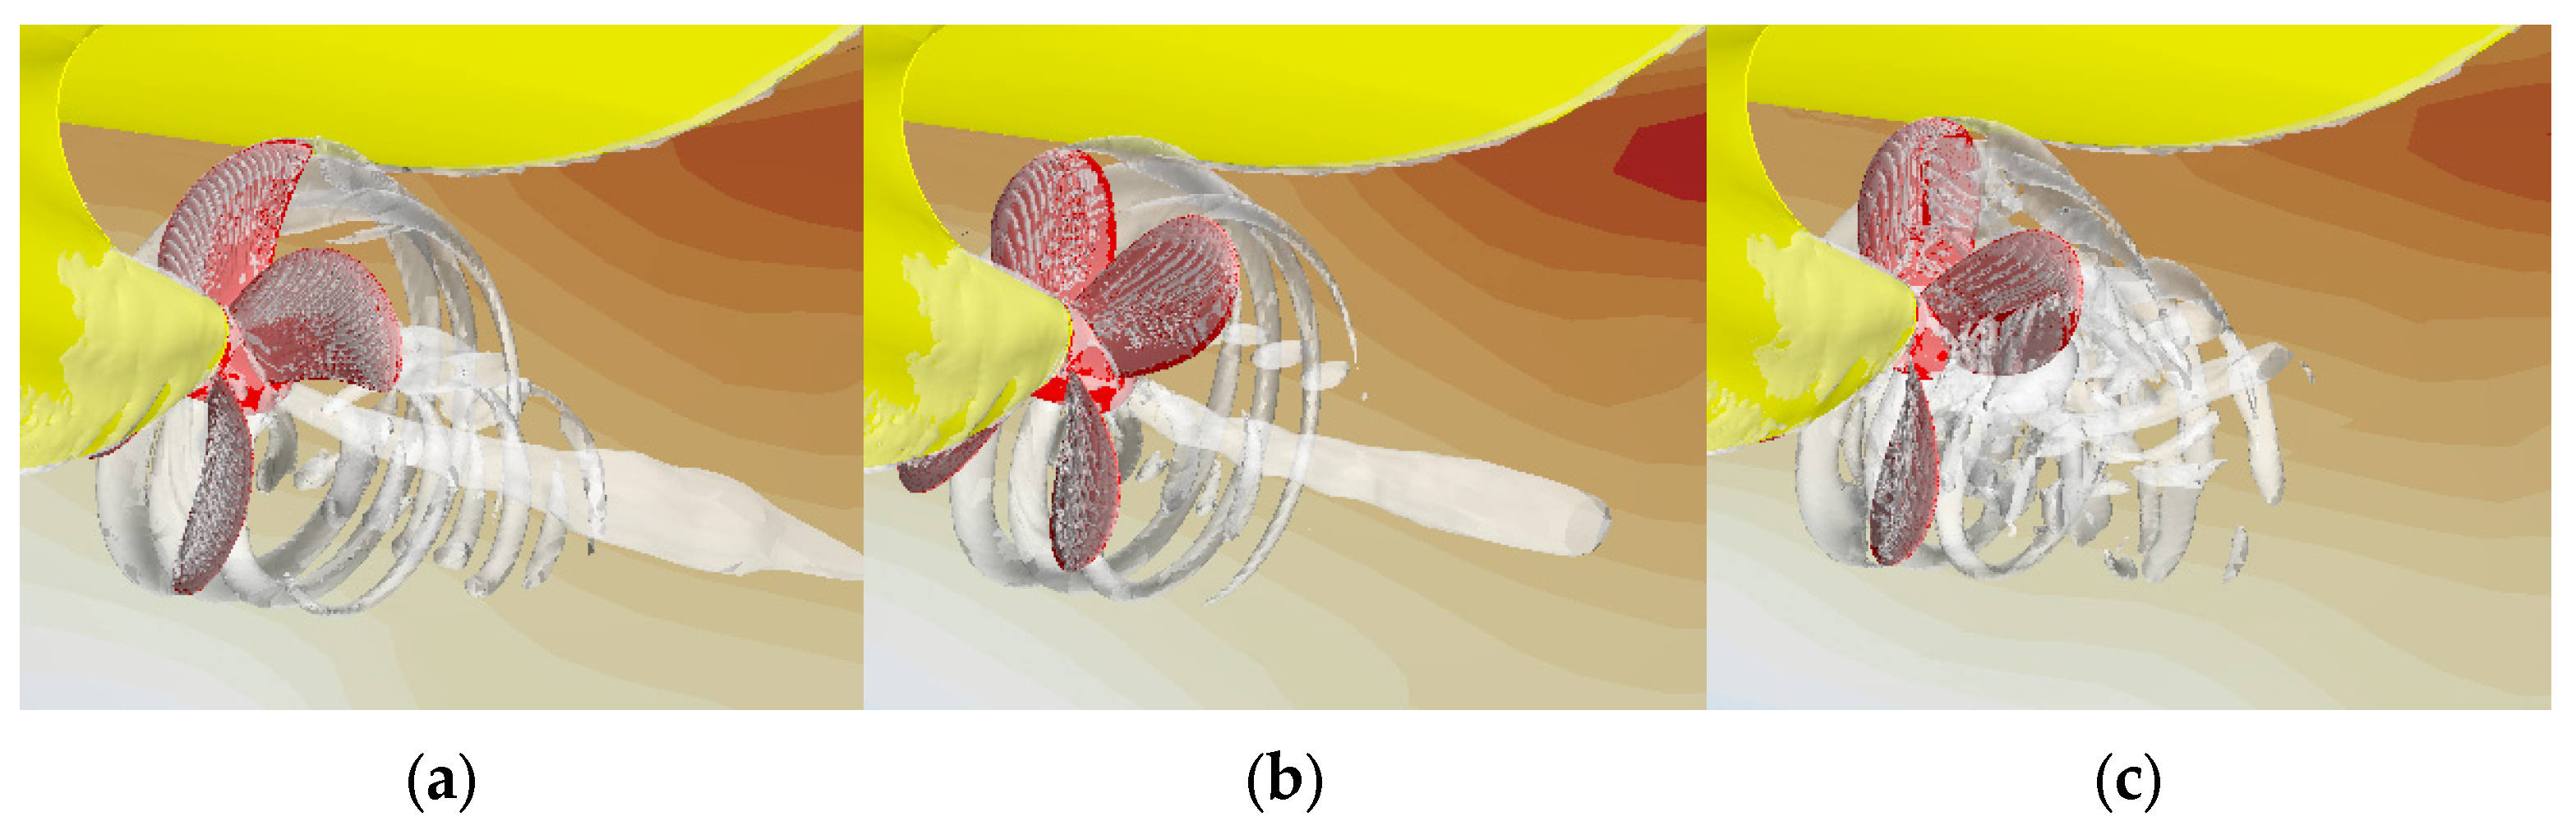
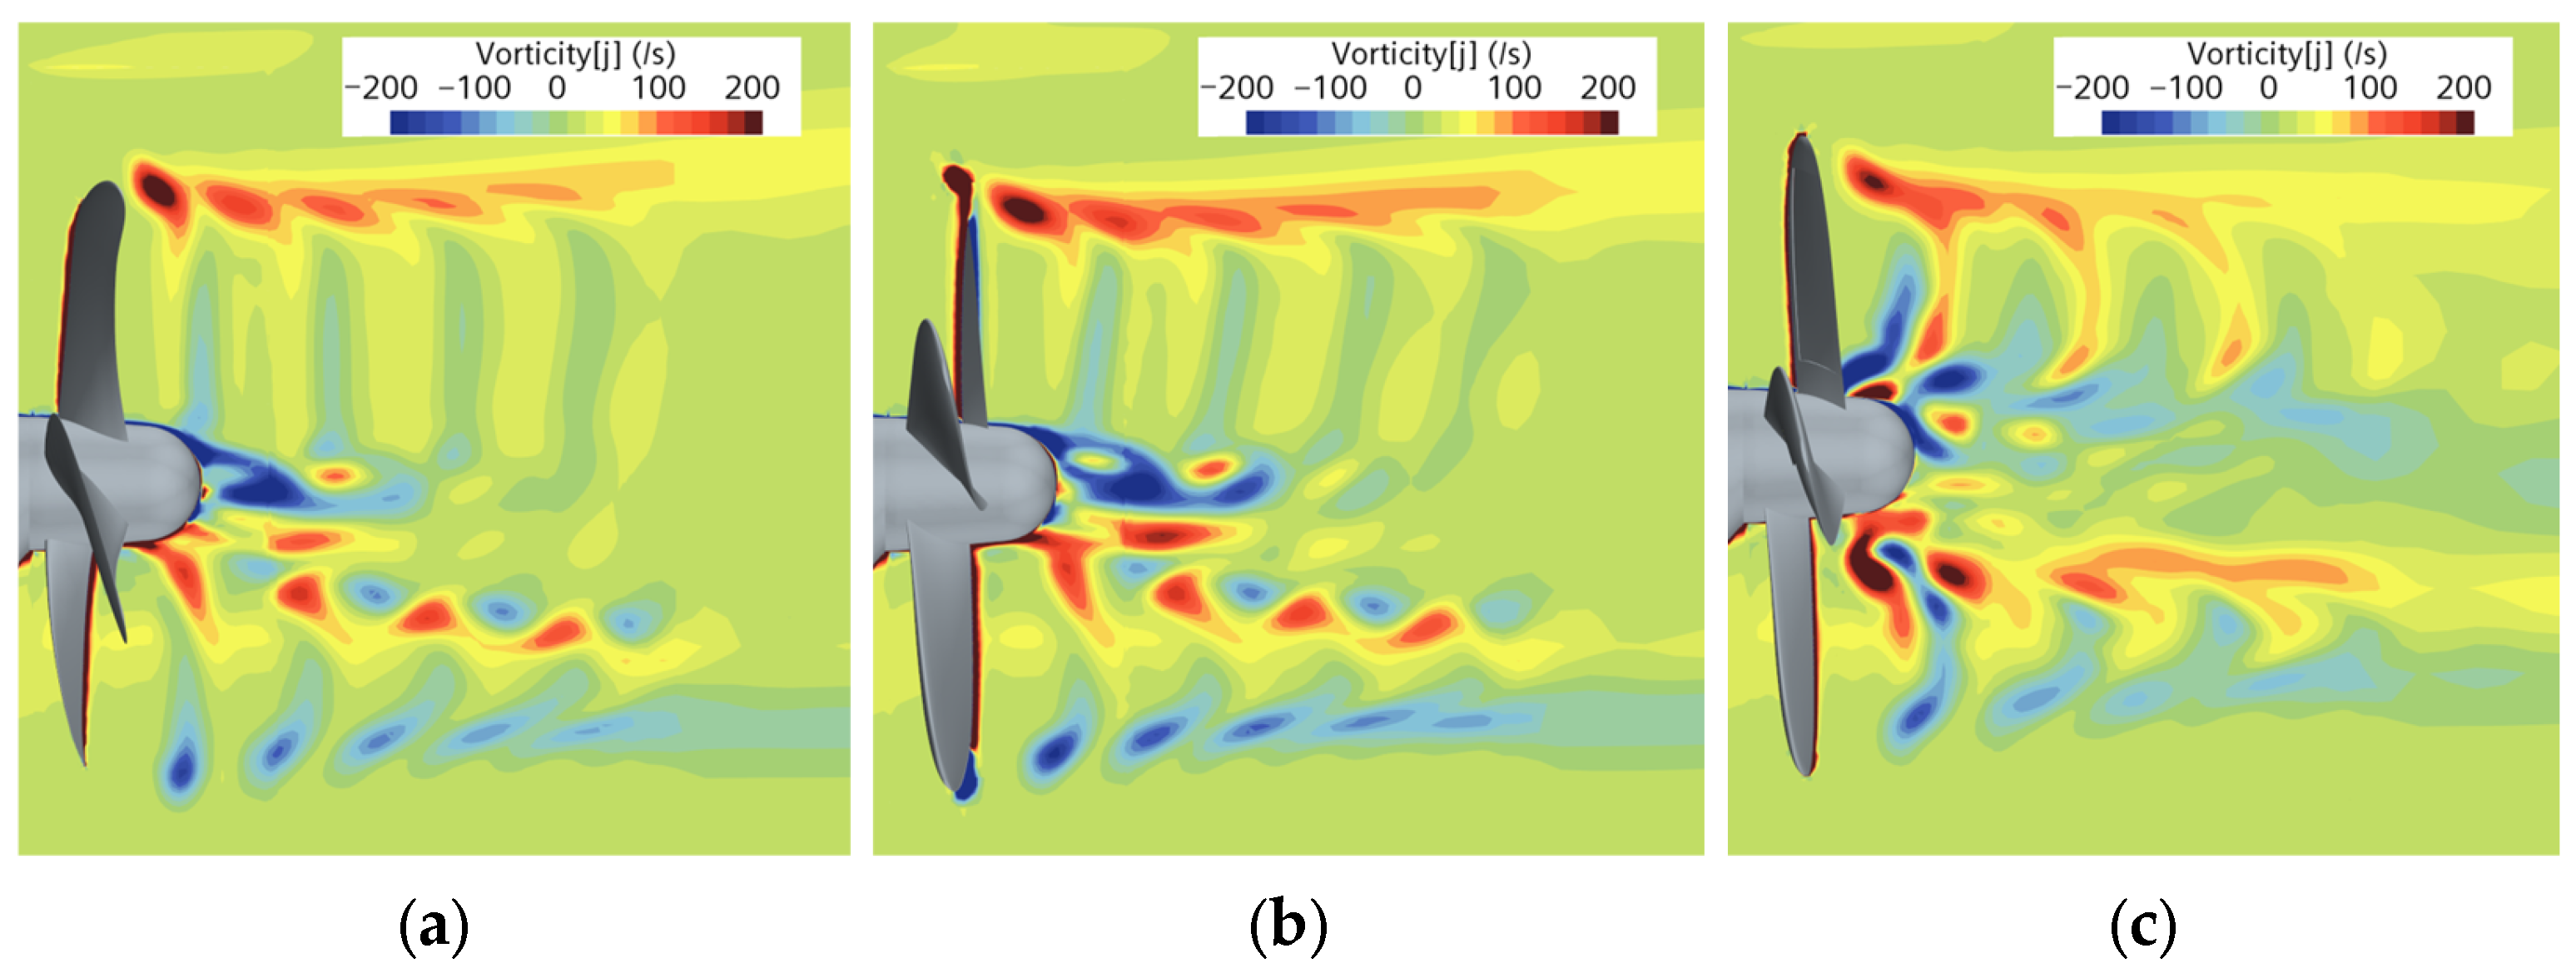
  • The numerical results confirmed that the Coanda effect positively influenced the flow characteristics by stabilizing the wake and enhancing pressure recovery. In the wake region, the interactions between tip vortices and the jet flow were observed, promoting vortex dissipation, reducing resistance, and improving propulsion efficiency. Furthermore, pressure fluctuations showed that the Coanda propeller exhibited lower pressure variations than normal and original propellers, indicating its potential for cavitation.
This study identified the self-propulsion performance and flow characteristics of the Coanda propeller on the model scale, providing foundational data for extending the analysis to full-scale conditions. Future research will focus on incorporating Reynolds number effects and free-surface interactions in full-scale studies, as well as refining propeller geometry design to determine the practical applicability of this technology.

Author Contributions

Conceptualization, Data curation, Formal analysis, Investigation, Methodology, Validation, Visualization, Writing—original draft, review, and editing, J.-H.L.; Conceptualization, Data curation, Methodology, Funding acquisition, Investigation, Resources, Supervision, Writing—review and editing, K.-J.P.; Conceptualization, Investigation, Visualization, Writing—review and editing, D.-H.O. All authors have read and agreed to the published version of the manuscript.

Funding

This work was supported by the National Research Foundation of Korea (NRF) grant (No. 2022R1F1A1074865) funded by the Ministry of Science and ICT, Republic of Korea, and the Korea Institute of Marine Science and Technology Promotion (KIMST) grant (20220210) funded by the Ministry of Oceans and Fisheries, Republic of Korea.

Institutional Review Board Statement

Not applicable.

Informed Consent Statement

Not applicable.

Data Availability Statement

Data are contained within the article.

Conflicts of Interest

The authors declare no conflicts of interest.

References

  1. Lee, J.Y. International Maritime Organization (IMO) 82nd Marine Environment Protection Committee (MEPC). J. Soc. Nav. Archit. Korea 2024, 61, 12–21. [Google Scholar]
  2. Kim, J.H.; Choi, J.H. A study on impact and countermeasures of marine fuels in the FuelEU Maritime regulation. J. Soc. Nav. Archit. Korea 2024, 61, 88–97. [Google Scholar] [CrossRef]
  3. Su, Y.M.; Lin, J.F.; Zhao, D.G.; Guo, C.Y.; Guo, H. Influence of a pre-swirl stator and rudder bulb system on the propulsion performance of a large-scale ship model. Ocean Eng. 2020, 218, 108189. [Google Scholar] [CrossRef]
  4. Koushan, K.; Krasilnikov, V.; Nataletti, M.; Sileo, L.; Spence, S. Experimental and numerical study of pre-swirl stators (PSS). J. Mar. Sci. Eng. 2020, 8, 47. [Google Scholar] [CrossRef]
  5. Kang, J.G.; Kim, M.C.; Shin, I.R.; Jin, W.S. Feasibility study on effect of structural flexibility of asymmetric pre-swirl stator on propulsion performance for kriso container ship (Kcs). Brodogradnja 2021, 72, 103–119. [Google Scholar] [CrossRef]
  6. Gaggero, S. Design of PBCF energy saving devices using optimization strategies: A step towards a complete viscous design approach. Ocean Eng. 2018, 159, 517–538. [Google Scholar] [CrossRef]
  7. Ouchi, K.; Ogura, M.; Kono, Y.; Orito, H.; Shiotsu, T.; Tamashima, M.; Koizuka, H. A research and development of PBCF (propeller boss cap fins): Improvement of flow from propeller boss. J. Soc. Nav. Archit. Jpn. 1988, 163, 66–78. [Google Scholar] [CrossRef]
  8. Ouchi, K.; Tamashima, M.; Kawasaki, T.; Koizuka, H. A research and development of PBCF (propeller boss cap fins), 2nd report: Study on propeller slipstream and actual ship performance. J. Soc. Nav. Archit. Jpn. 1989, 165, 43–53. [Google Scholar] [CrossRef]
  9. Xu, K.; Su, X.; Bensow, R.; Krajnovic, S. Drag reduction of ship airflow using steady Coanda effect. Ocean Eng. 2022, 266, 113051. [Google Scholar] [CrossRef]
  10. Pfingsten, K.C.; Radespiel, R. Numerical simulation of a wing with a gapless high-lift system using circulation control. In New Results in Numerical and Experimental Fluid Mechanics VI: Contributions to the 15th STAB/DGLR Symposium; Springer: Berlin/Heidelberg, Germany, 2007. [Google Scholar]
  11. Burnazzi, M.; Radespiel, R. Design and analysis of a droop nose for Coanda flap applications. J. Aircr. 2014, 51, 1567–1579. [Google Scholar] [CrossRef]
  12. Lee, H.; Han, S.; Lee, H.; Jeon, J.; Lee, C.; Kim, Y.B.; Choi, H.R. Design optimization, modeling, and control of unmanned aerial vehicle lifted by Coandă effect. IEEE/ASME Trans. Mechatron. 2017, 22, 1327–1336. [Google Scholar] [CrossRef]
  13. Jun, H.C.; Kim, S.H.; Kim, H.J.; Park, H.P. An experimental study on the effect of increasing rudder force on the turning ability of a short sea shipping ship. J. Korean Soc. Mar. Environ. Saf. 2012, 18, 591–596. [Google Scholar] [CrossRef]
  14. Maltsev, L.I.; Dimitrov, V.D.; Milanov, E.M.; Zapryagaev, I.I.; Timoshevskiy, M.V.; Pervunin, K.S. Jet control of flow separation on hydrofoils: Performance evaluation based on force and torque measurements. J. Eng. Thermophys. 2020, 29, 424–442. [Google Scholar] [CrossRef]
  15. Oh, J.K.; Noh, J.K. On the lift enhancement technique of the trailing edge rotor of two-dimensional hydrofoil. J. Korean Soc. Mar. Environ. Saf. 2015, 21, 200–206. [Google Scholar] [CrossRef]
  16. Oh, J.K.; Kim, H.C. A study on the high lifting device equipped with the trailing edge rotor for the enhancement of circulation control. J. Soc. Nav. Archit. Korea 2010, 47, 533–542. [Google Scholar]
  17. Pant, C.S.; Frankel, S.H. Interaction between surface blowing and re-entrant jet in active control of hydrofoil cavitation. Ocean Eng. 2021, 242, 110087. [Google Scholar] [CrossRef]
  18. Wang, W.; Tang, T.; Zhang, Q.D.; Wang, X.F.; An, Z.Y.; Tong, T.H.; Li, Z.J. Effect of water injection on the cavitation control: Experiments on a NACA66 (MOD) hydrofoil. Acta Mech. Sin. 2020, 36, 999–1017. [Google Scholar] [CrossRef]
  19. Chowdhury, N.E.; Hossain, M.F.; Karim, M.M.; Islam, M.R.; Bhuiyan, A.A. Numerical investigation for mitigation of cavitation in high-speed marine propeller using mass injection approach. Iran. J. Sci. Technol. Trans. Mech. Eng. 2023, 47, 1693–1709. [Google Scholar] [CrossRef]
  20. Yang, C.; Yao, H.D.; Sun, C.; Guo, C.; Wang, C.; Ren, W. Injection of micro jets to improve hydrodynamic performance of a ducted propeller. Ocean Eng. 2024, 309, 118502. [Google Scholar] [CrossRef]
  21. Eom, M.J.; Paik, K.J.; Lee, J.H. Numerical study on the lift-drag and cavitation performances of a two-dimensional hydrofoil using the Coanda effect. J. Adv. Mar. Eng. Technol. 2020, 44, 457–466. [Google Scholar] [CrossRef]
  22. Eom, M.J.; Paik, K.J.; Lee, J.H.; Kang, S.M.; Kim, D.Y. A study on the performance variation of a three-dimensional hydrofoil using jet flow. J. Ocean Eng. Technol. 2021, 35, 24–37. [Google Scholar] [CrossRef]
  23. Lee, J.H.; Paik, K.J.; Lee, S.H.; Kim, G.H.; Cho, J.H. Experimental and numerical study on the performance change of a simple propeller shape using the Coanda effect. Appl. Sci. 2021, 11, 4112. [Google Scholar] [CrossRef]
  24. Lee, J.H.; Lee, J.H.; Kim, M.M.; Oh, D.; Paik, K.J. A numerical study on the optimization of the slit shape of a jet injection propeller. Int. J. Nav. Archit. Ocean Eng. 2024, 16, 100578. [Google Scholar] [CrossRef]
  25. Menter, F.R. Two-equation eddy-viscosity turbulence models for engineering applications. AIAA J. 1994, 32, 1598–1605. [Google Scholar] [CrossRef]
  26. Lee, S.H.; Paik, K.J.; Cho, J.H.; Kim, G.H.; Kim, H.S.; Kim, S.H. A Numerical Study on Self-Propulsion Performance in Regular Waves and Power Prediction in Irregular Waves. Int. J. Nav. Archit. Ocean Eng. 2022, 14, 100454. [Google Scholar] [CrossRef]
  27. Grlj, C.G.; Degiuli, N.; Martić, I. Experimental and numerical assessment of the effect of speed and loading conditions on the nominal wake of a containership. Brodogradnja 2024, 75, 75405. [Google Scholar] [CrossRef]
  28. Simens. STAR-CCM+ User Guide, Version 16.06; Simens: Munich, Germany, 2021. [Google Scholar]
  29. Celik, I.B.; Ghia, U.; Roache, P.J.; Freitas, C.J.; Coleman, H.; Raad, P.E. Procedure for Estimation and Reporting of Uncertainty Due to Discretization in CFD Applications. J. Fluids Eng. 2008, 130, 078001. [Google Scholar]
  30. ITTC. Uncertainty Analysis in CFD Verification and Validation Methodology and Procedures. ITTC-Rcomm. Proced. 7.5-03-01-01.4. 2021. Available online: https://www.ittc.info/media/11950/75-03-01-01.pdf (accessed on 23 February 2025).
  31. ITTC. 1978 ITTC Performance Prediction Method. ITTC-Rcomm. Proced. 7.5-02-03-01.4. 2018. Available online: https://www.wartsila.com/encyclopedia/term/ittc-performance-prediction-method (accessed on 23 February 2025).
Figure 1. Geometry of the 6.5K DWT tanker.
Jmse 13 00437 g001
Figure 2. Geometry of three propellers: (a) original propeller; (b) normal propeller; (c) Coanda propeller.
Jmse 13 00437 g002
Figure 3. Geometry of the cross-section of the applied nozzle slit (adapted from [24]).
Jmse 13 00437 g003
Figure 4. Geometry of three propellers: (a) resistance domain; (b) POW domain; (c) self-propulsion domain (yellow part: hull).
Jmse 13 00437 g004
Figure 5. Grid distribution for the resistance and POW simulation: (a) perspective view (bow); (b) perspective view (bow); (c) stern view (propeller).
Jmse 13 00437 g005
Figure 6. Geometry of the stern and propellers for a 6.5K DWT tanker: (a) original propeller; (b) normal propeller; (c) Coanda propeller.
Jmse 13 00437 g006
Figure 7. Comparison of the flow distribution around the hull: (a) nominal wake; (b) streamline (black line) and pressure coefficient (red circle: propeller diameter).
Jmse 13 00437 g007
Figure 8. Comparison of the POW curves between experiment and simulation.
Jmse 13 00437 g008
Figure 9. Coanda design point decision procedure.
Jmse 13 00437 g009
Figure 10. Conceptual diagram of pump power.
Jmse 13 00437 g010
Figure 11. Comparison of the pressure distribution around the stern. (a) nominal propeller; (b) Coanda propeller.
Jmse 13 00437 g011
Figure 12. Vortices visualized based on the Q-criterion at the stern: (a) original propeller; (b) normal propeller; (c) Coanda propeller.
Jmse 13 00437 g012
Figure 13. Vorticity intensity in the XZ plane around the propeller: (a) original propeller; (b) normal propeller; (c) Coanda propeller.
Jmse 13 00437 g013
Table 1. Main specifications of the objective ships (6.5K DWT tanker).
Main SpecificationsFull ScaleCFD Model
Ship speed (Fr)0.219
Scale ratio120
Length between perpendiculars, LPP (m)1025.10
Breadth, BWL (m)18.60.93
Draft, d (m)6.650.3325
Displacement, ∇ (m3)93661.171
Vertical center of gravity, KG (m)26726.680
Moment of inertia,
Ixx/B, Iyy/LPP, Izz/LPP
0.40, 0.25, 0.25
Table 2. Propeller principal particulars.
Main SpecificationsKP1364
Full-scale diameter (m)3.600
Model-scale diameter (m)0.180
Pitch ratio,
P/DP (0.7RP)
0.632
Thickness ratio,
t/D (0.7RP)
0.044
Chord ratio,
c/DP (0.7RP)
0.300
Number of blades4
Hub ratio0.180
Direction of rotationRight-handed
Table 3. Grid convergence test conditions.
VariablesFine GridMedium GridCoarse Grid
Number of grids
(at resistance test)
5,697,2482,976,7101,553,994
Number of grids
(at POW test)
7,068,2153,787,5442,028,383
Time step [s]
(at resistance test)
0.0050.0100.025
Table 4. Calculation of discretization error for resistance and POW test.
Resistance TestPOW Test
(J = 0.35)
POW Test
(J = 0.40)
POW Test
(J = 0.45)
ε210.7114.7852.0661.530
ε321.00011.4254.4182.584
r1.2421.2311.2311.231
R0.7100.4190.4680.592
GCI fine 21 , %3.6262.7471.6912.451
Table 5. Comparison of resistance performance at design ship speeds (without flow control fin).
CaseCTM (×103)τ (deg)σ/LPP (×102)
Exp.4.558--
Present CFD4.5030.234−0.217
Diff.−1.21%
Table 6. Comparison of resistance performance at various ship speeds (with flow control fin).
CaseVS (knots)CTM (×103)τ (deg)σ/LPP (×102)
Exp.12.04.2070.158−0.131
Present CFD4.1860.177−0.180
Diff.−0.49%0.019−0.049
Exp.13.04.3010.185−0.157
Present CFD4.3110.220−0.218
Diff.0.23%0.035−0.061
Exp.13.54.4410.203−0.175
Present CFD4.4510.225−0.235
Diff.0.23%0.023−0.061
Exp.14.04.6120.215−0.190
Present CFD4.7090.237−0.255
Diff.1.90%0.022−0.065
Exp.15.04.9080.255−0.220
Present CFD4.9700.269−0.300
Diff.1.26%0.014−0.080
Table 7. Propeller open-water test results of experiments and calculations.
Exp.Present CFD
JKT10KQηOKTDiff.10KQDiff.ηODiff.
0.100.25900.25050.16460.2565−1.0%0.25411.4%0.1606−2.4%
0.200.22110.22140.31790.2190−0.9%0.22451.4%0.3106−2.3%
0.300.18130.19020.45510.1801−0.7%0.19482.4%0.4414−3.0%
0.350.16120.17440.51500.1597−1.0%0.17872.5%0.4976−3.4%
0.400.14100.15840.56670.1387−1.6%0.16172.1%0.5460−3.6%
0.450.12050.14200.60780.1173−2.6%0.14361.1%0.5850−3.8%
0.500.09970.12500.63470.0957−4.0%0.1246−0.3%0.6112−3.7%
0.550.07810.10680.63970.0735−5.8%0.1042−2.4%0.6175−3.5%
0.600.05520.08680.60730.0506−8.3%0.0826−4.8%0.5852−3.6%
Table 8. Self-propulsion factors in calm water.
WTMWTS1−tηHηRηOηDRPMPD (kW)
Exp.---1.1281.0020.5690.643204.52399
Present CFD0.3560.3050.7951.1451.0460.5480.656203.32344
Diff. (%) 1.54.4−3.72.0−0.6−2.3
WTM, WTS, and t represent the model wake faction, full-scale wake fraction, and the thrust deduction, respectively.
Table 9. Comparison of self-propulsion performance at the design ship speeds (without flow control fin).
CaseOriginal Prop.Normal Prop.Coanda Prop.
RPSM15.86516.72415.012
KTM0.1630.1450.176
QTM (Nm)0.8330.859-
PW (W)--24.7
wTM0.3720.3260.280
tM0.1590.1500.128
ηH1.3401.2611.211
ηR1.0351.0311.000
ηO0.5060.4941.881
ηP--0.500
ηM--0.667
ηD0.7010.6430.759
PE (W)56.356.356.3
PD (W)80.287.674.1
Diff. of PD (%)-9.0−7.8
Disclaimer/Publisher’s Note: The statements, opinions and data contained in all publications are solely those of the individual author(s) and contributor(s) and not of MDPI and/or the editor(s). MDPI and/or the editor(s) disclaim responsibility for any injury to people or property resulting from any ideas, methods, instructions or products referred to in the content.

