Article

Data-Driven Approach to Safety Control in Jacket-Launching Installation Operations

School of Naval Architecture and Ocean Engineering, Jiangsu University of Science and Technology, Zhenjiang 212000, China
*
Author to whom correspondence should be addressed.
J. Mar. Sci. Eng. 2025, 13(3), 554; https://doi.org/10.3390/jmse13030554
Submission received: 20 February 2025 / Revised: 4 March 2025 / Accepted: 11 March 2025 / Published: 13 March 2025
(This article belongs to the Special Issue Advances in Marine Engineering Hydrodynamics)

Abstract

:
Installing offshore wind jackets faces increasing risks from dynamic marine conditions and is challenged by trajectory deviations due to coupled hydrodynamic and environmental factors. To address the limitations of software, such as long simulation times and tedious parameter adjustments, this study develops a rapid prediction model combining Radial Basis Function (RBF) and Backpropagation (BP) neural networks. The model is enhanced by incorporating both numerical simulation data and real-world measurement data from the launching operation. The real-world data, including the barge attitude before launching, jacket weight distribution, and actual environmental conditions, are used to refine the model and guide the development of a fully parameterized adaptive controller. This controller adjusts in real time, with its performance validated against simulation results. A case study from the Pearl River Mouth Basin was conducted, where datasets—capturing termination time, six-degrees-of-freedom motion data for the barge and jacket, and actual environmental conditions—were collected and integrated into the RBF and BP models. Numerical models also revealed that wind and wave conditions significantly affected lateral displacement and rollover risks, with certain directions leading to heightened operational challenges. On the other hand, operations under more stable environmental conditions were found to be safer, although precautions were still necessary under strong environmental loads to prevent collisions between the jacket and the barge. This approach successfully reduces weather-dependent operational delays and structural load peaks. Hydrodynamic analysis highlights the importance of directional strategies in minimizing environmental impacts. The model’s efficiency, requiring a fraction of the time compared to traditional methods, makes it suitable for real-time applications. Overall, this method provides a scalable solution to enhance the resilience of marine operations in renewable energy projects, offering both computational efficiency and high predictive accuracy.

1. Introduction

In recent years, the rapid development and construction of offshore wind power resources have significantly enhanced the utilization of marine resources. As offshore wind power projects extend into deeper waters, the size and complexity of jacket structures have increased accordingly [1]. Deepwater jackets, as critical facilities for deep-sea oil and gas development, primarily function to support and protect subsea pipelines through a combination of vertical conduits and horizontal frameworks.
Among the common installation methods for jackets, sliding launch and crane lifting are widely used [2,3]. Sliding launch, in particular, is preferred for its high efficiency and adaptability. However, the process involves complex dynamic behaviors and is influenced by a variety of environmental factors and operational conditions. The safety of the sliding launch depends on the interaction of several critical parameters, including sliding velocity, the clearance between the launch trajectory and the seabed, jacket stability, and ballast configuration during operations [4]. When the sliding force generated by the self-weight of the jacket is greater than its frictional force, the jacket begins to slide down by its weight and move away from the barge on its own. If the aft tilt of the barge approaches the design angle and the jacket still cannot slide down, the assist system arranged at the tail of the jacket can be used to push the jacket down [5]. Furthermore, as the stress and motion state of the jacket change dynamically during the launch process, predicting its trajectory and structural forces under varying sea conditions is essential for guiding actual engineering operations.
Research on sliding launch began in the 1980s, with international scholars conducting in-depth studies by combining ship motion theory and wave mechanics. Mayfield et al. [6] introduced the launching situation of Bullwinkle pipe racks from an engineering perspective. Sircar et al. [7] provided a detailed introduction to the analysis method for the launching process of the Kilauea pipeline rack. Campbell et al. [8] conducted real-time monitoring and analysis of the underwater motion process of the SYU jacket. Vasicek and Lu [9] proposed a numerical model for jacket-sliding launches based on an iterative finite difference method, while Sphaier et al. [10] explored the theoretical framework of launch modeling software. Additionally, Jo et al. [11] analyzed the effects of barge and jacket dimensions, as well as initial barge conditions, on the launch process using SACS software. Their findings indicated that increasing the draft and trim angle of the barge could reduce the mean and impact loads on the jacket, although these parameters had minimal influence on its dive depth. Xiong et al. [12] conducted comparative studies on a typical jacket-sliding launch through model tests and numerical simulations, while Sunder and Connor [13] investigated the sensitivity of steel jackets to environmental wave loading using simplified numerical models. Honarvar et al. [4] studied the mechanics of the jacket-sliding process and validated their numerical simulations through comparisons with actual engineering data. Recent studies, such as those by Welzel et al. [14], have further examined the vertical positioning of conduit sleeves under varying wave headings by analyzing heave, roll, and pitch motions.
The sliding launch of a jacket is a dynamic and continuous nonlinear process that requires real-time monitoring of the barge trajectory and the jacket’s posture to ensure structural stability. Research has shown that initial barge inclination, draft, and the friction coefficient between the barge and the jacket significantly impact dynamic responses during the sliding launch [15]. Additionally, environmental factors such as wave period, wave height, and wind–wave–current interactions play a critical role. Due to the real-time variability of marine conditions, the natural period and response amplitude operator (RAO) of the jacket dynamically adjusts, leading to notable differences in motion responses across various locations. Meanwhile, understanding hydrodynamic wave forces is essential for accurately predicting the jacket’s response during launch. Cheng Y et al. [16,17] explored wave energy converters (WECs) and floating breakwaters, revealing that complex wave–structure interactions can significantly alter local hydrodynamic conditions. These insights are particularly relevant for sliding launch scenarios, where wave-induced forces can impact the jacket’s stability and trajectory. Similarly, Zhiming Yuan et al. [18] investigated multi-mode wave energy converters surrounding a floating platform, highlighting the importance of wave diffraction and radiation effects, which must be considered when analyzing wave forces acting on the jacket and barge system.
Moreover, recent studies have emphasized gap resonance and hydrodynamic interactions between multiple floating structures, which can provide valuable insights for understanding wave loads on the barge–jacket system during launch. Chenglong Mi et al. [19] examined gap resonance effects between a stationary box and a vertical wall under transient focused wave groups, demonstrating how localized wave amplification could influence offshore structures. Similarly, Junliang Gao et al. [20,21] studied the impact of floater motion on wave loads in gap resonance scenarios and analyzed hydrodynamic forces on two side-by-side barges subjected to nonlinear focused wave groups. These findings suggest that when a jacket is launched from a barge, similar wave trapping and resonance effects may occur, potentially amplifying wave forces and altering the jacket’s motion. Incorporating these hydrodynamic phenomena into sliding launch simulations can enhance the accuracy of trajectory predictions and improve safety measures. Although traditional numerical simulation methods have been widely used to predict jacket-launching behavior, their high computational cost and lack of real-time capability make them less effective for providing immediate guidance during offshore operations. To address this issue, this study focuses on the sliding launch of a subsea pipeline rack in the South China Sea and proposes a new approach that integrates the Radial Basis Function (RBF) neural network with the Backpropagation (BP) neural network to enhance prediction accuracy and computational efficiency while overcoming the inefficiencies of conventional numerical simulations.
This approach incorporates findings from Mingxin Li et al. [22,23] on ship-induced wash waves and Mingxin Li et al. [24,25] on multi-body hydrodynamic interactions, developing a hybrid predictive model that combines numerical simulations with machine learning techniques. By utilizing commercial software (Python 3.11.x), this study simulates the motion trajectory and mechanical response of the jacket under different sea conditions and constructs a dataset for termination time and six-degrees-of-freedom (6DOF) motion. Specifically, the RBF neural network is employed for the rapid prediction of termination time, while the BP neural network models the motion response of the jacket, enabling efficient forecasting of the entire sliding launch process. Furthermore, this study analyzes key characteristics such as the vertical motion of the center of gravity, velocity and acceleration trends, and rocker arm pressures, providing valuable technical insights and optimization strategies to ensure the safe sliding launch of jackets under complex wind and wave conditions.

2. Calculation Theory of Launching Force and Environment of Jacket

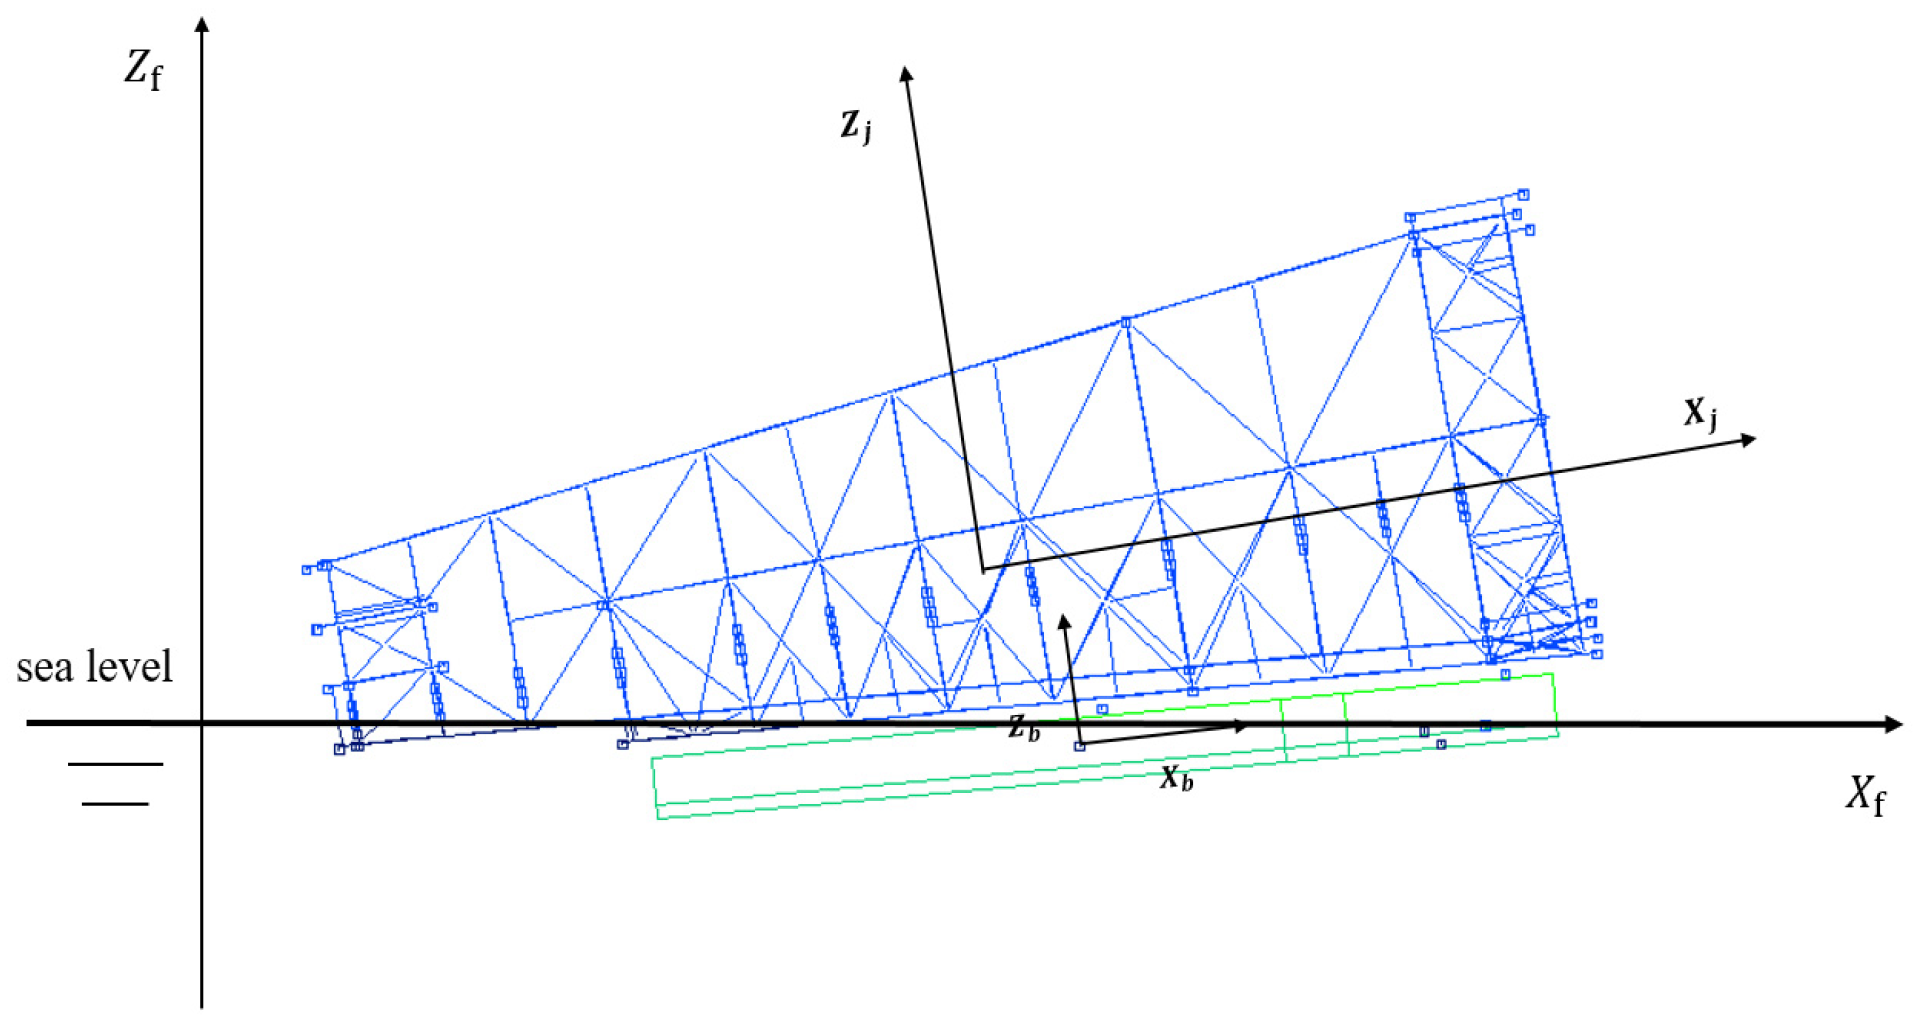
2.1. Two-Dimensional Equation of Jacket-Launching System

As shown in Figure 1, the origin of the absolute coordinate system is taken at the moment of the jacket’s self-motion, the intersection of the vertical line of the rocker pin shaft with the sea level, the X f direction along the barge lengthwise, and the Z f -axis vertically upward. With the center of the bow of the barge as the coordinate origin, the longitudinal direction of the barge is the X b -axis, the port direction is the positive direction, and the vertically upward direction is the Z b -axis. The origin O j of the jacket, the coordinate system, is set at the centroid of the jacket, with the X j -axis parallel to the pile leg in contact with the barge skid and the Z j -axis pointing vertically upwards from X j . As shown in Figure 2, take the direction of 180° relative to the bow direction and 0° relative to the transom direction. Take the counterclockwise direction as the angle increases direction.
For the convenience of system simulation and solution, and based on the two-dimensional motion characteristics of the system, the following simplifications and assumptions are made from an engineering perspective:
(1)
Only the motion within the vertical longitudinal plane is considered, including pitch, heave, and surge motions. Roll, sway, and yaw motions are neglected, meaning the system’s rotation around the x-axis and y-axis, as well as lateral displacement along the z-axis, are ignored.
(2)
Before the jacket detaches from the barge, it is assumed that the legs in contact with the barge’s skidway remain in contact at all times, with no separation occurring between the legs and the skidway.
(3)
The asymmetry of the jacket structure may cause asymmetrical gravitational and hydrodynamic forces, leading to barge roll and yaw motions. However, since the numerical values of these motions are relatively small, they are neglected in this analysis.
(4)
Wind, waves, and currents are assumed to be independent and non-interfering. The system’s oscillations in waves are considered small, and only the effects of regular waves are taken into account.
The software simulates the launching process of the jacket in the time domain and obtains the movement attitude and force of each state in the launching process of the jacket. The launching time domain simulation program was developed on the basis of commercial software built-in macro commands, and the barge and jacket were treated as two independent six-free rigid bodies, both of which moved relative to the rocker’s arm through the slipway. In order to facilitate the calculation, the two-dimensional plane motion equation is adopted to simplify the motion process. The following symbols represent the following:
KG is the longitudinal stability recovery arm of the barge, and T j is the angular acceleration vector of the pipe rack.
I b ,   I s b   and   I j , I s j are the moments of inertia of the barge and the jacket and its additional water mass moment of inertia, respectively.
G j , m j , and M j are the gravity, mass of the jacket, and its additional water mass, respectively.
G b , m b , and M b are the gravity, mass of the barge, and its additional water mass, respectively.
M I j , M H j , M W j , and M B j are the moments of hydrodynamic, wind, and buoyancy forces on the center of gravity of the jacket, respectively.
M I b , M H b , M W b , and M B b are the moments of hydrodynamic, wind, and buoyancy forces on the center of gravity of the barge, respectively.
F H b , F W b , and F B b represent the hydrodynamic, wind, and buoyancy vectors of the submerged part of the barge, respectively.
F H j , F W j , and F B j represent the hydrodynamic, wind, and buoyancy vectors of the submerged part of the jacket, respectively.
The specific equation is as follows:
(1)
Initial state equation
Calculate the position in the absolute coordinate system at which the jacket begins to move:
F X j b , T j = 0 , M X j b , T j = 0
Expand the merge to obtain the following:
X j b = G j F B Z j b sin T j M B + G j + G b F B K G / G j F B cos T j
(2)
The jacket movement equation when the slide movement
M j x + G j / g a X j f = u N cos T j N sin T j + F H x M j z + G j / g a Z j f = N cos T j + u N sin T j + F H z + F B G j M b x + G b / g a X b f = u N cos T j + N sin T j M b z + G b / g a Z b f = N cos T j u N sin T j + F B b G b I s b + I b a T b = N X n b + u N Z n b + K G F B I s j + I j a T j = N X n j + u N Z n j + M B + M H
The supporting force N relative to the center of gravity position of the jacket is converted to the coordinates X n b , Z n b relative to the barge.
(3)
The corresponding motion equation of the jacket in the process of rocker arm flipping
M j x + G j / g a X i f = N x cos T j N z sin T j + F H x M j z + G j / g a Z j f = N z cos T j + N x sin T j + F H z + F B G j M b x + G b / g a X b f = N x cos T j + N z sin T j M b z + G b / g a Z b f = N z cos T j N x sin T j + F B b G b I s b + I b a T b = N x cos T j + N z sin T j Z p f + Z b f + N z cos T j N x sin T j X p f X b f + K G F B I s j + I j a T j = N z X n j + N x Z j h + M B + M H I p a T j = N x Z p h N z X n p
Among them, Z j h and Z p h are known, representing the height from the center of gravity of the jacket to the slideway surface and the height from the slideway surface to the pin shaft center.
(4)
Equation of motion for the jacket as it simultaneously rotates and slides on the rocker arm
M j x + G j / g a X i f = u N cos T j N sin T j + F H x M j z + G j / g a Z j f = N cos T j + u N sin T j + F H z + F B G j M b x + G b / g a X b f = u N cos T j + N sin T j M b z + G b / g a Z b f = N cos T j u N sin T j + F B b G b I s b + I b a T b = u N cos T j + N sin T j Z p f + Z b f        + N cos T j u N sin T j X p f X b f + K G F B I s j + I j a T j = N X n j + u N Z j h + M B + M H I p a T j = u N Z p h N X n p
(5)
Equation of movement after jacket disengagement
M j x + G j / g a X j f = F H x M j z + G j / g a Z j f = F H z + F B G j I s j + I j a T j = M B + M H

2.2. Selection of Rapid Forecasting Methods

Radial Basis Function (RBF) neural networks are three-layer feedforward neural networks characterized by the use of Radial Basis Functions as the activation functions in their hidden layer neurons [26]. The training process for RBF networks involves two distinct steps: clustering algorithms are used to determine the parameters of the hidden layer, while linear regression is employed to optimize the output layer parameters. RBF neural networks exhibit superior local approximation capabilities, which are not easily achievable with other neural network architectures. This makes them advantageous for tasks requiring faster convergence and simpler structures compared to global approximation networks such as Backpropagation (BP) neural networks.
However, the performance of RBF neural networks is highly dependent on the quality and coverage of the dataset. They require datasets that comprehensively cover the input space and include a sufficiently large number of samples. Moreover, for multi-output tasks or large datasets, RBF networks often require a substantial number of neurons in the hidden layer, leading to increased network complexity and potential performance degradation. Given these considerations, this study employs an RBF neural network to predict the termination time of jacket sliding, leveraging its approximation properties in alignment with the characteristics and scale of the dataset.
In contrast, Backpropagation (BP) neural networks, trained using the error Backpropagation algorithm, allow for greater flexibility in network design. By increasing the number of hidden layers or neurons, BP neural networks can adapt their depth and structural complexity to suit multi-output tasks and large datasets. This adaptability enables BP neural networks to better capture intricate features within the data, thereby enhancing predictive accuracy and generalization capabilities. In this study, the BP neural network uses the rectified linear unit (ReLU) [27] as the activation function and the mean square error (MSE) as the loss function. The BP neural network is employed to predict the six-degrees-of-freedom (6DOF) motion of the barge and the jacket’s center of gravity, tasks that require capturing complex spatial and temporal relationships. To ensure the reliability and generalization of both neural network models, several optimization strategies are implemented during the training process. These include input data preprocessing, parameter initialization, mini-batch gradient descent, and adaptive learning rate adjustment, all of which contribute to improved training efficiency and model performance.
Using the termination time dataset for jacket sliding and the 6DOF motion data for the barge and jacket’s center of gravity, RBF and BP neural network models are developed [28]. The RBF model predicts the termination time of jacket sliding under varying working conditions by generating time-series data at fixed intervals (1.00 s). This output, along with the working condition data, serves as input for the BP neural network, which predicts the 6DOF motion of the barge and jacket center of gravity. Both models were implemented in Python (Python 3.11.x), resulting in a rapid and effective prediction framework for jacket-sliding processes.

3. Jacket-Launching System

The jacket-launching system primarily consists of the jacket, transportation barges, slideways, rocker arms, and other auxiliary launching facilities, such as the traction system and barge ballast system. The barge supports the entire weight of the jacket via the slideway, with the jacket making contact with the barge slide through a slide shoe. This contact reduces the friction coefficient, facilitating the smooth sliding of the jacket into the water from the barge. The rocker arm device is located at the end of the barge slideway. It consists of a main and a secondary steel rocker arm, both connected to the stern of the hull via a steel plate-welded base. The rocker’s arm rotates around a pin shaft to ensure the smooth launching of the jacket. In the long-term development process, software jacket-launching analysis can simplify the launching design and analysis process through parameter setting and integrate the ballast calculation function to analyze the transverse launching process of the resulting object and the launching process of multiple ships, and the launching simulation results have quite high accuracy. Commercial software can solve the basic idea of floating body motion response under irregular waves. In the calculation, it is necessary to select the appropriate spectral parameters according to the actual situation of the ocean so as to calculate the movement response of barge and jacket and barge as an important reference for the analysis of barge structural strength.

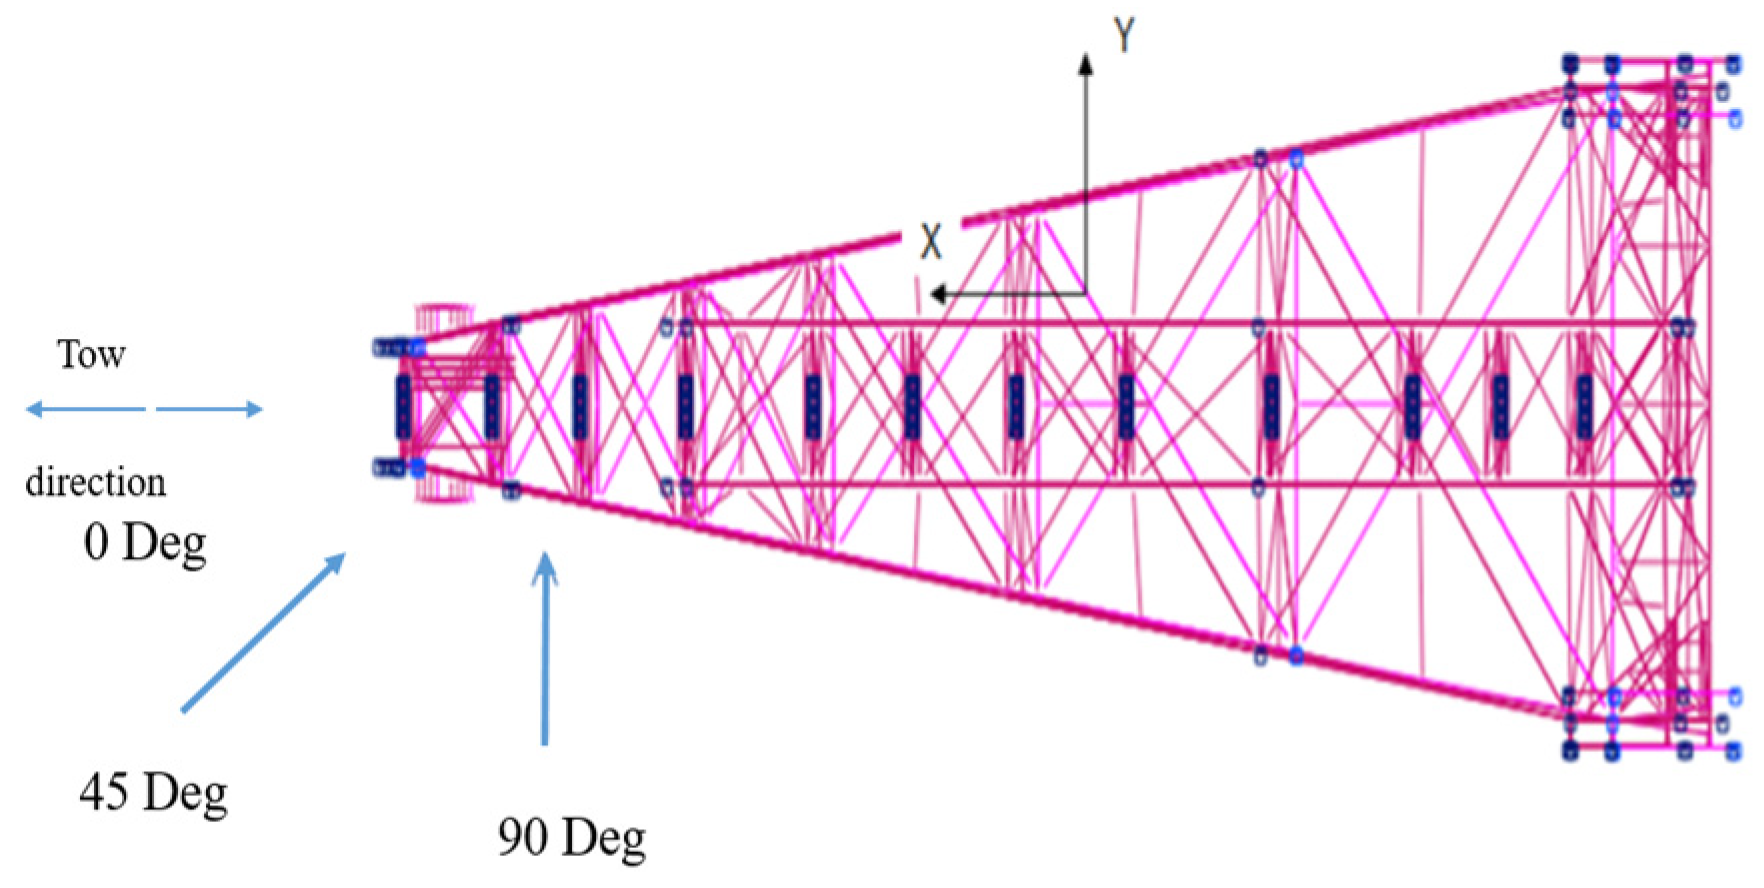
3.1. Establishment of Barge and Jacket Model

The jacket launch system consists of the jacket, transport barge, slide way, yaw arm, and various auxiliary components, such as the towing and barge ballast systems. At the start of the operation, the barge’s bow draft is 3.62 m, with a pitch angle of 4° and a mean draft of 11.5 m, as detailed in Table 1. The sliding friction coefficient between the slider and the shoe is 0.05, and the slider’s endpoint is 215 m from the bow. The analysis results confirm that the launch meets the requirements of the Noble Denton standard and project guidelines. To complement the technical description, Figure 3 presents a photograph taken at the launch site, capturing the precise moment the jacket is released from the barge, thereby offering a comprehensive view of the operational arrangement.
Before the departure of the barge, installation work was conducted on stress sensors placed on the pipe rack rods and barge rocker arms. The installation process involved polishing the contact points, cleaning the installation surfaces, attaching the sensors, securing the wiring, installing protective covers, and organizing the sensor lines.
The jacket weighs 30,380 tons, with its center of gravity positioned 54.07 m above the slideway. The water depth is 283 m, and the wave height is 2 m. Wave directions are evaluated at 45° intervals, with a wave period of 2 s. For simplicity, wind and wave directions are assumed to align, and their speeds are considered equal. The chosen sea conditions are based on comprehensive statistical data, reflecting typical regional marine environments. Extreme sea conditions are excluded as launch operations are not conducted under such scenarios.

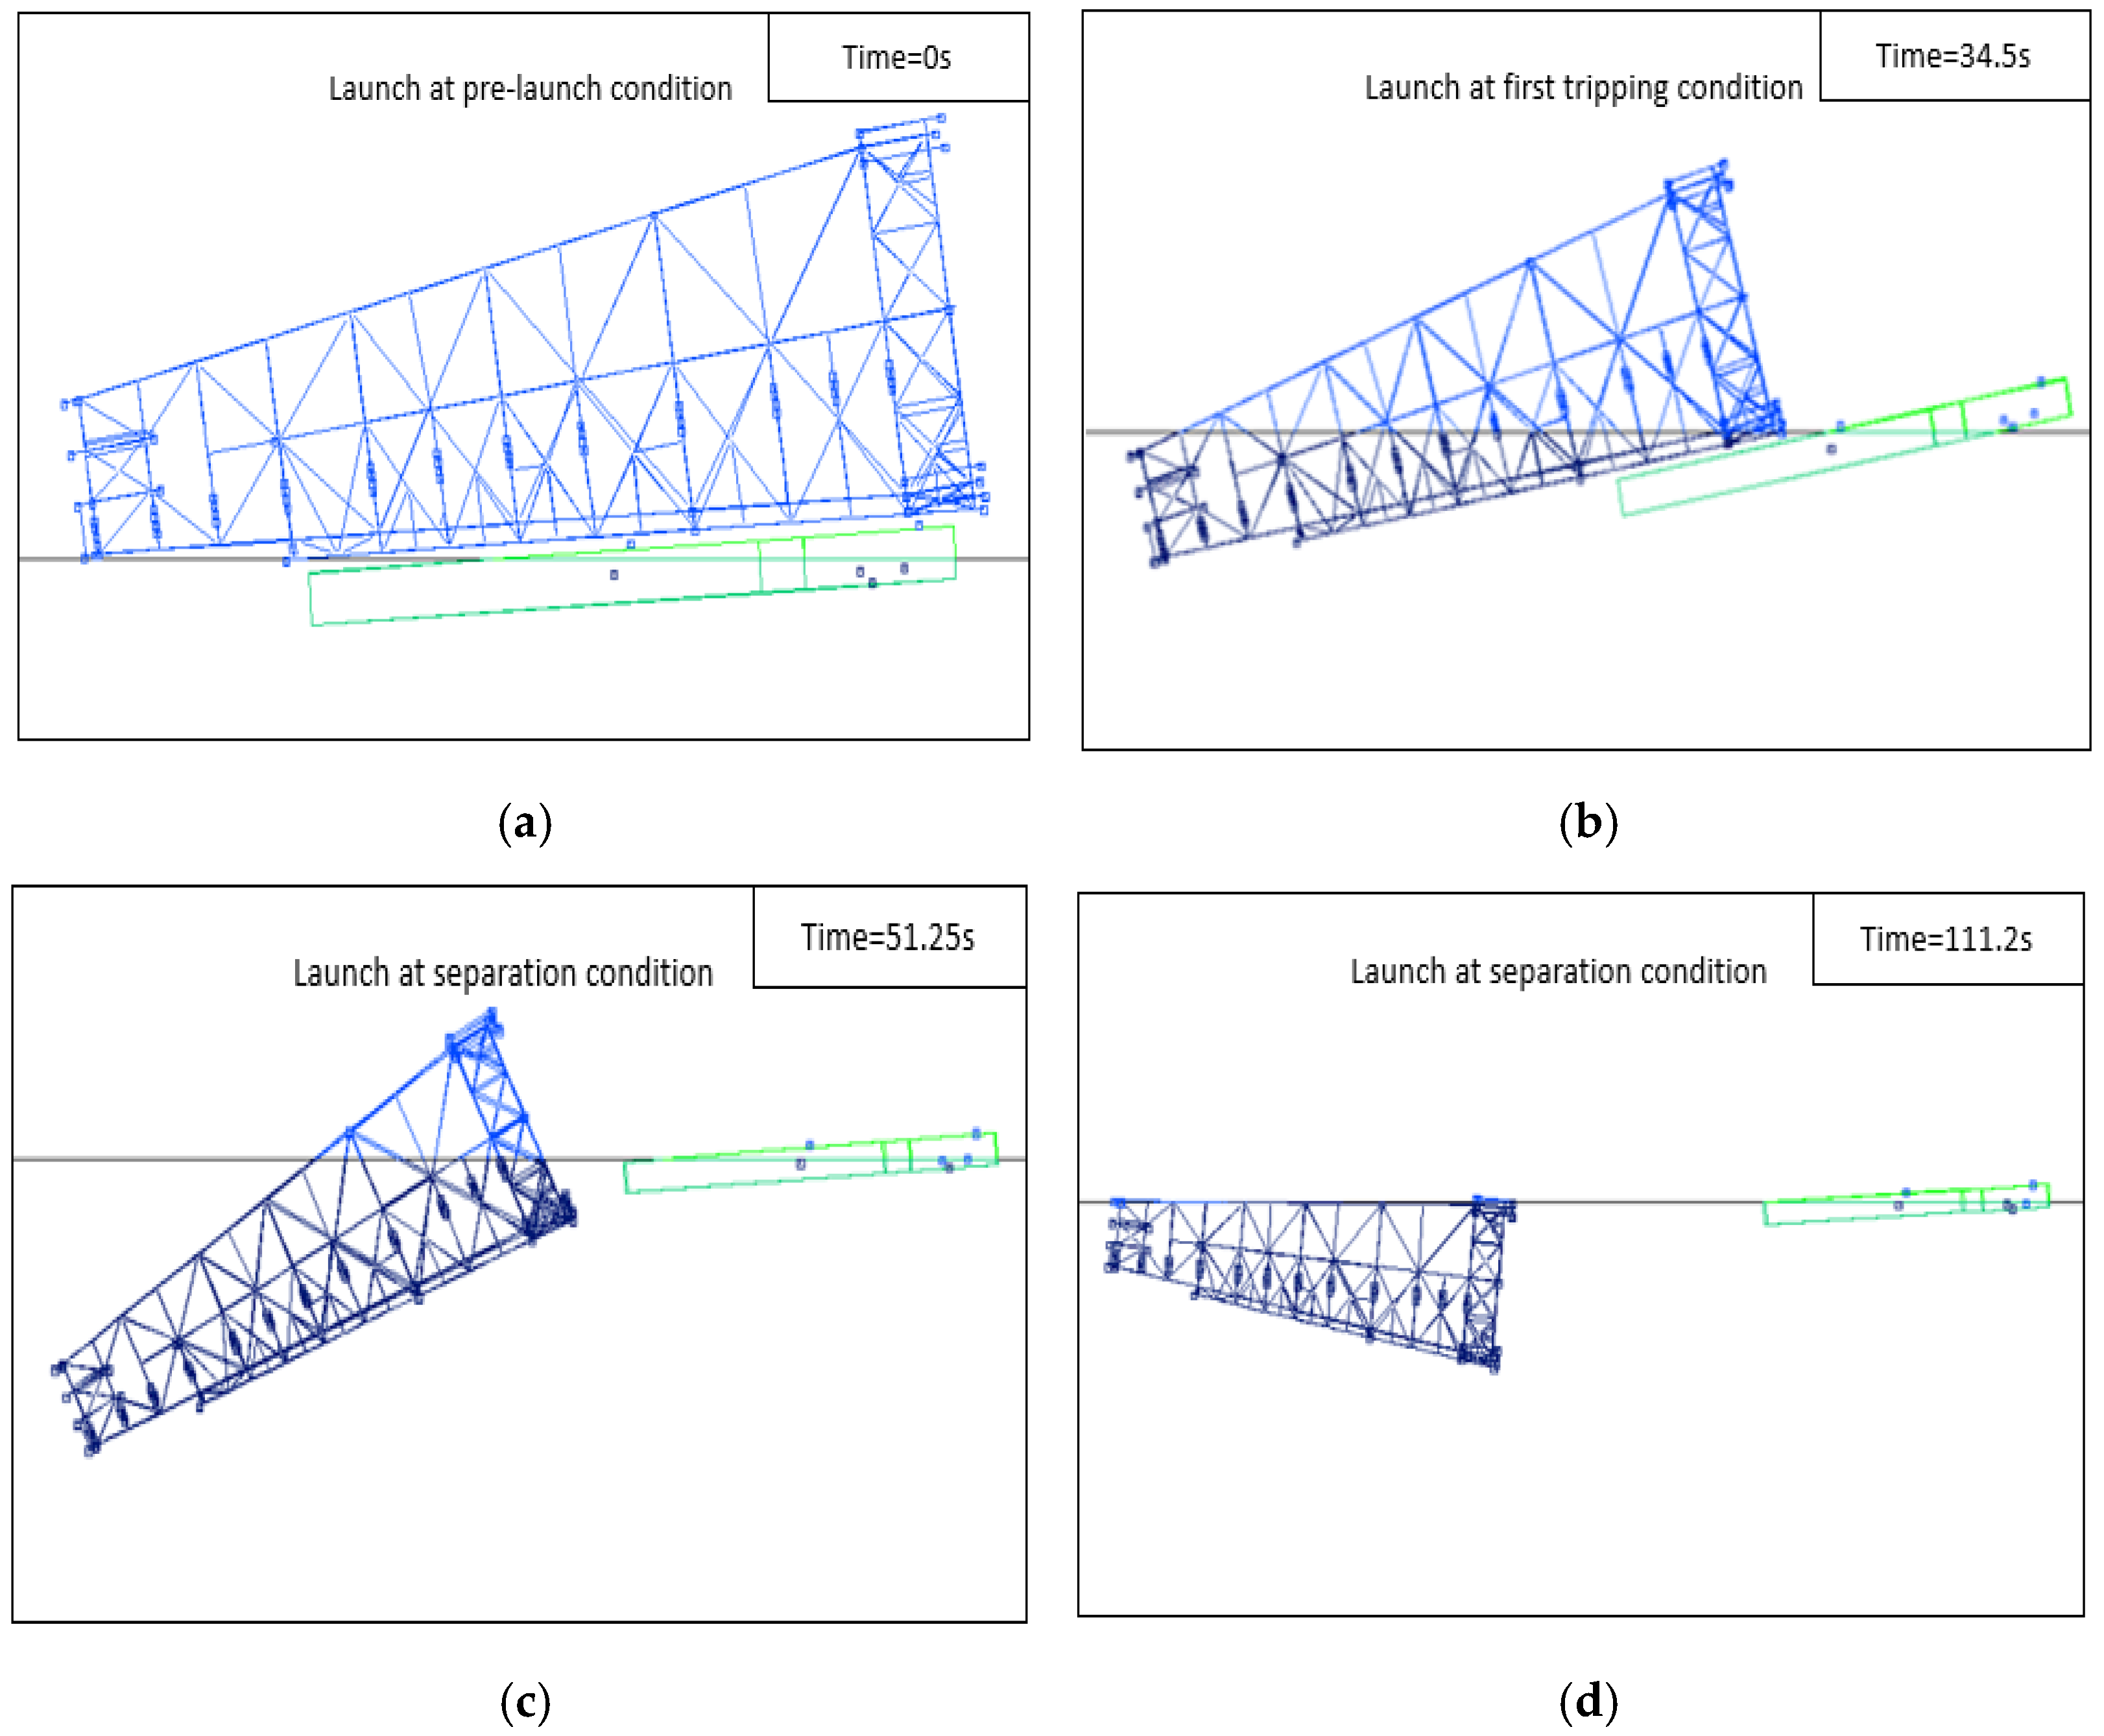
3.2. Launching Condition

A dedicated launching barge is employed for the loading, transportation, and launching of pipeline racks, which generally involves three main stages: sliding the pipeline rack onto the barge; towing the barge; and launching and positioning the pipeline rack. The friction coefficient during the launching process plays a critical role in the overall success of the operation. In simulation calculations using commercial software, an initial sliding speed of 0.3 m/s was set along the slide to ensure the smooth launch of the pipeline rack, accounting for various completion times. The thrust speed is key to ensuring the successful completion of the launching process.
The process is divided into several distinct calculation states: the guide frame begins sliding from a stationary state; before the guide frame flips over; after the guide frame flips over; before the guide frame separates from the barge; and after the guide frame is released from the barge. Among these, the separation from the barge is the most critical phase. This stage presents an extreme challenge to both the structural integrity and force distribution of the barge. As the jacket slides away, the rapid shift in the center of gravity results in severe dynamic loads acting on the barge. If the force distribution is uneven or exceeds the design safety limits, it may lead to structural damage or even catastrophic failure.
Furthermore, the separation stage has a profound impact on the barge’s stability. Given the substantial mass of the pipeline rack, the gravitational force generated during the sliding process can induce lateral or longitudinal imbalance in the barge, heightening the risk of overturning. Therefore, analyzing and optimizing this stage should be the primary focus of future research to ensure the safety and effectiveness of the launching operation. The entire process of launching the jacket is shown in the following Figure 4.

4. Results Analysis

According to the provided parameters of the jacket and barge, the environmental parameters are set to simulate a level-3 sea state, and the launching process of the jacket under different waves is analyzed. The environmental parameters are set to a wave height of 2.1 m, a wind speed of 11.4 knots with a period of two seconds, a flow velocity of 1 m, and a wave direction of 0–180° (data set every 45°). Focusing on 50–65 s of the jacket release from the barge, the total calculation time of the launching process to be controlled within 120 s is set, or the jacket enters the water and vibrates five times. Since the jacket has slipped from the barge into the water, and there are still many design data points after detachment, collecting points in the entire time domain may lead to an image lacking reference to the launching process of the jacket in the second half. Therefore, in processing the contact force data between the jacket and the slide, as well as the side wall of the slide, the calculation value of the pin shaft force in the entire launching process concludes after the pin shaft. However, parameters related to the movement of the jacket itself, such as the speed and acceleration of the jacket, and the trajectory of each coordinate axis of the jacket are processed using data values across the entire time domain.

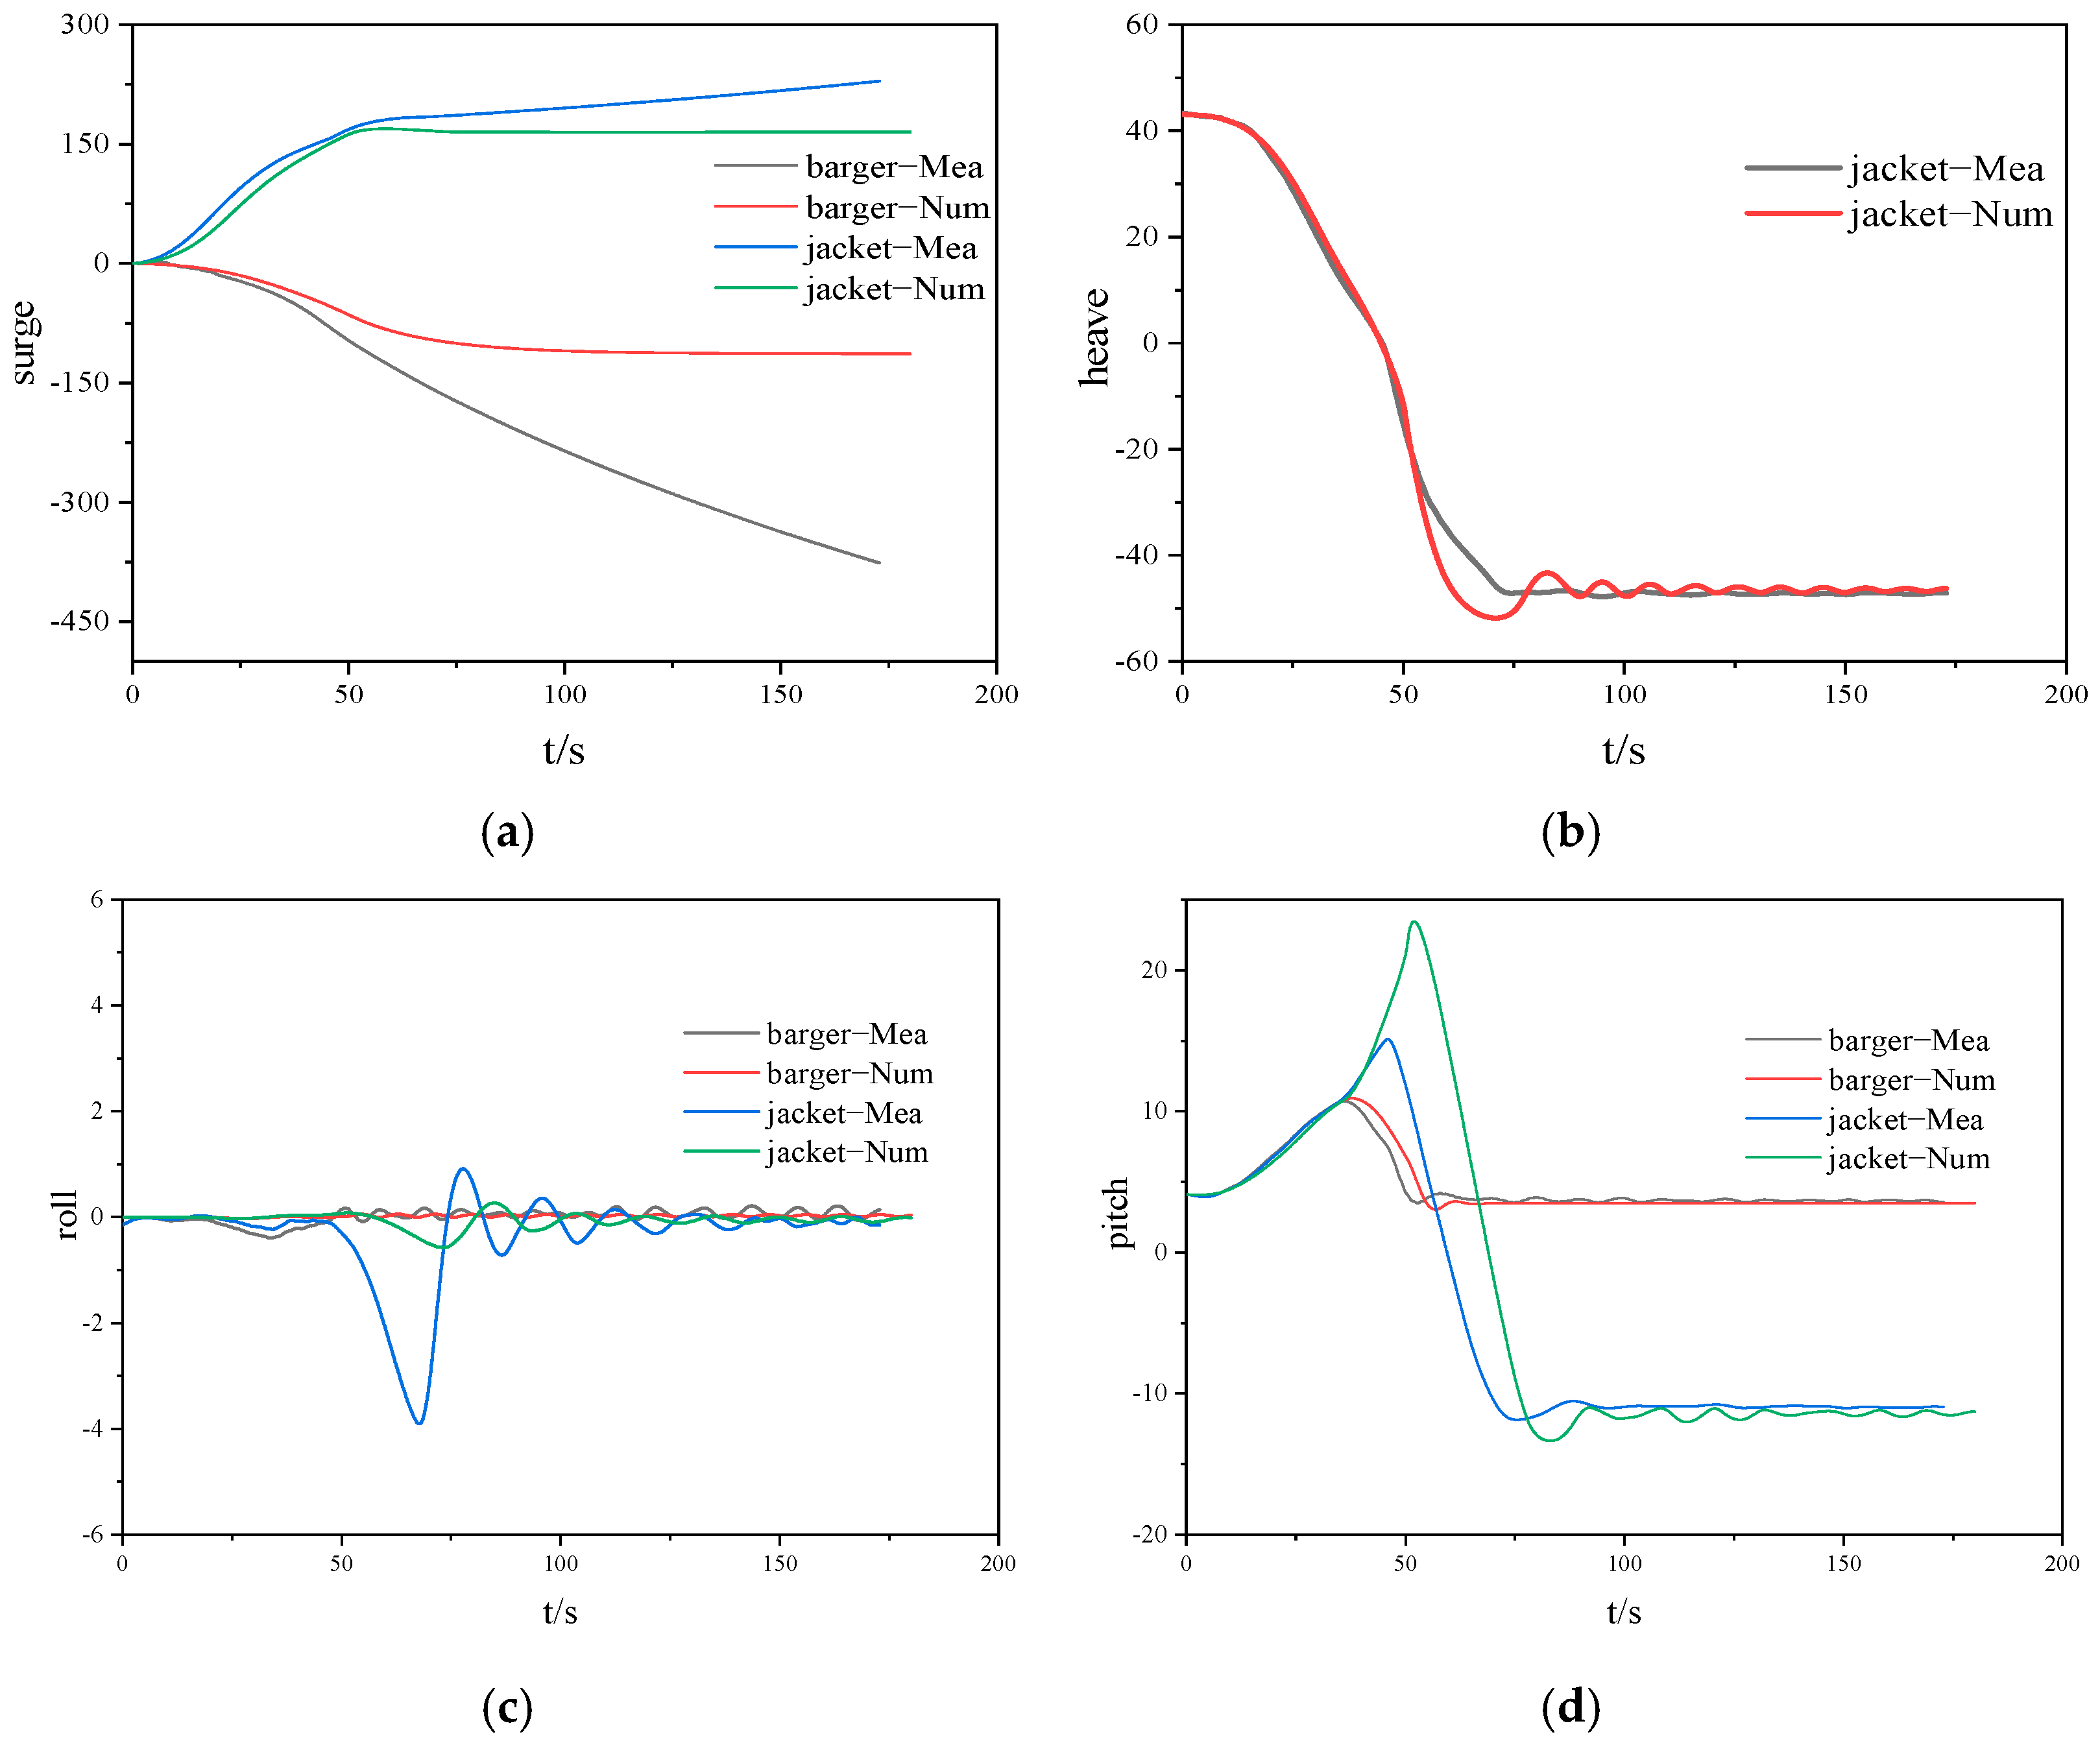
4.1. Comparative Analysis of Measured and Simulated Results of Six-Degrees-of-Freedom Motion

Field measurements, when compared to simulation data, are essential for calibrating the accuracy of simulation models. In pile installation operations, simulations are typically based on theoretical assumptions and standard conditions. However, real-world conditions—such as wind speed, wave variations, and tidal fluctuations—introduce uncertainties. Data from on-site sensors help reveal these uncertainties and adjust the simulation models accordingly. For example, actual environmental conditions (e.g., wind speed and wave height) may differ from assumptions, and field data feedback enables real-time corrections, improving model accuracy. Although simulation technology is advanced, errors can arise due to the difficulty in predicting many field factors, especially nonlinear effects and environmental fluctuations. For instance, models may underestimate these factors, resulting in discrepancies with actual data. Real-time field data on load, structural response, and movement trajectories can help identify such discrepancies and refine the model, enhancing its accuracy. Importantly, field data reflect the dynamic nature of real operating environments. While simulations rely on standardized assumptions, factors like sea conditions and wind strength are highly variable, making them challenging to fully account for in models. On-site sensors capture these dynamic changes, providing feedback that enhances the credibility of simulation results and increases operational flexibility. In conclusion, field measurement data are crucial for both validating simulation models and optimizing safety controls in pile installation. Given the uncertainties of the marine environment and complex structural behavior, field data calibrate models to align with real-world conditions, supporting safety management decisions and improving operational safety and efficiency.
The comparison and analysis of the measured results and simulation results of the heave, sway, heave, pitch, roll, and bow sway of the barge and the jacket in the initial state are shown in Figure 5.
A comparison of the movements in six directions during the launching process shows that the motion trends of both the barge and the jacket generally align with numerical simulations. The measured heave motion of the jacket closely matches the simulations. However, discrepancies exist, primarily due to environmental or operational factors. The pipeline rack’s longitudinal oscillation (x-direction) deviated from the simulations, which assumed static water conditions. In reality, waves, currents, and wind-caused additional oscillations are not accounted for in the model. The measured sway was smaller than predicted, likely due to damping effects from the surrounding water and the barge’s structural response. A roll motion, induced by the barge’s initial momentum and uneven displacement, was observed during launching but was not captured in the simulations, which assumed a stable platform in static water. The lateral displacement of the pipeline rack showed smaller errors compared to the simulation, but environmental factors such as wave motion and barge drift resulted in less-pronounced lateral movement than predicted. This suggests the simulations may have overestimated lateral motion under more extreme wave conditions. The lateral displacements between the pipeline rack and the barge deviated more from the static water model, likely due to unaccounted environmental influences, such as wind and hydrodynamic effects. Finally, the minimal deviation in bow sway under static conditions became more pronounced under operational conditions due to the combined effect of wind, waves, and currents, which caused the barge to move more than predicted.

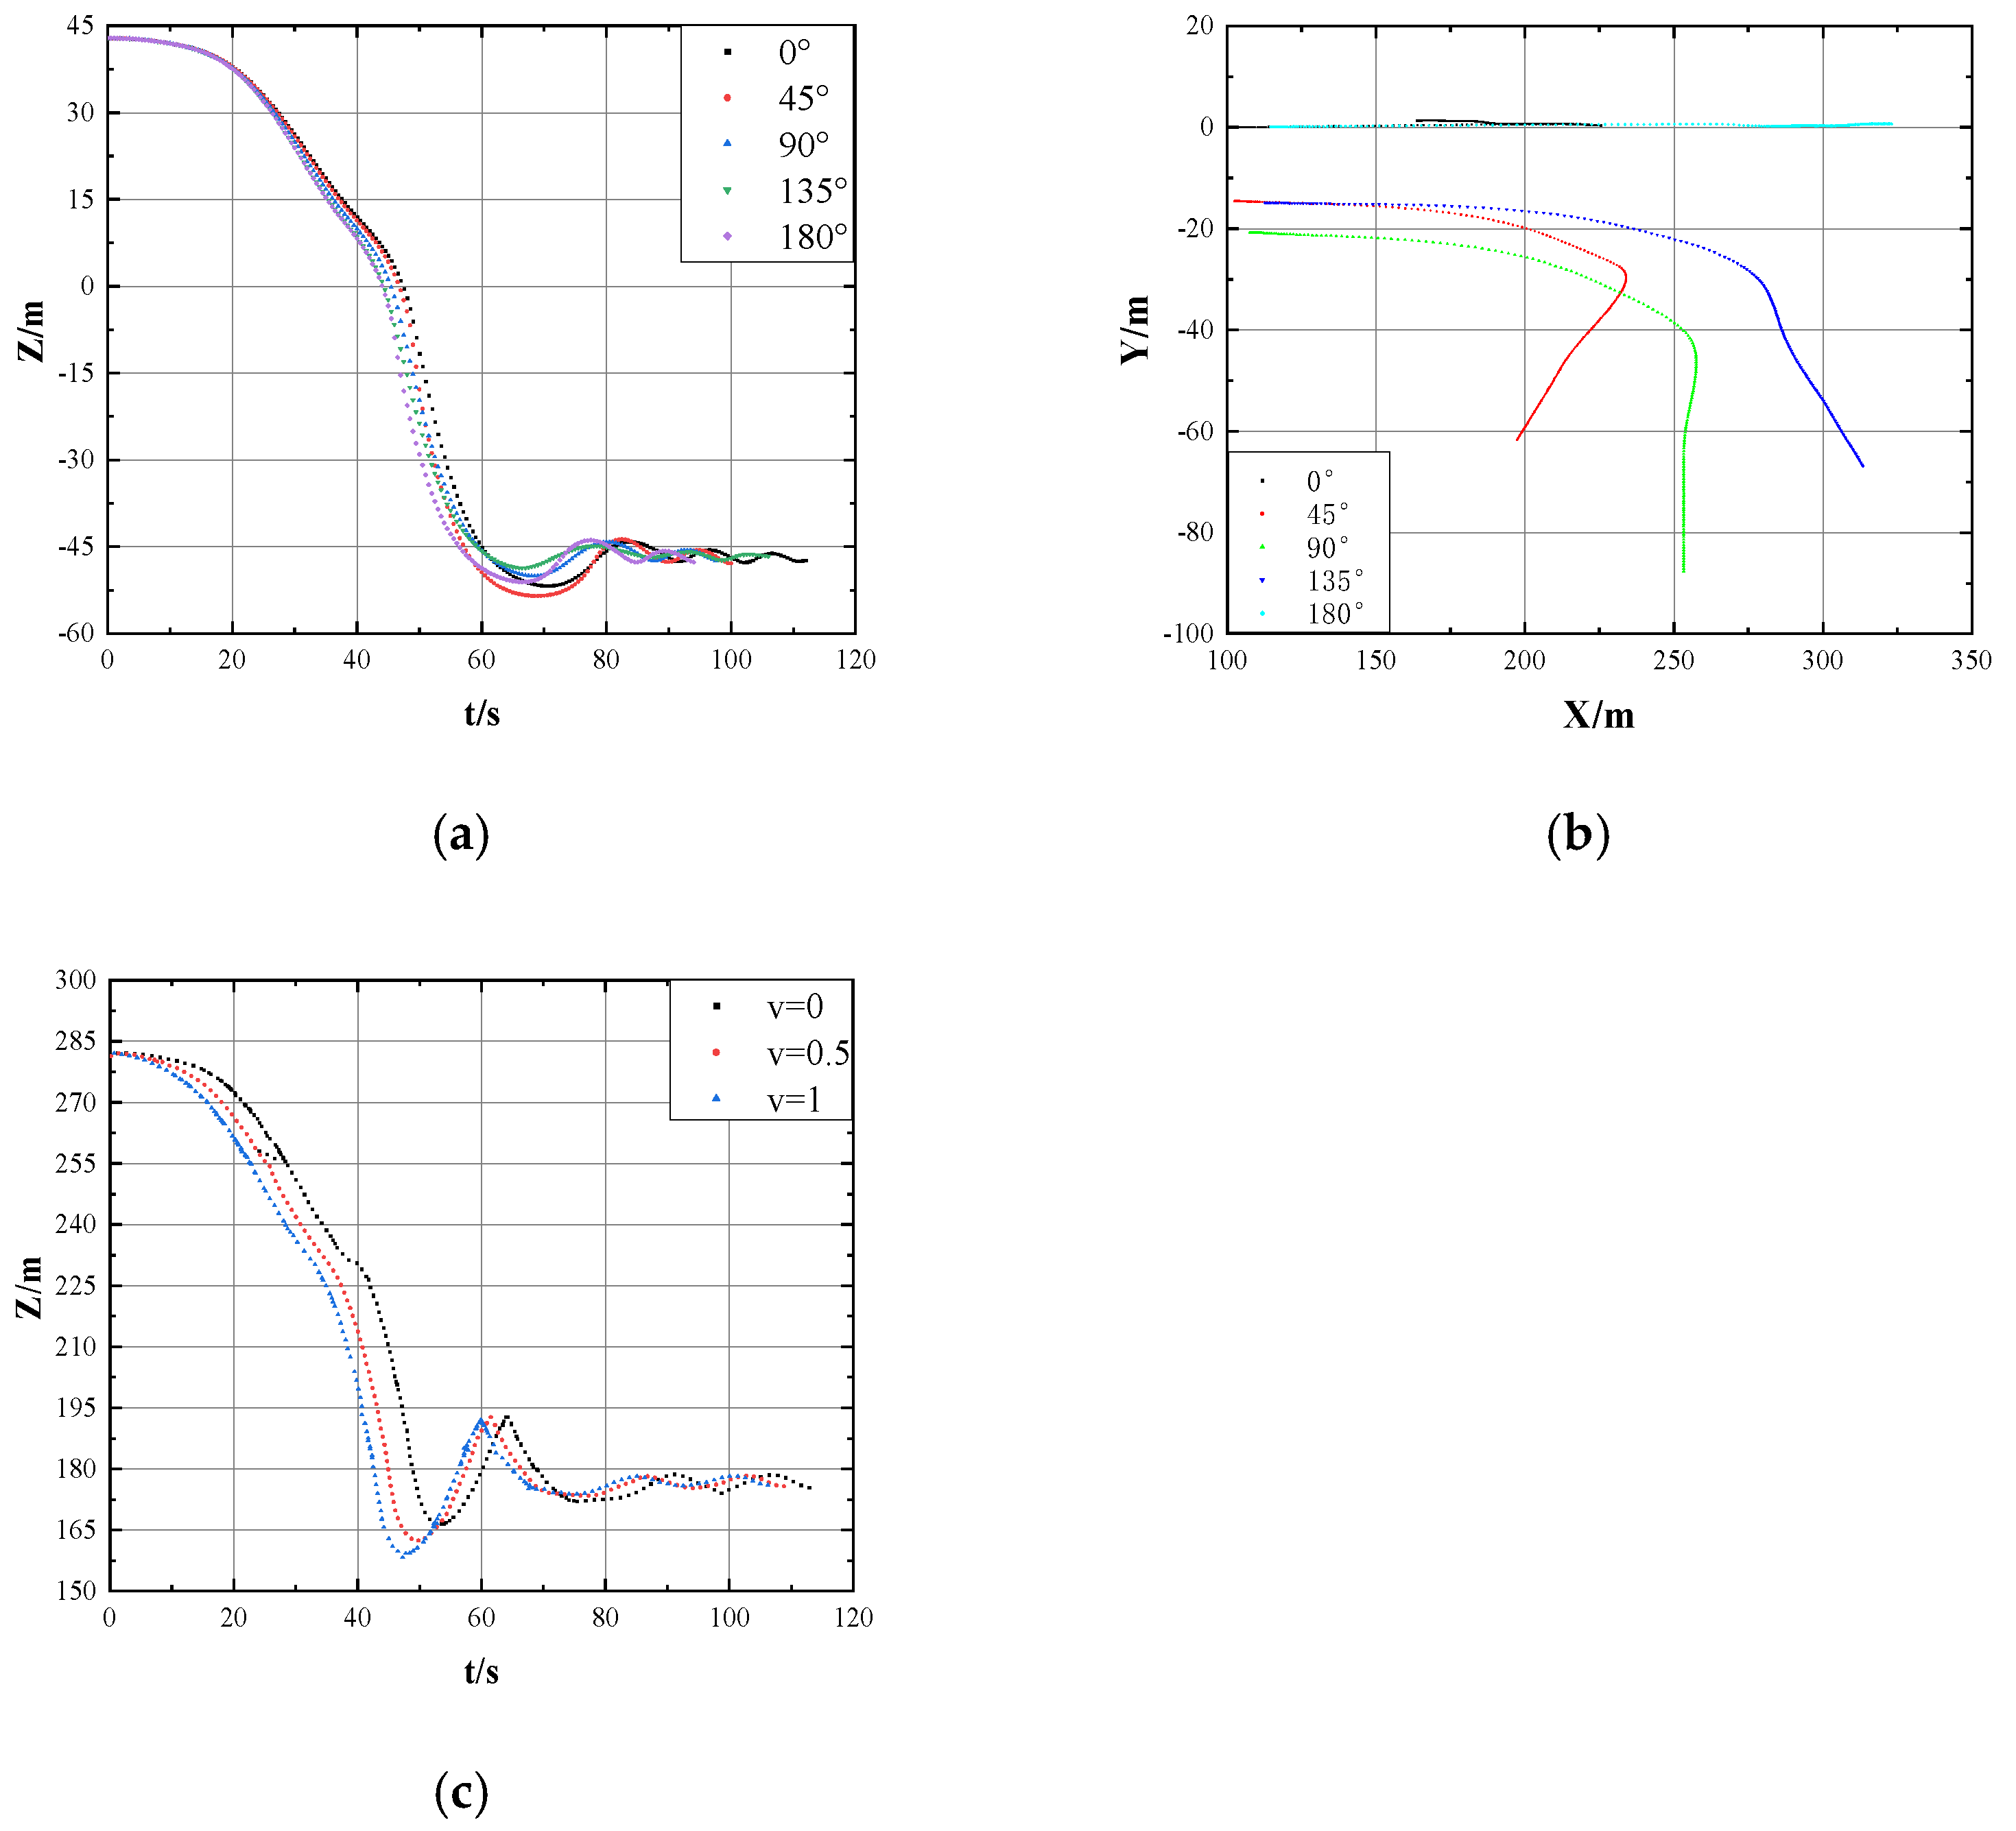
4.2. Movement Trajectories of Jacket Under Different Environmental Directions

Figure 6a illustrates the vertical movement of the jacket’s center of gravity during the launching of the model jacket under regular waves (wave height 1 m, period 2 s, wind speed 11.4 knots, and flow speed 1 m/s). Additionally, Figure 6b also presents the results of horizontal x-direction motion and horizontal y-direction motion, as well as the total motion trajectory of the center of gravity of the guide frame in the horizontal plane. Additionally, Figure 6c shows the variation of the z-coordinate of the center of gravity of the guide frame at different thruster speeds.
(1) The motion of the jacket’s center of gravity (Cog) under varying environmental conditions, including wave, wind, and flow directions, exhibits distinct phases during the launching process. Initially, the Cog’s height decreases gradually as the jacket begins to descend towards the water surface. This rate of descent accelerates significantly after the jacket overturns, continuing until it detaches from the barge. The discharge time of the jacket, which corresponds to the moment it is released into the water, varies with different environmental orientations; specifically, the release time shortens sequentially for 0°, 45°, 90°, 135°, and 180° directions. Once the jacket reaches its lowest point, it undergoes vertical fluctuations, primarily due to the combined effects of the jacket’s gravity and inertia. As the jacket sinks, its buoyancy gradually increases, eventually overcoming its gravitational pull, which causes it to rise. Conversely, when the buoyant force becomes weaker than the gravitational pull, the jacket sinks again until a dynamic equilibrium is reached. Thruster speed plays a crucial role in modulating this process, directly impacting the jacket’s descent characteristics, oscillation behavior, and overall stability. Without thrusters (v = 0), the descent is slower, but the structure experiences more pronounced oscillations after reaching its lowest point, leading to an extended stabilization period. When the thruster speed increases to v = 0.5, the jacket descends more rapidly, and oscillations are noticeably reduced, suggesting that the applied force helps streamline the motion and dampen excessive vertical fluctuations. At the highest thruster speed (v = 1), the descent occurs even faster, and oscillations become minimal, indicating that a stronger propulsion force can effectively suppress instability and shorten the time required for the structure to reach equilibrium. This effect can be attributed to the thrusters providing additional downward momentum, counteracting unpredictable hydrodynamic disturbances, and stabilizing the jacket’s motion before excessive oscillations develop.
Additionally, environmental direction affects the depth of descent and oscillation characteristics, emphasizing the importance of directional forces in determining the jacket’s motion. These findings are crucial for offshore engineering as optimizing both thruster settings and launch orientation can enhance stability, minimize excessive oscillations, and ensure a safer, more controlled jacket deployment.
(2) In terms of horizontal motion, at 0° and 180°, the jacket’s displacement follows a clear pattern: an initial increase in the x-direction, followed by a decrease. The motion is confined to specific ranges of the x-axis (100 < X < 300 for 0°, and 100 < X < 215 for 180°), while the motion in the y-direction remains minimal, with the center of gravity nearly stationary around Y = 0. These factors result in nearly linear motion trajectories, indicating minimal lateral displacement. Under bow wave conditions, the jacket tends to drift away from the barge while exhibiting vertical oscillations, whereas under stern wave conditions, the jacket first drifts laterally before returning towards the barge. These motions are primarily driven by hydrodynamic forces acting along the longitudinal axis of the barge in combination with vertical buoyancy forces, which cause either vertical or lateral drift depending on the relative positioning of the barge and environmental forces. For the 90° environmental condition, the trajectory of the Cog shows a gradual increase along the x-axis, with an initial increase in y-direction displacement, which eventually stabilizes. The trajectory approximates a logarithmic curve, indicating the influence of both wave-induced drift and the interaction between the jacket and the barge. These conditions result in significant lateral forces that create instability, making them particularly unsuitable for launching operations. For 45° and 135° directional conditions, the motion trajectory is symmetric in the x–y plane, reflecting balanced hydrodynamic forces that induce similar magnitudes of displacement in both the x and y-directions, but with opposite projections in the x-direction. However, after the jacket detaches from the barge, the forces in these directions diverge, underscoring the critical influence of environmental forces on both lateral and longitudinal stability during the launch.

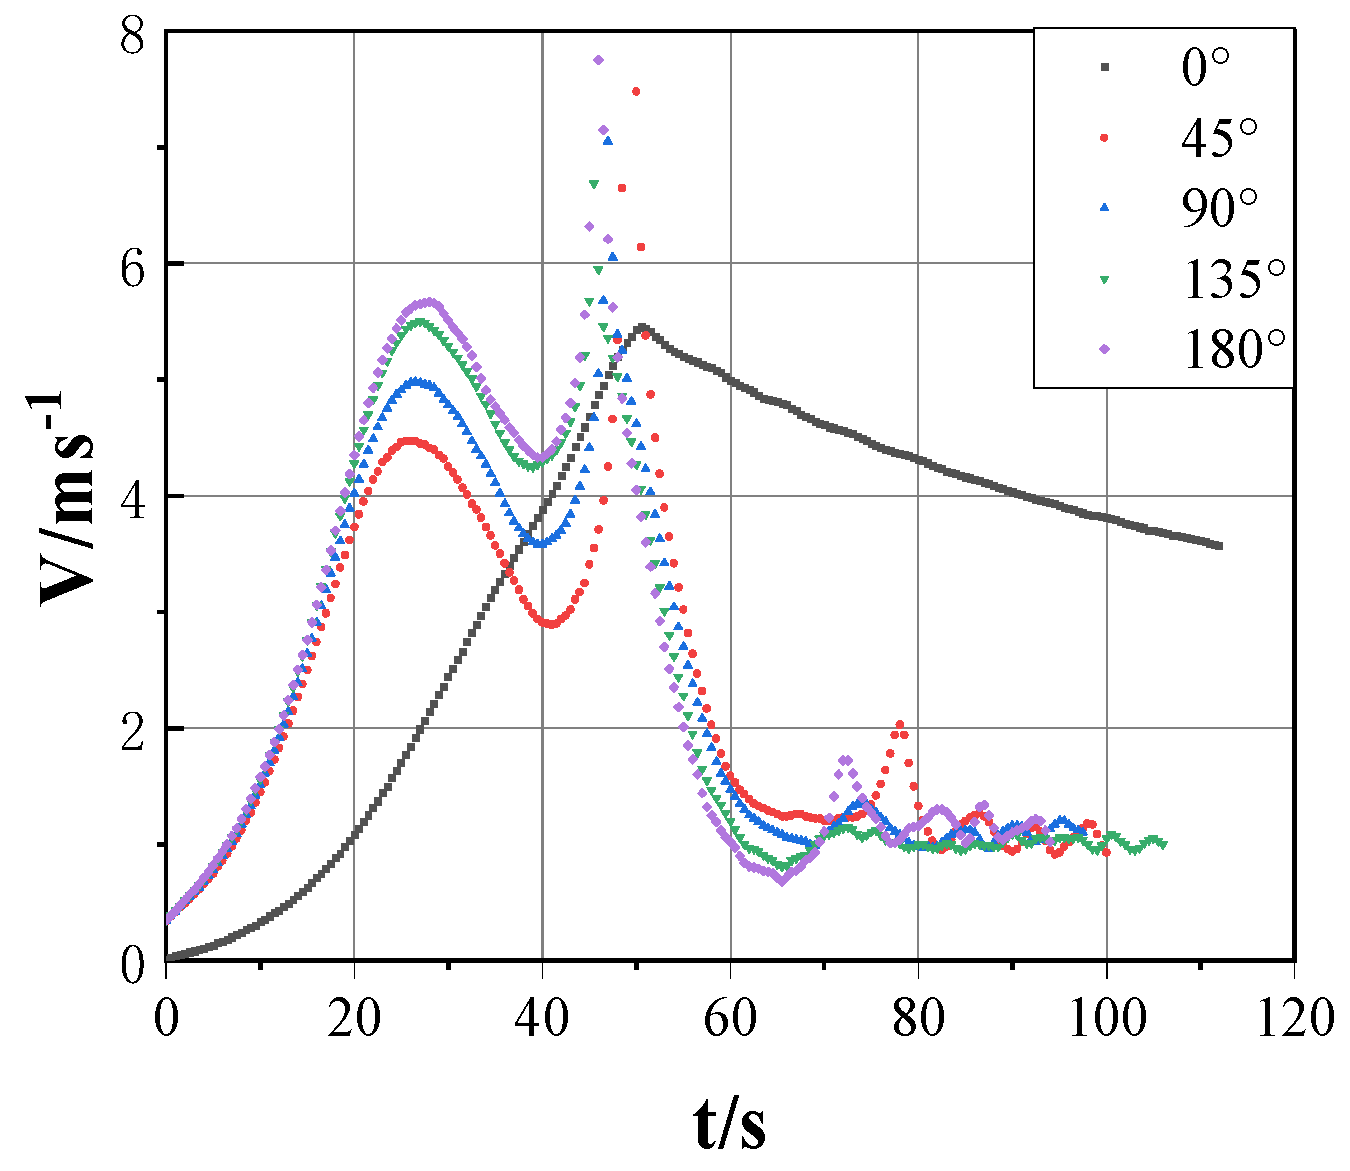
4.3. Velocity and Acceleration of Jacket-Launching Process Under Different Environmental Directions

Figure 7 and Figure 8 show the velocity and acceleration corresponding to the center of gravity in the launching process of the model jacket under a regular wave (wave height 1 m (period 2 s), wind speed 11.4 knots, and flow speed 1 m/s).
(1) By observing Figure 7, it can be found that the changing trend of velocity under the influence of 0° environmental direction is different from the curve under other environmental directions. It takes a longer time to reach the maximum speed after the jacket is detached from the pin and touches the water surface. The main reason is that the wave and wind direction in the direction of 0° environment are opposite to the direction of the water. The maximum jacket speed is achieved when the jacket slides at the tail until the pin turns.
(2) By observing the acceleration curves of the jacket center of gravity under different environmental directions in Figure 8, it is found that the velocity variation images of the jacket center of gravity in the time domain show a similar trend under conditions of other environmental directions except 0°. In the initial stage, due to the force exerted by the initial speed of the booster on the jacket, the acceleration of the jacket keeps increasing. Then, in the first half of the process of sliding the jacket from the barge to the water surface, the friction of the slide rail affects the acceleration of the jacket. In the second half, the center of gravity of the jacket moves in the x-direction with time, and the acceleration of the center of gravity of the jacket increases continuously until it reaches the maximum when the jacket is released from the barge. Then, as the volume of drainage continues to increase, the buoyancy it receives increases. When the buoyancy force is greater than gravity, the jacket will move upward, and when the displacement is reduced and the buoyancy force is reduced to less than gravity, the jacket will move downward again, and it will gradually stabilize after a dynamic equilibrium. In the floating process of the jacket, the direction of the combined force of gravity and the buoyancy force is alternately positive and negative, and the magnitude of acceleration is also constantly fluctuating.

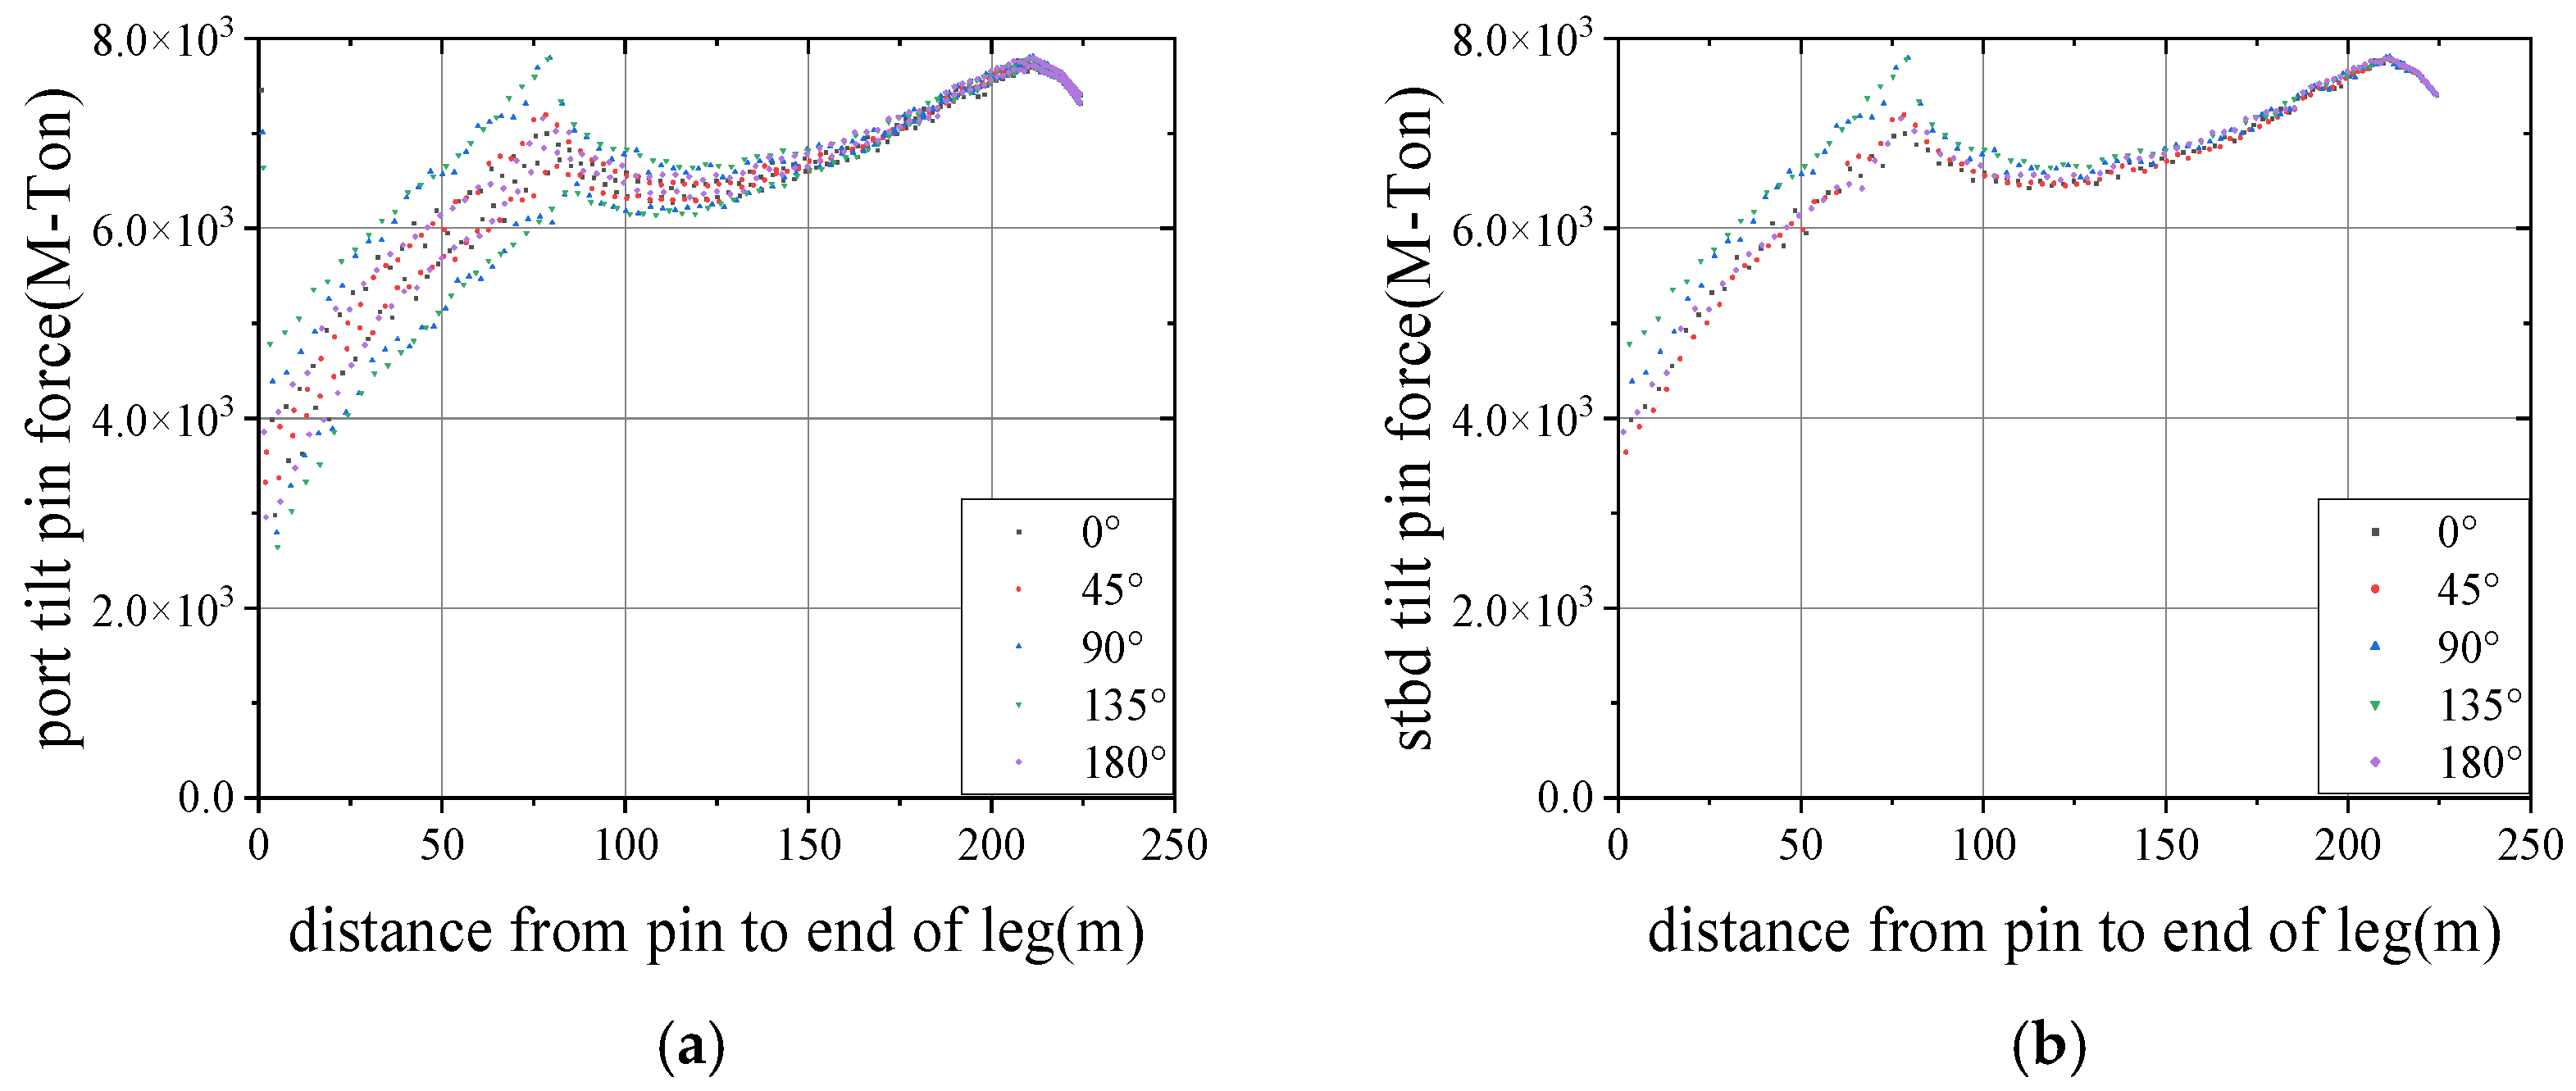
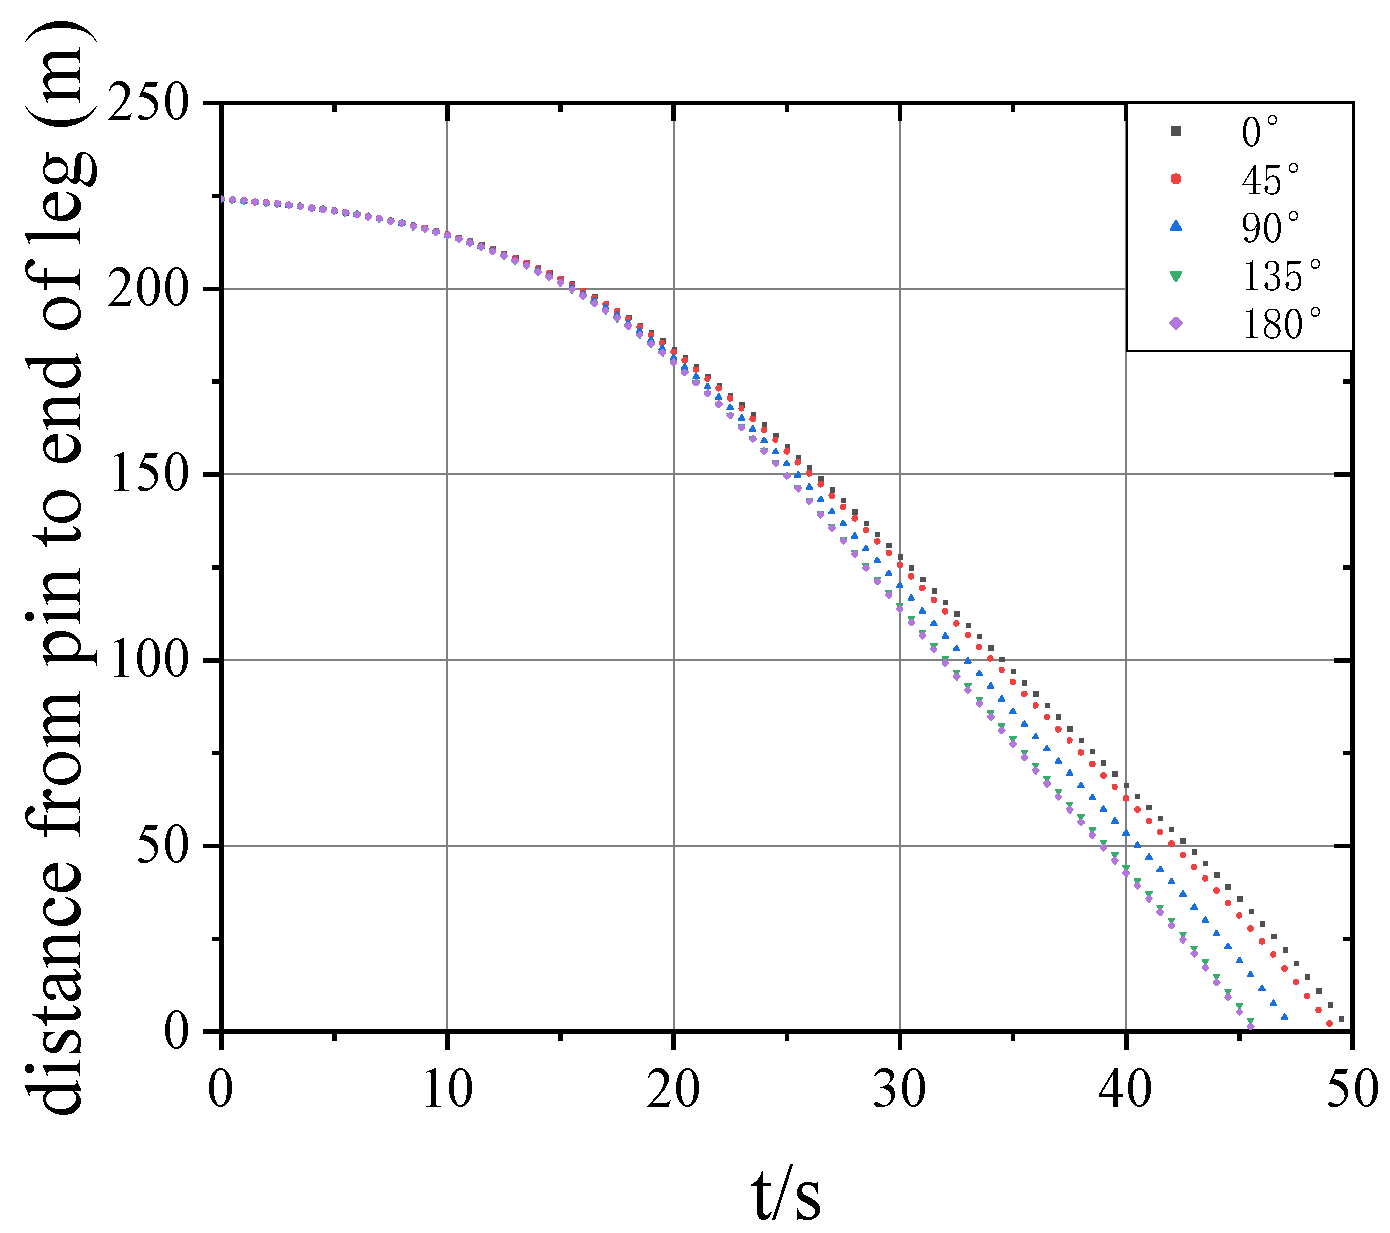
4.4. The Force of Jacket on Rocker Arm Under Different Environmental Directions

Figure 9 depicts the time-domain diagram illustrating changes in the pressure experienced by the left and right sides of the rocker arm concerning the distance between the rocker arm and the tail of the jacket during the launching of the model jacket under regular waves (wave height 1 m, period 2 s), wind speed 11.4 knots, and flow speed 1 m/s.
(1) By observing Figure 9, it is found that the trajectory images of forces on both sides of the rocker arm have strong symmetry under the ambient directions of 0° and 180°. Additionally, the maximum and minimum forces are almost the same. On the one hand, it is because of the symmetry of the jacket structure, and, on the other hand, it is because of the symmetry of the environmental direction. Under the influence of the environmental direction of 45°, 90°, and 135°, the pressure on the left and right rocker arms is not exactly the same, and the pressure on the left side will mutate. It is mainly caused by the lateral pressure generated under the influence of wind and wave currents, and it can be found from the horizontal movement trajectory of the center of gravity of the jacket before that under the action of the inclined wind and wave currents; there is a large lateral movement, especially in the case of the maximum roll in the direction of 90°, the maximum abrupt pressure on the left side is also the largest, and it is easy to roll over everywhere jacket and barge. Therefore, avoid launching operations in this environmental direction.
(2) By examining Figure 10, it is evident that the time domain trajectory from the head of the jacket to the rocker arm at the tail of the barge exhibits strong similarity. However, the time required for 180°, 135°, 90°, 45°, and 0° differs, primarily influenced by the wind and wave currents in the x-direction of the horizontal plane. The impact of wind and wave currents in the x-direction progressively increases over time. The moment when the jacket disconnects from the barge occurs last at 0 degrees

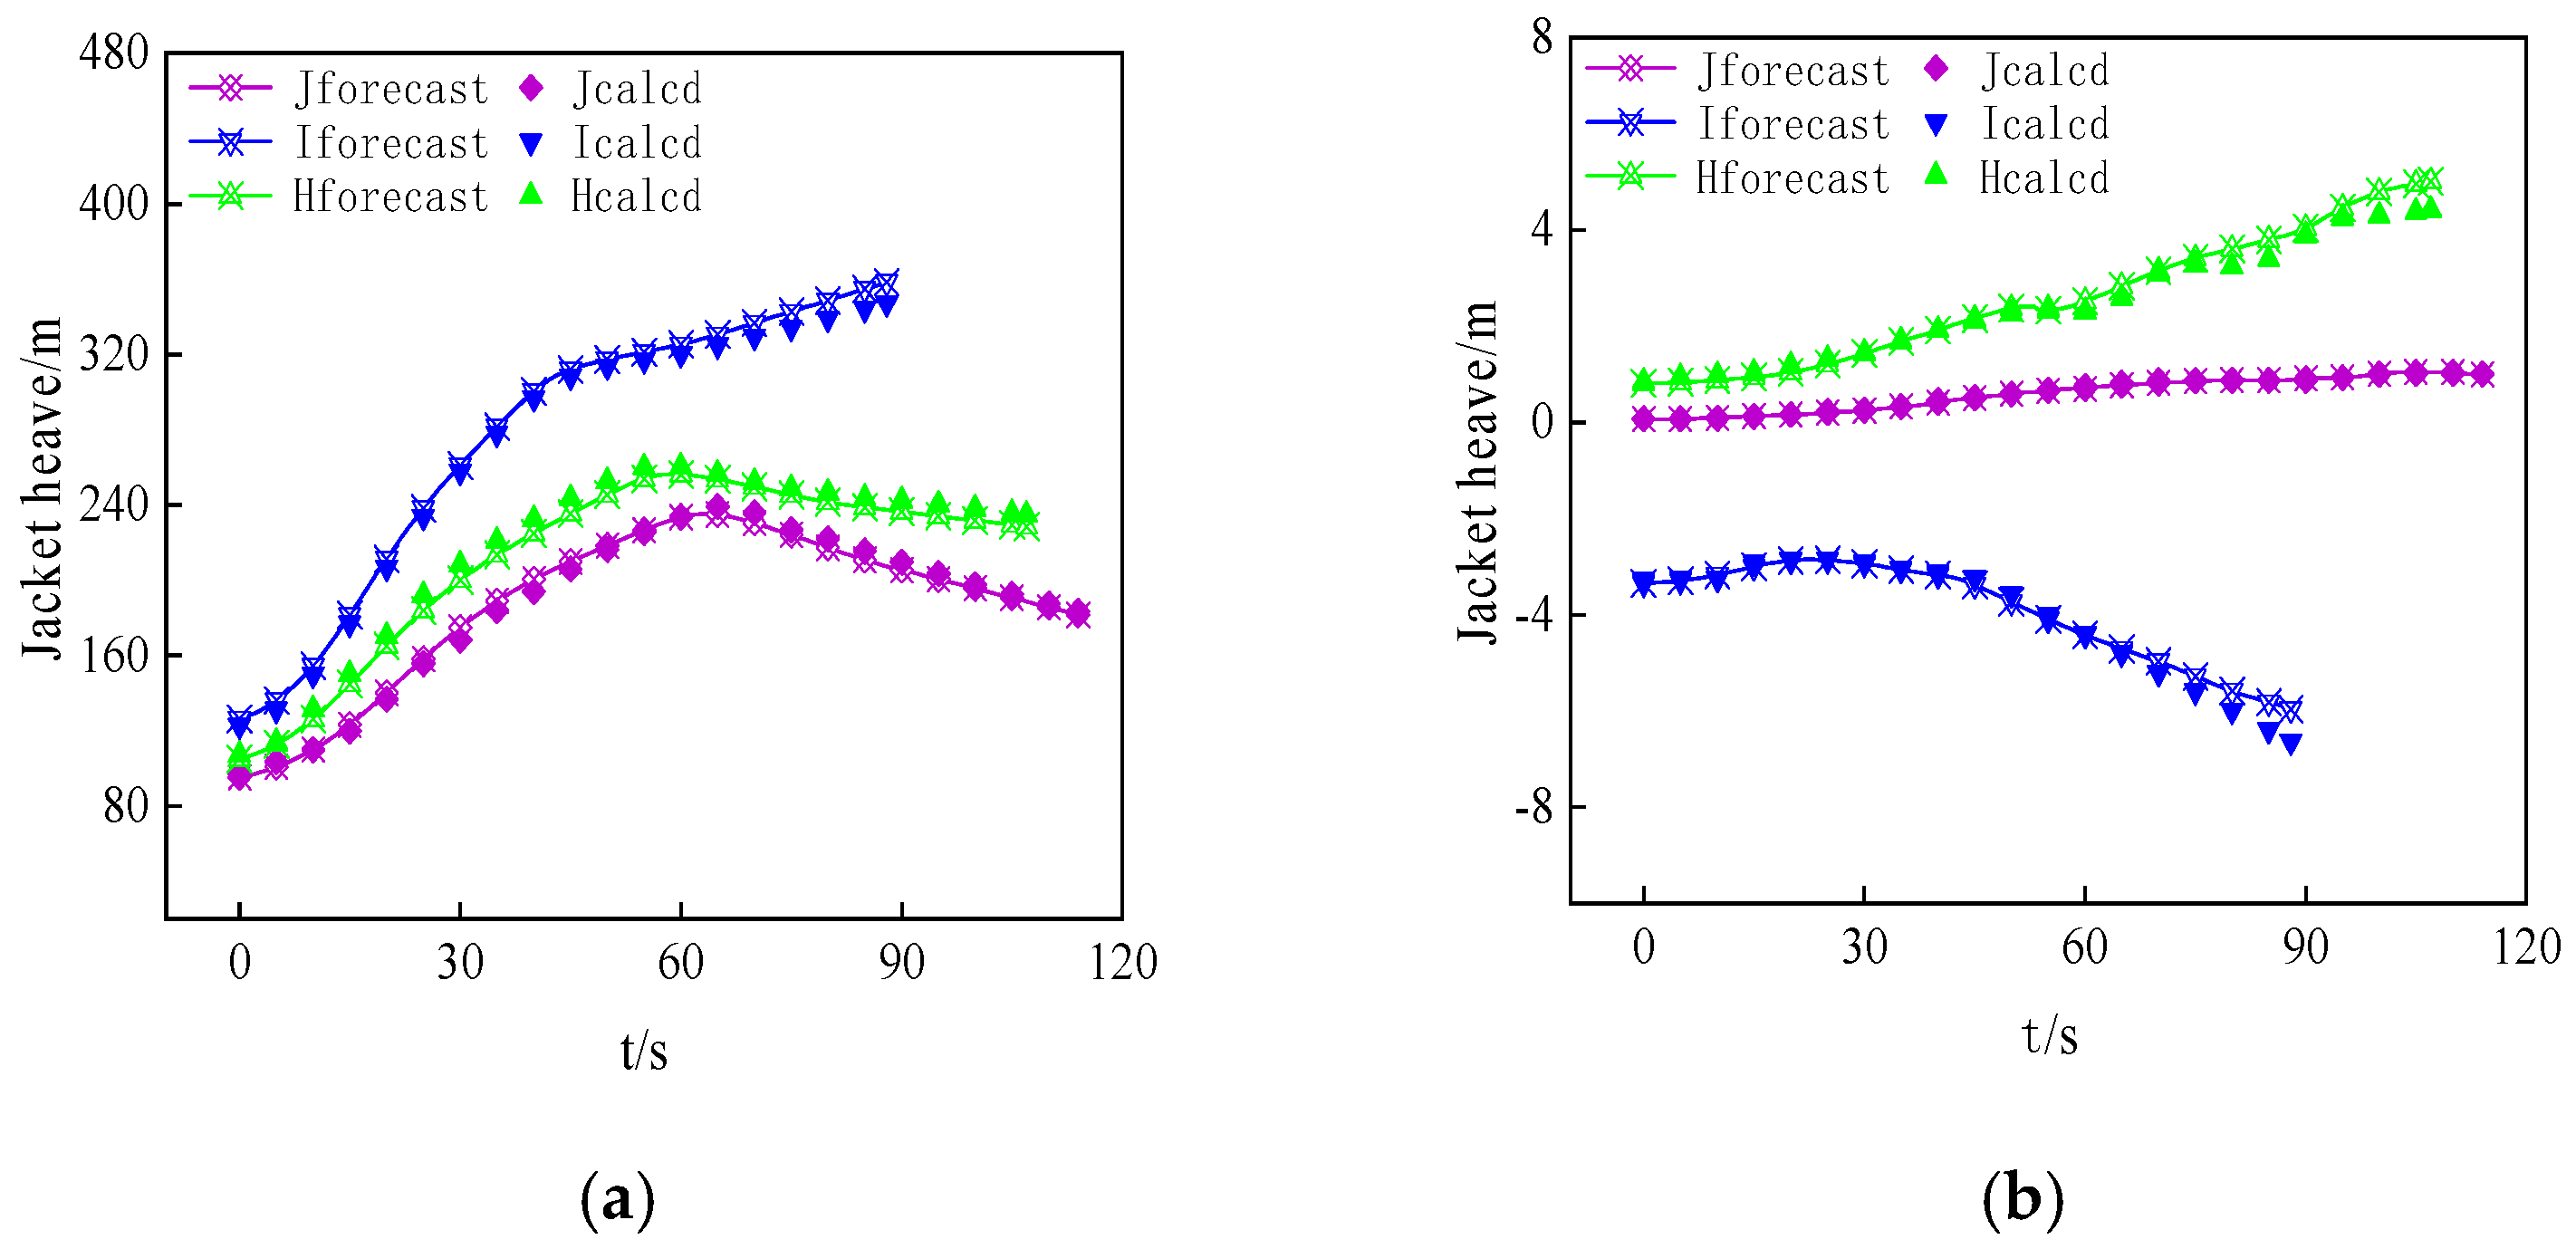
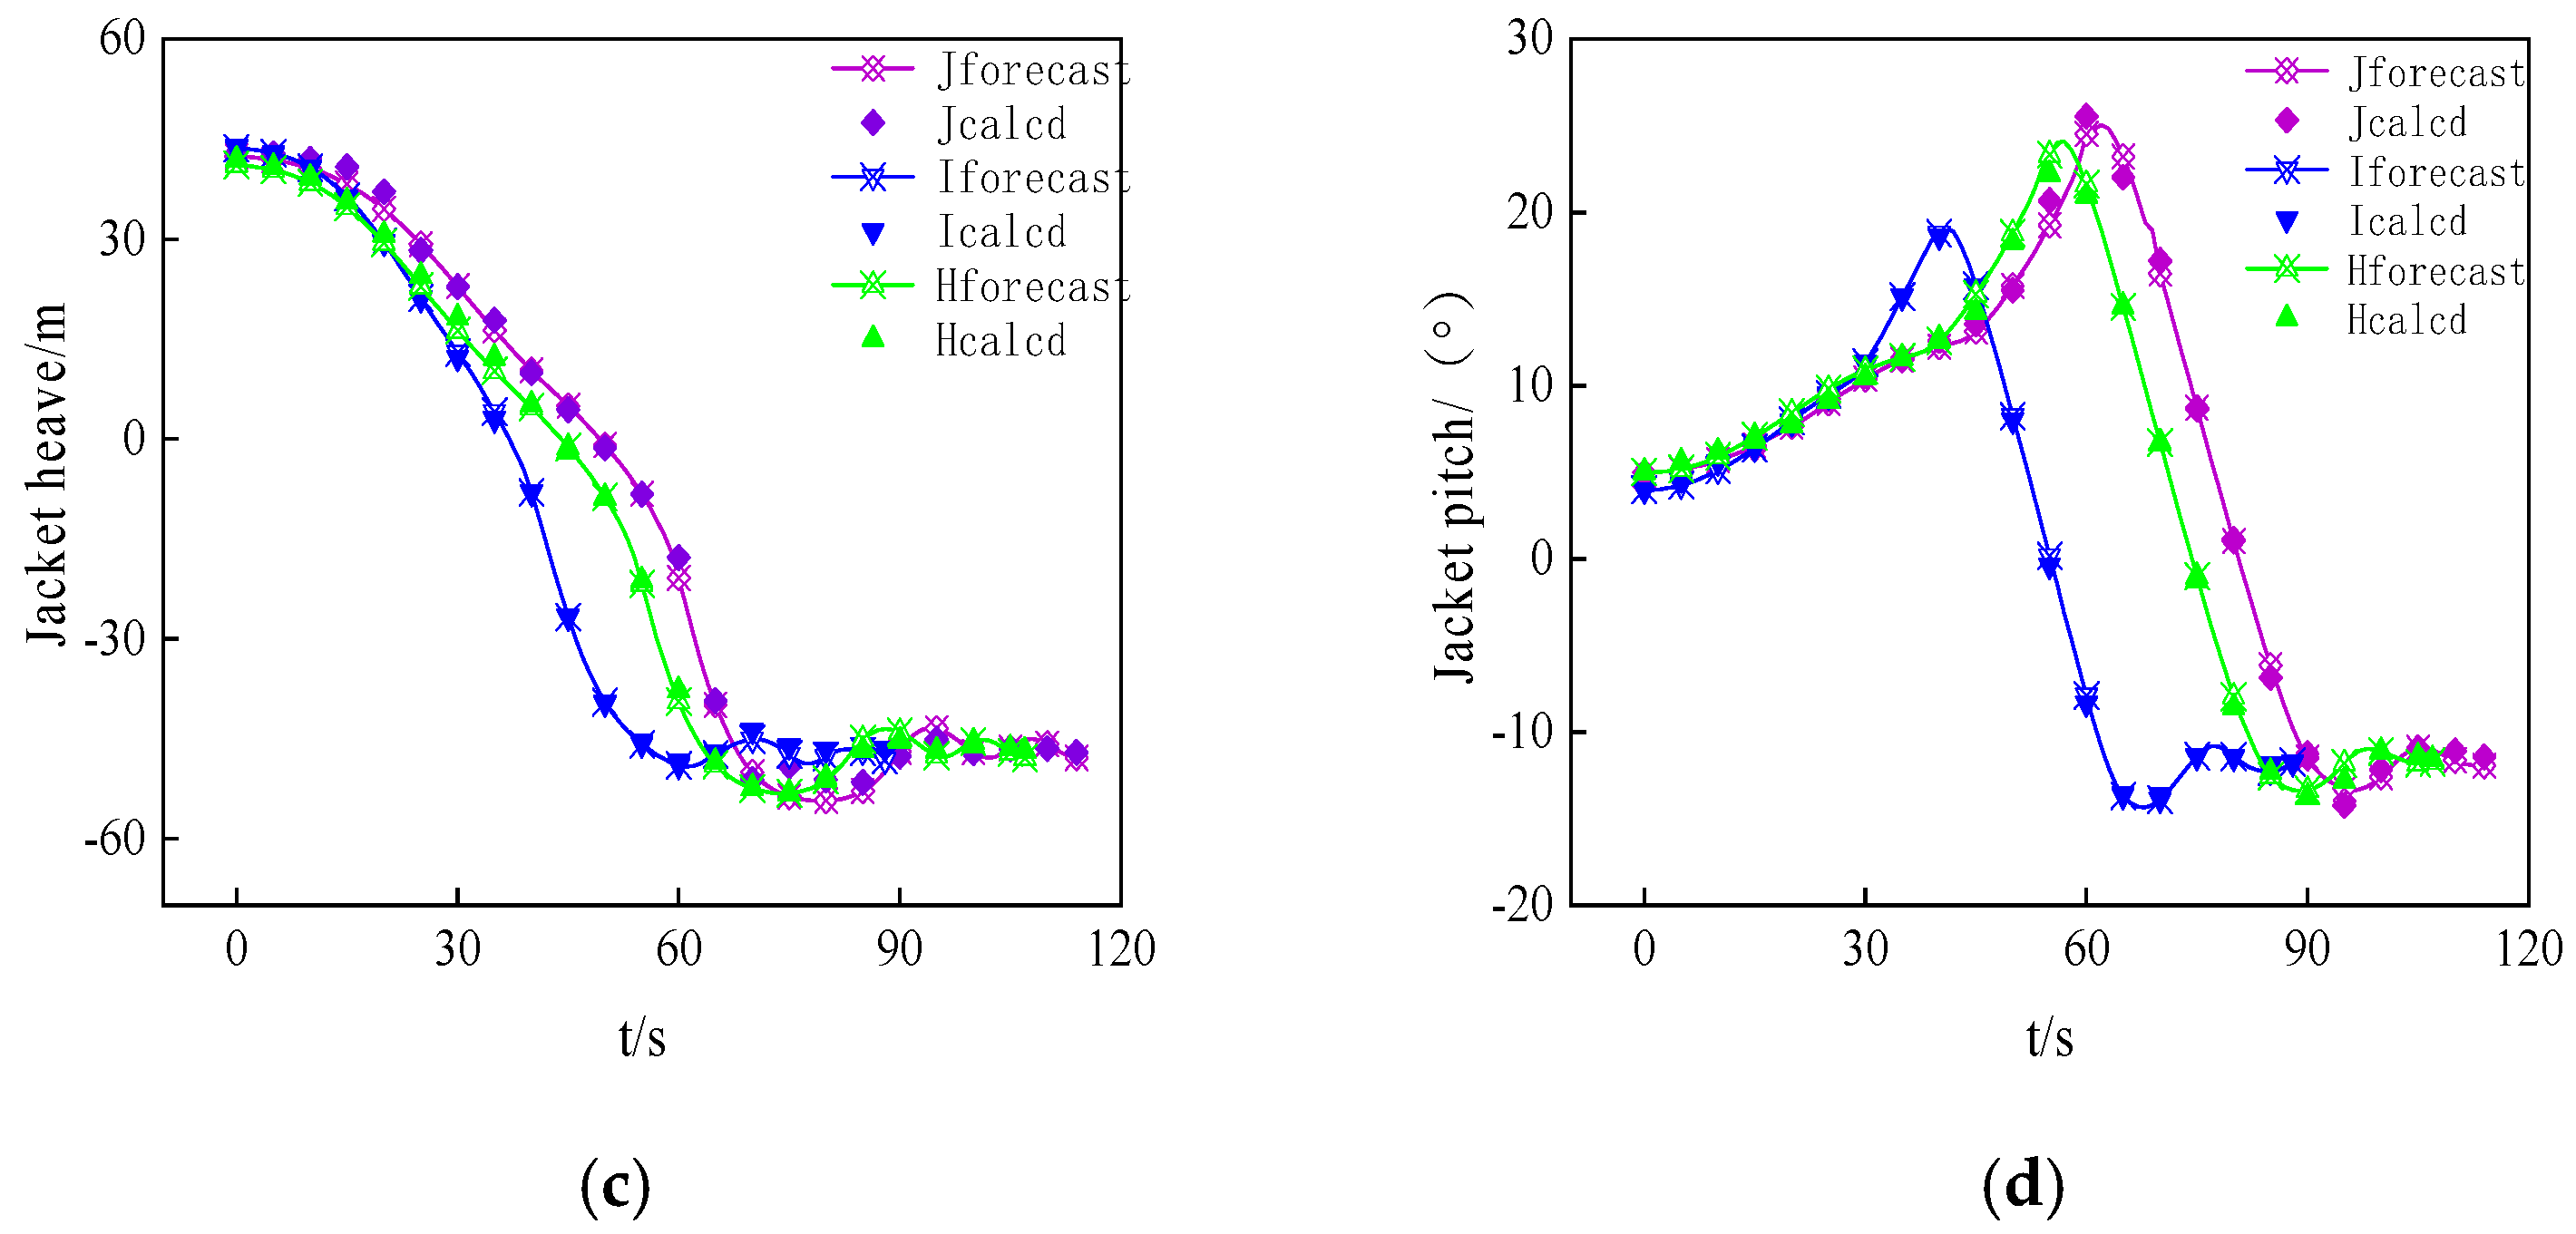
4.5. Accuracy Verification of Fast Forecasting Model

The neural network model demonstrates high prediction accuracy within the dataset range. However, its effective prediction capability outside the dataset depends not only on the model’s generalization performance but also on the sensitivity of the influencing parameters. Using commercial software (Python 3.11.x), extensive numerical calculations were conducted, and a controlled variable method was applied to analyze the sensitivity of various parameters affecting the jacket sliding into the water. Based on this analysis, the effective prediction range of the rapid prediction model for jacket sliding was determined, as summarized in Table 2.
To validate the accuracy of the RBF neural network model within the effective range, 100 typical working conditions were selected from the effective range for calculation. The predicted values from the RBF neural network model were compared with the calculated values. Across 100 working conditions, the prediction of the termination time for jacket sliding yielded a maximum error of 12.00 s, an RMSE of 4.90 s, and an average error of less than 5.00%. These indicators confirm that the RBF neural network model performs well within an acceptable error range, indicating that the model has high prediction accuracy within the effective range.
To comprehensively validate the BP neural network model’s performance in effective scenarios, three typical working conditions were selected for detailed evaluation. A comparative analysis between the model’s predicted values and the calculated reference values was conducted. The verification conditions are listed in Table 3, and the comparison results are shown in Figure 11 and Figure 12.
Under the three working conditions, the maximum prediction errors for the barge’s longitudinal, lateral, vertical, and longitudinal sway motions are 6.96 m, 0.58 m, 0.48 m, and 1.00°, respectively, with corresponding root mean square errors (RMSEs) of 2.92 m, 0.15 m, 0.13 m, and 0.23°. For the conduit frame, the maximum prediction errors in heave, sway, heave, and pitch motions are 11.51 m, 0.67 m, 5.12 m, and 3.18°, with RMSEs of 4.69 m, 0.15 m, 1.29 m, and 0.54°, respectively. It is worth noting that, except for the transitional moments immediately before and after the pipe rack enters the water, the motion prediction errors for all degrees of freedom are consistently below 10%, which meets the acceptable threshold for engineering applications. The BP neural network model for predicting the six-degrees-of-freedom motion of the center of gravity of the barge and the pipeline frame has strong generalization ability and high prediction accuracy within an effective range, even under complex operational conditions.

5. Conclusions

A comprehensive study of the kinematic response and rocker arm loading was conducted by comparing the jacket launch characteristics obtained under different wind, wave, and current conditions. This study yields the following conclusions:
(1)
Environmental Impact on Jacket Behavior: Wind, wave, and current directions significantly affect loading characteristics and motion trajectories. Symmetry in rocker arm forces was observed at 0° and 180° directions, while 45°, 90°, and 135° showed increasing asymmetry. The 90° direction produced the largest force variation on the left rocker arm, raising rollover risks. Environmental directions also influenced the jacket’s center-of-gravity trajectory, with the 90° direction causing the most lateral displacement, heightening operational risks. In the vertical plane, despite temporal variations, the overall trajectory showed consistent slow descent, rapid descent, and buoyancy-driven oscillations.
(2)
Detachment Time and Motion Characteristics: The time for jacket detachment, as well as peak velocity and acceleration, varied under different conditions. The 0° direction exhibited a longer buildup to peak velocity due to gradual hydrodynamic forces. Upon water entry, buoyant forces decelerated the jacket’s motion, ultimately reversing its direction as buoyancy exceeded gravity.
(3)
Prediction Model for Sliding Launches: A rapid prediction model combining RBF and BP neural networks was developed, successfully predicting sliding termination time and 6DOF motion responses with high accuracy. The model achieved an average error of less than 5% for termination time and below 10% for motion responses (except around submersion), significantly reducing computation time to only 6.40% of traditional simulation methods, making it suitable for real-time predictions in complex operations.
(4)
Operational Recommendations: Operations under 90° conditions should be avoided due to high rollover risks, while 0°, 180°, or calm conditions are safer, though strong environmental loads (e.g., 0° direction) require precautions to prevent collisions between the jacket and the barge.
In conclusion, by integrating numerical simulations with real-world data, this study establishes a scalable and adaptive framework for offshore jacket launching. Future research can focus on refining control strategies for different environmental conditions, improving hydrodynamic modeling accuracy, and developing more robust guidelines for offshore structure installations. These advancements will contribute to safer and more efficient offshore operations.
Future work can focus on refining hydrodynamic models for more accurate force and trajectory predictions, developing adaptive control strategies to enhance real-time safety adjustments, and expanding environmental datasets to improve model robustness. Additionally, integrating risk assessment frameworks can optimize decision-making in complex offshore conditions. These advancements will contribute to safer and more efficient jacket-launching operations. At the same time, in order to reduce reliance on large training datasets, we will expand our data sources by integrating historical engineering data, open access datasets, and real-world measurements. In addition, data augmentation techniques such as interpolation and noise addition can generate different samples, while transfer learning allows pre trained models to adapt to new conditions with less data.

Author Contributions

Validation, Y.L.; Formal analysis, X.B.; Writing—original draft, S.C.; Writing—review & editing, M.L.; Funding acquisition, X.B. All authors have read and agreed to the published version of the manuscript.

Funding

Project supported by the Natural Science Foundation of Jiangsu Province (Grant No. BK20241015).

Data Availability Statement

The original contributions presented in this study are included in the article. Further inquiries can be directed to the corresponding author.

Conflicts of Interest

The authors declare no conflict of interest.

References

  1. Saeful, M.; Paroka, D. NC3 CPP Jacket Launching Analysis by Using Numerical Simulation (Case Study of NC3 Gas Field, SK316 Block Bintulu Sarawak Malaysia). In Proceedings of the IOP Conference Series: Materials Science and Engineering, Bandung, Indonesia, 11 June 2020; IOP Publishing: Bristol, UK, 2020; p. 012072. [Google Scholar]
  2. Gerwick, B. Construction of Marine and Offshore Structures; CRC Press: Boca Raton, FL, USA, 2007. [Google Scholar]
  3. Jo, C.H.; Kim, K.S.; Lee, S. Parametric study on offshore jacket launching. Ocean Eng. 2002, 29, 1959–1979. [Google Scholar] [CrossRef]
  4. Honarvar, M.; Pirooz, M.D.; Bahaari, M.R. A physical and numerical modeling for launching of jackets (Case Study on Balal PLQ Platform). J. Offshore Mech. Arct. Eng. 2008, 130, 031004. [Google Scholar] [CrossRef]
  5. Omdehghiasi, H.; Mojtahedi, A.; Farajpour, I. A parametric stability analysis of the offshore jacket launch: A case study in the Persian Gulf. Mar. Syst. Ocean. Technol. 2018, 13, 87–102. [Google Scholar] [CrossRef]
  6. Mayfield, J.; Arnold, P.; Eekman, M.; Wellink, J. Installation of the bullwinkle platform. In Proceedings of the Offshore Technology Conference, Houston, TX, USA, 1–4 May 1989; OTC: Columbus, OH, USA, 1989. [Google Scholar]
  7. Sircar, S.; Chandra, T.; Mills, T.; Roberson, W. Transportation, launch, and self-upend analysis of the Kilauea Jacket using proven analytical techniques. In Proceedings of the Offshore Technology Conference, Houston, TX, USA, 7–10 May 1990; OTC: Columbus, OH, USA, 1990. [Google Scholar]
  8. Campbell, R.; Lamb, W.; Angevine, D.; Monopolis, G. Instrumentation of the SYU jackets for trans-pacific tow and launch. In Proceedings of the Offshore Technology Conference, Houston, TX, USA, 6–9 May 1991; OTC: Columbus, OH, USA, 1991. [Google Scholar]
  9. Vasicek, D.; Lu, C.-H. Launch and floatation analysis of offshore structures part 2–barge and jacket interaction on launch analysis. Pet. Eng. Int. 1979, 51, 10–16. [Google Scholar]
  10. Sphaier, S.; Vasconcellos, J.; Esperanca, P.; Ferreira, M. The study of jacket installation using INPLA system. In Proceedings of the 5th International Symposium on Offshore Engineering, Rio de Janeiro, Brazil, 16–20 September 1985. [Google Scholar]
  11. Jo, C.H.; Kim, K.S.; Kim, J.H.; Lee, S. Criterion of offshore jacket launching analysis. In Proceedings of the ISOPE International Ocean and Polar Engineering Conference, Kitakyushu, Japan, 25–31 May 2001. [Google Scholar]
  12. Xiong, L.; Yang, J.; Li, X.; Xu, X. Study on numerical simulation of jacket launching progress. In Proceedings of the International Conference on Offshore Mechanics and Arctic Engineering, Nantes, France, 8–13 June 2013; American Society of Mechanical Engineers: New York, NY, USA, 2013. [Google Scholar]
  13. Sunder, S.S.; Connor, J. Sensitivity analyses for steel jacket offshore platforms. Appl. Ocean Res. 1981, 3, 13–26. [Google Scholar] [CrossRef]
  14. Welzel, M.; Kreklow, T.; Schlurmann, T.; Hildebrandt, A. Excitation and dynamic responses of jacket structures in regular waves for offshore installation. Coast. Eng. Proc. 2016, 2, 12. [Google Scholar] [CrossRef]
  15. Elshafey, A.A.; Haddara, M.R.; Marzouk, H. Dynamic response of offshore jacket structures under random loads. Mar. Struct. 2009, 22, 504–521. [Google Scholar] [CrossRef]
  16. Cheng, Y.; Fu, L.; Dai, S.; Collu, M.; Ji, C.; Yuan, Z.; Incecik, A. Experimental and numerical investigation of WEC-type floating breakwaters: A single-pontoon oscillating buoy and a dual-pontoon oscillating water column. Coast. Eng. 2022, 177, 104188. [Google Scholar] [CrossRef]
  17. Cheng, Y.; Fu, L.; Dai, S.; Collu, M.; Cui, L.; Yuan, Z.; Incecik, A. Experimental and numerical analysis of a hybrid WEC-breakwater system combining an oscillating water column and an oscillating buoy. Renew. Sustain. Energy Rev. 2022, 169, 112909. [Google Scholar] [CrossRef]
  18. Cheng, Y.; Liu, W.; Dai, S.; Yuan, Z.; Incecik, A. Wave energy conversion by multi-mode exciting wave energy converters arrayed around a floating platform. Energy 2024, 313, 133621. [Google Scholar] [CrossRef]
  19. Mi, C.-L.; Gao, J.-L.; Song, Z.-W.; Yan, M.-Y. Gap resonance between a stationary box and a vertical wall induced by transient focused wave groups. In China Ocean Engineering; Springer: Berlin/Heidelberg, Germany, 2025; pp. 1–14. [Google Scholar]
  20. Gong, S.; Gao, J.; Yan, M.; Song, Z.; Shi, H. Effects of floater motion on wave loads during steady-state gap resonance occurring between two non-identical boxes. Ocean. Eng. 2025, 323, 120649. [Google Scholar] [CrossRef]
  21. Mi, C.; Gao, J.; Song, Z.; Liu, Y. Hydrodynamic wave forces on two side-by-side barges subjected to nonlinear focused wave groups. Ocean. Eng. 2025, 317, 120056. [Google Scholar] [CrossRef]
  22. Li, M.; Yuan, Z.-M.; Tao, L. Wash waves generated by ship moving across a depth change. Ocean Eng. 2023, 275, 114073. [Google Scholar] [CrossRef]
  23. Li, M.-X.; Yuan, Z.-M.; Bai, X.; Li, Y.-Z.; Cheng, Y.; Tao, L.-B. Numerical modelling of wash waves generated by ships moving over an uneven bottom. China Ocean Eng. 2023, 37, 145–153. [Google Scholar] [CrossRef]
  24. Li, M.; Pan, S.; Cheng, Y.; Yuan, Z.-M.; Tao, L. Time-domain numerical simulation for multi-ships moving in waves with forward speed. Ocean Eng. 2023, 290, 116325. [Google Scholar] [CrossRef]
  25. Li, M.-X.; Yuan, Z.-M.; Tao, L. An iterative time-marching scheme for the investigation of hydrodynamic interaction between multi-ships during overtaking. J. Hydrodyn. 2021, 33, 468–478. [Google Scholar] [CrossRef]
  26. Gomes, L.K.; Naik, M. Detection of damage in offshore jacket structure using artificial neural network. In IOP Conference Series: Earth and Environmental Science; IOP Publishing: Bristol, UK, 2023; Volume 1130, p. 012027. [Google Scholar]
  27. Hahnloser, R.H.R.; Sarpeshkar, R.; Mahowald, M.A.; Douglas, R.J.; Seung, H.S. Digital selection and analogue amplification coexist in a cortex-inspired silicon circuit. Nature 2000, 405, 947–951. [Google Scholar] [CrossRef] [PubMed]
  28. Reina, R.Q.; Álamo, G.M.; Aznárez, J.J. Global Sensitivity Analysis of the Fundamental Frequency of Jacket-Supported Offshore Wind Turbines Using Artificial Neural Networks. J. Mar. Sci. Eng. 2024, 12, 2011. [Google Scholar] [CrossRef]
Figure 1. 2D coordinate system.
Jmse 13 00554 g001
Figure 2. Particulars and coordinate system.
Jmse 13 00554 g002
Figure 3. Photos of the actual launch site: (a) 0 s, (b) 20 s, (c) 40 s, and (d) 60 s.
Jmse 13 00554 g003
Figure 4. Diagram of jacket-launching process: (a) pre-launch, (b) first tripping, (c) just of separation, and (d) end of separation.
Jmse 13 00554 g004
Figure 5. Comparison of actual measurement and simulation between barge and jacket: (a) surge, (b) heave, (c) roll, and (d) pitch.
Jmse 13 00554 g005
Figure 6. Movement of jacket in plane: (a) z-axis plane, (b) horizontal plane, and (c) different thruster speeds.
Jmse 13 00554 g006
Figure 7. Velocity curve of jacket center of gravity under different environmental parameters.
Jmse 13 00554 g007
Figure 8. Acceleration curve of jacket center of gravity under different environmental parameters.
Jmse 13 00554 g008
Figure 9. Pressure on the side of the rocker arm: (a) left and (b) right.
Jmse 13 00554 g009
Figure 10. The distance between the rocker arm and jacket tail varies in the time domain.
Jmse 13 00554 g010
Figure 11. Comparison between predicted values and dataset values of barge attitude: (a) barge surge, (b) barge sway, (c) barge heave, and (d) barge pitch.
Jmse 13 00554 g011
Figure 12. Comparison between predicted values and calculated values of jacket attitude: (a) jacket surge, (b) jacket sway, (c) jacket heave, and (d) jacket pitch.
Jmse 13 00554 g012aJmse 13 00554 g012b
Table 1. Barge-related parameters.
ItemsSymbolUnitValue
Length overall L O m215
Breadth (Forebody/Afrbody) B f / B A m42.5/65.0
DepthDm14.25
Lightship weight W L MT32,616.45
VCG above keel Y c g m8.19
LCG aft of the bow X c g m113.52
Roll radii of gyration R x x m19.072
Pitch radii of gyration R y y m62.35
Yaw radii of gyration R z z m62.35
Skidway height H S k m2.035
Rocker arm length L R a m24.65
Table 2. Valid prediction range.
ParameterRangeParameterRange
Draft/m8.00~12.00Flow speed/(m·s−1)0.50~1.00
Angle of trim/(°)3.00~5.00Regular wave height/m0.50~2.50
Friction coefficient0.03~0.07regular wave period/s1.00~9.00
Wind speed/(m·s−1)4.00~12.00Wind and wave speed (m·s−1)0.00~5.00
175.00~185.00
355.00~360.00
Table 3. Validation cases.
ConditionFHJ
Draft/m8.0010.0012.00
Trim angle/(°)5.004.005.00
Friction coefficient0.070.040.06
Wind speed/(m·s−1)10.0012.006.00
Flow speed/(m·s−1)1.001.000.50
Regular wave height/m2.002.501.00
Regular wave period/s7.009.003.00
Wind, waves, and
Current angle/(°)
0.00175.00355.00
Disclaimer/Publisher’s Note: The statements, opinions and data contained in all publications are solely those of the individual author(s) and contributor(s) and not of MDPI and/or the editor(s). MDPI and/or the editor(s) disclaim responsibility for any injury to people or property resulting from any ideas, methods, instructions or products referred to in the content.

