Article

Nutrient Fluxes from the Kamchatka and Penzhina Rivers and Their Impact on Coastal Ecosystems on Both Sides of the Kamchatka Peninsula

1
V.I. Il’ichev Pacific Oceanological Institute, Far Eastern Branch, Russian Academy of Sciences, Vladivostok 690041, Russia
2
Russian Federal Research Institute of Fisheries and Oceanography, Moskow 105187, Russia
3
Kamchatka Branch of the “Federal Research Institute of Fisheries and Oceanography”, Petropavlovsk-Kamchatsky 683000, Russia
4
State Key Laboratory of Estuarine and Coastal Research (SKLEC), East China Normal University (ECNU), 500 Dongchuan Road, Shanghai 200241, China
*
Author to whom correspondence should be addressed.
J. Mar. Sci. Eng. 2025, 13(3), 569; https://doi.org/10.3390/jmse13030569
Submission received: 30 January 2025 / Revised: 21 February 2025 / Accepted: 11 March 2025 / Published: 14 March 2025
(This article belongs to the Special Issue Coastal Water Quality Observation and Numerical Modeling)

Abstract

:
Catchment areas on volcanic territories in different regions are of great interest since they are enriched with nutrients that contribute significantly to coastal ecosystems. The Kamchatka Peninsula is one of the most active volcanic regions of the world; however, to date, the chemistry of its river waters and the state of its coastal ecosystems remain understudied in connection with volcanism. The two rivers under study are the largest in this region. The Kamchatka River, unlike the Penzhina River, drains volcanic territories, including the areas of the most active volcanoes of the Klyuchevskaya group of volcanoes and the Shiveluch Volcano. The mouth of the Kamchatka River has been shown to have DIP and DIN concentrations of 2.79–3.87 and 10.0–23.8 µM, respectively, during different seasons, which are comparable to rivers in urbanized areas with sewerage and agricultural sources of nutrients. It has been established that volcanoes form high concentrations of nutrients in the catchment area of the Kamchatka River. The Penzhina River has had very low DIP and DIN concentrations of 0.2–0.8 and 0.17–0.35 µM, respectively, near the mouth during different seasons, but high concentrations of DOC, at 5.9 mg/L in spring, which may be due to seasonal thawing of permafrost. During the period of increasing river discharge, seasonal phytoplankton blooms occur in spring and summer in bays of the same name, as shown using satellite data. The biomass of zooplankton in Penzhina Bay is at a level of 100 mg/L, while in Kamchatka Gulf, it exceeds 2000 mg/L. Thus, the biomass of zooplankton in the receiving basin, which is influenced by the runoff of the Kamchatka River with a volcanic catchment area in eastern Kamchatka, is 20 times higher than in the basin, which has a small nutrient flux with the river runoff in northwestern Kamchatka. This study demonstrates the connection between nutrient fluxes from a catchment area and the formation of seasonal phytoplankton blooms and high zooplankton biomass in the coastal area. We also study seasonal, year-to-year, and climatic variability of water discharges and hydrometeorological conditions to understand how nutrient fluxes can change in the foreseeable future and influence coastal ecosystems.

1. Introduction

Nutrient inputs into coastal ecosystems can come from rivers, precipitation, groundwater, and upwelling [1]. However, globally, rivers supply carbon (C), nitrogen (N), phosphorus (P), and silicates (Si) in different forms, such as dissolved and suspended particulate matter. Organic and inorganic particles are the most significant and widely discussed sources for coastal marine basins [2,3].
The increase in river nutrient influxes to shelf ecosystems during the last century is mainly attributed to industrialization, agriculture, and sewerage [4,5,6,7,8,9,10]. The process of enrichment of coastal waters with nutrients, along with phytoplankton blooms and increased production and destruction of organic matter, is known as eutrophication [11,12]. Eutrophication may also result from marine sources of nutrients during processes such as salmon homing and aquaculture [13,14].
Volcanism is also a natural source of nutrients, including Ferrum (Fe) [15,16,17]. Bio-incubation experiments with volcanic ash have shown that elements C, P, Si, N, and Fe released from ash are biologically available to phytoplankton and thus support the growth of biomass in subsequent food links [18,19]. Ash components can become available for coastal ecosystems in several ways, including from aerosols in clouds through rain and snowfall and by transfer from river basins [20].
In Russia, the Kamchatka Peninsula is known as “the territory of volcanoes, salmon and brown bears”, and some areas are part of the UNESCO World Heritage Site “The Volcanoes of Kamchatka”. The two rivers of the Kamchatka region under study, the Kamchatka River and Penzhina River, are the largest in the Russian Far East after the Amur River. Their catchment areas are located relatively close but have very different hydrogeological and hydrometeorological conditions [21,22]. Such differences are conditioned by active volcanism on the Pacific coast in the east of the Kamchatka Peninsula, where there are 29 active volcanoes [23], a feature not present on the Okhotsk coast to the west of the peninsula. Unlike volcanic regions located in “warm latitudes” such as Indonesia and Japan, the Kamchatka Peninsula is covered with snow for up to 300 days a year. Snow cover serves as a kind of accumulator of matter alongside atmospheric suspension during volcanism, including vital Fe and other trace elements [24]. So, in Kamchatka, there is an opportunity to study natural sources and nutrient fluxes in connection with volcanism. Only a few historical works describe the concentration of individual nutrients in the rivers of east Kamchatka [25,26,27], along with two recent works [28,29] and one on the Penzhina River and Penzhina Bay in summer [30]. Taking into account combinations of varying volcanism intensity and ash geochemistry [31,32,33], biological processes in catchment areas [34], snow abundance in winter, and current climatic changes [22,35,36], the concentrations and fluxes of nutrients and the biological responses of coastal ecosystems to river runoff on the Kamchatka Peninsula still remain understudied. Moreover, the influence of continental runoff from volcanic catchment areas of the Kamchatka Peninsula can be underestimated in terms of the formation of the chemical composition of coastal marine waters rich with nutrients, including Fe, in this part of the Pacific Ocean [37,38,39].
In coastal regions under the influence of river runoff from east Kamchatka, phytoplankton blooms, including blooms of potentially toxic species, have occurred regularly over the past 50 years, with tragic consequences for humans and many marine species [40,41]. The seasonality of chlorophyll a (Chl-a) concentration is known in coastal waters around the Kamchatka Peninsula based on satellite observations [42,43]. This is an important feature of the recurrent annual cycles of phytoplankton biomass variability, which supports the diversified food web in the east and west of the Kamchatka Peninsula [44,45,46]. Zooplankton, as the main link between the primary producers and consumers of the upper trophic level, transfer the energy produced by phytoplankton to higher trophic levels [47,48] and contribute significantly to the export of carbon on a global scale [49].
The aim of this paper is to study seasonal variability of the concentration and fluxes of nutrients in the Kamchatka and Penzhina rivers, the largest rivers located in the east and northwest of the Kamchatka Krai, respectively. We also examine the annual and long-term variability of Chl-a concentration over a period of two decades, as well as the summer response of zooplankton accompanying the bloom in their receiving basins on both sides of the Kamchatka Peninsula. The hydrometeorological conditions of Kamchatka over 91 years are also analyzed in order to understand what coastal ecosystem changes may occur in connection with this in the foreseeable future.

2. Materials and Methods

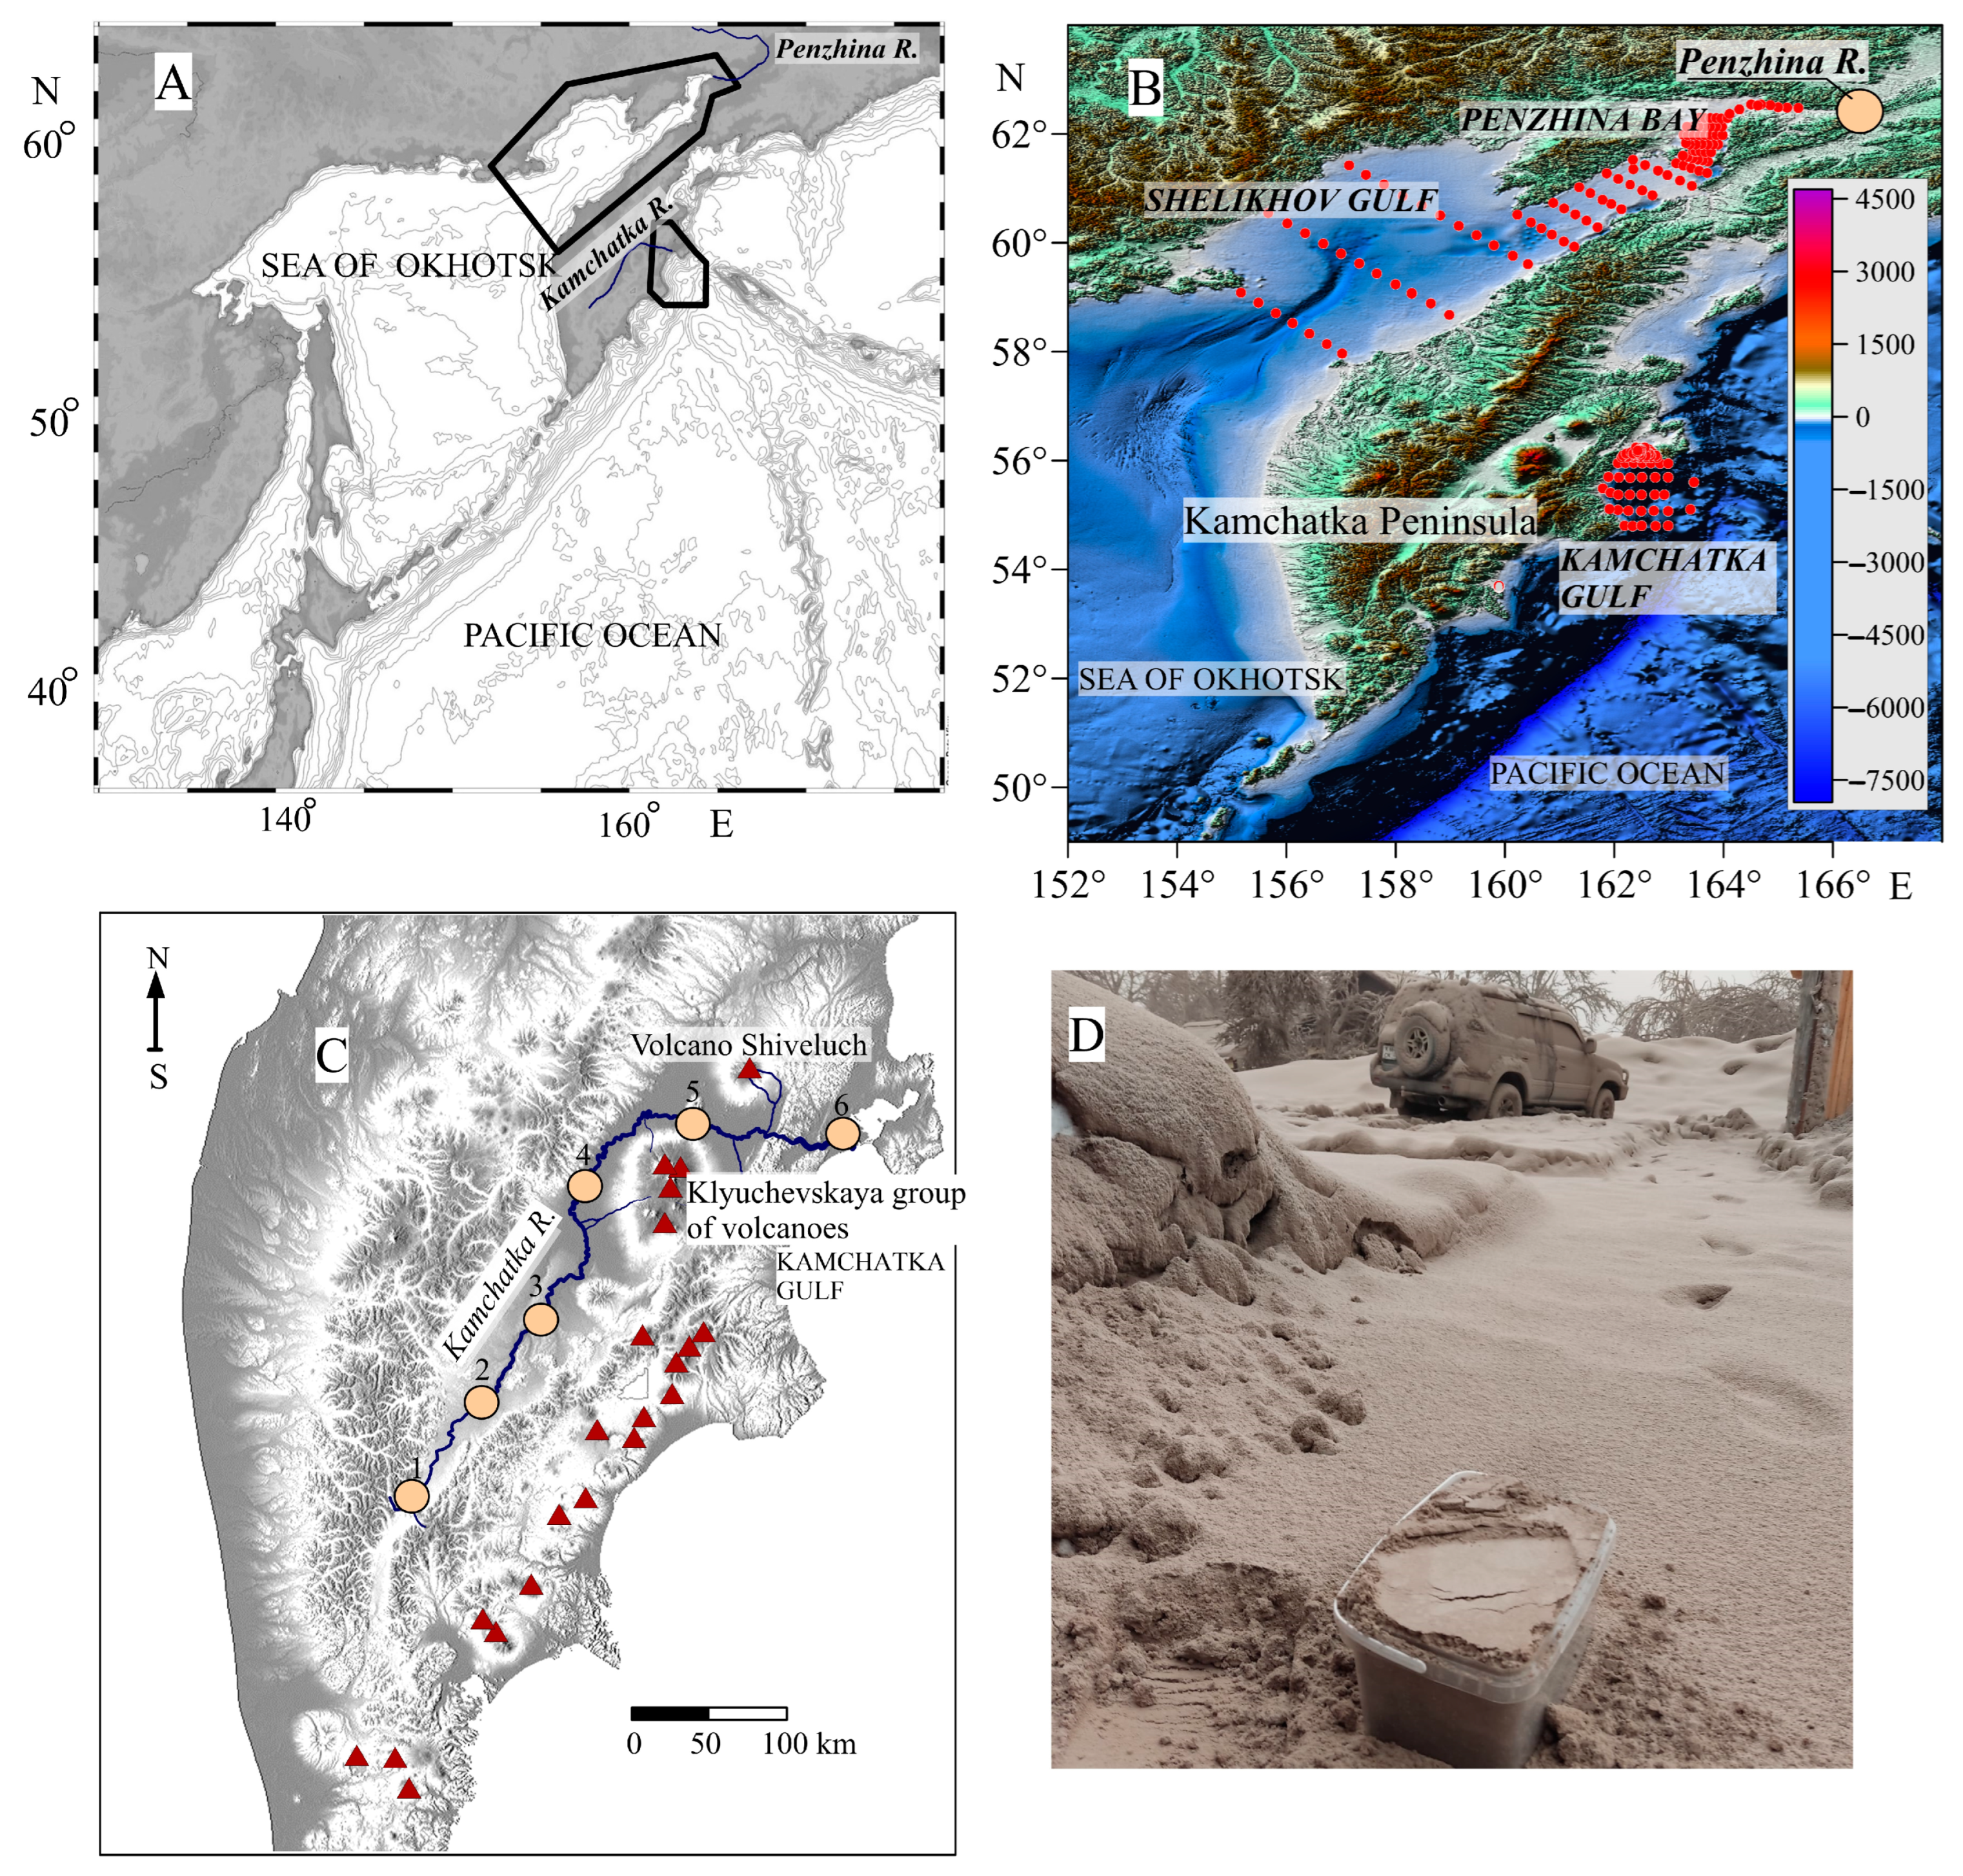
2.1. General Physical and Geographical Characteristics of the Areas Under Study

The Kamchatka Peninsula is located in the Russian Far East (Figure 1). The peninsula is 1250 km long (51–61° N) and 450 km wide (155–163° E). The Kamchatka Peninsula is surrounded by the northwest part of the Pacific Ocean in the east and the Sea of Okhotsk in the west. The Eastern Ridge, which consists of a number of active volcanoes covered with glaciers, stretches along the eastern coast of the peninsula [50].
The climate of the Kamchatka Peninsula is strongly influenced by the Siberian High and the Aleutian Low. In winter, low-pressure systems migrating to the North Pacific Ocean deliver large amounts of precipitation to the east coast of the peninsula. Along the western coast, the precipitation in winter is relatively low [25,26]. The average annual precipitation in the catchment area of the Penzhina River is in the range of 300–400 mm. In other parts of the Kamchatka Peninsula, precipitation varies from 1500 mm in the mountains’ eastern volcanic region to 500 mm on the northwestern coast. Kamchatka climate’s unique feature is its thick snow cover; its average depth is one of the highest on Earth—about 1.5 m. In general, snow cover increases from the northwest (about 0.5 m) to the east and southeast (up to 2.5 m) and from the coasts to the mountains [36]. Due to negative average annual temperatures and a great number of snowfalls, the region under study is covered with snow for 180–300 days a year [25,26].
Very low temperatures are observed on the western coast of the Kamchatka Peninsula compared to the eastern one. Numerous annual fluctuations in air temperature, in the range of about 50–57 °C, are observed in the area at the mouth of the Penzhina River. Winter in the region lasts about 7 months. The coldest month is December, when the average monthly air temperature drops to −23 °C and −29 °C downstream and upstream of the river, respectively. The absolute minimum air temperature is −52.6 °C in the lower part of the Penzhina River basin and −59.5 °C in the area of Penzhina River headwaters. The warmest month of the year is July, when the average monthly air temperature reaches 13–14 °C. At the same time, in the daytime, the air warms up to 18–19 °C on average. Ice phenomena on the rivers of the Kamchatka Peninsula are observed from early November to May.
The Kamchatka River basin is located in the zone of ash falls where tephra spreads to a distance of hundreds of kilometers from active volcanoes. The most active volcanoes in the region under study are Shiveluch, Klyuchevskoy, Bezymianny, Plosky Tolbachik, and Karymsky [51]. The most active volcanoes of the Klyuchevskaya group are located in the lower part of the Kamchatka River catchment area (Figure 1), including Klyuchevskoy Volcano, which is the highest active volcano in Eurasia with a height of 4850 m above sea level, and Shiveluch Volcano, with a height of 3283 m. Active volcanism mainly forms a volcanic type of soil in the basins of the rivers under study [34].
The population density in the Kamchatka River basin is low. The largest settlements are Milkovo, Klyuchi, and Kozyrevsk, with populations of around 7300, 4200, and 950 people, respectively (according to the 2021 Russian census). Economic activity in the river basin is minimal, and the environmental conditions remain almost intact. The Penzhina River basin is located on the continental north of the Kamchatka region and is sparsely populated. The largest settlement in the Penzhina River valley is the Manily settlement, with a population of around 700 people (according to the 2021 Russian census). Thus, the rivers under study serve as objects for examining natural biochemical processes under volcanic conditions in the Kamchatka River and without them in the Penzhina River.

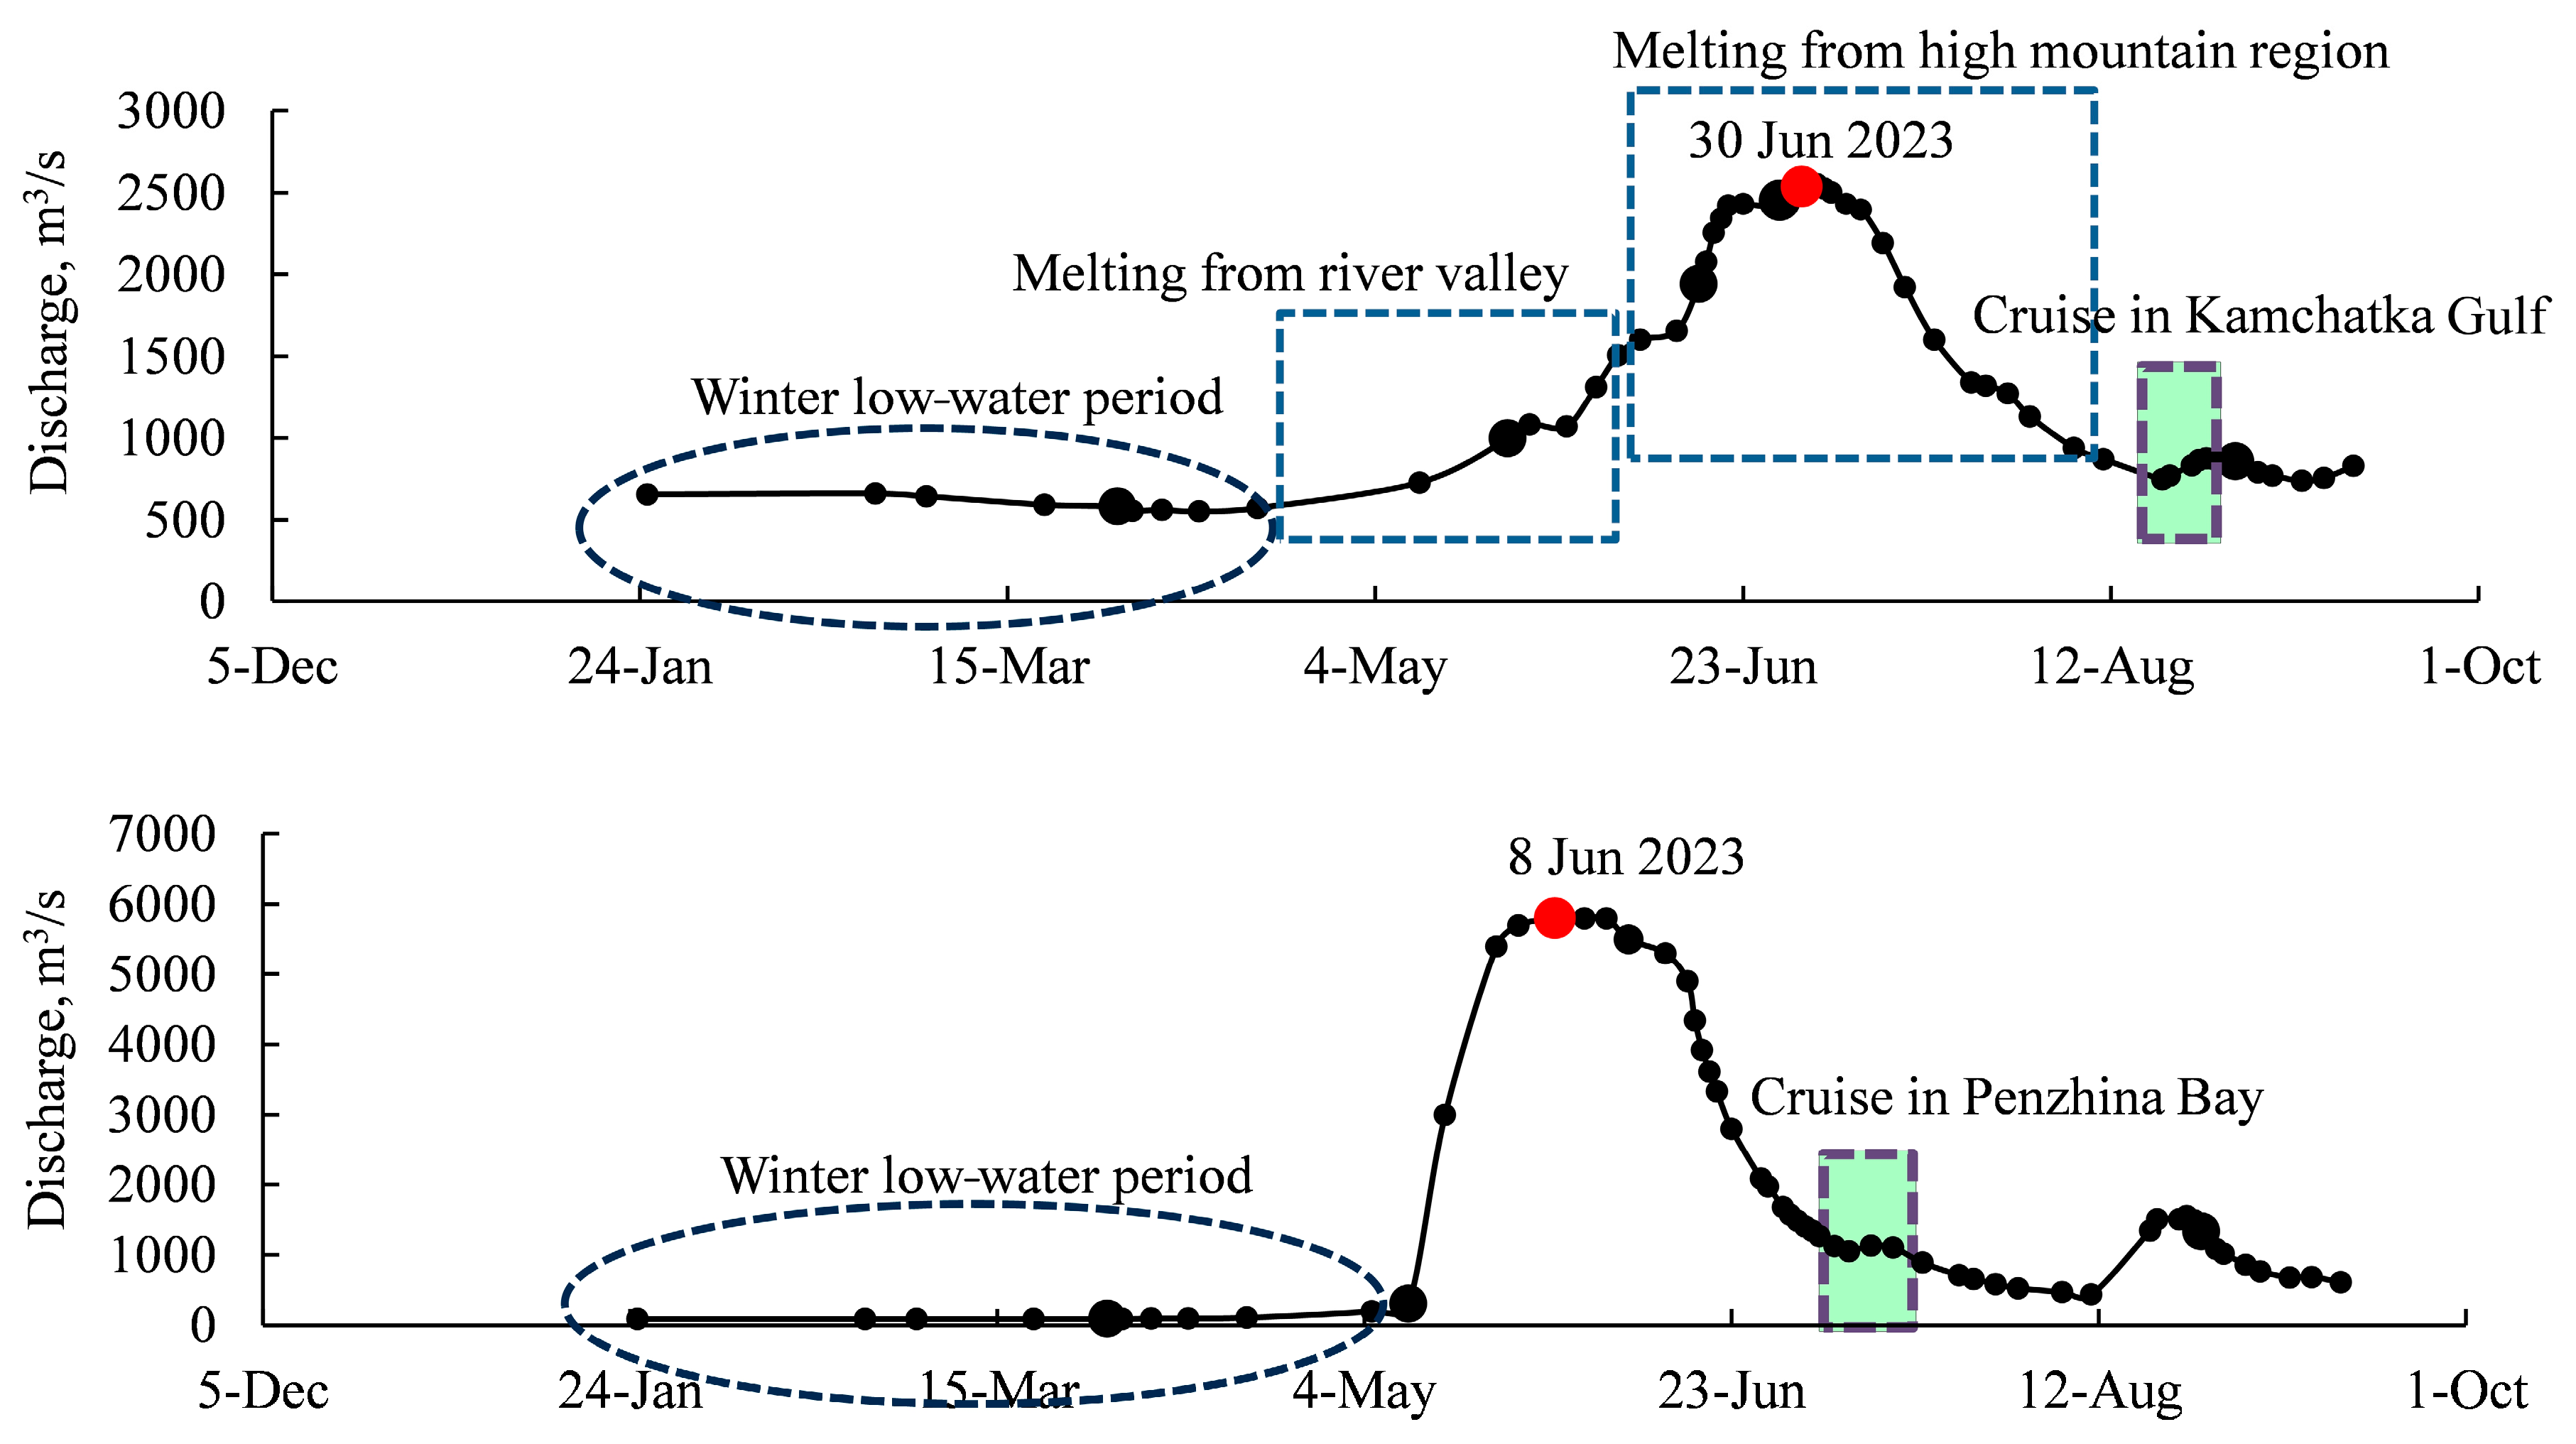
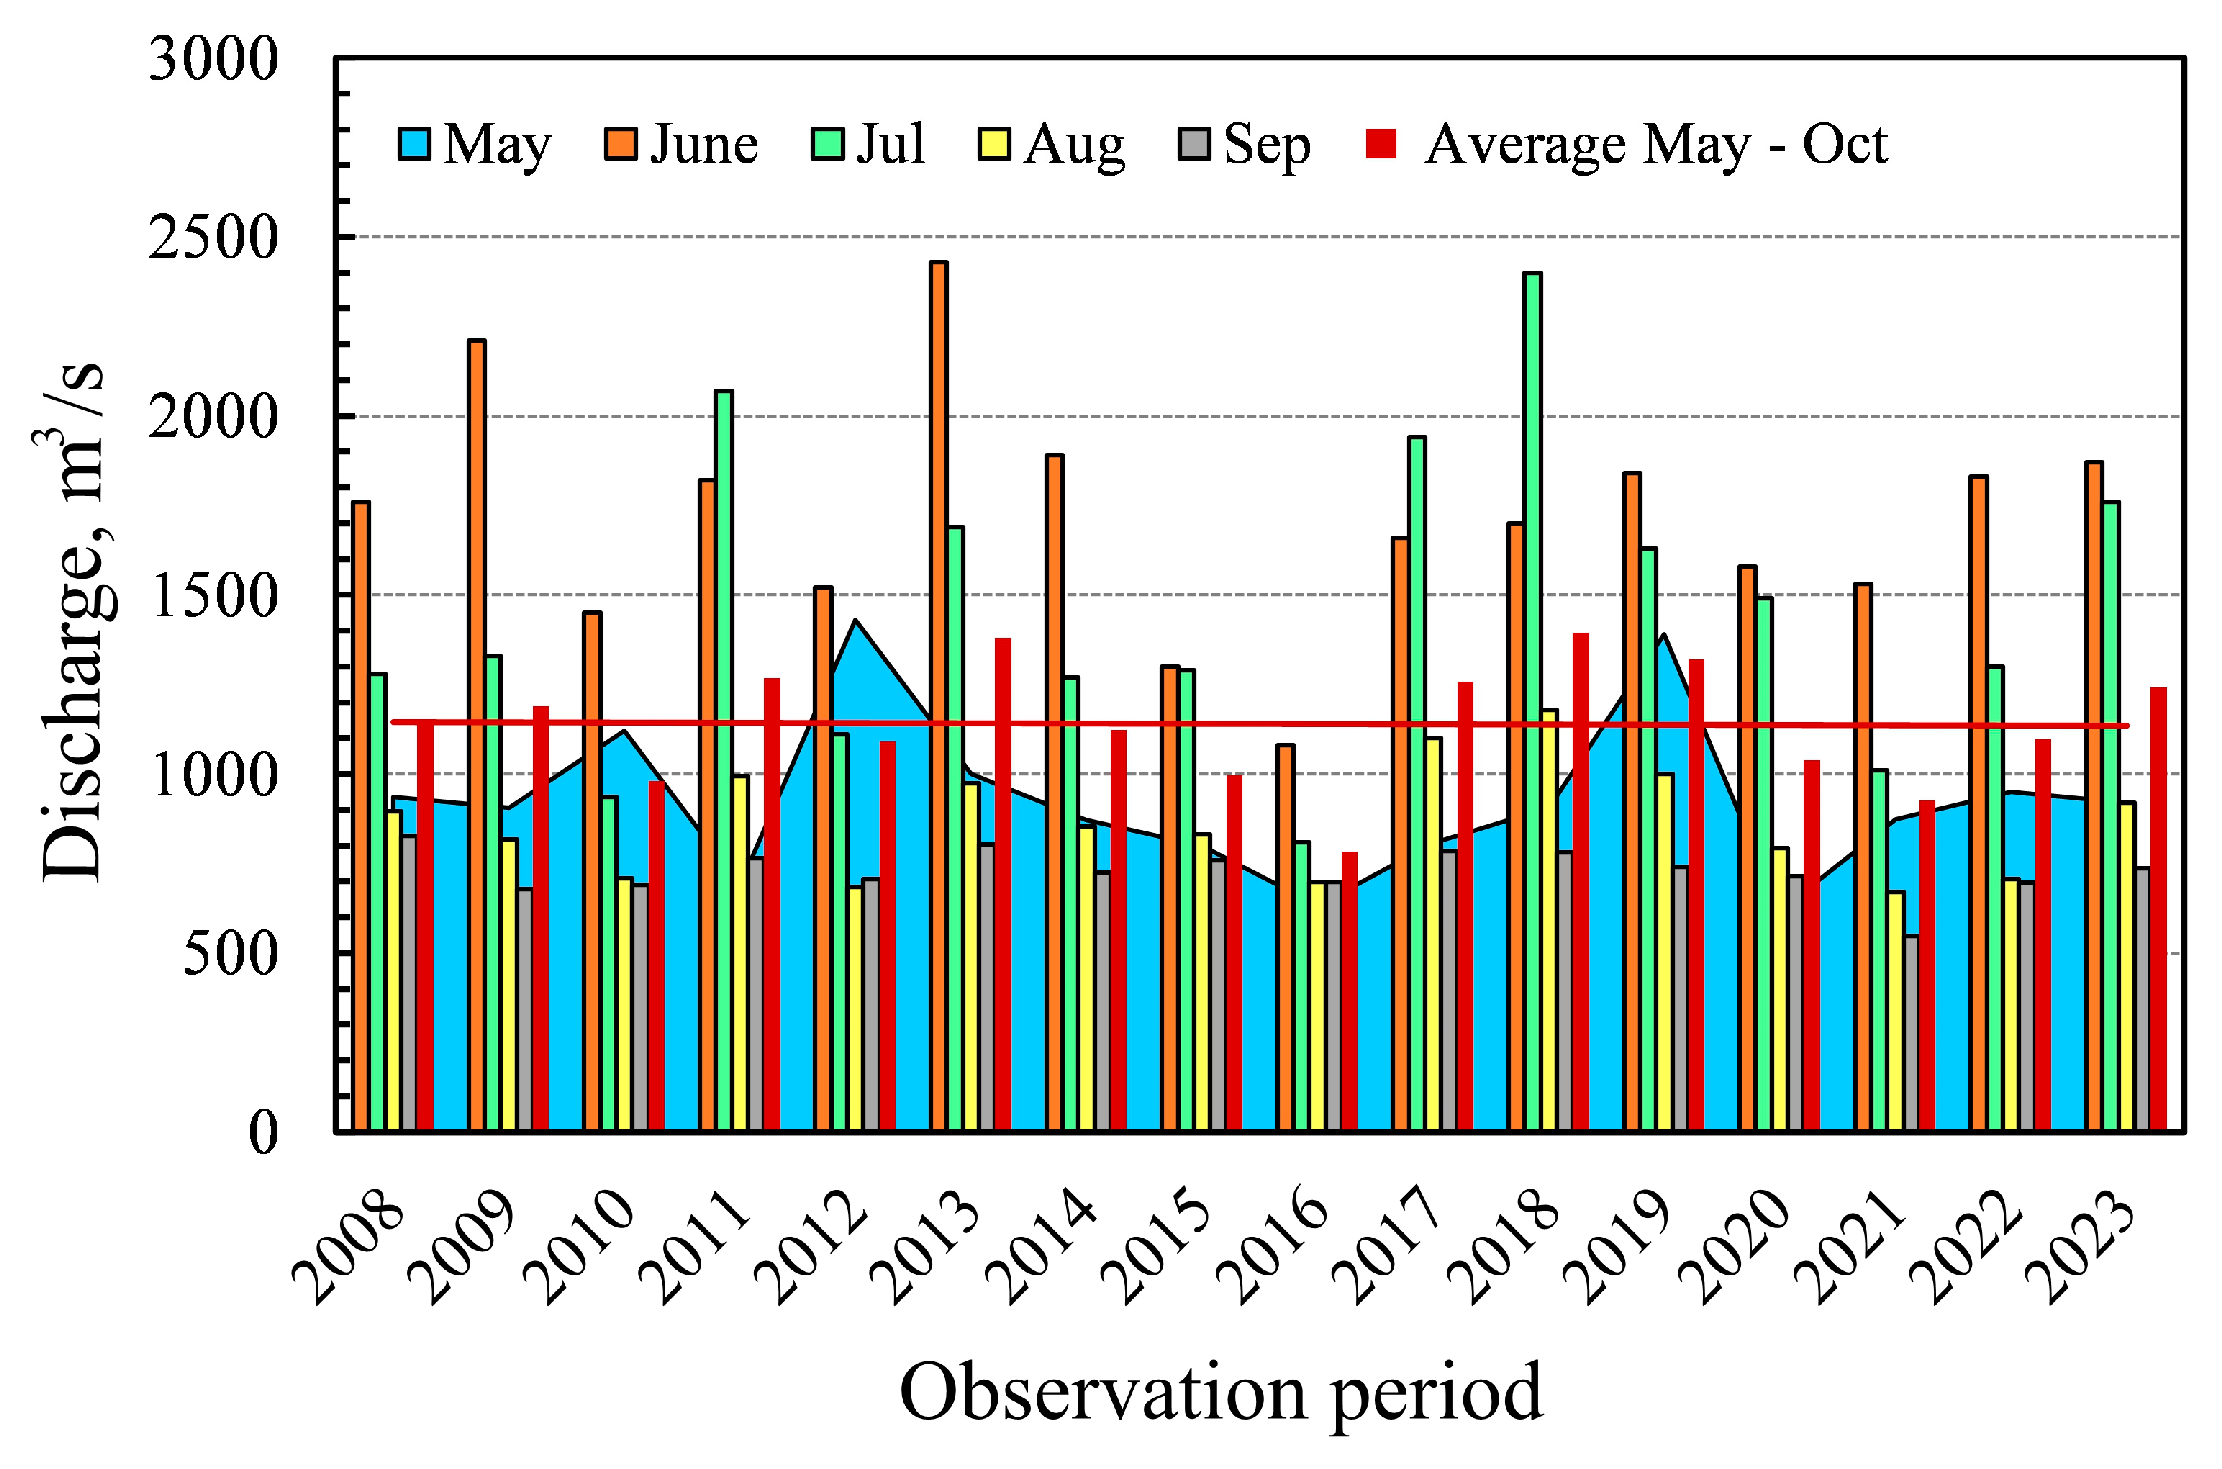
2.2. Water Regime of the Rivers Under Study

The Kamchatka River has a catchment area of 55,900 km2 with a length of 758 km. The Kamchatka River has mainly groundwater flow with significant involvement of snowmelt runoff. The size of underground runoff for an average water year for the Kamchatka River is 50–70%. A great share of underground water in the surface runoff of these rivers is explained by the features of the geological framework of river basins, more specifically, by the distribution of volcanogenic effusive rocks. This provides a supportive environment for the infiltration of melt- and rainwater and for the accumulation of considerable reserves of underground waters exerting a reservoir action on river runoff [25,26].
The key phase of the water regime for the Kamchatka River is lengthy spring and summer flooding from May to July, which accounts for 50–75% of the annual runoff. The discharge usually increases from the beginning of May and has two peak levels. The first peak is small and is caused by snow melting in river valleys; the second peak is caused by snow and ice melting in high mountain regions and occurs at the end of June–beginning of July (Figure 2). After the flooding, from September to October, a relatively water-abundant stable autumn low-water period begins. Then, from the end of October to the beginning of May, a winter low-water period is established [25,26].
The annual average discharge of the Kamchatka River at Bolshiye Shcheki observation station is 915 m3/s (a description of the posts and observation periods is given in [52]). The maximum average daily discharges are usually observed at the end of June. For example, on 19 June 2013, water discharge reached 3010 m3/s at Klyuchi observation station (https://gmvo.skniivh.ru/index.php?id=296 (accessed on 1 December 2024)), and it was at its absolute maximum over the past decade.
The Penzhina River has a catchment area of 73,500 km2 with a length of 713 km. The Penzhina River is mainly fed by snow (up to 65%) and rain (up to 25%) [53]. The peak of annual runoff of up to 80% occurs during spring and summer flooding, which starts in the middle of May. The average annual water discharge in the mouth is 682 m3/s. The maximum discharge during the flooding is 6644 m3/s on average, but it can exceed 10,000 m3/s. The flooding (in July–September) is followed by a period of high water capacity caused by rainfall floods with a water discharge of more than 365 m3/s. The second most important river for Penzhina Bay is the Talovka River. The catchment area of the Talovka River is 24,100 km2. The average annual discharge of this river is 230 m3/s (references to primary sources are in [53]).
The average discharge of the Kamchatka River from May to October over a long-term period (Figure 3) barely changes and is about 1150 m3/s, which is close to the average annual discharge over a long-term period for St. 5 in Figure 1. The maximum average monthly discharges can be observed both in June and July and comprise 2400 m3/s. The results of this paper show that 2023 was an average year in terms of water discharge for the Kamchatka River from May to October. The average monthly discharges for June and July in 2023 were close to each other at 1870 and 1760 m3/s, respectively, and for August and September were 919 and 736 m3/s, respectively (data obtained from an electronic resource https://gmvo.skniivh.ru/ (available on 1 December 2024)).

2.3. Characteristics of Kamchatka Gulf as Well as Penzhina Bay and Shelikhov Gulf

Kamchatka Gulf is one of three similar gulfs of eastern Kamchatka (Figure 1C). Kamchatka Gulf has a width of 74 km from the maritime boundary to the coastline and a length of about 148 km between the entrance capes. The depth of Kamchatka Gulf at the entrance is up to 2000 m. This means that a substantial area and water column of Kamchatka Gulf refers to the oxygen minimum zone (OMZ). This zone in the area of eastern Kamchatka is located at a depth from 200 to 1500 m (https://www.ewoce.org/gallery/P13_OXYGEN.gif (available on 1 December 2024)). Tides in Kamchatka Gulf are irregularly diurnal, with a height of up to 2 m.
Penzhina Bay and Shelikhov Gulf are located in the northwestern part of the Sea of Okhotsk in sub-polar latitudes (Figure 1). The total lengths of Penzhina Bay and Shelikhov Gulf are about 800 km from the Penzhina River mouth. The depth is up to 62 m in Penzhina Bay and up to 350 m in Shelikhov Gulf. The key feature of this receiving basin is the large tidal range against the background of the entire World Ocean. The highest possible tide in the northern part of Penzhina Bay can exceed 13 m [54].

2.4. Sampling in the Kamchatka River and Penzhina River

The locations of the water sampling stations are shown in Figure 1 and the coordinates are given in Table 1. Sampling at all six stations in the Kamchatka River was performed for one day on the following dates: 1 April 2023; 22 May 2023; 17 June 2023; and 6 September 2023. The day after sampling, water samples were delivered to the hydrochemistry laboratory of POI FEB RAS (Vladivostok city), where measurements were immediately taken. Sampling in the Penzhina River was performed at the station near Kamenskoye settlement (coordinates are given in Table 1) on the following dates: 21 May 2024; 13 June 2024; and 12 July 2023. Right after sampling, samples from the Penzhina River were frozen at a temperature of −20 °C and delivered to the hydrochemistry laboratory of POI FEB RAS (Vladivostok city) within 5–7 days. On the date of delivery, nutrients in the mineral form—DIP, DIN (NO2, NO3 NH4), and silicates (dissolved silicate, DSi)—and organic forms of nitrogen and phosphorus (Ntot = DIN + Norg; Ptot = DIP + Porg) were measured.

2.5. Sampling in Kamchatka Gulf, Penzhina Bay and Shelikhov Gulf

In 2023, we conducted an expedition to Penzhina Bay and Shelikhov Gulf, and then immediately to Kamchatka Gulf, thus obtaining data after the spring and summer flooding of both gulfs. The cruises were conducted on research vessel Akademik Oparin with a total tonnage of 2700 tons, in parallel with which a speedboat was used to work in shallow waters and directly in the Penzhina River and Kamchatka River. In Kamchatka Gulf, 70 stations (Figure 1) with profiling and water sampling at standard depths and 28 stations with long-line fishing of zooplankton were installed from 25 August 2023 to 29 August 2023. In Penzhina Bay and Shelikhov Gulf, 108 stations (Figure 1) with profiling and water sampling at surface and bottom depths and 13 stations with long-line fishing of zooplankton were installed from 3 July 2023 to 12 July 2023.
For profiling and water sampling, the six-position water sampler with 4 L sample bottles SBE 55 ECO and hydrologic profiler SBE 19 PLUS (Sea-Bird Scientific, Bellevue, Washington, DC, USA) were used. Pressure, temperature, conductivity, chlorophyll a (Chl-a), turbidity, and PAR sensors measured at a frequency of 4 Hz for the subsequent averaging of data after one meter. For profiling and water sampling on a speed boat, 5 L Niskin bottles and an RBR Maestro profiler (RBR Ltd., Ottawa, ON, Canada) were applied. In both cases, the same set of sensors was used for profiling. Surface and bottom waters were sampled in layers 0.5–1.5 m in depth and 1.0–2.0 m from the bottom, respectively. The PAR sensor was used to determine the photic zone thickness.
Long-line fishing of zooplankton was performed to the bottom depth or to a depth of 100 m under a speed of 0.5 m/s with the help of a Jedi plankton net (diameter: 0.5 m, mesh size: 0.3 mm). The samples were preserved in 4% formaldehyde diluted in seawater.

2.6. Sampling of Fresh Volcanic Ash and Subsequent Experiment on Releasing Nutrients from Ash

The peculiarity of 2023 was the strongest eruption of Shiveluch Volcano for several decades, which occurred on April 11 (the report of the director of the Institute of Volcanology and Seismology, Far Eastern Branch of the Russian Academy of Sciences, A.Yu. Ozerov, and multiple media reports). On the day of the Shiveluch Volcano eruption on 11 April 2023, an ash sample was taken near Klyuchi settlement at station 5 (Figure 1). The sample was placed in a plastic container and frozen at a temperature of −20 °C. Within three days, the sample of ash was delivered to POI FEB RAS. Then, an experiment was carried out with measurements of concentrations of nutrients in a series of two types of water samples—sea water with a salinity of 34.06 psu and Milli-Q water—to which ash was added at a ratio of 1:10. Samples were poured into 0.5 l dark plastic bottles, which were continuously shaken and kept at a temperature of about 23 °C throughout the experiment. After the ash came into contact with water, the concentration of nutrients at different time intervals from 10 min to 9 days was measured. The content of the main ash elements was measured at the Laboratory of Analytical Chemistry of Far East Geological Institute, FEB RAS, using atomic emission spectroscopy with inductively coupled plasma on an iCAP 7600Duo spectrometer (Thermo Scientific Corporation, Waltham, MA, USA).

2.7. Laboratory Analysis

Salinity was measured using an Autosal 8400B salinity meter (Guildline Instruments, Smiths Falls, ON, Canada) with an accuracy of 0.002. The concentration of NH4 was determined using the indophenol method, and the concentrations of NO2 and NO3, DSi, and DIP were measured using standard colorimetric methods [55]. The detection limit comprised 0.01 µM for DIP, NO3, and NO2 and 0.02 µM for DSi. Concentrations of Ntot and Ptot were determined using a Skalar San++ flow analyzer (Skalar, Breda, The Netherlands) with an accuracy of ±1%. The concentration of DOC was measured on a Shimadzu TOC-VCPN analyzer (Shimadzu, Kyoto, Japan) with an accuracy of ±2%. Studies of zooplankton in the laboratory included the determination of species composition and quantitative analysis of all species groups found in the samples. The main zooplankton groups were identified using general reports and compilations.

2.8. Estimations of Water Discharges and Nutrient Fluxes

The average daily discharges of the Kamchatka and Penzhina Rivers for 2023 were obtained based on available data on levels in 2023 and their dependencies on the water discharges available for previous years. Pursuant to this estimation, the maximum discharge of the Kamchatka River was observed on July 3 and reached 2553 m3/s, and for the Penzhina River, it was observed on June 8 and reached 5800 m3/s (data obtained from an electronic resource: https://gmvo.skniivh.ru/ (available on 1 December 2024)).
Fluxes of dissolved substances supplied by the Kamchatka and Penzhina rivers in receiving basins for the dates of sampling were calculated using the following equation [6]:
Ji = Q Ci
where Ji—flux of substance i; Q—water discharge in the river; and Ci—concentration of substance i in river waters.
The total annual fluxes (Fi) of substances in the receiving basins were obtained based on the ratios between Q and Ji on specific dates of the expedition. Based on the ratios obtained, the fluxes for each day of the year with the relevant average daily discharges were calculated and summed up for the year [6]:
F i = i = 1 n J i
where n—number of days in a year.
In the case of calculating annual fluxes for the Penzhina River in 2023, the concentrations of nutrients obtained during field sampling in 2023 and 2024 were used; see Section 2.4. This was conducted with the assumption that the concentration of nutrients in the Penzhina River primarily depends on the season and water discharge, as well as that interannual variability for the same discharge values is relatively small.

2.9. Satellite Remote Sensing Data for Chl-a

The time series of Chl-a were examined using standard mapped monthly average composites of 4 km resolution data collected from January 2003 to December 2023. Pixels covered by clouds were replaced by an average of eight non-cloud-neighbor pixels for each image. The periods with ice covering the water zones from November to February were excluded from the analysis. The Copernicus-GlobColour and OC-CCI are long-term series of Ocean Colour products at a global level based on a multi-sensor approach, involving a merger of SeaWiFS, VIIRS, MERIS, MODIS-Aqua, OLCI-S3A, and OLCI-S3B, using the best-performing atmospheric correction and Chl-a algorithms, along with a temporally weighted bias correction aiming to minimize differences between sensors. Chlorophyll-a concentration is generated using a blended combination of OCI, OCI2, OC2, and OCx algorithms, depending on the water class. The data are available at https://data.marine.copernicus.eu/product/OCEANCOLOUR_GLO_BGC_L4_MY_009_104/description (accessed on 1 November 2024).

2.10. Software

The software used for statistical analysis was MS Excel 2019. The spatial distribution maps were developed using the Surfer 20 program (Golden Software LLC, Golden, CO, USA). We used MATLAB R2016b 9.1.0.441655 (MathWorks, Inc., Natick, MA, USA) to visualize satellite image data.

3. Results

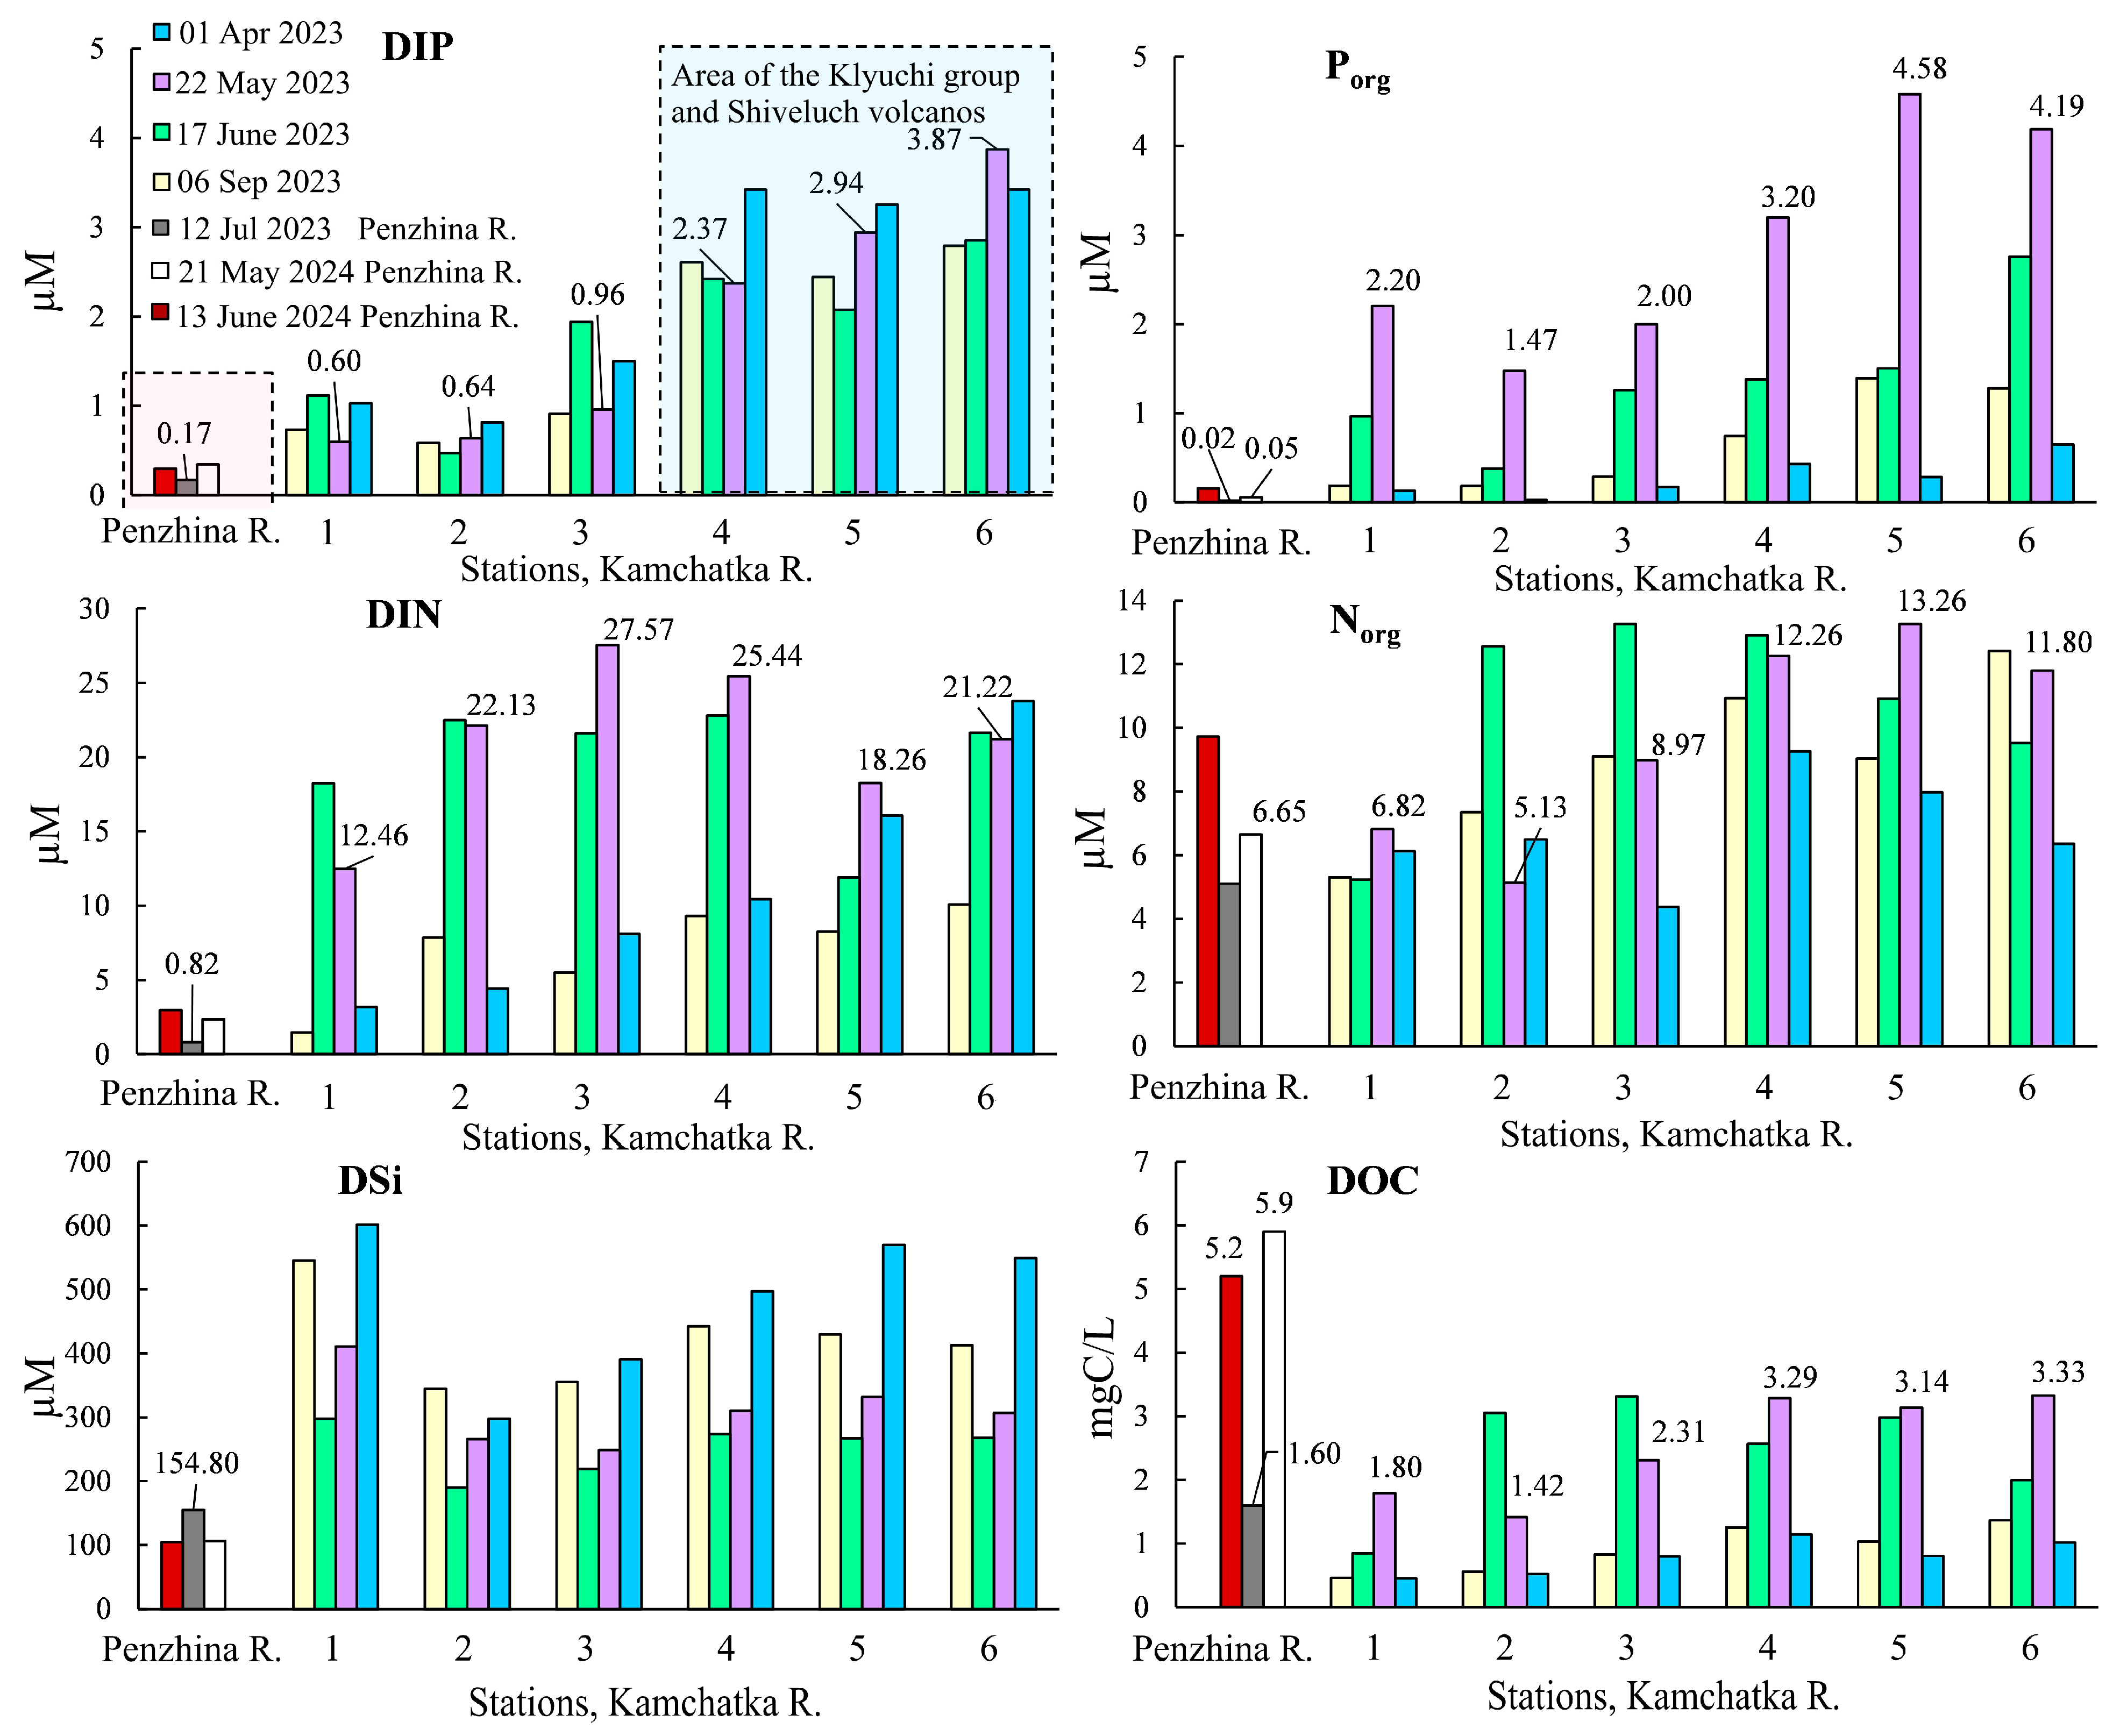
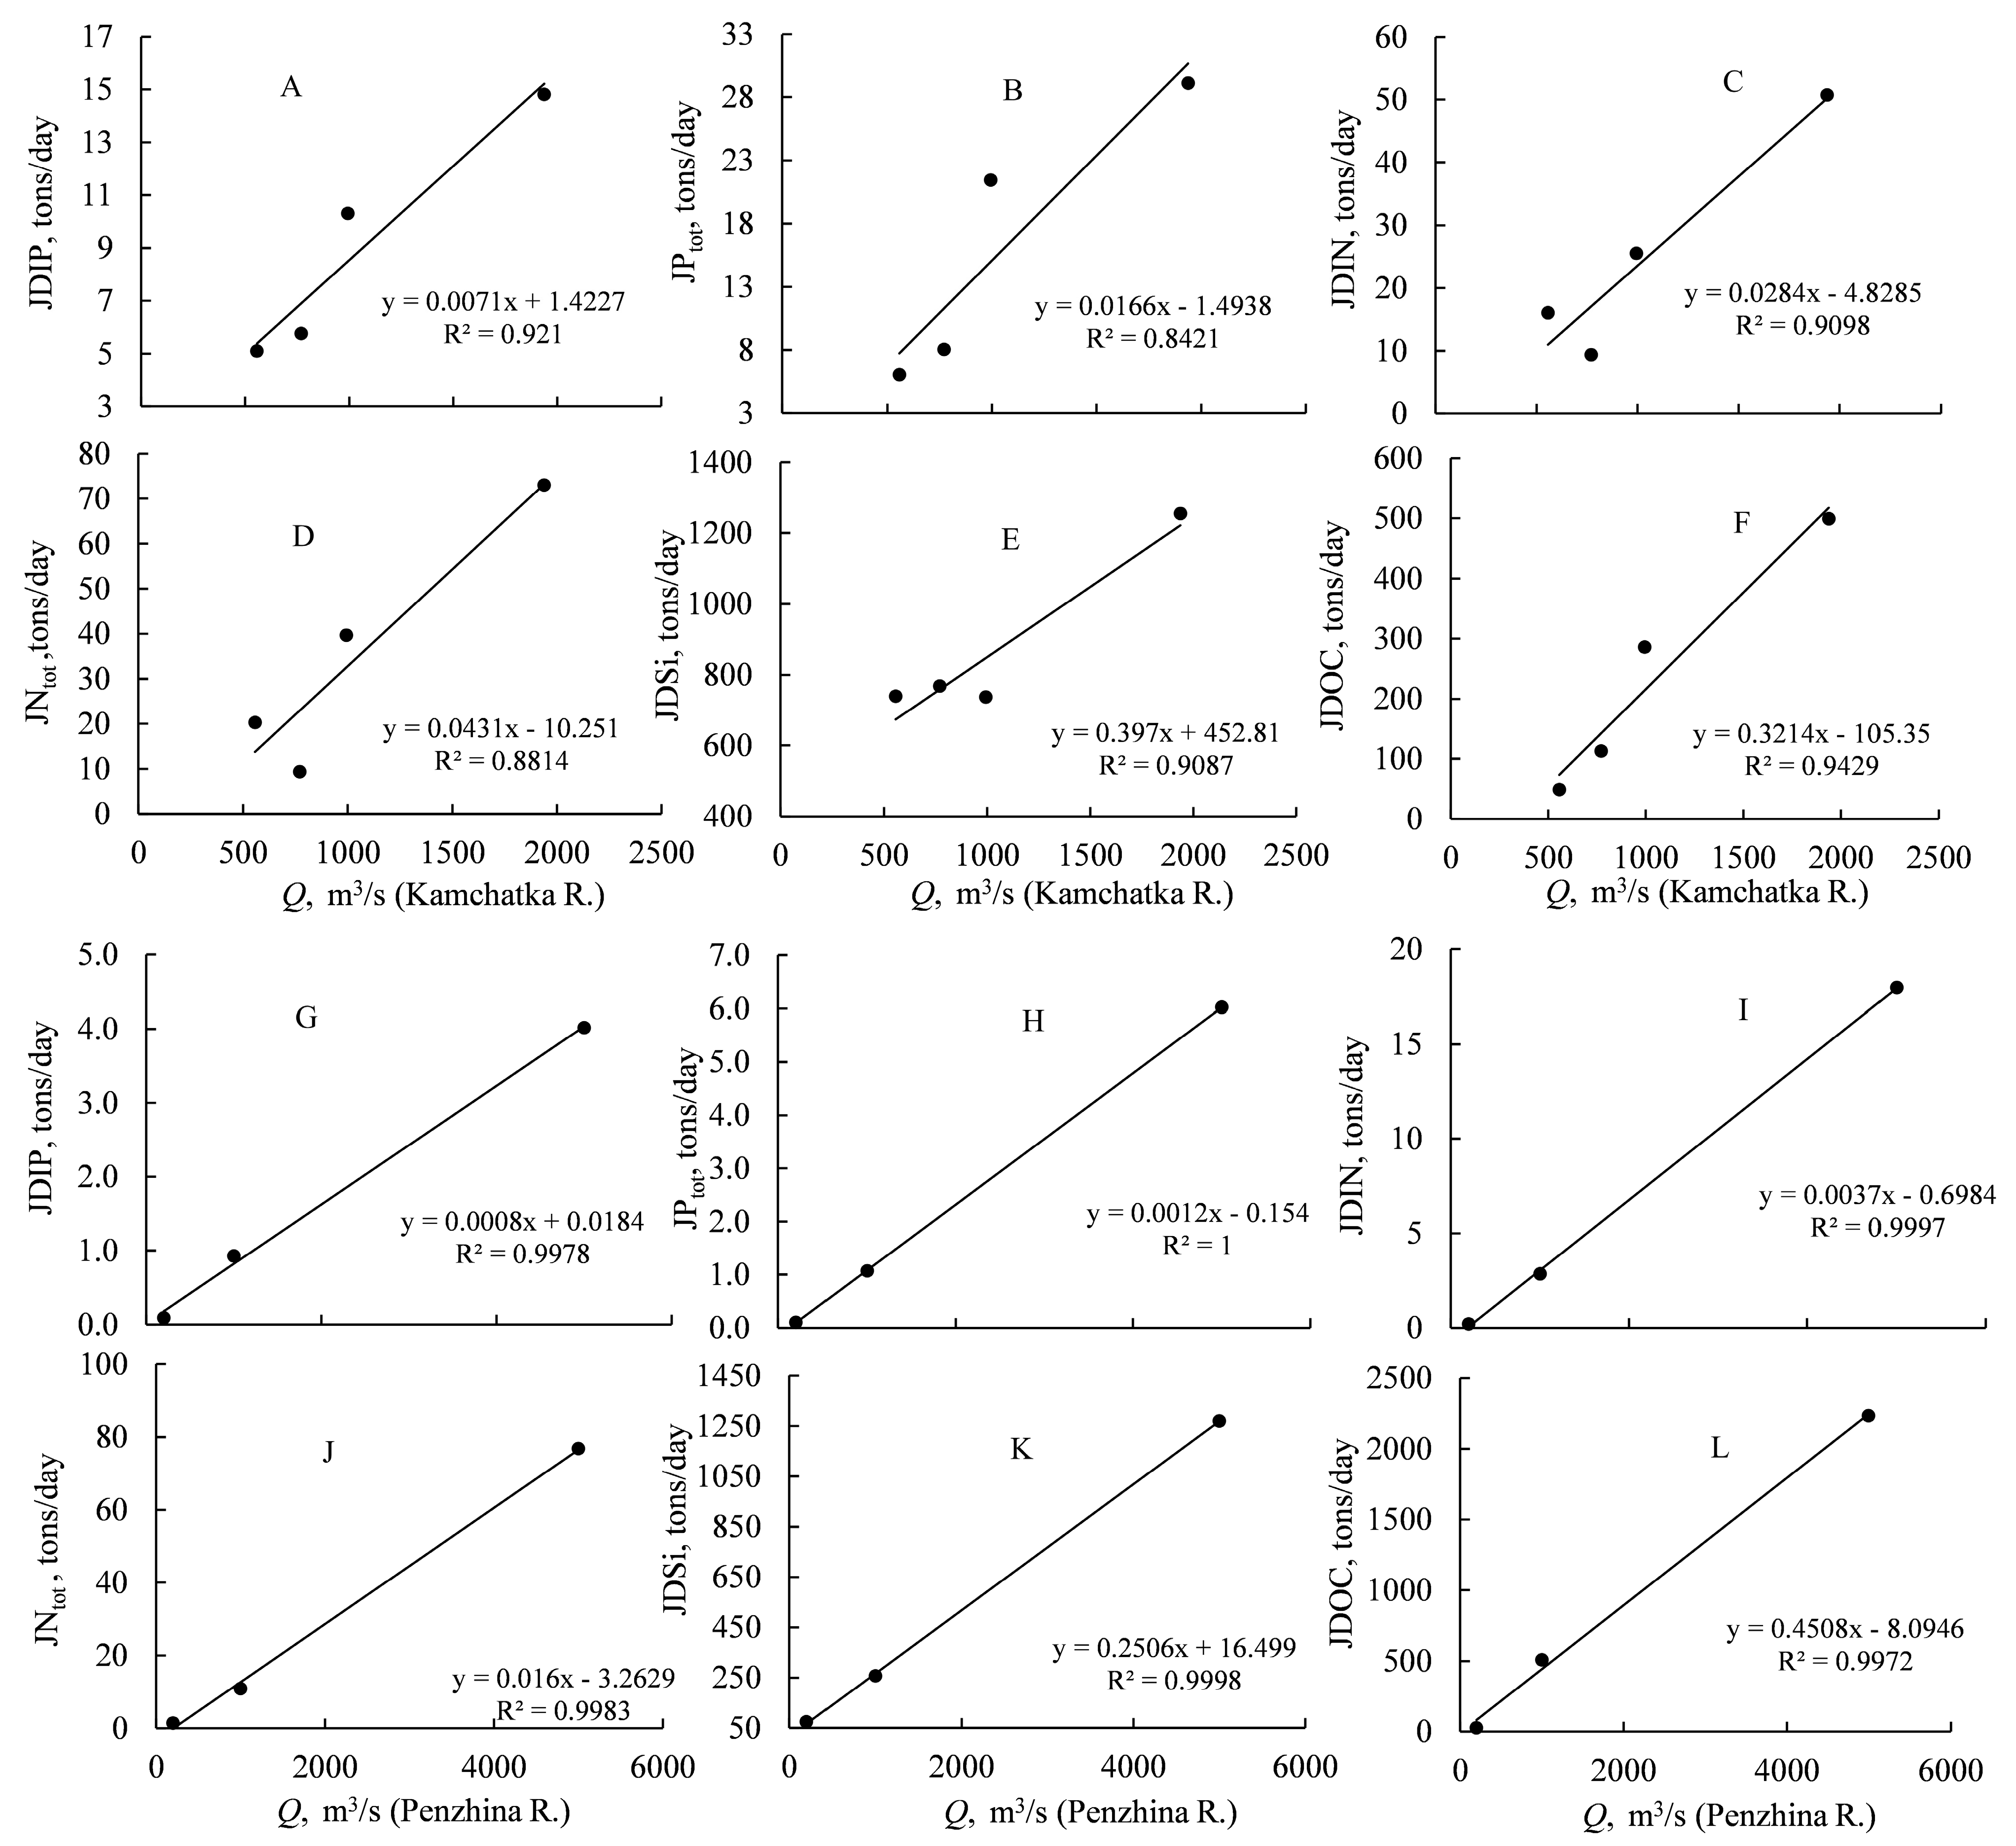
3.1. Seasonal Variability of Concentrations and Fluxes of Nutrients with the Runoff of the Kamchatka and Penzhina Rivers

The key features of the seasonal distribution (Figure 4) in the rivers under study are shown below. Firstly, the maximum DIP concentrations for river waters in all seasons were observed in the Kamchatka River in the area of the Klyuchevskaya group of volcanoes and Shiveluch Volcano—more than 2.37 µM. The maximum DIP concentration of up to 3.87 µM was recorded at station 6 in May during the period after the Shiveluch ash fall and intense snow melting in the valley of the Kamchatka River. The maximum concentrations of Porg (4.58 µM) in the Kamchatka River were also observed in the area directly influenced by volcanoes at stations 4–6 in May. Against this background, the DIP concentration in the Penzhina River was insignificant and was at a level of less than 0.2 µM. The concentrations of DIN and Norg were increased in the Kamchatka River relative to the Penzhina River with maximum values of 27.57 and 13.26 in May and June for DIN and Norg, respectively. The increased concentrations of DSi were recorded at almost all stations for the Kamchatka River, and the maximum concentrations in the range of 500–600 µM were observed in April. In the Penzhina River, the DSi concentrations were less than 154.8 µM. The rivers under study are characterized by the maximum DOC concentrations during periods of increasing water discharges—in May and June. At the same time, in the Kamchatka River, the maximum DOC concentration was 3.3 mg/L. For the Penzhina River, the maximum DOC concentrations of 5.9 and 5.2 mg/L were recorded in May and June, respectively, almost twice as high as those observed for the Kamchatka River.
The nutrient fluxes calculated on the basis of (1) are shown in Figure 5. Firstly, in the Kamchatka River, the value of JDIP increased approximately threefold, and the value of JPtot increased approximately fivefold with the increase in water discharge from April to June. Secondly, for the Kamchatka River, the values of JDIN and JNtot increased 3- and 3.6-fold, respectively. Thirdly, the values of JDOC for both rivers increased approximately tenfold with the increase in water discharge. Fourthly, the increase in JDSi for both rivers was insignificant—less than twofold. Thus, under the increasing discharges in the rivers, the following trend for nutrient fluxes was observed: the greatest increase in JDOC, with an increase in JDIN, JDIP, and JDSi to a lesser extent. The ratios of nutrient fluxes from the discharges of the Kamchatka and Penzhina Rivers, in most cases, demonstrate a near-linear dependence (Figure 5). With the help of Equation (2) and resulting equations (in Figure 5), the annual nutrient fluxes in the receiving basins (Table 2) were calculated.
Table 2 shows that FDIP and FPtot are 10 and 14 times higher, respectively, for the Kamchatka River than for the Penzhina River. At the same time, the values of FDIN, FDSi, and FNtot differ six-, three-, and twofold, respectively, between the Kamchatka River and Penzhina River, while FDOC for the Penzhina River, by contrast, is more than twice as high as for the Kamchatka River.

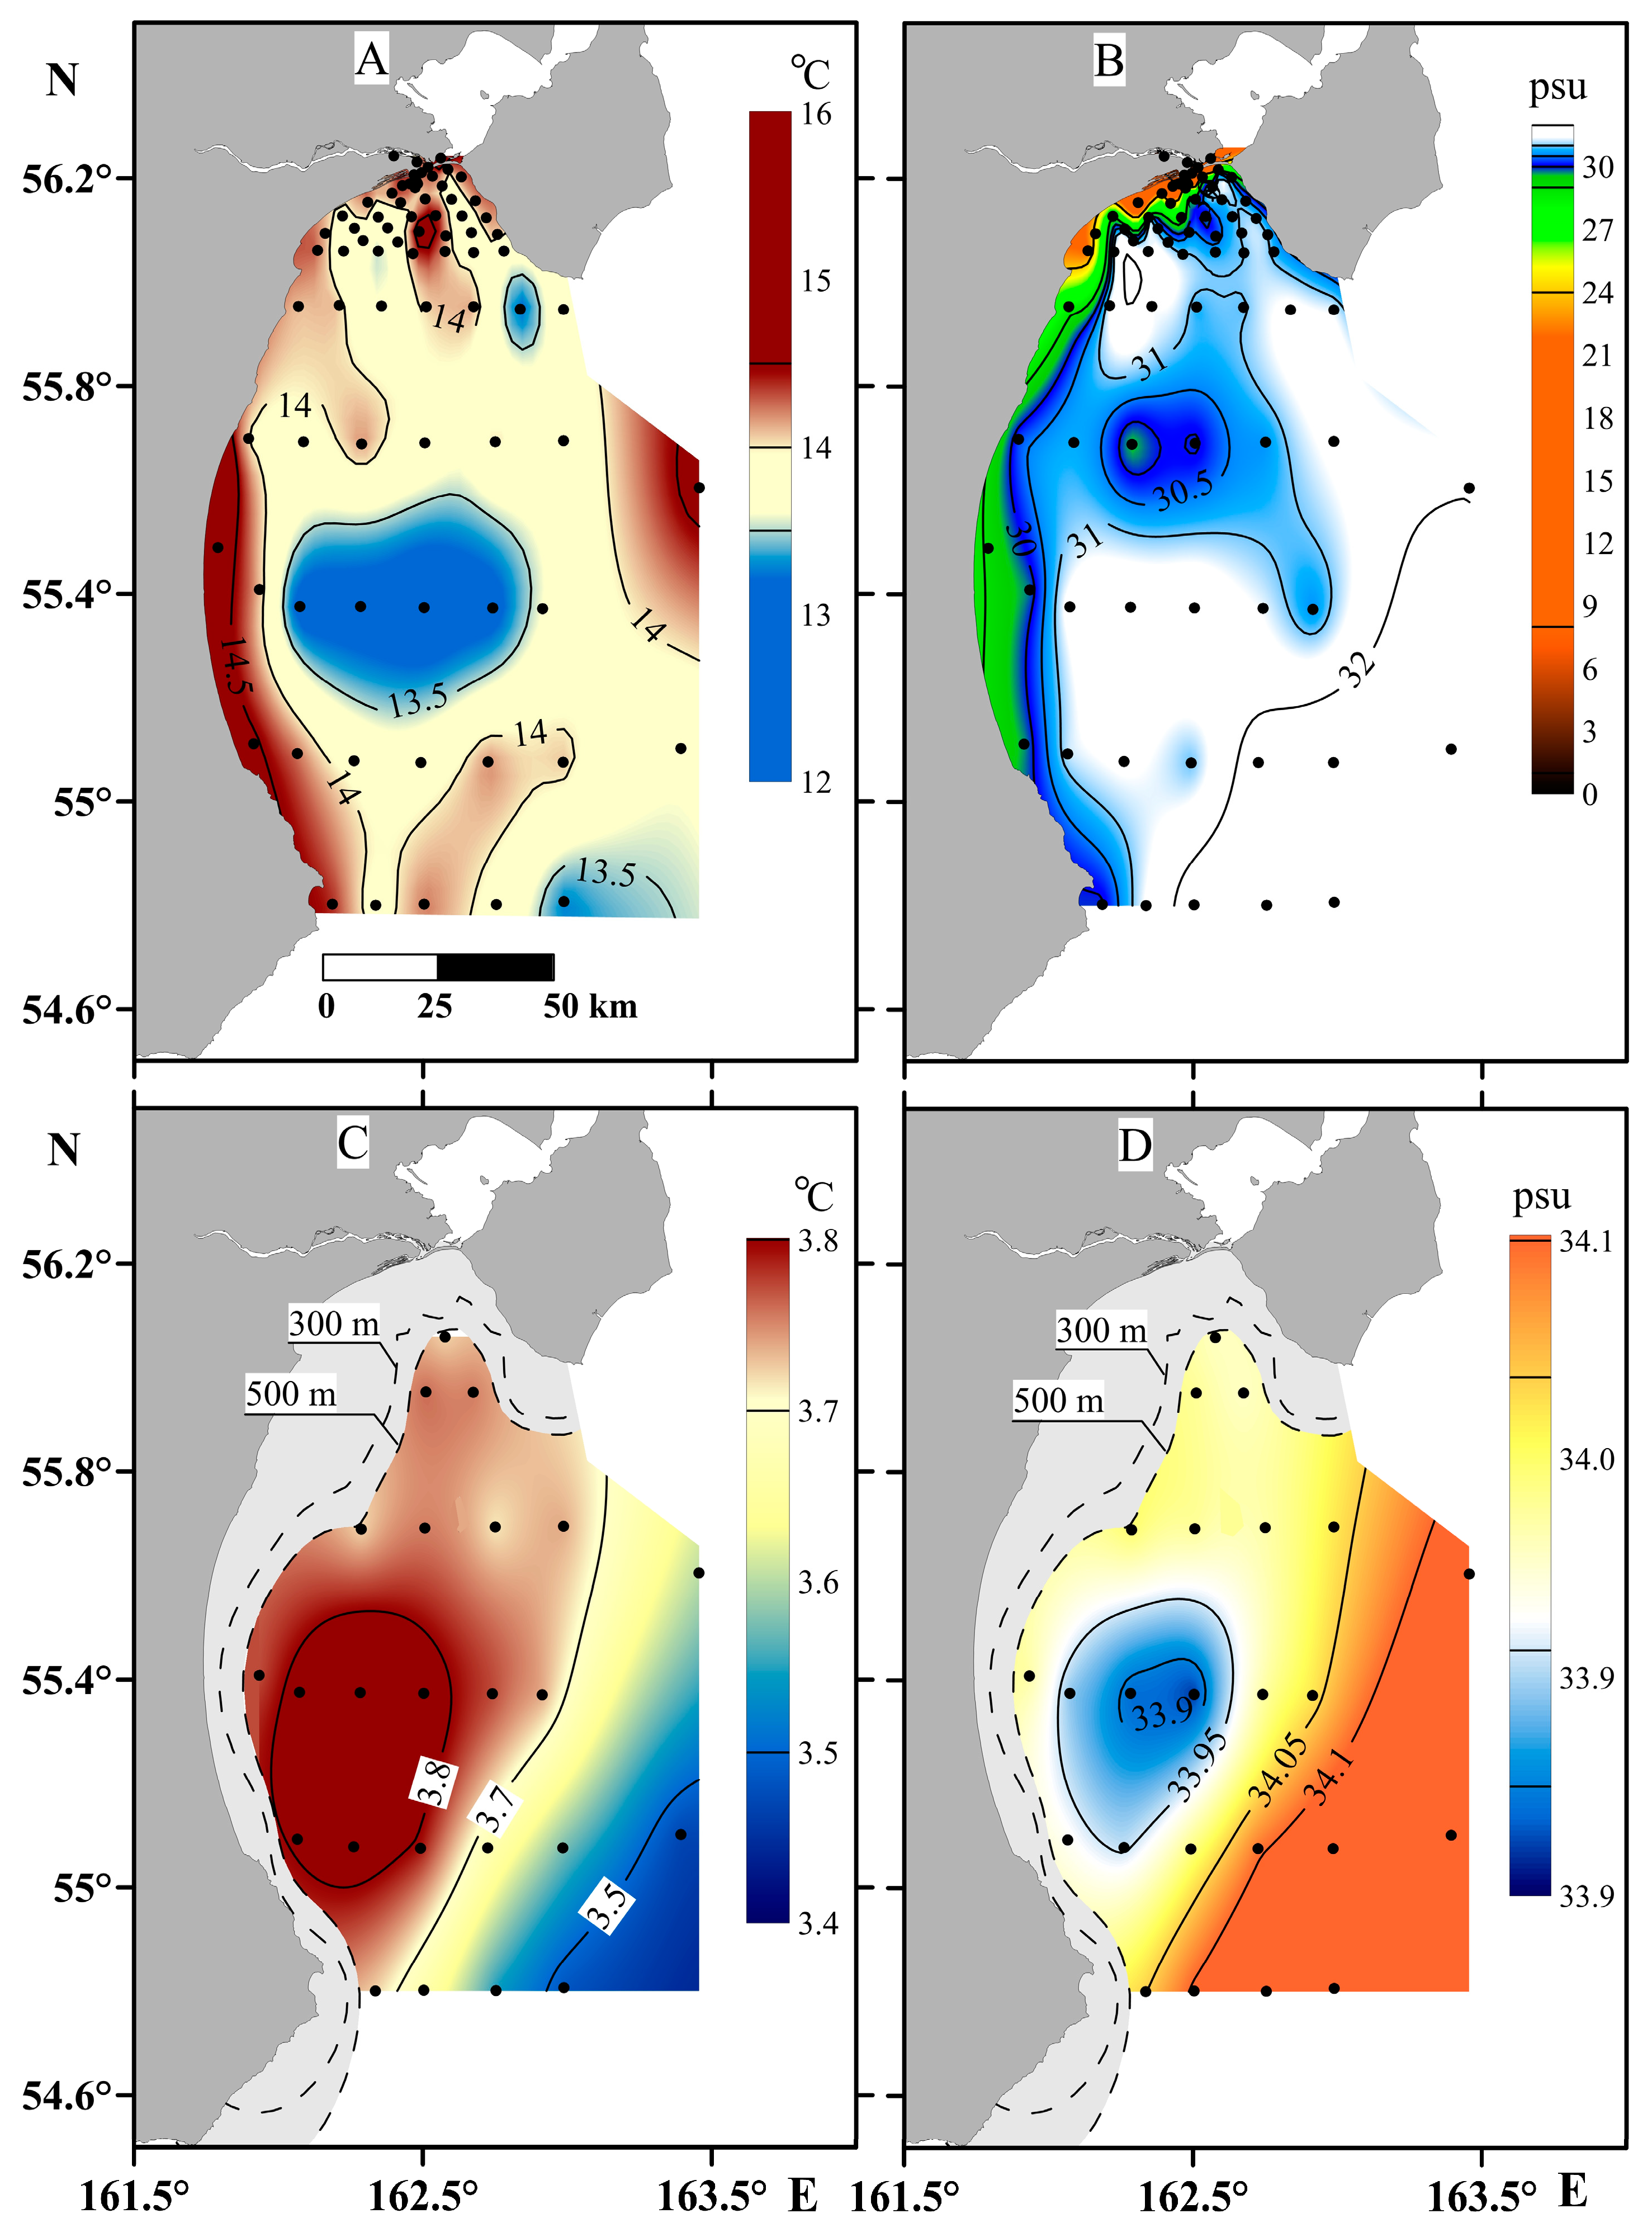
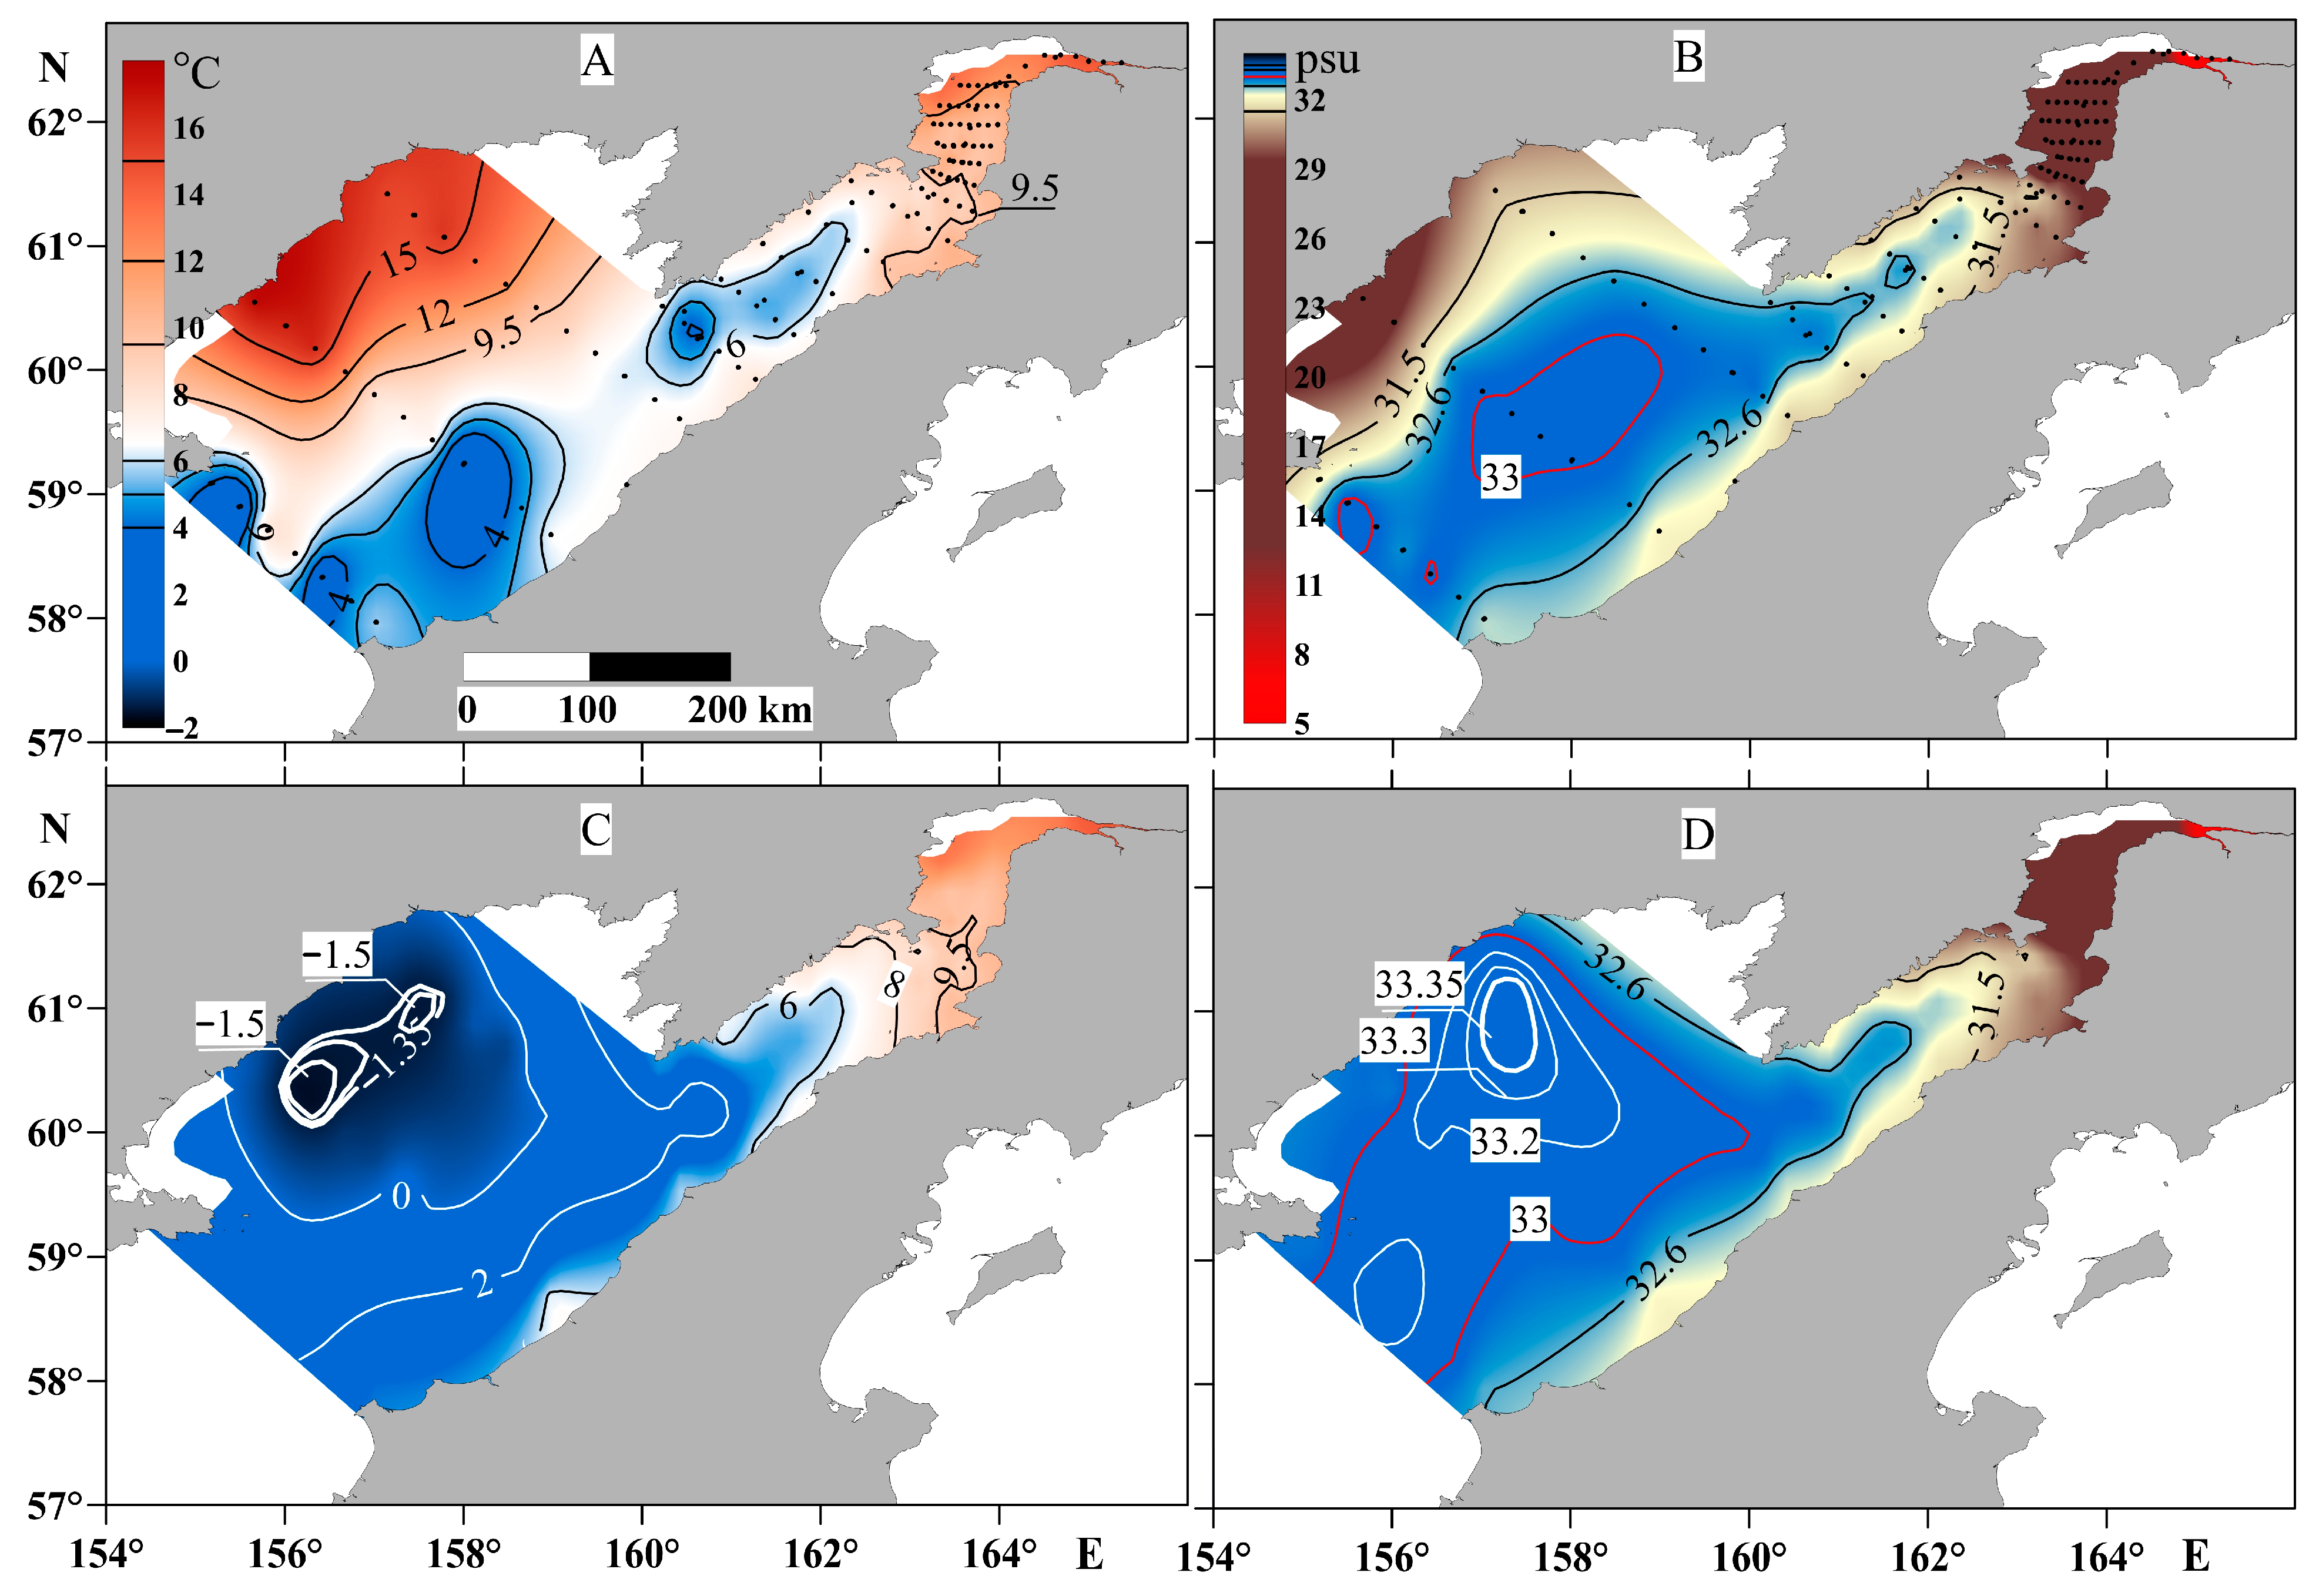
3.2. The Scale of Influence of River Runoff in Receiving Basins After the Passage of Spring and Summer Flooding

The influence of river runoff on the receiving basins was determined based on profiling data from the surface to a depth of 500 m in Kamchatka Gulf (Figure 6) and to the bottom in Penzhina Bay and Shelikhov Gulf (Figure 7). These results reflect the maximum possible influence of river runoff, using the summer seasons of 2023 as an example since they occurred just after the spring and summer flooding (see Section 2.2).
Figure 6A shows a slight temperature variability in the range of 13.5–14.0 °C in the surface water layer. The salinity of water was more than 32 psu outside Kamchatka Gulf, while lower salinity in the surface water layer is noticeable across its entire area (Figure 6B). River waters are relatively warm at this time of the year; therefore, the river plume, stretched along the entire coast of Kamchatka Gulf, had an elevated temperature of more than 14.5 °C. The influence of river waters could also be traced in the water layer at a depth of 500 m. In particular, the water temperature in Kamchatka Gulf was up to 3.8 °C against the background of the temperature of the intermediate Pacific Water Masses of about 3.5 °C (Figure 6C). The salinity was reduced to 33.9 against the background of the salinity of the surrounding Pacific Ocean waters of 34.1 at a depth of 500 m (Figure 6D).
Figure 7 shows that the distribution of the salinity and a temperature lines was almost the same at the surface and the bottom for a depth of about 50 m (published earlier [30]). This means that the water column in Penzhina Bay was almost homogenous from the surface to the bottom and river runoff affects a distance of about 200 km. The river water was relatively warm—approximately 14 °C—and the part of the basin most affected by the river runoff also had an increased water temperature. At the time, strong stratification of the waters was observed in the western part of the Shelikhov Gulf (Figure 7). In this area, the tides were much smaller. But in the area with depths of about 270 m in the central part of Shelikhov Gulf, this was slightly increased. According to data from the literature [56], the contrast in the temperature of the western part of Shelikhov Gulf is a result of winter convection, with the formation of cold water at the bottom layer.

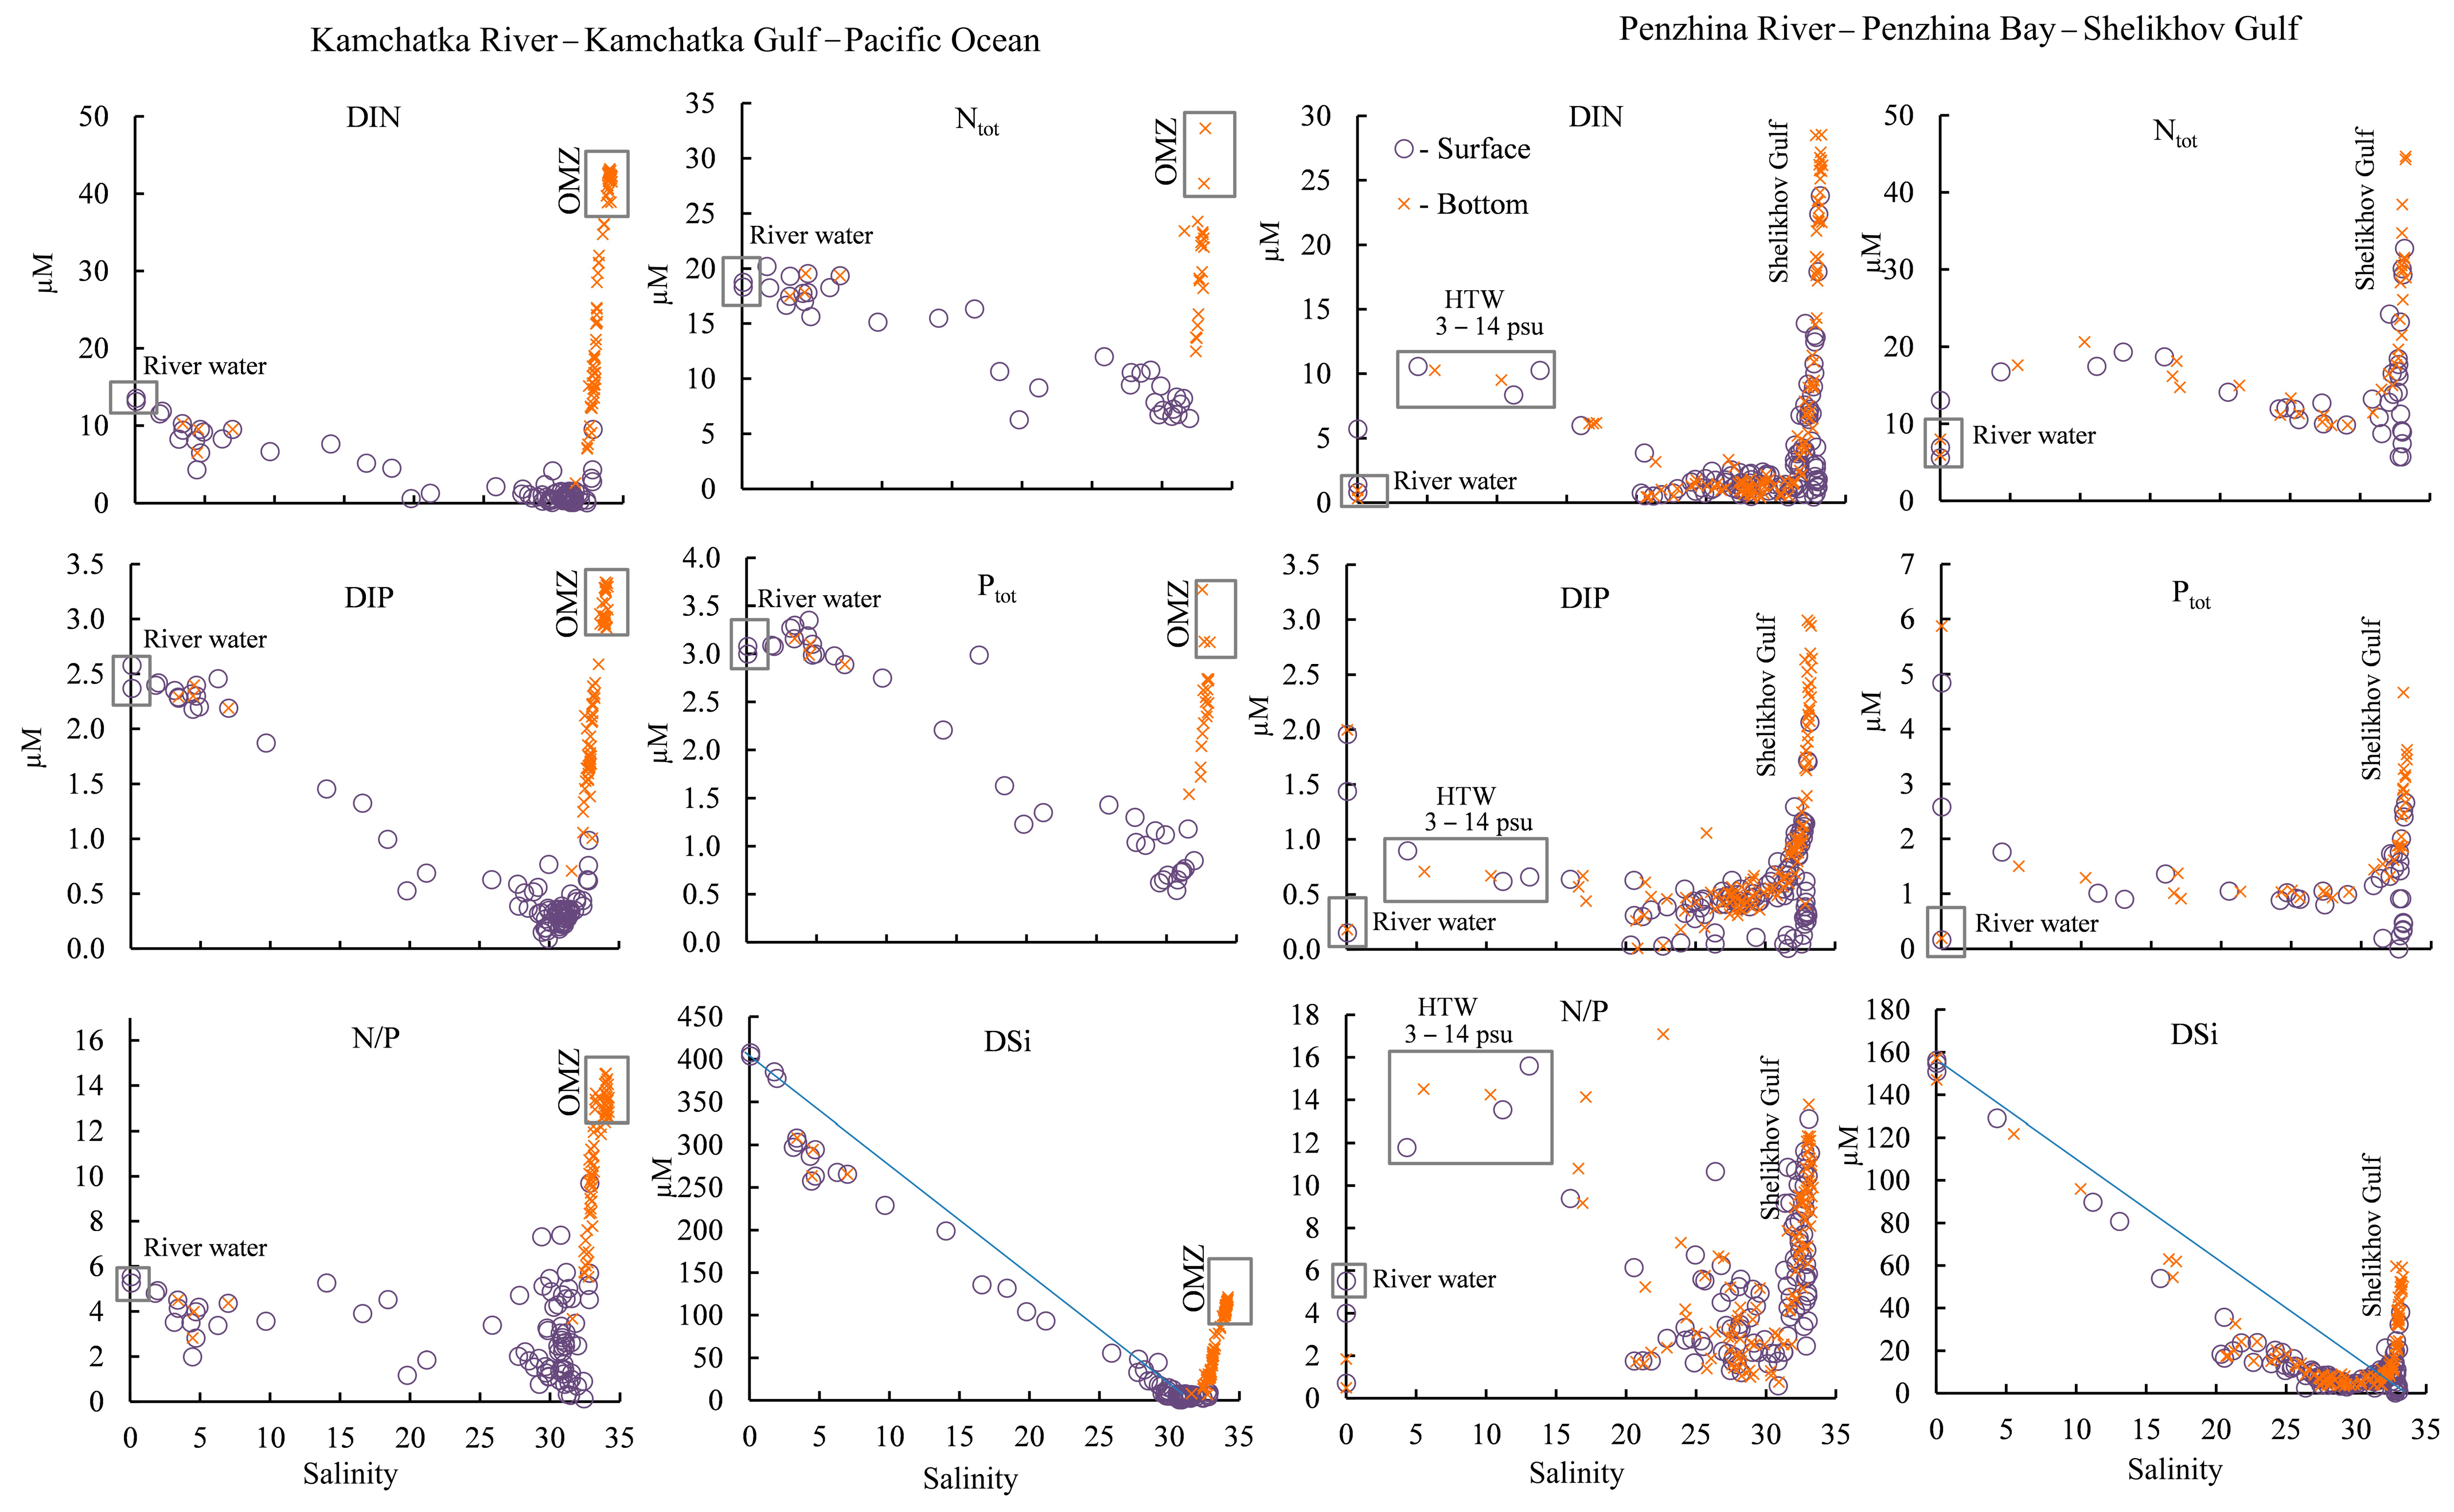
3.3. Nutrients in the River-Estuary-Deep Water Continuum After Flooding

Figure 8 shows nutrients in the river–estuarine–deep water continuum obtained during the expeditions in accordance with Section 2.5. Relatively high concentrations of Ntot, DIP, and Ptot in the Kamchatka River comparable to the OMZ were obtained (Figure 8). The DIN concentration was not very high, but the DSi concentration was significantly increased in river waters in relation to the OMZ. Thus, DIN and especially DIP, Ptot, and DSi entered Kamchatka Gulf mainly at the expense of the Kamchatka River runoff. Meanwhile, DIP, Ptot, and DSi also had relatively high concentrations in the river–sea mixing zone.
The N/P mole ratio in the range of salinity of 1–30 psu was mainly less than 6. The N/P ratio increased significantly in the bottom water layers of Kamchatka Gulf and in the OMZ, up to 15 at a salinity of more than 31 psu (Figure 8).
The main source of DIN and DIP for the photic zone of the Penzhina Bay was the deep part of Shelikhov Gulf due to tidal mixing, while DSi was mainly supplied from the river runoff of the Penzhina River. The concentrations of DIN, DIP, Ntot, and Ptot were low in Penzhina Bay, with significant increases in the bottom water layer observed, especially in Shelikhov Gulf (Figure 8). An increase in DIN and DIP was observed in the tidal effects zone of the river waters, as well as in HTW. A similar situation was observed for Ptot concentration, increasing in the fresh water of the biggest tidal area at the top of Penzhina Bay. This could mean that an important source of nutrients for Penzhina Bay is the tidal marshes near the mouth of the Penzhina River. In the Kamchatka Gulf, the influence of tides is almost unaffected, while the East Kamchatka Current, a long-shore current, facilitates the transport of nutrients from north to south.
Most N/P mole ratio markers of river water and water with the salinity range of 1–30 psu had values of less than 6. The DIN/DIP ratio increased significantly in the surface and bottom water layers at a salinity of more than 31 psu for both sides of the Kamchatka Peninsula (Figure 8). The growth of diatomic microalgae cold be reason of the decrease of the DSi concentration relative to the conservative line at the booth mixing zone (Figure 8).

3.4. Experiment on Releasing Nutrients from Fresh Ash of Shiveluch Volcano

The results of the laboratory experiment (Table 3) show that the concentration of DIP in water increases significantly in the first minutes after contact with ash. For fresh water, the increase in DIP to nearly the maximum possible concentration was observed as early as minutes after ash came in contact with water. However, for seawater, the DIP concentration was at its maximum after about one day, and the DSi concentration continued to increase for 9 days. Additionally, within the first few minutes after ash came into contact with water, ions of NO3 and NH4 were delivered into the water, but the DIN concentrations in the experiment were not as impressive as the results for DIP.

3.5. Chl-a Concentration According to Satellite Data

To understand the spatial and temporal variability of Chl-a, we presented average Chl-a concentrations for each month on both sides of the Kamchatka Peninsula in 2023, average concentrations for 2023, and average concentrations over a 20-year period beginning in 2003 for each month in Kamchatka Gulf (Figure 9).
The Chl-a concentration, against the general background (Figure 9, upper panel), increased in the apex of Penzhina Bay from April to October. This increase was probably due to the washing of nutrients and Chl-a from foreshores, which we observed visually during the works. These foreshores are located in the northwestern part of Penzhina Bay, whereas rocky shores and a gravel bottom are common in the main part of Penzhina Bay.
For Kamchatka Gulf, an increase in Chl-a concentration along with an increase in discharge in the Kamchatka River from May to July was clearly visible both over a long-term period and when averaged for 2023 (Figure 9). Maximum concentrations of up to 15 mg/m3 were obtained for the coastal line, where the plume of the Kamchatka River is traditionally present [52] as well as during our cruise in August 2023 (Figure 6). Chl-a concentrations obtained during the expedition using the RBR Maestro profiler (see Section 2.5) demonstrate good consistency with satellite data for the period at the end of August 2023 near the mouth of the Kamchatka River (Supplementary Materials S1).

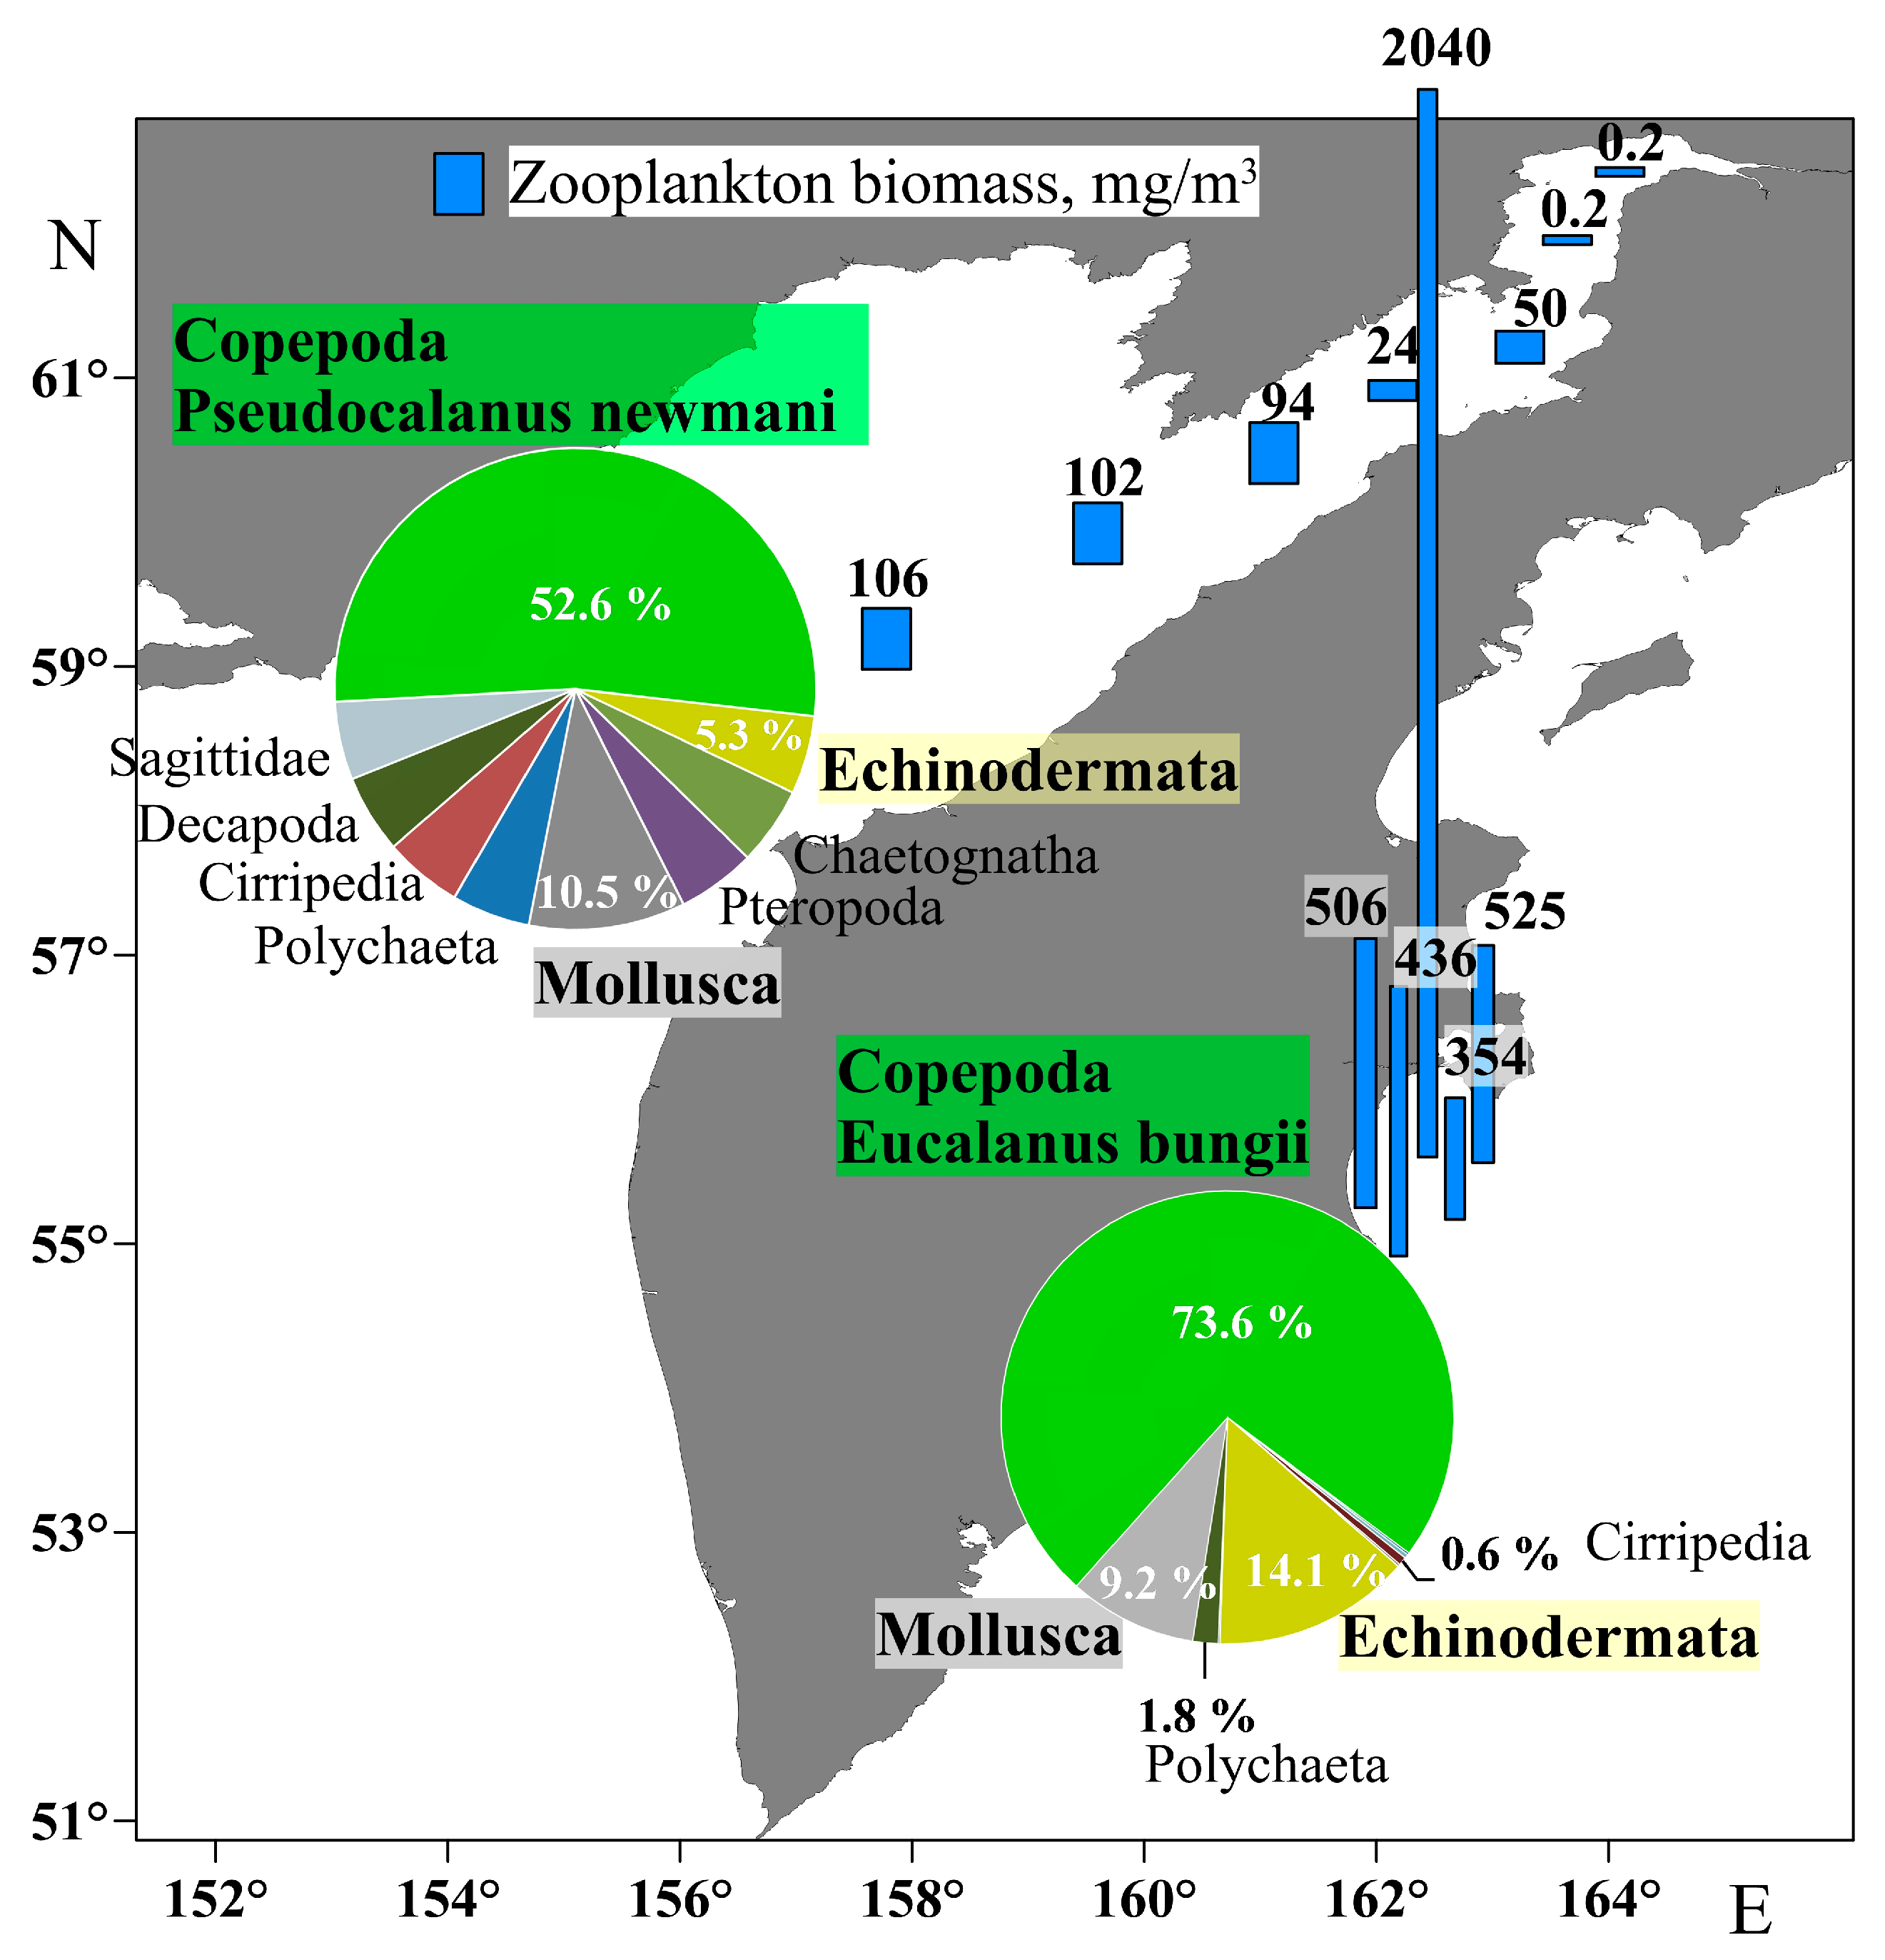
3.6. Species and Biomass of Zooplankton in Receiving Basins After the Passage of Spring and Summer Flooding

Previous studies have demonstrated an increase in zooplankton biomass in the coastal areas of the Kamchatka Peninsula following the spring and summer phytoplankton bloom [44,45,46]. Biomass reached its maximum in July in the southwest—1891 mg/m3 [45]; in the Pacific waters in the east of the Kamchatka Peninsula, it was about 2000 mg/m3, and in some cases, it was up to 3117 mg/m3 [46]. Analyzing the aforementioned research and satellite data on Chl-a (Figure 9), we believe that, taking into account the time lag, our cruises (see Section 2.5) characterize a period close to the maximum zooplankton biomass in the basins under study.
During our cruises, the basis of the zooplankton community on both sides of the Kamchatka Peninsula was formed by typical representatives of cold-water and moderate-cold-water Pacific and Sea of Okhotsk fauna Copepoda: Eucalanus bungii and Copepoda: Pseudocalanus newmani (Figure 10) [44,45,46]. Zooplankton biomass in Kamchatka Gulf reached 2040 mg/m3 and was consistently 3–5 times higher than in Penzhina Bay and Shelikhov Gulf. The zooplankton biomass of Kamchatka Gulf was mainly composed of copepods, accounting for 73.6%. However, in Penzhina Bay and Shelikhov Gulf, the biomass was no more than 106 mg/m3, with copepods forming 52.6% of it. The remaining biomasses of Penzhina Bay and Shelikhov Gulf were distributed between eight species (Figure 9).

4. Discussion

This discussion focuses on how volcanism and variations in water discharge over different time ranges, from seasonal to climatic, can affect fluxes of substances, cause associated phytoplankton blooms, and influence subsequent food links on both sides of the Kamchatka Peninsula.

4.1. Nutrient Sources for the Kamchatka and Penzhina Rivers and Their Receiving Basins

Nutrients can enter river waters through bacterial decomposition of organic matter, rock weathering, and anthropogenic activities in catchment areas [57]. Nutrient sources are generally divided into point sources and diffuse sources [2]. Diffuse sources include atmospheric precipitation as well as surface and groundwater, and point sources include localized public utility wastewater. Point sources can be excluded given the low population density in the catchment areas of the Kamchatka and Penzhina rivers (see Section 2).
Concentrations of DIP and Ptot in the Kamchatka River were close to or higher than those recorded in urbanized rivers, such as those in China [5,7,8,9,10] or India [4]. The maximum concentrations of DIP in the lowest river station (station 6) and the increase in Porg at stations 4–6 in May (Figure 4) were associated with snow melting in the river valley. After the eruption of Shiveluch Volcano on 11 April 2023, snow was covered with ash on 22 May 2023, at a distance of about 200 km along the highway in the basin of the Kamchatka River, near Klyuchi settlement (station 5 (Figure 1)). We observed tephra-saturated ‘mud’ surface runoff in the river valley, and water in the Kamchatka River turned brownish-reddish on the sampling day of May 22. Tephra is a direct source of DIP because it contains phosphorus oxide (P2O5) (Table 4), which forms bioavailable DIP due to its rapid reaction with water.
During other seasons, and particularly during the period with the lowest runoff (field work on 1 April 2023), an increase in DIP was also observed in the area with active volcanoes (stations 4–6). This fact indicates systematic enrichment of groundwater with DIP in this part of the river basin. This is attributed to the enrichment of groundwater with DIP in volcanic soils and bedrock in the area. Thus, the maximum concentrations of DIP and Porg downstream of the Kamchatka River in the area of the Klyuchevskaya group of volcanoes and Shiveluch Volcano (Figure 4) are the result of volcanism.
The enrichment of catchment areas with DIN, in contrast to DIP coming directly from tephra, occurs predominantly through volcanic exhalation, bacterial activity, and subsequent atmospheric transport of their products [32]. It has previously been shown that in the fluids of the oxidized shallow upper mantle, nitrogen (N) mainly exists almost predominantly as N2, with minor emissions of NH3, and as the nitric acid HNO3 [58]. Volcanic ash can also be a source of DIN (Table 3) since NH4 can exist in the minerals of metamorphic, sedimentary, or igneous rocks of the Earth’s crust [59]. Hence, DIN should be expected to enter the basins of the rivers under study with atmospheric precipitation and aerosol deposition, followed by DIN accumulation in the snow cover during the winter. In this work, the authors did not set out to study the distribution of DIN in snow. However, previous results for meltwater from the highlands in the area of the inactive Vilyuchinsky Volcano (coast of Avacha Gulf (Figure 3)) showed the maximum DIN concentration of 36.68 μmol/L (Table 2 in [29]) against the background of all data obtained for the rivers of east Kamchatka [25,26,27,28,29]. The systematic increase in DIN and Ntot during the period of increased river discharge in May and June (Figure 4) and the extremum of DIN in meltwater from the highlands obtained earlier [29] indicate the accumulation of DIN in snow. A generally high background of nutrient concentrations in the rivers of east Kamchatka was observed about 60 years ago [27], indicating the dominance of natural sources of nutrients in river runoff, such as volcanism.
DSi, unlike DIN and DIP, is mainly formed as a result of chemical weathering on the Earth’s surface [60]. Globally, the largest fluxes of DSi from land to ocean originate from volcanic arcs and submerged basaltic regions on continental margins [61] and are an important component of marine ecosystems [62]. On the Kamchatka Peninsula, water formed during snow melting drains volcanic soils and bedrock enriched with SiO2. Chemical weathering is the main cause of relatively high DSi concentrations during all seasons in Kamchatka rivers (Figure 4), in contrast with the catchment areas for the Sea of Okhotsk and the Sea of Japan, which are not affected by volcanism [63,64].
DOC is divided into humic and non-humic components, and rivers, as a rule, are heterotrophic ecosystems that supply mainly humic substances to the ocean—allochthonous DOC [2]. We obtained relatively high concentrations of DOC in the Kamchatka River and especially in the Penzhina River (Figure 4), comparable, for example, to rivers with intensive sewage [65]. The surface horizons of east Kamchatka soils lie on interlayers of volcanic ash enriched with nutrients and trace elements [34]. This is a favorable environment for microorganisms, and, accordingly, soil in the catchment area can serve as an important source of DOC for the Kamchatka River. Nutrients from volcanism can stimulate the growth of snow microalgae and the resulting increase in DOC concentrations in snow [66]. This is likely why the maximum DOC concentrations in the area of active volcanoes (stations 4–6 (Figure 4)) are clearly traceable in May, i.e., during the period of snow melting in the river valley.
In the Penzhina River, DIP and DIN have low concentrations (Figure 4). However, the change in water nutrition from deep aquifers to surface soil runoff in April–May (see Section 2.2) is probably the main reason for such high DOC concentrations (Figure 4). DOC, together with concentrations of other nutrients, demonstrates a positive relationship with water discharge in the Penzhina River and, to a lesser extent, in the Kamchatka River (Figure 5). This means that surface soils compensate for the dilution effect of meltwater during periods of rising river levels by supplying additional DOC.

4.2. Molar Ratios of Inorganic Forms of Nutrients and Potential Impact of River Runoff on Coastal Ecosystems of the Kamchatka Peninsula

Absolute nutrient concentrations play a central role in ecosystem dynamics, but the DIN/DIP ratio also influences the species composition of the primary food link [67]. According to recent studies, with a significant increase in the DIN/DIP ratio, dinoflagellates, including potentially toxic species, dominate [68]. Our recent results have shown a significant shift in DIN/DIP ratios in the case of river water inflow from highland meltwater [29]. This was evident in rivers in the southeast of the Kamchatka Peninsula, where the maximum DIN/DIP ratios in meltwater exceeded 300 in June. Such a high DIN/DIP ratio may explain the occurrence of harmful blooms, which were observed long before industrialization and population growth in the Kamchatka region [40]. However, a significant decrease in the DIN/DIP ratio in the Kamchatka River should favor the development of diatoms in Kamchatka Gulf. In addition, ashes from 29 active volcanoes on the Kamchatka Peninsula, including the most active volcanoes in the Kamchatka River valley, are a source of Fe for river waters and, subsequently, for coastal ecosystems. Fe is the most important micronutrient that stimulates phytoplankton growth [69]. Fe from volcanoes is evident in many ocean basins [15,70,71,72,73]. Data on Fe concentrations in the Northwest Pacific Ocean, including the East Kamchatka Current and the Sea of Okhotsk, are scarce [37,38,39]. Therefore, in the future, it will be necessary to study spatial and temporal changes in primary productivity and taxonomic composition in combination with Fe availability and at different DIN/DIP ratios under the influence of volcanism.

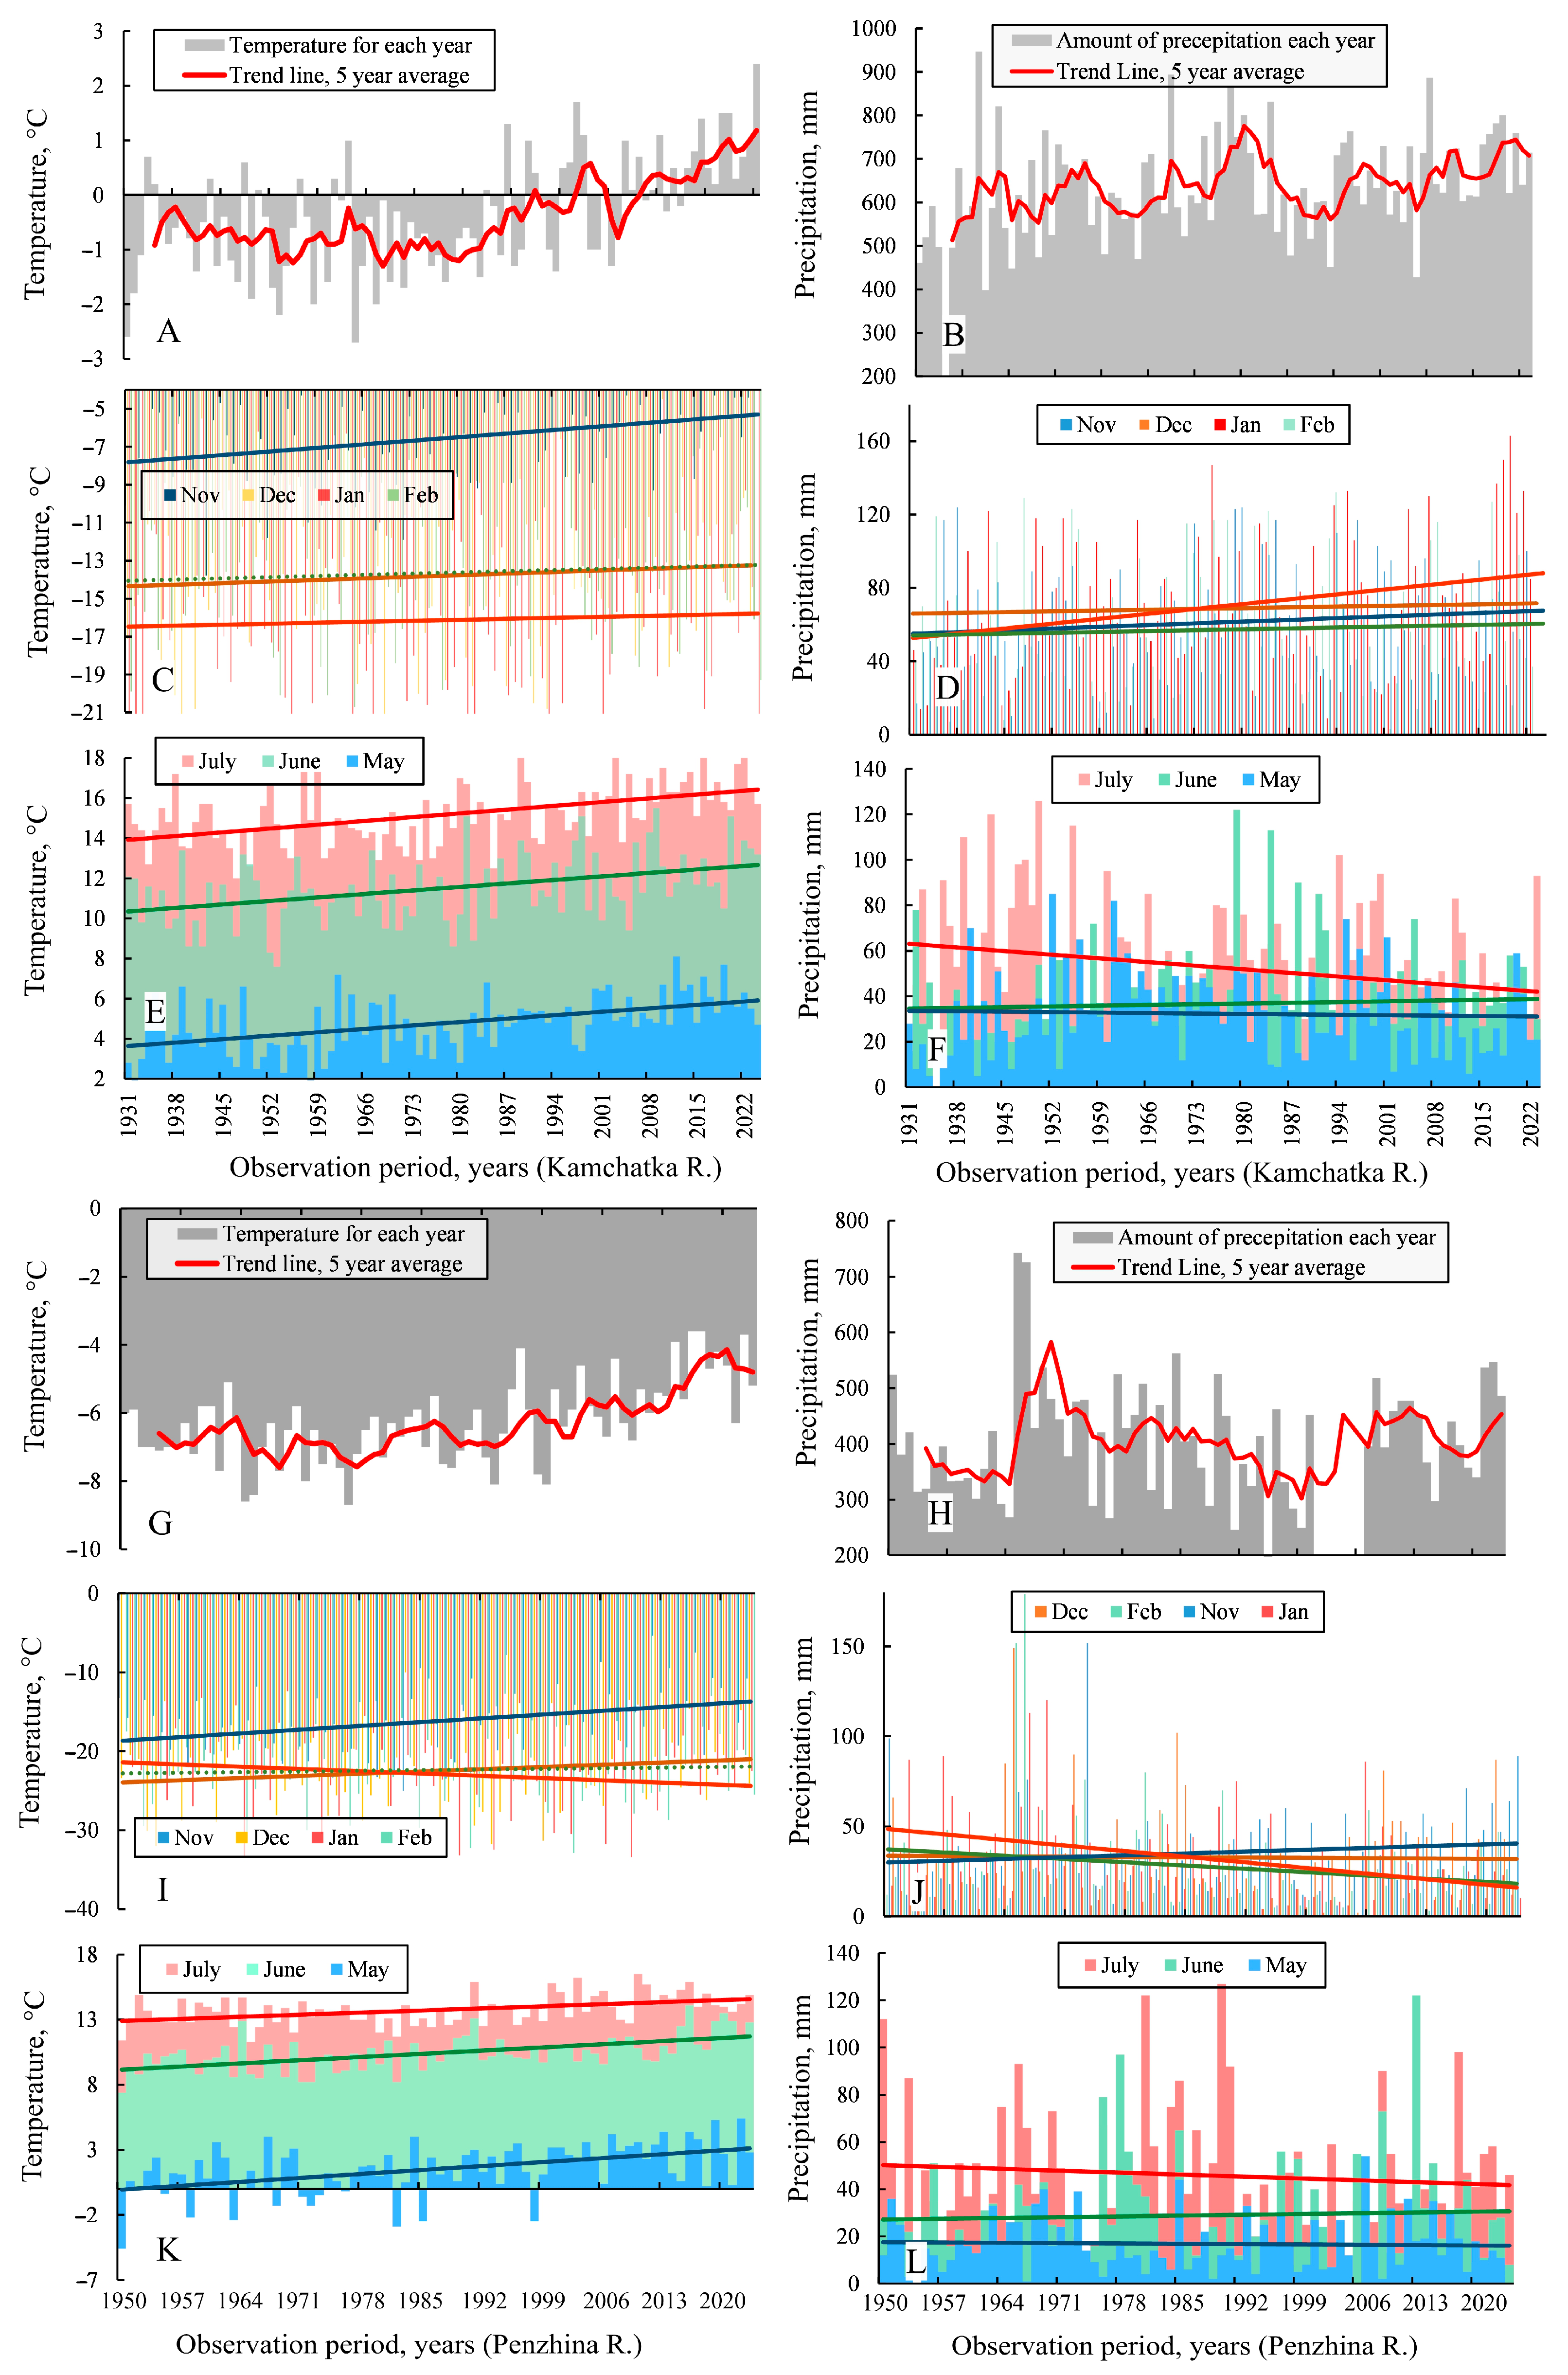
4.3. Impact of Climate Change on Seasonal Dynamics of Nutrient Fluxes and Ecology of Coastal Marine Waters of the Kamchatka Peninsula in the East and West

Climatic changes in temperature, intensity and amount of rainfall, and continental runoff regimes have been observed around the world [74]. As in most parts of the planet, the average annual air temperature in the basins of the Kamchatka and Penzhina rivers has been increasing since about 1960 (Figure 11). Since about 1990, the average annual temperature in the Kamchatka River basin near Klyuchi settlement (the area of the Klyuchevskaya group of volcanoes and Shiveluch Volcano) has changed from negative to positive. According to recent estimates [36], the rate of warming for the period of 1966–2020 on the western coast of the Kamchatka Peninsula is 0.4–0.7 °C/10 years and 0.3 °C/10 years on the east coast of the peninsula. At the same time, the highest rate of warming is observed in March, up to 0.9 °C/10 years [36]. In the coldest month of the year, January, the rate of warming in the Kamchatka River basin is minimal, while in the Penzhina River basin, the temperature in January decreases over the period under study (Figure 11).
Warming in the Kamchatka Peninsula region has already left an imprint in the form of glacier decline in the highlands since the beginning of the 21st century [35,36]. The total glacier area decreased from 800.6 ± 13.0 km2 in 2000 to 646.7 ± 10.6 km2 in 2014 at a rate of −1.4% year−1 [35]. Glaciers near active volcanoes are enriched with tephra and various forms of nutrients [32]; therefore, when they melt, an increase in nutrient concentrations in river water should be expected. Hence, we can assume that year-to-year and climatic changes in the melting intensity of glaciers in the highlands also change the timing of peak onset and phytoplankton biomass. For example, the most popular recent case of harmful dinoflagellate blooms [41] occurred precisely at the end of a warm summer in 2020, when thawing glaciers and probably DIN fluxes from the highlands were the greatest.
Potentially increasing nutrient fluxes with warming, glacier melt may make a significant contribution to DOC concentrations and composition, as has been shown in volcanic regions in Iceland [75]. Together with long-term changes in the substance fluxes of Icelandic rivers, the first few rainfalls after ashfalls often lead to a significant increase in the concentration of trace elements and nutrients [76]. This is probably similar to the situation during the snowmelt period of May in the Kamchatka River valley after the ashfall on 11 April 2023.
At the same time, the concentration of nutrients in the Penzhina River, located in the permafrost zone [22], may change in the same way, as it already does in the case of permafrost degradation in the polar regions [77]. Considering that at this time the Penzhina River has a predominantly snow water supply, unlike the Kamchatka River (see Section 2.2), permafrost thawing can significantly change the ratio of groundwater discharge to the river. A change in the balance of water supply of the Penzhina River from snow water to groundwater can have a significant effect on the concentration of chemical elements in river water and the flux of nutrients into the coastal area. Many studies have observed an increase in the export of major ions, DIP and DSi, due to groundwater discharge to the river–estuary–deep water continuum since the work [78], including the Arctic region [79].
Additionally, the chemical weathering regime will change in response to warming in the region, which has already generated widespread interest in different catchment areas [80].
Thus, in addition to seasonal variability, ecosystems in the receiving basins under study will probably respond to temporal scales of climate-scale variability. Due to changes in the hydrometeorological regime and shifts in the onset and duration of phytoplankton blooms, shifts in zooplankton development may occur. Such a scenario may be relevant for subsequent trophic links, taking into account that Kamchatka is a feeding ground for many hydrobionts. These problems imply the need to monitor nutrients in river runoff and study the chemical composition of glaciers in the region to be able to predict the sustainability of the coastal marine ecosystems of the Kamchatka Peninsula in the future.

5. Conclusions

In this study, we report high concentrations of DIP and Porg in the Kamchatka River comparable to many rivers in urbanized areas with sewerage and agricultural sources of nutrients. A distinct increase in DIP, Porg, and DSi is systematically manifested in all seasons, especially in spring and summer, in the area directly influenced by the Kliuchevskaya group of volcanoes and Shiveluch Volcano. This feature is directly related to snow melting in the river valley and on the slopes of volcanoes that were covered with ash—a source of nutrients—including after the eruption of Shiveluch Volcano on 11 April 2023. The Penzhina River is not directly influenced by volcanism, but there is widespread permafrost in its basin and soil freezing in winter that provide additional nutrient fluxes, primarily DOC during spring melting.
We believe that DIP, Porg, DSi, DIN, and Norg fluxes in river runoff from volcanic catchment areas in east Kamchatka are a major trigger for spring and summer phytoplankton blooms and subsequent high zooplankton biomass, using Kamchatka Gulf as an example. In the northwest of the peninsula, in Penzhina Bay, the marine source is primarily dominant for DIN and DIP compared to river inflows. However, the flux of DOC with river runoff is relatively higher in the Kamchatka River.
Since about 1990, the average annual temperature in the Kamchatka River basin near the Klyuchevskaya group of volcanoes and Shiveluch Volcano has changed from negative to positive and continues to increase. Thus, in addition to seasonal variability, coastal marine ecosystems will likely respond to temporal scales of climate-scale variability in the foreseeable future. A possible response to warming in the Kamchatka Peninsula region is an increase in nutrient fluxes from melting glaciers rich in nutrients in the highlands as well as permafrost thawing, which is common in the Penzhina River valley during the spring–summer period. This implies the need to monitor nutrients and a number of hydrochemical characteristics in river runoff and study the chemical composition of glaciers in the region to predict the sustainability of the coastal marine ecosystems on both sides of the Kamchatka Peninsula in the future.

Supplementary Materials

The following supporting information can be downloaded at: https://www.mdpi.com/article/10.3390/jmse13030569/s1, Supplementary S1. Chl-a concentrations in the Kamchatka Gulf, obtained on a cruise from 25 August to 29 August, 2023, using an RBR Maestro profiler; Supplementary S2. Abbreviations sheet.

Author Contributions

P.S.: writing—original draft, conceptualization, methodology, formal analysis, investigation, funding acquisition. G.P.: writing—review and editing, investigation, formal analysis. V.L.: review and editing, funding acquisition, investigation. K.B.: formal analysis, investigation, conceptualization. Y.B.: methodology, formal analysis, investigation. S.G.: investigation, conceptualization. M.S.: methodology, formal analysis, investigation. E.S.: methodology, formal analysis, investigation. O.U.: methodology, formal analysis, investigation. A.R.: methodology, formal analysis, investigation. E.L.: methodology, formal analysis, investigation. Y.F.: methodology, formal analysis, investigation. Y.X.: methodology, formal analysis, investigation. J.Z.: investigation, conceptualization. All authors have read and agreed to the published version of the manuscript.

Funding

This work was supported by the Russian Science Foundation (Project No. 23-77-10001) at V.I. Il’ichev Pacific Oceanological Institute, Far Eastern Branch Russian Academy of Sciences (Reg. No. 124022100077-0, 124022100079-4, and 124072200009-5 (accommodation, transportation, equipment)). The marine expeditions on the R/V “Akademik Oparin” were funded by the Ministry of Science and High Education of the Russian Federation.

Data Availability Statement

The original contributions presented in this study are included in the article/Supplementary Material. Further inquiries can be directed to the corresponding author.

Acknowledgments

The support of the scientific group and crew of R/V Akademik Oparin is greatly appreciated.

Conflicts of Interest

The authors declare no conflicts of interest.

References

  1. Jickells, T.D. Nutrient biogeochemistry of the coastal zone. Science 1998, 281, 217–222. [Google Scholar] [CrossRef]
  2. Meybeck, M. Carbon, nitrogen, and phosphorus transport by world rivers. Am. J. Sci. 1982, 282, 401–450. [Google Scholar] [CrossRef]
  3. Beusen, A.H.W.; Doelman, J.C.; Van Beek, L.P.H.; Van Puijenbroek, P.J.T.M.; Mogollón, J.M.; Van Grinsven, H.J.M.; Stehfest, E.; Van Vuuren, D.P.; Bouwman, A.F. Exploring river nitrogen and phosphorus loading and export to global coastal waters in the Shared Socio-economic pathways. Glob. Environ. Change 2022, 72, 102426. [Google Scholar] [CrossRef]
  4. Reddy, S.K.K.; Gupta, H.; Gandla, V.K.; Reddy, D.V.; Kurakalva, R.M.; Kumar, D. Nutrient dynamics in small west-flowing tropical mountainous rivers of India. Appl. Geochem. 2024, 169, 106035. [Google Scholar] [CrossRef]
  5. Zhang, P.; Ruan, H.; Dai, P.; Zhao, L.; Zhang, J. Spatiotemporal river flux and composition of nutrients affecting adjacent coastal water quality in Hainan Island, China. J. Hydrol. 2020, 591, 125293. [Google Scholar] [CrossRef]
  6. Tishchenko, P.Y.; Tishchenko, P.P.; Lobanov, V.B.; Mikhaylik, T.A.; Sergeev, A.F.; Semkin, P.Y.; Shvetsova, M.G. Impact of the transboundary Razdolnaya and Tumannaya Rivers on deoxygenation of the Peter the Great Bay (Sea of Japan). Estuar. Coast. Shelf Sci. 2020, 239, 106731. [Google Scholar] [CrossRef]
  7. Zhang, J.; Du, Y.N.; Zhang, G.S.; Chang, Y.; Zhou, Y.C.; Zhang, Z.F.; Wu, Y.; Chen, J.W.; Zhang, A.Y.; Zhu, Z.Y.; et al. Increases in the seaward river flux of nutrients driven by human migration and land-use changes in the tide-influenced delta. Sci. Total Environ. 2021, 761, 144501. [Google Scholar] [CrossRef]
  8. Zhang, S.; Zhang, H. Anthropogenic impact on long-term riverine CODMn, BOD, and nutrient flux variation in the Pearl River Delta. Sci. Total Environ. 2023, 859, 160197. [Google Scholar] [CrossRef]
  9. Wu, W.; Zhai, F.; Liu, Z.; Liu, C.; Gu, Y.; Li, P. The spatial and seasonal variability of nutrient status in the seaward rivers of China shaped by the human activities. Ecol. Indic. 2023, 157, 111223. [Google Scholar] [CrossRef]
  10. Zhang, J.; Zhang, G.; Du, Y.; Zhang, A.; Chang, Y.; Zhou, Y.; Zhu, Z.; Wu, Y.; Zhang, Z.; Liu, S. From the water sources of the Tibetan Plateau to the ocean: State of nutrients in the Changjiang linked to land use changes and climate variability. Sci. China Earth Sci. 2022, 65, 2127–2174. [Google Scholar] [CrossRef]
  11. Nixon, S.F. Coastal marine eutrophication: A definition, social causes, and future concerns. Ophelia 1995, 41, 199–219. [Google Scholar] [CrossRef]
  12. Andersen, J.H.; Schlüter, L.; Ertebjerg, G. Coastal eutrophication: Recent developments in definitions and implications for monitoring strategies. J. Plan. Res. 2006, 28, 621–628. [Google Scholar] [CrossRef]
  13. Tishchenko, P.Y.; Lobanov, V.B.; Tishchenko, P.P.; Semkin, P.Y.; Sergeev, A.F.; Anisimova, E.V.; Barabanshchikov, Y.A.; Melnikov, V.V.; Ryumina, A.A.; Sagalaev, S.G.; et al. Hydrochemical Study of Academy Bay (Sea of Okhotsk). Oceanology 2022, 62, 80–92. [Google Scholar] [CrossRef]
  14. Zhang, J.; Tishchenko, P.Y.; Jiang, Z.J.; Semkin, P.Y.; Tishchenko, P.P.; Zheng, W.; Lobanov, V.B.; Sergeev, A.F.; Jiang, S. Diverse nature of the seasonally coastal eutrophication dominated by oceanic nutrients: An eco-system based analysis characterized by salmon migration and aquaculture. Mar. Pollut. Bull. 2023, 193, 115150. [Google Scholar] [CrossRef]
  15. Browning, T.J.; Stone, K.; Bouman, H.A.; Mather, T.A.; Pyle, D.M.; Moore, M.C.; Martinez-Vicente, V. Volcanic ash supply to the surface ocean—Remote sensing of biological responses and their wider biogeochemical significance. Front. Mar. Sci. 2015, 2, 14. [Google Scholar] [CrossRef]
  16. Wilson, S.T.; Hawco, N.J.; Armbrust, E.V.; Barone, B.; Björkman, K.M.; Boysen, A.K.; Burgos, M.; Burrell, T.J.; Casey, J.R.; Delong, E.F.; et al. Karl Kīlauea lava fuels phytoplankton bloom in the North Pacific Ocean. Science 2019, 365, 1040–1044. [Google Scholar] [CrossRef]
  17. Barone, B.; Letelier, R.M.; Rubin, K.H.; Karl, D.M. Satellite detection of a massive phytoplankton bloom following the 2022 submarine eruption of the Hunga Tonga–Hunga Haʻapai volcano. Geophys. Res. Lett. 2022, 49, e2022GL099293. [Google Scholar] [CrossRef]
  18. Duggen, S.; Olgun, N.; Croot, P.; Hoffmann, L.; Dietze, H.; Delmelle, P.; Teschner, C. The role of airborne volcanic ash for the surface ocean biogeochemical iron-cycle: A review. Biogeosciences 2010, 7, 827–844. [Google Scholar] [CrossRef]
  19. Hoffmann, L.J.; Breitbarth, E.; Ardelan, M.V.; Duggen, S.; Olgun, N.; Hassellov, M.; Wangberg, S.-A. Influence of trace metal release from volcanic ash on growth of Thalassiosira pseudonana and Emiliania huxleyi. Mar. Chem. 2012, 132, 28–33. [Google Scholar] [CrossRef]
  20. Bisson, K.M.; Gassó, S.; Mahowald, N.; Wagner, S.; Koffman, B.; Carn, S.A.; Deutsch, S.; Gazel, E.; Kramer, S.; Krotkov, N. Observing ocean ecosystem responses to volcanic ash. Remote Sens. Environ. 2023, 296, 113749. [Google Scholar] [CrossRef]
  21. Hydrogeology of the USSR. Volume XXIX. Kamchatka, Kuril and Commander Islands. 1972. 364p. Available online: http://repo.kscnet.ru/2724/ (accessed on 1 November 2024). (In Russian).
  22. Jones, V.; Solomina, O. The geography of Kamchatka. Glob. Planet Chang. 2015, 134, 3–9. [Google Scholar] [CrossRef]
  23. Catalog of Volcanoes of Kamchatka, Novograblenov, P.T.; Glavnauka, Izv. Gos. geogr. ob. L.; Moscow, Russia, 1932. Volume 64. p. 99. Available online: http://repo.kscnet.ru/78/1/catalogue_volcane.pdf (accessed on 1 November 2024). (In Russian).
  24. Galeczka, I.; Sigurdsson, G.; Eiriksdottir, E.S.; Oelkers, E.H.; Gislason, S.R. The chemical composition of rivers and snow affected by the 2014/2015 Bárðarbunga eruption, Iceland. J. Volcanol. Geotherm. Res. 2016, 316, 101–119. [Google Scholar] [CrossRef]
  25. Vas’kovskii, M.G. (Ed.) Resursy Poverkhnostnykh vod SSSR (USSR Surface Water Resources); Kamchatka (Kamchatka); Gidrometeoizdat: Leningrad, Russia, 1973; Volume 20, Available online: https://z-lib.io/book/16375452 (accessed on 1 November 2024). (In Russian)
  26. Zdanovich, V.C. (Ed.) Resursy Poverkhnostnykh vod SSSR (USSR Surface Water Resources); Kamchatka (Kamchatka); Gidrometeoizdat: Leningrad, Russia, 1977; Volume 20, Available online: https://bigenc.ru/b/kamchatka-8d072a (accessed on 1 November 2024). (In Russian)
  27. Agafonova, K.G. Hydrochemical Regime of Kamchatka Rivers. Questions of the Geography of Kamchatka. 2. Kamchatka Department of the Geographical Society of the USSR. 1964, pp. 46–55. Available online: https://www.knigakamchatka.ru/periodical/geografii/voprosy-geografii-kamchatki-1964-2.html (accessed on 1 November 2024). (In Russian).
  28. Semkin, P.Y.; Pavlova, G.Y.; Gorin, S.L.; Koltunov, A.M.; Lepskaya, E.V.; Ulanova, O.A.; Shkirnikova, E.M.; Shvetsova, M.G.; Xu, Y.; Jiang, S.; et al. Seasonal Variations of Nutrient and Organic Carbon Concentrations in the Kamchatka and Avacha Rivers, Kamchatka Peninsula, in 2023. Water Resour. 2025, 52, 117–128. [Google Scholar]
  29. Semkin, P.Y.; Pavlova, G.Y.; Lobanov, V.B.; Barabanshchikov, Y.A.; Kukla, S.P.; Sagalaev, S.G.; Shvetsova, M.G.; Shkirnikova, E.M.; Tishchenko, P.Y.; Tibenko, E.Y.; et al. Nutrient Flux under the Influence of Melt Water Runoff from Volcanic Territories and Ecosystem Response of Vilyuchinskaya and Avachinskaya Bays in Southeastern Kamchatka. J. Mar. Sci. Eng. 2023, 11, 1299. [Google Scholar] [CrossRef]
  30. Semkin, P.Y.; Baigubekov, K.R.; Barabanshchikov, Y.A.; Gorin, S.L.; Koltunov, A.M.; Sagalaev, S.G.; Ulanova, O.A.; Tishchenko, P.Y.; Shvetsova, M.G.; Shkirnikova, E.M.; et al. The Carbonate System of Penzhina Bay and the Shelikhov Gulf in the Sea of Okhotsk during Extreme Tides in Summer. J. Mar. Sci. Eng. 2024, 12, 517. [Google Scholar] [CrossRef]
  31. Baturin, G.N.; Zaitseva, L.V.; Manevich, T.M. Geochemistry of volcanic ash from the Iceland and Kamchatka volcanoes. Dokl. Earth Sci. 2012, 443, 396–400. [Google Scholar] [CrossRef]
  32. Naboko, S.I. Volcanic Exhalations and Their Reaction Products, Trudy Laboratorii Vulkanologii (Trans. Labor. Volcanol.); Vlodavets, V.I., Ed.; Izd. Akad. Nauk SSSR: Moscow, Russia, 1959; Volume 16. (In Russian) [Google Scholar]
  33. Piip, B.I. Eruption of Avacha Sopka in 1945. Bull. Volcano 1953, 6–23. Available online: http://repo.kscnet.ru/1558/ (accessed on 1 March 2024). (In Russian).
  34. Zakharikhina, L.V.; Litvinenko, Y.S. Volkanism and geochemistry of soil–vegetation cover of Kamchatka. Vulkanol. Seismol. 2019, 4, 40–51. (In Russian) [Google Scholar] [CrossRef]
  35. Fukumoto, S.; Sugiyama, S.; Hata, S.; Saito, J.; Shiraiwa, T.; Mitsudera, H. Glacier mass change on the Kamchatka Peninsula, Russia, from 2000 to 2016. J. Glaciol. 2023, 69, 237–250. [Google Scholar] [CrossRef]
  36. Korneva, I.A.; Toropov, P.A.; Muraviev, A.Y.; Aleshina, M.A. Climatic factors affecting Kamchatka glacier recession. Int. J. Clim. 2024, 44, 345–369. [Google Scholar] [CrossRef]
  37. Nishioka, J.; Obata, H. Dissolved iron distribution in the western and central subarctic Pacific: HNLC water formation and biogeochemical processes. Limnol. Oceanogr. 2017, 62, 2004–2022. [Google Scholar] [CrossRef]
  38. Nishioka, J.; Obata, H.; Ogawa, H.; Ono, K.; Yamashita, Y.; Lee, K.; Takeda, S.; Yasuda, I. Subpolar marginal seas fuel the North Pacific through the intermediate water at the termination of the global ocean circulation. Proc. Natl. Acad. Sci. USA 2020, 117, 12665–12673. [Google Scholar] [CrossRef] [PubMed]
  39. Nishioka, J.; Hirawake, T.; Nomura, D.; Yamashita, Y.; Ono, K.; Murayama, A.; Shcherbinin, A.; Volkov, Y.N.; Mitsudera, H.; Ebuchi, N.; et al. Iron and nutrient dynamics along the East Kamchatka Current, western Bering Sea Basin and Gulf of Anadyr. Prog. Oceanogr. 2021, 198, 102662. [Google Scholar] [CrossRef]
  40. Konovalova, G.V. “Red tides” off Eastern Kamchatka Kamch. Institute of Ecology and Nature Management, Far Eastern Branch of the Russian Academy of Sciences, Kamch; Regional Committee for Nature Protection; Kamshat: Petropavlovsk-Kamchatsky, Russia, 1995; 56p. [Google Scholar]
  41. Orlova, T.Y.; Aleksanin, A.I.; Lepskaya, E.V.; Efimova, K.V.; Selina, M.S.; Morozova, T.V.; Stonik, I.V.; Kachur, V.A.; Karpenko, A.A.; Vinnikov, K.A.; et al. A massive bloom of Karenia species (Dinophyceae) off the Kamchatka coast, Russia, in the fall of 2020. Harmful Algae 2022, 120, 102337. [Google Scholar] [CrossRef]
  42. Sasaoka, K.; Saitoh, S.; Asanuma, I.; Imai, K.; Honda, M.; Nojiri, Y.; Saino, T. Temporal and spatial variability of chlorophyll-a in the western subarctic Pacific determined from satellite and ship observations from 1997 to 1999. Deep Sea Res. Part II Top. Stud. Oceanog. 2002, 49, 5557–5576. [Google Scholar] [CrossRef]
  43. Waga, H.; Fujiwara, A.; Hirawake, T.; Suzuki, K.; Yoshida, K.; Abe, H.; Nomura, D. Primary productivity and phytoplankton community structure in surface waters of the western subarctic Pacific and the Bering Sea during summer with reference to bloom stages. Prog. Oceanogr. 2022, 201, 102738. [Google Scholar] [CrossRef]
  44. Batischeva, N.A. Composition and distribution of zooplankton on the southeast coast of Kamchatka in spring 2006. Issled. Vodn. Biol. Resur. Kamchat. Sev. Zap. Chasti Tikhogo Okeana 2008, 11, 42–46. (In Russian) [Google Scholar]
  45. Maksimenkov, V.V.; Maksimenkova, O.V. Composition, structure and abundance of zooplankton in the coastal waters of West Kamchatka in 2005. Issled. Vodn. Biol. Resur. Kamchat. Sev. Zap. Chasti Tikhogo Okeana 2008, 10, 20–25. (In Russian) [Google Scholar]
  46. Koval, M.V.; Maximenkov, V.V. Some data about the oceanic Zooplankton in the area around the Commander Island. Issled. Vodn. Biol. Resur. Kamchat. Sev. Zap. Chasti Tikhogo Okeana 2010, 17, 5–11. (In Russian) [Google Scholar]
  47. Wassmann, P.; Reigstad, M.; Haug, T.; Rudels, B.; Carroll, M.L.; Hop, H.; Gabrielsen, G.W.; Falk-Petersen, S.; Denisenko, S.G.; Arashkevich, E.; et al. Food webs and carbon flux in the Barents Sea. Prog. Oceanogr. 2006, 71, 232–287. [Google Scholar] [CrossRef]
  48. Ruping, G.; Chen, H.; Chen, T.; Zang, Y.; Wang, W.; Zhuang, Y.; Liu, G. Geographical patterns of mesozooplankton functional diversity in the northwestern Pacific. Prog. Oceanogr. 2024, 221, 103195. [Google Scholar] [CrossRef]
  49. Richardson, T.L.; Jackson, G.A. Small phytoplankton and carbon export from the surface ocean. Science 2007, 315, 838–840. [Google Scholar] [CrossRef]
  50. Muravyev, Y.D.; Shiraiwa, T.; Yamaguchi, S.; Matsumoto, T.; Nishimura, K.; Koshima, S.; Ovsyannikov, A.A. Mass balance of glacier in condition of maritime climate—Koryto glacier in Kamchatka, Russia. In Cryospheric Studies in Kamchatka; Institute of Low Temperature Science Hokkaido University: Sapporo, Japan, 1999; Volume II, pp. 51–61. [Google Scholar]
  51. Vlodavets, V.I.; Piip, B.I. Catalog of active volcanoes of Kamchatka. Byull. Vulkanolog. Stantsii 1957, 25, 5–95. (In Russian) [Google Scholar]
  52. Koval, M.V.; Tepnin, O.B.; Gorin, S.L.; Fadeev, E.S.; Zikunova, O.M.; Lepskaya, E.V.; Shubkin, S.V.; Rudakova, S.L.; Pilganchuk, O.A.; Gorodovskaya, S.B. Factors determining spawning run dynamics and current state of Sockeye Salmon Oncorhynchus Nerka resources in the Kamchatka River. Issled. Vodn. Biol. Resur. Kamchat. Sev. Zap. Chasti Tikhogo Okeana 2020, 57, 20–25. (In Russian) [Google Scholar] [CrossRef]
  53. Gorin, S.L.; Koval, M.V.; Sazonov, A.A.; Terskii, P.N. Modern hydrological regime of the lower stream of the Penzhina River and the first data on hydrological processes in its estuaries according to the expedition of 2014. Issled. Vodn. Biol. Resur. Kamchat. Sev. Zap. Chasti Tikhogo Okeana 2015, 37, 33–52. [Google Scholar]
  54. Locia of the Sea of Okhotsk. No. 2. In Northern Part of the Sea; Publishing House of the UNGS of the USSR Navy: Leningrad, Russia, 1960; p. 200. (In Russian)
  55. Grasshoff, K.; Ehrhard, M.; Kremling, K. Methods of Seawater Analysis; Verlag Chemie: Weinheim, Germany, 1983; p. 419. Available online: https://scholar.google.com/scholar_lookup?title=Methods+of+Seawater+Analysis&author=Grasshoff,+K.&author=Ehrhard,+M.&author=Kremling,+K.&publication_year=1983 (accessed on 5 December 2024).
  56. Moroshkin, K.V. Water Masses of the Sea of Okhotsk; Nauka: Moscow, Russia, 1966. (In Russian) [Google Scholar]
  57. Chester, R.; Jickells, T. The Transport of Material to The Oceans: The Fuvial Pathway; Marine Geochemistry John Wiley & Sons, Ltd.: Chichester, UK, 2012. [Google Scholar] [CrossRef]
  58. Yuan, L.; Hans, K. Nitrogen speciation in mantle and crustal fluids. Geochim. Cosmochim. Acta 2014, 129, 13–32. [Google Scholar] [CrossRef]
  59. Pinti, D.L.; Hashizume, K. Early Life Record from Nitrogen Isotopes. In Earliest Life on Earth: Habitats, Environments and Methods of Detection; Golding, S., Glikson, M., Eds.; Springer: Dordrecht, The Netherlands, 2011. [Google Scholar] [CrossRef]
  60. Bluth, G.J.S.; Kump, L.R. Lithologic and climatologic controls of river chemistry. Geochim. Cosmochim. Acta 1994, 85, 2341–2359. [Google Scholar] [CrossRef]
  61. Chemtob, S.M.; Rossman, G.R.; Young, E.D.; Ziegler, K.; Moynier, F.; Eiler, J.M.; Hurowitz, J.A. Silicon isotope systematics of acidic weathering of fresh basalts, Kilauea Volcano, Hawai’i. Geochim. Cosmochim. Acta 2015, 169, 63–81. [Google Scholar] [CrossRef]
  62. Bernard, C.Y.; Dürr, H.H.; Heinze, C.; Segschneider, J.; Maier-Reimer, E. Contribution of riverine nutrients to the silicon biogeochemistry of the global ocean—A model study. Biogeosciences 2011, 8, 551–564. [Google Scholar] [CrossRef]
  63. Semkin, P.Y.; Tishchenko, P.Y.; Pavlova, G.Y.; Sagalaev, S.G.; Tishchenko, P.P.; Khodorenko, N.D.; Shkirnikova, E.M.; Shvetsova, M.G. Effect of river runoff on the hydrochemical characteristics of water in Udskaya Bay and Nikolaya Bay (the Sea of Okhotsk) in summer. Oceanology 2021, 61, 338–350. [Google Scholar] [CrossRef]
  64. Tishchenko, P.Y.; Semkin, P.Y.; Pavlova, G.Y.; Tishchenko, P.P.; Lobanov, V.B.; Marjash, A.A.; Mikhailik, T.A.; Sagalaev, S.G.; Sergeev, A.F.; Tibenko, E.Y.; et al. Hydrochemistry of the Tumen River estuary, Sea of Japan. Oceanology 2018, 58, 175–186. [Google Scholar] [CrossRef]
  65. Semkin, P.Y.; Tishchenko, P.Y.; Khodorenko, N.D.; Zvalinskii, V.I.; Mikhailik, T.A.; Sagalaev, S.G.; Stepanova, V.I.; Tishchenko, P.P.; Shvetsova, M.G.; Shkirnikova, E.M. Production-destruction processes in estuaries of the rivers of Artemovka and Shkotovka (Usuri Bay) in summer. Water Res. 2015, 42, 352–361. [Google Scholar] [CrossRef]
  66. Ganey, G.Q.; Loso, M.G.; Burgess, A.B.; Dial, R.J. The role of microbes in snowmelt and radiative forcing on an Alaskan icefield. Nat. Geosci. 2017, 10, 754–759. [Google Scholar] [CrossRef]
  67. Sarthou, G.; Timmermanns, K.R.; Blain, S.; Tréguer, P. Growth physiology and fate of diatoms in the ocean: A review. J. Sea Res. 2005, 53, 25–42. [Google Scholar] [CrossRef]
  68. Medina, M.; Kaplan, D.; Milbrandt, E.C.; Tomasko, D.; Huffaker, R.; Angelini, C. Nitrogen-enriched discharges from a highly managed watershed intensify red tide (Karenia brevis) blooms in southwest Florida. Sci. Total Environ. 2022, 827, 154149. [Google Scholar] [CrossRef]
  69. Martin, J.H.; Fitzwater, S.E. Iron deficiency limits phytoplankton growth in the north-east Pacific subarctic. Nature 1988, 331, 341–343. [Google Scholar] [CrossRef]
  70. Langmann, B. Volcanic Ash versus Mineral Dust: Atmospheric Processing and Environmental and Climate Impacts. Int. Sch. Res. Not. 2013, 2023, 245076. [Google Scholar] [CrossRef]
  71. Frogner, P.; Gislason, S.R.; Oskarsson, N. Fertilizing potential of volcanic ash in ocean surface water. Geology 2001, 29, 487–490. [Google Scholar] [CrossRef]
  72. Olgun, N.; Duggen, S.; Andronico, D.; Kutterolf, S.; Croot, P.L.; Giammanco, S.; Censi, P.; Randazzo, L. Possible impacts of volcanic ash emissions of Mount Etna on the primary productivity in the oligotrophic Mediterranean Sea: Results from nutrient-release experiments in seawater. Mar. Chem. 2013, 152, 32–42. [Google Scholar] [CrossRef]
  73. Longman, J.; Palmer, M.R.; Gernon, T.M.; Manners, H.R. The role of tephra in enhancing organic carbon preservation in marine sediments. Earth Sci. Rev. 2019, 192, 480–490. [Google Scholar] [CrossRef]
  74. Do, H.X.; Westra, S.; Leonard, M. A global-scale investigation of trends in annual maximum streamflow. J. Hydrol. 2017, 552, 28–43. [Google Scholar] [CrossRef]
  75. Chifflard, P.; Fasching, C.; Reiss, M.; Ditzel, L.; Boodoo, K.S. Dissolved and Particulate Organic Carbon in Icelandic Proglacial Streams: A First Estimate. Water 2019, 11, 748. [Google Scholar] [CrossRef]
  76. Flaathen, T.; Gislason, S. The effect of volcanic eruptions on the chemistry of surface waters: The 1991 and 2000 eruptions of Mt. Hekla, Iceland. J. Volc. Geoth. Res. 2007, 164, 293–316. [Google Scholar] [CrossRef]
  77. Frey, K.E.; McClelland, J.W. Impacts of permafrost degradation on arctic river biogeochemistry. Hydrol. Process 2009, 23, 169–182. [Google Scholar] [CrossRef]
  78. Moore, W.S. The subterranean estuary: A reaction zone of ground water and sea water. Mar. Chem. 1999, 65, 111–125. [Google Scholar] [CrossRef]
  79. Charkin, A.N.; Kosobokova, K.N.; Ershova, E.A.; Syomin, V.L.; Kolbasova, G.D.; Semkin, P.Y.; Leusov, A.E.; Dudarev, O.V.; Gulenko, T.A.; Yaroshchuk, E.I.; et al. A unique warm–water oasis in the Siberian Arctic’s Chaun Bay sustained by hydrothermal groundwater discharge. Commun. Earth Environ. 2024, 5, 393. [Google Scholar] [CrossRef]
  80. Deng, K.; Yang, S.; Guo, Y. A global temperature control of silicate weathering intensity. Nat. Commun. 2022, 13, 1781. [Google Scholar] [CrossRef]
Figure 1. Geographical location of the regions under study—(A). Layout of stations in coastal areas (), a monitoring station in the Penzhina River, () and the scale of altitudes and depths (meters)—(B). Monitoring stations in the Kamchatka River () this station numbers (1–6) and areas of active volcanoes ()—(C). Sampling of Shiveluch Volcano ash on the day of eruption on 11 April 2023, in the area of the monitoring station 5—(D).
Jmse 13 00569 g001
Figure 2. Water regimes of the Kamchatka River and Penzhina River in 2023 and the cruise periods in Kamchatka Gulf as well as Penzhina Bay and Shelikhov Gulf.
Jmse 13 00569 g002
Figure 3. Year-to-year changes in water discharge from May to September in Klyuchi settlement (data obtained from an electronic resource https://gmvo.skniivh.ru/index.php?id=296 (available on 1 December 2024)).
Jmse 13 00569 g003
Figure 4. Concentrations of nutrients for the Kamchatka and Penzhina Rivers.
Jmse 13 00569 g004
Figure 5. Ratio of the annual nutrient fluxes in the receiving basins from the discharges of the Kamchatka River (AF) and the Penzhina River (GL).
Jmse 13 00569 g005
Figure 6. Temperature (left panels) and salinity (right panels) in the surface water layer (A,B) and 500 m water layer (C,D) at Kamchatka Gulf.
Jmse 13 00569 g006
Figure 7. Temperature (left panels) and salinity (right panels) in the surface water layer (A,B) and bottom water layer (C,D) at Penzhina Bay and Shelikhov Gulf (published earlier [30]).
Jmse 13 00569 g007
Figure 8. Dependence of nutrients on salinity. HTW—high turbidity water.
Jmse 13 00569 g008
Figure 9. The spatial and temporal variability of Chl-a from March to October 2023 on both sides of the Kamchatka Peninsula (upper panel); from March to October 2023 for Kamchatka Gulf (middle panel); and from March to October for the period from 2003 to 2023 for Kamchatka Gulf (lower panel).
Jmse 13 00569 g009
Figure 10. Species diversity, percentage of species, and zooplankton biomass in mg/m3 in the basins under study.
Jmse 13 00569 g010
Figure 11. Climatic changes in air temperature and precipitation in the valleys of the Kamchatka River (AF) and the Penzhina River (GL). Source: http://www.pogodaiklimat.ru/history/32389.htm (available on 1 December 2024).
Jmse 13 00569 g011
Table 1. Coordinates of water sampling stations in the Kamchatka River and Penzhina River.
Station No.NE
154°01.450′157°50.940′
2 54°37.462′158°27.781′
3 55°06.953′159°03.951′
4 55°55.249′159°40.740′
556°20.184′160°50.476′
6 56°14.572′162°29.508′
Penzhina River (Kamenskoye settlement)62°27.900′166°13.000′
Table 2. Quantity (F (tons/year)) of nutrients (P, N, Si, C) entering the receiving basins of the Kamchatka River and Penzhina River in 2023.
ParameterFDIPFPtotFDINFNtotFDSiFDOC
Kamchatka River2705456569809526287,48660,485
Penzhina River2643301046469486,766142,294
Table 3. Concentration of nutrients (µM) in water after contact with tephra taken near Klyuchi settlement (station 4) on 11 April 2023. The tephra/water ratio is 1:10. Laboratory experiment results [28].
Period After Tephra Comes in Contact with WaterType of WaterDIPDSiNO2NO3NH4
10 minseawater with salinity of 34.06 psu3.567.010.181.348.78
1 h3.7912.340.241.378.71
5 h5.9630.530.091.388.39
24 h8.1976.570.121.038.84
9 days7.67107.090.091.2410.62
background0.190.000.050.040.37
10 minMilli-Q 22.465.580.121.0610.91
1 h22.418.900.091.0910.97
5 h23.6022.690.071.0712.77
24 h23.8071.720.110.7511.57
9 days23.30103.310.080.8310.97
background0.000.170.020.120.18
Table 4. Content of major elements in the volcanic ash sample (mass, %) taken in the vicinity of Klyuchi settlement on 11 April 2023 [28].
SiO2TiO2Al2O3Fe2O3MnOMgOCaONa2OK2OP2O5H2OLOIΣ
63.60.4516.114.300.083.064.774.711.370.190.440.7099.77
Disclaimer/Publisher’s Note: The statements, opinions and data contained in all publications are solely those of the individual author(s) and contributor(s) and not of MDPI and/or the editor(s). MDPI and/or the editor(s) disclaim responsibility for any injury to people or property resulting from any ideas, methods, instructions or products referred to in the content.

