Article

Evaluation of Measurement Uncertainty for the Wave Buoy Calibration Device Using a Vertical Lifting Method

1
South China Sea Sea Area and Island Center, Ministry of Natural Resources, Guangzhou 510310, China
2
Key Laboratory of Marine Environmental Survey Technology and Application, Ministry of Natural Resources, P.R. China, Guangzhou 510310, China
3
National Marine Date Center, Guangdong-Hong Kong-Macao Greater Bay Area Branch, Guangzhou 510310, China
4
School of Transportation and Logistics Engineering, Wuhan University of Technology, Wuhan 430063, China
*
Author to whom correspondence should be addressed.
J. Mar. Sci. Eng. 2025, 13(3), 605; https://doi.org/10.3390/jmse13030605
Submission received: 23 January 2025 / Revised: 25 February 2025 / Accepted: 2 March 2025 / Published: 19 March 2025
(This article belongs to the Section Ocean Engineering)

Abstract

:
This study evaluates the measurement uncertainty of the wave buoy calibration device using a vertical lifting method to ensure the accuracy and reliability of wave buoy measurements for marine research. The calibration device employs a linear motor-driven vertical displacement system, integrating a standard steel tape for wave height measurement and a photoelectric switch-based time calibration module for wave period verification. To address the limitations of traditional instruments, the device utilizes a 0.1 mm laser beam and image processing software to enhance the resolution of the standard steel tape, reducing the smallest division measurement from 1 mm to 0.1 mm. Additionally, a high-precision time calibration method synchronizes the time of the motor’s upper computer software and a frequency meter, minimizing indication error. Key uncertainty sources, including repeatability, environmental temperature effects, and the smallest division measure of instrument, were systematically analyzed. Results demonstrate that the extended measurement uncertainty (k = 2) for wave heights of 0.03 m and 40 m are 0.058 mm and 1.088 mm, respectively, while the uncertainty for a 30 s wave period is 3 ms. These values meet the stringent accuracy requirements (0.5% of measured values) for calibrating advanced wave buoys like the Directional Waverider 4. The proposed device provides a robust solution for validating wave buoy performance, offering significant practical value for oceanographic studies and coastal engineering applications.

1. Introduction

Scientists explore the hidden mysteries in the ocean world by studying temperature, salinity, depth, waves, currents, and tides. As one of ocean research’s key elements, waves have always been an area of interest [1,2]. In open ocean conditions under severe storms, significant wave heights (the average height of the highest one-third of waves) rarely exceed 15 m, as documented in historical data [3]. Liu et al. observed 32.3 m waves generated by Typhoon Rosa through a disk-shaped buoy in the Western Pacific to the northeast of Taiwan, China, in 2007, and the huge waves caused severe damage to the coastline and coastal engineering [4,5]. Ardhuin et al. detected waves with a wave height of 0.03 m and a wave period of 25 s through the Surface Water and Ocean Topography (SWOT) satellite. These waves were generated by intense storms and radiated globally in the form of expansion, giving rise to microseisms and affecting coastal areas [6,7,8]. The breaking of sea ice shelves and ice flows have a large impact on the dynamics of the polar regions, and this requires accurate measurements of the wave signals, which can be really small due to the attenuation in the ice [9,10]. Both huge waves and micro waves need to be observed by devices. The Waverider buoy (principle of acceleration sensor), produced by Datawell (a Dutch oceanographic instruments company), is one of the wave buoys known for featuring the highest measurement accuracy worldwide. Currently, the measurement accuracy of most wave buoys produced by other companies is verified by conducting offshore comparison tests with the Waverider buoy [11,12,13,14]. Among them, the Directional Waverider 4 type wave buoy produced by Datawell is the most accurate wave buoy of the company [15]. According to its specification, the smallest division measure is 1 mm, the maximum measurable wave height is 40 m, and the measurement accuracy of the wave height is 0.5% of the measured value; when it measures waves of 0.03 m, the measurement error can reach 0.15 mm. With the rapid development of the Global Positioning System (GPS), GPS-based wave buoys were produced. Spoondrift Technologies, Inc., Integral Consulting, Inc., and Sandia National Laboratories have developed the Spotter, a low-cost, easy-to-use, solar-powered GPS-based wave measurement platform. The wave displacement accuracy is approximately 2 cm, and accuracy depends on field of view, weather conditions, and GPS status [16,17,18]. Yet the measurement accuracy claimed by the manufacturer needs to be verified by the wave buoy calibration device. Ardhuin et al. state in the “Data Availability Statement” of the paper that “product quality is not final and will be affected by some evolutions as the SWOT project team makes progress on science data processing algorithms and instrument calibrations”. So, the measurement accuracy of SWOT is associated with the development of calibration technology. Compared with a calibrated in situ wave buoy, the measurement accuracy of SWOT can be verified, which illustrates the essentiality of the calibration device that judges the accuracy of wave buoys. The minimum indication error of the instrument that the calibration device can calibrate is closely related to the uncertainty of the calibration device. The smaller the uncertainty, the smaller the indication error of the calibrated instrument that can be evaluated. The research group has established a wave buoy calibration device using a vertical lifting method, which can not only measure a wave height of 0.03 m, but also that of 40 m. Based on the research result, the paper conducts an uncertainty evaluation of wave buoy calibration devices to ensure the accuracy and reliability of calibration results.
The remaining paper is as follows. In the second section, the design of the standard instrument for the wave buoy calibration device is presented. This includes the introduction of the wave buoy calibration device, the design of the wave height measuring standard instrument, and the design of the wave period measuring standard instrument. The third section focuses on the evaluation of measurement uncertainty, covering the evaluation of wave height measurement uncertainty and wave period measurement uncertainty. Finally, the conclusion summarizes the key findings of the study, demonstrating the measurement accuracy of the calibration device and its significance for marine scientific research and applications.

2. Design of the Standard Instrument for the Wave Buoy Calibration Device

2.1. Introduction of Wave Buoy Calibration Devices

The acceleration sensor wave buoy is based on the principle that water particles on the wave surface perform periodic vibrations near the equilibrium position. By measuring the vertical acceleration of water particles at different times, the wave height and wave period can be calculated through quadratic integration of the acceleration. According to the characteristics of the linear motor, such as stable operation and high real-time precision [19,20], the research group has designed a wave buoy calibration device using the vertical lifting method based on a linear motor. The wave buoy calibration device consists of a linear motor, a supporting floor, a linear guide, a grating ruler, and a carrier case, as shown in Figure 1. The linear motor is composed of a stator and an actuator. The stator is installed on the supporting floor, which provides a stable structural foundation for the entire calibration device. The actuator is installed on the carrier case with the wave buoy to be calibrated placed inside it. The linear guide consists of a guide and a slider, and the connection between the two of them is through ball bearings with point contact, minimizing the frictional force [21]. The linear guide is installed on the supporting floor, and the slider is installed on the carrier case, which allows the actuator to drive the carrier case to move in the vertical direction along the linear guide. The linear guide keeps a stable gap between the stator and the actuator as well as between the grating ruler and the reading head. The grating ruler is fixed on the supporting flooring by gluing, and the reading head is installed on the carrier case. The actuator, controlled by a motion controller, drives the carrier case to move up and down, and the reading head can read the real-time position of the grating ruler.

2.2. Wave Height Measuring Standard Instrument Design

The linear motor in the calibration device is installed vertically on the supporting floor, and the grating ruler is also installed on the supporting floor by gluing. The grating ruler cannot be reused once removed, so it cannot serve as the standard instrument that requires it to be removed regularly for inspection or calibration. In addition, the installation of the motor cannot guarantee its verticality, so tilt errors will occur, which also introduces measurement uncertainty, especially for the 40 m wave height calibration device. Therefore, it is necessary to find a measuring tool to be the wave height standard instrument, which not only measures the vertical displacement directly, but also is convenient for inspection or calibration [22]. Taking the Directional Waverider 4 type wave buoy as an example, its wave height accuracy is 0.5% of the measured value, the measurement error of a 0.03 m wave height is 0.15 mm, and that of a 40 m wave height is 200 mm. The maximum permissible error (MPE) of length measuring instruments can be divided into micron-level, millimeter-level, centimeter-level, and meter-level. The measuring instrument with millimeter-level, centimeter-level, or meter-level MPE has a relatively large measurement error, so is not considered as the wave height standard instrument. After performing a survey, the most common measuring instruments with micron-level MPE include laser interferometers, laser trackers, and standard steel tape [23]. Laser interferometers and laser trackers also need to be installed vertically, or tilt errors occur, and they are complicated to install and inconvenient to use. Comparatively, standard steel tapes can remain vertical by attaching a 10 kg weight to the bottom [24]. However, the 1 mm smallest division measure of the standard steel tape introduces an uncertainty of 0.289 mm, which exceeds the measurement error of the 0.03 m wave height of the Directional Waverider 4 type wave buoy. Aiming at reducing the measurement uncertainty introduced by the smallest division measure, the research group uses a one-line laser beam with a width of 0.1 mm as the reading reference and reads the value with a one hundredfold optical zoom camera. At the single focal length, a range of 60 mm can be photographed, the specific position of the laser beam can be observed, and the reading can be taken up to the 1 mm digit, as shown in Figure 2. At the one hundredfold focal length position, 1.5 graduations of the standard steel tape are displayed, and the smallest division measure of the standard steel tape is reduced from 1 mm to 0.1 mm by using an image processing software to perform a virtual 10-equal division of the smallest division measure, and the reading can be estimated to 0.01 mm [25].

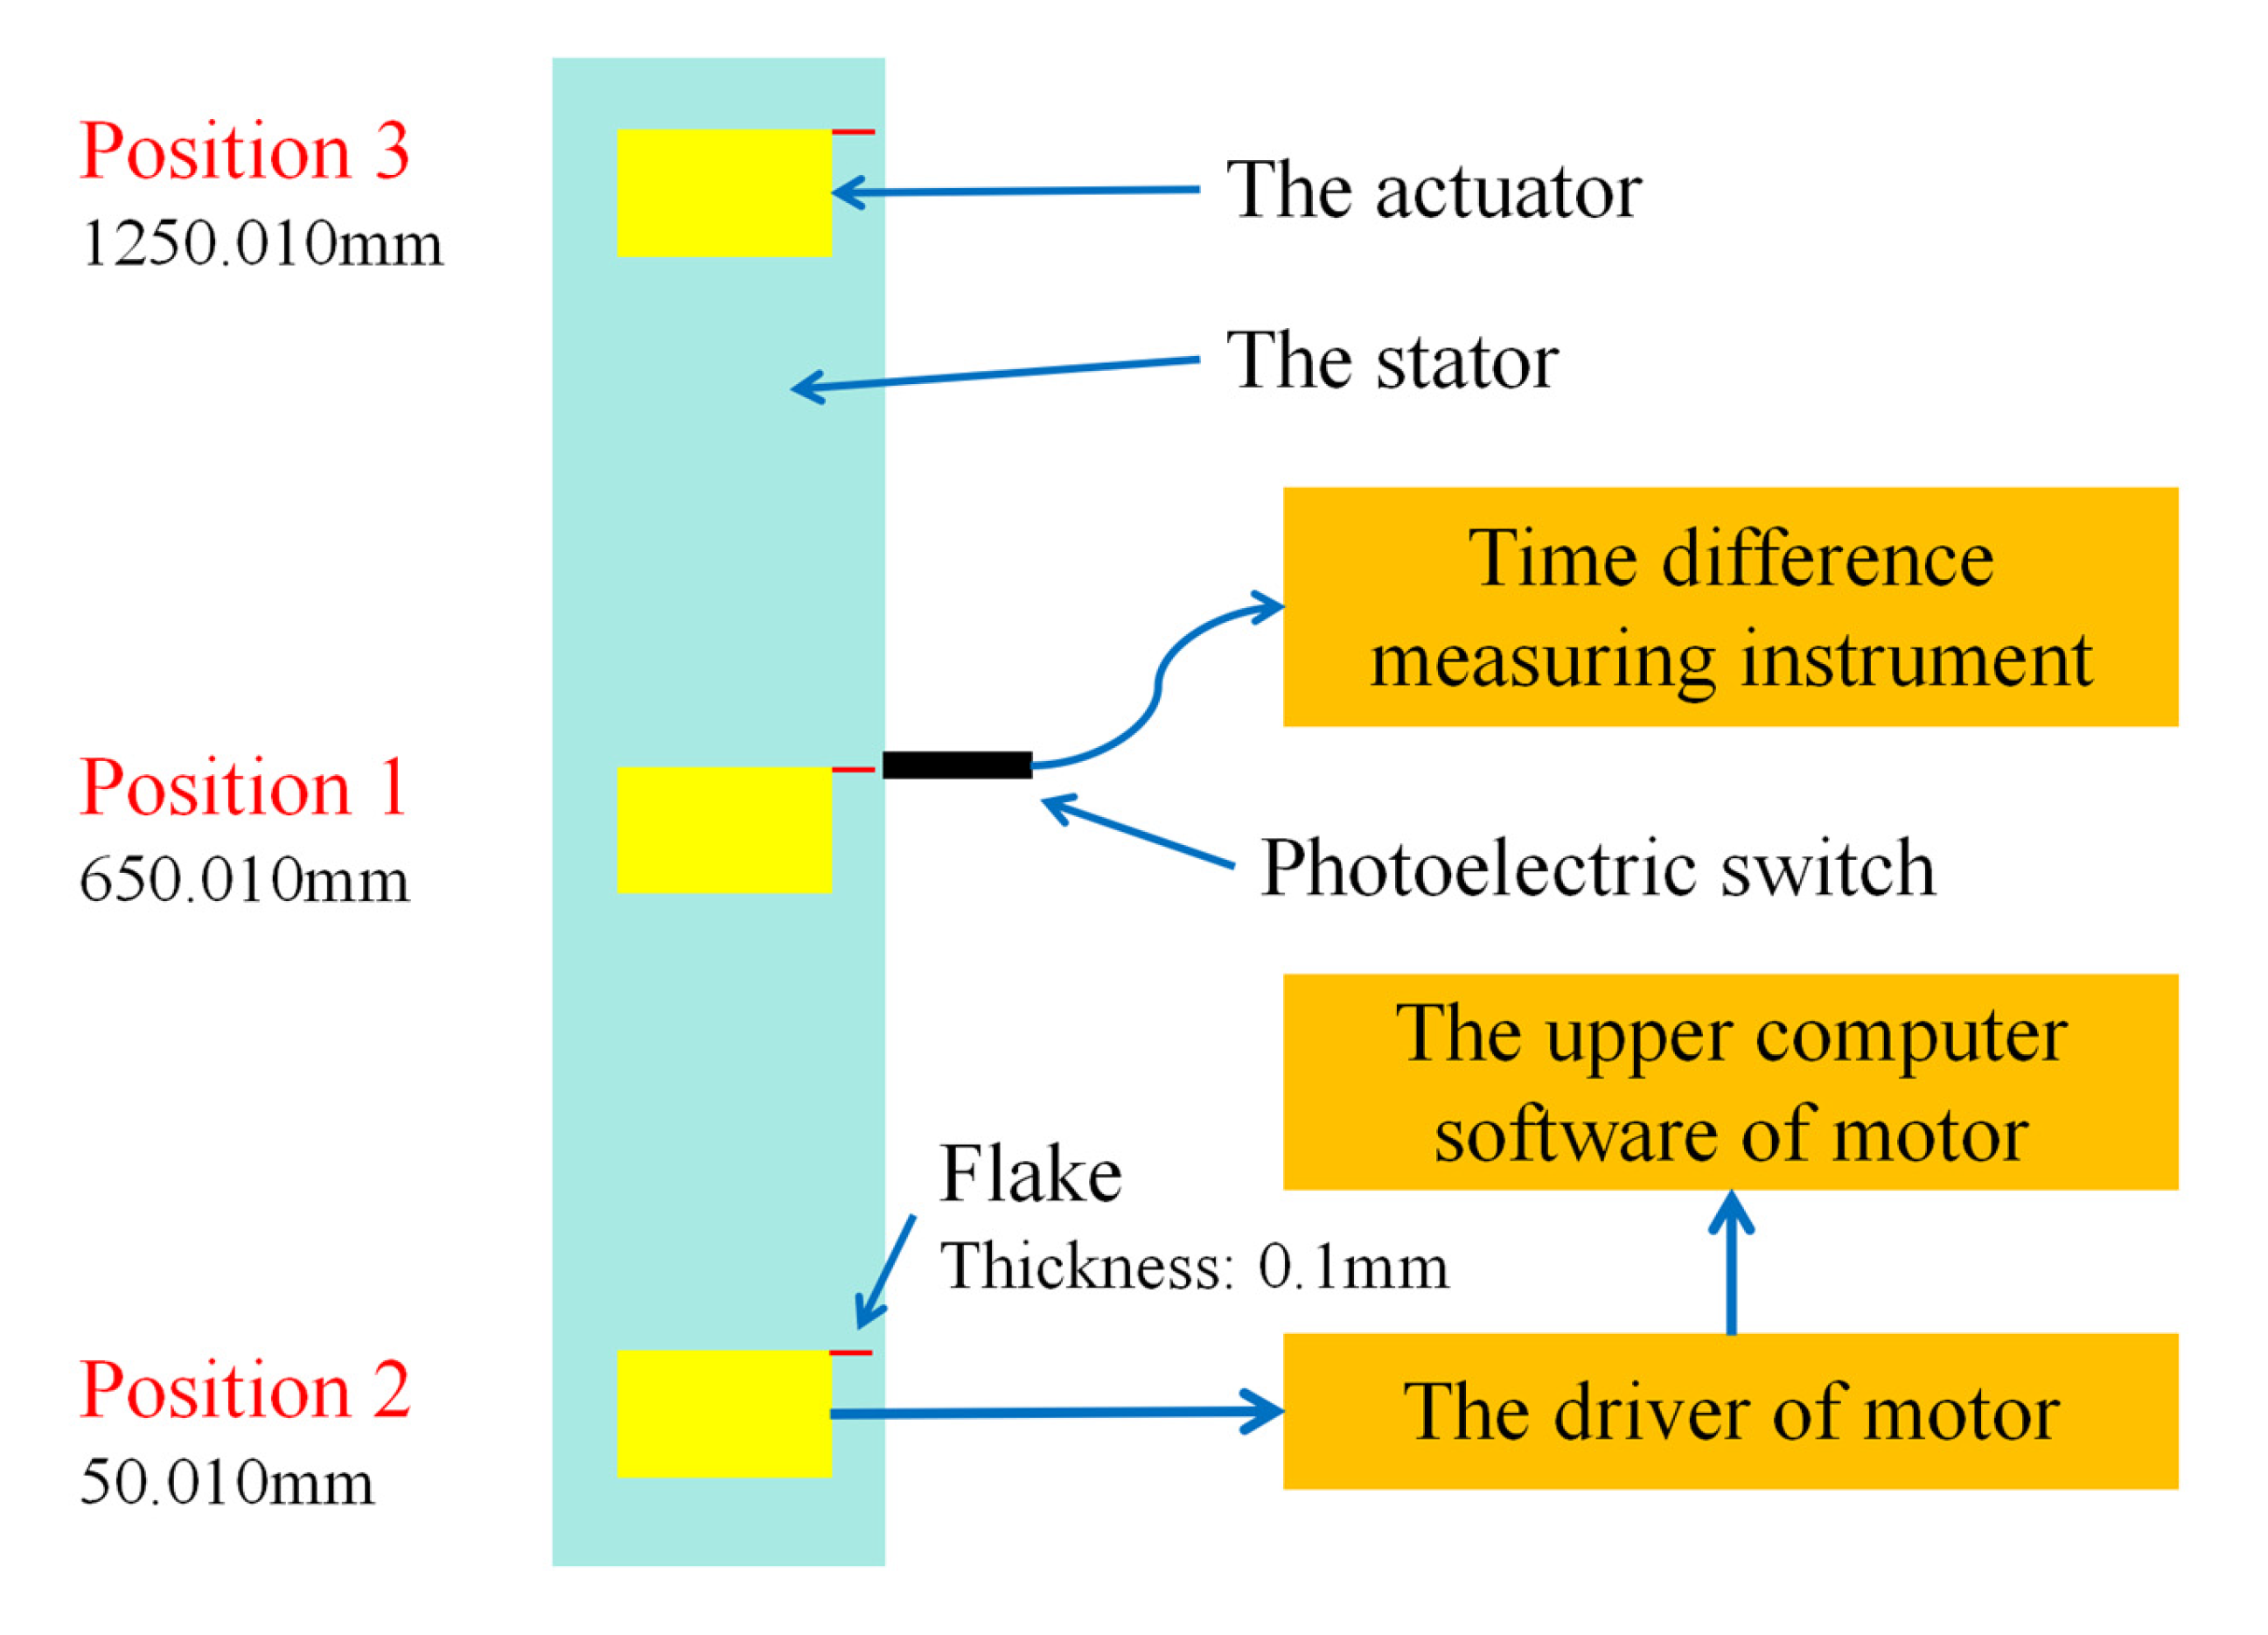
2.3. Wave Period Measuring Standard Instrument Design

The wave period is generally (2~30) s, and the time is short; if using an electronic stopwatch as a standard instrument, the measurement time will introduce greater uncertainty due to the instability of human reaction time. The wave period accuracy of the Directional Waverider 4 type wave buoy is 0.5% of the measured value, and the measurement error of the 2 s wave period is 10 ms. The expanded measurement uncertainty of the electronic stopwatch given by a higher level of legal metrological verification institution is 10 ms (k = 2); only the electronic stopwatch introduces 5 ms uncertainty, which is large and cannot meet the calibration accuracy requirements. The 5 MHz crystal oscillator in the motor driver provides the clock for the motor upper computer software to record the real-time position of the motor. Still, the driver has no crystal oscillator frequency output interface and cannot calibrate the crystal oscillator frequency. According to the “JJG 2007-2015 Time frequency measuring instrument verification system table”, the relative frequency deviation of the crystal oscillator is generally ±1 × 10⁻⁵ to ±5 × 10⁻⁹, and the relative frequency deviation and time deviation of the crystal oscillator are calculated according to Equation (1) [26,27]. The relative frequency deviation of the crystal oscillator is calculated as the worst ±1 × 10⁻⁵. The time deviation that the crystal oscillator may introduce at 2 s is ±0.02 ms. Although the time deviation introduced by the relative frequency deviation of the crystal oscillator is slight, it is not calibrated by standard time, and all are empirical values.
f d = f s f a f s T d = f d T
Here, fs is the standard frequency of the crystal oscillator, fa is the actual output frequency of the crystal oscillator, fd is the frequency deviation of the crystal oscillator, T is the wave period, and Td is the time deviation.
A photoelectric switch is installed on the supporting plate, and a flake with a thickness of 0.1 mm is installed on the actuator. When the motor drives the flake to the photoelectric switch position, the flake will block the optical signal of the photoelectric switch, the photoelectric switch outputs a rising edge signal, the rising edge signal is input into the frequency meter, and the frequency meter starts to count. The motor moves to the photoelectric switch position again, the photoelectric switch outputs a rising edge signal again, and the frequency meter stops to count. The time calibration process is shown in Figure 3: First, confirm the photoelectric switch’s specific position on the supporting floor and control the motor to approach the photoelectric switch. When the distance from the photoelectric switch is about 10 mm, control the motor to move 1 mm each time and check whether the photoelectric switch outputs the rising edge signal until the photoelectric switch outputs the rising edge signal. The position value displayed by the motor upper computer software is 650.010 mm (that is, the grating ruler value) and is denoted as position 1, which is the position where the recording time starts and ends in the motor upper computer software. Second, the downward motion of the motor is controlled to 50.010 mm, denoted as position 2. The speed of the motor is set to 1 m/s (that is, 1 mm/ms). The sampling interval is set to 1 ms, which can ensure that the position interval of each sampling by the motor upper computer software is 1 mm when the motor passes through position 1, which is convenient to determine the time when the motor upper computer software starts and ends the timing. The motor runs upwards from 1200 mm to 1250.010 mm, denoted as position 3. When the motor passes through the photoelectric switch, the rising edge signal output by the photoelectric switch is input to the frequency meter as the starting point for the timing. The motor upper computer software takes the time when the grating ruler is (650.010 ± 0.5) mm as the starting point of timing. Third, after 29 s, set the motor to run down 1200 mm to 50.010 mm, keep the speed and sampling interval unchanged, the rising edge signal output by the photoelectric switch is input to the frequency meter as the timing end, and the motor host software takes the time when the grating ruler shows the value of (650.010 ± 0.5) mm as the timing end. This can unify the start and end time of the motor upper computer software and frequency meter and complete the time calibration of the motor upper computer software. A higher level of legal metrology verification institution provides the frequency meter and issues a calibration certificate for the time measurement module of the motor upper computer software. The indicating error of the 30 s wave period is 0.1 ms, which is very small compared with the 10 ms measurement error of the 2 s wave period of the wave buoy. The motor upper computer software can be used as a standard instrument.

3. Evaluation of Measurement Uncertainty

3.1. Evaluation of Wave Height Measurement Uncertainty

The wave height is determined by the subsection measurement. First, the motor is driven up for a displacement, and the indicating value of the standard steel tape is recorded as H1; then, the motor is driven up again for a displacement; the indicating value of the standard steel tape is recorded as H2; the difference between the two values of the standard steel tape is the standard wave height.
The measurement model is linear, the measurement equation is shown in Equation (2), and the input and output probability distribution is symmetrical. We use the guide of measurement uncertainty expression to evaluate the uncertainty [28,29].
Y 1 = H 2 H 1
Here, Y1 is the standard wave height value, H1 is the standard steel tape’s value when the motor is at its lowest point, and H2 is the standard steel tape’s value when the motor is at its highest point.
The measurement uncertainty mainly comes from the uncertainty introduced by the measurement repeatability of the standard steel tape, the smallest division measure of the standard steel tape, the linear expansion coefficient of the standard steel tape, the influence of ambient temperature, and the measurement of the standard steel tape.
(a)
The uncertainty introduced by the measurement repeatability of the standard steel tape
Taking 1 m wave height as an example, the standard steel tape was measured 10 times. Type A evaluation was adopted, and the probability distribution followed a normal distribution. The uncertainty introduced by the measurement repeatability of the standard steel tape is shown in Table 1.
Whether the wave height is 0.03 m or 40 m, the reading of the standard steel tape is consistent and the uncertainty introduced by its repeatability is the same.
(b)
The uncertainty introduced by the smallest division measure of the standard steel tape
The smallest division measure of the standard steel tape is 1 mm. According to the discussion in Section 2.2, the smallest division measure is reduced to 0.1 mm. Type B evaluation is adopted, and the coverage probability follows a uniform distribution, the coverage factor k = 3 , then the uncertainty u2h = 0.1/(2 × 3 ) mm = 0.0289 mm.
The dispersion of the indicated values under repeated measurements depends on the random effects of the instrument measurement results and the smallest division measure. Therefore, under repeated measurement, when the uncertainty component introduced by the repeatability of the measurement result is less than the uncertainty component introduced by the smallest division measure, the uncertainty introduced by the smallest division measure includes the uncertainty introduced by repeatability, and the uncertainty introduced by the repeatability should not be considered again.
(c)
The uncertainty introduced by the linear expansion coefficient of the standard steel tape
The linear expansion coefficient of the standard steel tape is 11.5 × 10⁻⁶ °C−1, Type B evaluation is adopted, and the coverage probability follows a uniform distribution. The possible upper and lower deviation of the linear expansion coefficient (C1) is ±2 × 10⁻⁶ °C−1. The measurement standard uncertainty of different wave heights is shown in Equation (3).
u 3 h = C 1 × H / 3
Here, C1 is 2 × 10⁻⁶ °C−1 and H is the wave height.
(d)
The uncertainty introduced by the influence of ambient temperature
The ambient temperature of the higher level legal metrological verification institution when carrying out calibration is (20 ± 1) °C, and the ambient temperature of the calibration device is (20 ± 1) ℃. At a higher level of legal verification institution, the ambient temperature at which the standard steel tape is calibrated may be 19.0 °C, and the ambient temperature at which the wave buoy is calibrated may be 21.0 °C. The maximum possible temperature difference (K) is 2 °C. Type B evaluation is adopted and the coverage probability follows a uniform distribution. The possible upper and lower deviation of the ambient temperature is ±2 °C. The measurement standard uncertainty of different wave heights is shown in Equation (4)
u 4 h = C 2 × K × H / 3
Here, C2 is the linear expansion coefficient of the linear expansion coefficient, C2 is 11.5 × 10⁻⁶ °C−1, K is 2 °C, and H is the wave height.
(e)
The uncertainty introduced the measurement of the standard steel tape
The extended measurement uncertainty (Ush) of the standard steel tape is given by the higher legal metrological verification institution, Ush is 0.005 + 0.005 × H mm (H is the wave height in mm), the coverage factor k is 2, and the standard uncertainty (u5h) is Ush/k.
(f)
The combined standard uncertainty
u c h = u 2 h 2 + u 3 h 2 + u 4 h 2 + u 5 h 2
(g)
The extended measurement uncertainty
The coverage factor k is 2, then the extended measurement uncertainty (Uh) is shown in Equation (6). The uncertainty introduced is shown in Table 2.
U h = 2 u c h ( k = 2 )

3.2. Evaluation of Wave Period Measurement Uncertainty

The measurement model is linear, the measurement equation is shown in Equation (7), and the input and output probability distribution is symmetrical. We use the guide of measurement uncertainty expression to evaluate the uncertainty.
Y 2 = T
Here, Y2 is the standard wave period and T is the value of the motor upper computer software.
The measurement uncertainty mainly comes from the uncertainty introduced by the response time of the photoelectric switch, the sampling interval of the motor upper computer software, the digital output transmission delay of the driver, and the measurement of the motor upper computer software.
(a)
The uncertainty introduced by the response time of the photoelectric switch
The response time of the photoelectric switch is 1 ms. Type B evaluation is adopted, and the coverage probability follows a uniform distribution. The coverage factor k is 3 then the uncertainty (u1t) is 0.3 ms.
(b)
The uncertainty introduced by the sampling interval of the motor upper computer software
The sampling interval of the motor upper computer software is 1 ms. Type B evaluation is adopted, and the coverage probability follows a uniform distribution. In the upper computer software of motor timing, the maximum time from the start to the end may be 2 ms, the coverage factor k is 3 , then the uncertainty (u2t) is 1.2 ms.
(c)
The uncertainty introduced by the digital output transmission delay of the driver
The digital output transmission delay of the driver is 1 ms. Type B evaluation is adopted, and the coverage probability follows a uniform distribution, the coverage factor k is 3 , then the uncertainty (u3t) is 0.3 ms.
(d)
The uncertainty introduced by the measurement of the motor upper computer software
The extended measurement uncertainty (Ust) of the standard steel tape measure is given by the higher legal metrological verification institution, Ust is 0.01 ms, the coverage factor k is 2, and the standard uncertainty (u4t) is 0.005 ms.
(e)
The combined standard uncertainty
u c t = u 1 t 2 + u 2 t 2 + u 3 t 2 + u 4 t 2 = 1.3   ms
(f)
The extended measurement uncertainty
The coverage factor k is 2, then the extended measurement uncertainty (Uh) is shown in Equation (9).
U t = 2 u c t = 3 ms

4. Conclusions

In this study, the wave height and wave period measurement uncertainty of the wave buoy calibration device using the vertical lifting method is evaluated, and the measurement accuracy of the calibration device is demonstrated. The research shows no vertical error when the standard steel tape pulled by heavy objects is used as the wave height standard instrument, and the measured value of the standard steel tape is the standard wave height. The camera is used to read the value of standard steel tape, and the image processing software is used to perform a virtual 10-equal division of the smallest division measure. The smallest division measure of the standard steel tape is reduced from 1 mm to 0.1 mm, and the uncertainty introduced by the smallest division measure is reduced. The time benchmark of the photoelectric switch and flake is established, which solves the problem of the time measurement module of the motor upper computer software not being calibrated directly. By analyzing the source of uncertainty of the wave height and wave period, the extended measurement uncertainty of the 0.03 m and 40 m wave height is evaluated as 0.058 mm and 1.088 mm (k = 2), respectively, and the extended measurement uncertainty of the 30 s wave period is 3 ms (k = 2). The extended uncertainty of the wave height and wave period meets the calibration requirements of Directional Waverider 4 type wave buoy accuracy (0.05% of the measured value), provides essential practical guidance for the measurement accuracy of the wave buoy, and has significant value for marine scientific research and applications.

Author Contributions

Conceptualization, D.Z.; Methodology, Y.H.; Software, C.G.; Investigation, C.G.; Resources, T.Y.; Data curation, L.H.; Writing—original draft, Y.H.; Writing—review & editing, D.Z.; Visualization, L.H. All authors have read and agreed to the published version of the manuscript.

Funding

This research was funded by Key Laboratory of Marine Environmental Survey Technology and Application, Ministry of Natural Resources, P.R. China (NO. MESTA-2021-D009) and National Marine Date Center, Guangdong-HongKong-Macao Greater Bay Area Branch (No.2024B1212080006).

Data Availability Statement

The original contributions presented in this study are included in the article. Further inquiries can be directed to the corresponding author.

Conflicts of Interest

The authors declare no conflict of interest.

References

  1. Pradal, M.A.; Gnanadesikan, A. How does the Redi parameter for mesoscale mixing impact global climate in an Earth System Model? J. Adv. Model. Earth Syst. 2014, 6, 586–601. [Google Scholar] [CrossRef]
  2. Rossby, T.; Flagg, C.; Chafik, L.; Harden, B.; Soiland, H. A Direct Estimate of Volume, Heat, and Freshwater Exchange Across the Greenland-Iceland-Faroe-Scotland Ridge. J. Geophys. Res. Ocean. 2018, 123, 7139–7153. [Google Scholar] [CrossRef]
  3. Torsethaugen, K.; Haver, S.K.; Norway, S. Simplified Double Peak Spectral Model For Ocean Waves. In Proceedings of the International Ocean and Polar Engineering Conference, Toulon, France, 23–28 May 2004; ISOPE-I-04-289. [Google Scholar]
  4. Wang, D.; Mitchell, D.A.; Teague, W.J.; Jarosz, E.; Hulbert, M. Extreme Waves Under Hurricane Ivan. Science 2005, 309, 896. [Google Scholar] [CrossRef] [PubMed]
  5. Liu, P.C.; Chen, H.S.; Doong, D.-J.; Kao, C.C.; HSU, Y.-J.G. Monstrous ocean waves during typhoon Krosa. In Annales Geophysicae; Copernicus Publications: Göttingen, Germany, 2008; Volume 26, pp. 1327–1329. [Google Scholar]
  6. Hanafin, J.; Quilfen, Y.; Ardhuin, F.; Sienkiewicz, J.; Queffeulou, P.; Obrebski, M.; Chapron, B. Phenomenal sea states and swell radiation: A comprehensive analysis of the 12-16 February 2011 North Atlantic storms. Bull. Am. Meteorol. Soc. 2012, 93, 1825–1832. [Google Scholar] [CrossRef]
  7. Husson, R.; Ardhuin, F.; Chapron, B.; Collard, F.; Balanche, A. Swells throughout the pacific: A combined view using the global seismic network and Envisat’s wave mode ASAR data. Geophys. Res. Lett. 2012, 39, L15609. [Google Scholar] [CrossRef]
  8. Ardhuin, F.; Molero, B.; Bohé, A.; Nouguier, F.; Collard, F.; Houghton, I.; Hay, A.; Legresy, B. Phase-Resolved Swells Across Ocean Basins in SWOT Altimetry Data: Revealing Centimeter-Scale Wave Heights Including Coastal Reflection. Geophys. Res. Lett. 2024, 51, 109658. [Google Scholar] [CrossRef]
  9. Thomson, J. Wave propagation in the marginal ice zone: Connections and feedback mechanisms within the air-ice-ocean system. Philos. T. R. Soc. A 2022, 380, 20210251. [Google Scholar] [CrossRef]
  10. Nose, T.; Katsuno, T.; Waseda, T.; Ushio, S.; Rabault, J.; Kodaira, T.; Voermans, J. Observation of wave propagation over 1000 km into Antarctica winter pack ice. Coast. Eng. J. 2023, 66, 115–131. [Google Scholar] [CrossRef]
  11. Jangir, P.K.; Ewans, K.C.; Young, I.R. Comparative Performance of Radar, Laser, and Waverider Buoy Measurements of Ocean Waves. Part II: Time-Domain Analysis. J. Atmos. Ocean. Technol. 2023, 40, 939–956. [Google Scholar] [CrossRef]
  12. Xue, C.; Guo, J.S.; Jiang, S.M.; Wang, Y.F.; Guo, Y.L.; Li, J. Performance Characteristics of Newly Developed Real-Time Wave Measurement Buoy Using the Variometric Approach. J. Mar. Sci. Eng. 2024, 12, 2032. [Google Scholar] [CrossRef]
  13. Lopez, G.; Conley, D.C. Comparison of HF Radar Fields of Directional Wave Spectra Against In Situ Measurements at Multiple Locations. J. Mar. Sci. Eng. 2019, 7, 271. [Google Scholar] [CrossRef]
  14. Timmermans, B.; Shaw, A.G.P.; Gommenginger, C. Reliability of Extreme Significant Wave Height Estimation from Satellite Altimetry and In Situ Measurements in the Coastal Zone. J. Mar. Sci. Eng. 2020, 8, 1039. [Google Scholar] [CrossRef]
  15. Directional Waverider 4. Available online: https://datawell.nl/products/directional-waverider-4 (accessed on 1 January 2025).
  16. Raghukumar, K.; Chang, G.; Spada, F.; Jones, C.; Janssen, T.; Gans, A. Performance Characteristics of “Spotter”, a Newly Developed Real-Time Wave Measurement Buoy. J. Atmos. Ocean. Technol. 2019, 36, 1127–1141. [Google Scholar] [CrossRef]
  17. Rabault, J.; Nose, T.; Hope, G.; Müller, M.; Breivik, Ø.; Voermans, J.; Hole, L.R.; Bohlinger, P.; Waseda, T.; Kodaira, T.; et al. OpenMetBuoy-v2021: An easy-to-build, affordable, customizable, open-source instrument for oceanographic measurements of drift and waves in sea ice and the open ocean. Geosciences 2022, 12, 110. [Google Scholar] [CrossRef]
  18. Thomson, J.; Bush, P.; Castillo Contreras, V.; Clemett, N.; Davis, J.; de Klerk, A.; Iseley, E.; Rainville, E.J.; Salmi, B.; Talbert, J. Development and testing of microSWIFT expendable wave buoys. Coast. Eng. J. 2023, 66, 168–180. [Google Scholar] [CrossRef]
  19. Zhang, L.; Kou, B.; Jin, Y.X.; Chen, Y.H.; Liu, Y.J. Investigation of an Ironless Permanent Magnet Linear Synchronous Motor with Cooling System. Appl. Sci. 2016, 6, 422. [Google Scholar] [CrossRef]
  20. Chen, S.Y.; Chien, Z.J.; Wang, W.Y.; Chiang, H.H. Contour Tracking Control of a Linear Motors-Driven X-Y-Y Stage Using Auto-Tuning Cross-Coupled 2DOF PID Control Approach. Appl. Sci. 2020, 10, 9036. [Google Scholar] [CrossRef]
  21. Zhu, Y.L.; Cheng, Y.B.; Gao, H.T.; Sun, S.H.; Zhang, X.D.; Xue, L.; Tang, J.W.; Tang, Y.Q. High-Precision Measurement of Microscales Based on Optoelectronics and Image Integration Method. Micromachines 2024, 15, 1162. [Google Scholar] [CrossRef]
  22. Cheng, Y.B.; Wang, Z.Y.; Chen, X.H.; Li, Y.; Li, H.Y.; Li, H.L.; Wang, H.B. Evaluation and Optimization of Task-oriented Measurement Uncertainty for Coordinate Measuring Machines Based on Geometrical Product Specifications. Appl. Sci. 2019, 9, 6. [Google Scholar] [CrossRef]
  23. de Groot, P.J. A review of selected topics in interferometric optical metrology. Rep. Prog. Phys. 2019, 82, 056101. [Google Scholar] [CrossRef]
  24. JJG 741-2022; Standard Steel Tapes. State Market Regulatory Administration of China: Beijing, China, 2022.
  25. Yan, T.; Li, F. A Tide Gauge Verification Device Based On Image Recognition. J. Astronaut. Metrol. Meas. 2021, 41, 20–21. [Google Scholar]
  26. JJG 2007-2015; Time and Frequency Measuring Instruments. State Market Regulatory Administration of China: Beijing, China, 2015.
  27. IEC 60444-1:1986; Measurement of Quartz Crystal Unit Parameters by Zero Phase Technique in a -Network; Part 1: Basic Method for the Measurement of Resonance Frequency and Resonance Resistance of Quartz Crystal Units by Zero Phase Technique in a -Network. International Electrotechnical Committee: Singapore, 1986.
  28. JCGM 100:2008; Evaluation of Measurement Data—Guide to the Expression of Uncertainty in Measurement. JCGM Member Organizations (BIPM, IEC, IFCC, ILAC, ISO, IUPAC, IUPAP and OIML): Sèvres Cedex, France, 2008.
  29. Huang, Y.F.; Gao, C.H.; Wen, Z.P.; Qian, F.; He, L.J. Design and Performance Analysis of Meteorological Temperature Sensor Calibration Device Using Gas Cavities. Atmosphere 2024, 15, 1475. [Google Scholar] [CrossRef]
Figure 1. Schematic diagram of the wave buoy calibration device using a vertical lifting method.
Jmse 13 00605 g001
Figure 2. Schematic diagram of wave height reading.
Jmse 13 00605 g002
Figure 3. Calibration process diagram of time measurement module of the motor upper computer software.
Jmse 13 00605 g003
Table 1. The uncertainty introduced by the measurement repeatability of the standard steel tape.
Serial NumberThe Value of the Standard Steel Tape Measure for the Motor at Its Lowest Point (mm)The Value of the Standard Steel Tape Measure for the Motor at Its Highest Point (mm)Standard Wave Height (mm)Experimental Standard Deviation (mm)Uncertainty u1h (mm)
114.831014.851000.020.00820.0033
214.841014.841000.00
314.841014.851000.01
414.831014.841000.01
514.831014.851000.02
614.841014.841000.00
Table 2. Summary of the wave height’s uncertainty.
Serial NumberWave Height (m)u2h (mm)u3h (mm)u4h (mm)u5h (mm)uch (mm)Uh (mm)
10.030.02890.00000.00040.00260.02900.058
20.10.02890.00010.00130.00280.02910.059
310.02890.00120.01330.00500.03220.065
450.02890.00580.06640.01500.07420.149
5200.02890.02310.26560.05250.27320.547
6400.02890.04620.53120.10250.54371.088
Disclaimer/Publisher’s Note: The statements, opinions and data contained in all publications are solely those of the individual author(s) and contributor(s) and not of MDPI and/or the editor(s). MDPI and/or the editor(s) disclaim responsibility for any injury to people or property resulting from any ideas, methods, instructions or products referred to in the content.

