Review

Towards a Digital Information Platform for Locating and Assessing Environmental Impacts of Submarine Groundwater Discharge: Examples from the Baltic Sea

1
Geological Survey of Denmark and Greenland, GEUS, Oster Voldgade 10, 1350 Copenhagen, Denmark
2
Department of Geosciences, Kiel University, CAU, Otto Hahn Platz 1, 24118 Kiel, Germany
3
Geological Survey of Finland, GTK, Vuorimiehentie 5, FI-02151 Espoo, Finland
4
Institute of Oceanology, IO PAN, Powstańców Warszawy 55, 81-712 Sopot, Poland
5
NOA MARINE, Mierzeja Wiślana 6, 30-732 Kraków, Poland
6
EvoLogics GmbH, Wagner-Régeny-Straße 4, 12489 Berlin, Germany
*
Author to whom correspondence should be addressed.
J. Mar. Sci. Eng. 2025, 13(3), 614; https://doi.org/10.3390/jmse13030614
Submission received: 31 December 2024 / Revised: 3 March 2025 / Accepted: 7 March 2025 / Published: 20 March 2025

Abstract

:
The number of studies on submarine groundwater discharge (SGD) and the evidence of its significance in biogeochemical cycling and potential impacts on the chemical and ecological status of coastal waters is increasing globally. Here, we briefly present SGD studies from the Baltic Sea identified along the coastlines of Denmark, Finland, Germany, Poland, Sweden and Russia in the southwestern, southern and north–northeastern parts of the Baltic Sea. We introduce a digital SGD map viewer and information platform enabling easy overview and access to information on identified SGD sites in the coastal areas of the Baltic Sea. SGDs potentially transport critical pollutants from urban and agricultural areas on land to the marine environment. The pollutants include nutrients, dissolved organic and inorganic carbon, metals, pharmaceuticals, and other emerging contaminants, potentially harming marine ecosystems and biodiversity and possibly contributing to the poor chemical or ecological status of coastal waters, affecting human and environmental health. We focus on case studies from Finland, Germany, Poland and Denmark that include the results and interpretations from the applied geochemical, geophysical and geological methods, as well as bionic autonomous underwater vehicles (AUVs) for locating, investigating, modelling and visualizing SGD sites in 2D and 3D. The potential Pan-European or even global SGD information platform established within the European Geological Data Infrastructure (EGDI) enables the easy combination and comparison of map layers such as seabed sediment types and coastal habitats. The EGDI map viewer provides easy access to information from SGD studies and may serve as an entry point to relevant information on SGDs, including contents of pollutants, for the scientific community and policy-makers. The information potentially includes the results of model simulations, data from near real-time sensors at permanently installed monitoring stations and surveys in time and space conducted by AUVs. The presented digital SGD information platform is particularly pertinent to the UN Sustainable Development Goal (SDG) No. 14, which focuses on the conservation and sustainable use of oceans and marine resources.

Graphical Abstract

1. Introduction

Submarine groundwater discharge (SGD) has been recognized and studied for over fifty years [1,2,3,4]. Despite challenges in identifying and investigating these discharges, new methods introduced in the last two decades have enhanced our understanding of their environmental impacts and global significance [5,6,7,8,9,10,11,12,13,14,15,16,17,18]. The growing body of research underscores the need for the continuous improvement and development of practical tools to locate and assess the environmental impacts of SGDs [6,10,18,19,20,21,22,23,24,25,26,27,28,29], evaluate seasonal variations, the vulnerability of SGDs to hydroclimatic extremes [30], and finally display and integrate biogeoscience and pollution data within the land–sea continuum for the efficient implementation of environmental policies and efficacy assessments [31,32].
Studies reveal that nutrient loading via SGD can be significant locally, particularly in areas with intensive agriculture [8,18,33,34,35,36,37,38] and can contribute to coastal acidification [39]. Total SGD nutrient loads, including fresh and saline sources, may be comparable to or exceed those from large rivers [13,40,41]. Despite improved tools for identifying SGD, data gaps persist in shallow coastal zones, the so-called “white ribbon zone”, where vessel-based data acquisition is challenging. Remote sensing technologies like autonomous underwater vehicles (AUVs), lidar, satellite observations and transient electromagnetic surveys offer promising advancements [42,43,44,45,46,47,48].
Here, we briefly review SGD studies in the Baltic Sea as one of the world’s most polluted and extensively studied marine ecosystems. Global change impacts observed in the Baltic Sea may serve as early warning for many similar coastal oceans or semi-enclosed seas [49]. The Baltic Sea is a semi-enclosed brackish sea surrounded by nine countries. These are Sweden, Finland, Russia, Estonia, Latvia, Lithuania, Poland, Germany and Denmark from north to west. It has limited exchange with the open sea and salinities ranging from nearly ocean water in the northwestern part to nearly fresh water in the easternmost part. The restricted exchange with the open sea makes its ecosystems highly susceptible to physical and chemical changes such as increasing temperatures, nutrient loadings and pollution in general. The Baltic Sea is significantly affected by eutrophication from surrounding countries [50,51,52,53,54]. It hosts the most extensive known dead zone globally [55]. Environmental challenges such as acidification, eutrophication, deoxygenation, and warming make the Baltic Sea a model for conditions other coastal regions may face in the future [49]. Hazardous substances and eutrophication impact the entire region [56].
Ensuring findable, accessible, interoperable and reusable (FAIR) data and data sustainability across technological and human generations is crucial for the sustainable management of resources and the environment [57,58,59]. Similarly, improved access to SGD data is crucial for advancing characterizing, classifying, and assessing integrated coastal zone management and protection [60]. Coastal SGD sites serve as conduits for freshwater discharge to the sea, supporting adapted ecosystems and water supply options [30,61]. They may, however, also be conduits for seawater intrusion into aquifers, reducing freshwater availability in coastal regions depending on hydroclimatic factors [62]. Real-time monitoring at key sites can track and forecast changes in groundwater quantity and quality [62]. In this study, we initiated the development of a digital information platform for SGD integrated into the European Geological Data Infrastructure [59,63,64] as an essential outcome of the BONUS SEAMOUNT project “New surveillance tools for remote sea monitoring and their application on submarine groundwater discharge and seabed surveys” [44].
Based on FAIR and sustainable data principles [57,58], the platform will provide accessible subsurface data for assessing SGD’s impact on coastal water quality under EU legislation [65,66,67]. Such data can guide the establishment of nutrient or contaminant thresholds in groundwater to protect groundwater-associated ecosystems as outlined, e.g., in the EU Groundwater Directive [65] and related guidelines [31,32] and the UN SDG No. 14. Collaboration across disciplines, including hydrogeology, geophysics, and ecology, is essential for enhancing data collection and application with innovative tools like AUVs and real-time monitoring systems [44]. Integrating these data into open knowledge systems will ultimately address broader environmental challenges like climate change and biodiversity loss [49,68,69,70,71,72].
This paper presents examples from Baltic Sea coastal waters, focusing on Eckernförde Bay, Germany [29,36,73]; Hanko Peninsula, Finland [19,20,74,75]; Puck Bay, Poland [21,22,23,24,25,26,27,28]; and Horsens Fjord, Denmark [31,42]. Most study sites are within a few kilometers of the shoreline and in relatively shallow waters. However, SGD has also been found in large offshore pockmarks, up to 50 m in diameter and over 100 m deep, about 20 km from land in the Gulf of Gdańsk [76,77]. Objectives and findings from these studies are summarized in Table S1 in the Supplementary Materials. Further details are accessible via the map viewer of the European Geological Data Infrastructure [78].

2. Materials and Methods

2.1. Type and Location of the Investigated SGD Sites

Figure 1 shows a conceptual model of submarine groundwater discharge (SGD) from a deep confined and a shallow phreatic aquifer typically discharging in relatively deep and shallow coastal waters, respectively. Both types occur in the Baltic Sea, although near-shore shallow SGDs dominate among the published studies (Table S1).
SGDs from confined and unconfined aquifers may occur in all four pilot areas investigated in this study, i.e., Eckernförde, Germany [29,36,73], Hanko Peninsula, Finland [19,20,74,75]. Horsens Fjord, Denmark [31,42] and Puck Bay, Poland [21,22,23,24,25,26,27,28], although the geological settings and, e.g., the seabed substrate vary (Figure 2). The Hanko SGD site is associated with a shallow, unconfined aquifer hosted in the sandy distal part of a significant Late Pleistocene ice-marginal ridge formation. At Mittelgrund in the Eckernförde Bay, SGD is associated with a large, confined aquifer, a significant drinking water reservoir. The SGD at the bottom of Horsens Fjord originates from a confined sand aquifer potentially hydraulically connected to a Quaternary buried valley in the subsurface formed by glaciers during the last ice age. The Puck Bay catchment discharges to the bay through Cretaceous, Paleogene, Neogene and Quaternary aquifers mainly as seepage through Holocene sediments.
Other relevant maps can be turned on and off interactively in the EGDI map viewer [78]. The selected seabed substrate map is developed within the European Marine Observation and Data Network (Section 2.4). The geological map for rock and sediment types on land is harvested by EGDI from national INSPIRE (Infrastructure for Spatial Information in Europe) conformant WFS services for geological units complying with INSPIRE [79].

2.2. Methods for SGD Detection and Monitoring

In most cases, SGD is difficult to observe by the naked eye as it occurs at relatively low discharge rates at the seabed. In recent years, a combination of a wide range of methods including geophysical methods (primarily hydroacoustics and seismics), hydrological modeling, geochemical profiling in water and sediments and seepage meters have shown to be reliable and widely used tools for SGD detection and quantification globally. For instance, the locations of SGD are often associated with the occurrence of pockmarks, shallow depressions in soft surface sediments formed by the emanation of SGD and gas [3]. These pockmarks can be identified using seismic and acoustic systems like multibeam echosounders and side-scan sonar. More direct methods for SGD detection are based on the measurements of geochemical traces like salinity and the natural radionuclides of radon and radium as they can help to distinguish between groundwater and seawater [7,8]. As radon and radium are highly enriched in groundwater and nearly absent in seawater, radon and radium concentration anomalies in seawater indicate SGD. Furthermore, mass balances of these radionuclides can be used to estimate the SGD flux which, when combined with the contents of solutes in SGD, allow for the quantitative assessment of, e.g., environmental impacts of SGD [8].

2.3. Monitoring SGDs in Time and Space

Two bionic AUVs, the “Poggy” AUV by Evologics (Figure 3 [80]) and the “Squid” or Sea Sentinel AUV by NOA Marine [81], were developed with special sensors to facilitate the mobile spatial exploration of SGDs and other seabed and underwater features.
The NOA squid AUV has been developed to carry a significant amount of scientific payload (up to 100 kg) for long-term operation [81]. Besides its quiet work, it provides high thrust power and maneuverability with minimum water disturbance, which is of importance for SGD identification by scientific measurements of, e.g., radon (222Rn) activity measurements in marine waters; the AUVs are also able to make programmed maneuvers as well as lurk in a single place for a desired amount of time and move itself to a new position as requested.
In addition to using maneuverable AUVs to locate and explore SGDs, permanently installed monitoring stations enabling real-time observations and data transfer are increasingly relevant to monitoring and assessing, e.g., climate change impacts on the evolution of physical, chemical, and ecological key parameters (e.g., temperature, nutrients, and salinity) of marine and coastal waters [62,82,83,84]. The EGDI information platform described in the following is developed to allow real-time visualization of online sensor systems deployed in onshore- and offshore monitoring stations [84].

2.4. Developing Open Access Information Platform (EGDI) Including 3D Model Viewer

The European Geological Data Infrastructure, EGDI [85], was established in 2016 by national members of the European Geological Surveys [63]. The primary purpose was to establish a platform to ensure data sustainability [57] and long-term access to data generated in European projects on geology and related topics according to the “FAIR” data principles [58], supporting science and policy addressing societal challenges [59,64,86].
EDGI currently gives access to results from projects covering basic geology (on- and offshore), mineral resources, earth observation and geohazards, geoenergy, geochemistry, groundwater, geophysics, boreholes and geography via a map viewer. EGDI, which receives data on marine geology from the European Marine Observation and Data Network, EMODnet [87], is the backbone of the Information Platform further developed under the ERA-NET on Applied Geosciences “GeoERA” [88] and currently continued within [89]. Furthermore, EGDI delivers services to the European Plate Observing System, EPOS [90].
During the GeoERA project, the EGDI platform was developed further, and new functionalities were added. These include a much-improved user interface for delivering data to the platform, improved web GIS, support for online censor data, and 3D models viewer [91]. Examples of these functionalities are used for locating and visualizing the submarine groundwater discharge sites investigated in this study (Section 3.3).
The EGDI platform now supports standard GIS data such as points, lines, and polygons delivered as Shapefiles and GeoPackages. Gridded data can be delivered as GeoTIFF files and multidimensional scientific and multi-value gridded data may be delivered in NetCDF (Network Common Data Form). Such data include, e.g., the monitoring of water quality parameters like electrical conductivity/salinity, temperature and nitrate concentrations, etc. and other tabular data related to GIS data with multiple tables of parameters related to points in time and space. Documents (reports and papers, diagrams, etc.), CSV (comma-separated) files, and pictures may be stored in the EGDI’s document repository. Three-dimensional models may be uploaded and stored in EGDI’s 3D database, [91]). This includes polygons defining the project areas and sampling points (Figure 2). For further support about data uploads, etc., please visit the EGDI website and map viewer [85].
The location of the SGD sites in the Baltic Sea and links to the research articles and reports were uploaded to EGDI using the GeoPackage file format (gkpg files) produced by the open-source GIS program “QGIS”. A copy of the uploaded gpkg file can be downloaded from the EGDI SGD map viewer [78]. The downloaded gpkg file can also be found in Supplementary Materials (gpkg S1). Before uploading research data to EGDI, a metadata record with information on the data, responsible institutions, funding agencies, etc., has to be completed [92,93]. Further information on providing data, metadata and documents for the EGDI repository can be found on the EGDI website [85].
The EGDI map viewer currently includes the following main maps and data entries: 1. Base layers (e.g., the ESRI world topography map); 2. Basic geology (various lithology maps and 3D models, Figure 2); 3. Marine geology (Figure 2); 4. Mineral resources; 5. Earth observation—geohazards; 6. Geoenergy; 7. Geochemistry; 8. Groundwater; 9. Geophysics; 10. Boreholes; and 11. Geographical topics. Currently, EGDI exhibits nearly 500 data layers provided by more than 25 projects. Topic 8 “Groundwater”, the most relevant for this paper, has the following sub-topics and data entries: 1. Quantity; 2. Quality; 3. Drinking water and health; 4. Transboundary aquifers; 5. Climate change; 6. Competing uses; 7. Ecosystems and biodiversity; and 8. Hydrogeology and geological features. Information on all the SGD sites described in the paper (Table S1) is found within sub-topic number 7 “Ecosystems and biodiversity” as “Submarine Groundwater Discharge”. Future potential developments of the SGD part could include, e.g., the type of SGD (e.g., karstic SGDs, nutrient or novel entities discharging SGDs, direct freshwater SGDs or recirculated mixed SGDs).
The EGDI map viewer showing the SGD sites can easily be extended to all of Europe, for example, to include karstic SGD sites around the Mediterranean Sea. Further development to a global SGD viewer would be nearly as simple, although it would require adding other map projections as the existing one is optimized for a European view. However, some work would be required to compile on- and offshore digital geological maps, groundwater chemistry, and other relevant data to assess environmental impacts and SGD type (e.g., Karstic SGDs) for regions outside Europe.

3. Selected Results and Examples from Investigated SGD Sites

3.1. Eckernförde, Germany

Since the discovery of the pockmarks and associated groundwater discharge and methane seeping in the 80s, Mittelgrund (Eckenförde Bay, Figure 4) has been the focus of many SGD studies investigating the biogeochemical effects of groundwater discharge [3,29,36,73,94,95].
More than 22% of the seafloor in the Eckernförde Bay is affected by SGD [36]. The estimated SGD rates of 0.127 m3 s−1 to 1.81 m3 s−1 correspond to 0.3% to 4.1% of the bay’s water volume being replaced yearly. There is no significant discharge of surface water into the bay. No elevated nutrient concentrations have been detected here, which is most probably due to denitrification in the relatively old aquifer of Miocene age in the catchment to the bay. In contrast to these deep SGD locations, shallow water SGD (~<5 m water depth) occurs frequently along the shoreline of the Eckernförde Bay (here, shallow unconfined aquifers mix with seawater and discharge at a rate of about 2.3 × 10⁻⁶ ms−1 (m3 m−2 s−1). Although these aquifers are enriched in nutrients, no evident influence of SGD on the nitrogen balance of the investigated bay in the western Baltic Sea could be detected [29].
Radon (222Rn) has been used in many studies for more than three decades to identify groundwater discharge to surface water [96], including locating and identifying SGD sites in coastal waters such as the Eckernförde Bay and the three other SGD sites in Poland, Finland, and Denmark described in the following. The concentrations of 222Rn, a decay product of radium (226Ra), are typically 2–4 orders of magnitude higher in groundwater than in seawater. Therefore, radon measurements in coastal waters have demonstrated their value as an essential tool to locate and identify SGD sites in coastal waters. A recent study of the Eckernförde Bay and nearby bays in the German part of the Western Baltic Sea has, however, demonstrated that using 222Rn to locate SGD sites has limitations in shallow wind-exposed coastal settings [95]. Hence, while 222Rn anomalies strongly indicate possible SGDs, the absence of 222Rn anomalies does not rule out SGDs in shallow wind-exposed settings, as “wind speed and wind direction have a non-quantifiable impact on both atmospheric evasion and offshore mixing” [95].

3.2. Hanko Peninsula, Finland

Interest in the Hanko site arose when multiple pockmarks up to 25 m wide and 2 m deep were identified close to each other in multibeam and side-scan sonar images of seafloor. The pockmarks were found at ca. 200 m from the Lappohja beach, on a sandy slope at water depths between 4 and 17 m [19]. Water column profiles of salinity, temperature, dissolved oxygen and turbidity were measured at the locations of the largest pockmarks, but did not show conclusive evidence for groundwater influence. Fresh groundwater discharge with rates up to 1.39 × 10⁻⁷ ms−1 from two of three pockmarks studied was confirmed by in situ 222Rn activity concentration measurements of the pockmark near-bottom water [19]. Short sediment cores collected from pockmarks showed that the two pockmarks with active groundwater discharge had fine sand floors, whereas the inactive pockmark floor was covered by a ca. 7 cm layer of soft organic-rich mud. Transient state groundwater flow modeling later simulated groundwater flow paths to the pockmark area and produced comparable discharge rate estimates of up to 1.6 cm d−1 for fine sand [20]. Studies by [74,75] documented SGD impacts on Sr, S and Li isotopes, biogeochemical processes and microbial communities (Table S1).
The influence of SGD on the sea surface water at the Hanko site was investigated in May 2018 by a 222Rn survey from a motorboat. Seawater 222Rn activity concentration was measured using two identical flow-through systems with Durridge RAD7 radon detectors and pumps fixed at 50 cm water depth on the side of the motorboat [19] (the measured mean 222Rn concentration in surface water was 16.9 Bq/m3, with locally slightly elevated concentrations up to 49.9 Bq/m3 near the shoreline (Figure 5). These elevated concentrations may result from localized groundwater seepage through the beach sand and/or from the local upwelling of radon-bearing bottom water. At the time of measurements, the water mass was separated to the surface and bottom water layers by a thermocline at the depth of 5–8 m. Notably, the sites of active SGD, pockmarks B and D with near-bottom 222Rn concentrations of 156.9 and 134.7 Bq/m3, respectively, do not show consistently elevated radon concentrations in the surface water, whereas the surface water radon concentration is high close to the inactive pockmark E. Groundwater discharged from the seafloor is advected laterally and mixed before reaching the sea surface. The bottom water flow was directed west at the time of measurements. Radon data are available on the EGDI platform.

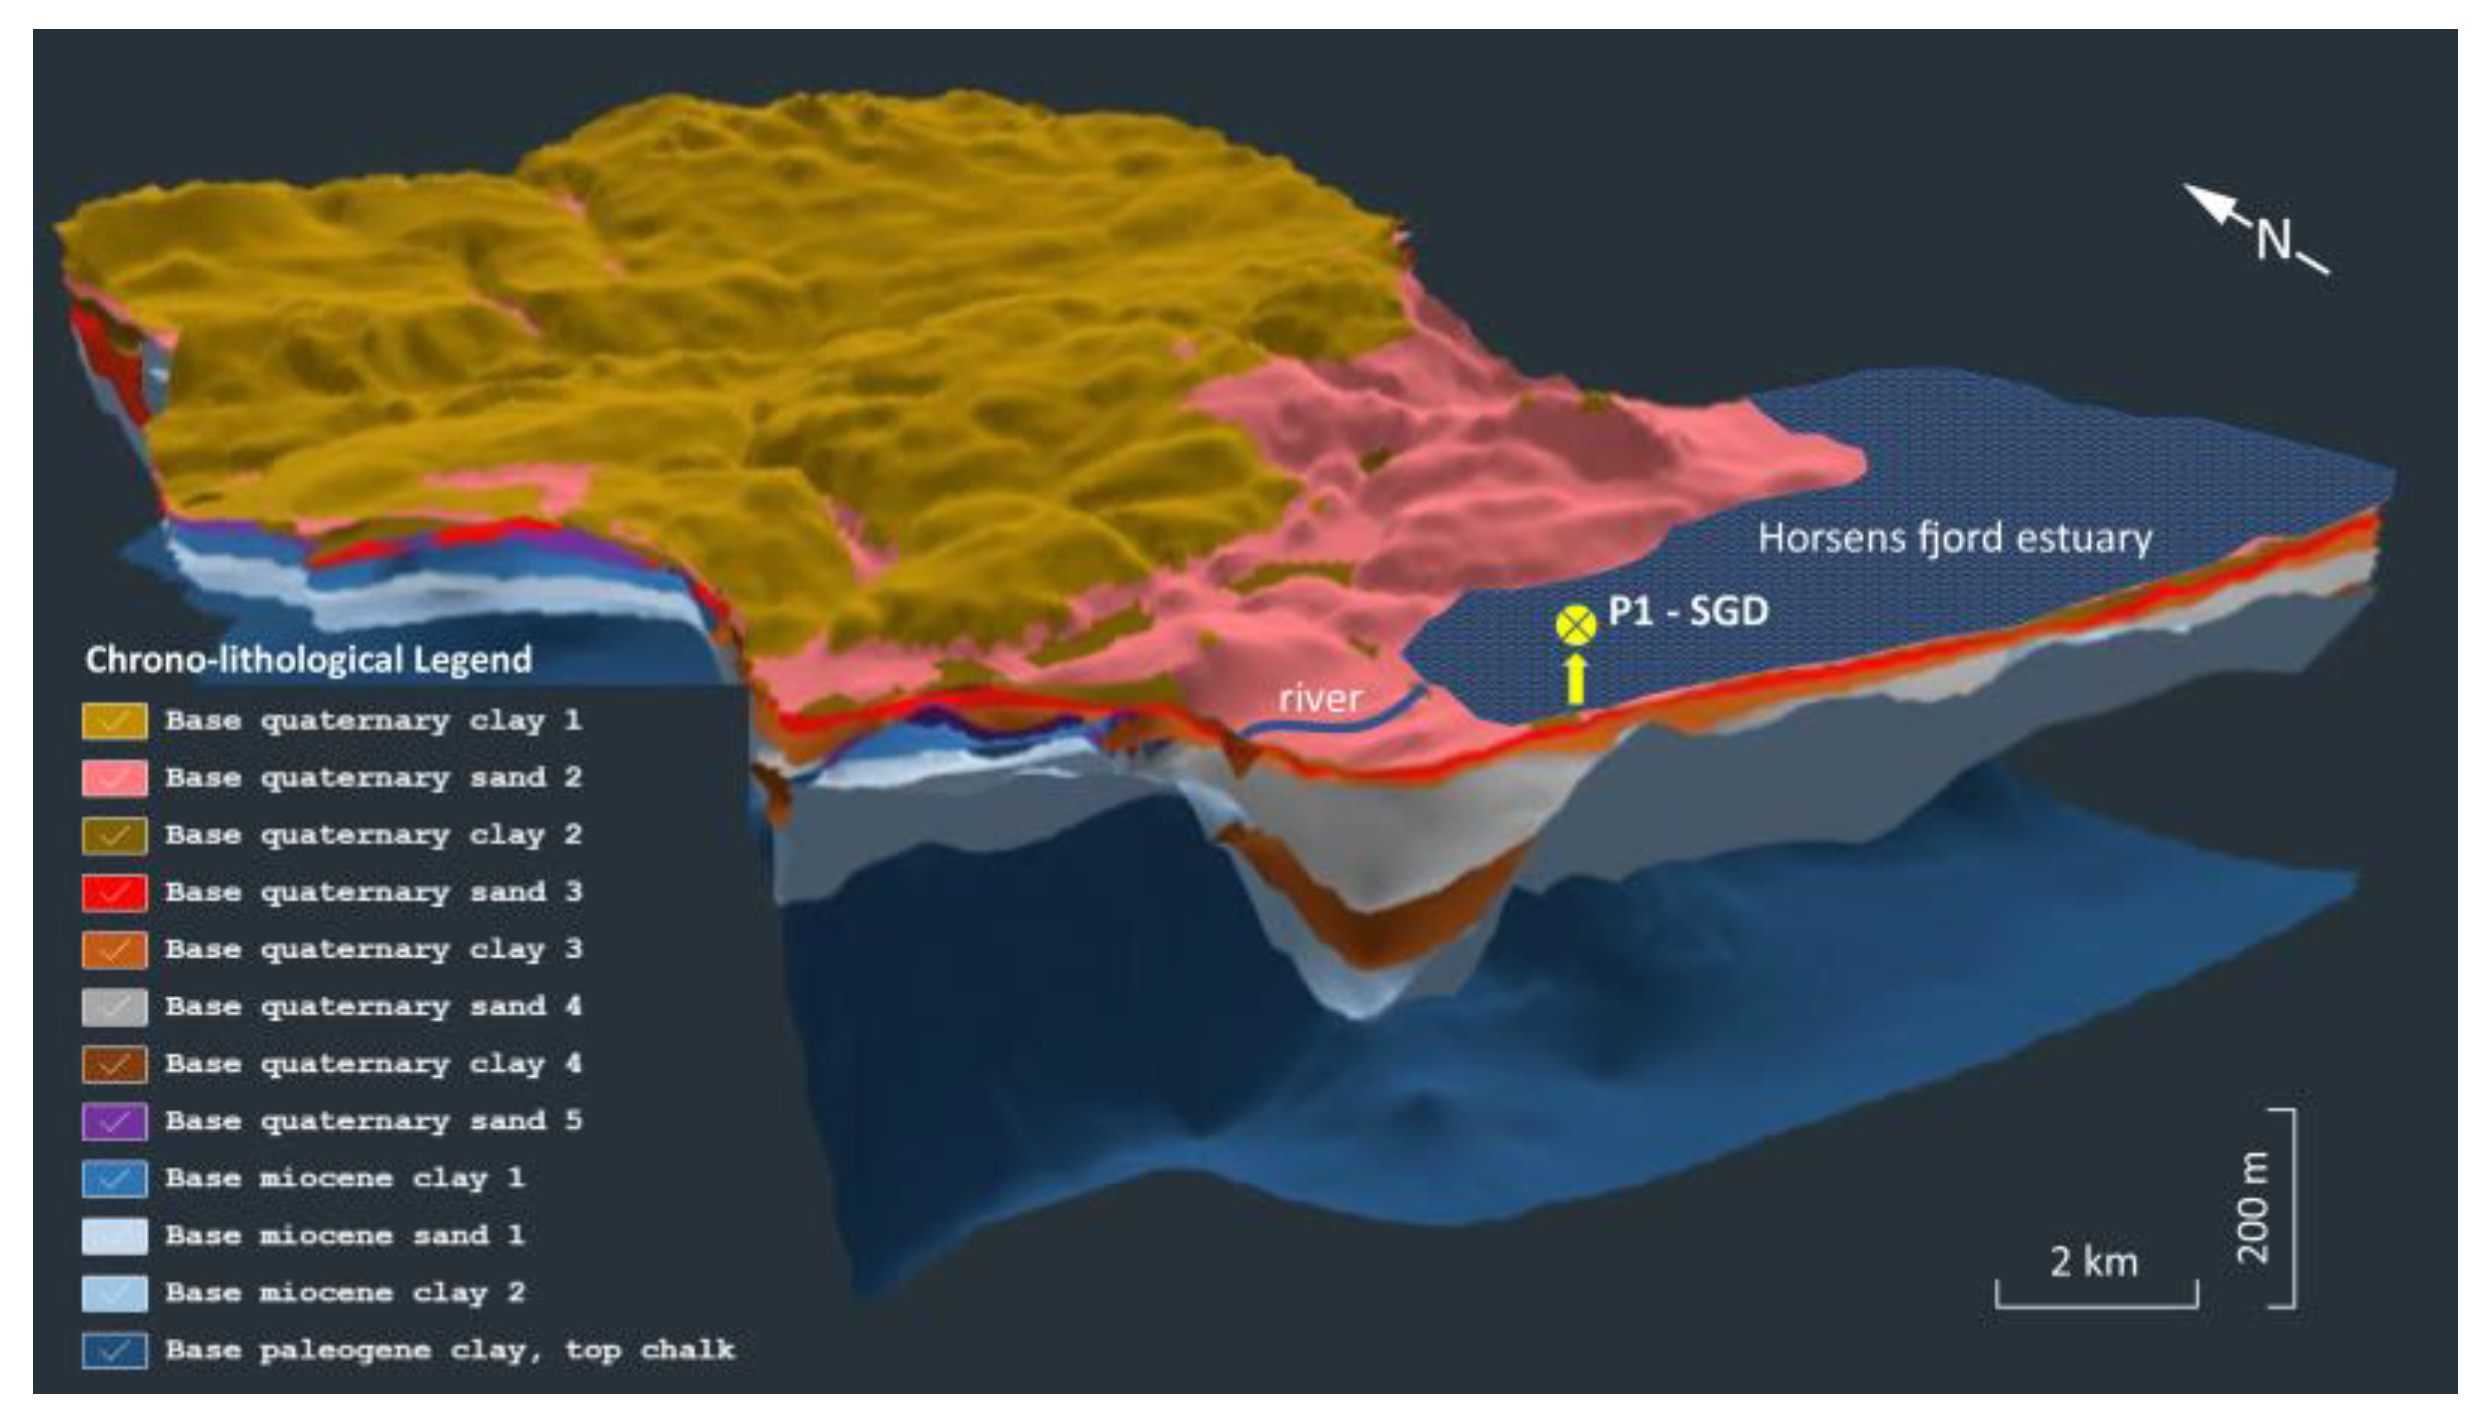
3.3. Horsens Fjord, Denmark

A previous study modeling the nutrient loadings from the catchments of Horsens fjord to the estuary indicated possible submarine groundwater discharge directly to the bottom of the fjord of about 13% of the total net precipitation to the catchment of Horsens Fjord [31]. From the previous estimations of the total freshwater discharge to the Fjord [97], this would result in a potential total SGD of approximately 0.4 m3 s−1 to Horsens Fjord, the same order of magnitude as the annual SGD to the Eckernförde bay described above, which is located about 150 km to the south of Horsens Fjord. To identify potential SGD sites in the Horsens fjord estuary, the following investigations were carried out: (1) geophysical surveys (parametric sub-bottom profiler, sidescan sonar and multibeam echosounder) for pockmark locations; (2) 222Rn surveys in the estuary and in groundwater collected from different well types both North and South of the fjord to indicate the possible recharge of fresh or reduced salinity waters at these; (3) Geochemical and macrofossil analyses on marine sediment cores collected from located pockmarks to identify freshwaters in the sediment and the history of the evolution of the sediments in the estuary; and (4) Geological and hydrogeological modeling based on onshore—and offshore borehole information and geophysics to delineate freshwater/saltwater boundaries and possible sites for the submarine groundwater discharge of dissolved pollutants [42,98].
The geophysical surveys conducted by GEUS on research cruises in the estuary from the GEUS research vessel “Maritina” in 2018 and 2019 identified three significant pockmarks at the bottom of the fjord, potentially developed by submarine groundwater discharge. 222Rn surveys conducted in collaboration between the University of Kiel and GEUS around the three pockmarks confirmed slightly elevated 222Rn activities at two of these sites. Water extracted at different levels of the 1–1.5 m long marine sediment cores from the bottom at one of these clearly showed the influence of discharging freshwater based on the results from primarily chloride and stable isotope (δ18O, δ2H) analyses [42,98].
The results from the marine geophysical measurements conducted in the BONUS SEAMOUNT project by GEUS (as described above and in [42,43]), were compiled in a 3D geological modeling software GeoScene3D [99] together with existing geological and geophysical data from the databases at GEUS [42]. Together with the marine sediment cores from the pockmarks and the radon surveys, the geological model demonstrates that submarine groundwater discharges at P1 (Figure 6).
The groundwater flows through late Pleistocene meltwater sands towards the Horsens Fjord. The 3D model indicates that the estuary is a groundwater-associated aquatic ecosystem receiving groundwater and potential pollution via rivers and submarine groundwater discharge directly at the bottom of the fjord. The model can be viewed on the 3D model viewer on EGDI [91] where it can also be turned and explored in space. The illustrated model was built into the existing integrated groundwater–surface water model of the Horsens fjord catchment used to estimate the nutrient loadings to the fjord/estuary [31,42]. Simulations with the updated model identified new areas where SGDs probably occur [42]. GEUS tested the permanent monitoring stations for cost-efficient near real-time monitoring of water quality parameters [100] at two out of three new potential SGD sites. However, the results were inconclusive and further real-time monitoring to document and illustrate the impacts of fresh SGDs is needed.

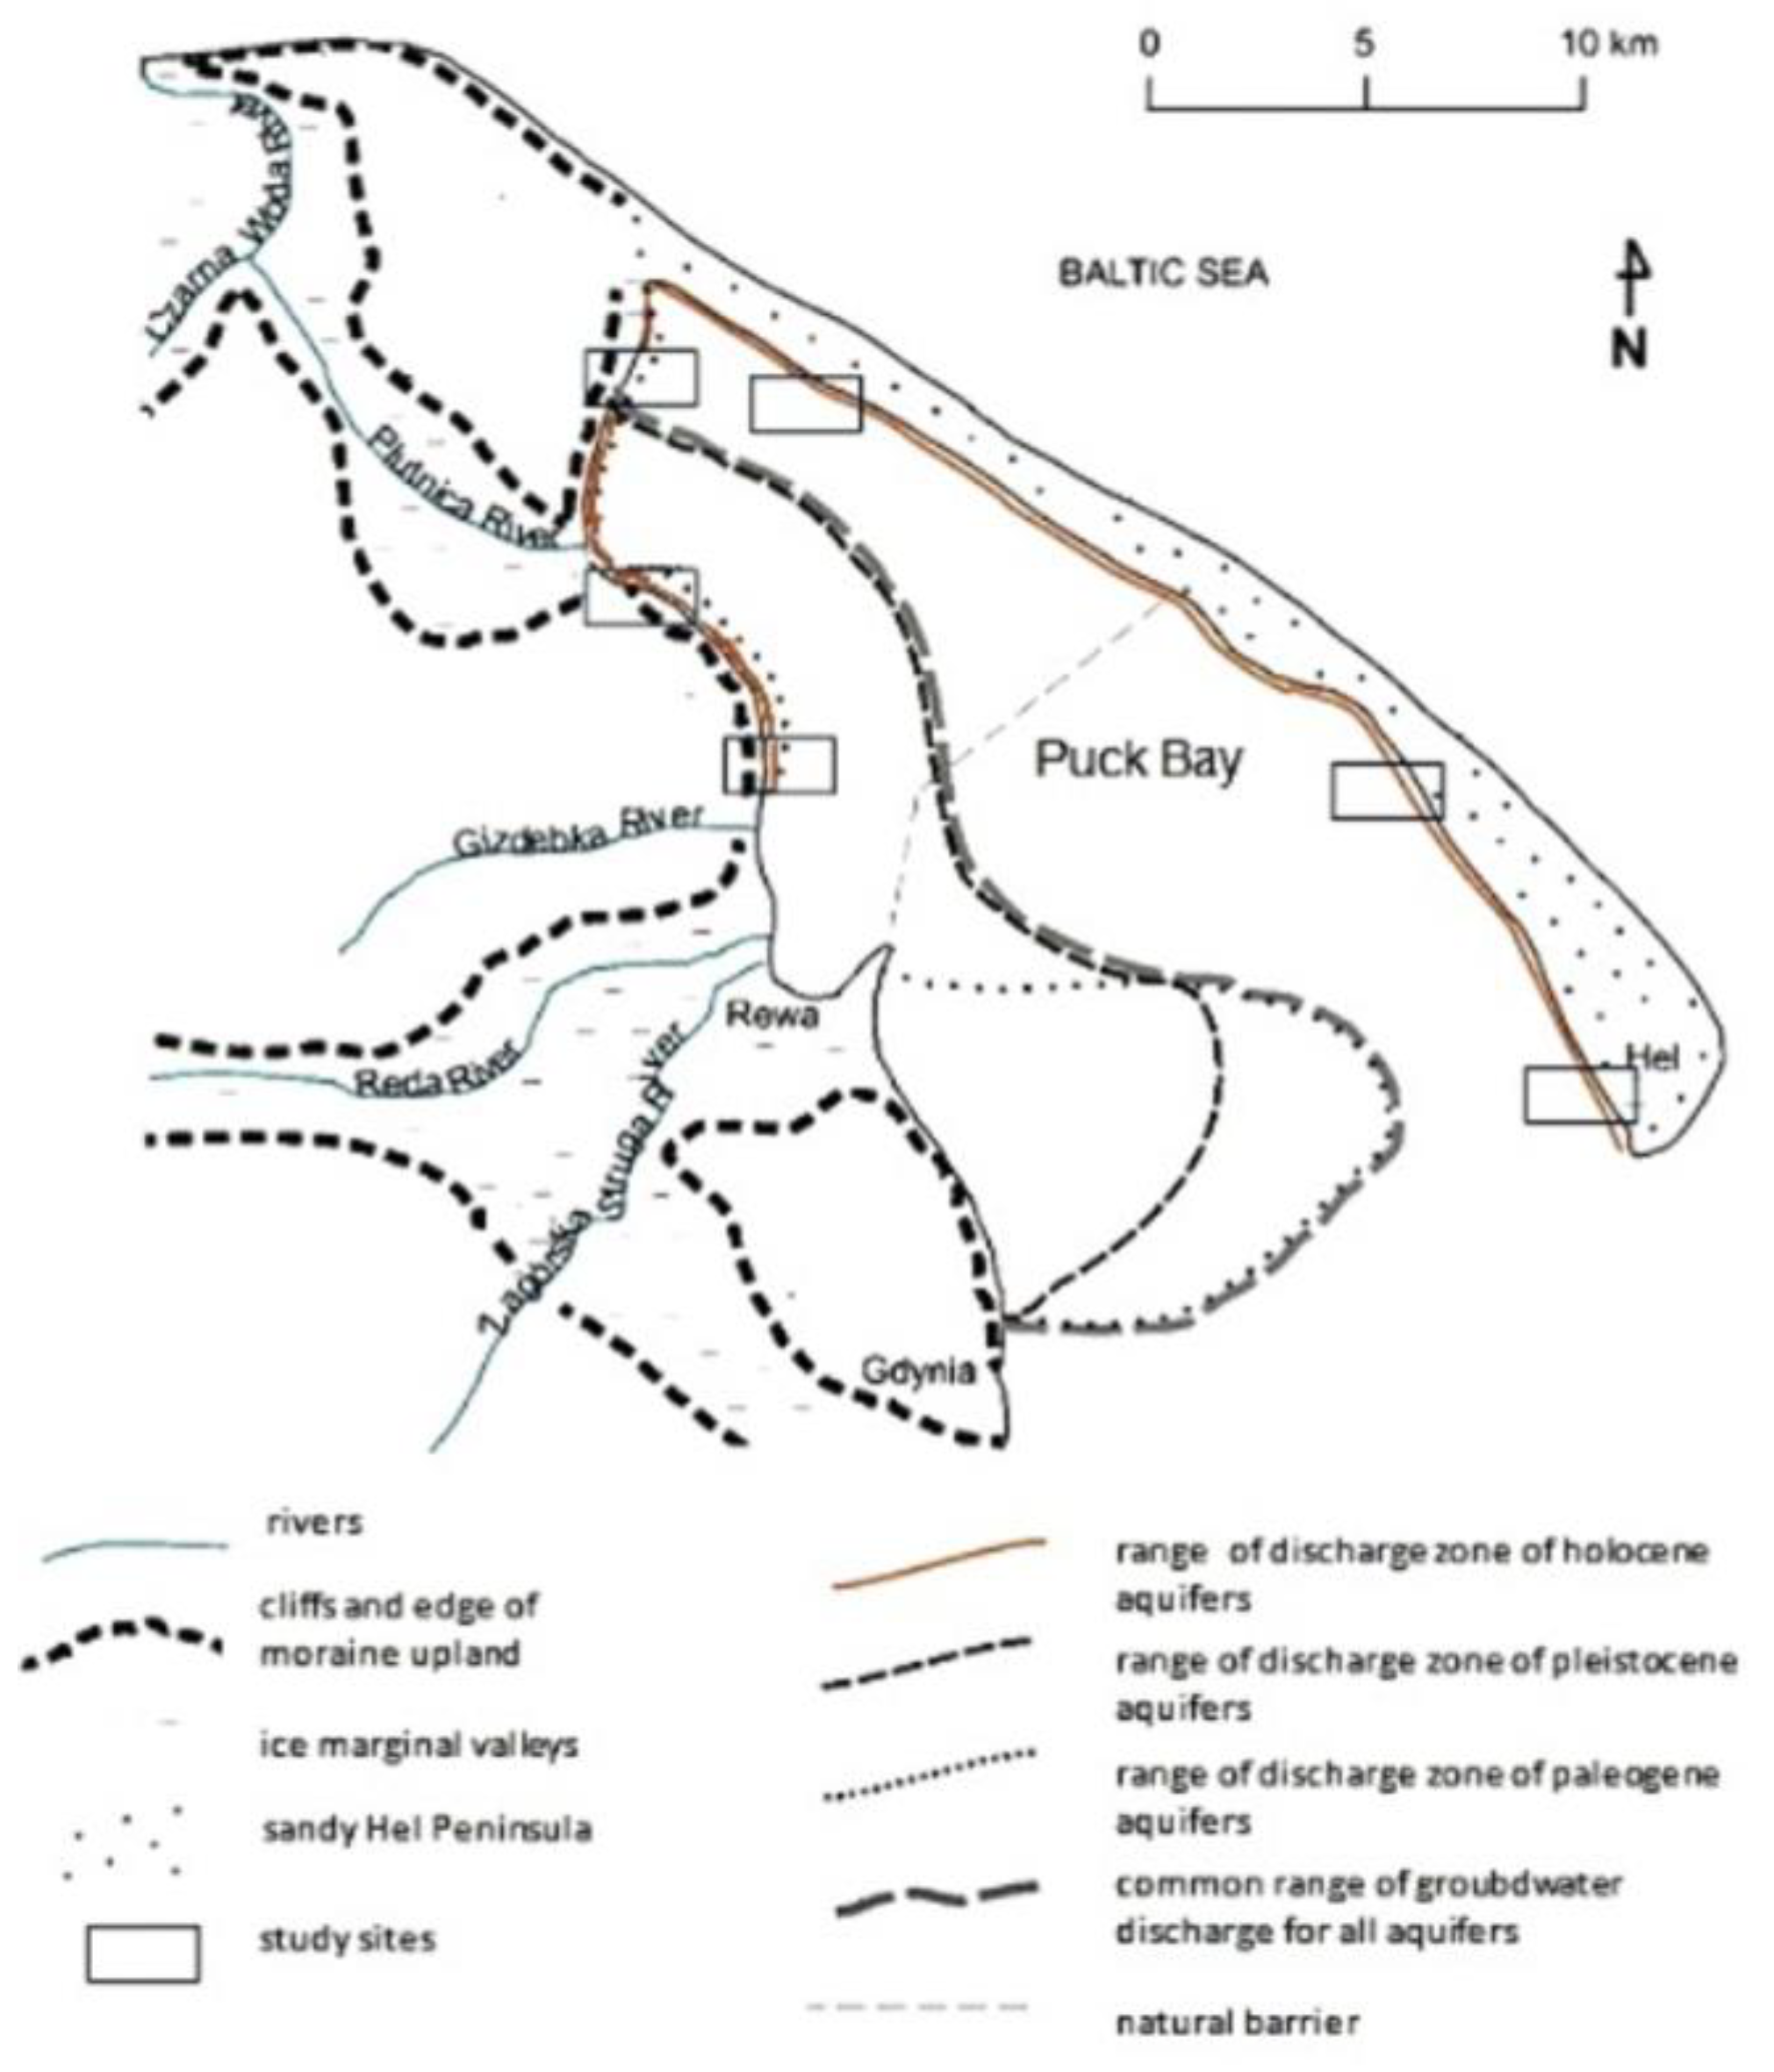
3.4. Puck Bay, Poland

More than half of Puck Bay is under fresh groundwater seepage influence (200 km2), which extends up to 1–5 km seaward in the inner bay and up to 12 km in the upper bay, and the total submarine groundwater discharge equals 2.2 m3 s−1 [21,22,23,24,25,26,27,28,101,102]. Recently, SGD sites (Figure 7) were identified based on the marine sediment cores and pore water composition. Chloride concentrations (Cl-) were described by a vertical, one-dimensional, advection–diffusion model [36] and SGD ranges from 16.0 m3 s−1 to 127.7 m3 s−1 in the entire bay, which is about 50 times more than the results obtained in previous studies [26].
SGD samples (identified by means of pore water salinity [26]) were collected from the coastal area of the Puck Bay (<5 m water depth). Most of the measured parameters such as dissolved inorganic and organic carbon (DIC and DOC, respectively), nutrients, trace metals, and pharmaceutical residues (Figure 8) varied seasonally, while PO43− concentrations varied significantly among the study sites and seasons [21,23,24,25,28].
The SGD was recognized as a source of identified pharmaceutical residues (four out of 16 pharmaceutical compounds and their selected metabolites) and caffeine [25]. In addition, SGD turned out to be a significant source of nutrients, metals, and dissolved carbon (Figure 8, Table S2) that affects the sustainability of the coastal environment [21,22,28]. Dissolved trace metal concentrations (Figure 8) were generally one or two orders of magnitude higher in groundwater than in seawater. However, the redox conditions primarily control the trace metal distribution at the SGD sites [23].

4. Discussion and Perspectives

The case studies described above indicate potential significant impacts of submarine groundwater discharge on the chemical and ecological status of coastal waters, at least locally, and that the SGD loadings of nutrients, pharmaceuticals and other contaminants may be higher than loadings by other sources [24,25]. A recent study shows that SGD does not constitute a significant contaminant source for the world’s oceans in general, but that the relative SGD input varies significantly in coastal waters and locally contributes to the contamination of, e.g., estuaries, salt marshes and coral reefs and increases the risk of pollution, eutrophication and loss of biodiversity in these important ecosystems [35].
Hence, there is a strong need for information systems that provide easy access to maps of and information about groundwater chemistry on- and offshore in coastal areas, including the chemical composition and contents of pollutants and environmental tracers in SGDs. Such information can, e.g., in combination with maps of the ecological status of coastal waters and the geological characteristics of the land–sea continuum, be an important tool for the sustainable management and planning of appropriate mitigation measures, e.g., for reducing the loadings of nutrients and pharmaceuticals, including human and veterinary antibiotics to transitional and coastal waters. This information is required for the derivation of groundwater threshold values or maximum acceptable concentrations or loadings of SGDs for the protection of the biodiversity in groundwater-associated aquatic ecosystems in the coastal waters of the Baltic Sea, as requested by the European Water Framework Directive [31,32,66,103] and coastal waters, globally.
Digital information systems can ensure easy and FAIR access [58] to knowledge and data compiled by EU research programs such as the BONUS Program on the Baltic Sea [104], the BANOS—Baltic and North Sea Coordination and Support Action [105] and the Geological Service for Europe—GSEU—Coordination and Support Action [89]. Such digital information systems improve access to data and knowledge for meeting the UN Sustainable Development Goals [59].
The geoscientific information available in the coastal zone, particularly in the “white ribbon” area, is generally limited. There is a significant need for better tools to investigate this region globally. For example, autonomous underwater vehicles (AUVs) could be utilized to monitor the biogeochemical, geophysical, geological and ecological features of shallow coastal waters [45,46,47,48,80,81,82]. Additionally, advanced airborne and marine transient electromagnetic methods [42,43] show promising potential for exploring the subsurface in the shallow marine and brackish waters along coastlines globally [106,107].
It is hoped that the digital SGD information platform [76] developed in [44] in collaboration with the ERA-NET on Applied Geoscience, GeoERA [88] will serve as a future platform for all of Europe. The EuroGeoSurveys will continue collaborating with relevant partners to develop the SGD map viewer and related geoscience data, e.g., within the new project “SentinelSpringS” of the Water4All partnership [108]. Improving availability and access to data from shallow coastal areas (the “white ribbon”) and the land–sea continuum in general is essential for the sustainable management of European coastal waters to ensure that societal challenges and environmental goals such as UN SGD No. 14 are met in a changing climate [59,86].
It is recommended that transdisciplinary research projects and programs are established for the studies on SGD impacts on the chemical and ecological status of transitional and coastal waters and efficient mitigation and remediation measures that consider future climate change challenges such as changes in groundwater recharge, sea level rise and changing land use, globally. Transdisciplinary research programs should address the impacts of sea level rise, the resulting risk for sea water intrusion to coastal aquifers and ecosystems, and the flooding of agricultural and urban areas in coastal areas [107,109,110]. Furthermore, it should support the development of new effective and energy efficient monitoring techniques using AUVs and near-real-time monitoring sensors and measurement techniques either for the AUVs monitoring in time and space, or for permanent monitoring stations at SGD sites, e.g., for tracer measurements to improve the available biogeoscience data in the “the white ribbon”.
All compiled data and documents should be sustained [57] and freely accessible through digital information platforms like the European Geological Data Infrastructure. This access should follow the FAIR data management principles [58]. Additionally, maps showing the SGD locations and protected resources and ecosystems should be provided to facilitate the efficient management and protection of coastal areas.

5. Conclusions

Ten areas with known occurrences of SGD in the Baltic Sea were introduced, and four of these were described in further detail, focusing on potential pollution from various pollutants originating from urban and agricultural sources. Coastal ecosystems may be negatively affected by the SGD contaminant discharges and occasionally experience the eutrophication and loss of biodiversity due to excessive loadings of nutrients and other pollutants.
The SGD studies conducted in Denmark, Finland and Germany focused on locating and linking the geological and hydrological settings with the SGD sites and their possible environmental impacts, while the Polish case study focused on the SGD discharge of nutrients, metals, DIC and pharmaceuticals, and how they may affect ecosystems in the Bay of Puck.
Especially the results from the studies in Puck Bay demonstrate potential environmental impacts and the need for further investigation of the constituents in SGDs including contaminants such as nutrients, heavy metals, pesticides, pharmaceuticals and other emerging contaminants, as well as geogenic elements potentially affecting ecosystems and food webs in coastal waters globally. The studies from the Bay of Puck SGD sites indicate that caffeine may act as an environmental tracer and an indicator of human impact and, e.g., potential contamination with pharmaceuticals. The application of other tracers for the estimation of groundwater travel times and potential contamination such as tritium–helium (3H/3He) and the PFAS trifluoroacetate (TFA) [15,111] should be considered to improve the understanding of the history and fate of the contaminants discharging to the coastal waters. Generally, transdisciplinary studies are warranted to assess the environmental impacts of SDGs to coastal ecosystems globally. The brief review of the SGD sites in the Baltic Sea and the introduction of a new European SGD information platform and map viewer, which provides easy access to SGD data and knowledge, offers a novel approach to compiling geoscience data relevant for assessing the environmental impacts of SGD in coastal waters. The review of SGD studies and map viewer hold significant potential for applied SGD research and policy implementation to protect coastal ecosystems. The work presented is particularly pertinent to the UN Sustainable Development Goal (SDG) No. 14, which focuses on the conservation and sustainable use of oceans and marine resources and is also related and relevant to UN SDGs No. 3, 6, 11, 12, 15 and 17.

Supplementary Materials

The following supporting information can be downloaded or accessed at https://www.mdpi.com/article/10.3390/jmse13030614/s1: Table S1: The main objectives, methods, contaminants and environmental issues applied and investigated at the SGD sites in the Baltic Sea as identified and mapped in this review. The first four examples from Denmark, Finland, Germany and Poland shown in italics are described in more detail in the text. Figure S1: Lithological legend of onshore geology shown in Figure 2. GIS file S1: Example of the gkpg file with SGD information provided for the SGD map viewer. Table S2: Concentrations of nutrients, dissolved organic (DOC) and inorganic (DIC) carbon, pharmaceuticals and trace metals in fresh SGD in the Puck Bay. Video S1: Underwater robots looking for submarine groundwater—Underground Channel. Video S2: Noa Marine Robotics—SEA SENTINEL AUV capability demo—November 2020 Milestone.

Author Contributions

Conceptualization: K.H., J.S., J.V. and B.S. Methodology: K.H., J.S., J.V., B.S., J.O.L. and L.T.A. Software: L.T.A., M.O. and J.T. Validation: K.H., J.S., J.V. and B.S. Formal analysis: K.H., J.S., J.V., B.S., J.O.L. and L.T.A. Investigation: K.H., J.S., J.V., B.S., J.O.L. and L.T.A. Resources: K.H., J.S., J.V., B.S., J.O.L., L.T.A., R.B. and M.L. Data Curation: M.O., J.T., J.V. and B.S. Writing: K.H., J.S., J.V., B.S., J.O.L. and L.T.A. Visualization: M.O., J.T., L.T.A. and J.V. Project administration: R.B. and K.H. Funding acquisition: K.H., M.L. and R.B. All authors have read and agreed to the published version of the manuscript.

Funding

This work resulted from the BONUS SEAMOUNT project supported by BONUS (Art 185), funded jointly by the EU, Innovation Fund Denmark (grant number 6180-00018B), the Federal Ministry of Education and Research, Germany (grant number 03F0771A and 03F0771B), the Academy of Finland (grant number 311983) and the National Centre for Research and Development, Poland (grant number BONUS-BB/SEAMOUNT/08/2017). Additional support was received from EGDI developments in the GeoERA program/ERA-NET on a Geological Service for Europe (grant number: 731166 co-funded by Innovation Fund Denmark specifically for near real-time monitoring (grant number 8055-00073B).

Data Availability Statement

No new data were created or analyzed in this study. Data sharing is not applicable to this article.

Acknowledgments

We thank Vladimir Vanek for the additional information about the Laholm Bay SGD site presented in Table S1.

Conflicts of Interest

Author Rudolf Bannasch is employed by the company EvoLogics GmbH and Michal Latacz was employed by NOA MARINE. The remaining authors declare that the research was conducted in the absence of any commercial or financial relationships that could be construed as a potential conflict of interest.

References

  1. Zektzer, I.S.; Ivanov, V.A.; Meskheteli, A.V. The Problem of Direct Groundwater Discharge to the Seas. J. Hydrol. 1973, 20, 1–36. [Google Scholar] [CrossRef]
  2. Johannes, R.E. The Ecological Significance of the Submarine Discharge of Groundwater. Mar. Ecol. Prog. Ser. 1980, 3, 365–373. [Google Scholar] [CrossRef]
  3. Whiticar, M.J.; Werner, F. Pockmarks: Submarine Vents of Natural Gas or Freshwater Seeps? Geo-Mar. Lett. 1981, 1, 193–199. [Google Scholar] [CrossRef]
  4. Church, T.M. An Underground Route for the Water Cycle. Nature 1996, 380, 579–580. [Google Scholar] [CrossRef]
  5. Taniguchi, M.; Burnett, W.C.; Cable, J.E.; Turner, J.V. Investigation of Submarine Groundwater Discharge. Hydrol. Process. 2002, 16, 2115–2129. [Google Scholar] [CrossRef]
  6. Taniguchi, M.; Dulai, H.; Burnett, K.M.; Santos, I.R.; Sugimoto, R.; Stieglitz, T.; Kim, G.; Moosdorf, N.; Burnett, W.C. Submarine Groundwater Discharge: Updates on Its Measurement Techniques, Geophysical Drivers, Magnitudes, and Effects. Front. Environ. Sci. 2019, 7, 141. [Google Scholar] [CrossRef]
  7. Moore, W.S. Sources and Fluxes of Submarine Groundwater Discharge Delineated by Radium Isotopes. Biogeochemistry 2003, 66, 75–93. [Google Scholar] [CrossRef]
  8. Burnett, W.C.; Aggarwal, P.K.; Aureli, A.; Bokuniewicz, H.; Cable, J.E.; Charette, M.A.; Kontar, E.; Krupa, S.; Kulkarni, K.M.; Loveless, A.; et al. Quantifying Submarine Groundwater Discharge in the Coastal Zone via Multiple Methods. Sci. Total Environ. 2006, 367, 498–543. [Google Scholar] [CrossRef]
  9. Burnett, W.C.; Bokuniewicz, H.; Moore, W.S.; Taniguchi, M. Groundwater and pore water inputs to the coastal zone. Biogeochemistry 2003, 66, 3–33. [Google Scholar] [CrossRef]
  10. Dulai, H.; Santos, I.R.; Taniguchi, M.; Sugimoto, R.; Shoji, J.; Mukherjee, A. Editorial: Submarine Groundwater Discharge: Impacts on Coastal Ecosystem by Hidden Water and Dissolved Materials. Front. Environ. Sci. 2021, 8, 629509. [Google Scholar] [CrossRef]
  11. Londoño-Londoño, J.E.; de Melo, M.T.C.; Nascimento, J.N.; Silva, A.C.F. Thermal-Based Remote Sensing Solution for Identifying Coastal Zones with Potential Groundwater Discharge. J. Mar. Sci. Eng. 2022, 10, 414. [Google Scholar] [CrossRef]
  12. McKenzie, T.; Moody, A.; Barreira, J.; Guo, X.; Cohen, A.; Wilson, S.J.; Ramasamy, M. Metals in Coastal Groundwater Systems under Anthropogenic Pressure: A Synthesis of Behavior, Drivers, and Emerging Threats. Limnol. Oceanogr. Lett. 2024, 9, 388–410. [Google Scholar] [CrossRef]
  13. Wilson, S.J.; Moody, A.; McKenzie, T.; Cardenas, M.B.; Luijendijk, E.; Sawyer, A.H.; Wilson, A.; Michael, H.A.; Xu, B.; Knee, K.L.; et al. Global Subterranean Estuaries Modify Groundwater Nutrient Loading to the Ocean. Limnol. Oceanogr. Lett. 2024, 9, 411–422. [Google Scholar] [CrossRef]
  14. Arévalo-Martínez, D.L.; Haroon, A.; Bange, H.W.; Erkul, E.; Jegen, M.; Moosdorf, N.; Schneider Von Deimling, J.; Berndt, C.; Böttcher, M.E.; Hoffmann, J.; et al. Ideas and Perspectives: Land-Ocean Connectivity through Groundwater. Biogeosciences 2023, 20, 647–662. [Google Scholar] [CrossRef]
  15. Jenner, A.K.; Saban, R.; Ehlert von Ahn, C.M.; Roeser, P.; Schmiedinger, I.; Sültenfuβ, J.; Reckhardt, A.; Böttcher, M.E. Different Continuous Freshwater Contributions to Submarine Groundwater Discharge at a Coastal Peatland, Southern Baltic Sea. Isotopes Environ. Health Stud. 2024. [Google Scholar] [CrossRef]
  16. von Ahn, C.M.E.; Dellwig, O.; Szymczycha, B.; Kotwicki, L.; Rooze, J.; Endler, R.; Escher, P.; Schmiedinger, I.; Sültenfuß, J.; Diak, M.; et al. Submarine Groundwater Discharge into a Semi-Enclosed Coastal Bay of the Southern Baltic Sea: A Multi-Method Approach. Oceanologia 2024, 66, 111–138. [Google Scholar] [CrossRef]
  17. von Ahn, C.M.E.; Scholten, J.C.; Malik, C.; Feldens, P.; Liu, B.; Dellwig, O.; Jenner, A.K.; Papenmeier, S.; Schmiedinger, I.; Zeller, M.A.; et al. A Multi-Tracer Study of Fresh Water Sources for a Temperate Urbanized Coastal Bay (Southern Baltic Sea). Front. Environ. Sci. 2021, 9, 642346. [Google Scholar] [CrossRef]
  18. Zhang, X.; Li, H.; Wang, X.; Kuang, X.; Zhang, Y.; Xiao, K.; Xu, C. A Comprehensive Analysis of Submarine Groundwater Discharge and Nutrient Fluxes in the Bohai Sea, China. Water Res. 2024, 253, 121320. [Google Scholar] [CrossRef]
  19. Virtasalo, J.J.; Schröder, J.F.; Luoma, S.; Majaniemi, J.; Mursu, J.; Scholten, J. Submarine Groundwater Discharge Site in the First Salpausselkä Ice-Marginal Formation, South Finland. Solid Earth 2019, 10, 405–423. [Google Scholar] [CrossRef]
  20. Luoma, S.; Majaniemi, J.; Pullinen, A.; Mursu, J.; Virtasalo, J.J. Geological and Groundwater Flow Model of a Submarine Groundwater Discharge Site at Hanko (Finland), Northern Baltic Sea. Hydrogeol. J. 2021, 29, 1279–1297. [Google Scholar] [CrossRef]
  21. Szymczycha, B.; Miotk, M.; Pempkowiak, J. Submarine Groundwater Discharge as a Source of Mercury in the Bay of Puck, the Southern Baltic Sea. Water Air Soil Pollut. 2013, 224, 1542. [Google Scholar] [CrossRef] [PubMed]
  22. Szymczycha, B.; Vogler, S.; Pempkowiak, J. Nutrient Fluxes via Submarine Groundwater Discharge to the Bay of Puck, Southern Baltic Sea. Sci. Total Environ. 2012, 438, 86–93. [Google Scholar] [CrossRef] [PubMed]
  23. Szymczycha, B.; Kroeger, K.D.; Pempkowiak, J. Significance of Groundwater Discharge along the Coast of Poland as a Source of Dissolved Metals to the Southern Baltic Sea. Mar. Pollut. Bull. 2016, 109, 151–162. [Google Scholar] [CrossRef]
  24. Szymczycha, B.; Kłostowska, Z.; Lengier, M.; Dzierzbicka-głowacka, L. Significance of Nutrient Fluxes via Submarine Groundwater Discharge in the Bay of Puck, Southern Baltic Sea. Oceanologia 2020, 62, 117–125. [Google Scholar] [CrossRef]
  25. Szymczycha, B.; Borecka, M.; Bia, A.; Siedlewicz, G.; Pazdro, K. Science of the Total Environment Submarine Groundwater Discharge as a Source of Pharmaceutical and Caffeine Residues in Coastal Ecosystem: Bay of Puck, Southern Baltic Sea Case Study. Sci. Total Environ. 2020, 713, 136522. [Google Scholar] [CrossRef]
  26. Kłostowska, Ż.; Szymczycha, B.; Lengier, M.; Zarzeczańska, D.; Dzierzbicka-Głowacka, L. Hydrogeochemistry and Magnitude of SGD in the Bay of Puck, Southern Baltic Sea. Oceanologia 2020, 62, 1–11. [Google Scholar] [CrossRef]
  27. Matciak, M.; Misiewicz, M.M.; Szymczycha, B.; Idczak, J.; Tęgowski, J.; Diak, M. Pockmarks and Associated Fresh Submarine Groundwater Discharge in the Seafloor of Puck Bay, Southern Baltic Sea. Sci. Total Environ. 2024, 942, 173617. [Google Scholar] [CrossRef]
  28. Szymczycha, B.; Böttcher, M.E.; Diak, M.; Koziorowska-Makuch, K.; Kuliński, K.; Makuch, P.; von Ahn, C.M.E.; Winogradow, A. The Benthic-Pelagic Coupling Affects the Surface Water Carbonate System above Groundwater-Charged Coastal Sediments. Front. Mar. Sci. 2023, 10, 1218245. [Google Scholar] [CrossRef]
  29. Kreuzburg, M.; Scholten, J.; Hsu, F.-H.; Liebetrau, V.; Sültenfuß, J.; Rapaglia, J.; Schlüter, M. Submarine Groundwater Discharge-Derived Nutrient Fluxes in Eckernförde Bay (Western Baltic Sea). Estuaries Coasts 2023, 46, 1190–1207. [Google Scholar] [CrossRef]
  30. Dang, M.Q.; Hsu, F.H.; Su, C.C.; Wang, S.J.; Fu, C.C.; Lin, I.T. Investigation of Seasonal Variations in Submarine Groundwater Discharge Using Radium Isotopes under Drought Conditions in Northwestern Coastal Taiwan. J. Hydrol. 2025, 649, 132450. [Google Scholar] [CrossRef]
  31. Hinsby, K.; Markager, S.; Kronvang, B.; Windolf, J.; Sonnenborg, T.O.; Thorling, L. Threshold Values and Management Options for Nutrients in a Catchment of a Temperate Estuary with Poor Ecological Status. Hydrol. Earth Syst. Sci. 2012, 16, 2663–2683. [Google Scholar] [CrossRef]
  32. European Commission. Technical Report on Groundwater Associated Aquatic Ecosystems; European Commission: Brussels, Belgium, 2015.
  33. Andersen, M.S.; Baron, L.; Gudbjerg, J.; Gregersen, J.; Chapellier, D.; Jakobsen, R.; Postma, D. Discharge of Nitrate-Containing Groundwater into a Coastal Marine Environment. J. Hydrol. 2007, 336, 98–114. [Google Scholar] [CrossRef]
  34. Moore, W.S.; Blanton, J.O.; Joye, S.B. Estimates of Flushing Times, Submarine Groundwater Discharge, and Nutrient Fluxes to Okatee Estuary, South Carolina. J. Geophys. Res. Oceans 2006, 111, 1–14. [Google Scholar] [CrossRef]
  35. Luijendijk, E.; Gleeson, T.; Moosdorf, N. Fresh Groundwater Discharge Insignificant for the World’s Oceans but Important for Coastal Ecosystems. Nat. Commun. 2020, 11, 1260. [Google Scholar] [CrossRef]
  36. Schlüter, M.; Sauter, E.J.; Andersen, C.E.; Dahlgaard, H.; Dando, P.R. Spatial Distribution and Budget for Submarine Groundwater Discharge in Eckernförde Bay (Western Baltic Sea). Limnol. Oceanogr. 2004, 49, 157–167. [Google Scholar] [CrossRef]
  37. Slomp, C.P.; Van Cappellen, P. Nutrient Inputs to the Coastal Ocean through Submarine Groundwater Discharge: Controls and Potential Impact. J. Hydrol. 2004, 295, 64–86. [Google Scholar] [CrossRef]
  38. Smith, S.L.; Cunniff, S.E.; Peyronnin, N.S.; Kritzer, J.P. Prioritizing Coastal Ecosystem Stressors in the Northeast United States under Increasing Climate Change. Environ. Sci. Policy 2017, 78, 49–57. [Google Scholar] [CrossRef]
  39. Liu, Y.; Song, Y.; Jiao, J.J. Submarine Groundwater Discharge Strengthens Acidification in the Coastal Semi-Closed Bays. Geophys. Res. Lett. 2023, 50, e2023GL103788. [Google Scholar] [CrossRef]
  40. Moore, W.S. The Effect of Submarine Groundwater Discharge on the Ocean. Ann. Rev. Mar. Sci. 2010, 2, 59–88. [Google Scholar] [CrossRef]
  41. Wang, X.; Li, H.; Jiao, J.J.; Barry, D.A.; Li, L.; Luo, X.; Wang, C.; Wan, L.; Wang, X.; Jiang, X.; et al. Submarine Fresh Groundwater Discharge into Laizhou Bay Comparable to the Yellow River Flux. Sci. Rep. 2015, 5, 8814. [Google Scholar] [CrossRef]
  42. Hinsby, K.; Leth, J.O.; Andersen, L.T.; Kidmose, J.; Bennike, O.; Jakobsen, R.; Scholten, J.; Schröder, J.F.; Christensen, F.E.; Christiansen, A.V. Combining Land and Marine Geoscientific Mapping and Modelling to Explore Submarine Groundwater Discharge in a ”white Ribbon” of an Eutrophic Estuary in the Western Baltic Sea. Geus Bull. 2025; submitted. [Google Scholar]
  43. Lane, J.W.; Briggs, M.A.; Maurya, P.K.; White, E.A.; Pedersen, J.B.; Auken, E.; Terry, N.; Minsley, B.; Kress, W.; LeBlanc, D.R.; et al. Characterizing the Diverse Hydrogeology Underlying Rivers and Estuaries Using New Floating Transient Electromagnetic Methodology. Sci. Total Environ. 2020, 740, 140074. [Google Scholar] [CrossRef] [PubMed]
  44. Bonus Seamount New Surveillance Tools for Remote Sea Monitoring and Their Application on Submarine Groundwater Discharge and Seabed Surveys—What We Are Doing and Why? Available online: https://seamount.eu/news/video-what-are-we-doing-and-why/ (accessed on 29 January 2025).
  45. Cai, K.; Zhang, G.; Sun, Y.; Ding, G.; Xu, F. Multi Autonomous Underwater Vehicle (AUV) Distributed Collaborative Search Method Based on a Fuzzy Clustering Map and Policy Iteration. J. Mar. Sci. Eng. 2024, 12, 1521. [Google Scholar] [CrossRef]
  46. Zhou, J.; Si, Y.; Chen, Y. A Review of Subsea AUV Technology. J. Mar. Sci. Eng. 2023, 11, 1119. [Google Scholar] [CrossRef]
  47. Bandyopadhyay, P.R. Trends in Biorobotic Autonomous Undersea Vehicles. IEEE J. Ocean. Eng. 2005, 30, 109–139. [Google Scholar] [CrossRef]
  48. Wynn, R.B.; Huvenne, V.A.I.; Le Bas, T.P.; Murton, B.J.; Connelly, D.P.; Bett, B.J.; Ruhl, H.A.; Morris, K.J.; Peakall, J.; Parsons, D.R.; et al. Autonomous Underwater Vehicles (AUVs): Their Past, Present and Future Contributions to the Advancement of Marine Geoscience. Mar. Geol. 2014, 352, 451–468. [Google Scholar] [CrossRef]
  49. Reusch, T.B.H.; Dierking, J.; Andersson, H.C.; Bonsdorff, E.; Carstensen, J.; Casini, M.; Czajkowski, M.; Hasler, B.; Hinsby, K.; Hyytiäinen, K.; et al. The Baltic Sea as a Time Machine for the Future Coastal Ocean. Sci. Adv. 2018, 4, eaar8195. [Google Scholar] [CrossRef]
  50. Meier, H.E.M.; Eilola, K.; Almroth-Rosell, E.; Schimanke, S.; Kniebusch, M.; Höglund, A.; Pemberton, P.; Liu, Y.; Väli, G.; Saraiva, S. Disentangling the Impact of Nutrient Load and Climate Changes on Baltic Sea Hypoxia and Eutrophication since 1850. Clim. Dyn. 2019, 53, 1145–1166. [Google Scholar] [CrossRef]
  51. Meier, H.E.M.; Kniebusch, M.; Dieterich, C.; Gröger, M.; Zorita, E.; Elmgren, R.; Myrberg, K.; Ahola, M.P.; Bartosova, A.; Bonsdorff, E.; et al. Climate Change in the Baltic Sea Region: A Summary. Earth Syst. Dyn. 2022, 13, 457–593. [Google Scholar] [CrossRef]
  52. Andersen, J.H.; Carstensen, J.; Conley, D.J.; Dromph, K.; Fleming-Lehtinen, V.; Gustafsson, B.G.; Josefson, A.B.; Norkko, A.; Villnäs, A.; Murray, C. Long-Term Temporal and Spatial Trends in Eutrophication Status of the Baltic Sea. Biol. Rev. 2017, 92, 135–149. [Google Scholar] [CrossRef]
  53. Carstensen, J.; Andersen, J.H.; Gustafsson, B.G.; Conley, D.J. Deoxygenation of the Baltic Sea during the Last Century. Proc. Natl. Acad. Sci. USA 2014, 111, 5628–5633. [Google Scholar] [CrossRef] [PubMed]
  54. Reckermann, M.; Omstedt, A.; Soomere, T.; Aigars, J.; Akhtar, N.; Bełdowska, M.; Bełdowski, J.; Cronin, T.; Czub, M.; Eero, M.; et al. Human Impacts and Their Interactions in the Baltic Sea Region. Earth Syst. Dyn. 2022, 13, 1–80. [Google Scholar] [CrossRef]
  55. Diaz, R.J.; Rosenberg, R. Spreading Dead Zones and Consequences for Marine Ecosystems. Science 2008, 321, 926–929. [Google Scholar] [CrossRef] [PubMed]
  56. HELCOM. State of the Baltic Sea. Third HELCOM Holistic Assessment 2016–2021; HELCOM: Helsinki, Finland, 2023. [Google Scholar]
  57. Jarvenpaa, S.L.; Essén, A. Data Sustainability: Data Governance in Data Infrastructures across Technological and Human Generations. Inf. Organ. 2023, 33, 100449. [Google Scholar] [CrossRef]
  58. Wilkinson, M.; Dumontier, M.; Aalbersberg, I. The FAIR Guiding Principles for Scientific Data Management and Stewardship. Sci. Data 2016, 3, 160018. [Google Scholar] [CrossRef]
  59. Hinsby, K.; Négrel, P.; de Oliveira, D.; Barros, R.; Venvik, G.; Ladenberger, A.; Griffioen, J.; Piessens, K.; Calcagno, P.; Götzl, G.; et al. Mapping and Understanding Earth: Open Access to Digital Geoscience Data and Knowledge Supports Societal Needs and UN Sustainable Development Goals. Int. J. Appl. Earth Obs. Geoinf. 2024, 130, 103835. [Google Scholar] [CrossRef]
  60. Prampolini, M.; Savini, A.; Foglini, F.; Soldati, M. Seven Good Reasons for Integrating Terrestrial and Marine Spatial Datasets in Changing Environments. Water 2020, 12, 2221. [Google Scholar] [CrossRef]
  61. Post, V.E.A.; Groen, J.; Kooi, H.; Person, M.; Ge, S.; Edmunds, W.M. Offshore Fresh Groundwater Reserves as a Global Phenomenon. Nature 2013, 504, 71–78. [Google Scholar] [CrossRef]
  62. Ladouche, B.; Maréchal, J.C.; Lamotte, C.; Durand, V.; Bailly-Comte, V.; Hakoun, V. Dataset on Onshore Groundwaters and Offshore Submarine Spring of a Mediterranean Karst Aquifer during Flow Reversal and Saltwater Intrusion. Data Brief 2023, 50, 109557. [Google Scholar] [CrossRef]
  63. EuroGeoSurveys. EuroGeoSurveys—Bridging Science and Policy. Available online: https://eurogeosurveys.org/ (accessed on 30 January 2025).
  64. Van Gessel, S.F.; Hinsby, K.; Stanley, G.; Tulstrup, J.; Schavemaker, Y.; Piessens, K.; Bogaard, P.J.F. Geological Services towards a Sustainable Use and Management of the Subsurface: A Geoethical Imperative. Ann. Geophys. 2017, 60. [Google Scholar] [CrossRef]
  65. European Commission. Directive 2006/118/EC of the European Parliament and of the Council of 12 December 2006 on the Protection of Groundwater against Pollution and Deterioration; European Commission: Brussels, Belgium, 2006.
  66. European Commission. Directive 2000/60/EC of the European Parliament and of the Council of 23 October 2000 Establishing a Framework for Community Action in the Field of Water Policy; European Commission: Brussels, Belgium, 2000.
  67. European Commission. Directive 2008/56/EC of the European Parliament and of the Council of 17 June 2008 Establishing a Framework for Community Action in the Field of Marine Environmental Policy (Marine Strategy Framework Directive); European Commission: Brussels, Belgium, 2008.
  68. Cornell, S.; Berkhout, F.; Tuinstra, W.; Tàbara, J.D.; Jäger, J.; Chabay, I.; de Wit, B.; Langlais, R.; Mills, D.; Moll, P.; et al. Opening up Knowledge Systems for Better Responses to Global Environmental Change. Environ. Sci. Policy 2013, 28, 60–70. [Google Scholar] [CrossRef]
  69. Gleeson, T.; Wang-Erlandsson, L.; Porkka, M.; Zipper, S.C.; Jaramillo, F.; Gerten, D.; Fetzer, I.; Cornell, S.E.; Piemontese, L.; Gordon, L.J.; et al. Illuminating Water Cycle Modifications and Earth System Resilience in the Anthropocene. Water Resour. Res. 2020, 56, e2019WR024957. [Google Scholar] [CrossRef]
  70. Richardson, K.; Steffen, W.; Lucht, W.; Bendtsen, J.; Cornell, S.E.; Donges, J.F.; Drüke, M.; Fetzer, I.; Bala, G.; Von Bloh, W.; et al. Earth beyond Six of Nine Planetary Boundaries. Sci. Adv. 2023, 9, eadh2458. [Google Scholar] [CrossRef] [PubMed]
  71. Steffen, W.; Richardson, K.; Rockström, J.; Cornell, S.E.; Fetzer, I.; Bennett, E.M.; Biggs, R.; Carpenter, S.R.; De Vries, W.; De Wit, C.A.; et al. Planetary Boundaries: Guiding Human Development on a Changing Planet. Science 2015, 347, 1259855. [Google Scholar] [CrossRef]
  72. Walther, G.; Post, E.; Convey, P.; Menzel, A.; Parmesank, C.; Beebee, T.J.C.; Fromentin, J.-M.; Hoegh-Guldberg, O.; Bairlein, F. Ecological Response to Recent Climate Change. Nature 2002, 416, 389–395. [Google Scholar] [CrossRef]
  73. Hoffmann, J.J.L.; Schneider von Deimling, J.; Schröder, J.F.; Schmidt, M.; Held, P.; Crutchley, G.J.; Scholten, J.; Gorman, A.R. Complex Eyed Pockmarks and Submarine Groundwater Discharge Revealed by Acoustic Data and Sediment Cores in Eckernförde Bay, SW Baltic Sea. Geochem. Geophys. Geosystems 2020, 21, e2019GC008825. [Google Scholar] [CrossRef]
  74. Ikonen, J.; Hendriksson, N.; Luoma, S.; Lahaye, Y.; Virtasalo, J.J. Behavior of Li, S and Sr Isotopes in the Subterranean Estuary and Seafloor Pockmarks of the Hanko Submarine Groundwater Discharge Site in Finland, Northern Baltic Sea. Appl. Geochem. 2022, 147, 105471. [Google Scholar] [CrossRef]
  75. Purkamo, L.; von Ahn, C.M.E.; Jilbert, T.; Muniruzzaman, M.; Bange, H.W.; Jenner, A.-K.; Böttcher, M.E.; Virtasalo, J.J. Impact of Submarine Groundwater Discharge on Biogeochemistry and Microbial Communities in Pockmarks. Geochim. Cosmochim. Acta 2022, 334, 14–44. [Google Scholar] [CrossRef]
  76. Idczak, J.; Brodecka-Goluch, A.; Łukawska-Matuszewska, K.; Graca, B.; Gorska, N.; Klusek, Z.; Pezacki, P.D.; Bolałek, J. A Geophysical, Geochemical and Microbiological Study of a Newly Discovered Pockmark with Active Gas Seepage and Submarine Groundwater Discharge (MET1-BH, Central Gulf of Gdańsk, Southern Baltic Sea). Sci. Total Environ. 2020, 742, 140306. [Google Scholar] [CrossRef]
  77. Krek, A.; Danchenkov, A.; Mikhnevich, G. Morphological and Chemical Features of Submarine Groundwater Discharge Zones in the South-Eastern Part of the Baltic Sea. Russ. J. Earth Sci. 2022, 22, ES4003. [Google Scholar] [CrossRef]
  78. EGDI. Interactive Map Showing the Location of SGD Sites Investigated in Coastal Waters of the Baltic Sea. Available online: https://maps.europe-geology.eu/#baslay=baseMapGEUS&e-tent=192526.50754193496,1981300.3554729372,8882255.512591414,5534832.147915851&layers=onegeoeuro_surface_lithology,emodnet_substrate_1m,sgd_locations_epsg3034_2024 (accessed on 28 January 2025).
  79. INSPIRE. Infrastructure for Spatial Information in Europe. 2025. Available online: https://knowledge-base.inspire.ec.europa.eu/index_en (accessed on 6 March 2025).
  80. Evologics. Introducing-Seamount-Poggy-a-Novel-Bionic-Auv-from-Evologics; Evologics: Berlin, Germany, 2020; Available online: https://www.evologics.com/blog/news-2/introducing-seamount-poggy-a-novel-bionic-auv-from-evologics-57 (accessed on 6 March 2025).
  81. NOA-MARINE. Sea Sentinel AUV Capability Demo; NOA MARINE: Kraków, Poland, 2020; Available online: https://www.dropbox.com/scl/fo/nb7jscf6b9pr0wpzjlaz6/AGnyyK7-ADhzyVcKNL78IhQ?rlkey=iblbgmr9xv8a1bfd75jelf4uk&st=0f86y7fu&dl=0 (accessed on 6 March 2025).
  82. Bannasch, R.; Latacz, M.; Schröder, J.F.; Prien, R.; Virtasalo, J.; Hac, B.; Hinsby, K. Designing and Testing Autonomous Underwater Vehicles for Locating and Monitoring Submarine Groundwater Discharge. In Proceedings of the Baltic Sea Science Congress 2019, Stockholm, Sweden, 19–23 August 2019; Stockholm University: Stockholm, Sweden, 2019; p. 81. [Google Scholar]
  83. Skålvik, A.M.; Bjørk, R.N.; Martínez, E.; Frøysa, K.-E.; Saetre, C. Multivariate, Automatic Diagnostics Based on Insights into Sensor Technology. J. Mar. Sci. Eng. 2024, 12, 2367. [Google Scholar] [CrossRef]
  84. EGDI. Real-Time Measurements of Nitrate at St. Blaakilde/the “Big Blue Spring” Denmark. Available online: https://data.geus.dk/sensornet/egditimeseries/index.html?country=denmark&chart=nitrate&locale=en-GB&id-list=StoreBl%E5kilde_1 (accessed on 30 January 2025).
  85. EGDI. European Geological Data Infrastructure. Available online: https://www.europe-geology.eu/ (accessed on 30 January 2025).
  86. Hollis, J.; Bricker, S.; Čápová, D.; Hinsby, K.; Krenmayr, H.-G.; Negrel, P.; Oliveira, D.; Poyiadji, E.; Van Gessel, S.; Van Heteren, S.; et al. Pan-European Geological Data, Information, and Knowledge for a Resilient, Sustainable, and Collaborative Future. Eur. Geol. 2022, 53, 6–19. [Google Scholar] [CrossRef]
  87. European Commission. European Marine Observation and Data Network. Available online: https://emodnet.ec.europa.eu/en (accessed on 29 January 2025).
  88. GeoERA. Establishing the European Geological Surveys Research Area to Deliver a Geological Service for Europe. Available online: https://geoera.eu/ (accessed on 29 January 2025).
  89. GSEU. GSEU—Geological Service for Europe: Bringing the Subsurface into the Light. Available online: https://www.geologicalservice.eu/ (accessed on 29 January 2025).
  90. EPOS. EPOS—European Plate Observing System. Available online: https://www.epos-eu.org/ (accessed on 29 January 2025).
  91. EGDI. EGDI 3D Model Viewer. Available online: https://3dviewer.europe-geology.eu/?model_id=12 (accessed on 30 January 2025).
  92. Czech Geological Survey Cookbook for Creating Metadata Records Using the EGDI Metadata Catalogue (MIcKA, Version 6.0). Available online: https://czechgeologicalsurvey.github.io/MICKA-Docs/ (accessed on 13 February 2025).
  93. EGDI. Information and Support on Providing Data and Metadata for EGDI. Available online: https://www.europe-geology.eu/get-involved/ (accessed on 6 February 2025).
  94. Bussmann, I.; Suess, E. Groundwater Seepage in Eckernförde Bay (Western Baltic Sea): Effect on Methane and Salinity Distribution of the Water Column. Cont. Shelf Res. 1998, 18, 1795–1806. [Google Scholar] [CrossRef]
  95. Schubert, M.; Scholten, J.; Kreuzburg, M.; Petermann, E.; de Paiva, M.L.; Köhler, D.; Liebetrau, V.; Rapaglia, J.; Schlüter, M. Radon (222Rn) as Tracer for Submarine Groundwater Discharge Investigation—Limitations of the Approach at Shallow Wind-Exposed Coastal Settings. Environ. Monit. Assess. 2022, 194, 798. [Google Scholar] [CrossRef] [PubMed]
  96. Ellins’, K.K.; Roman-Mas, A.; Lee, R. Using 222Rn to examine groundwater/surface discharge interaction in the rio grande de manati, puerto rico. J. Hydrol. 1990, 115, 319–341. [Google Scholar] [CrossRef]
  97. Pedersen, J.; Johnsen, R.; Henriksen, H.J. Horsens Fjord Case—NONAM Risk Assessment and Stakeholder Investment. Multidisciplinary Workshop in Reykjavík 26–27 August 2010. Available online: https://en.vedur.is/media/loftslag/Case_A___Horsens_Fjord.pdf (accessed on 13 February 2025).
  98. Hinsby, K.; Leth, J.O.; Andersen, L.T.; Kidmose, J.; Thorling, L.; Schröder, J.F.; Scholten, J.; Lanstorp, J.; Hansen, M. Locating and Investigating Submarine Groundwater Discharge in the Horsens Fjord Estuary, Denmark. In Proceedings of the Baltic Sea Science Congress 2019 Abstracts; Stockholm University: Stockholm, Sweden, 2019; p. 114. [Google Scholar]
  99. IGIS. GeoScene3D—Geological Modelling Software Developed by Geologists for Geologists. Available online: https://i-gis.dk/geoscene3d/ (accessed on 13 February 2025).
  100. Havsans Low Cost Solutions for Measuring Hydrographic Parameters in Coastal Seas. Available online: https://www.havsans.dk/ (accessed on 30 January 2025).
  101. Jankowska, H.; Matciak, M.; Nowacki, J. Salinity Variations as an Effect of Groundwater Seepage through the Seabed (Puck Bay, Poland) Puck Bay Salinity Variations Submarine Groundwater Discharge. Oceanologia 1994, 36, 33–46. [Google Scholar]
  102. Matciak, M.; Pruszkowska-Caceres, M.; Szymczycha, B.; Kobos, J.; Misiewicz, M.M.; Owsianny, P.M. Submarine Groundwater Discharge to the Puck Bay. In Zatoka Pucka, Aspekty Geologiczne i Fizyczne; Bołaek, J., Burska, D., Eds.; Wyd. Uniwersytet Gdański: Gdański, Poland, 2020; pp. 115–169. [Google Scholar]
  103. Hinsby, K.; Condesso de Melo, M.T.; Dahl, M. European Case Studies Supporting the Derivation of Natural Background Levels and Groundwater Threshold Values for the Protection of Dependent Ecosystems and Human Health. Sci. Total Environ. 2008, 401, 1–20. [Google Scholar] [CrossRef]
  104. BONUS. BONUS—Science for a Better Future of the Baltic Sea Region. Available online: https://www.bonusportal.org/ (accessed on 30 January 2025).
  105. BANOS. The Baltic and North Sea Coordination and Support Action (BANOS CSA, 2018–2021). Available online: https://www.banoscsa.org/ (accessed on 30 January 2025).
  106. Jørgensen, F.; Scheer, W.; Thomsen, S.; Sonnenborg, T.O.; Hinsby, K.; Wiederhold, H.; Schamper, C.; Burschil, T.; Roth, B.; Kirsch, R.; et al. Transboundary Geophysical Mapping of Geological Elements and Salinity Distribution Critical for the Assessment of Future Sea Water Intrusion in Response to Sea Level Rise. Hydrol. Earth Syst. Sci. 2012, 16, 1845–1862. [Google Scholar] [CrossRef]
  107. Hinsby, K.; Auken, E.; Oude-Essink, G.H.P.; de Louw, P.; Jørgensen, F.; Siemon, B.; Sonnenborg, T.O.; Vandenbohede, A.; Wiederholt, H.; Guadagnini, A.; et al. Assessing the Impact of Climate Change for Adaptive Water Management in Coastal Regions. Hydrol. Earth Syst. Sci. 2011, 16, 149. [Google Scholar]
  108. Water4All—Water Security for the Planet. SentinelSprings—Springs as Sentinels of Climate Change and Sustainability of Aquatic Ecosystems. 2025. Available online: https://www.water4all-partnership.eu/joint-activities/water4all-2023-joint-transnational-call (accessed on 6 March 2025).
  109. Luoma, S.; Okkonen, J.; Korkka-Niemi, K. Comparaison Des Méthodes AVI, SINTACS Modifiée et GALDIT d’évaluation de La Vulnérabilité d’un Aquifère Côtier Peu Profond Dans Le Sud de La Finlande Pour Des Scénarios de Changement Climatique. Hydrogeol. J. 2017, 25, 203–222. [Google Scholar] [CrossRef]
  110. Pellikka, H.; Leijala, U.; Johansson, M.M.; Leinonen, K.; Kahma, K.K. Future Probabilities of Coastal Floods in Finland. Cont. Shelf Res. 2018, 157, 32–42. [Google Scholar] [CrossRef]
  111. Albers, C.N.; Sültenfuss, J. A 60-Year Increase in the Ultrashort-Chain PFAS Trifluoroacetate and Its Suitability as a Tracer for Groundwater Age. Environ. Sci. Technol. Lett. 2024, 11, 1090–1095. [Google Scholar] [CrossRef]
Figure 1. Conceptual model of an SGD site with white arrows showing groundwater flow and possible dissolved contaminant pathways in the subsurface (modified from [8]). Bluish and brownish colours indicate aquifers and aquitards, respectively. Agricultural pollution potentially includes nutrients, pesticides, and veterinary antibiotics, and urban pollution potentially includes caffeine, human antibiotics, pharmaceuticals and other organic microcontaminants. Novel entities such as per- and polyfluoroalkyl substances (PFAS) that breach planetary boundaries [70] are potentially found in agricultural and urban polluted waters.
Jmse 13 00614 g001
Figure 2. Map showing the locations of the four SGD sites in Germany, Finland, Denmark and Poland (EF, HP, HF and PB) briefly described in Section 3, and other SGD research sites in the Baltic Sea in Sweden, Germany and Russia. The Supplementary Materials include Table S1 summarizing all of them. The legend for rock types and sediments on land is provided in the Supplementary Materials, Figure S1. The onshore and offshore geological maps are at a scale of 1:1,000,000.
Jmse 13 00614 g002
Figure 3. AUVs for SGD and seabed surveys [44]: (left) The SEAMOUNT-AUV “Poggy” [80]; (right) The NOA MARINE high-payload Sea Sentinel AUV [81]. For more information see Supplementary Materials, videos S1 and S2.
Jmse 13 00614 g003
Figure 4. Detailed bathymetric map of a pockmark at Mittelgrund, Eckernförde Bay. The colored area highlights the pockmark area. Small depressions within the pockmark, i.e., intrapockmarks are areas where SGD and methane seepage occurs (adopted from [73]).
Jmse 13 00614 g004
Figure 5. 222Rn activity in the sea surface water (0.5 m water depth) at the Hanko SGD site on 23 May 2018. Locations of pockmarks B, D and E that have been studied in detail are indicated. Color change in the background image is due to the combination of two aerial photographs taken at different times. Modified from [19]. Aerial photograph: National Land Survey of Finland Topographic Database April 2017.
Jmse 13 00614 g005
Figure 6. Three-dimensional geological model of the Horsens fjord estuary and its catchment with the location of the identified SGD site (P1). Submarine groundwater discharge from the pink and red quaternary sand aquifers below the seabed occurs at P1. The yellow arrow indicates the upwelling of groundwater at the yellow/blue cross. The 3D model developed in GeoScene3D [99] covers an area of 14 km × 22 km to a total depth of 700 m (vertical exaggeration: 10). The illustrated example is a modified version of the model stored in the 3D model repository on EGDI [91].
Jmse 13 00614 g006
Figure 7. SGD range in the Puck Bay identified by salinity pore water measures at offshore SGD sites. Modified after [102].
Jmse 13 00614 g007
Figure 8. Concentrations of contaminants in SGD within the Puck Bay [23,24,25,28]. Note! The Cd concentrations in the trace metals diagram in the lower left corner are so low that the red columns to the right of the blue Al columns are not visible, see Table S2 for more information.
Jmse 13 00614 g008
Disclaimer/Publisher’s Note: The statements, opinions and data contained in all publications are solely those of the individual author(s) and contributor(s) and not of MDPI and/or the editor(s). MDPI and/or the editor(s) disclaim responsibility for any injury to people or property resulting from any ideas, methods, instructions or products referred to in the content.

