Abstract
The green tide is the biggest ecological disaster in Yellow Sea in recent decades, and the species composition has varied from year to year. The ITS (internal transcribed spacer) sequence combined with 5S rDNA spacer are the mainstream molecular markers for green macroalgae. The former can perfectly distinguish the majority of Ulva spp. except the LPP (Ulva linza–procera–prolifera) complex, and the latter is used to distinguish U. linza and U. prolifera exactly based on the former. However, in practice, 5S rDNA spacer is difficult to amplify perfectly with universal primers, and this ultimately affects the experimental process. For this reason, we developed a stable mitochondrial marker for the distinction between U. linza and U. prolifera. The phylogenetic tree based on the mitochondrial rps2 (ribosomal protein S2) gene fragment can distinguish the LPP complex into two clades: U. linza and U. prolifera. Therefore, we concluded that the mitochondrial marker can be a great substitute for 5S primers to distinguish U. linza and U. prolifera.
1. Introduction
Green tide refers to a seasonal occurrence and harmful ecologic phenomenon caused by the blooming of macroalgae [1]. It was first reported in China along the Qingdao coastline on a small scale in July 2007, and it drew much attention in the summer of 2008 for its potential impact on the Olympic Games, with a massive green tide covering about 400 km2 [2,3]. Since then, green tide has appeared in the Yellow Sea from May to July annually and caused huge losses to the marine ecosystem, coastal environment, and economic developments [4,5,6].
The identification of algae species is crucial for the prevention and control of green tide. Some green algae have high morphologic plasticity and display different morphologies, colors, and sizes depending on season and environmental conditions [7]; therefore, morphologic identification is insufficient to distinguish between different algae species. The application of molecular biology for the identification of algae overcomes the shortcomings of morphologic plasticity, providing more information on the evolution and genetics of algae.
In the current identification method of green algae species, ITS (internal transcribed spacer) and 5S ribosomal intergenic spacer are the most widely used for the molecular identification for green algae [8,9,10,11]. The ITS sequence is located in the ribosomal gene cluster and consists of ITS1, 5.8S, and ITS2; it distinguishes most species of Ulva spp., except for the LPP (Ulva linza–procera–prolifera) complex [10], of which U. prolifera and U. linza are both components of green tide [12], and the former is the dominant species [2,3,5]. At present, U. procera has been regarded as a taxonomic synonym of U. linza, so the LPP clade should include both U. linza and U. prolifera [9]. Hence, distinguishing between U. linza and U. prolifera is particularly important. Usually, after distinguishing Ulva species usiing ITS sequences, the 5S rDNA spacer region is used to differentiate the LPP sepcies [10,11,12,13,14]. This is the ITS-5S PCR method for the identification of green macroalgae. However, in practice, we found that the 5S rDNA spacer was frequently difficult to amplify, except in floating U. prolifera. Moreover, the PCR-amplified production of 5S rDNA spacer of many macroalgae had multiple bands, and hence it took a lot of time and materials for the identification of green macroalgae [15]. Therefore, the development of a reliable and stable molecular marker for distinguishing U. linza from U. prolifera is necessary for the prevention and control of green tide.
In this study, we designed one pair of primers based on the CDS (coding sequence) of mitochondrial rps2 (ribosomal protein S2) genes, and they can distinguish between U. linza and U. prolifera stably and clearly after identification by ITS sequences.
2. Materials and Methods
2.1. Algae Collection and Culture Condition
The floating and attached green algae used for identification were collected respectively from Lianyungang (34.6128° N, 119.5532° E) (sample A) and Dafeng (33.6219° N, 120.7874° E) (sample B). The algae samples verified for the reliability of mitochondrial markers were collected from Rudong (32.6139° N, 121.1441° E) (sample C) and Lianyungang (34.6128° N, 119.5532° E) (sample D), and some were provided by Dr. Huan (the Institute of Oceanology, Chinese Academy of Sciences); these were collected from Qingdao (36.29624° N, 120.6597° E) (sample E and F) and Weihai (36.80834° N, 121.6274° E) (sample G), (37.01884° N, 122.5428° E) (sample H), (37.4258° N, 122.4872° E) (sample I) (Table 1).

Table 1.
Sample information of green algae in this study.
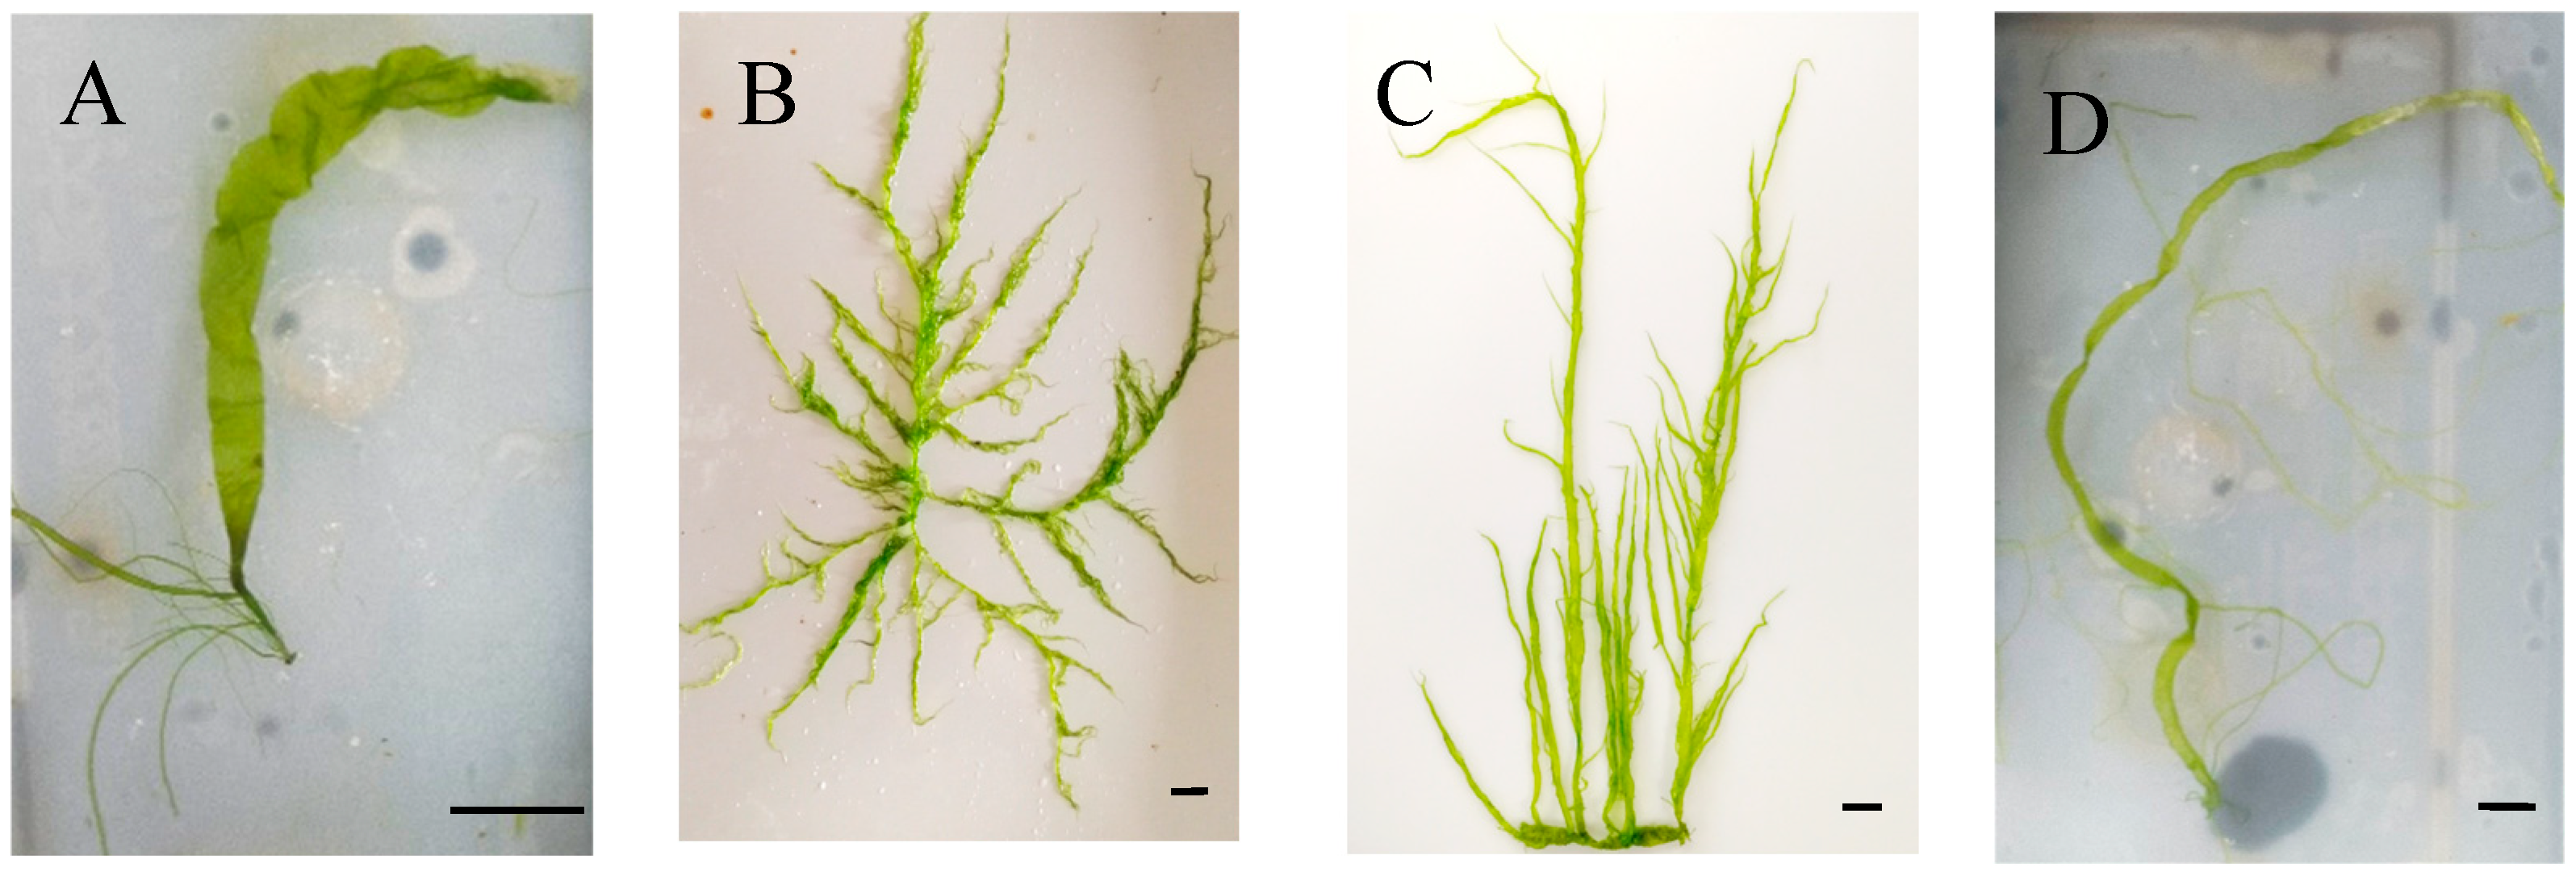
Sample A resembled an unfolded leaf in morphology, while floating algae (sample B) had a main branch and multiple branches, each of which was a hollow tubular structure. The morphological structure of the algae (sample C) was similar to that of sample B. Sample D also had a main branch and a few lateral branches (Figure 1). As for samples E–I, since they were all algal fragments, we could not provide specific morphological characteristics.

Figure 1.
The morphological characteristics of samples (A–D). Bar = 1 cm.
After washing three times with sterile distilled water, the algae samples (A–D) were cultured in sterile filtered seawater at 10 °C and 12L:12D in an illumination incubator, and the culture medium was changed every two days. The single algae sample weighed about 50–100 mg for further genomic DNA extraction. The samples (E–I) (all in algal fragments) were packed in 1.5 mL centrifuge tubes, sent by express delivery from Qingdao, washed with sterile water, and then used for genomic DNA extraction.
2.2. Primer Design and Synthesis
The traditional ITS and 5S primers were used to identify green algae. ITS-F (5′-TCGTAACAAGGTTTCCGTAGG-3′) and ITS-R (5′-TTCCTTCCGCTTATTGATATGC-3′) were used for the amplification of the ITS fragment; 5S-F (5′-GGTTGGGCAGGATTAGTA-3′) and 5S-R (5′-AGGCTTAAGTTGCGAGTT-3′) were used for the amplification of 5S rDNA space region [7]. Based on the mitochondrial genome information between Ulva linza (NC_029701.1) and Ulva prolifera (NC_028538.1), one pair of primers were designed to amplify the rps2 gene fragment: rps2-F: 5′-CTGCTGGACAATGTAAAGCA-3′ and rps2-R: 5′-GATCCAAGCCACTCTACTATC-3′. All the primers were synthesized by Sangon Biotech Co., Ltd. (Shanghai, China).
2.3. Genome Extraction, PCR Amplification, and Sequence Analysis
The genomic DNA of the algae sample was extracted using the Plant Genomic DNA Kit (TIANGEN, DP350, Beijing, China). The PCR reaction system included 2 × Taq Mix (15 μL) (Sangon Biotech Co., Ltd., Shanghai, China), each primer (10 μM) (1.5 μL), genome DNA template (1 μL), and ultrapure water (11 μL). The amplification program of the ITS sequence was as follows [8]: pre-denaturation at 94 °C for 5 min; 35 cycles for denaturation at 94 °C for 30 s, annealing at 55 °C for 30 s, extension at 72 °C for 40 s; and incubation at 72 °C for 5 min. The protocol for the PCR amplification of the 5S space region [10] included pre-denaturation at 94 °C for 5 min, 35 cycles for denaturation at 94 °C for 30 s, annealing at 52 °C for 30 s, and extension at 72 °C for 30 s, and then incubation at 72 °C for 5 min.
The profile of the PCR reaction programs for the rps2 gene fragment consisted of pre-denaturation at 94 °C for 5 min, 35 cycles for denaturation at 94 °C for 30 s, annealing at 55 °C for 30 s, extension at 72 °C for 40 s, and incubation at 72 °C for 5 min.
The PCR product was detected by 1% agarose electrophoresis, purified with StarPrep DNA Gel Extraction Kit (GenStar, D205, Beijing, China), and ligated into pMD19-T cloning vector for sequencing by Sangon Biotech Co., Ltd. (Shanghai, China).
The sequences were checked, edited, and blasted in the NCBI database (https://www.ncbi.nlm.nih.gov (accessed on 6 November 2023)). The most similar sequences were downloaded for further phylogenetic analysis. The phylogenetic tree was constructed using the NJ (Neighbor-Joining) method by MEGA 7 [16], and the bootstrap value was equal to 1000. The online program iTOL (https://itol.embl.de (accessed on 13 March 2025)) was used for visualization of the phylogenetic tree. Monostroma grevillea (No. GU062560.1) was set as the outgroup.
3. Results
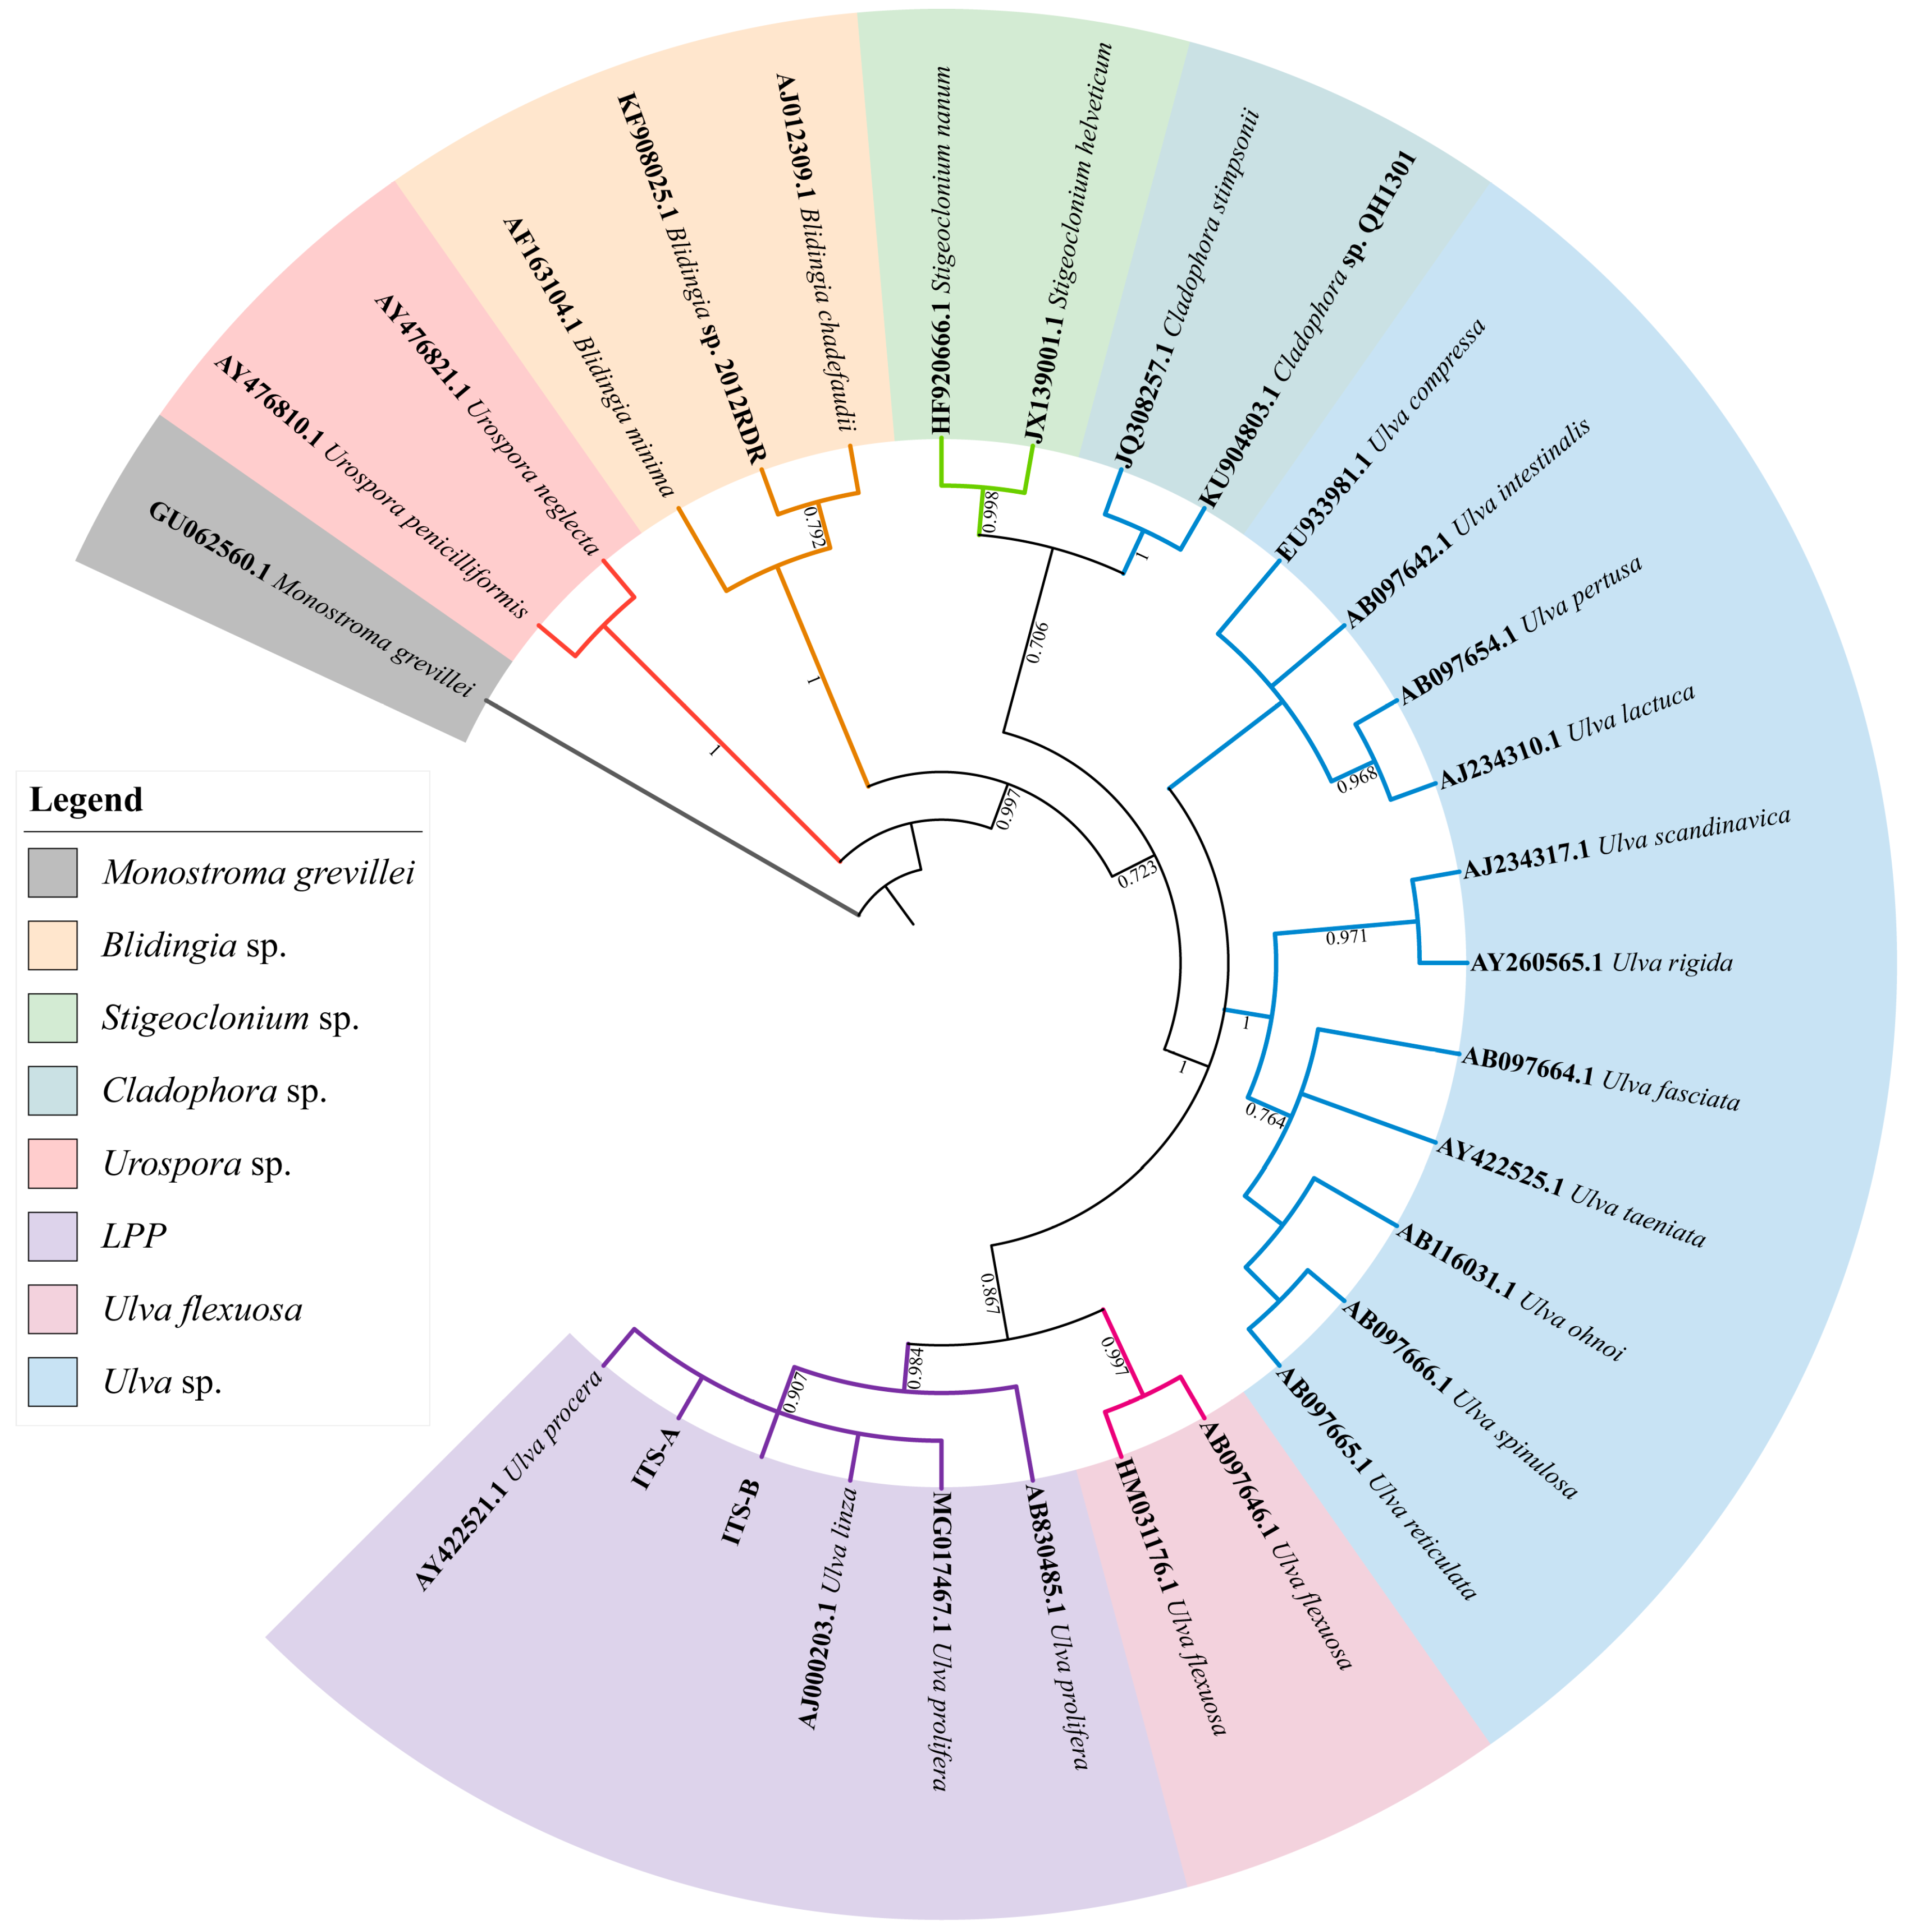
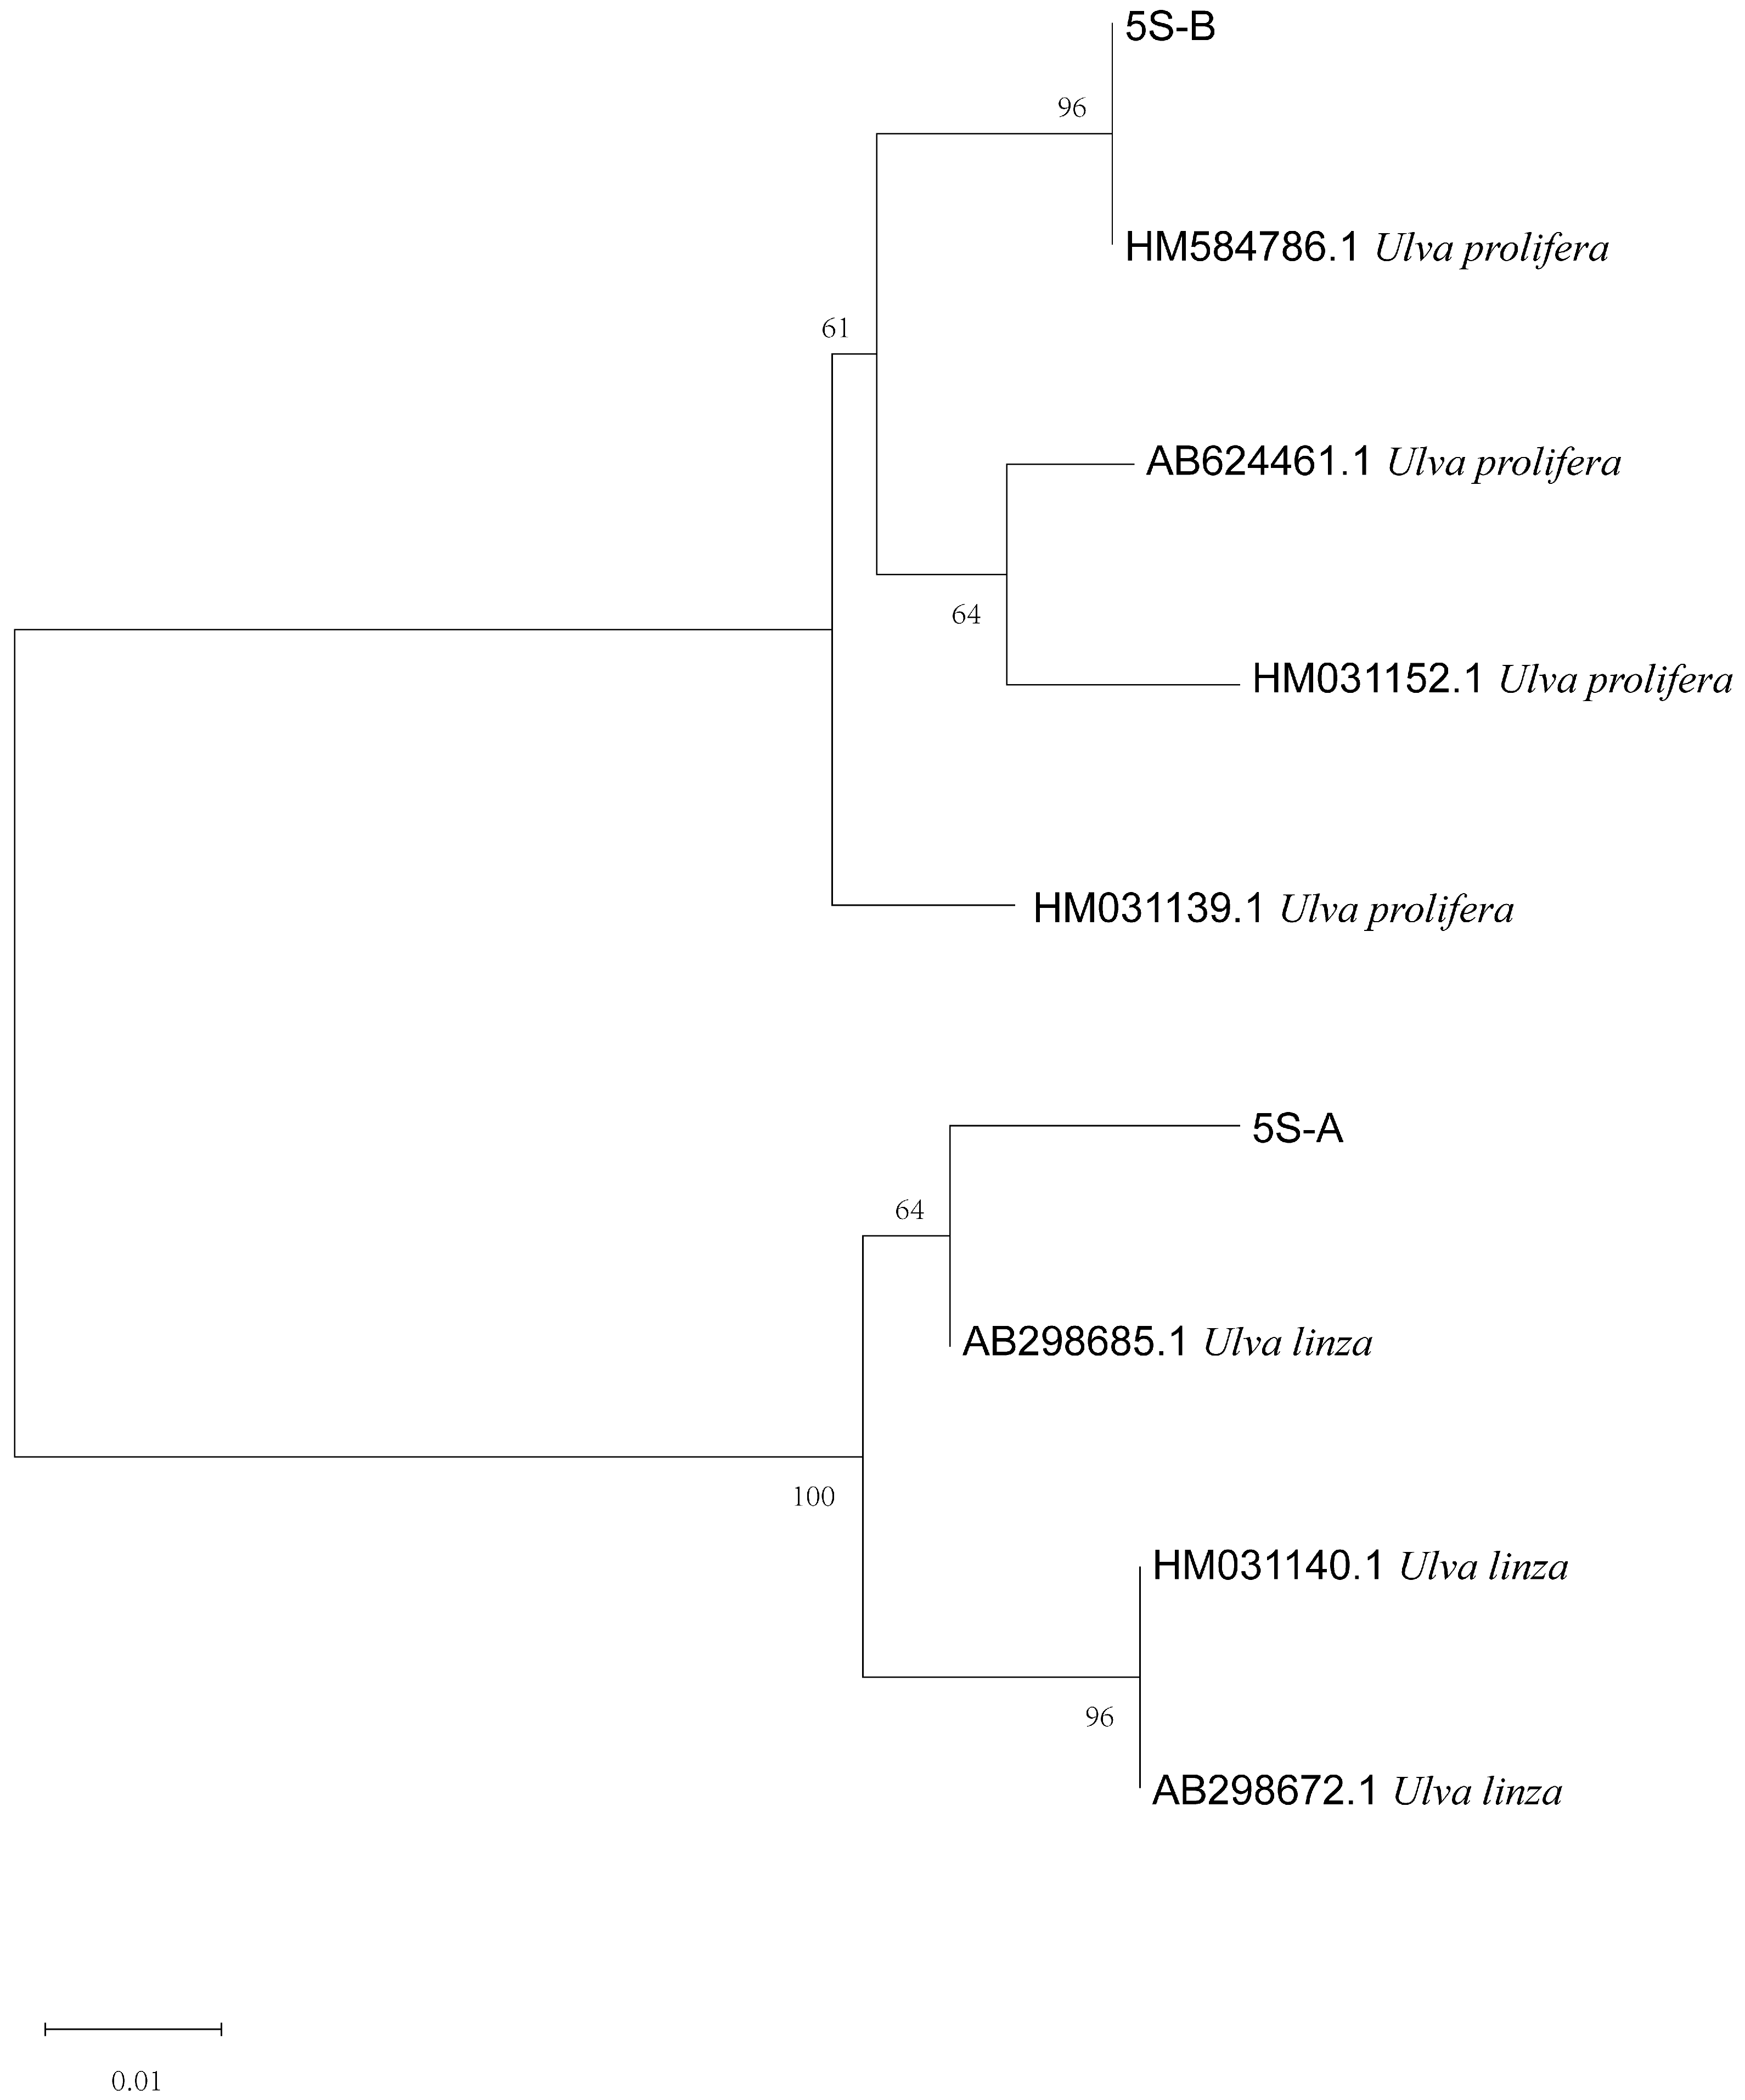
The phylogenetic tree based on the ITS sequences of algae samples A and B (Figure 2) was constructed using MEGA 7, and the result showed that the ITS sequences of the two algae were located on the LPP (Ulva linza–procera–prolifera) clade [10,17]. Furthermore, the phylogenetic tree based on the 5S rDNA spacer region (Figure 3) clearly showed that the two sequences were distributed in the U. linza clade and U. prolifera clade, respectively.

Figure 2.
Phylogenetic tree based on ITS (internal transcribed spacer) sequences of algae sample A and B. Monostroma grevillea (GU062560.1) was set as the outgroup.
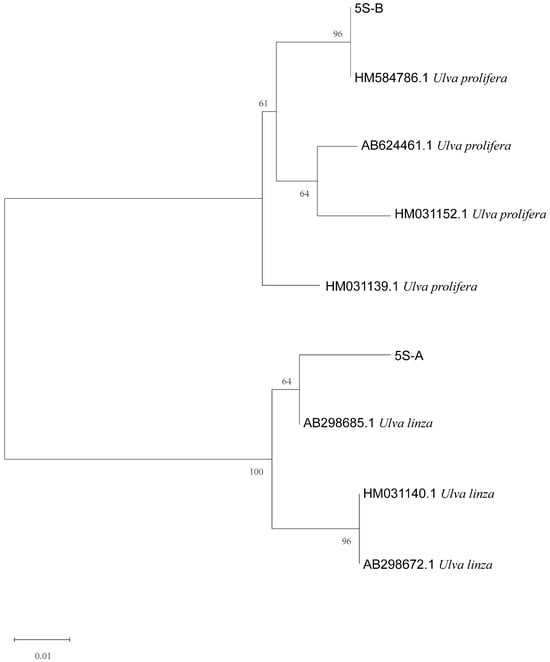
Figure 3.
Phylogenetic tree based on 5S rDNA interspace of algae samples A and B.
Based on the above results, we designed a new molecular marker according to the different CDS sequences of mitochondrial rps2 genes between U. linza and U. prolifera and amplified the rps2 gene fragments of the two algae. There was only one amplified band, and the sequencing results showed that the amplified products were about 560 bp (U. prolifera 563 bp and U. linza 554 bp) (Supplementary Figure S1) The phylogenetic tree based on the rps2 gene fragment (Figure 4) revealed that the two rps2 sequences (Supplementary Information) were located, respectively, in the U. linza and U. prolifera clades, which implied that the rps2-F/rps2-R primers can be used to distinguish between U. linza and U. prolifera.
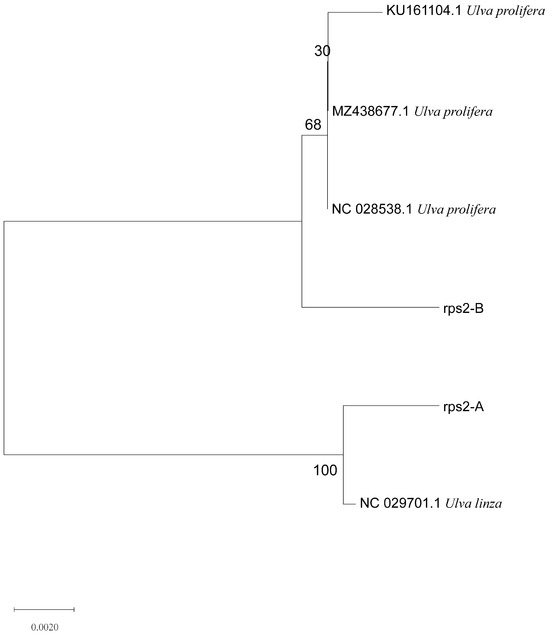
Figure 4.
Phylogenetic tree based on rps2 gene fragment of algae samples A and B.
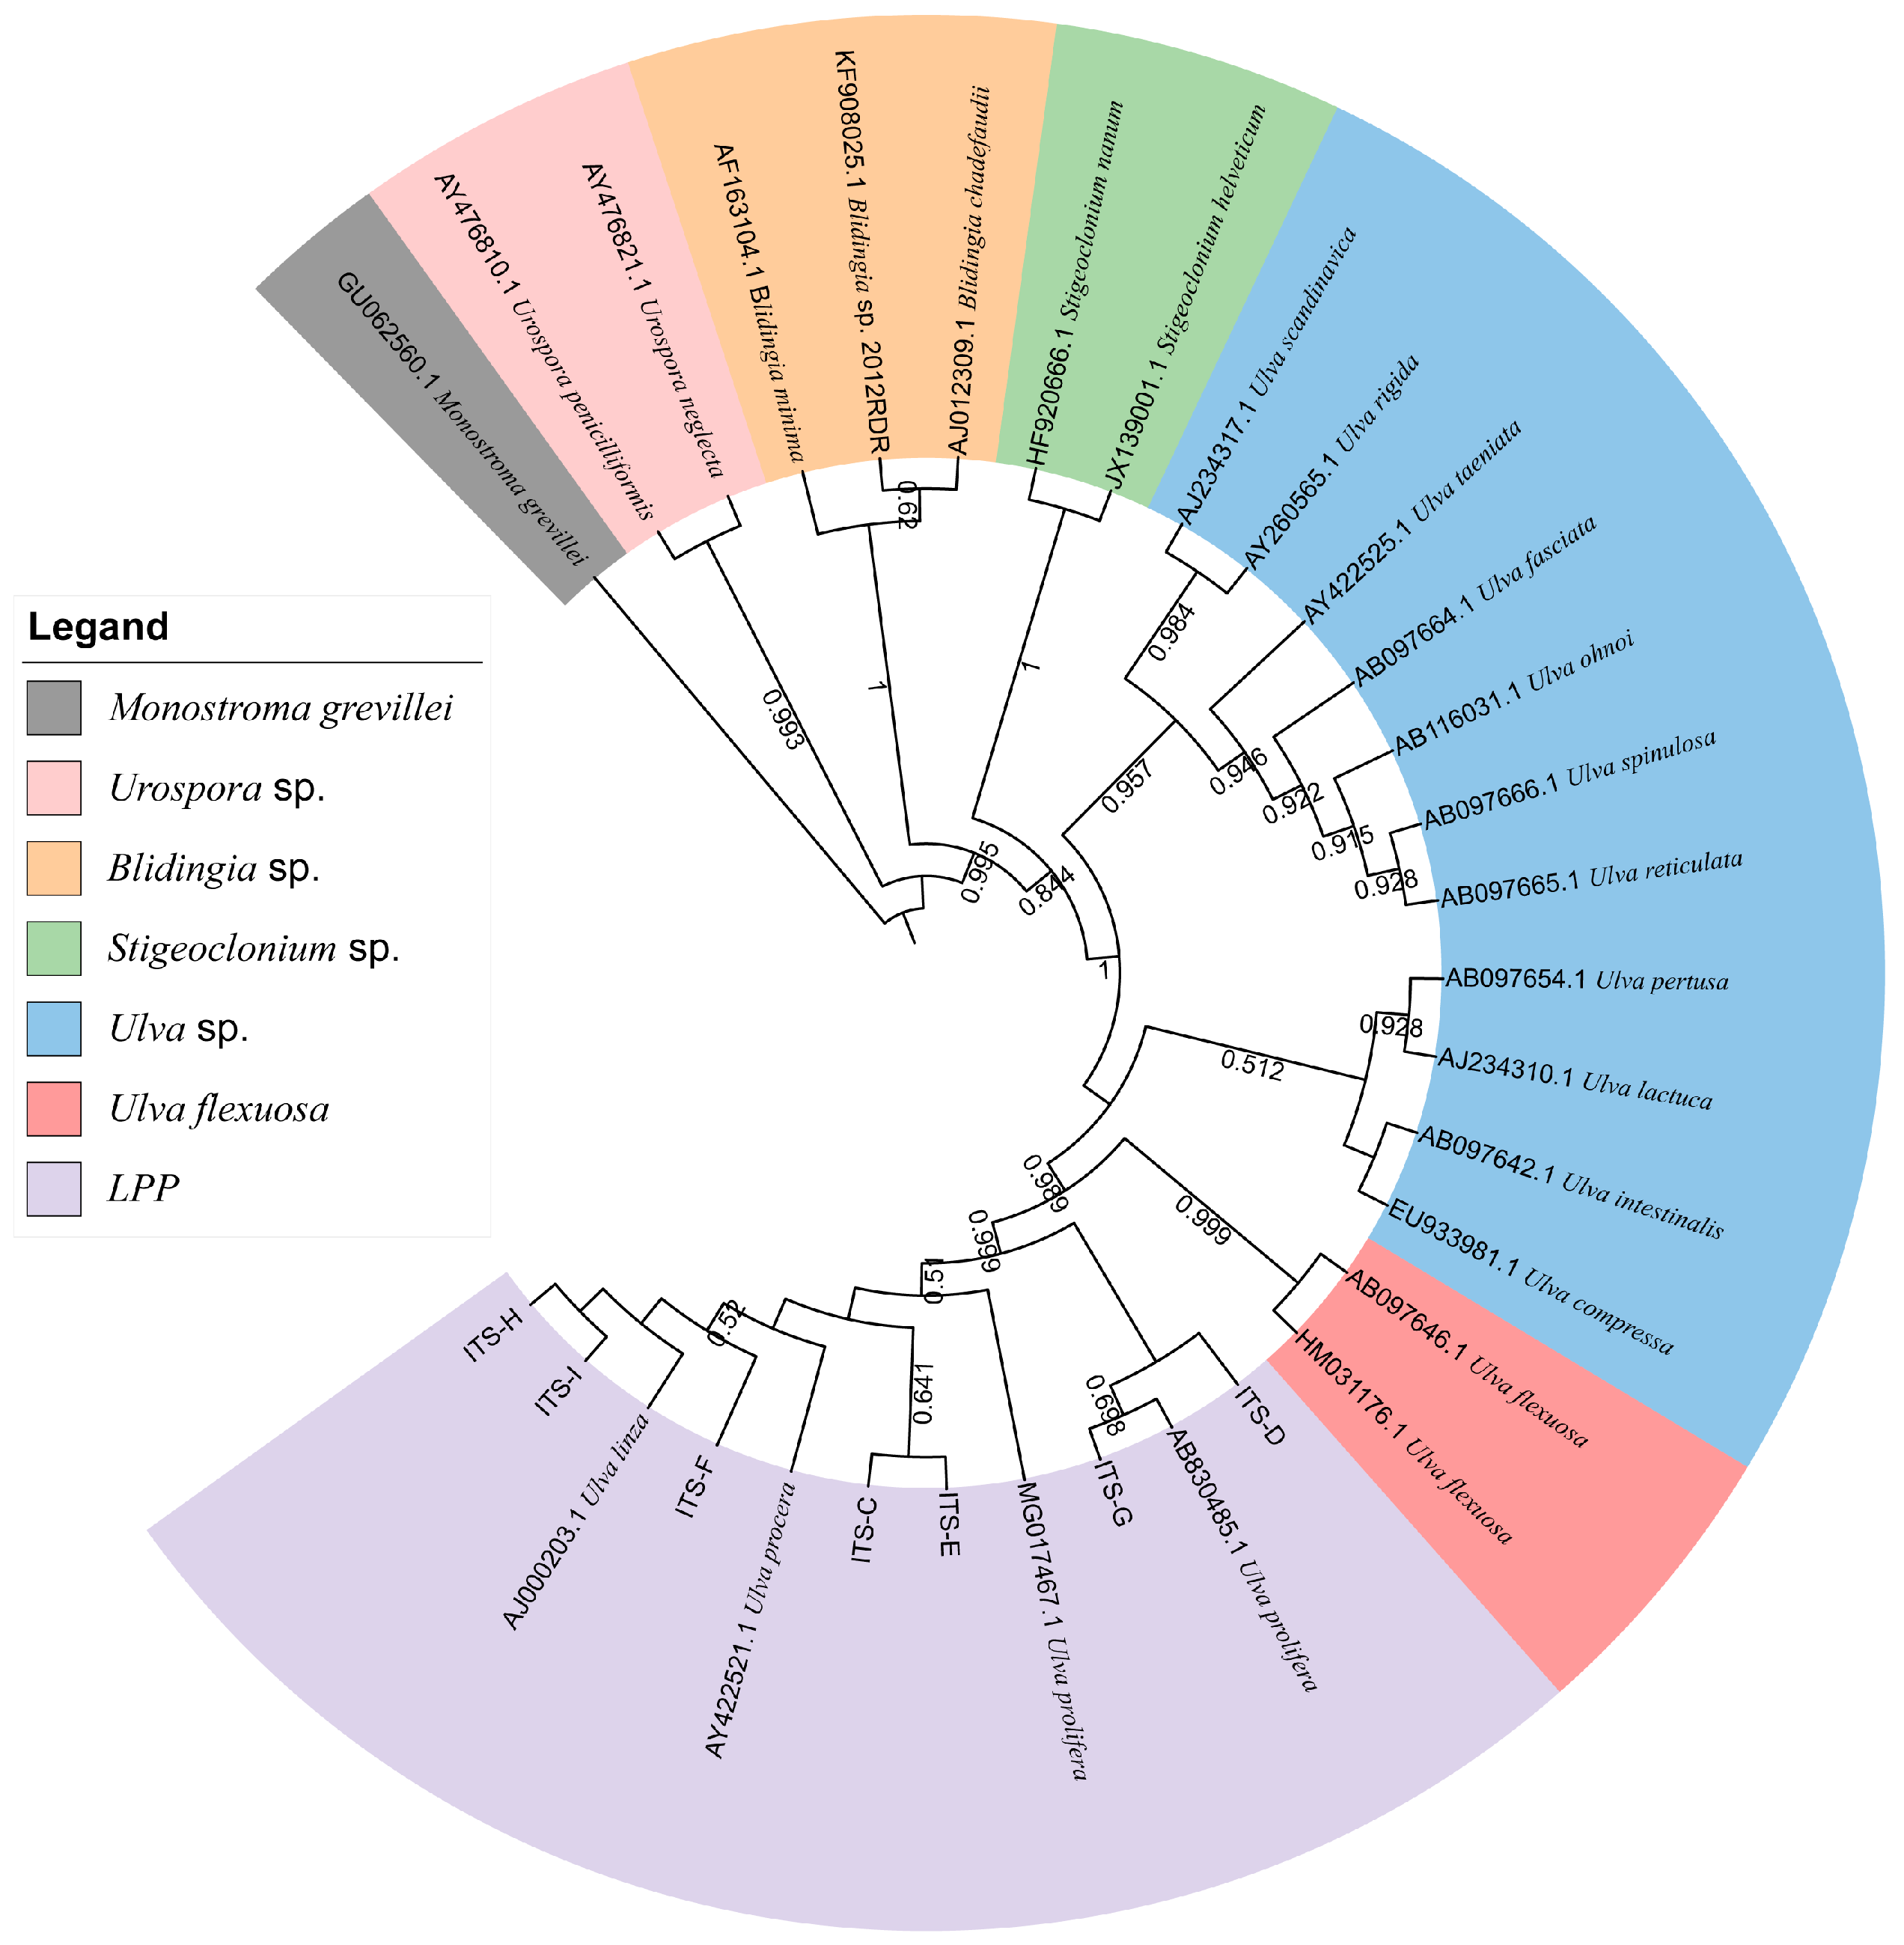
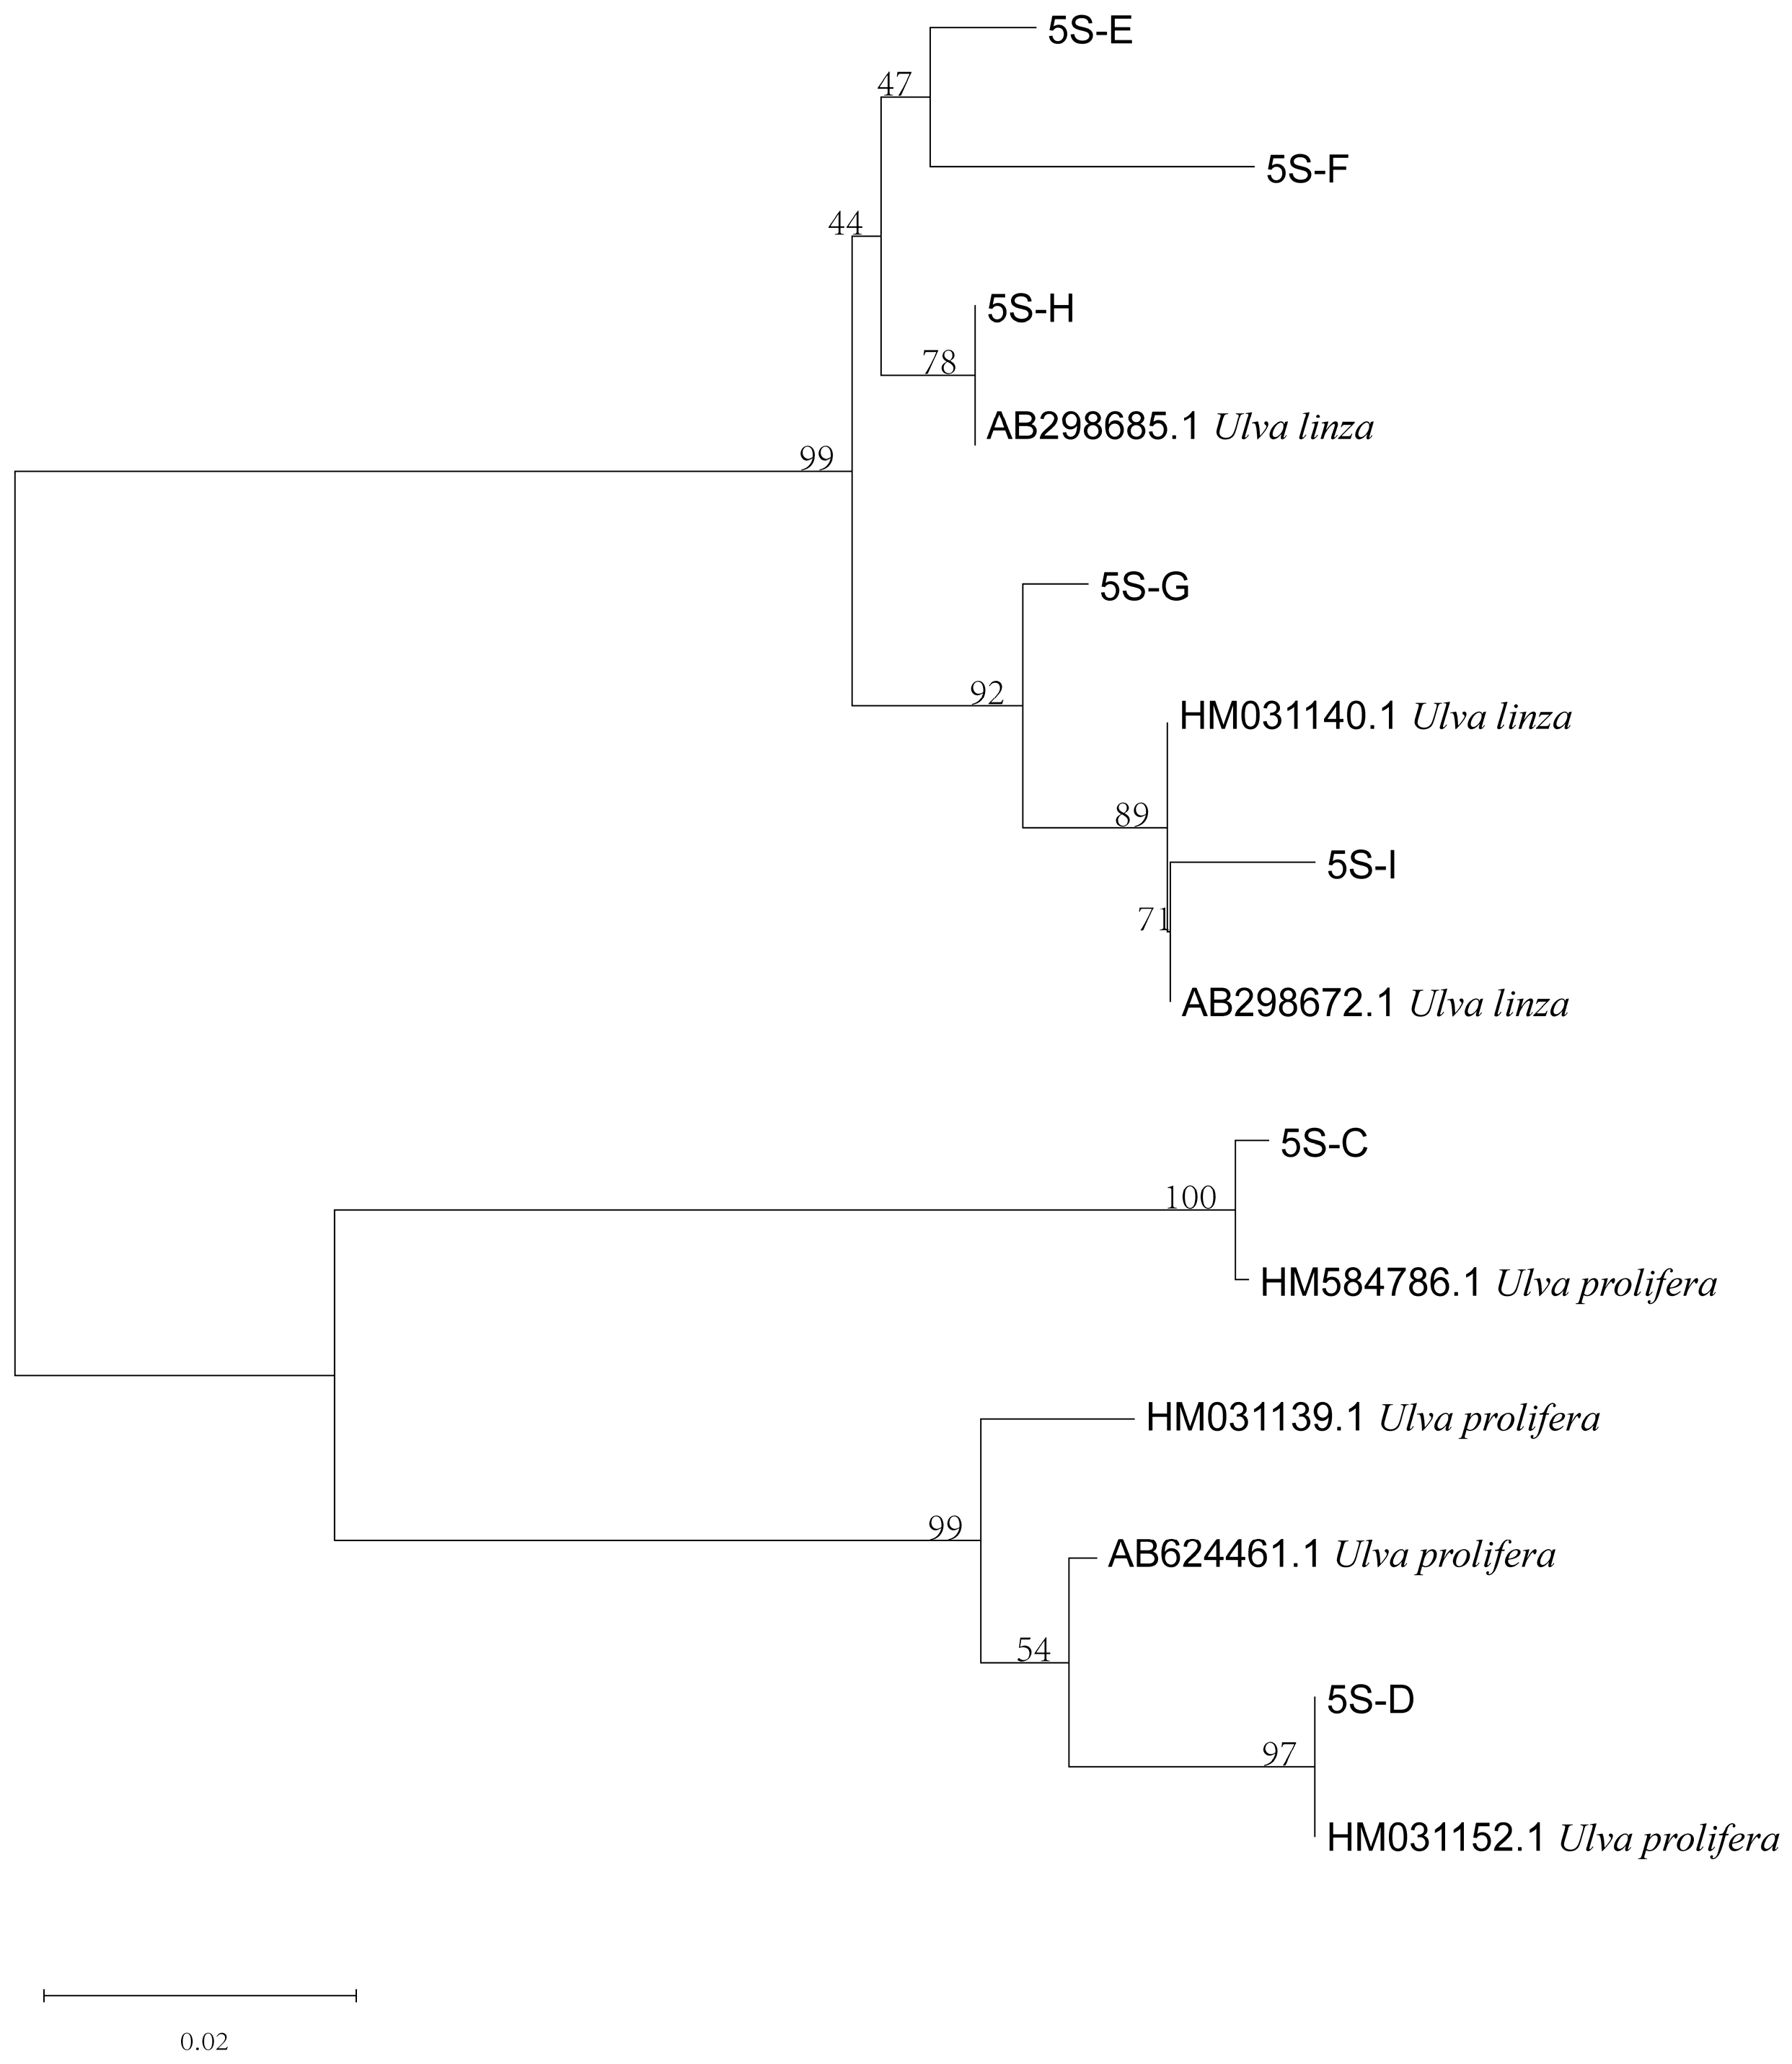
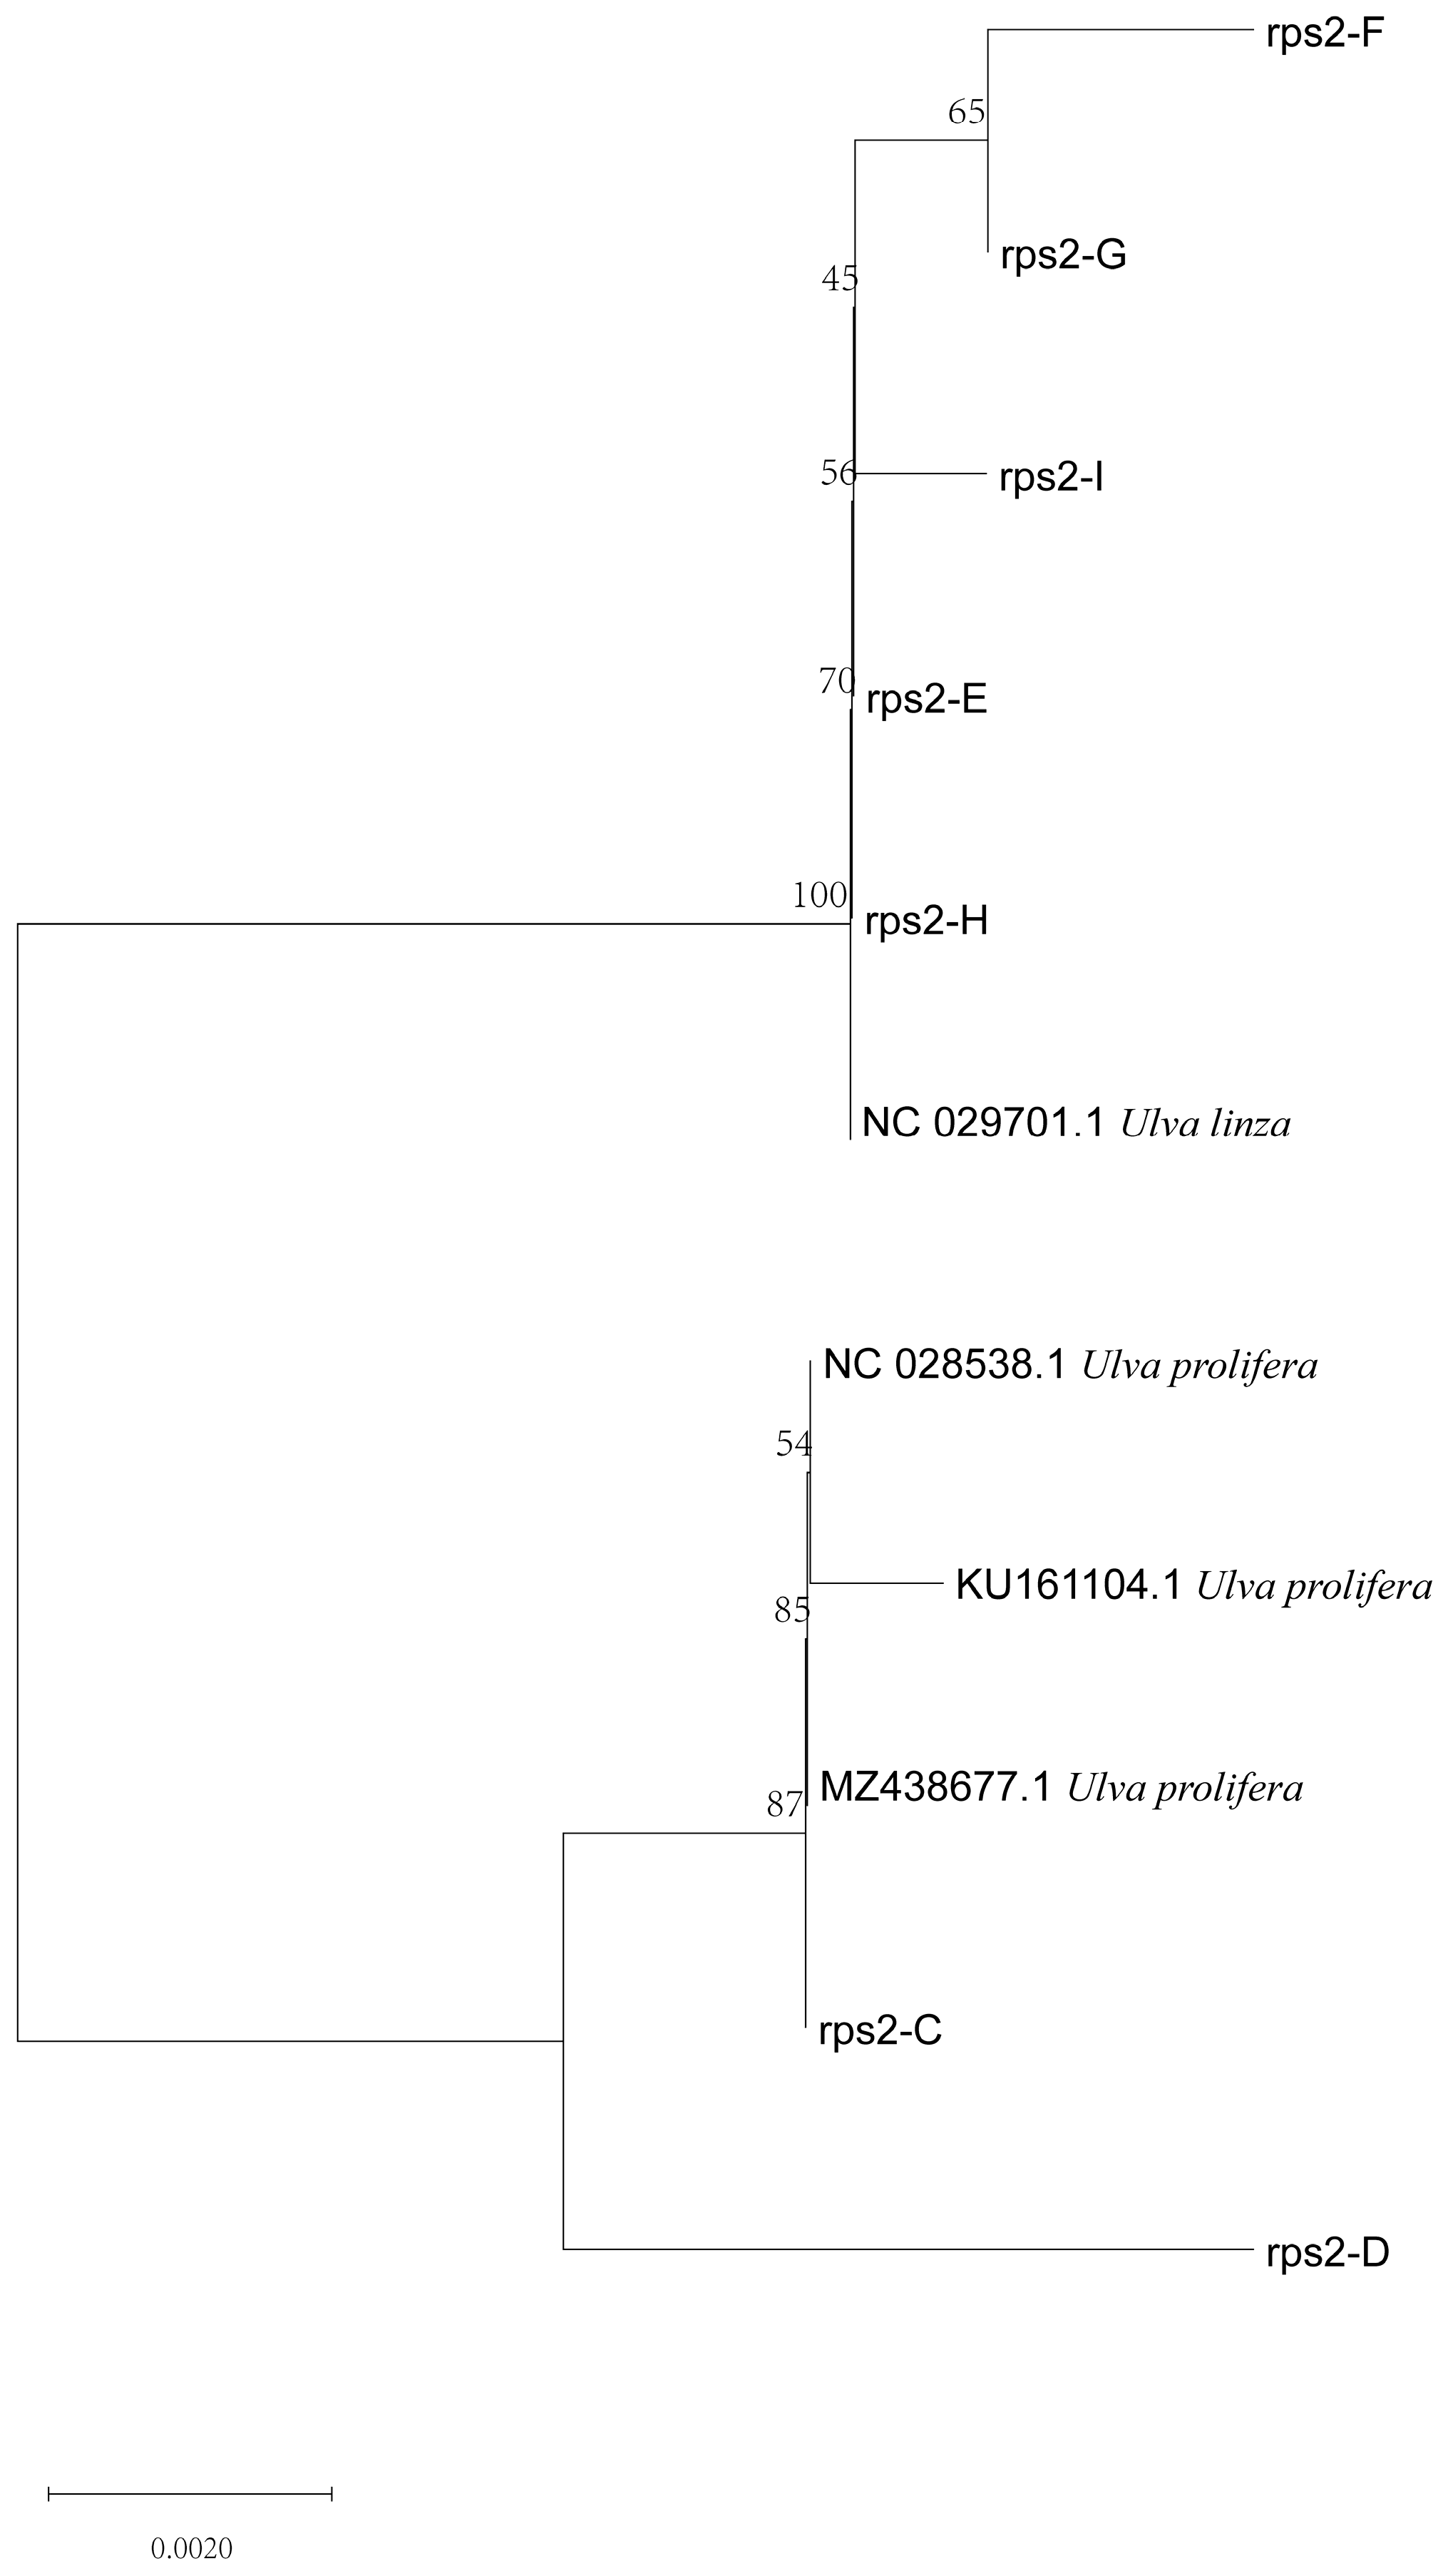
Furthermore, to verify the reliability of the rps2-F/rps-R primers, we attempted to use ITS primers combined with rps2 primers to identify unknown samples (C–I). The phylogenetic tree based on the ITS sequences (Figure 5) indicated that samples C to I were all located on the LPP clade, which illustrated that they should be distinguished further by 5S rDNA spacer region or rps2 gene fragment. Therefore, we constructed two phylogenetic trees, respectively. The phylogenetic tree based on the 5S rDNA spacer region clearly displayed that samples C and D were gathered in the U. prolifera clade, and other samples were located in the U. linza clade (Figure 6); the phylogenetic tree based on the rps2 gene fragment demonstrated the same results (Figure 7), which illustrates that the rps2 primers can be used to distinguish between U. prolifera and U. linza, like 5S primers.
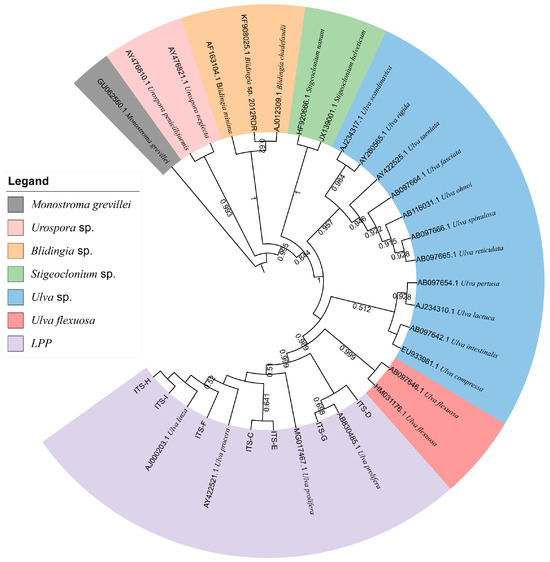
Figure 5.
Phylogenetic tree based on ITS sequences of algae samples C to I. Monostroma grevillea (GU062560.1) was set as the outgroup.
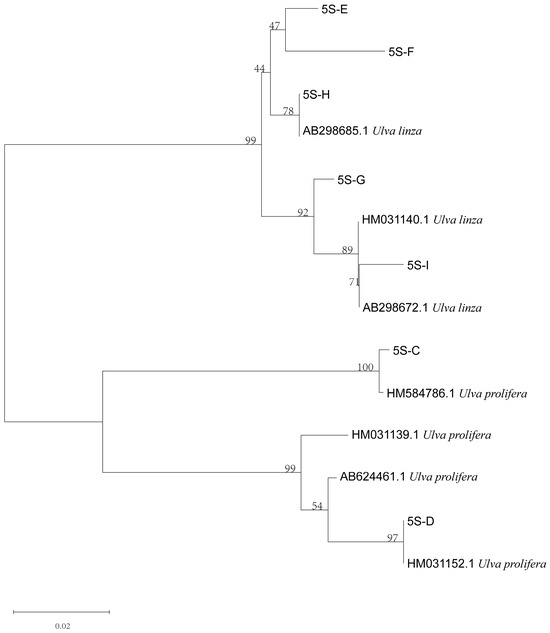
Figure 6.
Phylogenetic tree based on 5S rDNA interspace of algae samples C to I.

Figure 7.
Phylogenetic tree based on rps2 gene fragment algae samples C to I.
4. Discussion
The mainstream molecular identification method of green tide algae was ITS-5S PCR method. The ITS sequence can distinguish the most of Ulva spp. but can hardly distinguish the LPP (Ulva linza–procera–prolifera) complex, and the 5S rDNA spacer can distinguish the U. linza and U. prolifera exactly. Therefore, this method has been widely used in species identification of green tide algae for over a decade [11,13,14]. However, in the practice, we found that the 5S rDNA spacer of many macroalgae is difficult to amplify, except for floating free U. prolifera, and the electrophoretic results often show dispersion bands. In response to the challenging situation, Zhang et al. [8] designed two probes (5S-1 and 5S-2) for the rapid detection of Ulva green algae, and only U. prolifera could be labeled with both probes. At the meantime, probe 5S-1 displayed a higher labeling efficiency on U. prolifera and was selected as the probe for the FISH detection. The FISH method could be applied to qualitative and quantitative analysis of field samples, but the disadvantages of the method are the higher cost, complicated hybridization reaction procedure, and specific testing instrument. The probe should be labeled with fluorescein isothiocyanate, and hence the cost has increased. The FISH protocol was involved in the fragmentation, fixation, dehydration, pre-hybridization, and hybridization of the samples, so the protocol was very cumbersome and error-prone. Finally, the hybridized algal pieces should be observed under a fluorescence microscope, which is not necessarily available in every laboratory. Thus, it is clear that the FISH method is not suitable for conventional laboratories.
Another marker (rps2-trnL-F1/rps2-trnL-R1) for the detection of green macroalgae based on the mitochondrial genome, for which the amplified products were the gene interspace region sequence between the rps2 and trnL genes, could perfectly distinguish the Ulva macroalgae: U. prolifera, U. linza, U. compressa, and U. flexuosa [15]. When the samples contain more species, the identification of samples cannot solely rely on the phylogenetic tree based on rps2-trnL space sequences [18]. Of course, we speculate that if more mitochondrial genome information of green macroalgae is added to the GenBank database, this problem will be solved. However, the sequences amplified by primer pairs rps2-trnL-F1/rps2-trnL-R1 or rps2-trnL-F2/rps2-trnL-R2 are intergenic sequences between rps2 and trnL genes. It is well known that noncoding sequences are highly susceptible to mutation. Hence, the length and sequence of product of the PCR amplification are variable, which affects the final identification result.
In this research, we designed one pair of primers (rps2-F/rps2-R) based on the CDS of mitochondrial rps2 gene to distinguish between U. linza and U. prolifera to replace 5S primers. The amplified product is a single band (Supplementary Figure S1), which signifies that the specificity of the primers is very good. As for the 5S rDNA space sequence, PCR amplification products using the primers (5S-F and 5S-R) often result in multiple bands, and the shortest DNA fragment was used as the target product [10,12], which means that the specification of 5S-F/5S-R primers is very weak and greatly affects the identification result.
In addition, the phylogenetic tree based on the rps2 gene fragment clearly revealed that the different algae were located in the U. linza and U. prolifera clades, respectively (Figure 4 and Figure 7), which is the same as with the phylogenetic tree based on 5S rDNA spacer (Figure 3 and Figure 6). Therefore, we regarded the primers (rps2-F/rps2-R) as a good substitution for 5S primers. Of course, the results of rps2 gene fragment cannot decide the ecological subtype of green algae since the subtype was divided by the 5S rDNA spacer [19].
5. Conclusions
A mitochondrial marker, the rps2-F/rps2-R primer pair, can be amplified successfully and used to distinguish U. prolifera and U. linza clearly under the premise of the identification by the ITS sequence.
Supplementary Materials
The following supporting information can be downloaded at: https://www.mdpi.com/article/10.3390/jmse13040632/s1, Figure S1: The PCR amplified products of sample A and B by primers rps2-F and rps2-R.
Author Contributions
R.Z., C.T. and S.W. were mainly responsible for the sample collection, molecular identification and data analysis. G.C. designed the research and wrote the manuscript. J.M., X.L. and J.X. reviewed the manuscript. All authors have read and agreed to the published version of the manuscript.
Funding
This study was supported by Jiangsu Qinglan, Lianyungang 521 Talent Projects (LYG06521202397 and LYG06521202129), the Jiangsu Marine Science and Technology Innovation Project (JSZRHYKJ202206), the Doctoral Research Initiation Fund of Jiangsu Ocean University (KQ21005), the Open-end Funds of Jiangsu Key Laboratory of Marine Biotechnology, Jiangsu Ocean University (HS2023003), and the Priority Academic Program Development of Jiangsu Higher Education Institutions.
Institutional Review Board Statement
All data were collected from the public available databases on the internet, and not involved any biological materials or specimens. The experiments complied with current Chinese laws.
Data Availability Statement
The data within the current manuscript are available from the corresponding author upon reasonable request.
Acknowledgments
We thank Li Huan (the Institute of Oceanology, Chinese Academy of Sciences) for providing the green macroalgae (sample E to I) to verify the reliability of the mitochondrial marker.
Conflicts of Interest
The authors declare no conflicts of interest.
Abbreviations
| ITS | internal transcribed spacer |
| rps2 | ribosomal protein S2 |
| U. linza | Ulva linza |
| U. prolifera | Ulva prolifera |
| LPP | Ulva linza–procera–prolifera |
| CDS | coding sequence |
References
- Valiela, I.; McClelland, J.; Hauxwell, J.; Behr, P.J.; Hersh, D.; Foreman, K. Macroalgal blooms in shallow estuaries: Controls and ecophysiological and ecosystem consequences. Limnol. Oceanogr. 1997, 42 Pt 2, 1105–1118. [Google Scholar] [CrossRef]
- Liu, D.; Keesing, J.K.; Xing, Q.; Shi, P. World’s largest macroalgal bloom caused by expansion of seaweed aquaculture in China. Mar. Pollut. Bull. 2009, 58, 888–895. [Google Scholar] [CrossRef] [PubMed]
- Liu, D.; Keesing, J.K.; He, P.; Wang, Z.; Shi, Y.; Wang, Y. The world’s largest macroalgal bloom in the Yellow Sea, China: Formation and implications. Estuar. Coast. Shelf Sci. 2013, 129, 2–10. [Google Scholar] [CrossRef]
- Smetacek, V.; Zingone, A. Green and golden seaweed tides on the rise. Nature 2013, 504, 84–88. [Google Scholar] [CrossRef] [PubMed]
- Wang, Z.; Xiao, J.; Fan, S.; Li, Y.; Liu, X.; Liu, D. Who made the world’s largest green tide in China?—An integrated study on the initiation and early development of the green tide in Yellow Sea. Limnol. Oceanogr. 2015, 60, 1105–1117. [Google Scholar] [CrossRef]
- Shan, J.; Li, J.; Xu, Z. Estimating ecological damage caused by green tides in the Yellow Sea: A choice experiment approach incorporating extended theory of planned behavior. Ocean Coast. Manag. 2019, 181, 104901. [Google Scholar] [CrossRef]
- Blomster, J.; Bäck, S.; Fewer, D.P.; Kiirikki, M.; Lehvo, A.; Maggs, C.A.; Stanhope, M.J. Novel morphology in Enteromorpha (Ulvophyceae) forming green tides. Am. J. Bot. 2002, 89, 1756–1763. [Google Scholar] [CrossRef] [PubMed]
- Zhang, Q.-C.; Liu, Q.; Kang, Z.-J.; Yu, R.-C.; Yan, T.; Zhou, M.-J. Development of a fluorescence in situ hybridization (FISH) method for rapid detection of Ulva prolifera. Estuar. Coast. Shelf Sci. 2015, 163, 103–111. [Google Scholar] [CrossRef]
- Duan, W.; Guo, L.; Sun, D.; Zhu, S.; Chen, X.; Zhu, W.; Xu, T.; Chen, C. Morphological and molecular characterization of free-floating and attached green macroalgae Ulva spp. in the Yellow Sea of China. J. Appl. Phycol. 2012, 24, 97–108. [Google Scholar] [CrossRef]
- Shimada, S.; Yokoyama, N.; Arai, S.; Hiraoka, M. Phylogeography of the genus Ulva (Ulvophyceae, Chlorophyta), with special reference to the Japanese freshwater and brackish taxa. J. Appl. Phycol. 2008, 20, 979–989. [Google Scholar] [CrossRef]
- Zhang, Q.-C.; Yu, R.-C.; Chen, Z.-F.; Qiu, L.-M.; Wang, Y.-F.; Kong, F.-Z.; Geng, H.-X.; Zhao, Y.; Jiang, P.; Yan, T.; et al. Genetic evidence in tracking the origin of Ulva prolifera blooms in the Yellow Sea, China. Harmful Algae 2018, 78, 86–94. [Google Scholar] [CrossRef] [PubMed]
- Han, W.; Chen, L.P.; Zhang, J.H.; Tian, X.L.; Hua, L.; He, Q.; Huo, Y.Z.; Yu, K.F.; Shi, D.J.; Ma, J.H.; et al. Seasonal variation of dominant free-floating and attached Ulva species in Rudong coastal area, China. Harmful Algae 2013, 28, 46–54. [Google Scholar] [CrossRef]
- Shen, Q.; Li, H.; Li, Y.; Wang, Z.; Liu, J.; Yang, W. Molecular identification of green algae from the rafts based infrastructure of Porphyra yezoensis. Mar. Pollut. Bull. 2012, 64, 2077–2082. [Google Scholar] [CrossRef] [PubMed]
- Zhang, J.; Liu, C.; Yang, L.; Gao, S.; Ji, X.; Huo, Y.; Yu, K.; Xu, R.; He, P. The source of the Ulva blooms in the East China Sea by the combination of morphological, molecular and numerical analysis. Estuar. Coast. Shelf Sci. 2015, 164, 418–424. [Google Scholar] [CrossRef]
- Liu, J.; Zhao, X.; Kang, X.; Zhuang, M.; Ding, X.; Zhao, L.; Wen, Q.; Zhu, Y.; Gu, K.; Bao, Q.; et al. Good news: We can identify Ulva species erupted in the Yellow Sea more easily and cheaply now. Conserv Genet Resour 2020, 12, 447–449. [Google Scholar] [CrossRef]
- Kumar, S.; Stecher, G.; Tamura, K. MEGA7: Molecular Evolutionary Genetics Analysis version 7.0 for bigger datasets. Mol. Biol. Evol. 2016, 33, 1870–1874. [Google Scholar] [CrossRef] [PubMed]
- Leliaert, F.; Zhang, X.; Ye, N.; Malta, E.; Engelen, A.H.; Mineur, F.; Verbruggen, H.; De Clerck, O. Research note: Identity of the Qingdao algal bloom. Phycol. Res. 2009, 57, 147–151. [Google Scholar] [CrossRef]
- Liu, J.; Tong, Y.; Xia, J.; Sun, Y.; Zhao, X.; Sun, J.; Zhao, S.; Zhuang, M.; Zhang, J.; He, P. Ulva macroalgae within local aquaculture ponds along the estuary of Dagu River, Jiaozhou Bay, Qingdao. Mar. Pollut. Bull. 2022, 174, 113243. [Google Scholar] [CrossRef] [PubMed]
- Wang, S.; Huo, Y.; Zhang, J.; Cui, J.; Wang, Y.; Yang, L.; Zhou, Q.; Lu, Y.; Yu, K.; He, P. Variations of dominant free-floating Ulva species in the source area for the world’s largest macroalgal blooms, China: Differences of ecological tolerance. Harmful Algae 2018, 74, 58–66. [Google Scholar] [CrossRef] [PubMed]

Disclaimer/Publisher’s Note: The statements, opinions and data contained in all publications are solely those of the individual author(s) and contributor(s) and not of MDPI and/or the editor(s). MDPI and/or the editor(s) disclaim responsibility for any injury to people or property resulting from any ideas, methods, instructions or products referred to in the content. |
© 2025 by the authors. Licensee MDPI, Basel, Switzerland. This article is an open access article distributed under the terms and conditions of the Creative Commons Attribution (CC BY) license (https://creativecommons.org/licenses/by/4.0/).