Abstract
Monitoring the top-tension of mooring lines is essential for ensuring the safe operation of floating units. This study aims to propose an innovative hybrid method combining measured motions of Floating Production Storage and Offloading Vessels (FPSO) with numerical models to estimate mooring line top-tensions using artificial neural networks. The inconsistency in numerical results of FPSO motions, attributed to the loss of clump weights on mooring lines, necessitates the development of an inversion method employing genetic algorithms. This method identifies the loss of clump weights in the mooring system by utilizing field-measured FPSO motion data to update the numerical model. The results demonstrate that, after detecting clump weight loss, the relative error of the maximum horizontal displacement between the simulated submerged turret production and the measured values is reduced to less than 5%. With the updated model in place, numerical simulations are conducted to map measurable motions and unmeasurable mooring line top-tensions. To achieve precise real-time predictions of mooring line top-tensions, a Long Short-Term Memory (LSTM) neural network is deployed, using the measured FPSO motions as input data. This approach enables highly accurate predictions of mooring line top-tensions.
1. Introduction
Floating production units (FPUs), which encompass semi-submersible platforms, Floating Production Storage and Offloading Vessels (FPSOs), and similar structures, play a central role in offshore oil development in deep and ultra-deep waters. The mooring system serves as the critical component for positioning these FPUs. Any damage to the mooring system causes severe economic losses and environmental pollution, so it is crucial to monitor the tension of mooring lines to prevent potential damage. However, installing monitoring equipment directly on mooring lines at offshore sites can be prohibitively expensive. Furthermore, monitoring equipment, such as inclinometers and tensiometers, is susceptible to damage in rough sea conditions, resulting in intermittent data collection. In situations where mooring systems lack monitoring equipment altogether, effectively assessing the unmeasurable tension of mooring lines poses a considerable challenge.
For variables that cannot be measured directly, the mapping of measurable and unmeasurable variables should be established first. Kaneko et al. used a physics-based model utilizing physical knowledge to map the measurable surface weight on bit to unmeasurable downhole weight on bit for a deep-water offshore drilling system [1]. Owing to the nonlinear effects of the dynamic behavior of mooring systems, detailed numerical simulations in the time domain are required to assess accurate mooring line dynamics. Nevertheless, time domain simulation of nonlinear systems can be computationally costly. Artificial neural networks (ANNs), which also have a nonlinear solid mapping ability, are used to study the dynamic behaviors of mooring lines. For instance, Simoes et al. utilized a time series-based neural network to predict mooring line forces, utilizing experimental data such as the heading, position, speed, and yaw rate of FPSO [2]. This approach harnessed ANNs to model and predict the complex behavior of mooring lines. In the realm of mooring line and riser analysis and design, de Pina et al. introduced a novel surrogate model based on ANNs, resulting in substantial reductions in processing time [3]. This surrogate model allows for efficient analysis and design processes while still accounting for the intricate dynamics of mooring systems.
In recent years, a hybrid method combining FEM with ANN has been proposed to predict mooring line responses. Kim used the dataset obtained from nonlinear finite element analysis to train the neural network and predicted the time series of a slender marine structure’s dynamics [4]. Researchers obtained unmeasurable mooring line top-tension by numerical simulations first and then developed different neural networks to predict the mooring line top-tension [5,6,7]. The hybrid method combining ANN and FEM can also effectively reduce the high computational cost of FEM. Guarize et al. observed that the hybrid ANN-FEM approach can accurately predict longer time series of mooring line responses and reduce calculation time [8]. Christiansen et al. also found that the ANN with high precision provides mooring line top-tension force histories approximately two orders of magnitude faster than a complete dynamic analysis through similar work [9].
However, the numerical model cannot always reflect the practical condition of mooring systems. Clump weights are usually installed on mooring lines to improve mooring performance. Ji et al. applied clump weights to the lower ends of taut lines and found that the offset of the semi-submersible and the line tensions were significantly reduced [10]. This combined mooring system was proved to be applicable for a wide range of water depths by Yuan et al. [11] and later improved by Yuan et al. [12]. However, due to large reciprocating offsets of FPUs under harsh sea states, clump weights attached to mooring lines are lifted off and hit the seafloor periodically, which may cause clump weights to fall off. The loss of clump weights changes the mechanical properties of mooring lines, which affects the dynamic response of the mooring system and FPSO. This results in differences between the measured and simulated data. Hence, it is necessary to modify the numerical model to account for the loss of clump weights in mooring systems in advance.
However, there are few studies about the effect of the loss of clump weights on using numerical simulation data to predict mooring line dynamics. Fortunately, there are some works using measured data for parameter identification. Lee et al. proposed a deep-learning-based approach that can detect underwater mooring line damage based on the real-time monitored response data of floating structures [13]. This kind of method of using on-site monitoring data of the structure under the actual load to analyze the calculation parameters used in forward analysis is called inverse analysis. Inverse analysis can not only identify structural parameters [14,15], but also calibrate the model [16]. Usually, inverse analysis is performed by minimizing the difference between the calculated and measured response. The minimization process can also be described as an optimization problem. As an adaptive global optimization search algorithm that simulates the genetic and evolutionary process of organisms in the natural environment [17], the Genetic Algorithm (GA) is widely used in the fields of combinatorial optimization and other fields [18]. Researchers successively used a genetic algorithm to optimize mooring system parameters [19,20,21].
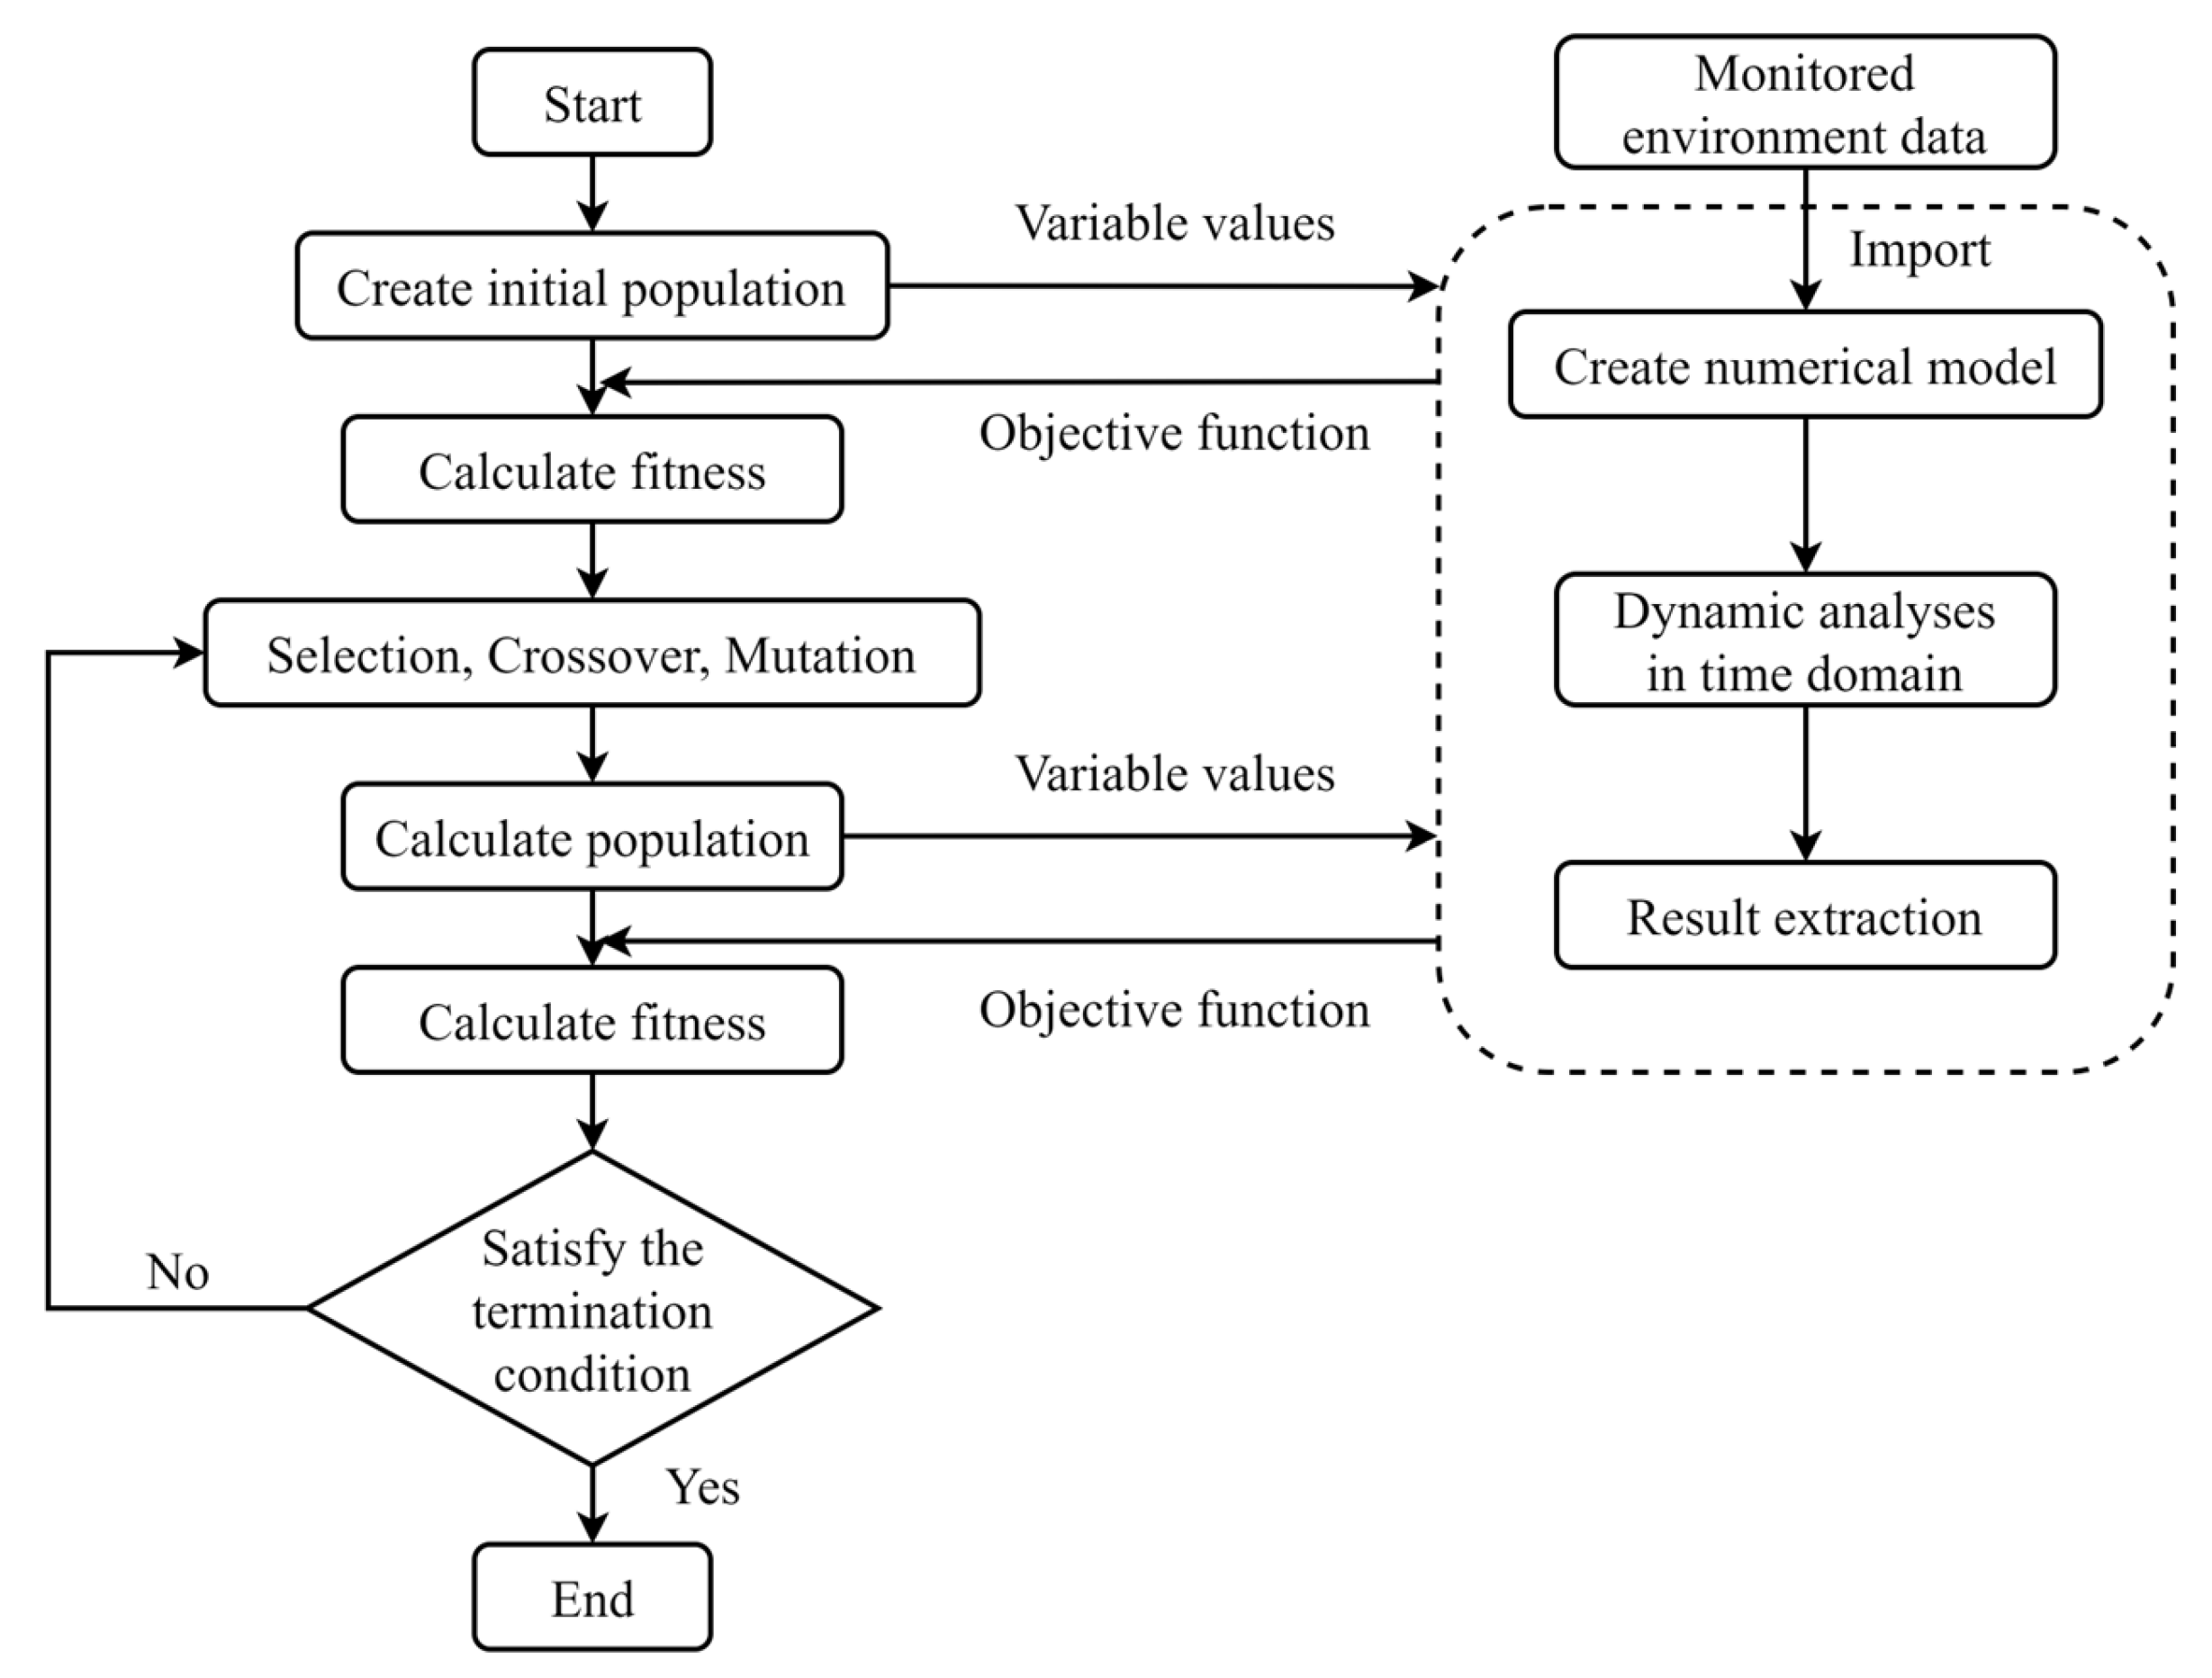
It is acknowledged that, currently, the monitored data of FPU six DOF motions obtained by GPS (Global Positioning System) technology are usually more stable than those of the mooring line tensions. In this work, a novel hybrid method which combines measured data with coupled numerical calculation and ANN is proposed to estimate mooring line top-tensions when monitoring equipment is not available. Aiming to predict the mooring line tension more accurately, an inverse analysis method based on a genetic algorithm is proposed to identify the loss of clump weights first. Based on the optimized model obtained after identification, the mooring line tension response is simulated using the measured six DOF motions as the forced excitation at the top of the mooring lines. The mooring line top-tensions are used for training a Long Short-Term Memory (LSTM) neural network to predict the unmeasurable mooring line top-tension in this work. Moreover, the flowchart is shown in Figure 1.
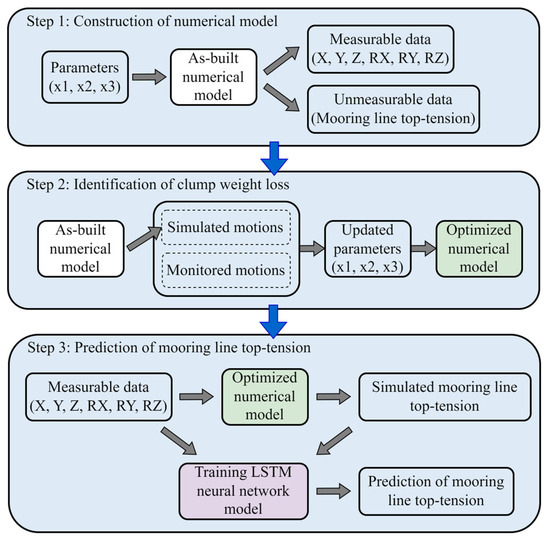
Figure 1.
Flowchart of methodology.
In what follows, the numerical model of the FPSO and mooring system is presented and the simulation method of clump weight loss is introduced in Section 2, which is followed by the effect of clump weight loss on the response of the FPSO and mooring system. Subsequently, to identify the loss of clump weights using the measured data, we propose an inverse analysis method based on a genetic algorithm. In Section 5, an LSTM neural network model is presented to predict the unmeasurable mooring line top-tension with the input of six DOF motions. Finally, we conclude our study with discussions and summarize our findings in the concluding section.
2. Numerical Model
2.1. FPSO and Its Mooring System
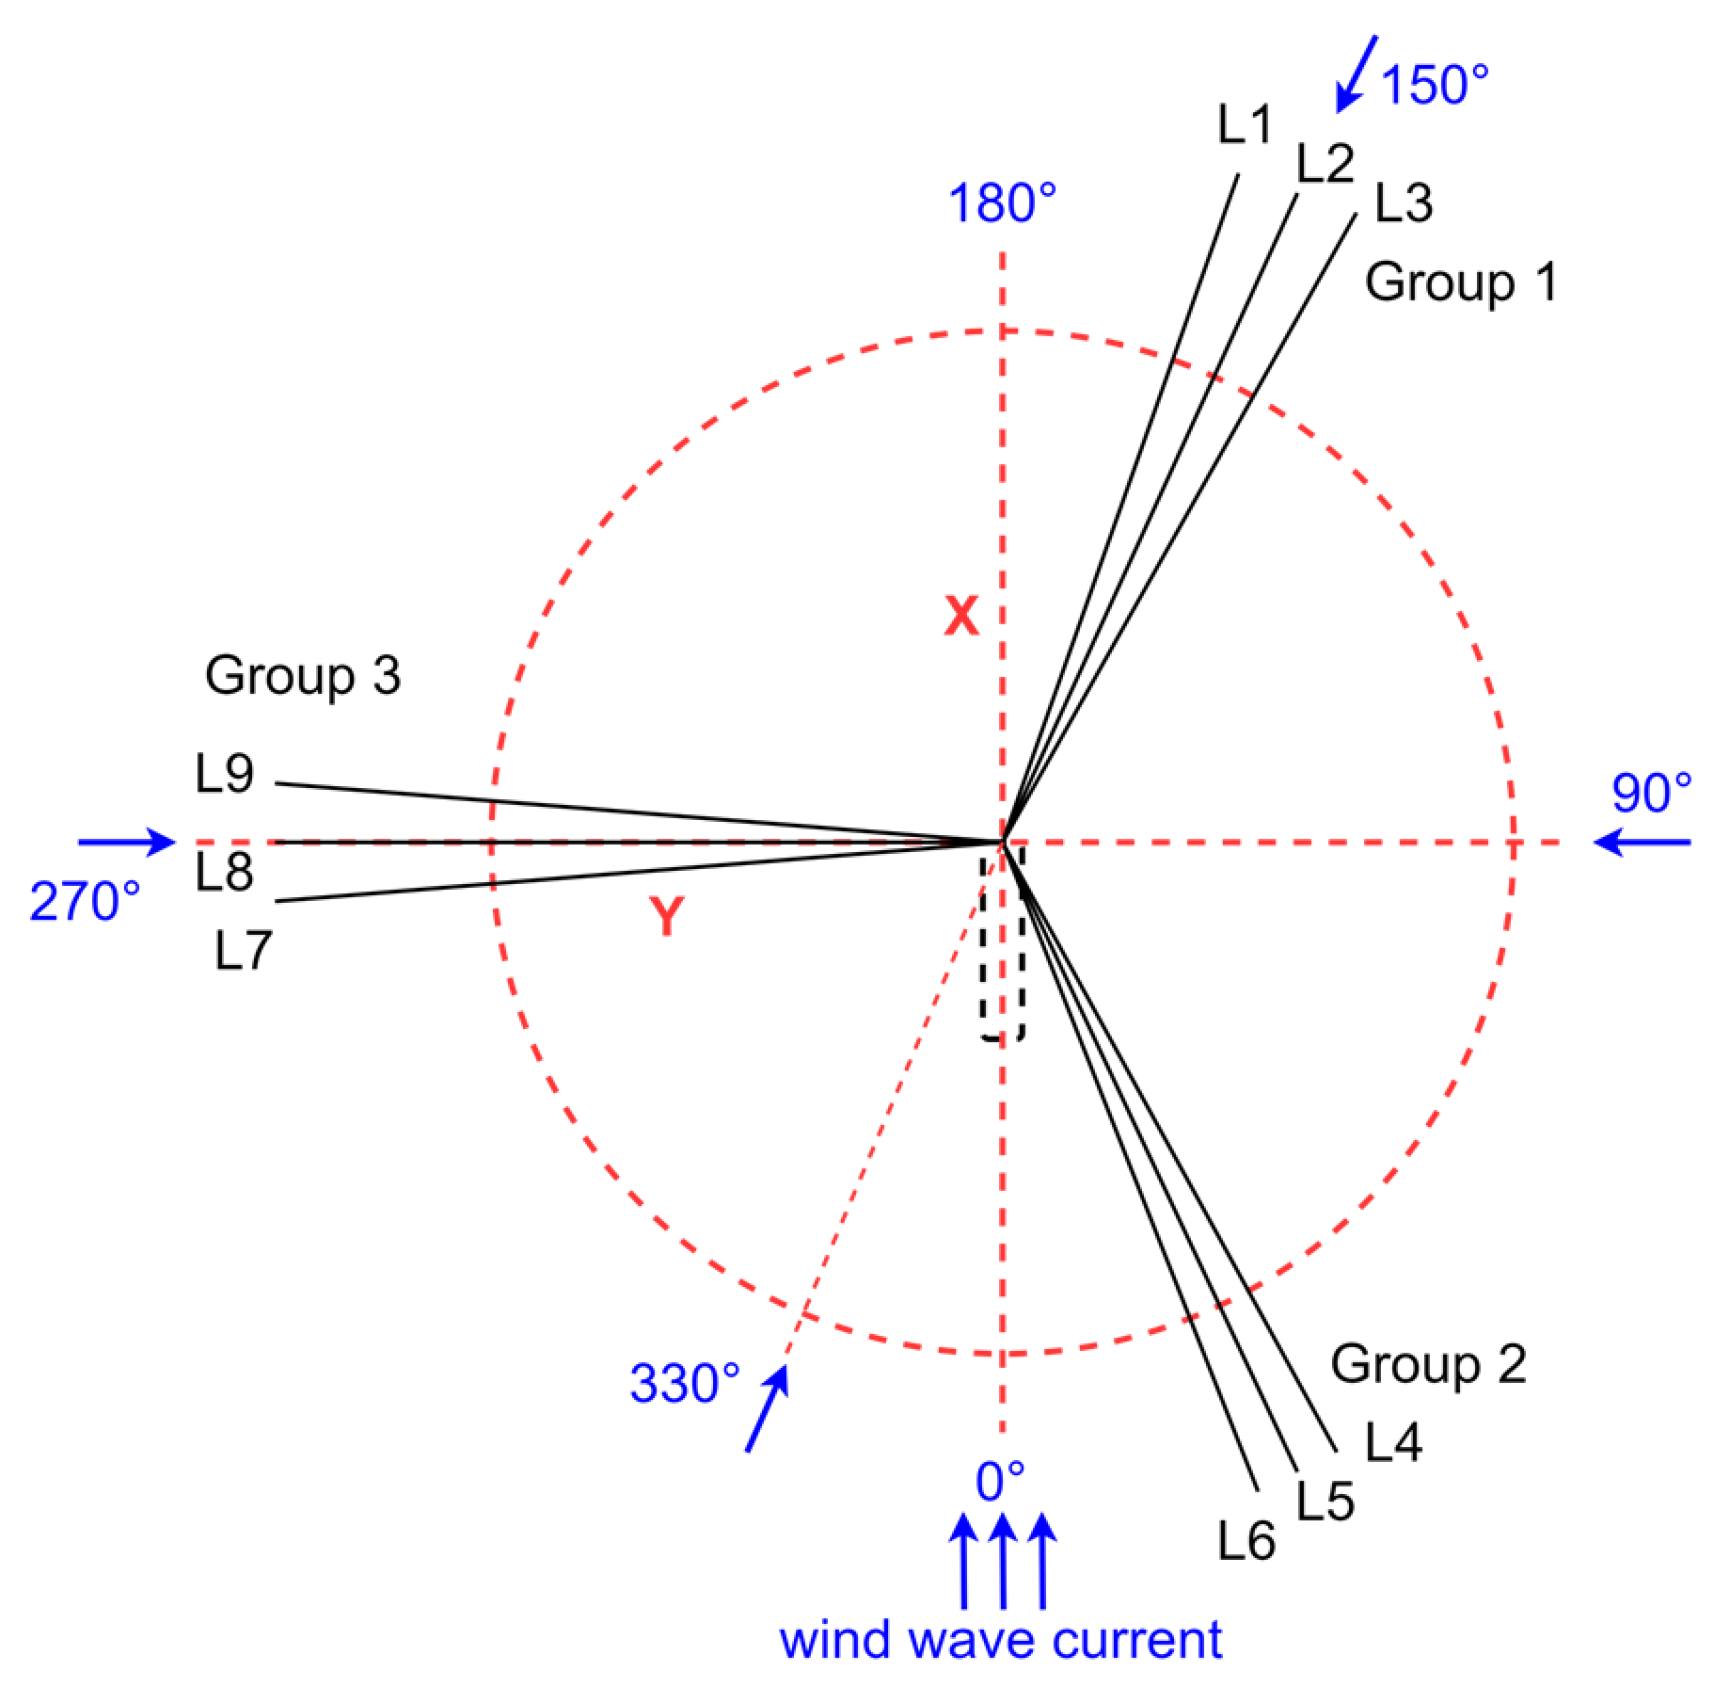
In this study, we conduct an analysis of a turret-moored FPSO system operating within the South China Sea, situated at a water depth of 105 m. The target FPSO has a length of 250 m between the vertical lines, a width of 46 m, and a depth of 24.6 m. The displacement of the FPSO under the full load is 176,000 tons, and the draft is 16.5 m. The mooring system is connected to FPSO by the STP buoy. This FPSO is equipped with a 3 × 3 legged mooring system, as visually depicted in Figure 2. Notably, there is an angular separation of 120 degrees between the centers of the line groups, with each group featuring an internal angle of 5 degrees between individual lines. The schematic diagram of the layout of clump weights is shown in Figure 3.
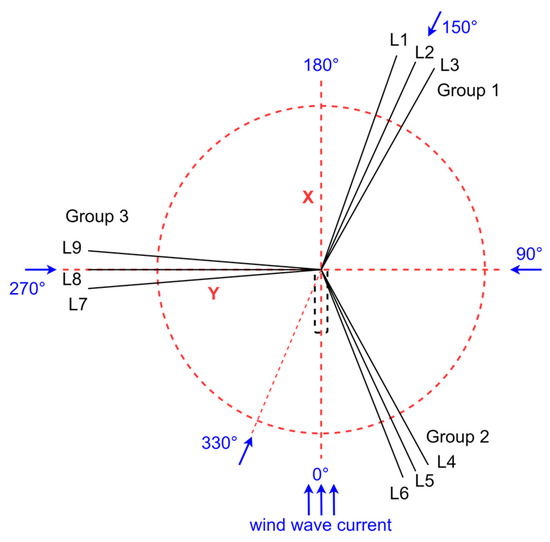
Figure 2.
Mooring system layout.
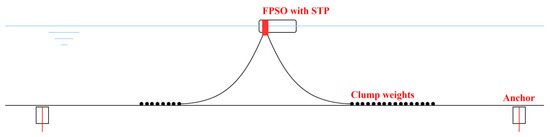
Figure 3.
Mooring system attached with clump weights.
Table 1 shows the 100-year return period of environmental conditions where the FPSO is located, whereby the wave spectrum adopted is JONSWAP. The FPSO wet surface model is established for hydrodynamic analysis, and the FPSO–mooring system coupled model is established for dynamic coupling analysis in time domain using OrcaFlex 10.3.

Table 1.
The 100-year return period of environmental conditions.
2.2. Simulation Method of Clump Weight Loss
Floats or buoyancy modules attached to a line can be modeled with discrete buoyant clumps attached at the relevant points. However, when several floats are supporting a length of line, it is recommended to model the buoyancy as if it were smeared equivalently, i.e., spread out evenly, along that part of the line [12]. Properties of the new line type are equivalent to those of the original line plus floats combined. This is carried out by spreading each float’s buoyancy, drag, etc. uniformly over the length of the line from sf/2 before the float center to sf/2 after the float center, where sf is the float pitch, i.e., the spacing between float centers as shown in Figure 4. The result is an isotropic circular cross section line which will experience the same forces per unit length as the original line along with its attached floats.
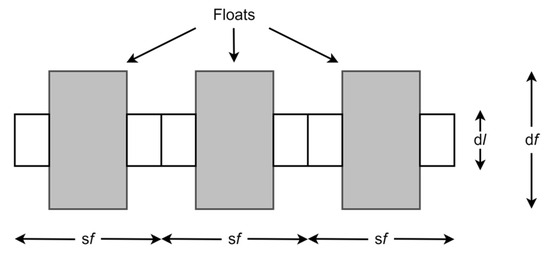
Figure 4.
Geometry of line with floats.
Consequently, for modeling purposes, clump weights are treated using an equivalency method that entails uniformly distributing their characteristics along the length of the line. The equivalent length of one clump weight is the spacing between clump weight centers, which is 6 m in this mooring system.
3. Sensitivity Analyses of Clump Weight Loss
3.1. Static Analyses
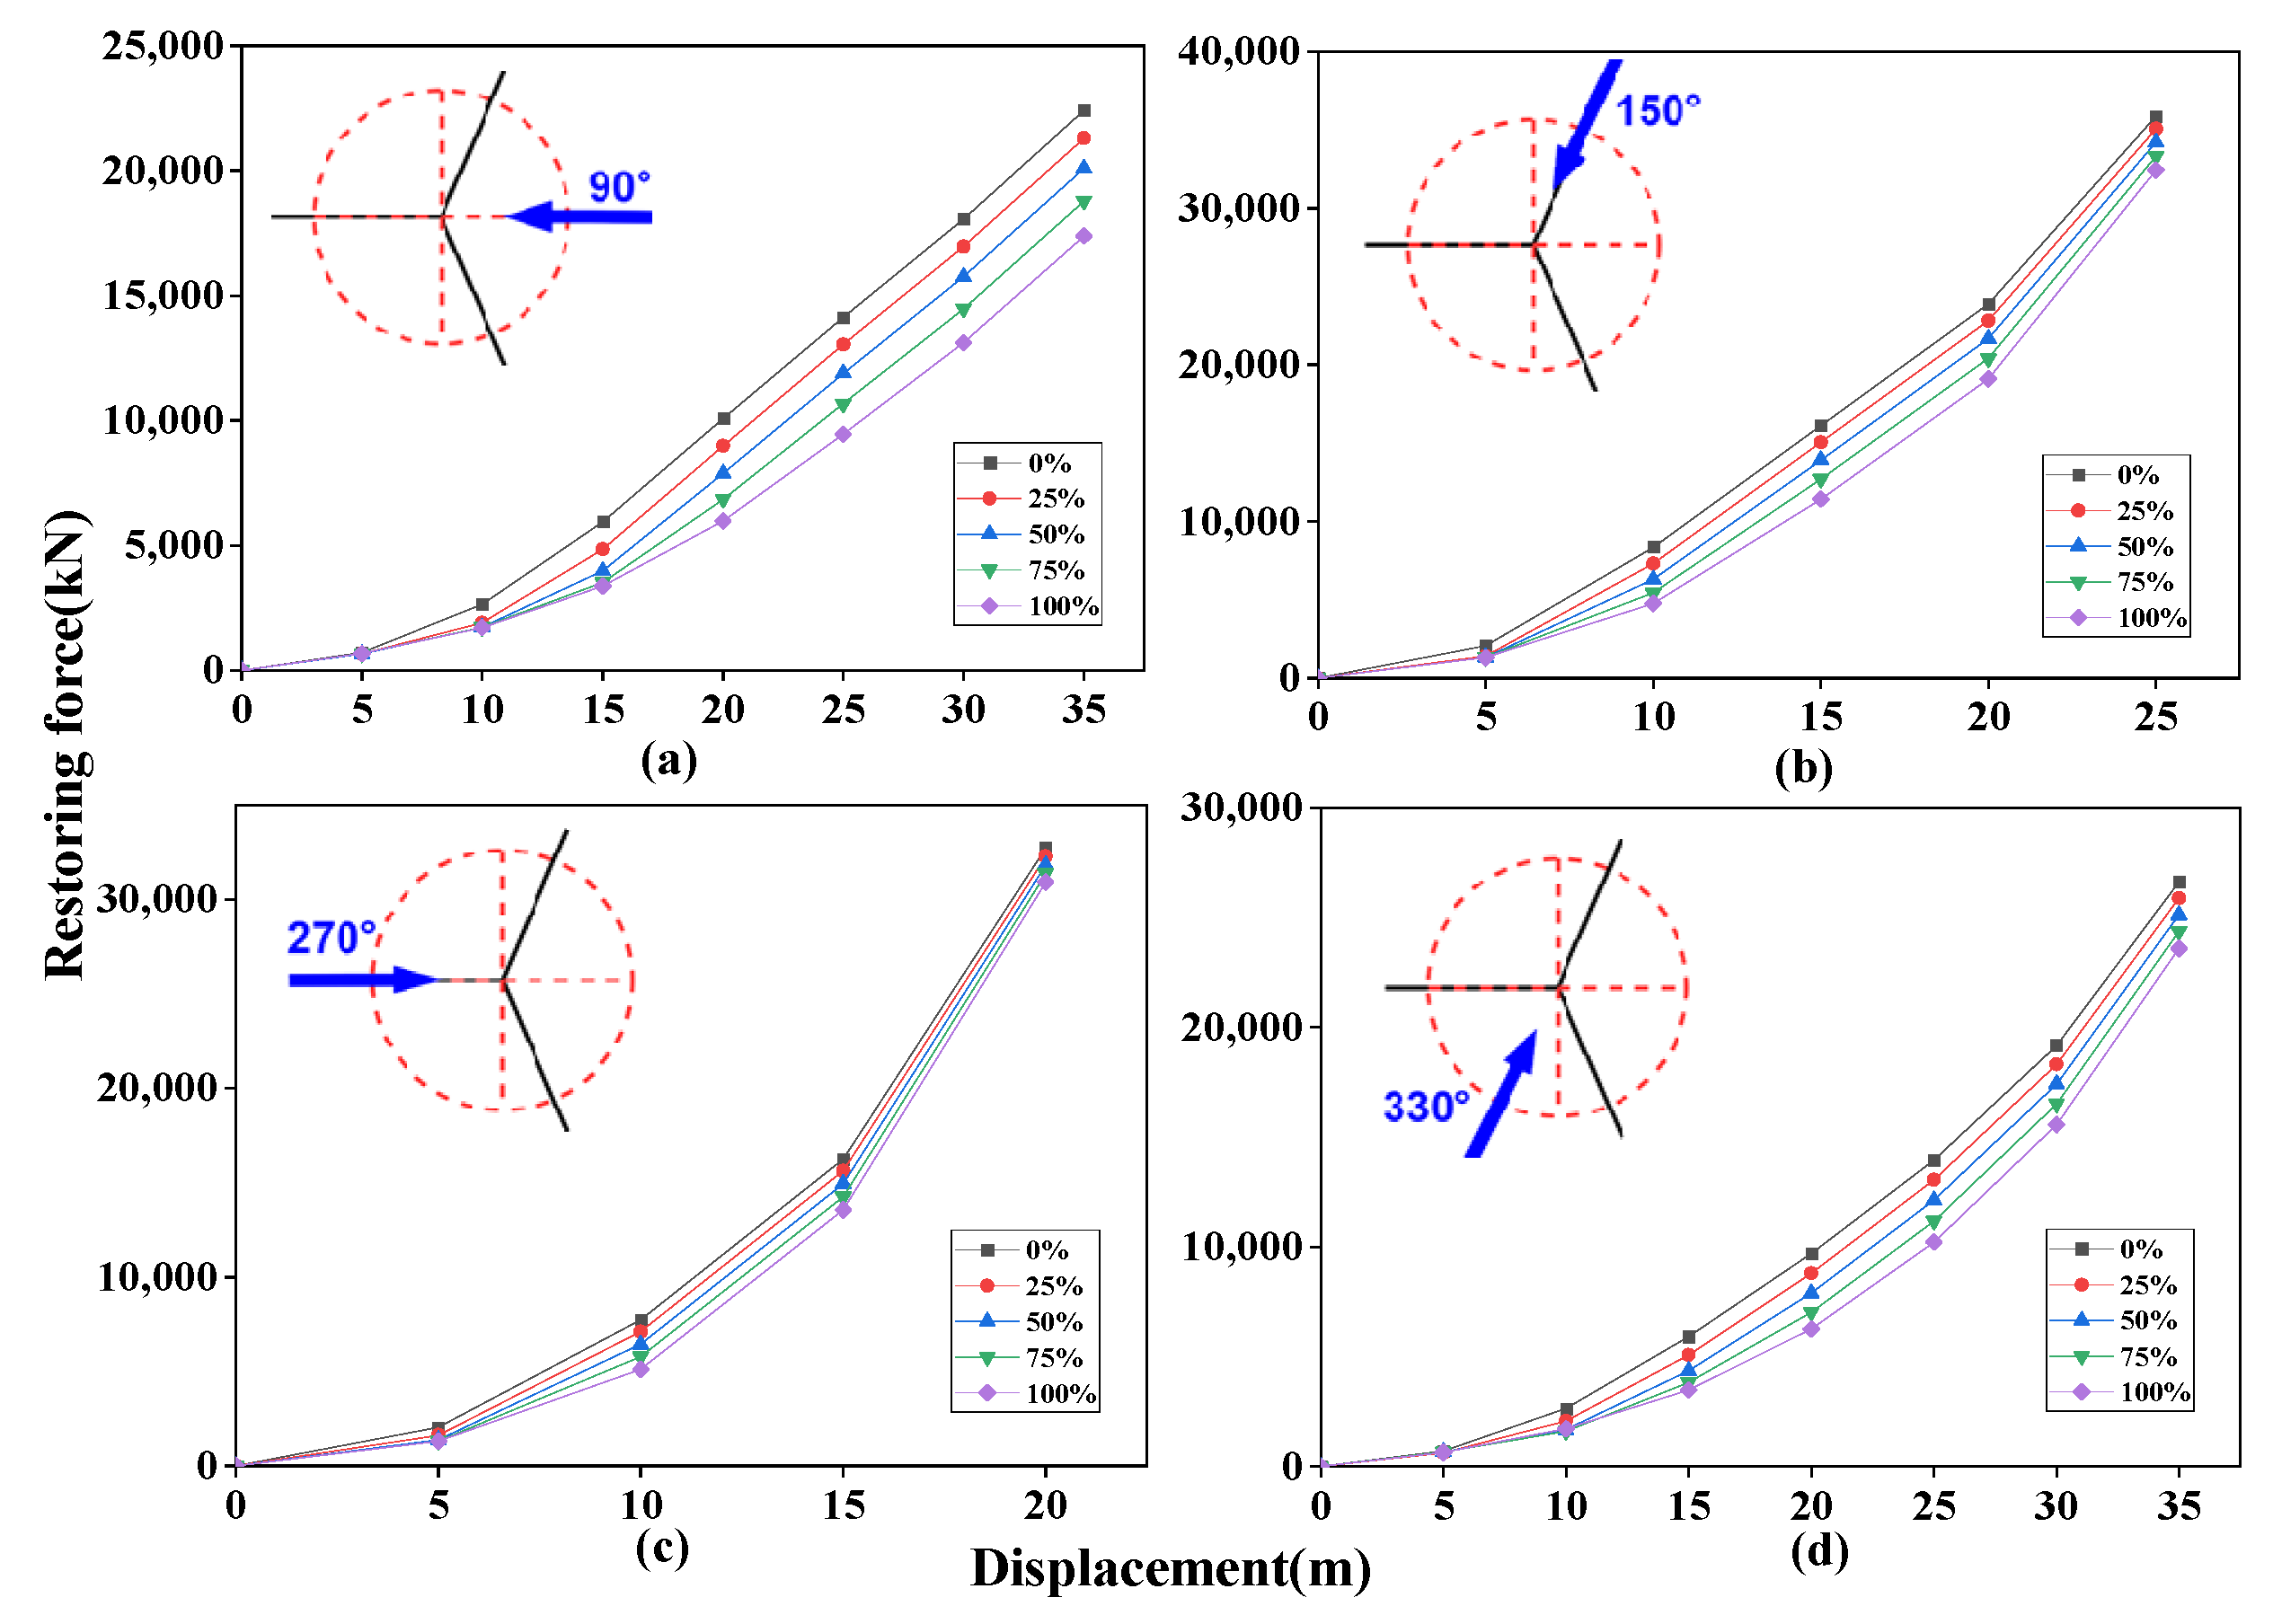
To identify the effect of clump weight loss attached to mooring lines on the response of the FPSO and mooring system, sensitivity analysis is carried out. First, static analysis of the mooring system is carried out to investigate the influence of clump weight loss on the restoring force of the mooring system. The fully coupled model of the FPSO–mooring system is established with the clump weight loss ratio of 0, 25%, 50%, 75%, or 100%.
The restoring force exerted by the mooring system varies depending on the directions of environmental loads. When the environmental loads align with a specific group of mooring lines, the predominant contribution to the restoring force comes from that particular group, which typically possesses the maximum mooring stiffness. Additionally, in between-line incident directions, the restoring force of the mooring system is mainly provided by two groups of mooring lines, and the system has the minimum mooring stiffness. Since the mooring system is approximately symmetric around the Y-axis, static analysis is performed only for four typical directions, as shown in Figure 5.
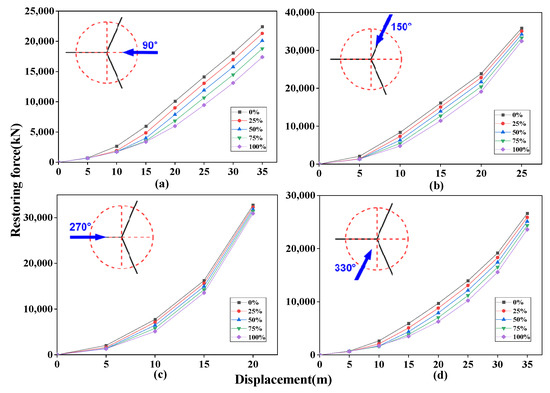
Figure 5.
Effect of clump weight loss on the restoring force: (a) 90°, (b) 150°, (c) 270°, (d) 330°.
The restoring force of the mooring system in a 150° direction is mainly provided by the mooring lines of Group 1. The displacement-restoring force curves of the mooring system in a 150° direction with different proportions of clump weight loss are shown in Figure 5b. Similar displacement-restoring force curves of the mooring system in the other three directions are shown in Figure 5a,c,d. Consequently, the restoring force of the mooring system at the same displacement gradually decreased with the increase of the proportion of lost clump weights in all environmental directions.
3.2. Dynamic Analyses
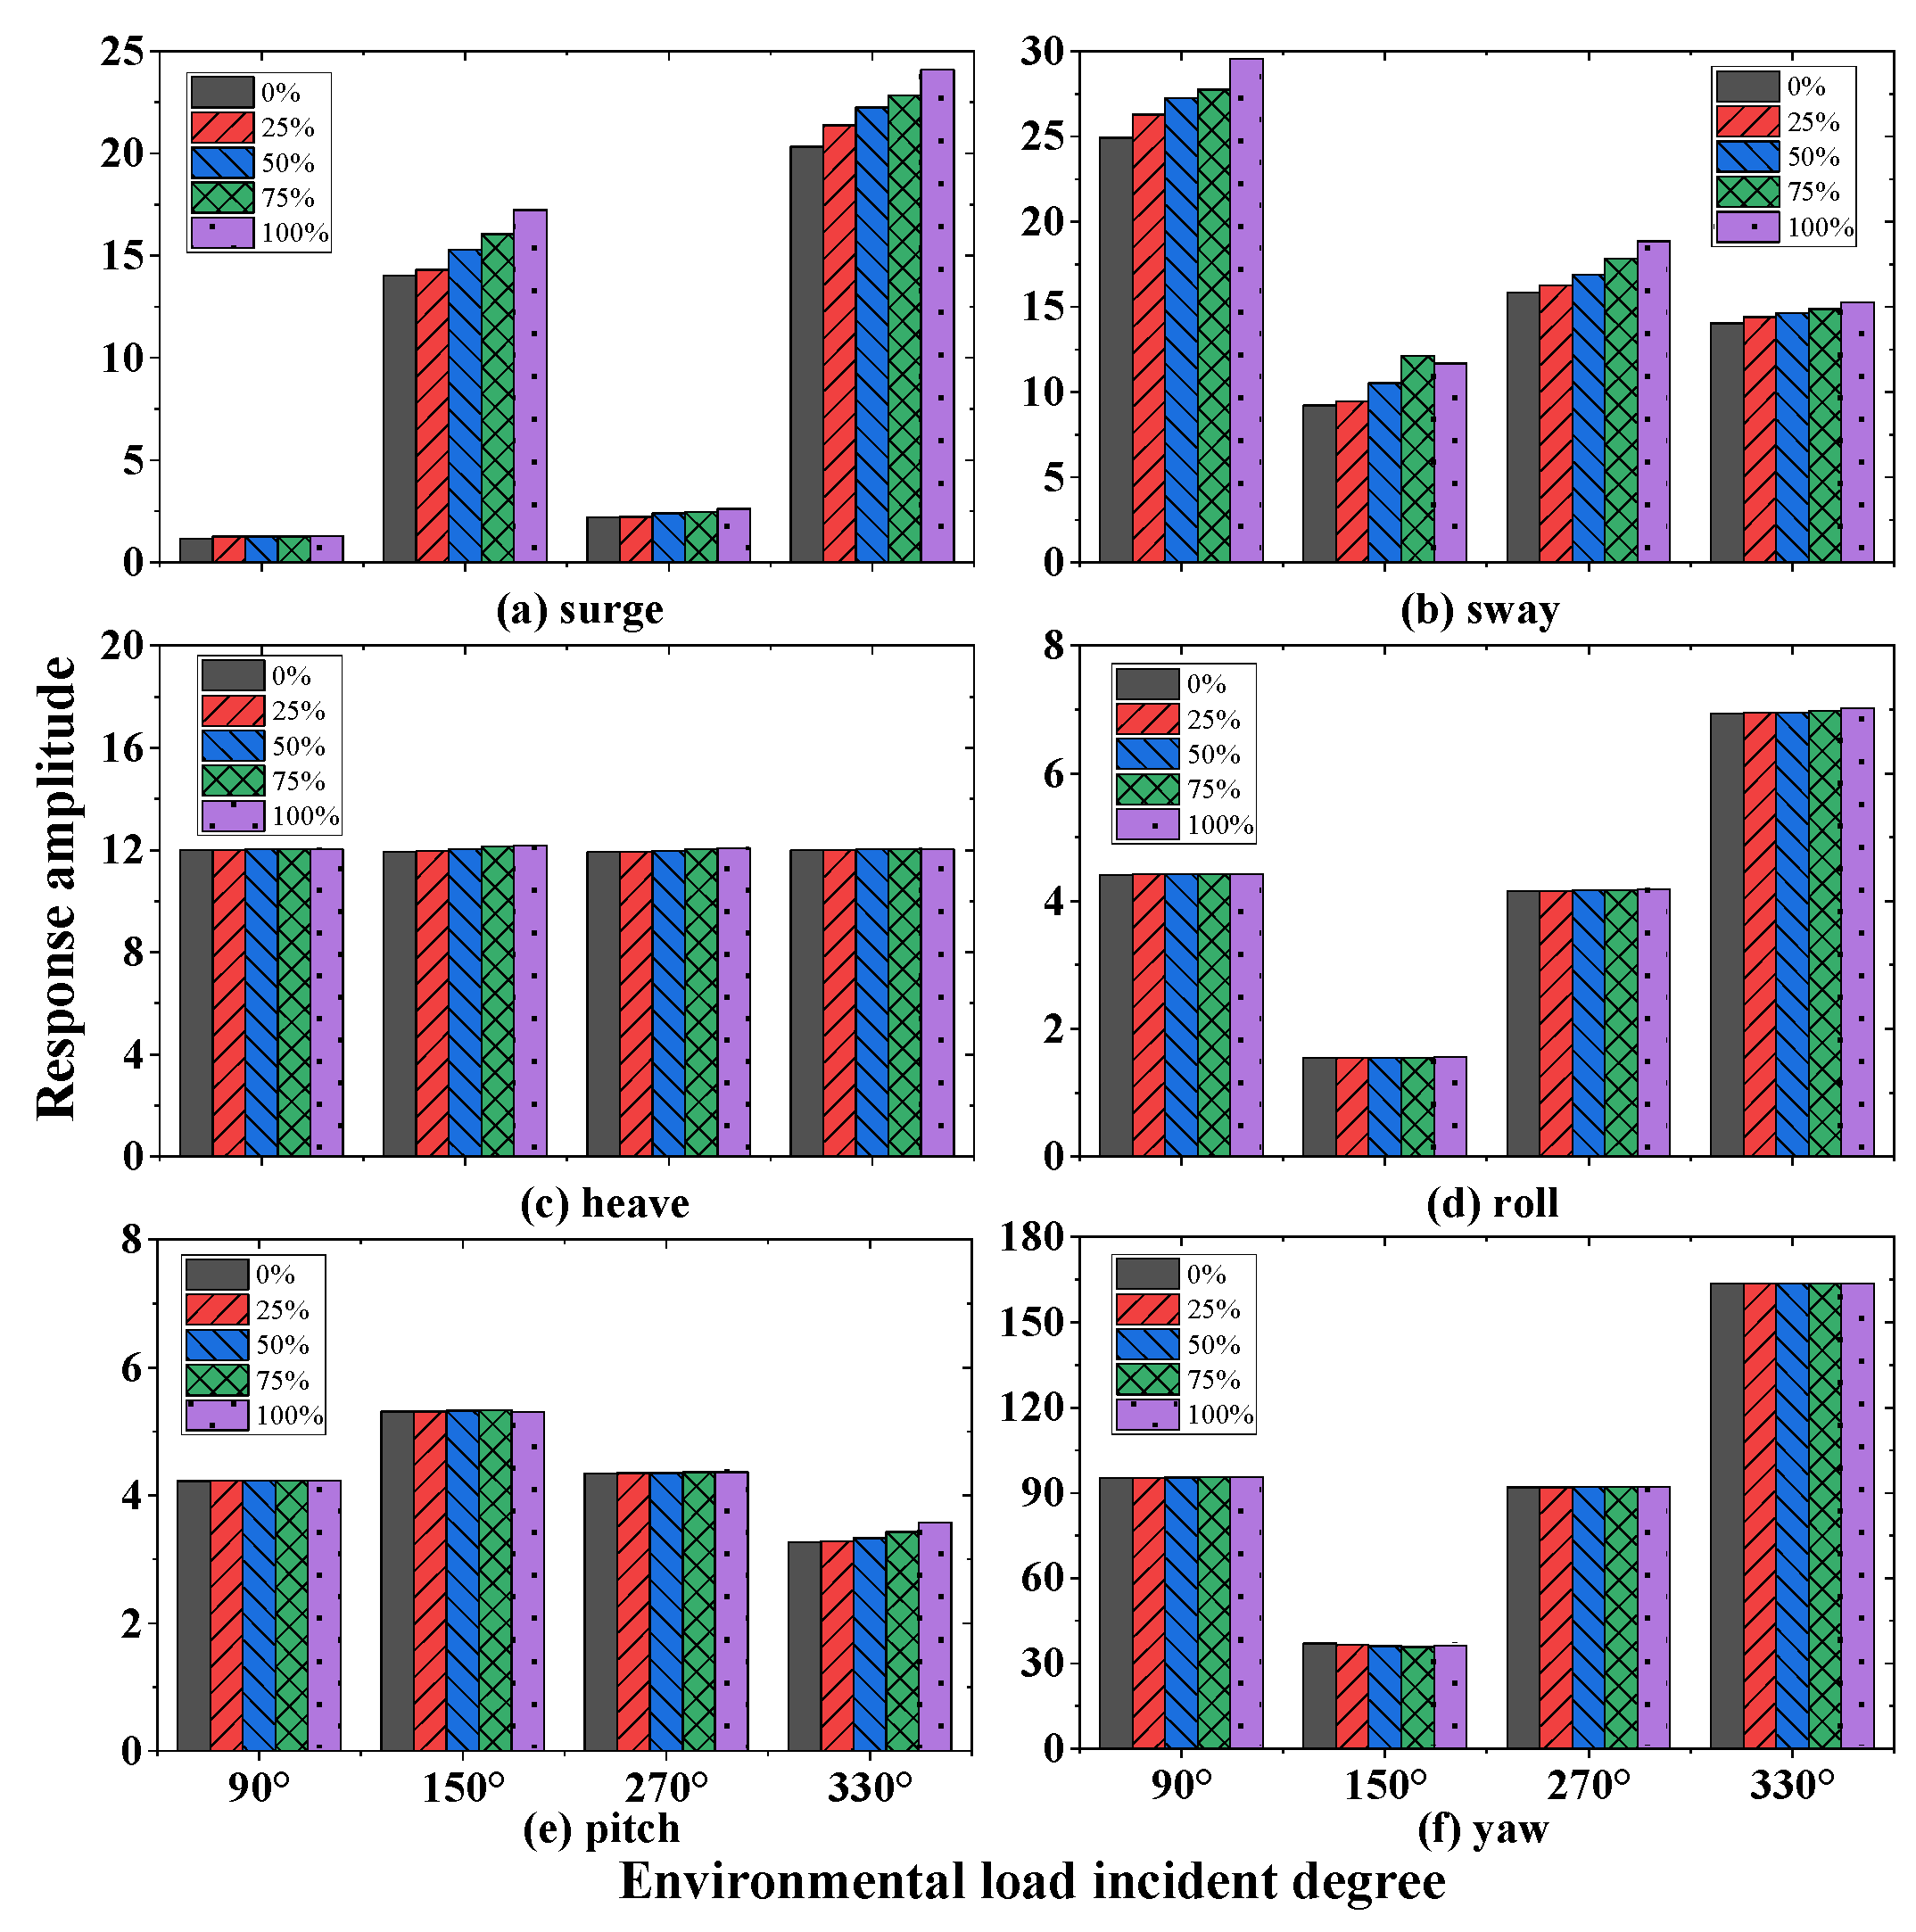
Based on the static analysis above, numerical models with clump weight loss ratios of 0%, 25%, 50%, 75%, and 100% are established for dynamic analysis in time domain with the 100-year return period sea states, considering the same four typical directions as in Section 2.1.
Figure 6 shows that the maximum surge increased by 23% in a 150° direction and the maximum sway increased by 19% in a 270°direction, indicating that loss of clump weights has a significant effect on the surge and sway motions of the FPSO. However, the effect of loss of clump weights on other DOF motions was negligible. In addition, due to the wind vane effect of the single point mooring system, the yaw of the FPSO was mainly affected by the wave direction.
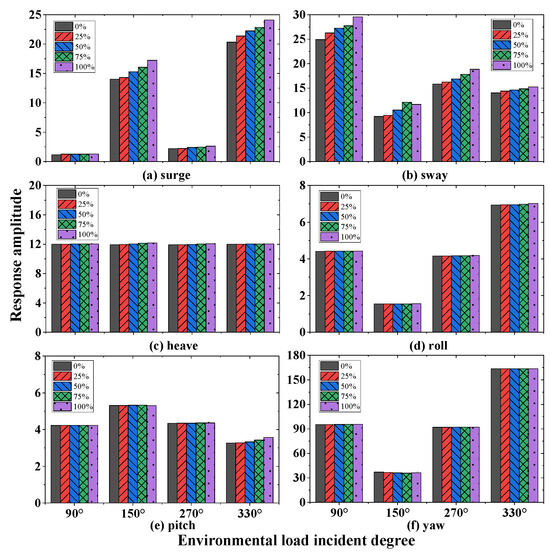
Figure 6.
Effect of clump weight loss on the response amplitude of six DOF motions: (a) surge, (b) sway, (c) heave, (d) roll, (e) pitch, (f) yaw.
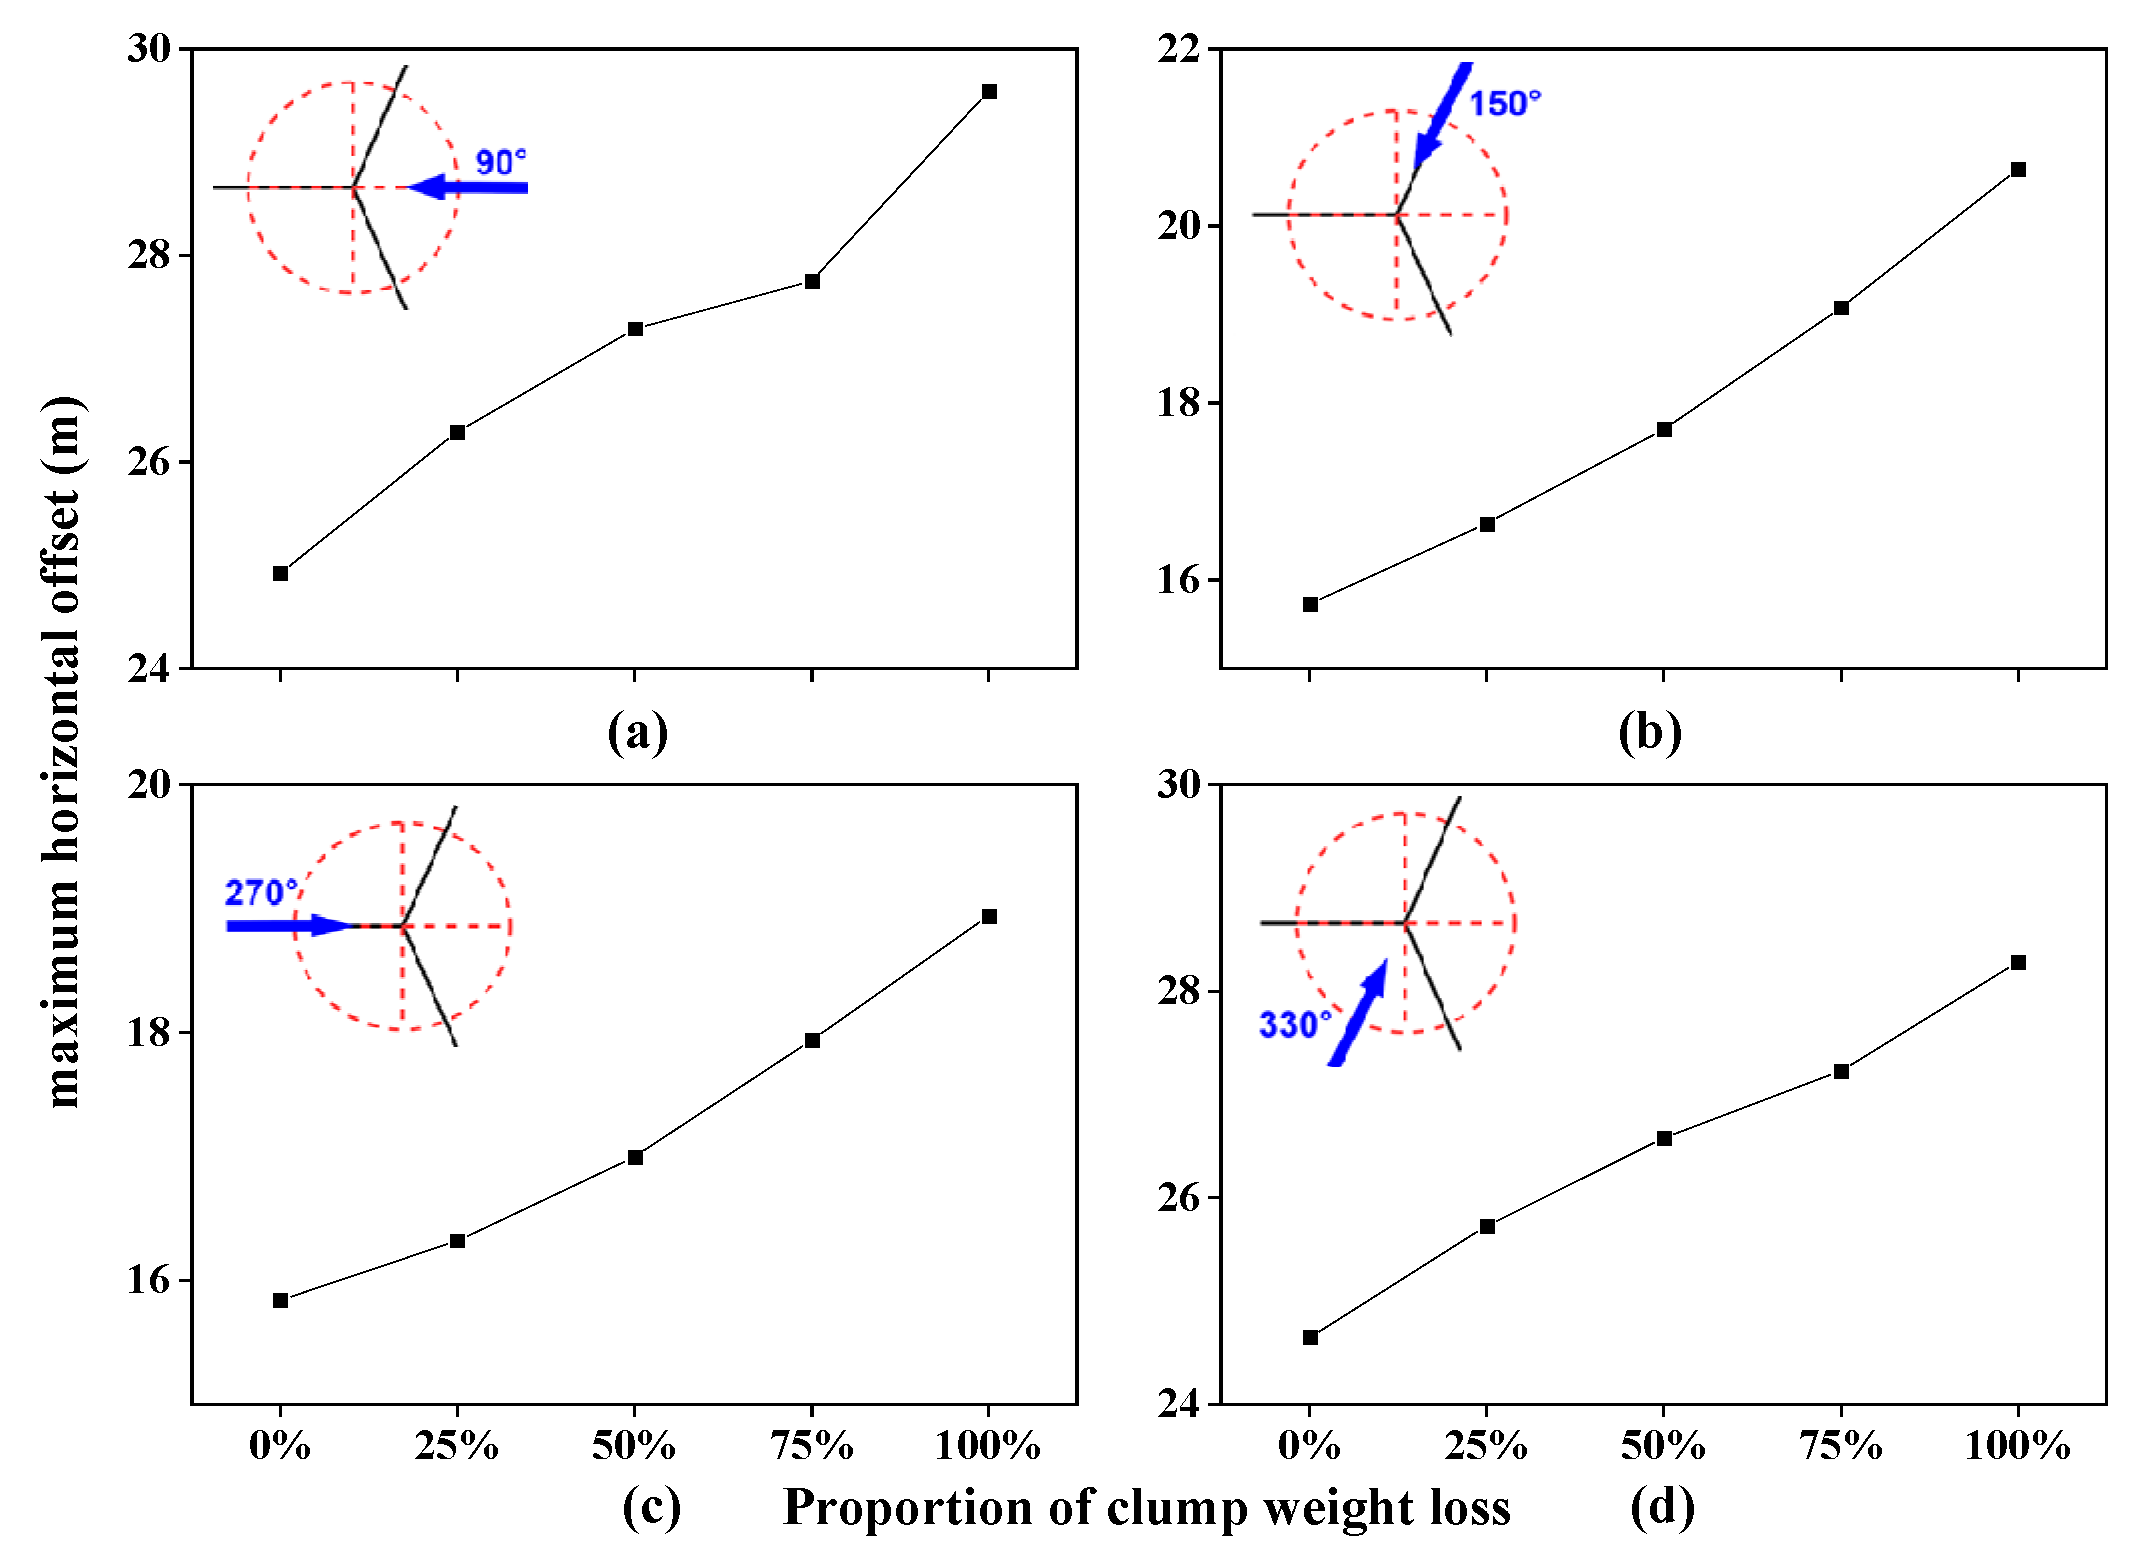
Not only is the mooring system connected to the FPSO, but also risers; therefore, limiting the horizontal displacement of the FPSO is crucial to risers’ integrity. Figure 7 gives the relationship between the clump weight loss ratio and the maximum horizontal displacement of the FPSO with different environmental load directions. Figure 7 shows that the maximum horizontal displacement of the FPSO increases with clump weight loss, no matter which direction the vessel is facing. Given that the primary contribution to the restoring force of the mooring system occurs when the environmental load aligns with a specific group of mooring lines, the influence of clump weight loss on the maximum horizontal offset of the FPSO is more pronounced in such scenarios compared to cases where the incident direction falls between the lines. When the incident direction is 150°, the maximum horizontal displacement with 100% loss of clump weight is increased by 31% compared with the integrated one.
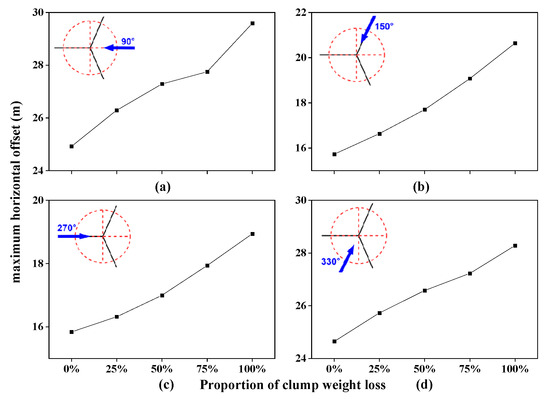
Figure 7.
Effect of clump weight loss on the FPSO maximum horizontal offset: (a) 90°, (b) 150°, (c) 270°, (d) 330°.
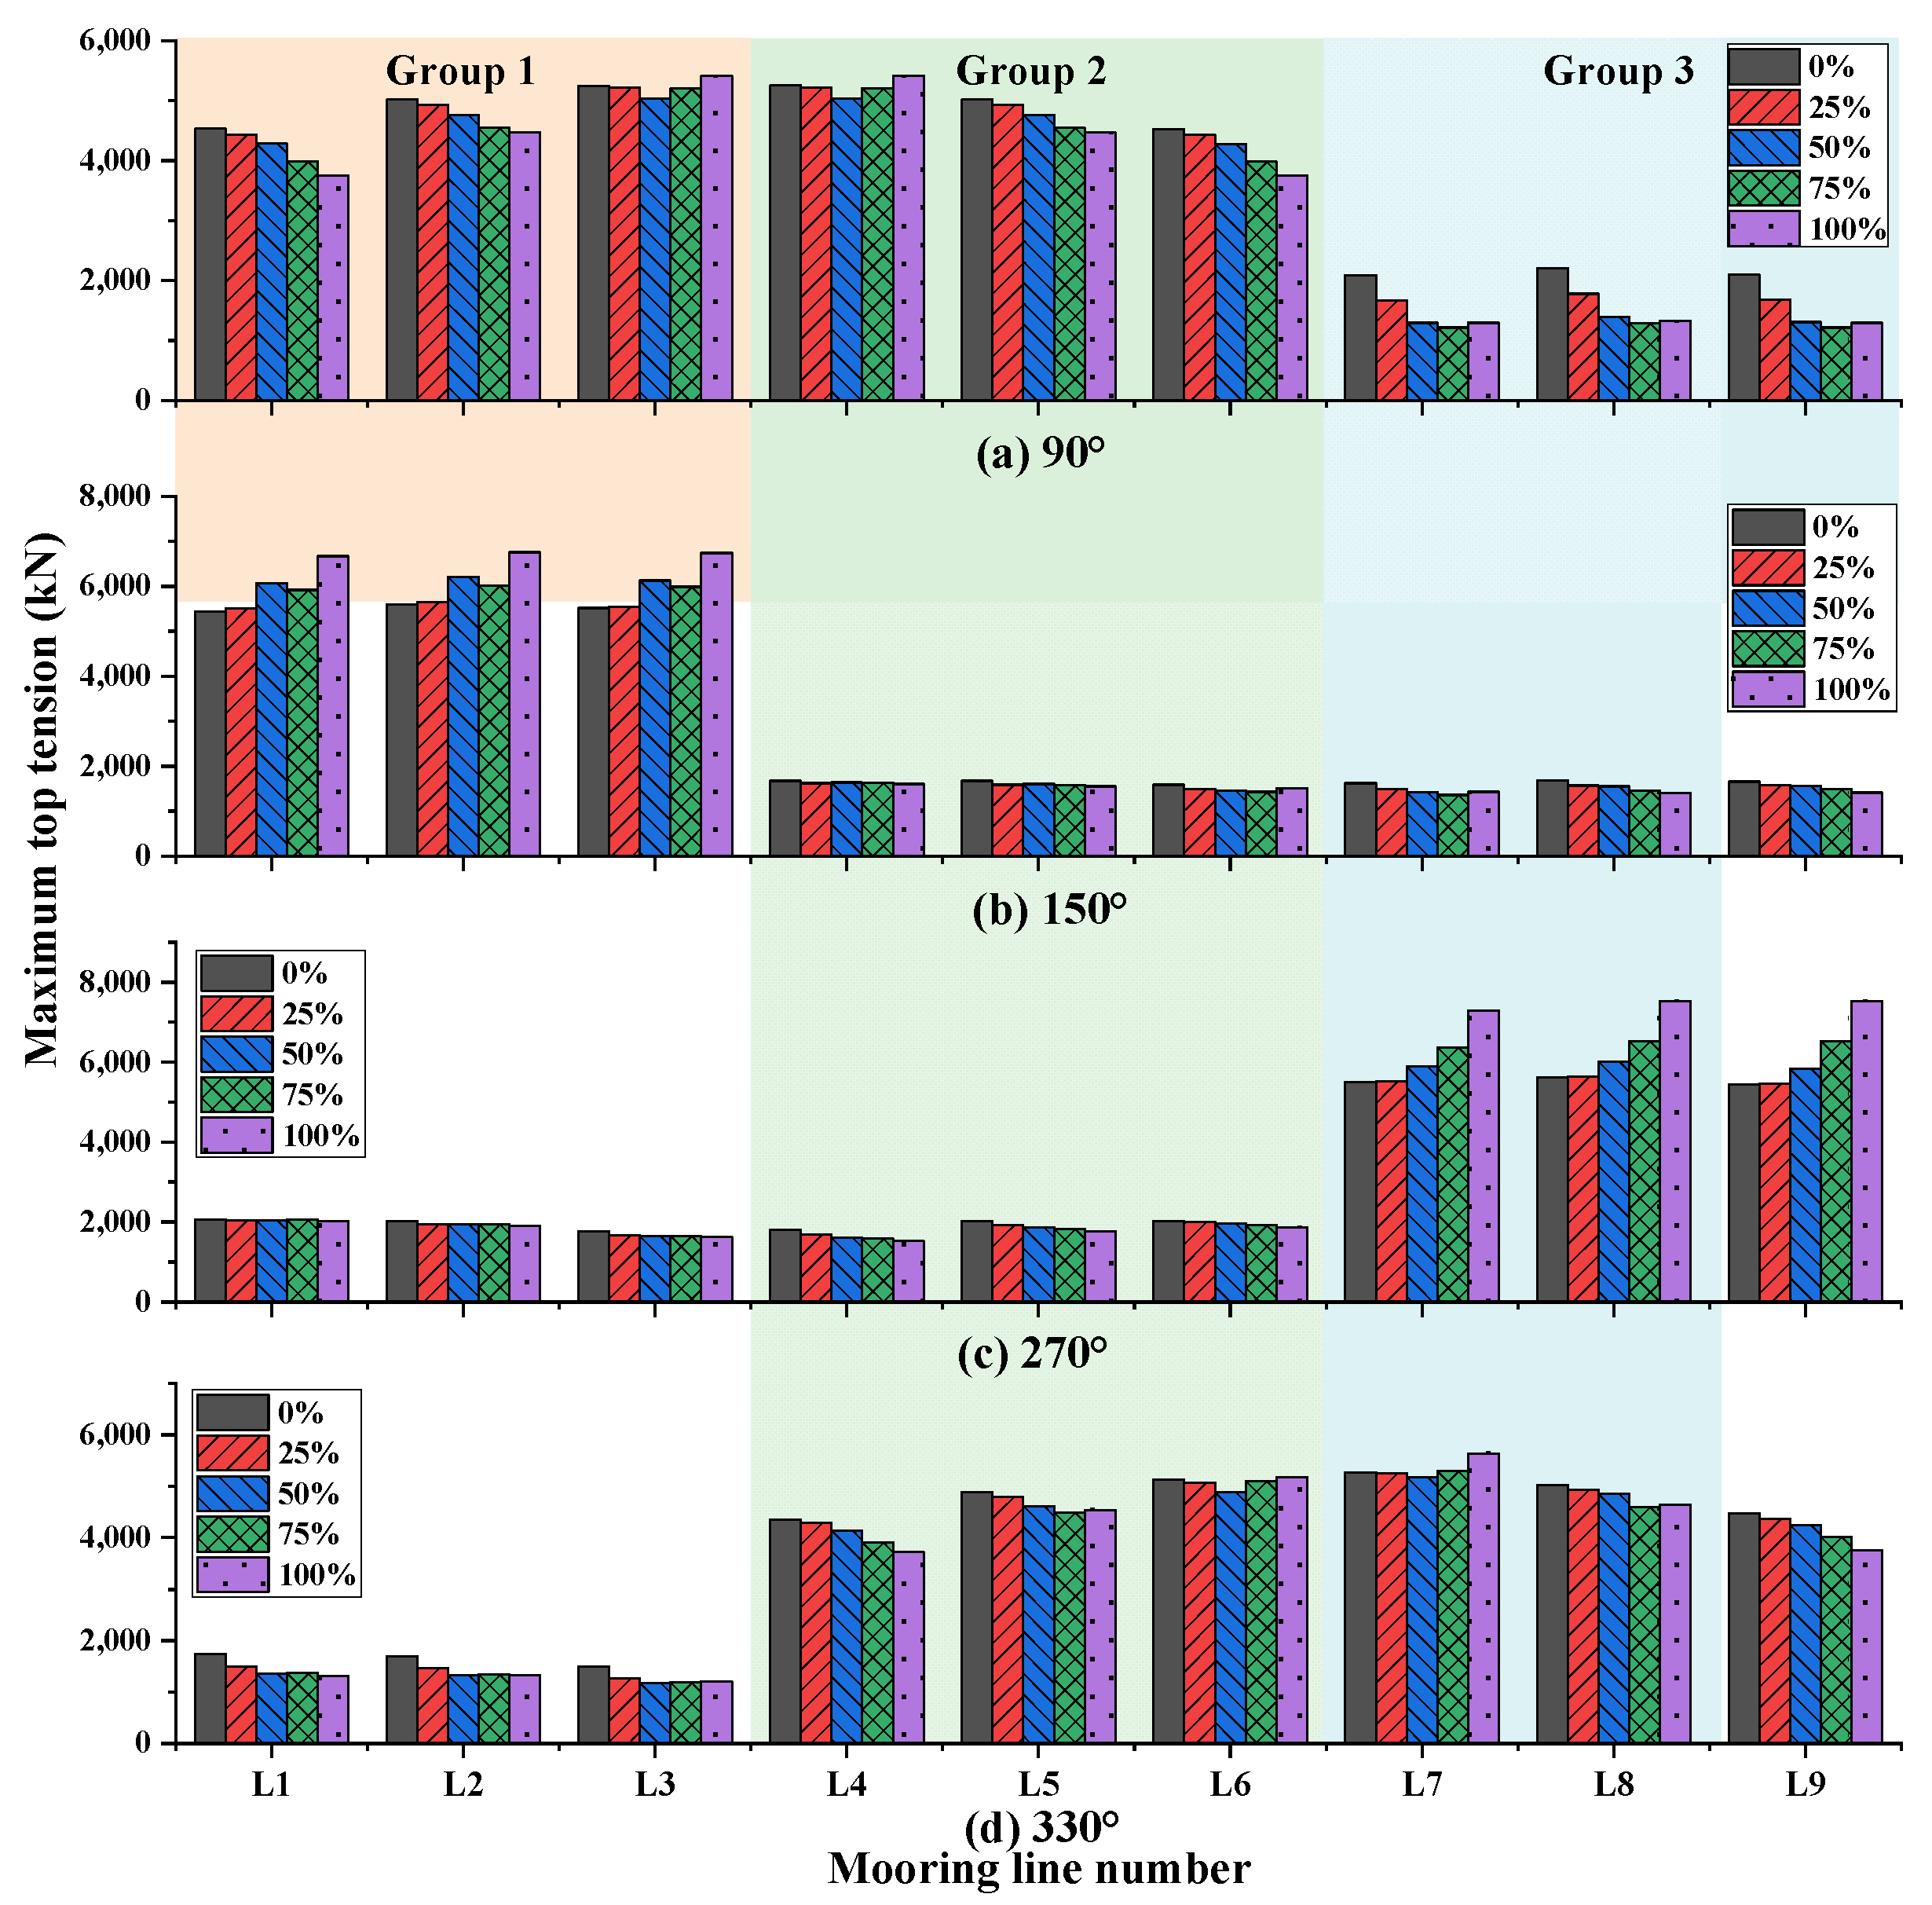
Figure 8 presents the maximum top-tension of the nine mooring lines with different ratios of clump weight loss when the environmental load comes from different directions. It can be seen from Figure 8 that, when the environmental load aligns with a specific group of mooring lines, the maximum top-tension of mooring lines, which mainly provide the restoring force of the mooring system, increases gradually with the increase of the clump weight loss ratio. On the contrary, the maximum top-tension decreases with more clump weight loss when the environmental load is incident between two groups of mooring lines. This is because the loss of clump weights reduces the weight of mooring lines, resulting in a reduction in top-tension. On the other hand, the loss of clump weights also leads to the reduction of the restoring force of the mooring system, resulting in an increase in the offset of the FPSO and the top-tension of mooring lines.

Figure 8.
Effect of clump weight loss on the maximum top-tension: (a) 90°, (b) 150°, (c) 270°, (d) 330°.
4. Inverse Analyses to Identify Loss of Clump Weight
Due to the reciprocating motions of the FPSO, it is recognized that clump weights attached to mooring lines are partially lost in operational conditions, which directly affects the motion response of the FPSO. In this section, an inversion method is proposed to identify the loss of clump weights using the measured motions. Typically, inverse analysis involves the minimization of the disparity between the calculated and measured responses, essentially framing it as an optimization problem. Therefore, an optimization model based on a genetic algorithm is proposed to identify the clump weight loss and update the numerical model of the mooring system.
4.1. Method of the Mooring System Optimization Model
According to the sensitivity analysis, it is evident that the loss of clump weights exerts a substantial impact on the maximum horizontal displacement of the FPSO. Therefore, the difference between the measured and numerical simulation values of the maximum horizontal displacement of the FPSO under the same sea state is selected as the optimization objective to optimize the number of lost clump weights on mooring lines. The mathematical expression of the objective function is shown in Equation (1).
where V1 and V2 are the measured and the numerical simulation value of maximum horizontal displacement at the FPSO, respectively.
Due to the similarity in dynamic responses among mooring lines within the same group, it is assumed that the number of lost clump weights for each mooring line within a particular group is identical. Consequently, the mooring system optimization problem can be simplified, resulting in three independent variables. Specifically, these variables represent the number of lost clump weights for each group of mooring lines within the system. The mathematical expression of the governing variables of the optimization problem is shown in Equation (2).
where x1, x2, and x3 are the number of lost clump weights of each mooring line in groups 1, 2, and 3 respectively.
Since sixteen clump weights are uniformly attached on mooring lines L1–6 and eight clump weights are uniformly attached on mooring lines L7–9, the number of lost clump weights is discrete rather than continuous. The values of x1 and x2 are in the range of [0, 1, 2, …, 15, 16], and the value of x3 is in the range of [0, 1, 2, …, 7, 8].
To determine a sensible configuration for the number of lost clump weights of each mooring lines group, an optimization model is developed to minimize the difference between the measured and numerical results of the maximum horizontal displacement of the FPSO under same sea states. The mathematical programming model of the optimization of the mooring system is shown in Equation (3).
An appropriate conversion method, as shown in Equation (4), is used to transform the problem of solving the minimum of the objective function into that of solving the maximum of fitness. Individuals with higher fitness levels are chosen for crossover, mutation, and other operations to increase their chances of inheritance in the next generation.
The flowchart in Figure 9 shows the process of mooring system optimization based on the genetic algorithm. The evolutionary process of the population in the genetic algorithm is to seek the individual solution X with a higher fitness value by repeated iterations continuously until the maximum number of iterations is reached. Considering the operation efficiency and optimization ability of the algorithm, the population size and the maximum number of iterations in the genetic algorithm are set to 50 and 20, respectively, in this work. The tournament selection method, one-point crossover method, and simple mutation method are used for selection, crossover, and mutation, respectively. The crossover probability is 0.8, and the mutation probability is 0.15.

Figure 9.
Optimization flowchart of mooring system.
4.2. Parameter Identification and Model Optimization
It is inevitable that the mooring system in operation will differ slightly from the original design due to installation precision. To reduce these differences, the numerical model of the FPSO and mooring system is adjusted according to the final anchor positions and line cutting records to obtain the as-built numerical model of the mooring system before optimization. Table 2 compares the total length of mooring lines between the initial and as-built mooring system numerical model. Optimization is carried out based on a GA using the as-built numerical model of the mooring system.
Table 2.
Comparison of total length of mooring lines.
The measured data include the wind, wave, and current, the FPSO translational, and the rotation displacement data, among which the time interval is 1 h for wave data and 1 s for other data. The on-site measured data from 6:00 to 7:00 on 17 October 2016, when the sea state was relatively severe, is selected for dynamic analysis. The measured environmental parameters are shown in Table 3. Figure 10 presents the time series of the wind speed and direction. The measured data are applied to optimize the as-built model of the mooring system through the optimization model proposed in Section 4.1.
Table 3.
Measured environmental parameters from 6:00 to 7:00 on 17 October 2016.
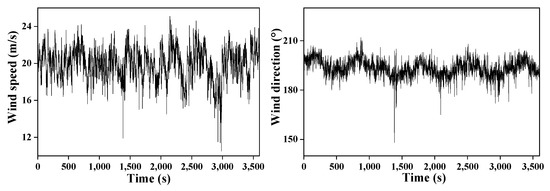
Figure 10.
Wind load time history curve.
Due to the randomness of waves, the outcomes of numerical simulations may vary slightly when different wave seeds are utilized. In order to mitigate the impact of wave randomness, different wave seeds are considered for multiple simulations under the same sea state. According to BV-NR-493 [22], the offset to be used in the optimization process is calculated from the results of five numerical simulations according to Equation (5).
where OK is the maximum offset obtained during the k-th simulation, OS is the mean of OK, and b is the factor depending on the number of simulations n.
First, an initial population containing 50 individuals is randomly generated, and the corresponding as-built models of the mooring system are built separately. To determine the number of the lost clump weight and fit the numerical model to the actual system, the as-built mooring system is optimized with the GA-based optimization model established in Section 4.1. The objective function of the optimization model is set as the difference between the numerical and measured values of the maximum horizontal displacement. Figure 11 shows the process of optimization through the genetic algorithm.
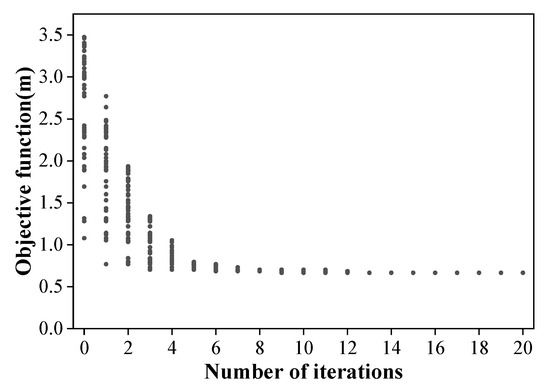
Figure 11.
Optimization process of the genetic algorithm.
After 20 generations of optimization, the optimal combination of numbers of lost clump weights for each group of mooring lines is identified. The objective function is minimum when two clump weight blocks are lost in Group 1 and when there is no loss in Groups 2 and 3 of the mooring system. The results show that 11.1% of clump weights are lost in Group 1, while there is no loss in Group 2 and 3. In fact, we can also see from Figure 11 that the optimization result is converged from the ninth generation. However, to prevent the GA from falling into the local optimum problem, optimization is continued until the maximum number of iterations is reached.
To assess the robustness and reliability of the optimization outcomes, the GA optimization procedure described above is iterated three times for a specific wave seed, with each iteration utilizing a distinct initial population. Since the optimization variables in this study exhibit discreteness, the search space for the genetic algorithm is relatively compact. Consequently, the optimization results derived from these three iterations consistently align, demonstrating the robust nature of the proposed optimization approach.
The property of mooring lines is updated for the numerical model of FPSO and its mooring system according to the result of optimization. Table 4 summarizes the length distribution of the UCS2 and UCS3 sections of the as-built model and the updated model after optimization, and the mooring lines in the center of a group are presented. It is assumed that the number of lost clump weights within one group of mooring lines is the same. In the optimized model, the segment length of UCS2 and UCS3 is reduced by 6 m and increased by 6 m, respectively, for the Group 1 mooring lines, while the segment distribution of the second and the third group remain unchanged.
Table 4.
Length distribution of the mooring lines model.
Table 5 summarizes eight typical sea states measured in October 2016. To verify the applicability of the optimized mooring system numerical model to other sea states, simulations are carried out for sea states 1, 3, and 6 with larger wind speeds and wave heights. The results show that the differences between the simulated and the measured FPSO maximum horizontal displacement decrease after optimization for the three sea states.
Table 5.
Eight typical sea states in October 2016.
5. Real-Time Prediction of Mooring Line Top-Tensions
Both the FPSO motion data and the mooring line top-tension data are time series data. The LSTM network is a temporal recurrent neural network that can consider the recurrence and memory effects of time series data to make predictions. In this work, the LSTM neural network model is constructed to predict the top-tension of mooring lines in real time based on the TensorFlow framework, using the measured data of six DOF motions as input. The mooring line top-tensions are calculated using the optimized model presented in Section 4.2, with the six measured DOF motions as forced excitation at the top of the mooring lines.
5.1. Data Pre-Processing
Considering the significant computational demands of numerical simulations, it is not practical to employ all six classes of DOF motion data for calculations. Therefore, it becomes essential to choose a representative subset of data rather than utilizing the complete dataset. To this end, the correlation analysis is conducted using the six DOF motions and the mooring line top-tension according to Equation (6).
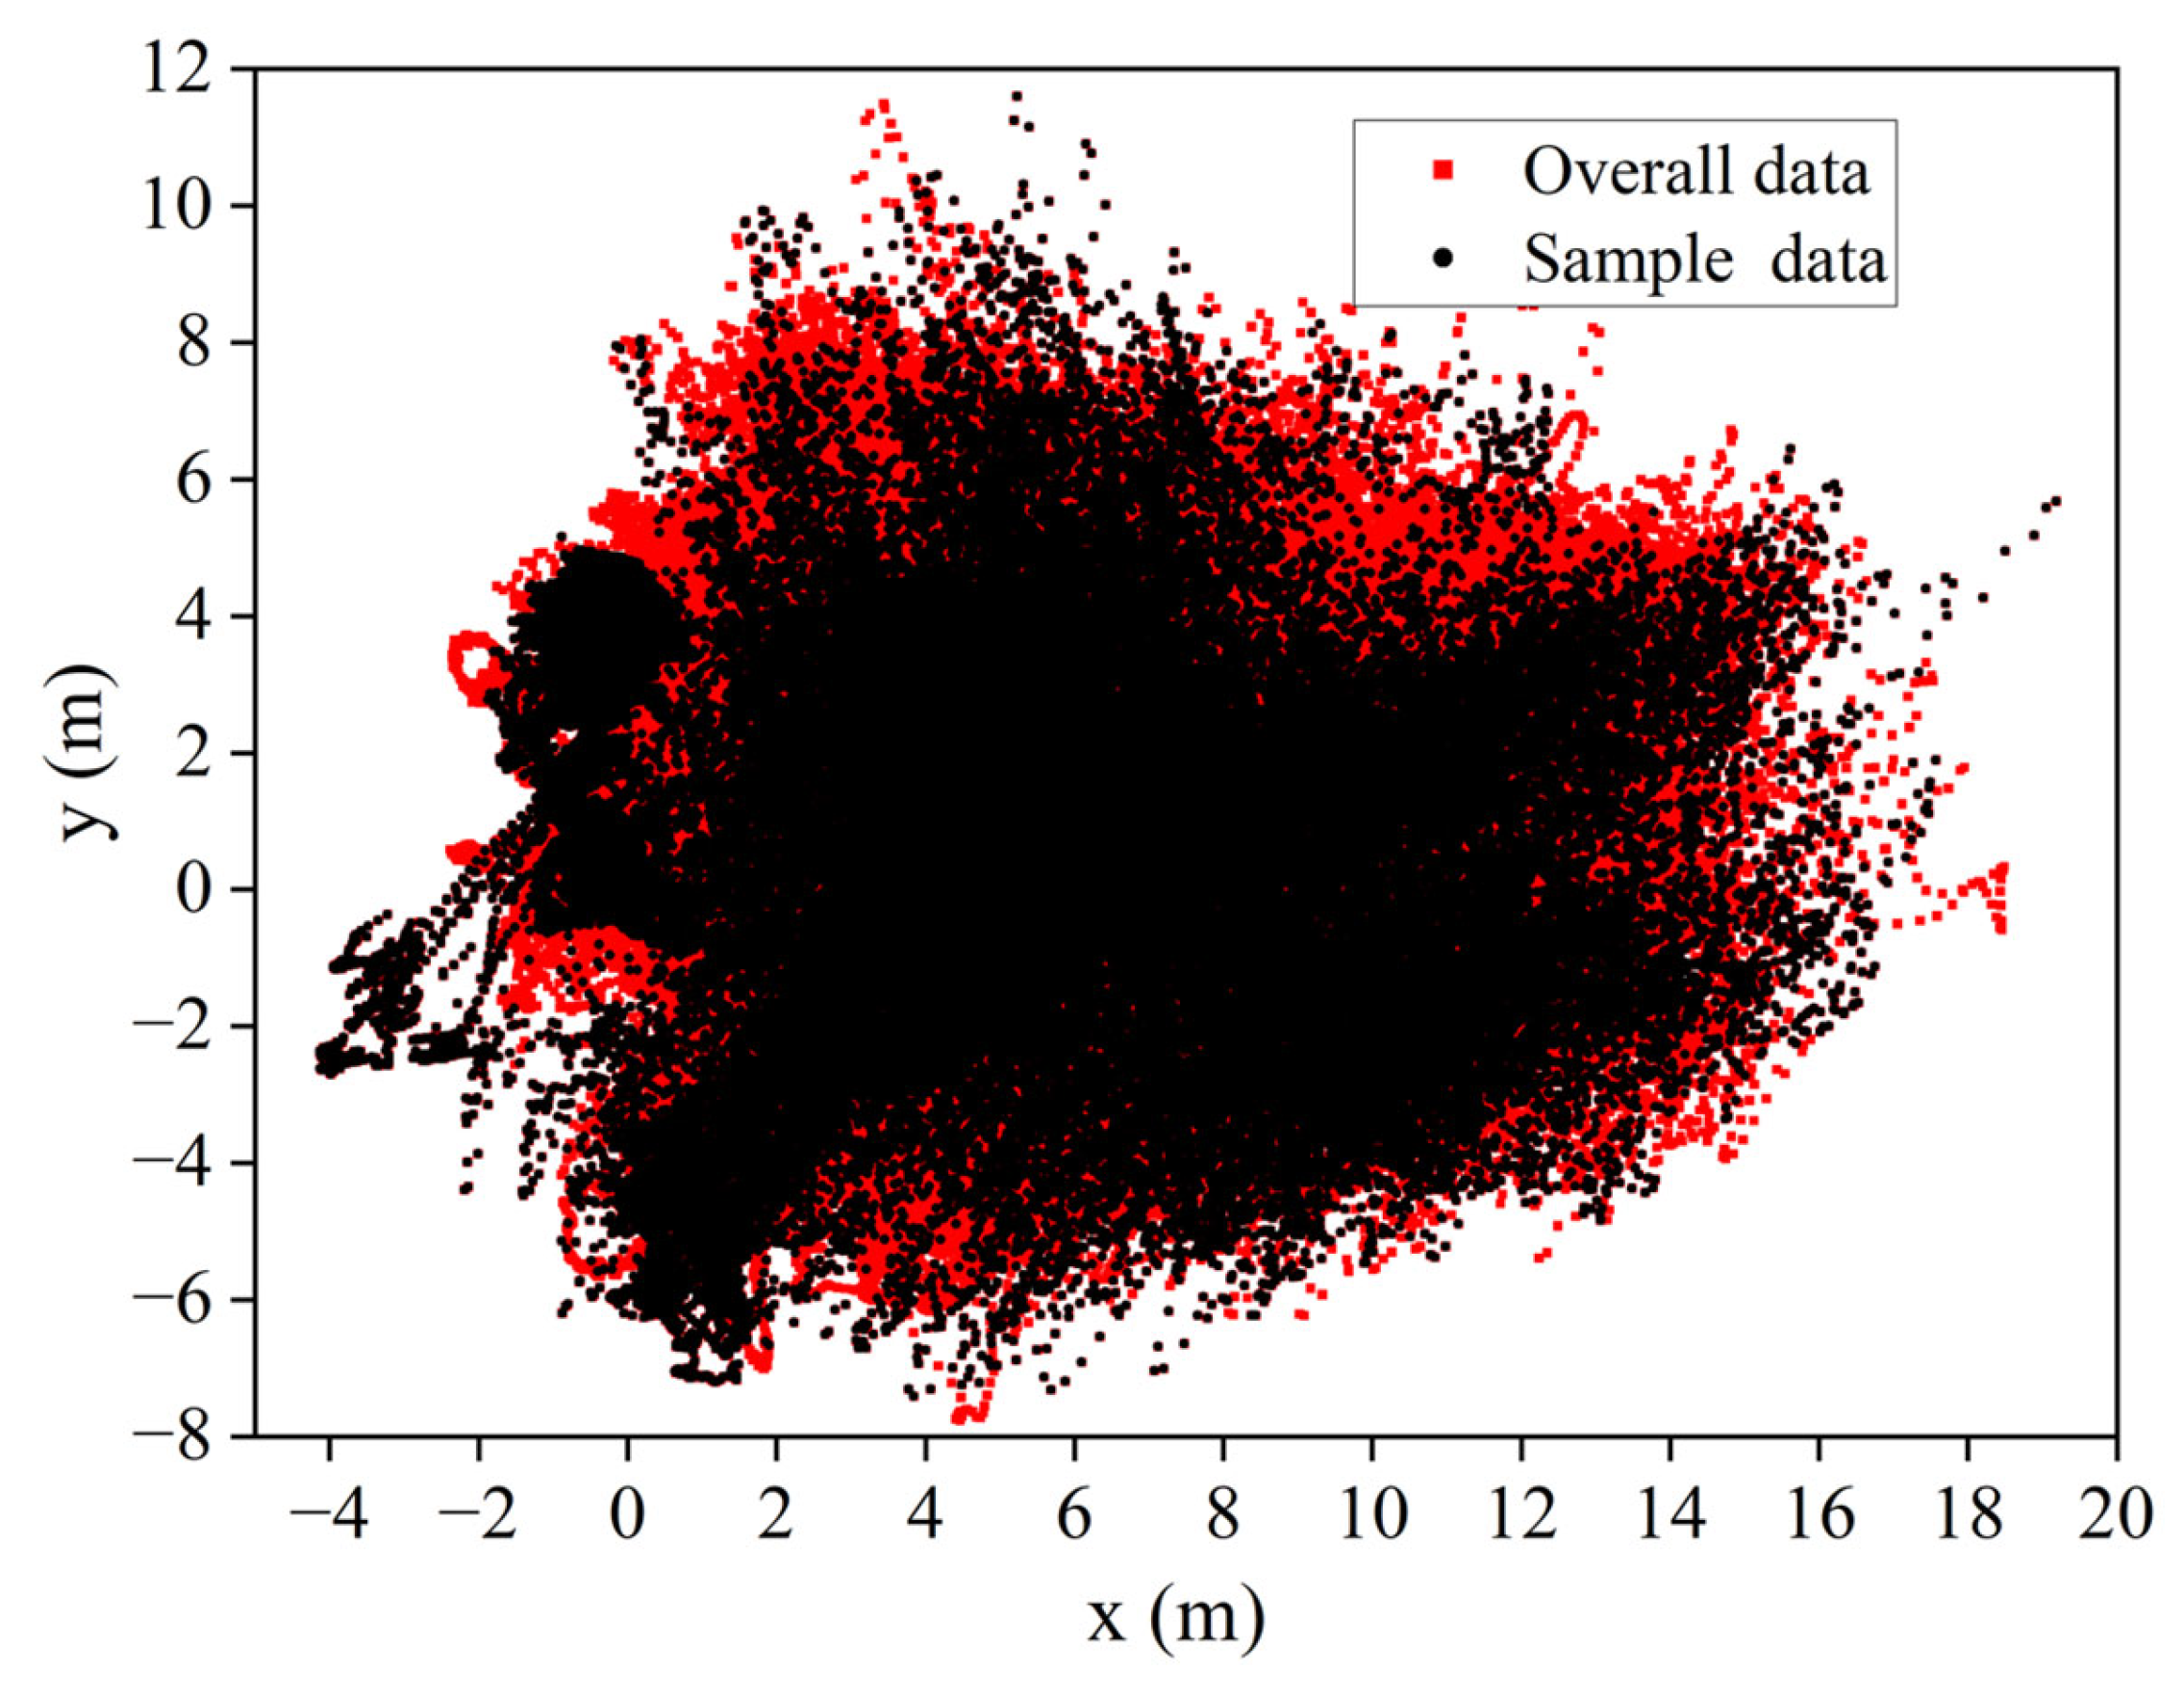
The calculated correlation coefficients are shown in Figure 12. It can be seen that the top-tension of each mooring line is most correlated with the surge and sway motions of FPSO. Due to the different arrangement azimuth of mooring lines, the correlations between the horizontal motions and top-tensions could be highly negative. Regarding the correlations between rotational motions and top-tensions, the overall values are much closer to zero, representing lower correlation. Therefore, the horizontal motion trajectory of FPSO of the sample data should cover the overall data measured as much as possible. Figure 13 depicts the distribution of the sample data and the overall data, with the red points denoting the overall data of the FPSO horizontal motion trajectory in October 2016 and the black points denoting the eight different units of sample data of 3 h intervals selected to predict the top-tension of mooring lines. As seen from Figure 13, the FPSO horizontal motion trajectories of selected sample data basically cover the overall data measured, which satisfies the requirement.
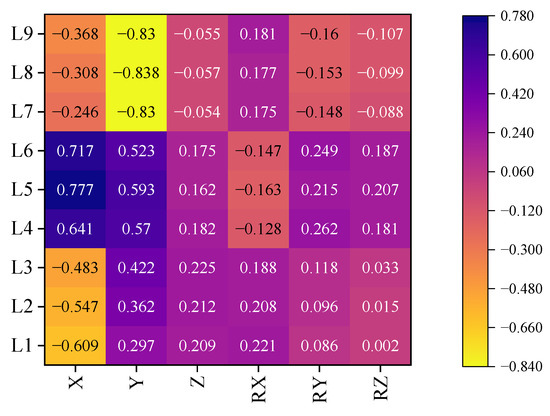
Figure 12.
Correlation analysis between FPSO motions and mooring line top-tensions.
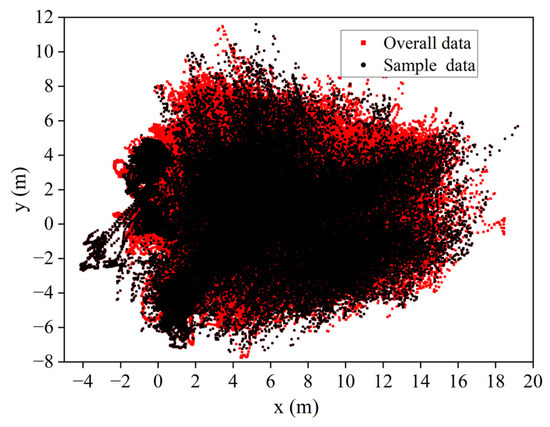
Figure 13.
Horizontal motion trajectory of FPSO of overall data and sample data.
The measured six DOF motions of selected sample data are used as the top forced excitation to calculate the top-tension of mooring lines. The calculated data of the top-tension of mooring lines together with the corresponding six classes of DOF motion data constitute the database for the training of the LSTM neural network. Since the units and magnitudes of the six DOF motions are different, data normalization before training is beneficial to the convergence of the LSTM neural network. The training set and testing set are uniformly divided from the sample data. The most common method is to randomly select 80% of the sample data as the training set and other data as the testing set, so the ratio of training set to testing set is 8:2 in this work.
To assess the prediction accuracy, the Root Mean Square Error (RMSE) and the coefficient of determination R-square (R2) are chosen as the indicators in this work, as given in Equations (7) and (8), respectively. RMSE indicates the degree of deviation between the predicted value and the true one. Thus, the smaller its value, the better it is. R2 reflects the fitting ability of the prediction model and is in the range of [0, 1], so the larger its value, the better it is.
5.2. Prediction of Mooring Line Top-Tensions
The determination of the number of hidden layers and the quantity of neuron nodes within each layer is a crucial step in configuring the LSTM neural network. It is important to note that increasing the number of neurons does not automatically lead to enhanced prediction accuracy; instead, it often prolongs the training process for the neural network. Striking the right balance is key, where an appropriate total number of neurons and network structure can yield a neural network model that achieves a desirable trade-off between short training times and high prediction accuracy.
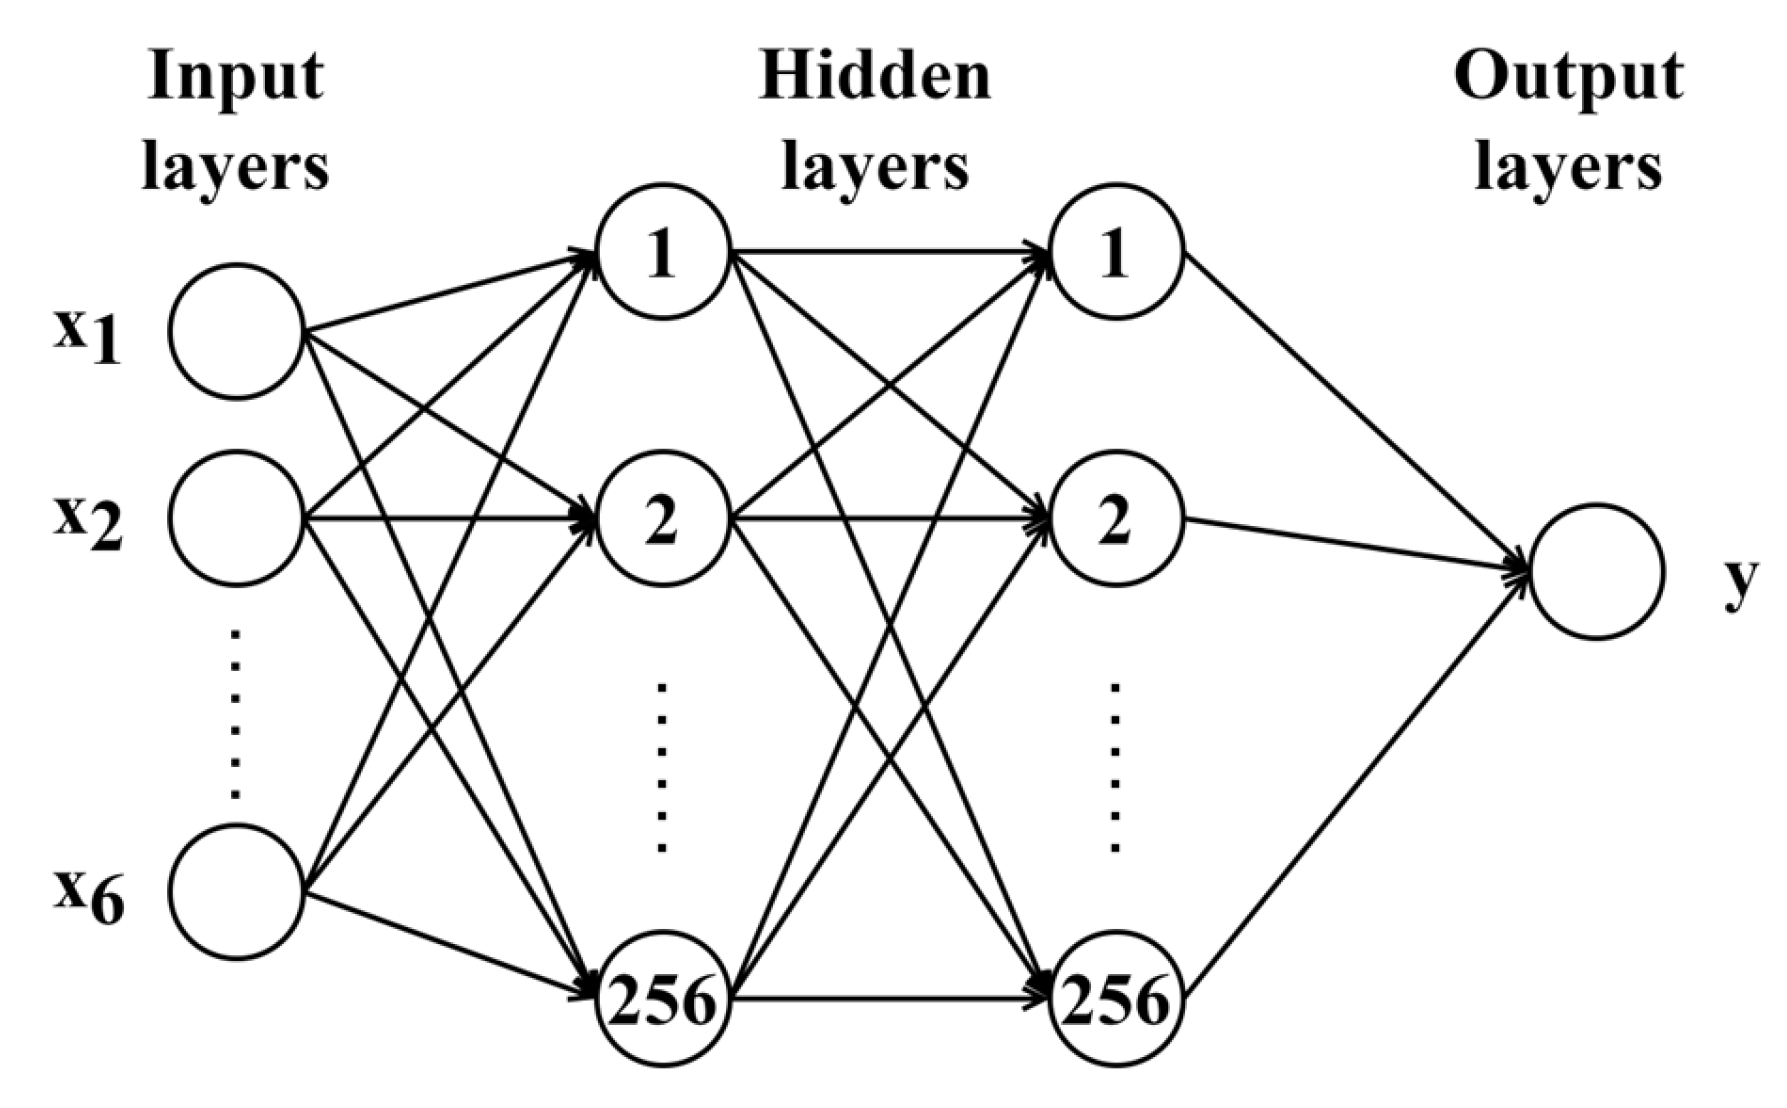
Firstly, the neural networks with one hidden layer of 32, 64, 128, and 256 neurons are established to predict the top-tension of mooring line L1 using the six DOF motions as input. Table 6 demonstrates the prediction accuracy of mooring line top-tension with different hidden layers in terms of RMSE and R2, and indicates that the highest prediction accuracy is achieved when the number of neurons is set to 256. Therefore, on the basis of one hidden layer with 256 neurons, hidden layers with 32, 64, 128, and 256 neurons are added. Finally, the neural network consisting of two hidden layers with 256 neurons in each layer is determined to predict the mooring line top-tensions, and the structure of this is shown in Figure 14. The input of the prediction model is the six DOF motions of FPSO, and the output is the top-tension of a specific mooring line. The calculated R2 of the network structure is nearly 0.95, which ensures both high prediction accuracy and less training time.
Table 6.
Prediction accuracy of different network structures.

Figure 14.
Structure of the neural network.
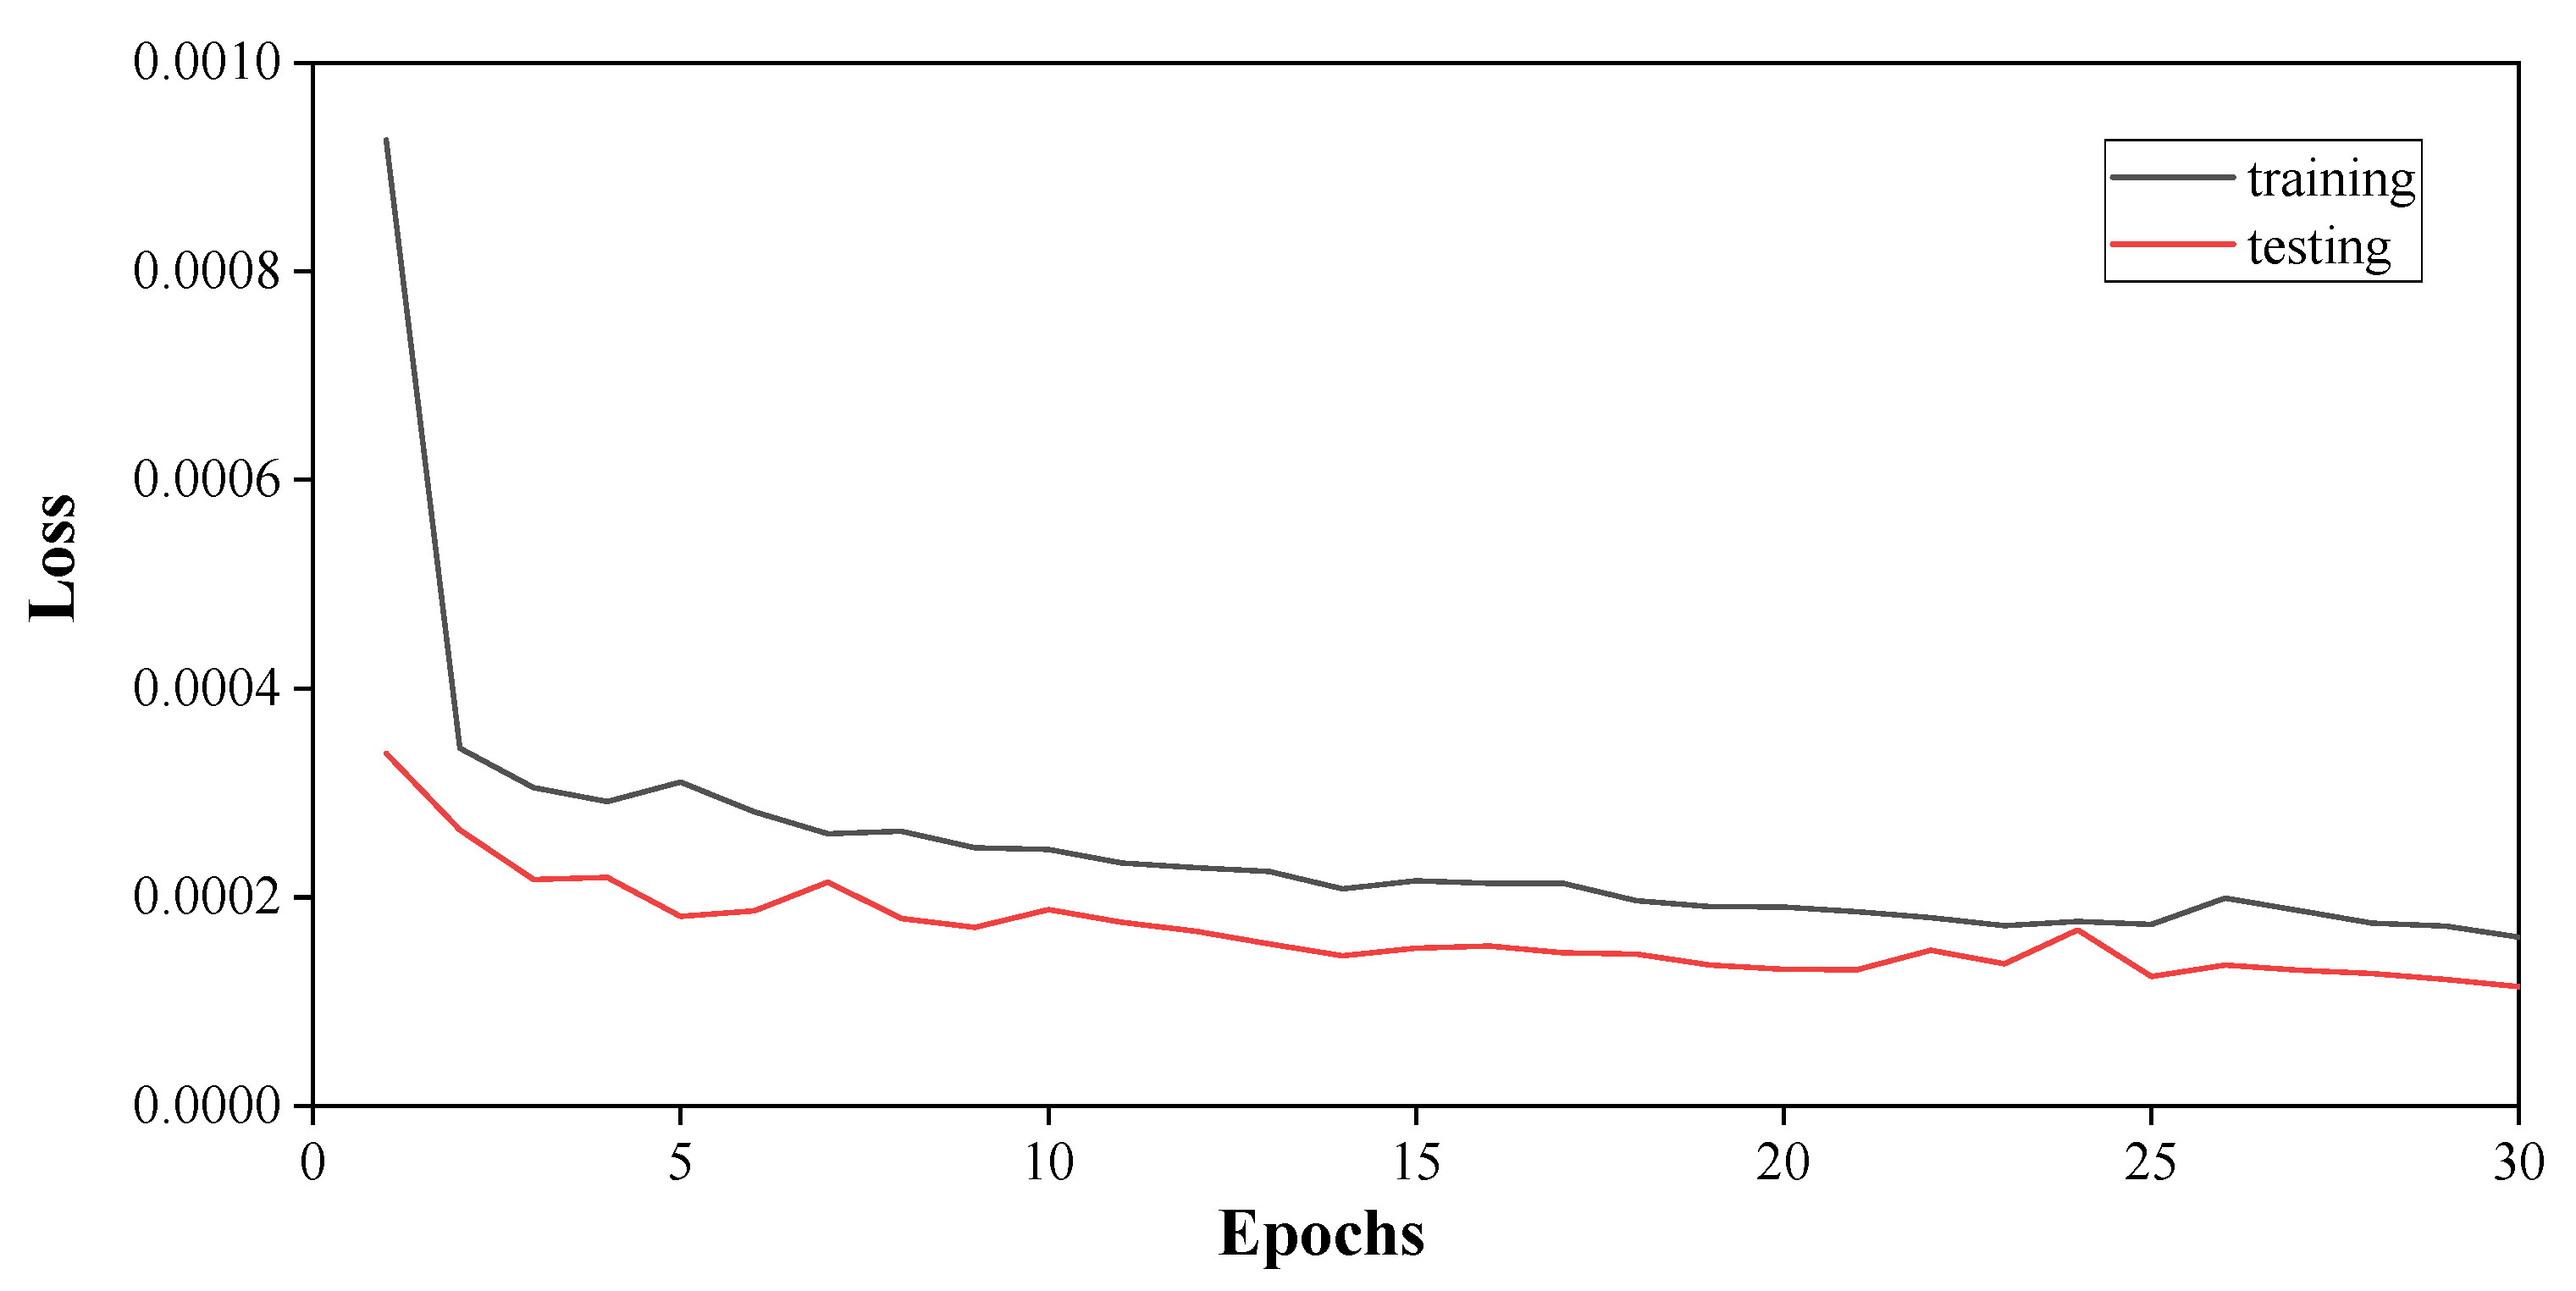
For other parameters of the LSTM neural network, the learning rate is set as 0.001, the activation function is set as Relu, the optimizer is set as Adam, the batch size is set as 128, and the length of the time window is set as 100, by compromising the prediction accuracy and training time consumption. A total of 84,808 samples are generated via a sliding time window with a length of 100. A total of 80% of the sample data are randomly selected as the training set, so that 68,320 training samples and 16,488 testing samples are obtained respectively. MSE (square of RMSE) is used as the loss function of the model. Figure 15 shows the training and testing loss during the training process. The training and testing losses are relatively small, with a significant decrease after five iterations, and remaining at a low level thereafter.
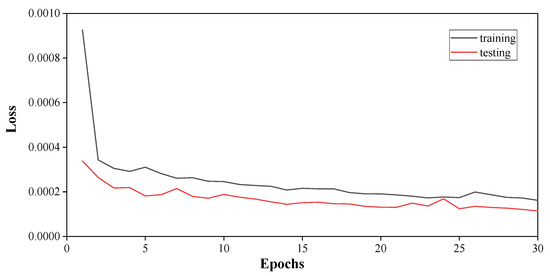
Figure 15.
Training and testing loss during the training process.
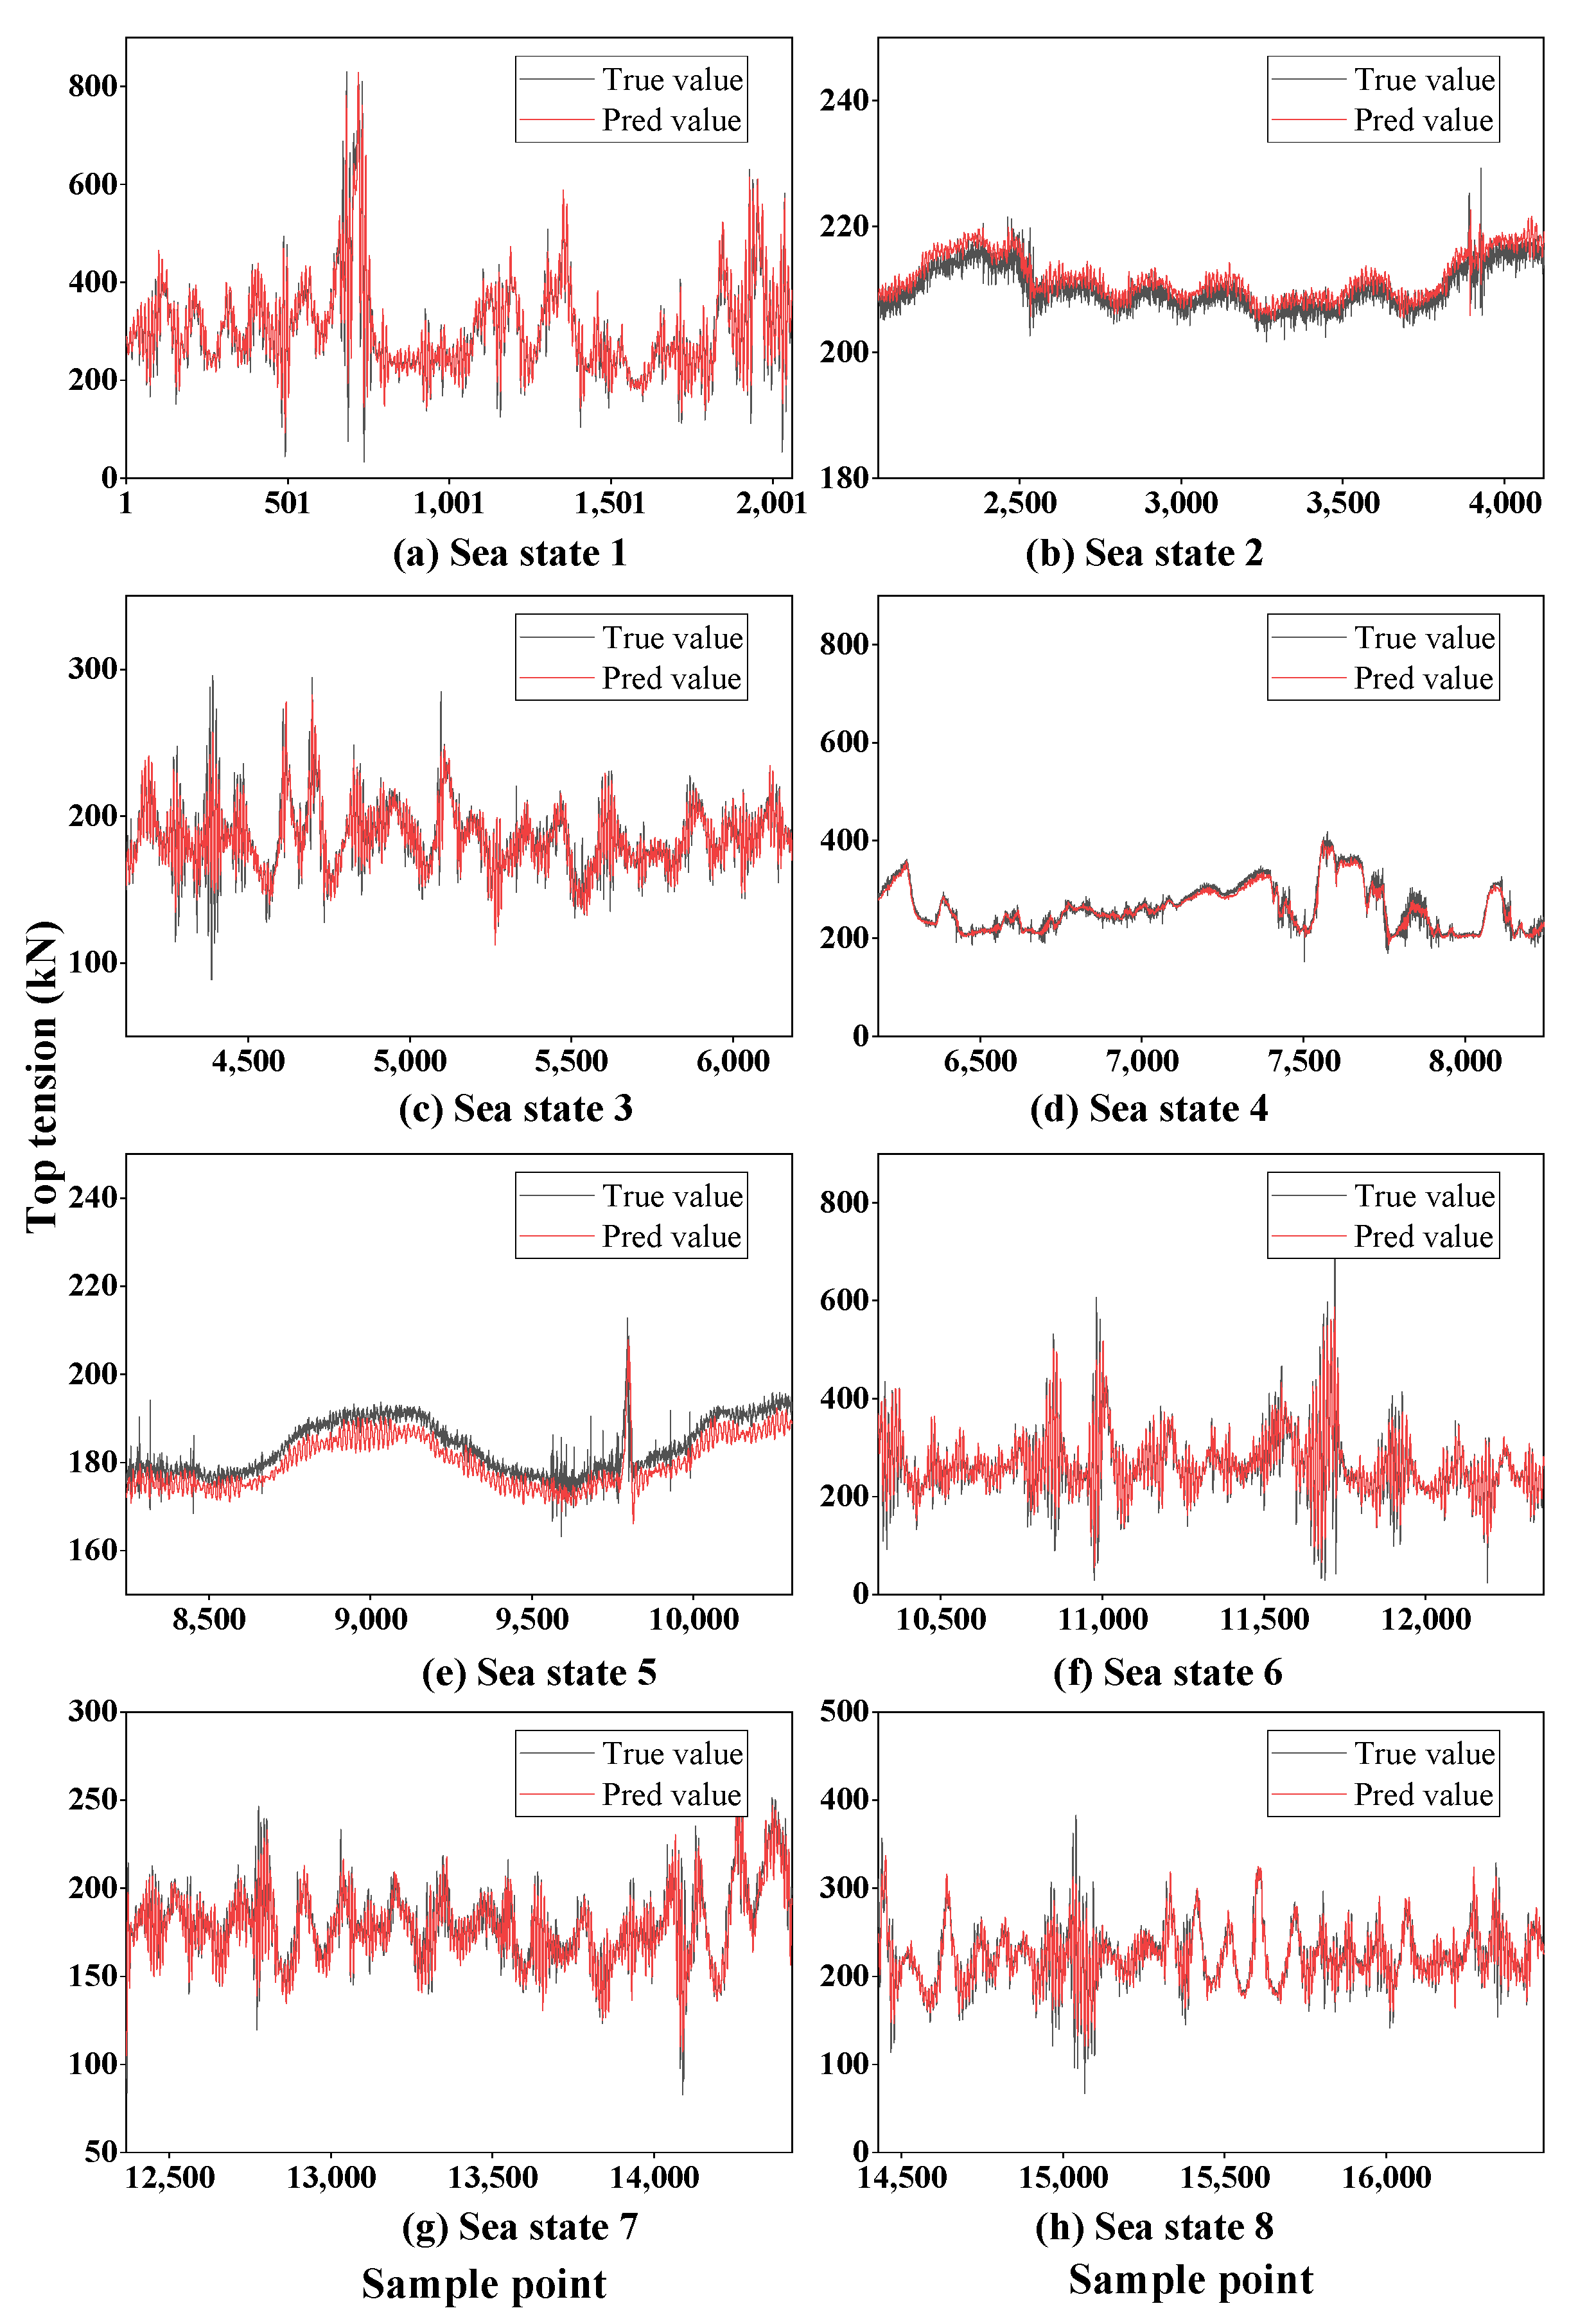
The trained LSTM neural network is used to predict the top-tension of mooring line L1 for the testing set. Figure 16 shows the predicted and the true top-tension of the testing set from sample datasets measured on-site for eight sea states. It can be seen from Figure 16 that the developed LSTM neural network model has excellent prediction performance in all operating conditions. The prediction accuracy of the top-tensions of mooring line L1 under eight different sea states is summarized in Table 7. High prediction accuracy can be achieved with an LSTM neural network to predict the mooring line top-tension with six DOF motions as input.

Figure 16.
Predicted top-tension of mooring line L1.
Table 7.
Prediction accuracy of mooring line top-tension under different sea states.
As can be seen from Table 7, relative to mooring line top-tensions, the RMSE of all sea states is much smaller. The R2 of sea states 2 and 5 are significantly smaller than those of other sea states. According to Equations (7) and (8), the smaller R2 values are due to the small fluctuation in the distribution of mooring line top-tensions near the average value, which can also be seen in Figure 16b,e. However, due to the smaller RMSE value, the prediction model is still suitable for sea states 2 and 5.
6. Conclusions and Discussions
To predict the unmeasurable top-tension of mooring lines, an innovative hybrid method combining existing measured motion data with coupled numerical calculation and ANN is proposed in this work. Firstly, the mapping of measurable motions and unmeasurable tension is established through numerical simulations. An LSTM neural network is established and trained to predict mooring line top-tensions in real-time. In addition, to predict top-tensions more accurately, an inversion method based on genetic algorithms is proposed to identify the loss of clump weights using the measured motion data. The main findings of this study are as follows:
- (1)
- The measured motion data are used to identify the loss of clump weights since it affects the dynamic response of the FPSO and its mooring system. The mooring line components in the numerical model are modified accordingly. The relative error of the maximum horizontal displacement between the numerical results after modification and the measurement is reduced to less than 5%.
- (2)
- Correlation analysis shows that the mooring line top-tension is mostly related to surge and sway motions of the FPSO, so the horizontal motion trajectory of sample data should cover the overall data as much as possible to improve the prediction accuracy.
- (3)
- Through the developed LSTM neural network with a reasonable neural network structure, mooring line top-tensions can be predicted in real-time with a high accuracy by using the measured data of six DOF motions on-site as input.
- (4)
- The LSTM neural network developed in this work is trained with measured motion data from a whole month rather than simulated data, which improves the accuracy of the top-tension prediction of mooring lines.
It should be noted that identifying clump weight loss with the measured data depends on the quality of the data. Hence, it is sensible to predict mooring line top-tensions with the predominant environmental loads on-site to ensure the safety of the FPSO system. In addition, the predicted mooring line top-tensions cannot be compared with measured tensions on-site in this work without tensiometers. This is also the motivation of this study: that the measurable data of FPSO motion are used to map the unmeasurable data of mooring line top-tensions. It is anticipated that the methodology can be verified in practice, if FPSO can be installed with tensiometers in the future. Furthermore, the LSTM neural network used in this work is constrained to utilize one month of measured data encompassing eight distinct sea states. If there are more measured data, the generality of the model will be better.
Author Contributions
Conceptualization, Y.L.; Methodology, Y.L. and J.Z.; Software, J.Z.; Validation, Q.Z.; Formal analysis, X.W.; Investigation, J.Z.; Writing—original draft, J.Z.; Writing—review and editing, Y.L. and Q.Z.; Visualization, J.Z. and Q.Z.; Supervision, Y.L. and X.W. All authors have read and agreed to the published version of the manuscript.
Funding
This work was funded by the National Key Research and Development Program of China (Grant No. 2022YFC2806300).
Data Availability Statement
The data presented in this study are available on request from the corresponding author.
Acknowledgments
The authors are grateful for the support for this research from the CNOOC Energy Development Co., Ltd., Tianjin and State Key Laboratory of Hydraulic Engineering Intelligent Construction and Operation, Tianjin University.
Conflicts of Interest
The authors declare no conflicts of interest.
References
- Kaneko, T.; Wada, R.; Ozaki, M.; Inoue, T. Hybrid Model of a Physics-Based Model and Machine Learning for Real-Time Estimation of Unmeasurable Parts: Mapping from Measurable to Unmeasurable Variables. Ocean. Eng. 2022, 261, 112123. [Google Scholar] [CrossRef]
- Godoy Simoes, M.; Leonidas Merma Tiquilloca, J.; Mitio Morishita, H. Neural-Network-Based Prediction of Mooring Forces in Floating Production Storage and Offloading Systems. IEEE Trans. Ind. Appl. 2002, 38, 457–466. [Google Scholar] [CrossRef]
- de Pina, A.C.; de Pina, A.A.; Albrecht, C.H.; Leite Pires de Lima, B.S.; Jacob, B.P. ANN-Based Surrogate Models for the Analysis of Mooring Lines and Risers. Appl. Ocean. Res. 2013, 41, 76–86. [Google Scholar] [CrossRef]
- Kim, Y. Prediction of the Dynamic Response of a Slender Marine Structure under an Irregular Ocean Wave Using the NARX-Based Quadratic Volterra Series. Appl. Ocean. Res. 2015, 49, 42–56. [Google Scholar] [CrossRef]
- Yetkin, M.; Kim, Y. Time Series Prediction of Mooring Line Top Tension by the NARX and Volterra Model. Appl. Ocean. Res. 2019, 88, 170–186. [Google Scholar] [CrossRef]
- Qiao, D.; Li, P.; Ma, G.; Qi, X.; Yan, J.; Ning, D.; Li, B. Realtime Prediction of Dynamic Mooring Lines Responses with LSTM Neural Network Model. Ocean. Eng. 2021, 219, 108368. [Google Scholar] [CrossRef]
- Zhao, Y.; Dong, S.; Jiang, F.; Incecik, A. Mooring Tension Prediction Based on BP Neural Network for Semi-Submersible Platform. Ocean. Eng. 2021, 223, 108714. [Google Scholar] [CrossRef]
- Guarize, R.; Matos, N.A.F.; Sagrilo, L.V.S.; Lima, E.C.P. Neural Networks in the Dynamic Response Analysis of Slender Marine Structures. Appl. Ocean. Res. 2007, 29, 191–198. [Google Scholar] [CrossRef]
- Christiansen, N.H.; Torbergsen Voie, P.E.; Høgsberg, J.; Sødahl, N. Efficient Mooring Line Fatigue Analysis Using a Hybrid Method Time Domain Simulation Scheme. In Proceedings of the ASME 2013 32nd International Conference on Ocean, Offshore and Arctic Engineering, Nantes, France, 9–14 June 2013; Volume 1. [Google Scholar]
- Ji, C.-Y.; Yuan, Z.-M.; Chen, M.-L. Study on a New Mooring System Integrating Catenary with Taut Mooring. China Ocean. Eng. 2011, 25, 427–440. [Google Scholar] [CrossRef]
- Yuan, Z.; Ji, C.; Chen, M.; Zhang, Y. Coupled Analysis of Floating Structures with a New Mooring System. In Proceedings of the International Conference on Offshore Mechanics and Arctic Engineering—OMAE, Rotterdam, The Netherlands, 19–24 June 2011; Volume 6. [Google Scholar]
- Yuan, Z.M.; Incecik, A.; Ji, C. Numerical Study on a Hybrid Mooring System with Clump Weights and Buoys. Ocean. Eng. 2014, 88, 1–11. [Google Scholar] [CrossRef]
- Lee, K.; Chung, M.; Kim, S.; Shin, D.H. Damage Detection of Catenary Mooring Line Based on Recurrent Neural Networks. Ocean. Eng. 2021, 227, 108898. [Google Scholar] [CrossRef]
- Toromanovic, J.; Knutsson, S.; Mattsson, H.; Laue, J. Parameter Identification for an Embankment Dam Using Noisy Field Data. Proc. Inst. Civ. Eng. Geotech. Eng. 2020, 173, 519–534. [Google Scholar] [CrossRef]
- Maier, G.; Ardito, R.; Fedele, R. Inverse Analysis Problems in Structural Engineering of Concrete Dams; Computational Mechanics Tsinghua University Press & Springer: Beijing, China, 2004; pp. 97–107. [Google Scholar]
- Yu, Y.; Liu, X.; Wang, E.; Fang, K.; Huang, L. Dam Safety Evaluation Based on Multiple Linear Regression and Numerical Simulation. Rock. Mech. Rock. Eng. 2018, 51, 2451–2467. [Google Scholar] [CrossRef]
- Holland, J.H. Adaptation in Natural and Artificial Systems: An Introductory Analysis with Applications to Biology, Control, and Artificial Intelligence; MIT Press: Cambridge, MA, USA, 1975. [Google Scholar]
- Goldberg, D.E. Genetic Algorithms in Search, Optimization, and Machine Learning, Addison-Wesley, Reading, MA, 1989. NN Schraudolph J. 1989, 3, 9. [Google Scholar]
- Shafieefar, M.; Rezvani, A. Mooring Optimization of Floating Platforms Using a Genetic Algorithm. Ocean. Eng. 2007, 34, 1413–1421. [Google Scholar] [CrossRef]
- Xia, L.Y.; Zhi, L.; Chen, L.; Cheng, Y. Optimization Design and Calculation of Mooring System Parameters Based on Genetic Algorithm. In Proceedings of the 4th International Conference on Mechatronics and Mechanical Engineering (ICMME 2017), Lumpur, Malaysia, 28–30 November 2017; Volume 153. [Google Scholar]
- Pillai, A.C.; Thies, P.R.; Johanning, L. Mooring System Design Optimization Using a Surrogate Assisted Multi-Objective Genetic Algorithm. Eng. Optim. 2019, 51, 1370–1392. [Google Scholar] [CrossRef]
- BV-NR-493; Classification of Mooring Systems for Permanent and Mobile Offshore Units. Bureau Veritas: Calgary, AB, Canada, 2021.


Disclaimer/Publisher’s Note: The statements, opinions and data contained in all publications are solely those of the individual author(s) and contributor(s) and not of MDPI and/or the editor(s). MDPI and/or the editor(s) disclaim responsibility for any injury to people or property resulting from any ideas, methods, instructions or products referred to in the content. |
© 2025 by the authors. Licensee MDPI, Basel, Switzerland. This article is an open access article distributed under the terms and conditions of the Creative Commons Attribution (CC BY) license (https://creativecommons.org/licenses/by/4.0/).