Abstract
Pump station engineering is extensively utilized in water supply and drainage, as well as agricultural irrigation. Due to its geographical advantages and significant comprehensive benefits, the construction of pumping stations in coastal areas has gained substantial attention in recent years. Adverse flow conditions caused by various factors negatively affect the inlet flow regime of pumps, becoming a key factor that restricts the operating life and further development of pump station systems. Optimizing the flow regime in the forebay is crucial for enhancing overall engineering quality, minimizing pump performance degradation, and reducing the risks of cavitation and vibration. This study investigates the flow characteristics of the forebay by combining the Navier–Stokes equations and the RNG turbulence model. The analysis focuses on the internal flow field, transverse flow before the inlet channel, and the uniformity of flow velocity distribution after the inlet channel. Numerical simulations are validated through physical model tests. We examine the flow characteristics in the forebay, analyze the causes of internal flow disorder, and propose a reasonable and practical rectification scheme for the forebay. Additionally, we elucidate the mechanism of flow state optimization through partition walls. The findings indicate that with the optimal partition wall length, the average elimination rate of transverse flow velocity before the pump station inlet channel reached 48.3%, and the uniformity of flow velocity distribution after the inlet increased by 3.24%. These research findings contribute to mitigating cavitation and vibration in water pump units, providing theoretical support for the safe operation of coastal pumping stations.
1. Introduction
Coastal pumping stations effectively manage and allocate water resources, providing essential support for agriculture, industry, and urban development in coastal areas. They demonstrate considerable flexibility, adjusting to meet varying water resource management challenges. These advantages enable coastal pumping stations to play a pivotal role in water resource management, ecological protection, and economic development. The design of the forebay of a large coastal low-head pump station should meet the requirements of stable water flow state, uniform velocity distribution, and no adverse flow state [1,2]. The pump station hydraulic system is shown in Figure 1. For large low-head pump stations using multiple units, the flow of water from the diversion channel into the forebay of the forward-flow pump station is significant, and the main flow is relatively concentrated, unable to disperse in time. When the units operate asymmetrically, the flow distribution in the forebay is uneven, leading to adverse phenomena such as biased flow, reverse flow, and vortices, as shown in Figure 1a. Especially at the inlet of the channel with a diffusion angle, significant transverse flow can be observed, which can further induce the formation of surface vortices at the inlet of the channel. In severe cases, intermittent or continuous air ingestion vortices may occur [3], as shown in Figure 1b. These two types of vortices have high intensity, and gas will enter the pump with the vortices, causing a decrease in all aspects of pump performance, affecting the safety and stability of the pump station operation. Therefore, proposing universally effective measures to improve the flow regime in the design of the forebay of the pump station is crucial.
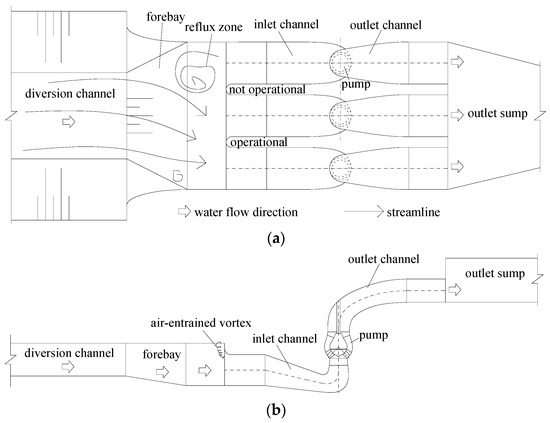
Figure 1.
Hydraulic system of pumping station. (a) Layout plan; (b) elevation.
Research in the forebay of the pump station is primarily conducted by scholars through model tests and numerical simulation calculations [4,5,6], which provide strong guarantees for the stable operation of the pump station [7]. The following rectification measures have been proposed by scholars in the forebay of pump stations to improve or eliminate unfavorable flow regimes in the forebay and increase the efficiency of pump operation.
Setting up guide piers in the forebay [8,9,10,11] can adjust the direction of the incoming flow and distribute the flow reasonably, achieving the goal of making the water flow smoothly and evenly distributed, thus effectively avoiding adverse hydraulic phenomena such as backflow and vortices in the forebay. The installation of columns [12,13,14] in the forebay can cause the water flow to contract, flow evenly to both sides, and then spread to the side walls, preventing spillage. Using the rectification method of bottom ridges [15,16,17,18] in the forebay offers the advantages of a simple structure, convenient construction, good rectification effect, and small hydraulic loss.
As research on the rectification measures for the forebay of pumping stations deepens, scholars have gradually proposed various combined rectification methods [19,20]. Han et al. [21] installed a rectifier grid and a bottom sill at the inlet bend, combined with multiple guide piers at the inlet of the forebay. This significantly reduced the backflow area in the forebay and improved the axial velocity uniformity near the inlet section by 9.8% after rectification. Feng et al. [22] discussed the flow state of the pumping station inlet and methods to improve the flow state, proposing measures such as multiple water holes, bottom sills, and deflectors. Nasr Ahmed et al. [23] implemented parabolic walls and rectifier piers, significantly enhancing the flow state in the forebay of the lateral inlet pump station, increasing the uniformity of flow velocity distribution by 8%, and reducing the vortex area by 70%, thereby improving the operating efficiency of the pump. Zheng et al. [24] observed that by adding a combination of bottom sill and diversion pier rectifier facilities, the uniformity of flow velocity distribution improved by 3.8%, 5.51%, and 7.46% when Units #3, #4, and #5 were simultaneously turned on. Li et al. [25] focused on the flow state of the forebay of pumping stations, proposing rectification measures such as transverse beams, breast walls, and columns to improve the inlet conditions of pumping stations and enhance operational reliability.
There are several reference measures for improving the flow state in the forebay of coastal pumping stations. B. Matyakubov et al. [26] enhanced the hydraulic characteristics of the intake structure’s cross-section to achieve better flow conditions. Khasanov Bakhreddin et al. [27] examined the influence of the inlet leading edge area and the ratio of the opening structure, as well as the formation and interaction mechanisms of vortex areas on the suction pipe. Kyu Jung Chae et al. [28] implemented a maximum water level tracking control scheme in the forebay and precisely adjusted the turbine blade angles based on the incoming flow, ensuring water strikes the blades in the optimal direction for maximum efficiency. A. M. Arifjanov et al. [29] developed a mathematical model for water distribution dynamics, considering the shape of the forebay, velocity field, and both longitudinal and transverse distributions in the forebay and intake section of the pump station.
Despite numerous studies investigating methods to improve the flow regime in the forebay of pumping stations, existing research often focuses on design improvements specific to individual stations due to varying design parameters. Consequently, a universal rectification measure remains undeveloped. This paper innovatively analyzes the flow regime of pumping stations with different partition lengths based on numerical models and experimental results of hydraulic characteristics under various working conditions. It elucidates the variation of hydraulic components in the forebay and inlet channel with the partition wall length and proposes effective strategies for enhancing the inlet regime in more universally applicable and cost-effective forebay designs. The research findings offer valuable insights for the design and optimization of similar pump station forebays.
2. Numerical Calculation Model Design
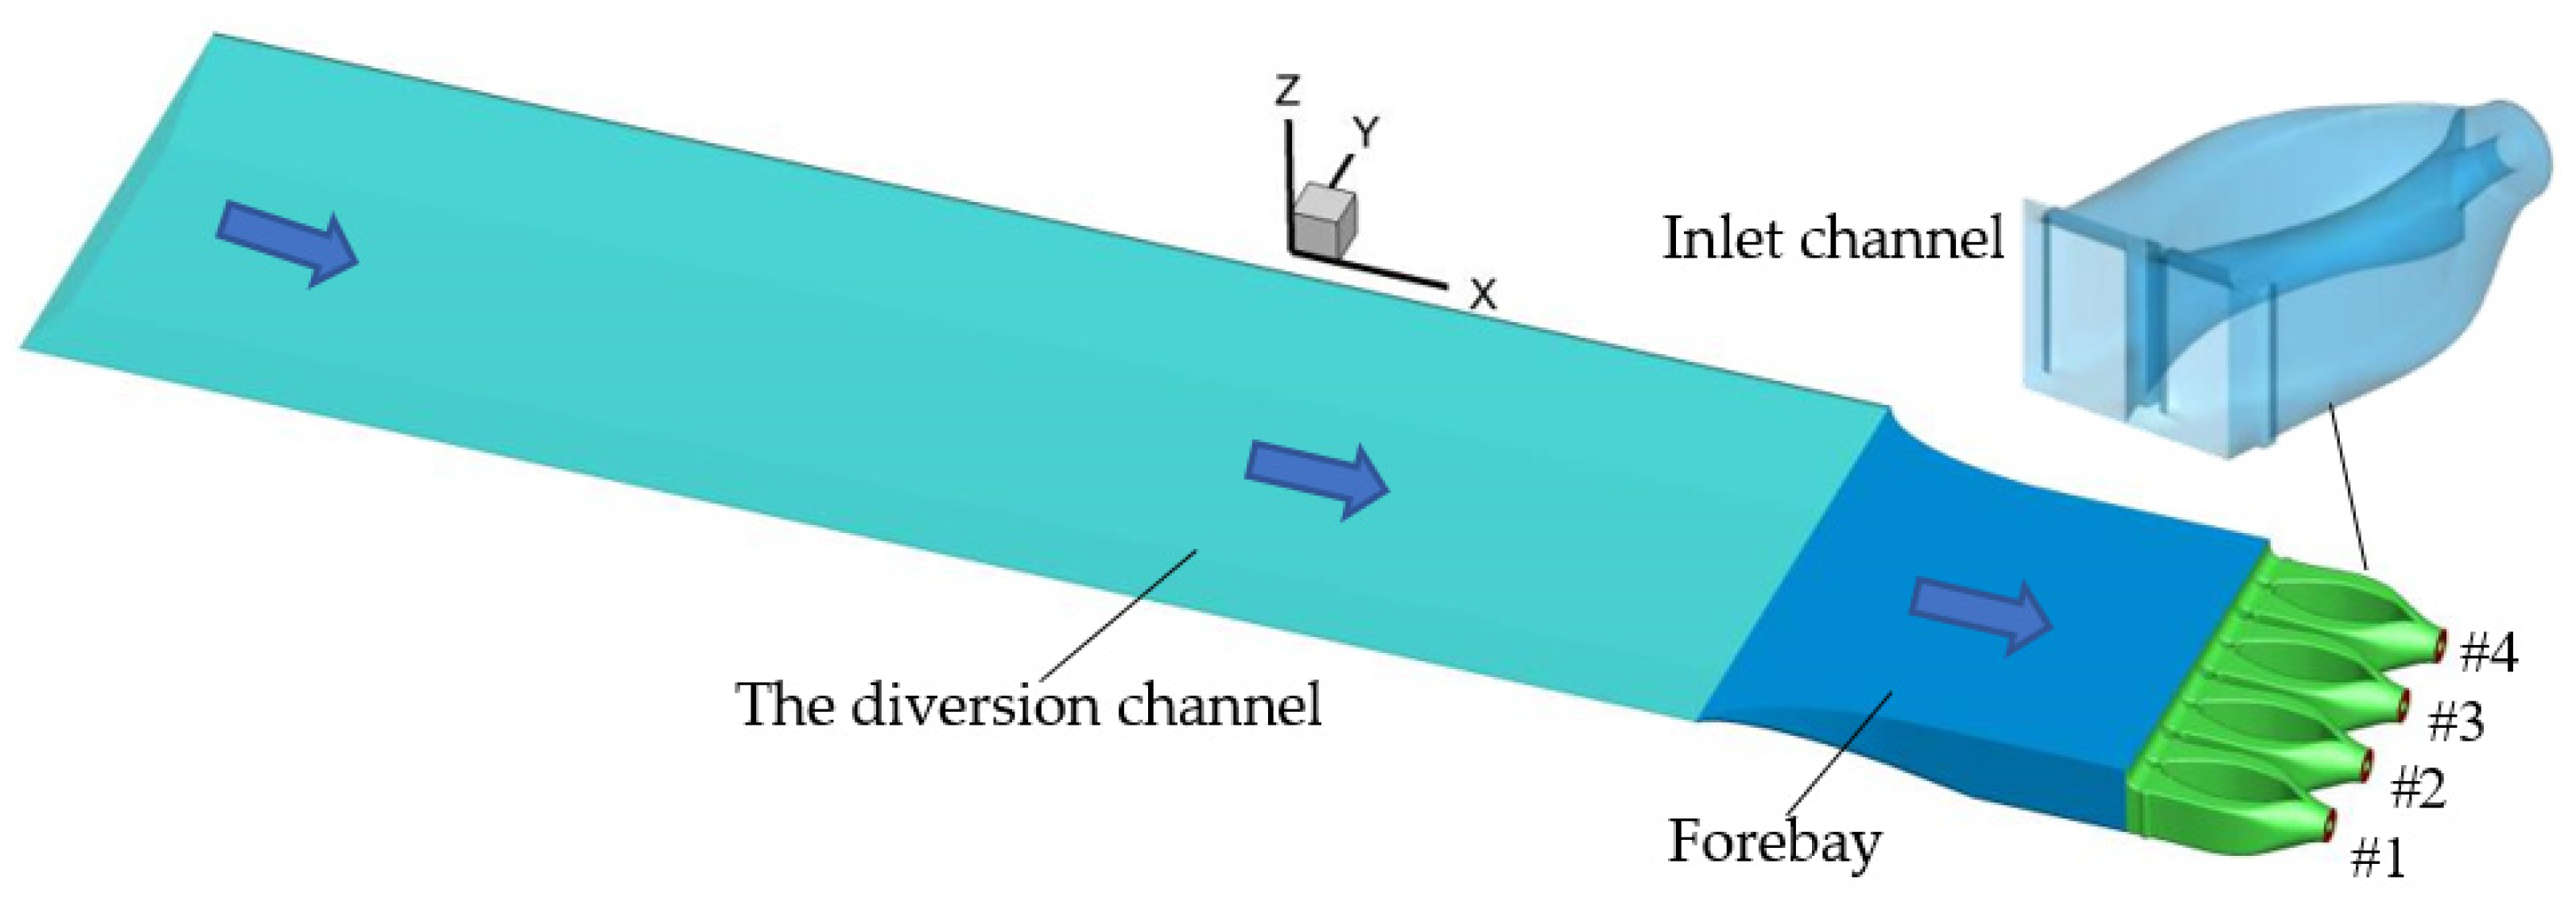
The study examines a large coastal low-head pumping station, which features vertically aligned axial-flow pump units symmetrically positioned in the forebay. It includes the diversion channel, forebay, and inlet channels, and employs a forward-facing inlet forebay with a planar diffusion angle of 28 degrees. The bottom level of the diversion channel is at 15.0 m, while the unit inlet channel has a bottom elevation of 12.0 m. The inlet section has dimensions of 6.3 m in height and 8.0 m in width. Figure 2 illustrates the pump station’s layout, and Table 1 contains detailed parameters.

Figure 2.
Layout of forebay of pumping station.

Table 1.
The detail parameters of pump station.
The study examines symmetrical arrangements, considering a total of nine distinct combinations of operating conditions, where individual units can be activated or deactivated. To determine the optimal flow regime in the forebay under different operational scenarios, this research conducts numerical simulations of the flow field for each scenario at the lowest operational water level. Four representative operational combinations were chosen for in-depth analysis, as detailed in Table 2. The four pump units are sequentially numbered #1 to #4 (refer to Figure 2).
Table 2.
Operational combinations for flow field calculation in the forebay of the pumping station.
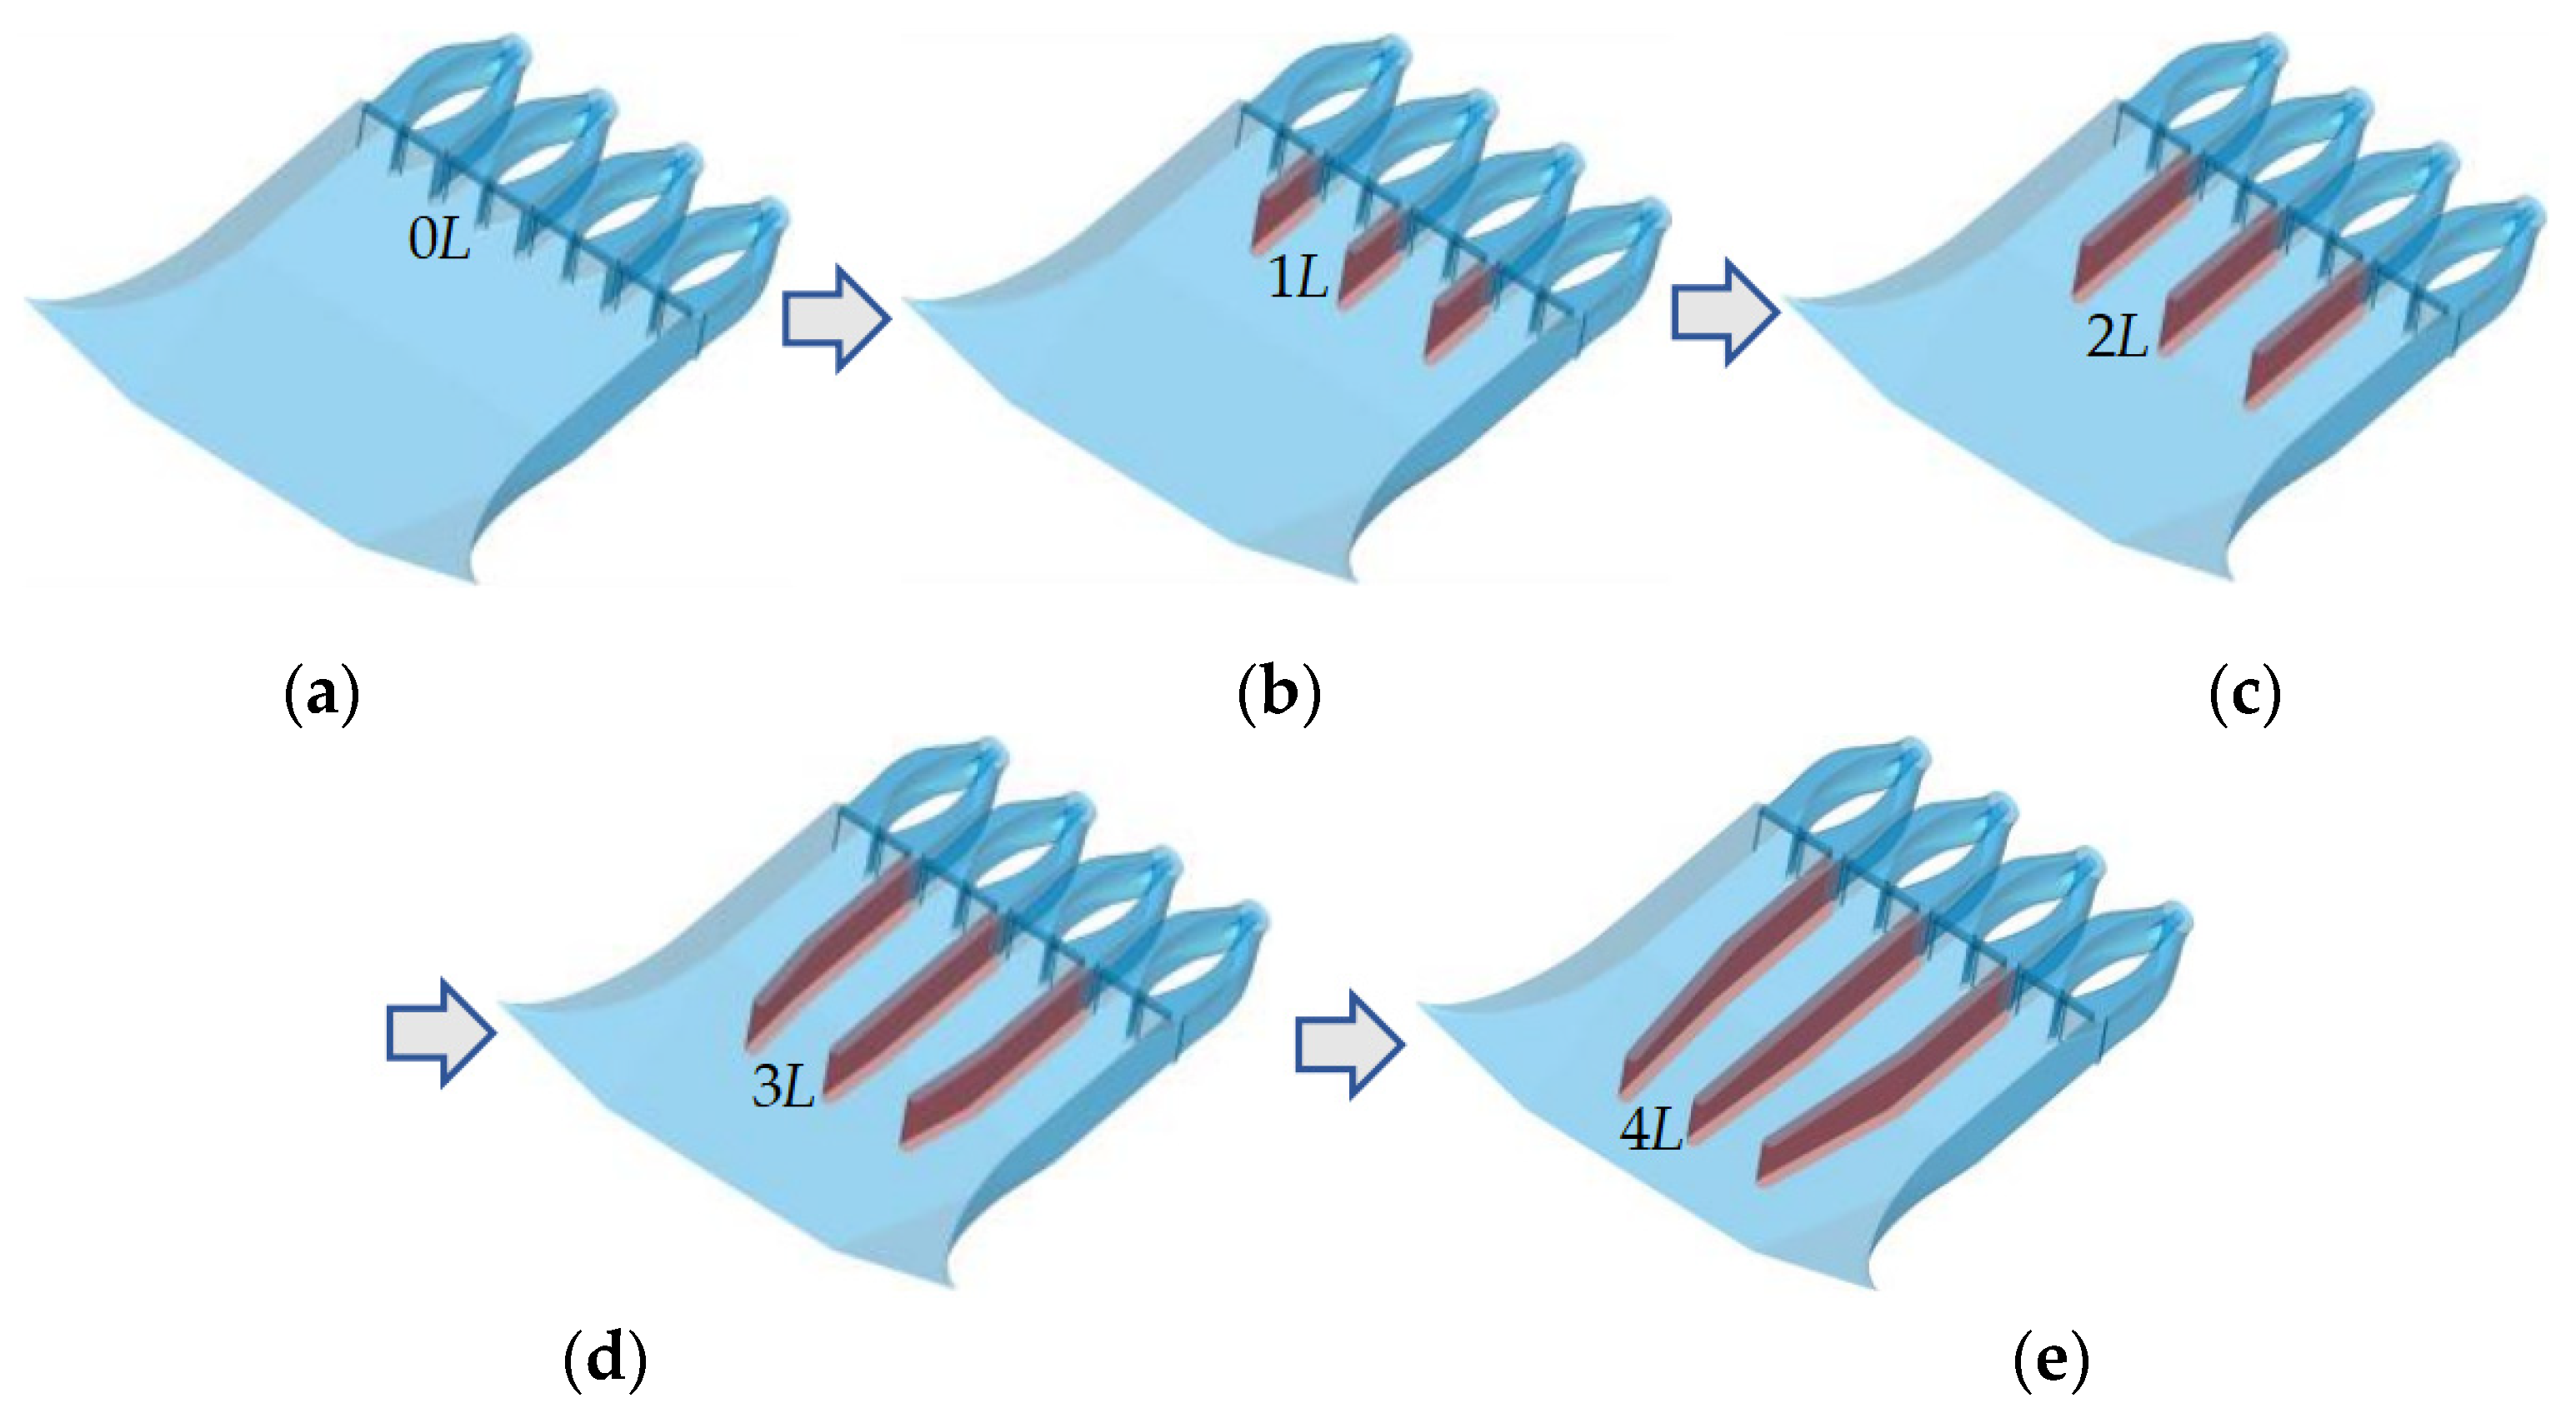
Proactive steps were undertaken to enhance the inlet flow pattern by installing partition walls in the forebay. The width of each partition wall corresponds to the width of the separating pier between the channels, while the length of each wall is a multiple of the channel inlet width, set at 8.0 m. Partition wall lengths include multiples of the channel inlet width: 0, 1, 2, 3, and 4 times. The additional partition wall starts from the head of the baffle pier between the inlet channels. When added to the forebay diffusion section, the left and right walls bend along the bottom of the forebay. Various partition wall arrangements in the forebay are illustrated in Figure 3.

Figure 3.
Partition wall arrangements. (a) Arrangement 1; (b) arrangement 2; (c) arrangement 3; (d) arrangement 4; (e) arrangement 5.
3. Experimental System
3.1. Introduction to Experimental Model
On-site experiments were conducted to examine the changes in flow regime within the pump station forebay, both with and without a partition wall. Water circulation was facilitated by a kinetic pump in a closed-loop pipeline to simulate river inflow, and an LDY-200S electromagnetic flow meter (Guanghua Instrument Co., Ltd., Shanghai, China) controlled the total flow rate. The inlet flow channel was connected to the kinetic pump, and the pipeline was linked to the upper flow channel to mimic the pump station’s operation. An LDY-100S electromagnetic flow meter (Guanghua Instrument Co., Ltd., Shanghai, China) controlled the flow rate of each pump unit, as illustrated in Figure 4.
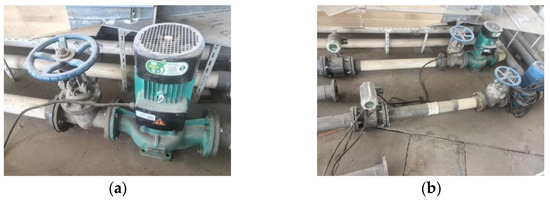
Figure 4.
Kinetic pump and electromagnetic flow meter. (a) Circulating pipeline kinetic pump; (b) electromagnetic flowmeter.
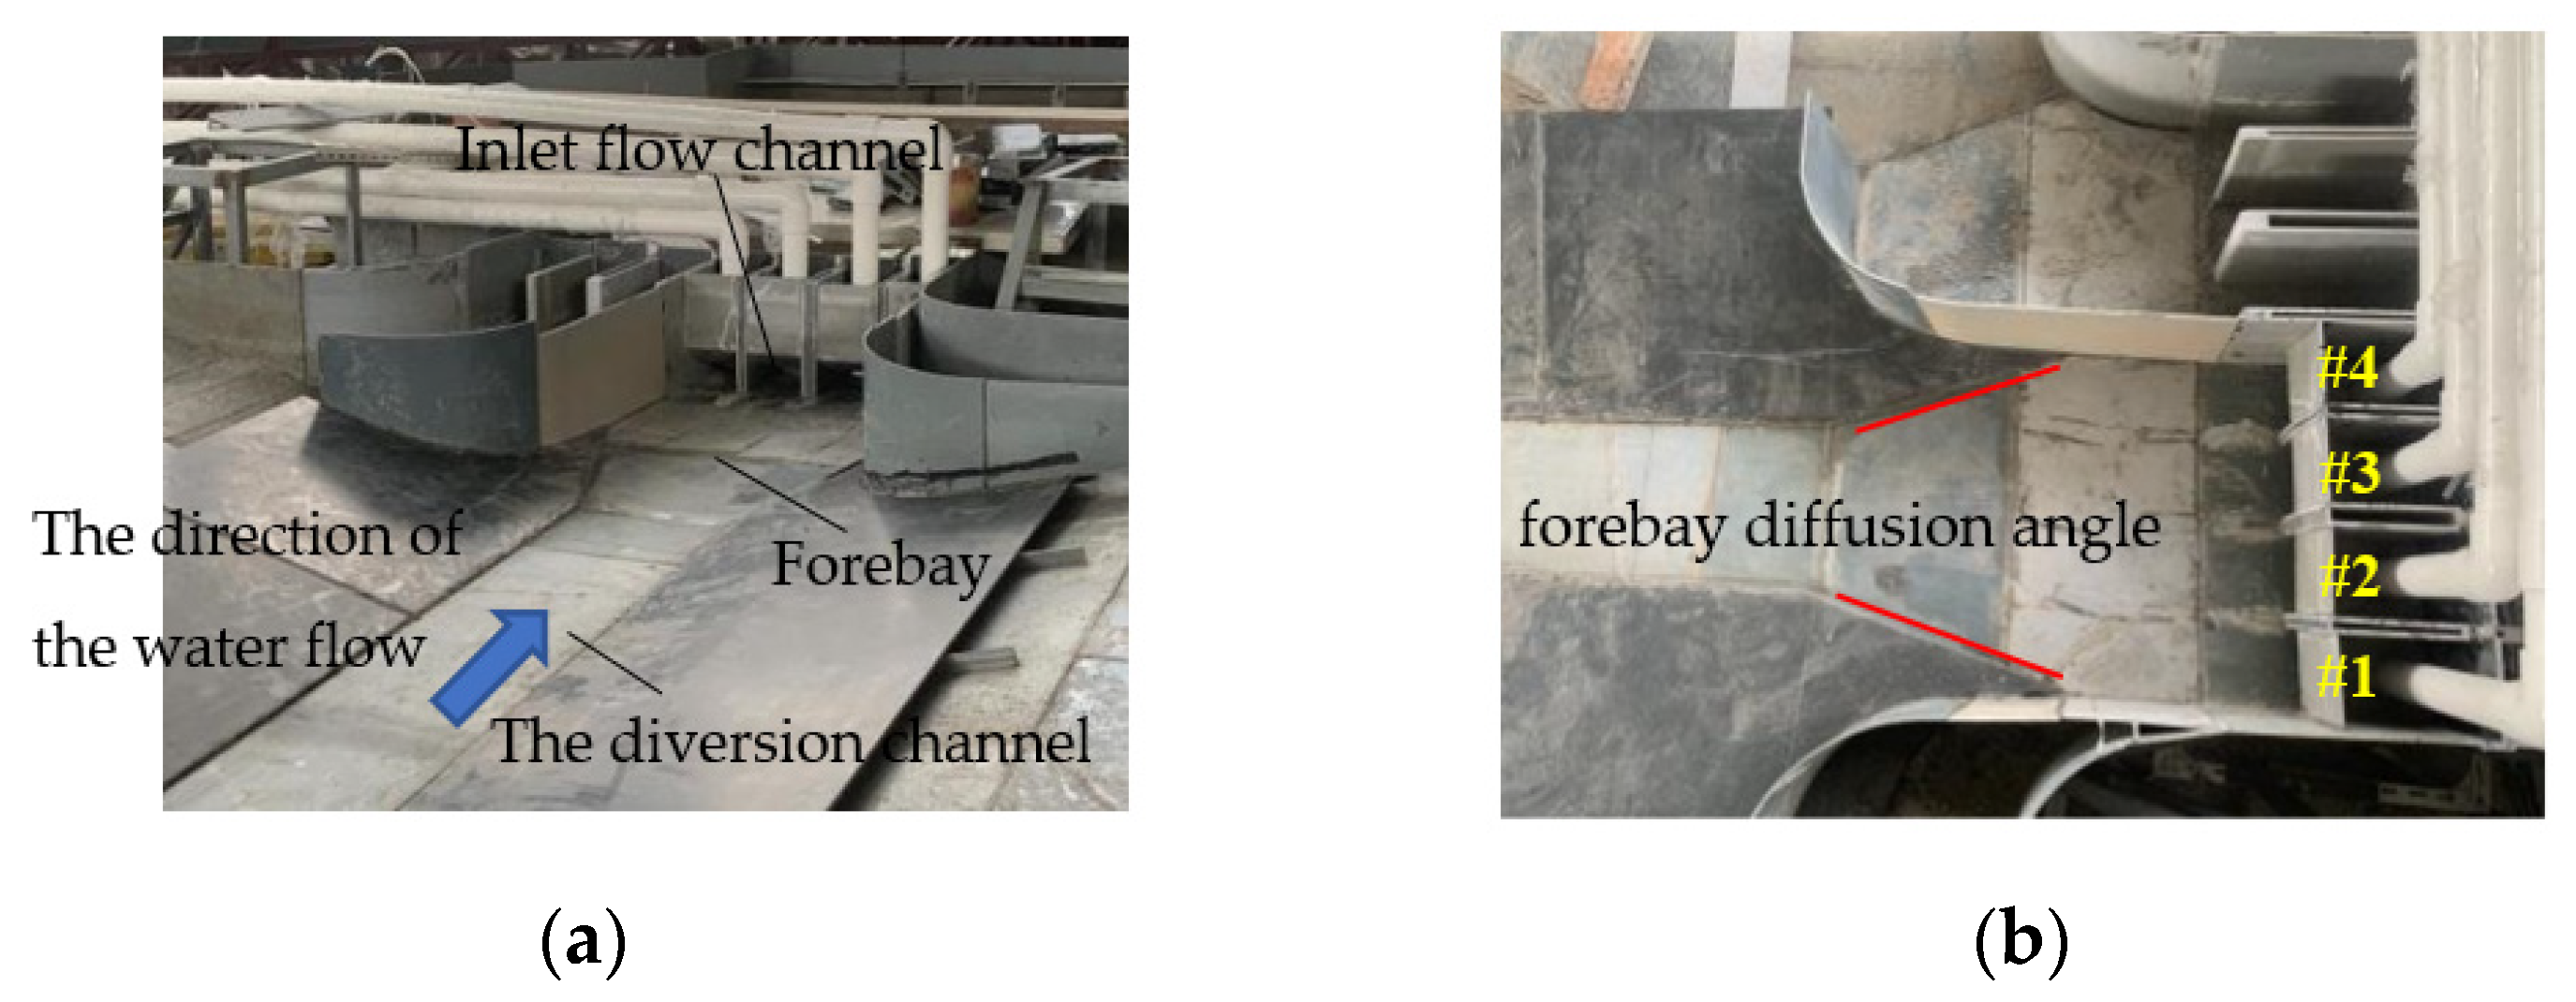
Under the condition of minimum submergence depth at the channel inlet, the water level stability in the model was controlled by adjusting the flow rates of both the circulation pipeline pump and the pumping station pump during the experiment. The WYD-III wireless intelligent water level gauge (Hydraulic Research Institute, Nanjing, China) monitored real-time water level changes. A photo of the physical model is shown in Figure 5.

Figure 5.
Photo of physical model. (a) Layout of physical model; (b) Forebay diffusion angle and unit number.
3.2. Experimental Parameters
Given that gravity was the main force affecting the water flow during the experiments, gravity similarity was taken into account. At the same time, a normal model was employed to ensure that various local hydraulic phenomena in the water flow were preserved. This design guaranteed that the gravity similarity adhered to the Froude number (Fr):
where is fluid velocity, m/s; is gravitational acceleration, m/s2; and is characteristic length, m.
Based on the criteria and corresponding regulations of geometric similarity, flow motion similarity, and dynamic similarity, the geometric scale ratio should not be less than 1:50.
where is model geometric scale ratio; is prototype length, m; is model length, m.
The experimental model presented in this paper is established based on the dimensions and layout of the pump station engineering, the conditions of the experimental hall, the available equipment, supply capacity, and the precision of the measuring instruments. The detailed parameters of the pump station test model are provided in Table 3.
Table 3.
The detail parameters of pump station test model.
According to the criteria for geometric, kinematic, and dynamic similarity [30,31], the ratio of flow velocities was calculated to be 7.071, while the ratio of roughness was found to be 1.919. Based on the model roughness criterion [32], taking into account the similarities in resistance and the range of prototype roughness (from 0.011 to 0.020), the equivalent model roughness coefficient varied between 0.00573 and 0.01042. The model was fabricated using high-quality polyvinyl chloride (PVC) greyboards with a roughness coefficient between 0.007 and 0.010, meeting the test requirements. The model’s overall accuracy, along with the manufacturing and installation procedures, adhered to the specifications outlined in the model test.
3.3. Experimental Methods
For these model tests, four typical operational arrangements (#1–#4) detailed in Table 2 were chosen. The operating scenarios for these arrangements were designed as follows: arrangement 1 utilized only unit #1, arrangement 2 involved the concurrent operation of units #1 and #2, arrangement 3 featured the simultaneous functioning of units #1 to #3, and arrangement 4 encompassed the simultaneous operation of all four units (#1–#4). The pumping units were numbered sequentially from right to left as #1 to #4 when observed in the direction of flow (Figure 5).
Based on the results from numerical simulations, enhancements to the inlet flow pattern were made by incorporating partition walls within the forebay. The width of these walls matched that of the separating pier between the channels, while the characteristic length L represented the width of the inlet flow channel. The lengths of the walls across the various arrangements were as follows: 0L for arrangement 1, 1L for arrangement 2, 2L for arrangement 3, 3L for arrangement 4, and 4L for arrangement 5, respectively. To study the flow conditions during the pumping station’s operation and the effect of partition wall lengths on the inlet flow pattern, the tests were conducted employing the following methodologies:
- Particles of potassium permanganate mixed with sand were applied to the surface of the forebay to visualize the flow occurring at the bottom.
- Flow velocity at the inlet channel’s front was recorded using a velocimeter under different conditions. The collected data were analyzed to determine the distribution of transverse flow velocity in front of the pumping station’s inlet channel.
4. Numerical Methods and Verification
4.1. Flow Governing Equations
The water present in the forebay of the pumping station is regarded as a uniform and incompressible fluid characterized by a consistent viscosity. Its three-dimensional turbulent flow can be represented through the continuity and Navier–Stokes equations. Additionally, two equations, specifically for turbulent kinetic energy and its dissipation rate , are necessary to complete the set of equations. The Reynolds averaged method is commonly utilized in numerical simulations of flow fields within the forebays of low-head pumping stations. The continuity and Navier–Stokes equations are expressed as follows:
where is the density, kg/m3; is the time, s; and are the components of average velocity, m/s; and are the coordinates; is the average pressure, Pa; is the dynamic viscosity coefficient, N·s/m2; is the component of volumetric force in -direction; and is the Reynolds stress.
In order to enhance the governing equations, the Boussinesq hypothesis is applied, relating Reynolds stress to turbulent viscosity:
where is the turbulent kinetic energy, is the Kronecker delta, and is the turbulent kinetic energy dissipation rate.
The equations for and of the RNG turbulent model are as follows:
where is the generation term of turbulent kinetic energy, , , and are empirical constants, with , , and .
4.2. Boundary Conditions
The numerical simulation of three-dimensional flow in the forebay is conducted using the finite volume method for equation discretization. The inlet is positioned sufficiently far upstream in the channel from the forebay’s inlet section, closely aligning with the pump station’s actual operation. This model represents a forward inlet pump station forebay and employs velocity inlet boundary conditions. The simulation encompasses the inlet channel section to ensure accurate flow field calculations at the exit of the inlet channel, which is extended along the normal direction to ensure fully developed flow. Outflow boundary conditions are set, and the outlet of the computational fluid domain is positioned at a distance of two diameters from the inlet channel’s outlet section. The boundary walls of the diversion channel, forebay, and inlet channel are treated using the wall function method. To simplify computations and reduce time, the free-slip rigid lid assumption is applied to the free water surface boundary, neglecting heat exchange and conduction between the free surfaces of the diversion channel and the forebay and the air. Specific settings for the numerical simulation are detailed in Table 4.
Table 4.
Specific settings of numerical simulation.
4.3. Grid Meshing and Grid Independence Analysis
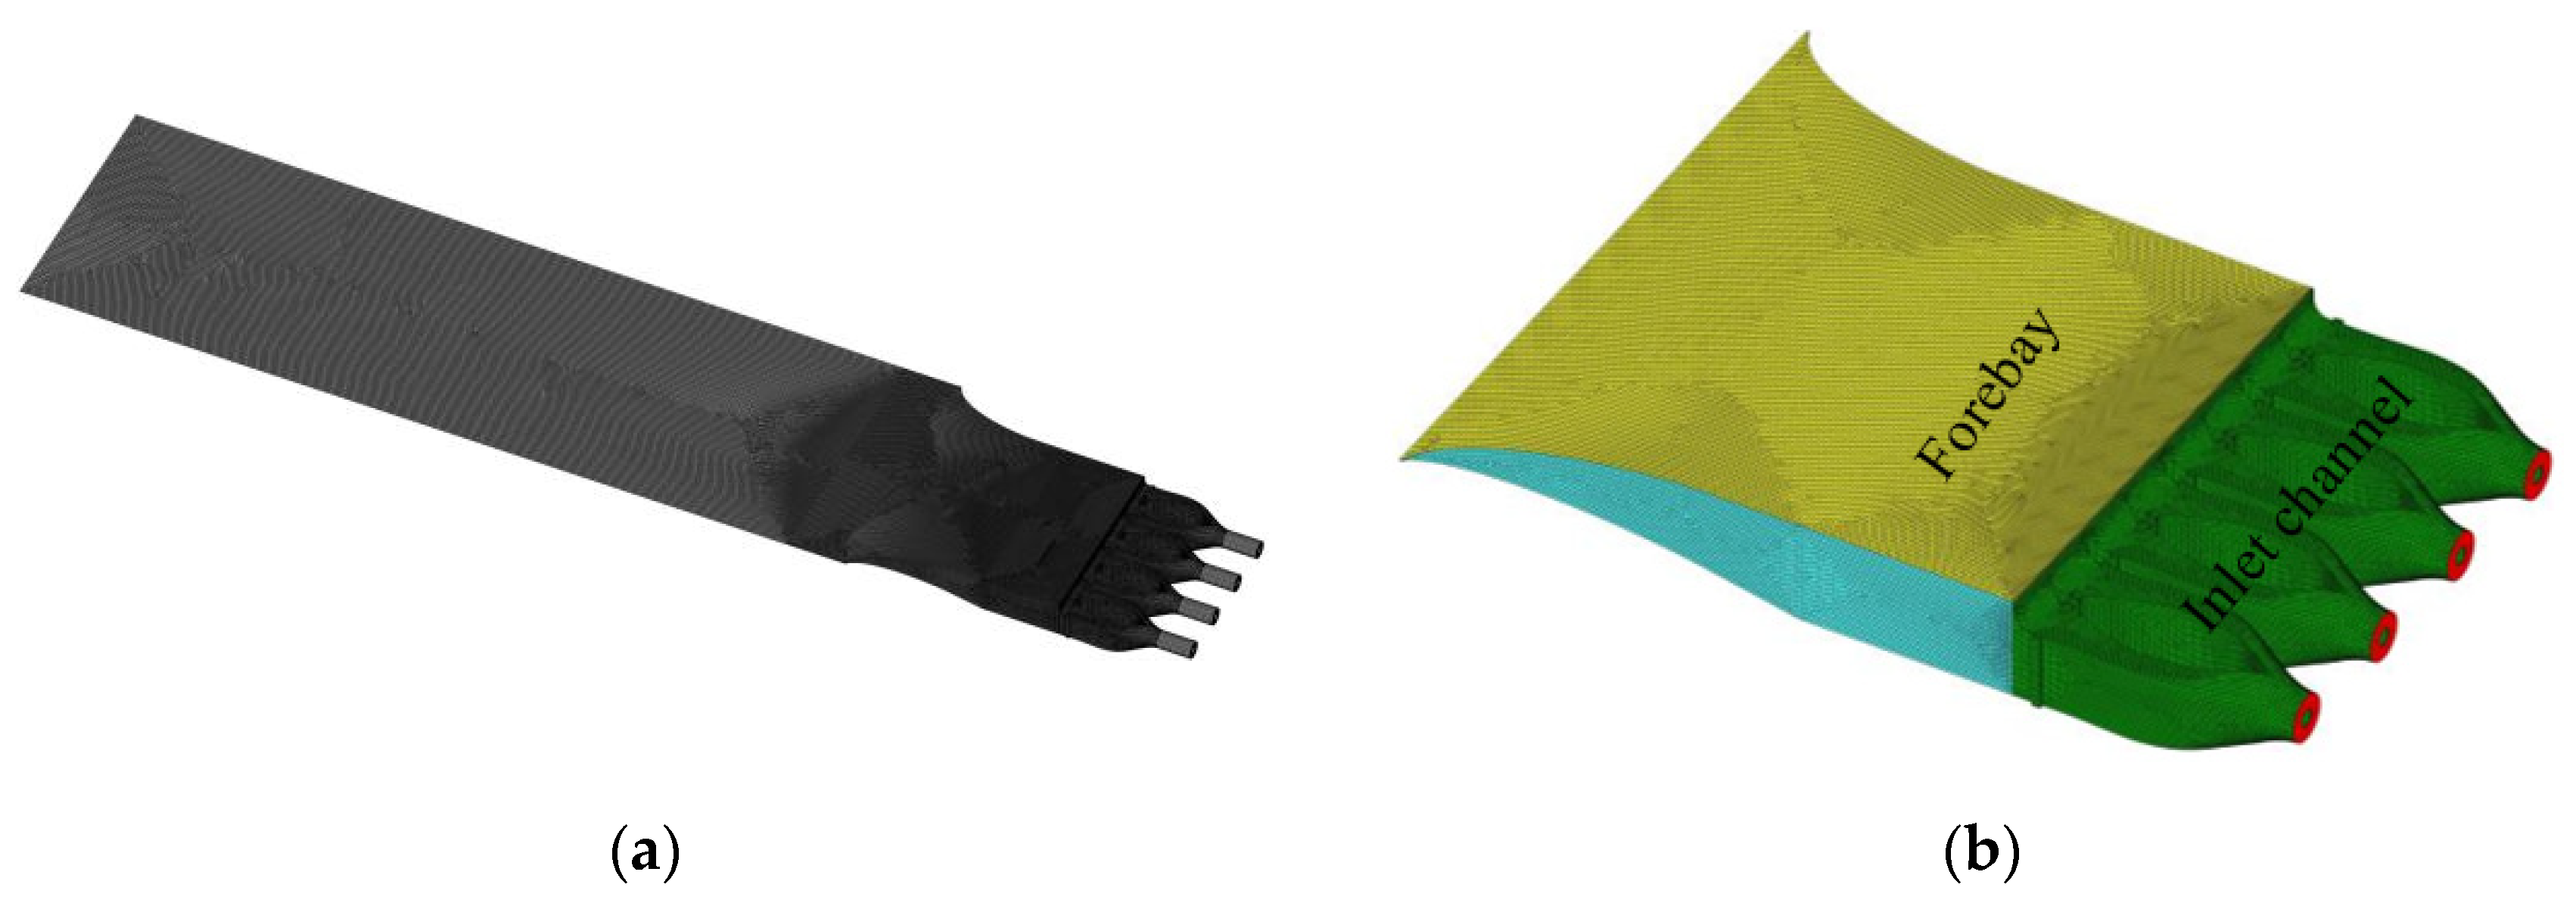
Based on the inlet structure of the pump station, the model is divided into three parts: diversion channel, forebay, and inlet channel. Given the geometric characteristics of the forebay, a hybrid method of structured and unstructured grids is employed to partition the computational domain. This study provides a detailed analysis of the flow field in the forebay of the pump station. In numerical simulations, it is crucial to balance the number of grids with the complexity of the computational object structure to achieve an appropriate y+. For detailed studies of the flow field in the pump station forebay, inlet pool, and suction pipe, especially when examining vortex suppression devices, the computational domain y+ should strictly adhere to the 30–500 wall function method requirements [33] to effectively capture various vortices, particularly wall vortices. Consequently, local grid refinement is applied to the near-wall areas of the forebay and channel. The maximum y+ value in this calculation is approximately 240. At the outlet of the inlet channel, the requirement to capture the characteristics of wall vortices is fulfilled, enhancing the efficiency and accuracy of the pump station flow field calculation and evaluation. Figure 6 illustrates the area for numerical simulation of three-dimensional flow and the grid division of the forebay flow field.

Figure 6.
Mesh generation of computational domain. (a) Computational domain; (b) forebay.
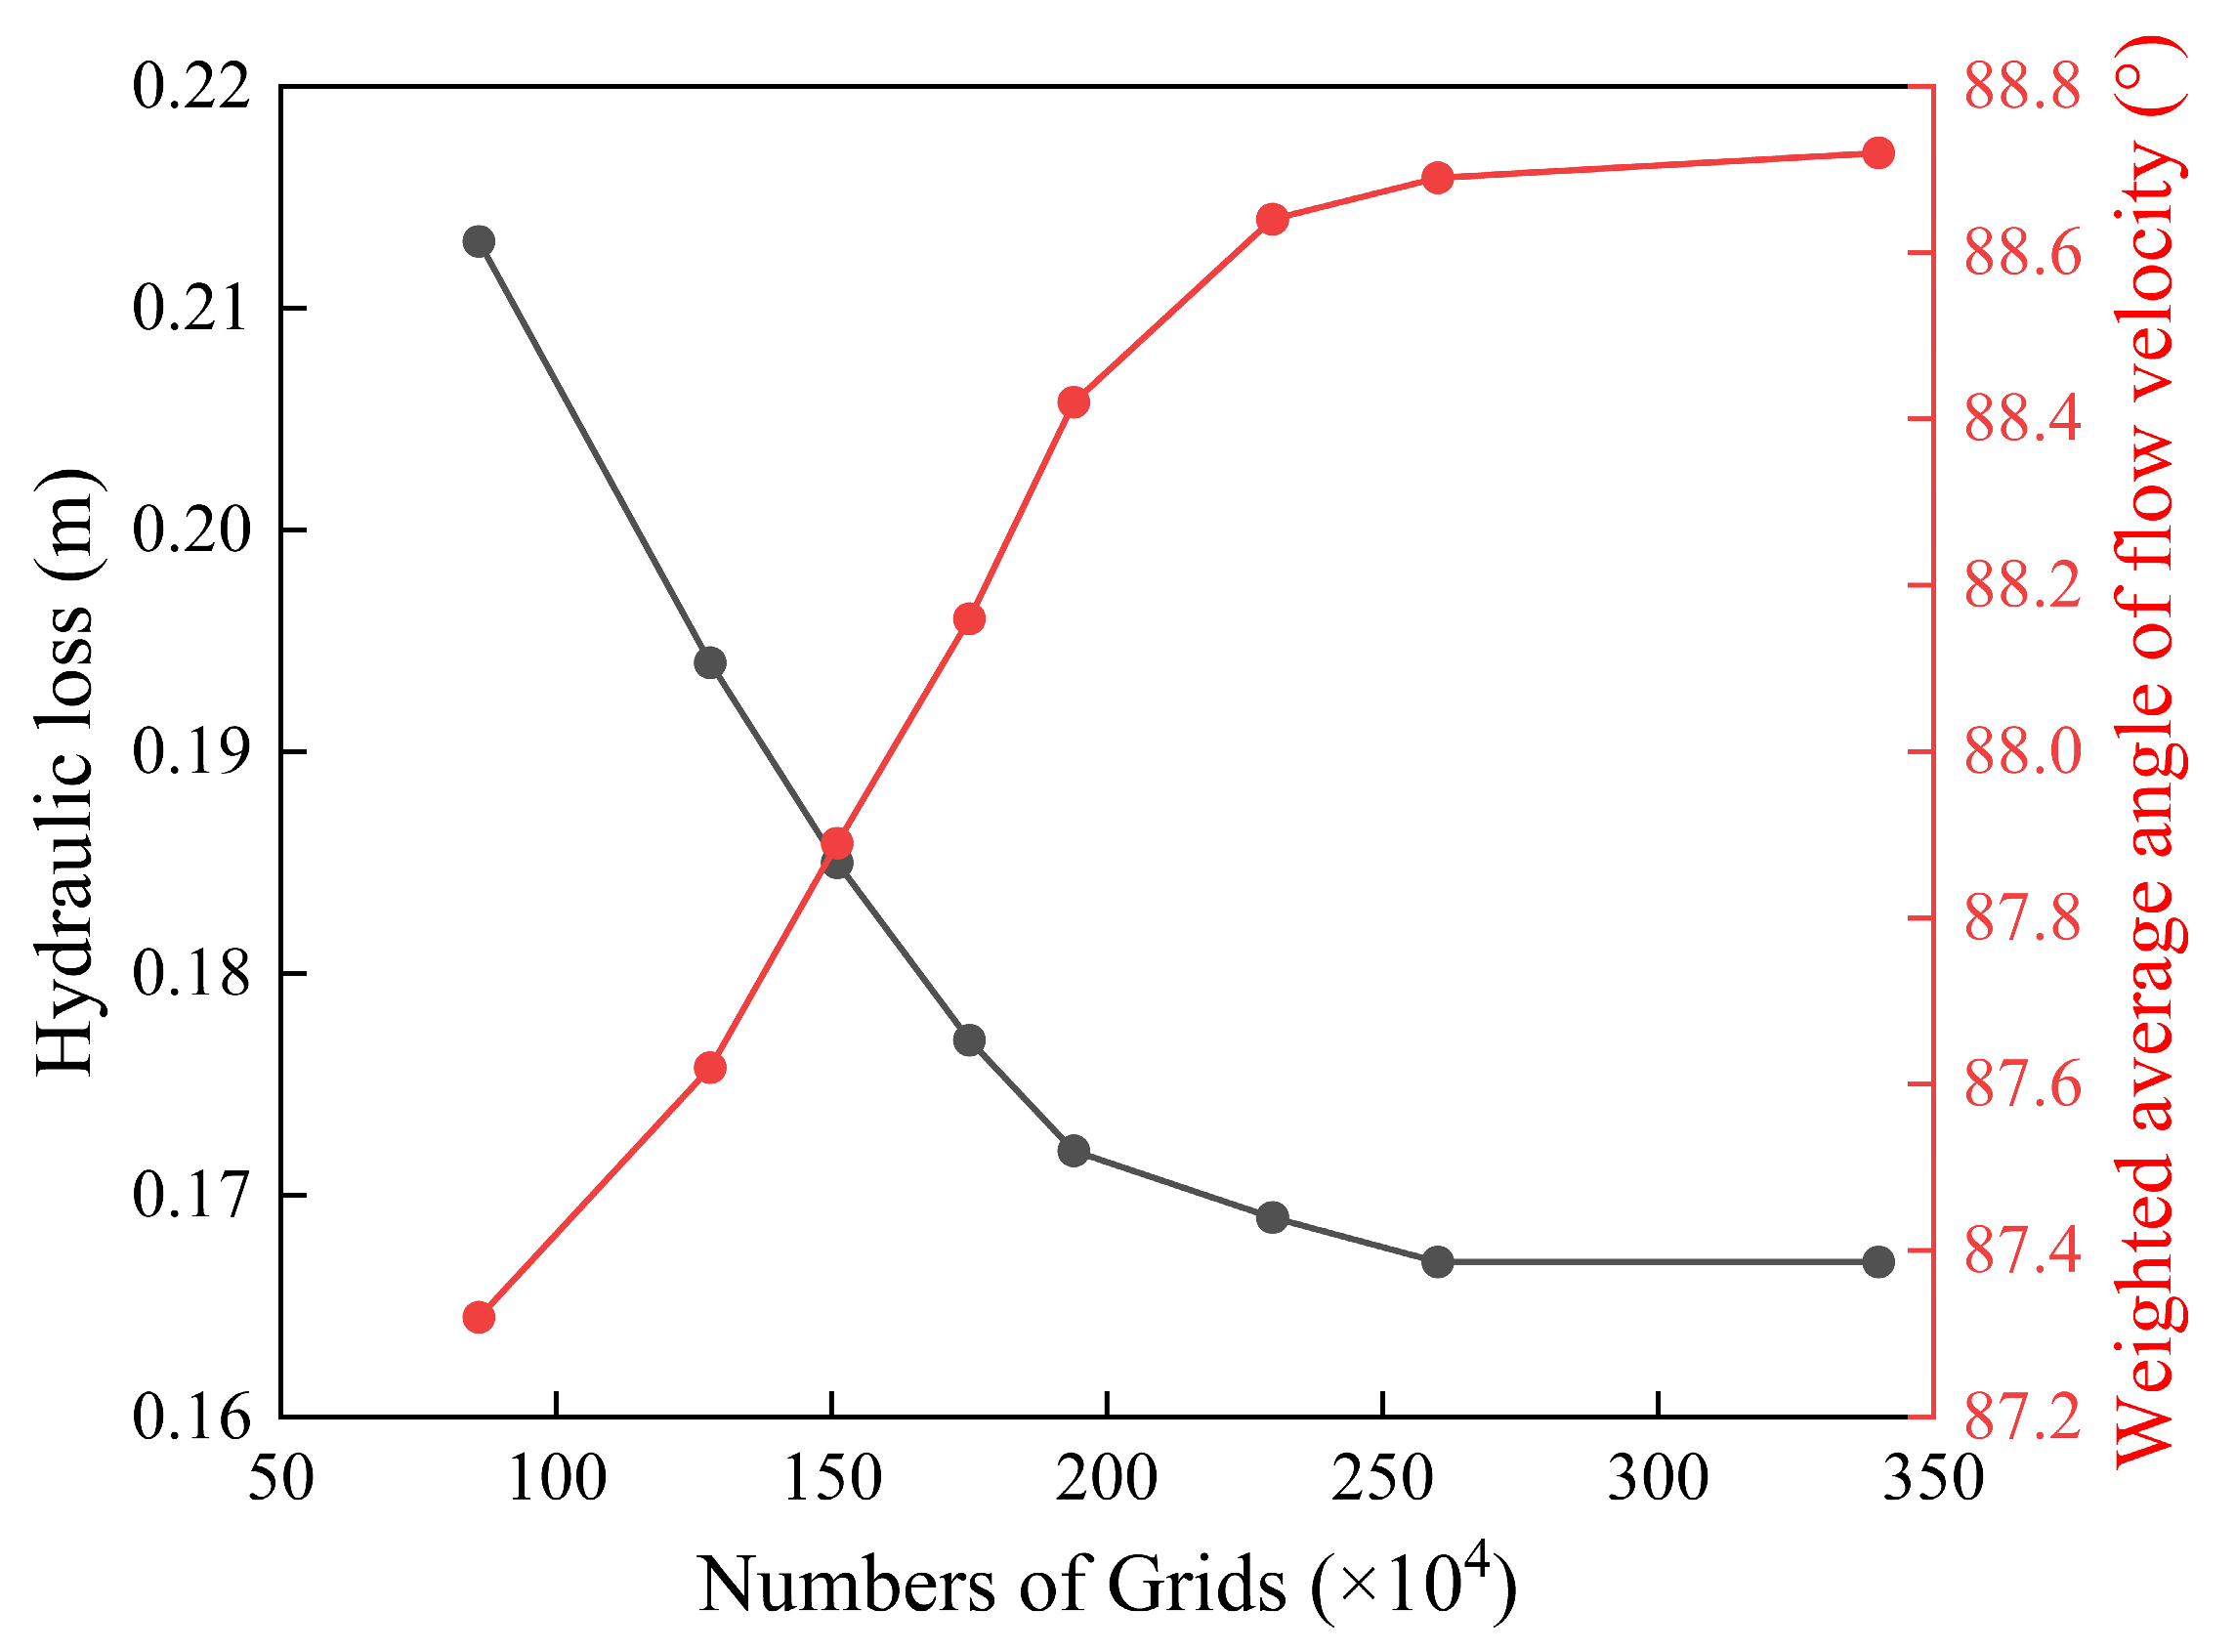
Considering the impact of mesh density on accuracy and computational cost, hydraulic loss and the weighted average angle of flow velocity are selected as the judgment index for mesh independence. The independence of the computational domain grid has been verified, and the grid independence check for the forebay flow field is illustrated in Figure 7. The results indicate that hydraulic loss and the weighted average angle stabilize when the grid number exceeds 2.6 million. Consequently, for this computation, the grid count is set at 2.6 million.
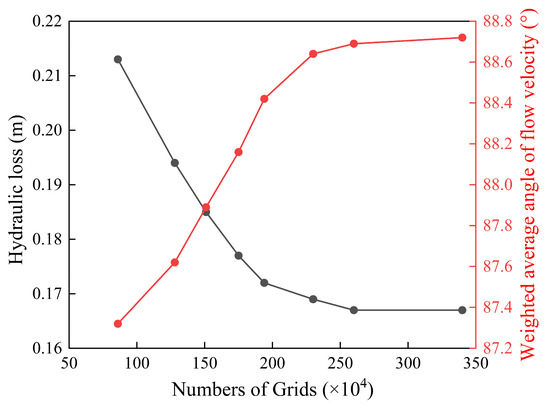
Figure 7.
Grid convergence study.
5. Results and Discussions
5.1. Analysis of Numerical Simulation Results
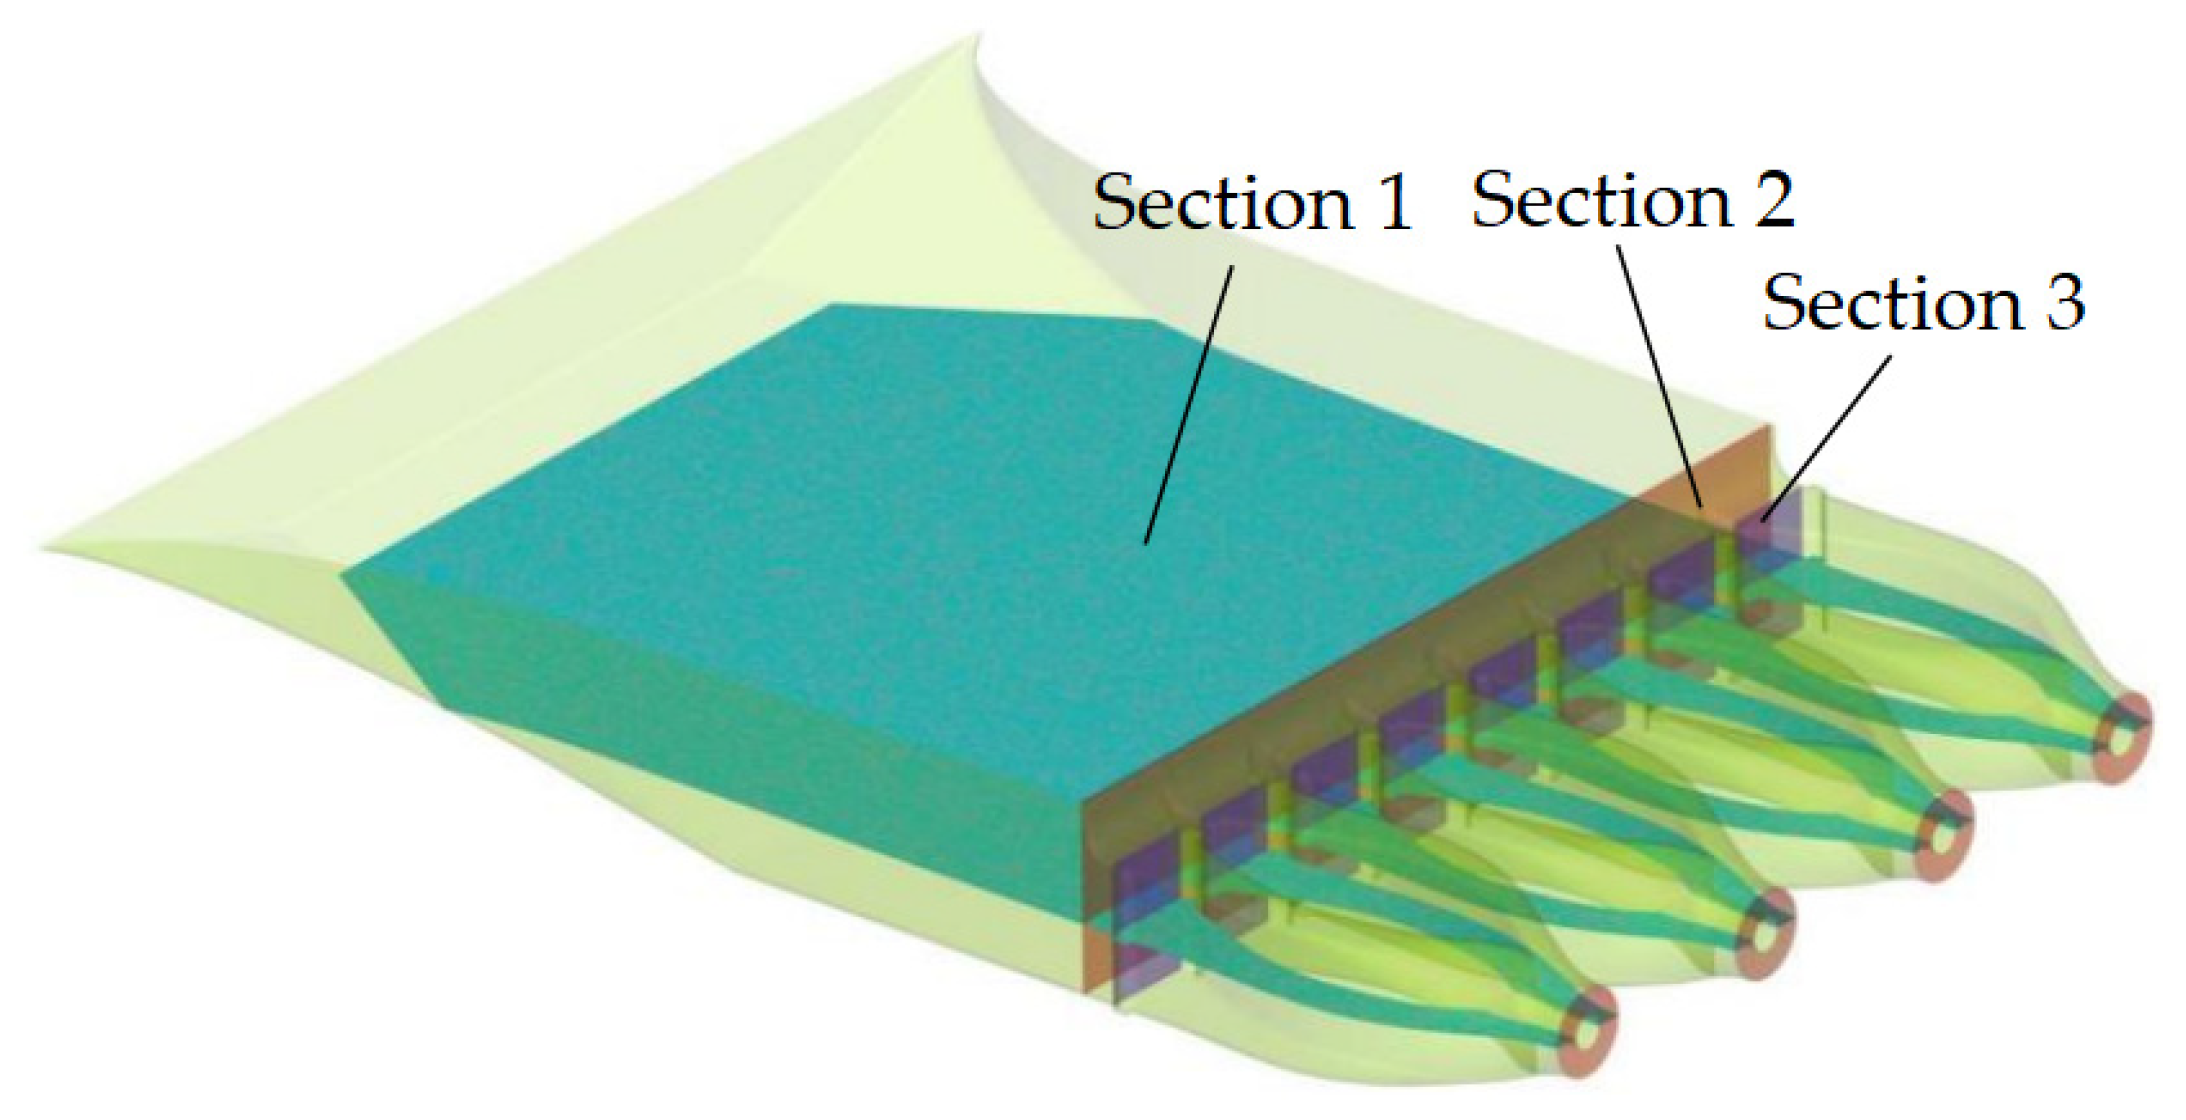
To analyze the internal flow characteristics within the forebay, three specific sections were selected, as illustrated in Figure 8. Section 1 corresponds to a horizontal plane situated in the middle layer of the forebay, while Sections 2 and 3 are vertical planes positioned in the upstream and downstream areas of the inlet channel, respectively. These sections were identified to examine the flow conditions at designated locations.

Figure 8.
Section position of flow field of forebay.
5.1.1. Flow Field Analysis
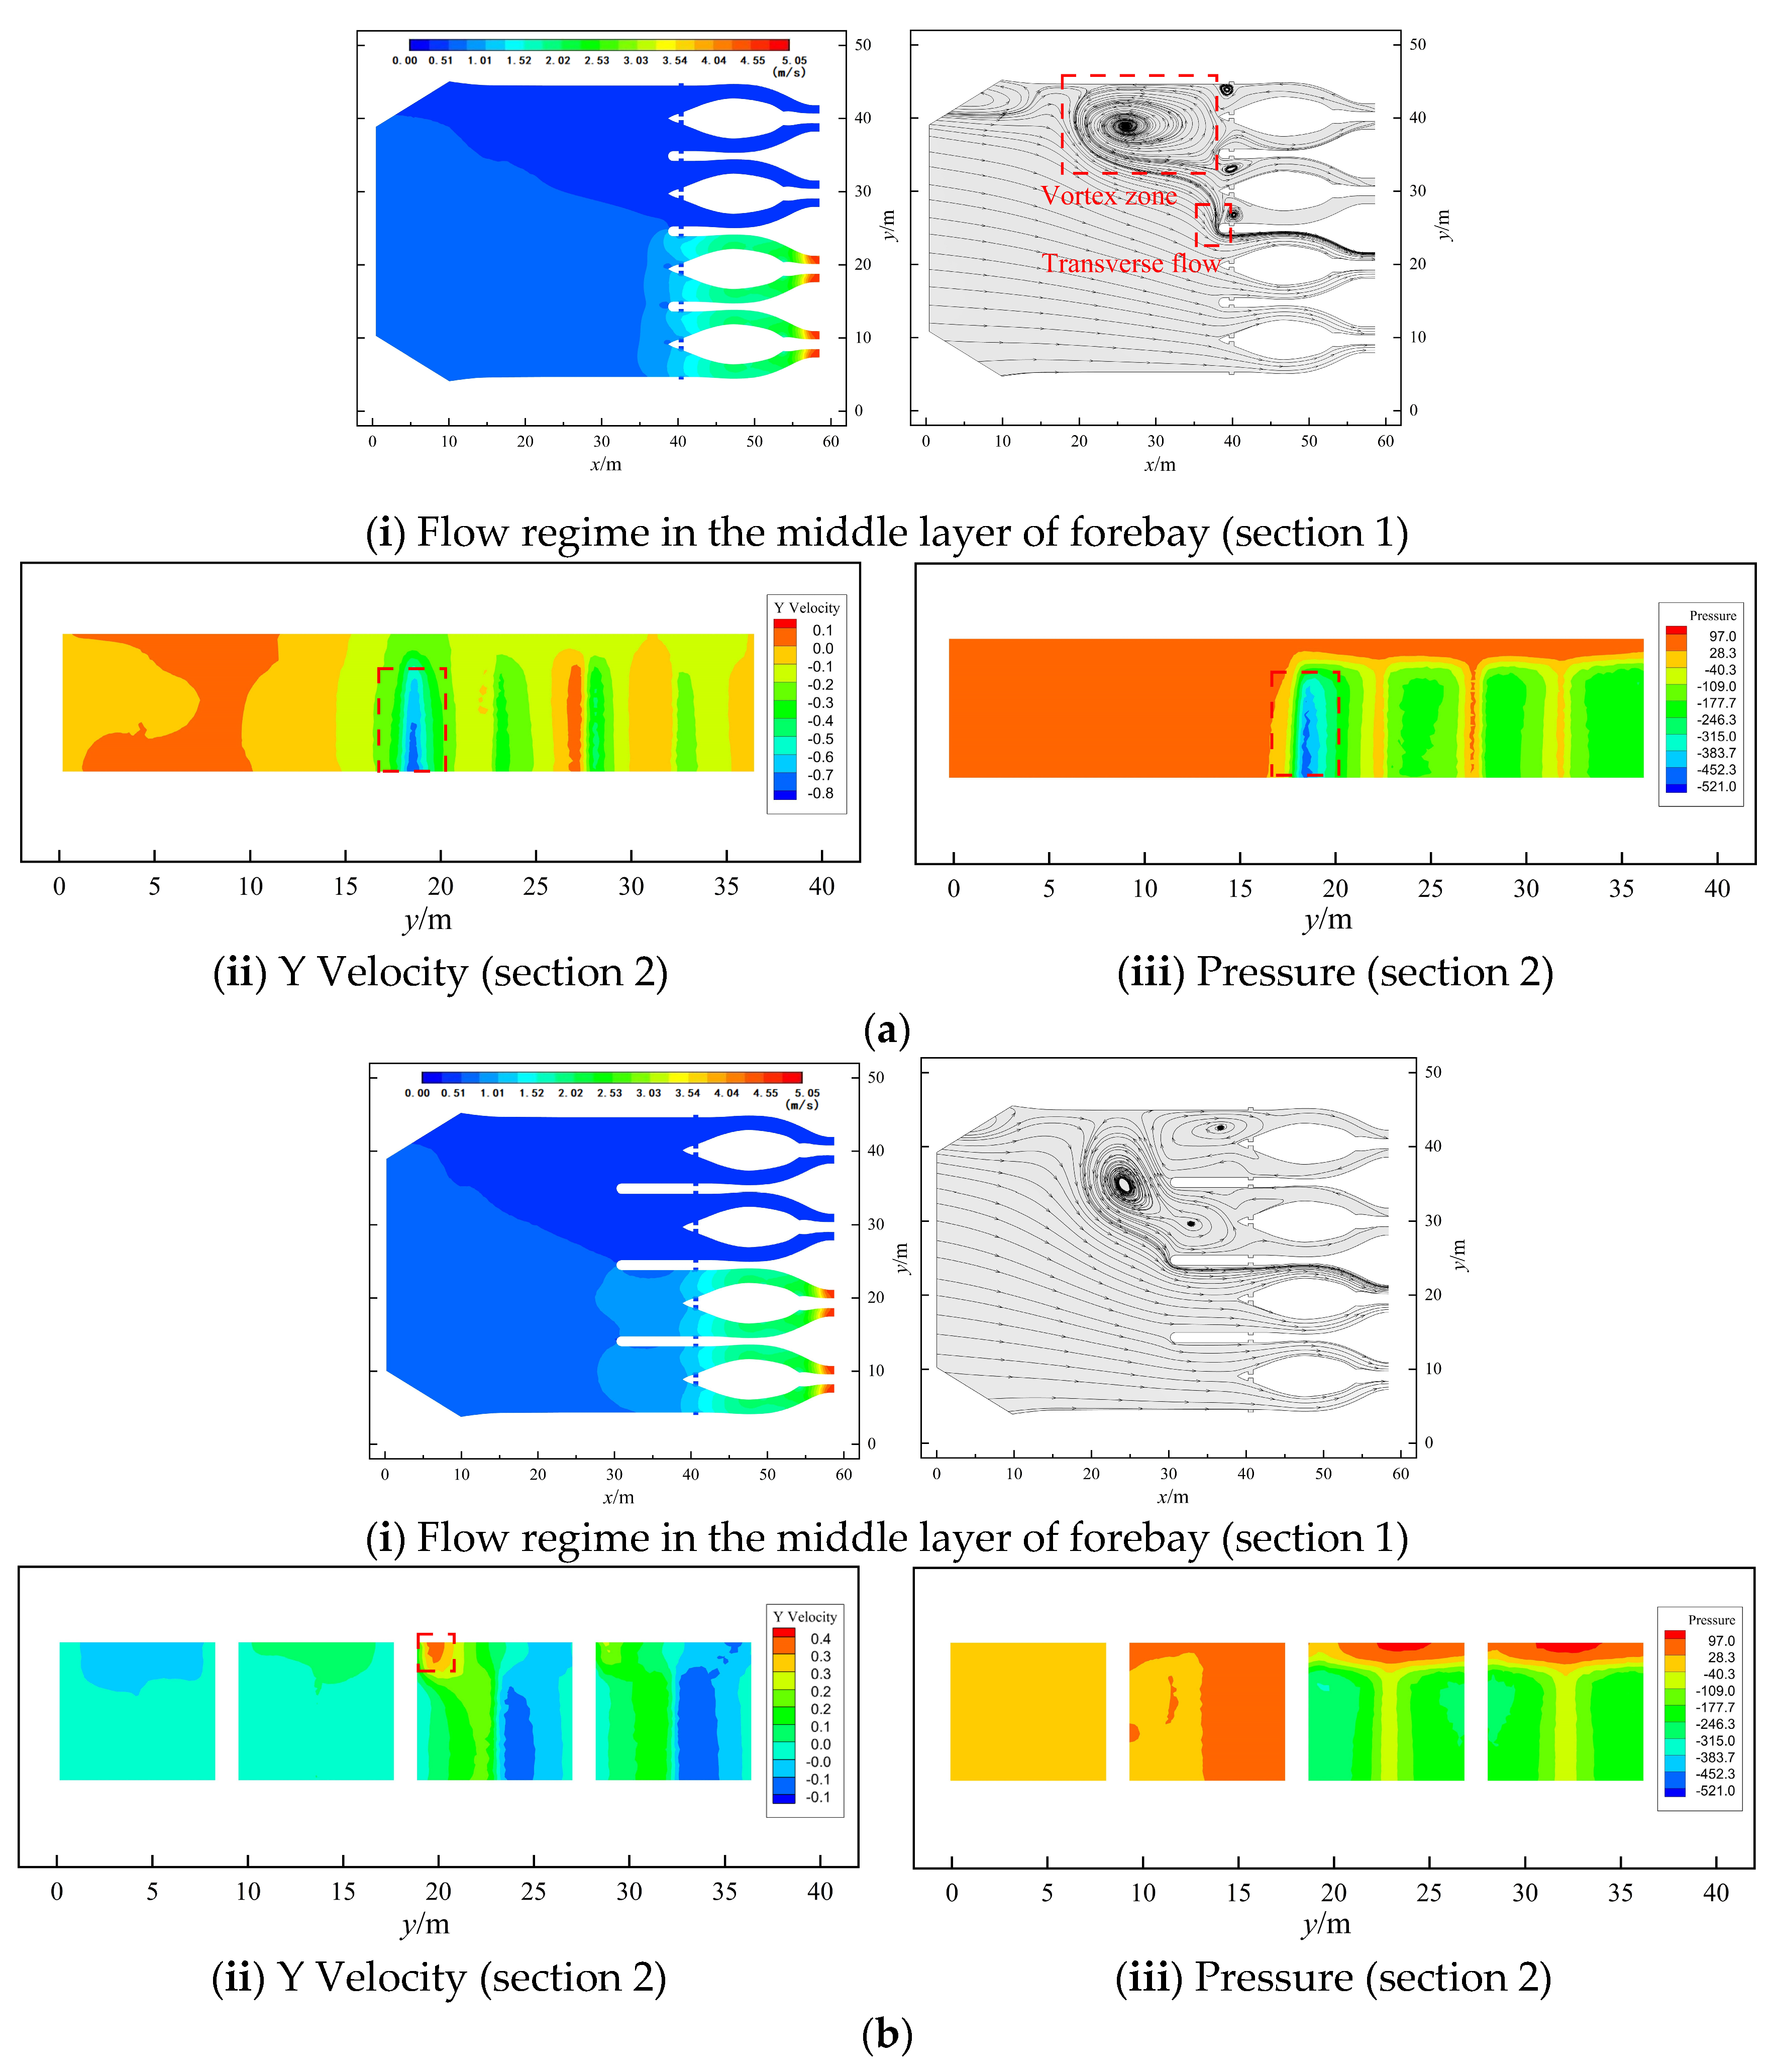
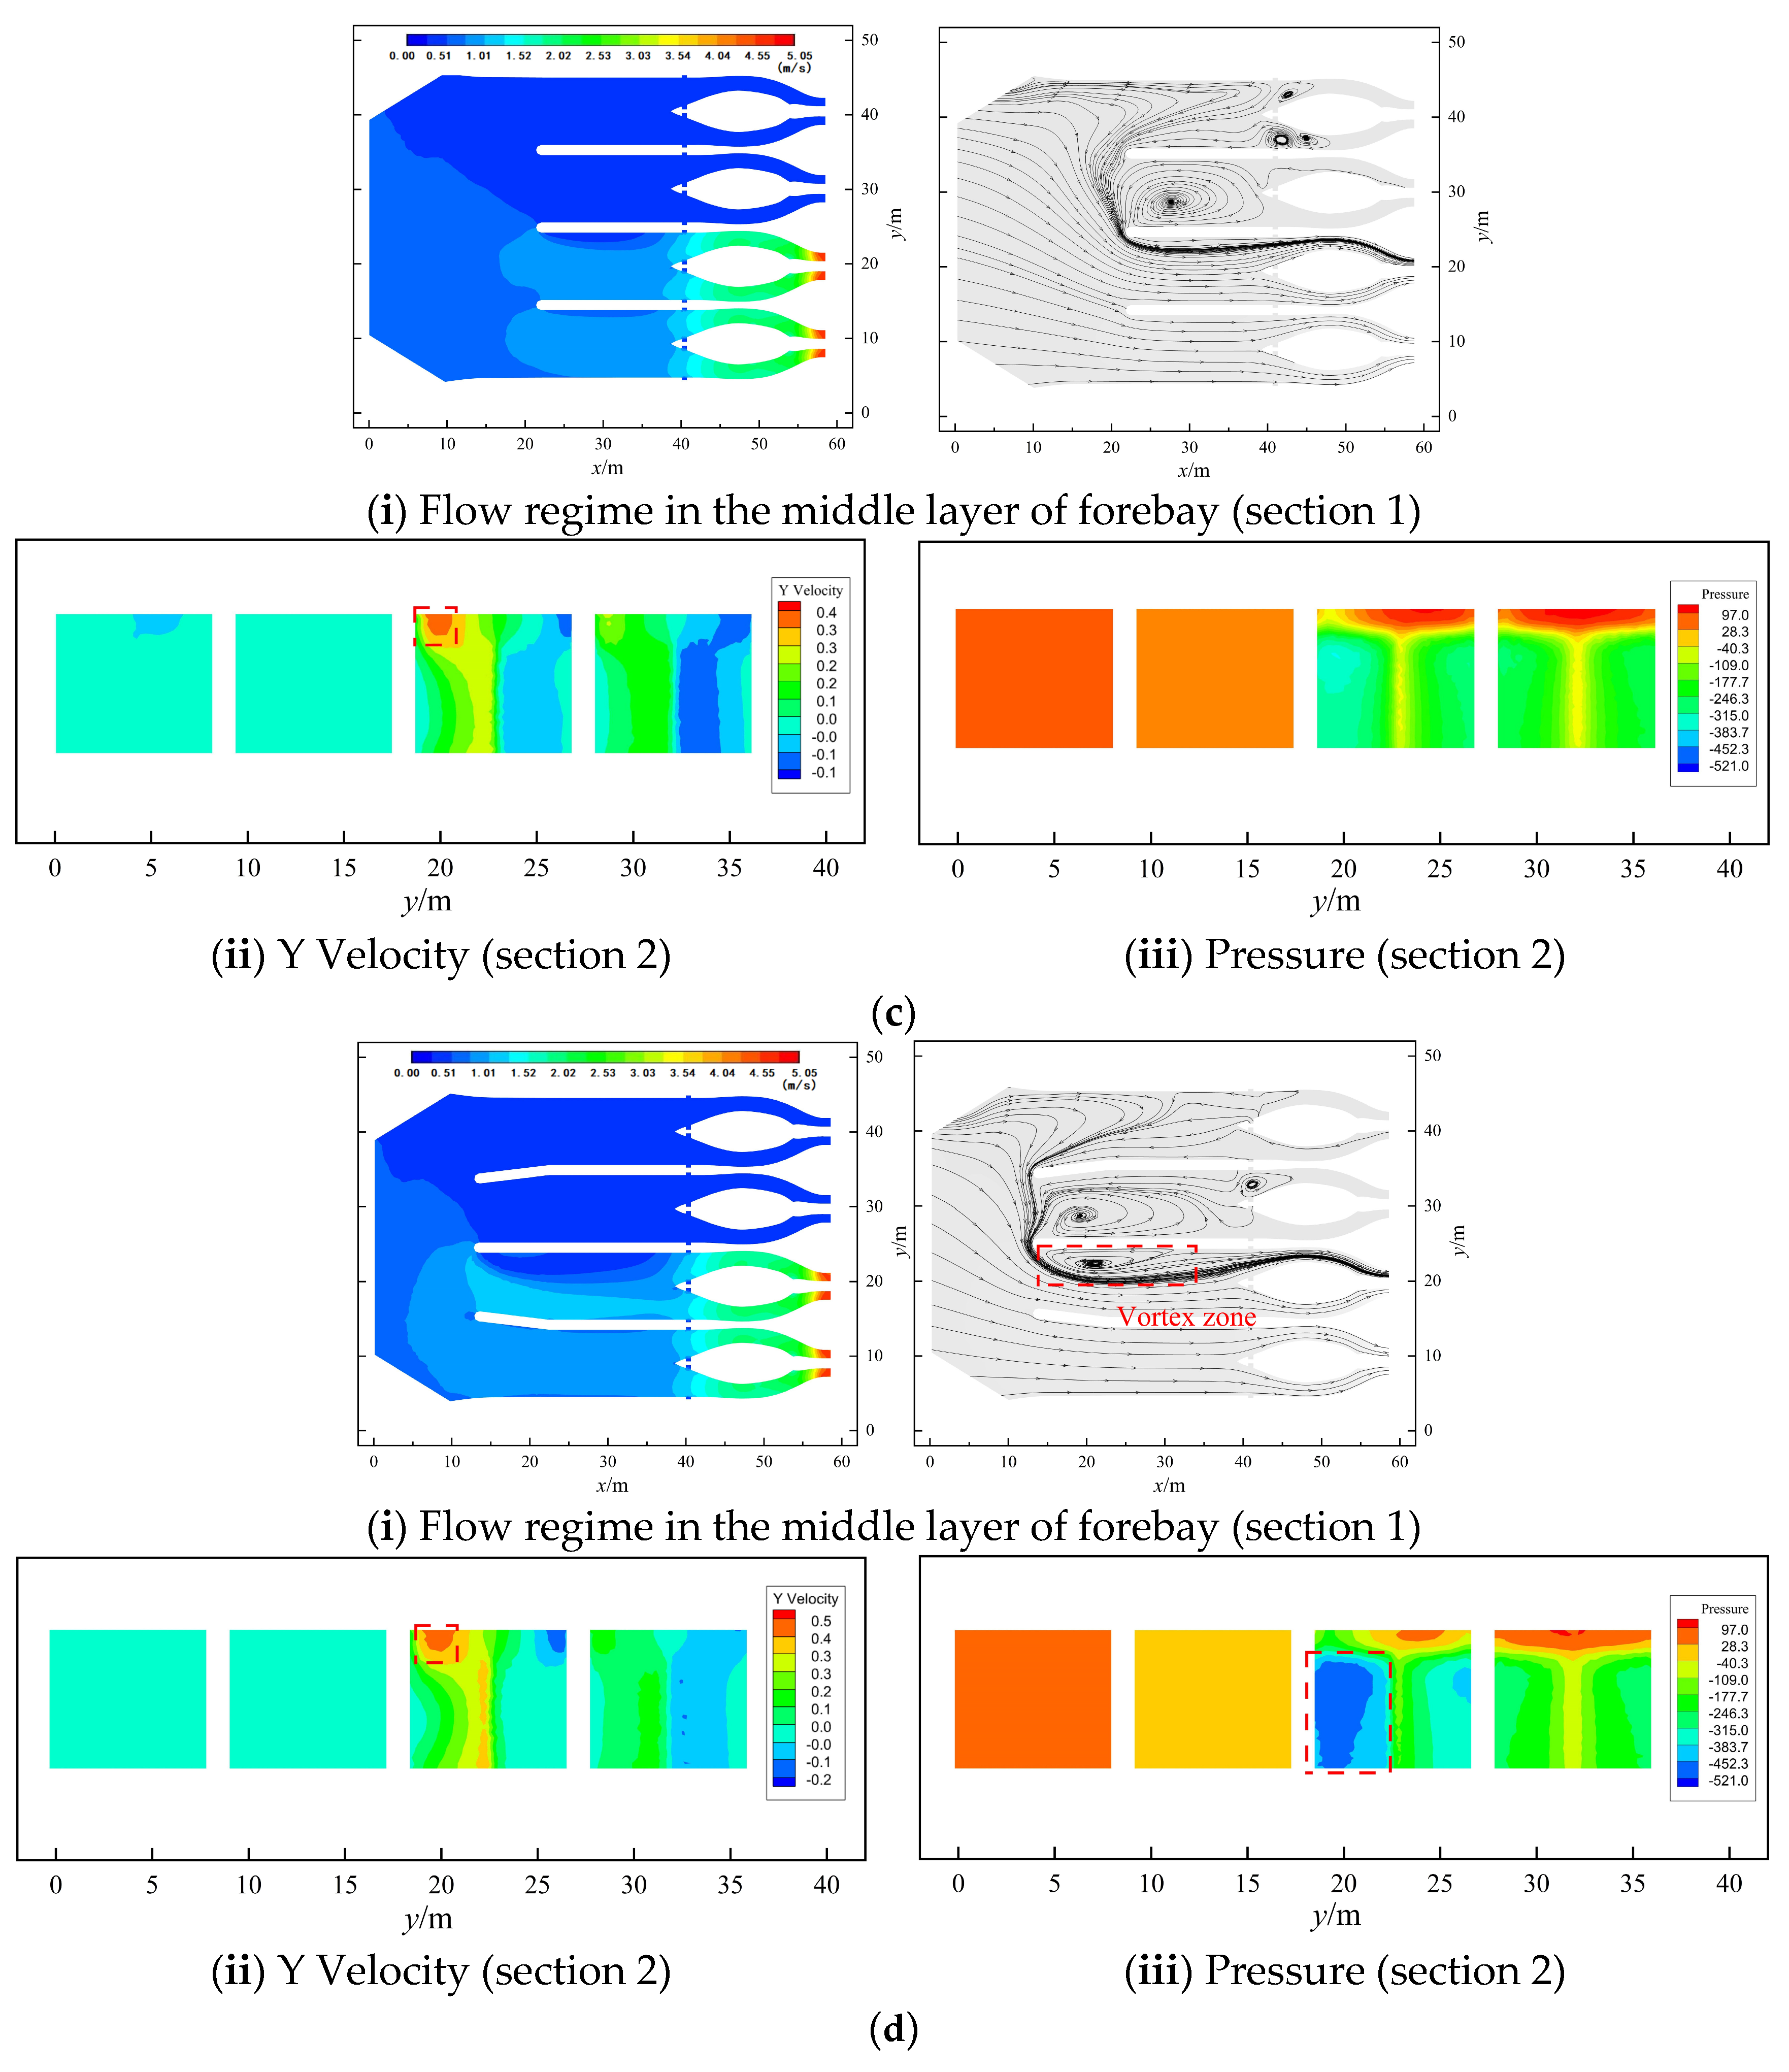
This section discusses the flow conditions in the forebay for the most common operational conditions 1 to 4, taking into account various operational combinations and partition-wall arrangements. Due to space constraints, the numerical simulation results for operating conditions 2 and 4 are presented in this section. Figure 9 illustrates the flow conditions of the forebay horizontal section and the channel inlet for each setting under operating condition 2. Without the addition of a partition wall in the forebay, the flow in the forebay was significantly biased, exhibiting extensive vortex and low-velocity zones in front of units #3 and #4, a lateral flow from left to right at the flow channel inlet, and considerable lateral flow in the lower middle of the channel inlet on the left side of unit #2. The Y-direction velocity intensity in the middle and lower parts reached 0.61 m/s and 0.71 m/s, respectively. The installation of the partition wall improved the flow regime in the inlet channel of the operating units. In arrangement 3, the transverse flow in the middle and lower parts of the partition wall on the left side at the entrance of unit #2 has been greatly improved. However, a small range of transverse flow, with a strength of 0.32 m/s, has appeared in the upper part, slightly affecting the flow conditions. In arrangement 4, due to the installation angle of the partition wall being skewed relative to the incoming water flow, a significant vortex region emerged on the surface of the return flow at the channel inlet of unit #2; the small-scale transverse flow intensity at the upper part of the partition wall at the entrance of unit #2 further reached 0.42 m/s. As the length of the partition wall increased, the transverse flow intensity rapidly rose to 0.74 m/s, the vortex area on the return surface further expanded, significantly impacting the flow regime of unit #2 by further expanding the vortex area on the return surface.

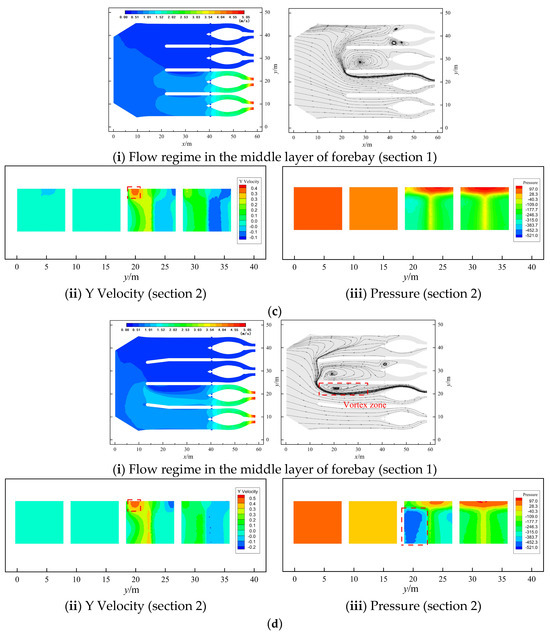

Figure 9.
Horizontal section of forebay flow field (operation condition 2). (a) Arrangement 1; (b) arrangement 2; (c) arrangement 3; (d) arrangement 4; (e) arrangement 5.
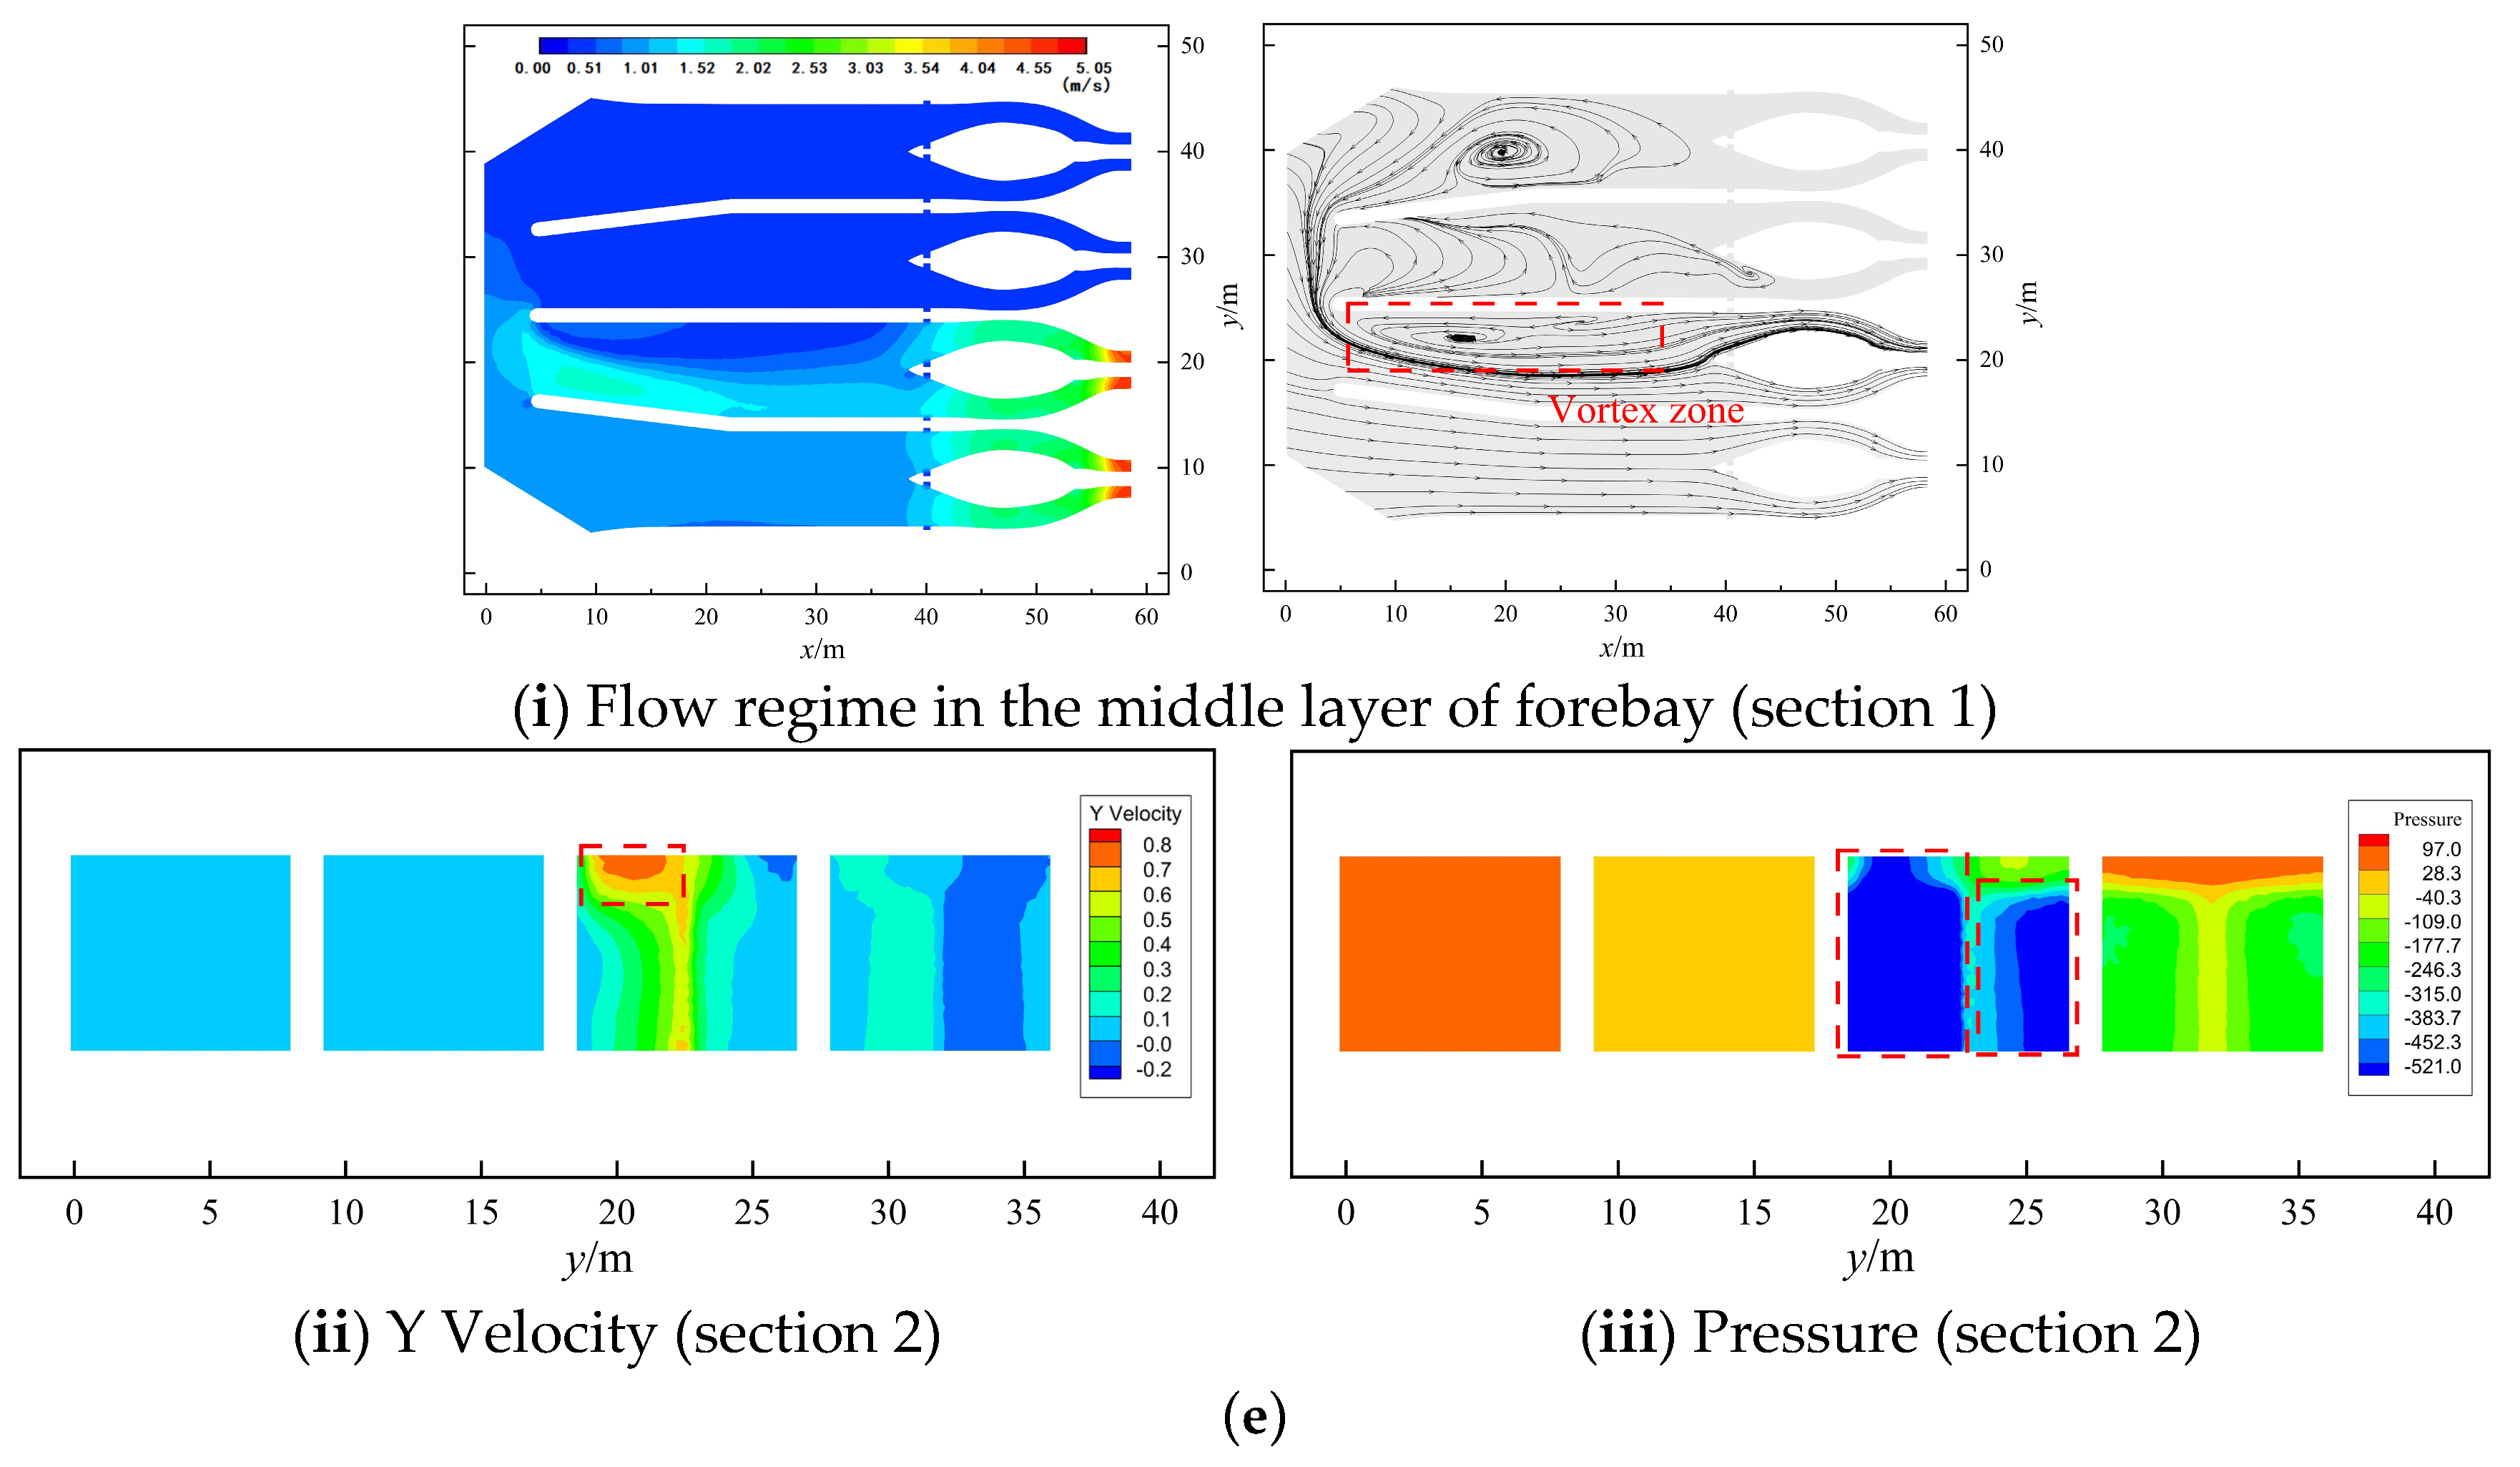
Figure 10 illustrates the flow conditions of the forebay horizontal section 1 during operating condition 4. The overall flow pattern in the forebay is favorable, with low-velocity zones observed on both sides of the deflector walls in the diffuser section. A significant transverse flow, with a strength of 0.34 m/s, is observed on the left side of unit #1 and the front-right side of unit #4. However, after the installation of partitions in the forebay, the extent of low-velocity areas on both sides of the deflector walls in the diffuser section gradually decreases with increasing partition length, thereby improving the inflow regime. Following the installation of the partition wall, a minor transverse flow with a strength of 0.28 m/s is observed in the upper right section before the inlet of unit #1 and the upper left section before the inlet of unit #4. In arrangement 4, vortex areas appear on the right side of unit #2 and the left side of unit #3, affecting the inflow regime of the pump units. In arrangement 5, the vortex area further expands, severely impacting the inflow regime of units #2 and #3.
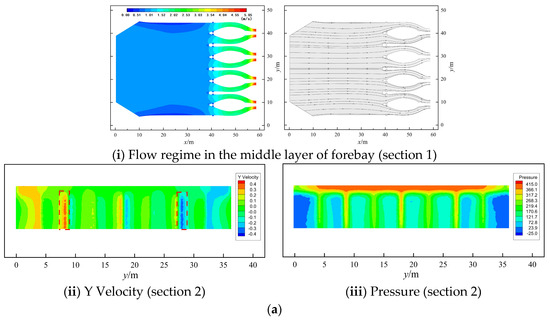
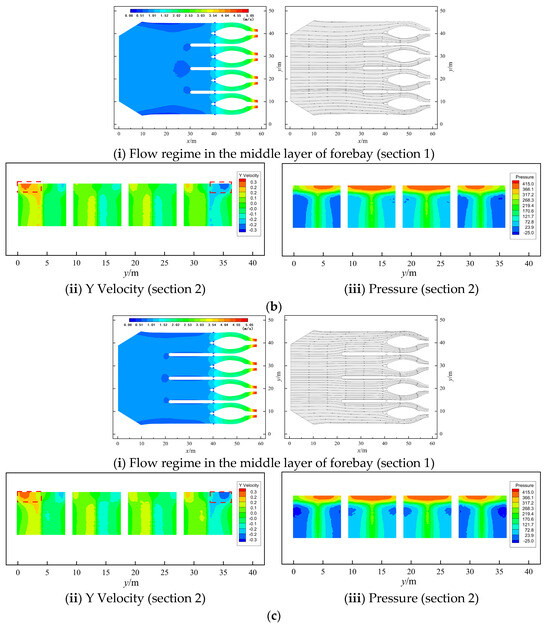
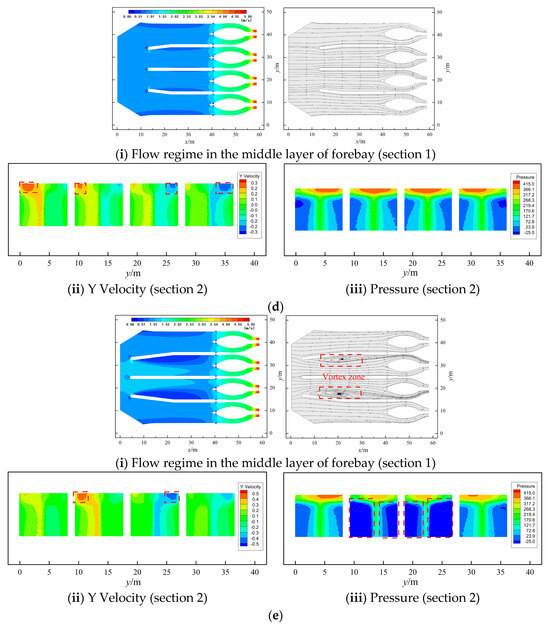
Figure 10.
Horizontal section of forebay flow field (operation condition 4). (a) Arrangement 1; (b) arrangement 2; (c) arrangement 3; (d) arrangement 4; (e) arrangement 5.
5.1.2. Flow Uniformity Analysis of Inlet Channel
The uniformity of flow velocity distribution [34] serves as a method to describe the velocity distributions across the chosen characteristic sections. It can be calculated as follows:
where is the relative flow velocity distribution uniformity in the section, is the average axial velocity in the section, is the axial velocity of each calculation unit of the section, and and are the areas of each calculation unit and the entire section, respectively.
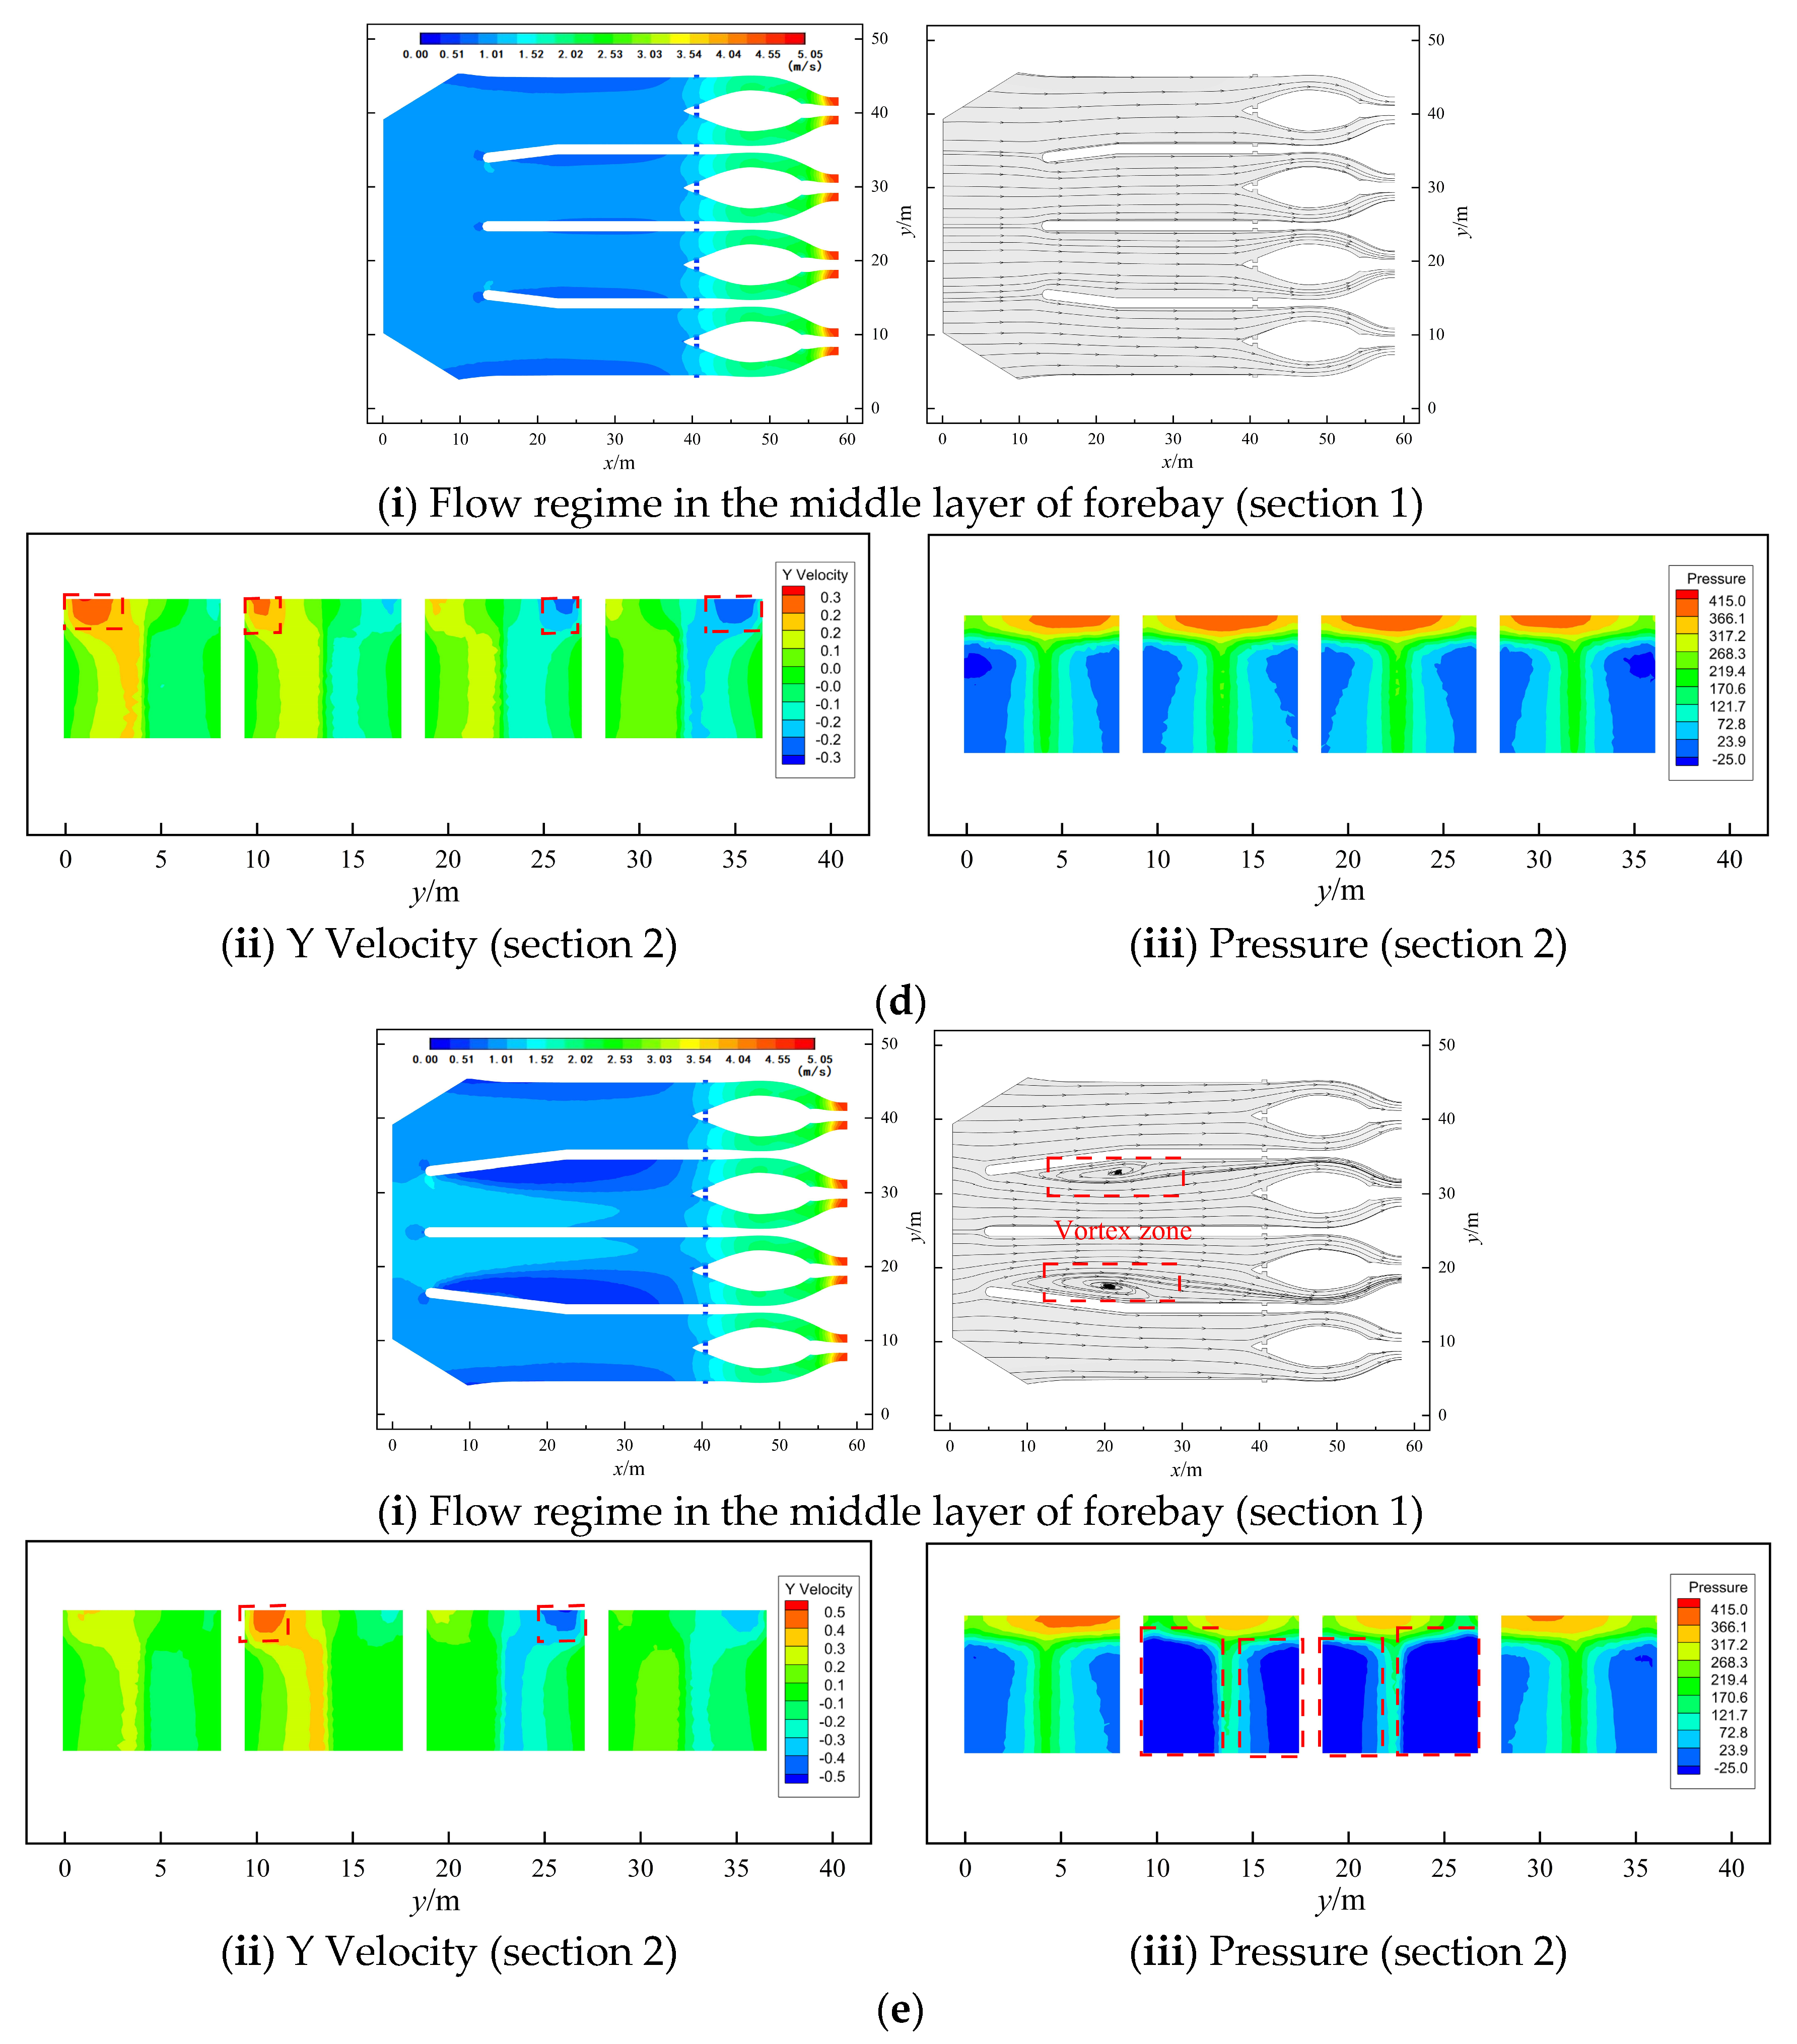
Figure 11 illustrates the flow velocity distribution uniformity in the section located downstream of the inlet channel for five different partition wall arrangements (section #3) in operating condition 1. Each unit features vertical shafts positioned within the straight segment of the elbow-shaped inlet channel, effectively splitting the inlet into left and right openings. In operating condition 1, the uniformity of the right orifice in unit #1’s inlet channel decreased when partition walls were added in the forebay. This occurred because the partition wall altered the angle between the wing wall and the original water flow entering the inlet channel. It slightly recovered in arrangement 4. Due to the partition wall’s adjustment effect on the incoming flow, the uniformity of the left orifice increases with the extension of the partition wall.
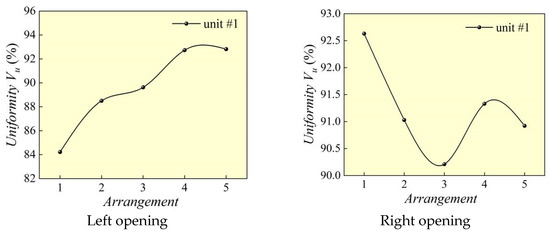
Figure 11.
Uniformity of flow velocity distribution behind the inlet of channels. (operating condition 1).
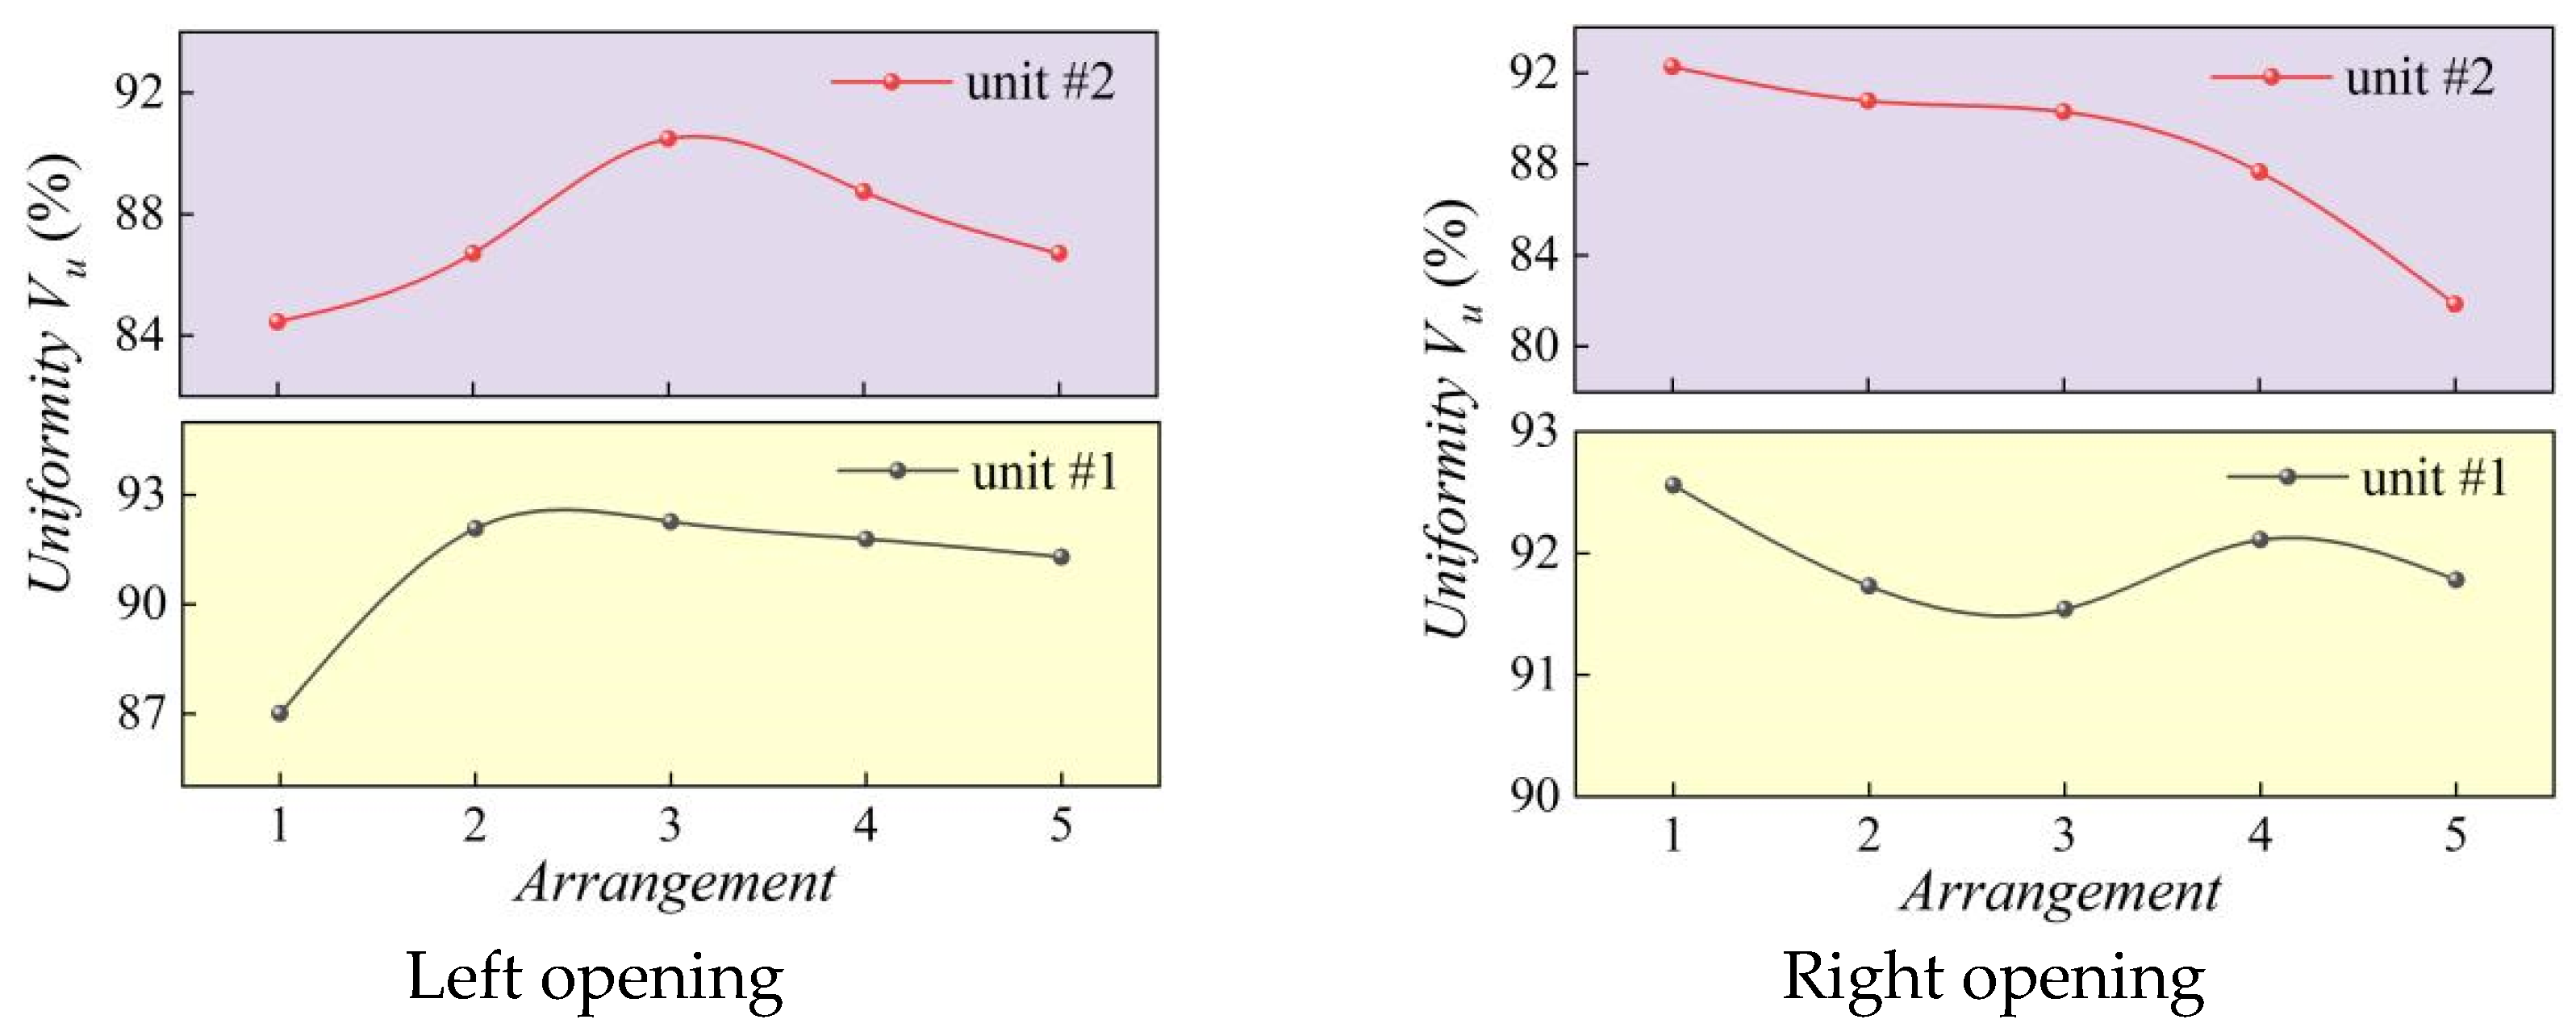
In operating condition 2, the uniformity of flow velocity distribution is shown in Figure 12. The uniformity of flow velocity distribution in unit #2’s inlet channel was lower than that in unit #1 due to the bias flow phenomenon in the forebay. The uniformity decreased after adding a partition in the forebay for the right openings of the inlet channels for both unit #1 and unit #2. In arrangement 3, adjusting the water flow in the forebay through the partition wall resulted in a slight change in uniformity, with a significant improvement in uniformity for the left openings of the inlet channels of both unit #1 and unit #2, reaching optimal levels in arrangement 3. As the partition length continued to increase, the uniformity of unit #2’s inlet channel sharply decreased due to the formation of vortices on the backwater surface of the partition wall.

Figure 12.
Uniformity of flow velocity distribution behind the inlet of channels. (operating condition 2).
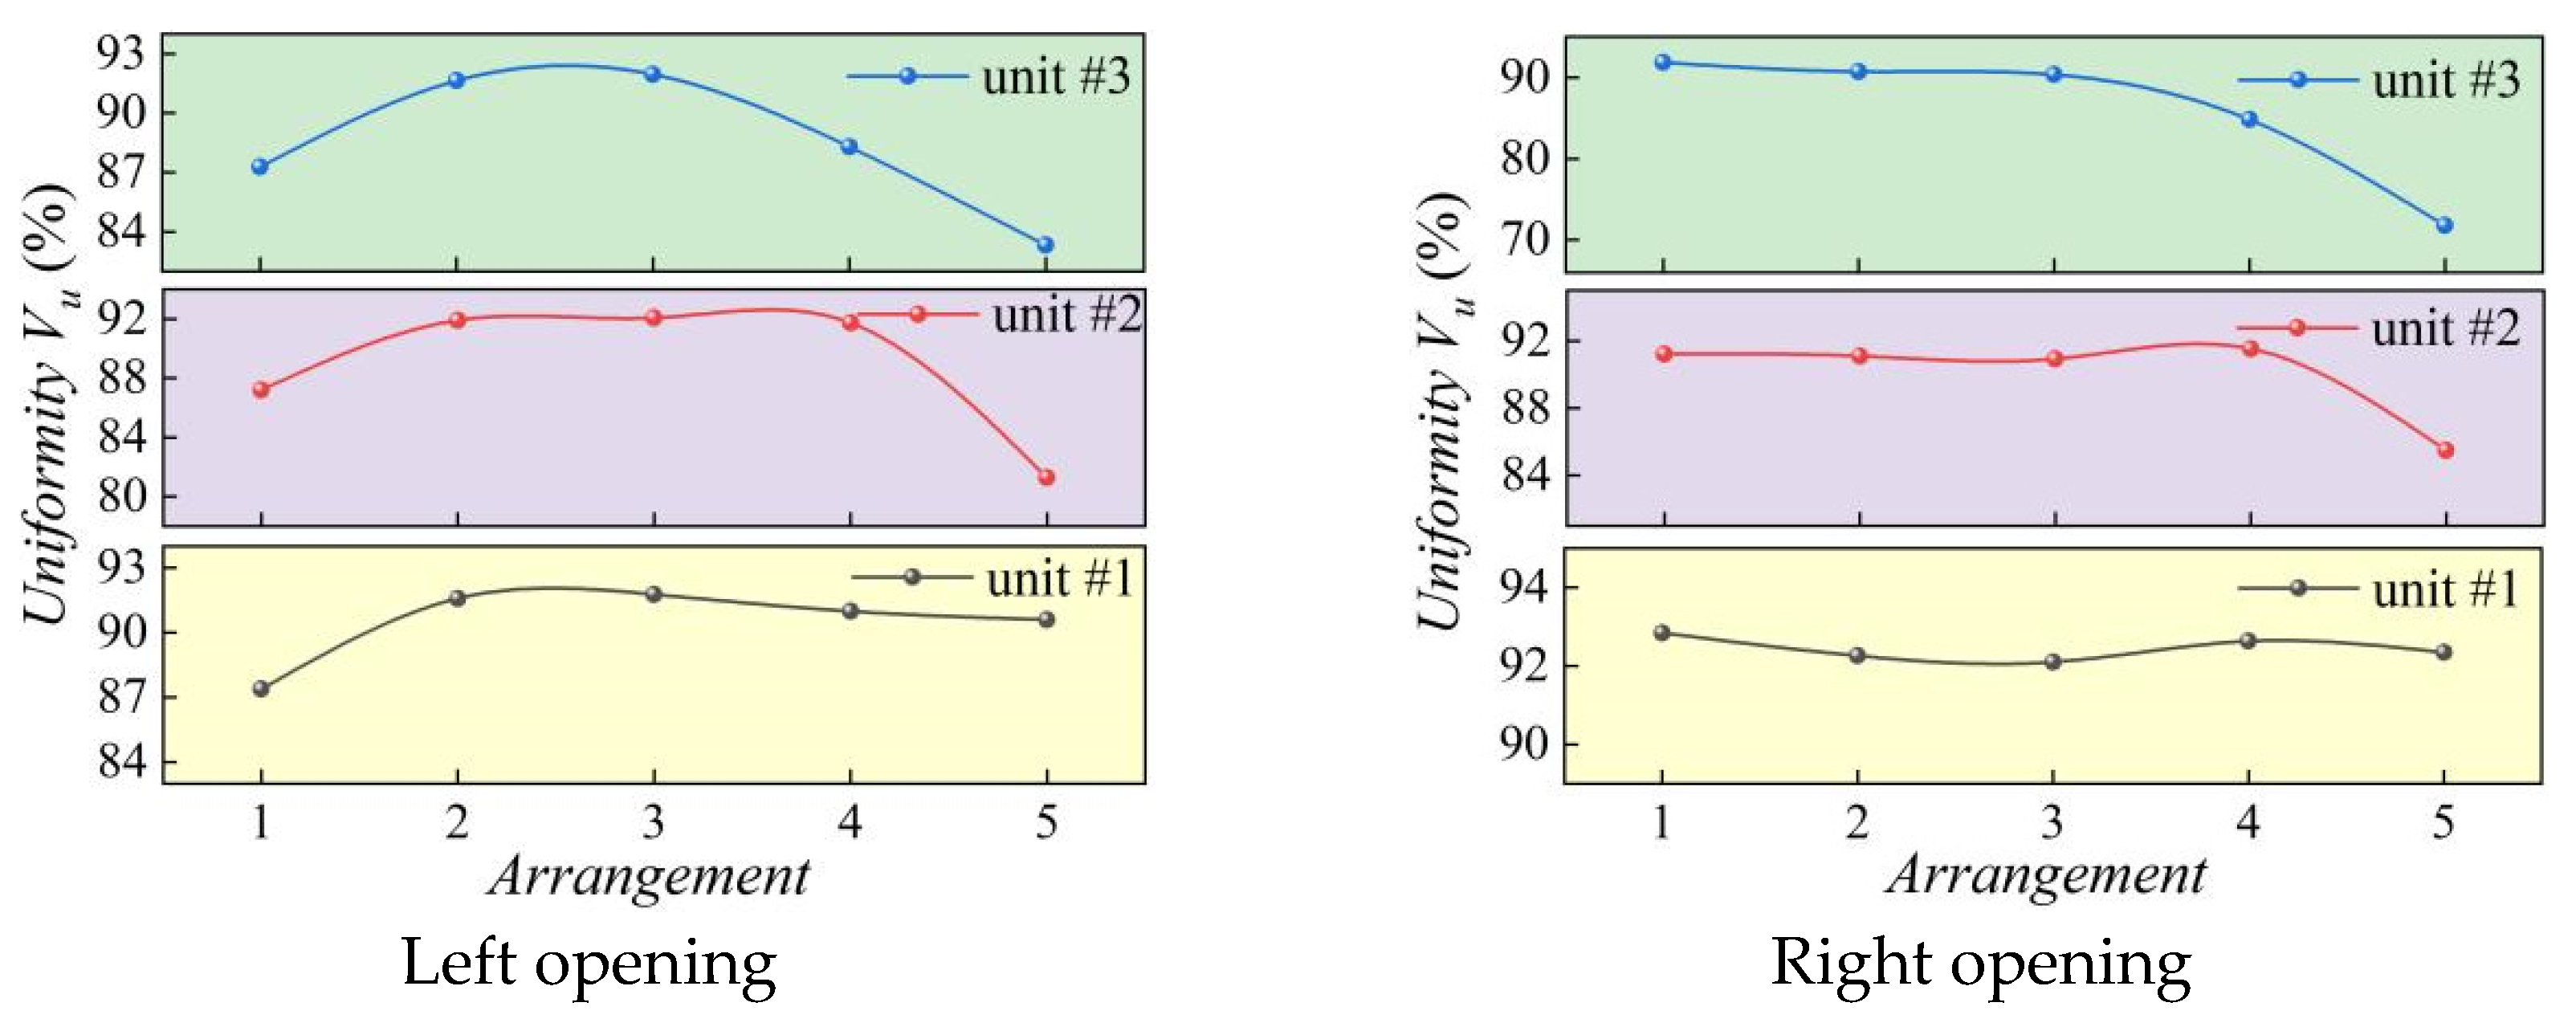
In operating condition 3, the uniformity of flow velocity distribution is shown in Figure 13. The uniformity of the left opening in the inlet channels of units #1, 2, and 3 improved following the addition of a partition wall in the forebay, achieving optimal levels in arrangement 3. The uniformity of the right opening showed no significant change. As the length of the partition wall increases, the flow velocity distribution uniformity remains stable for unit #1. Due to the influence of vortices in front of the inlet channel, the uniformity of flow velocity distribution in units # 2 and 3 sharply decreases.
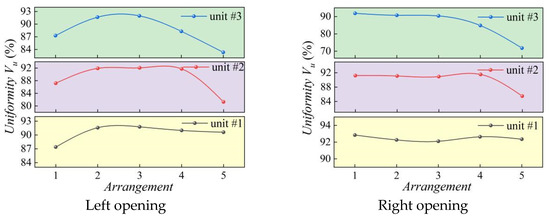
Figure 13.
Uniformity of flow velocity distribution behind the inlet of channels (operating condition 3).
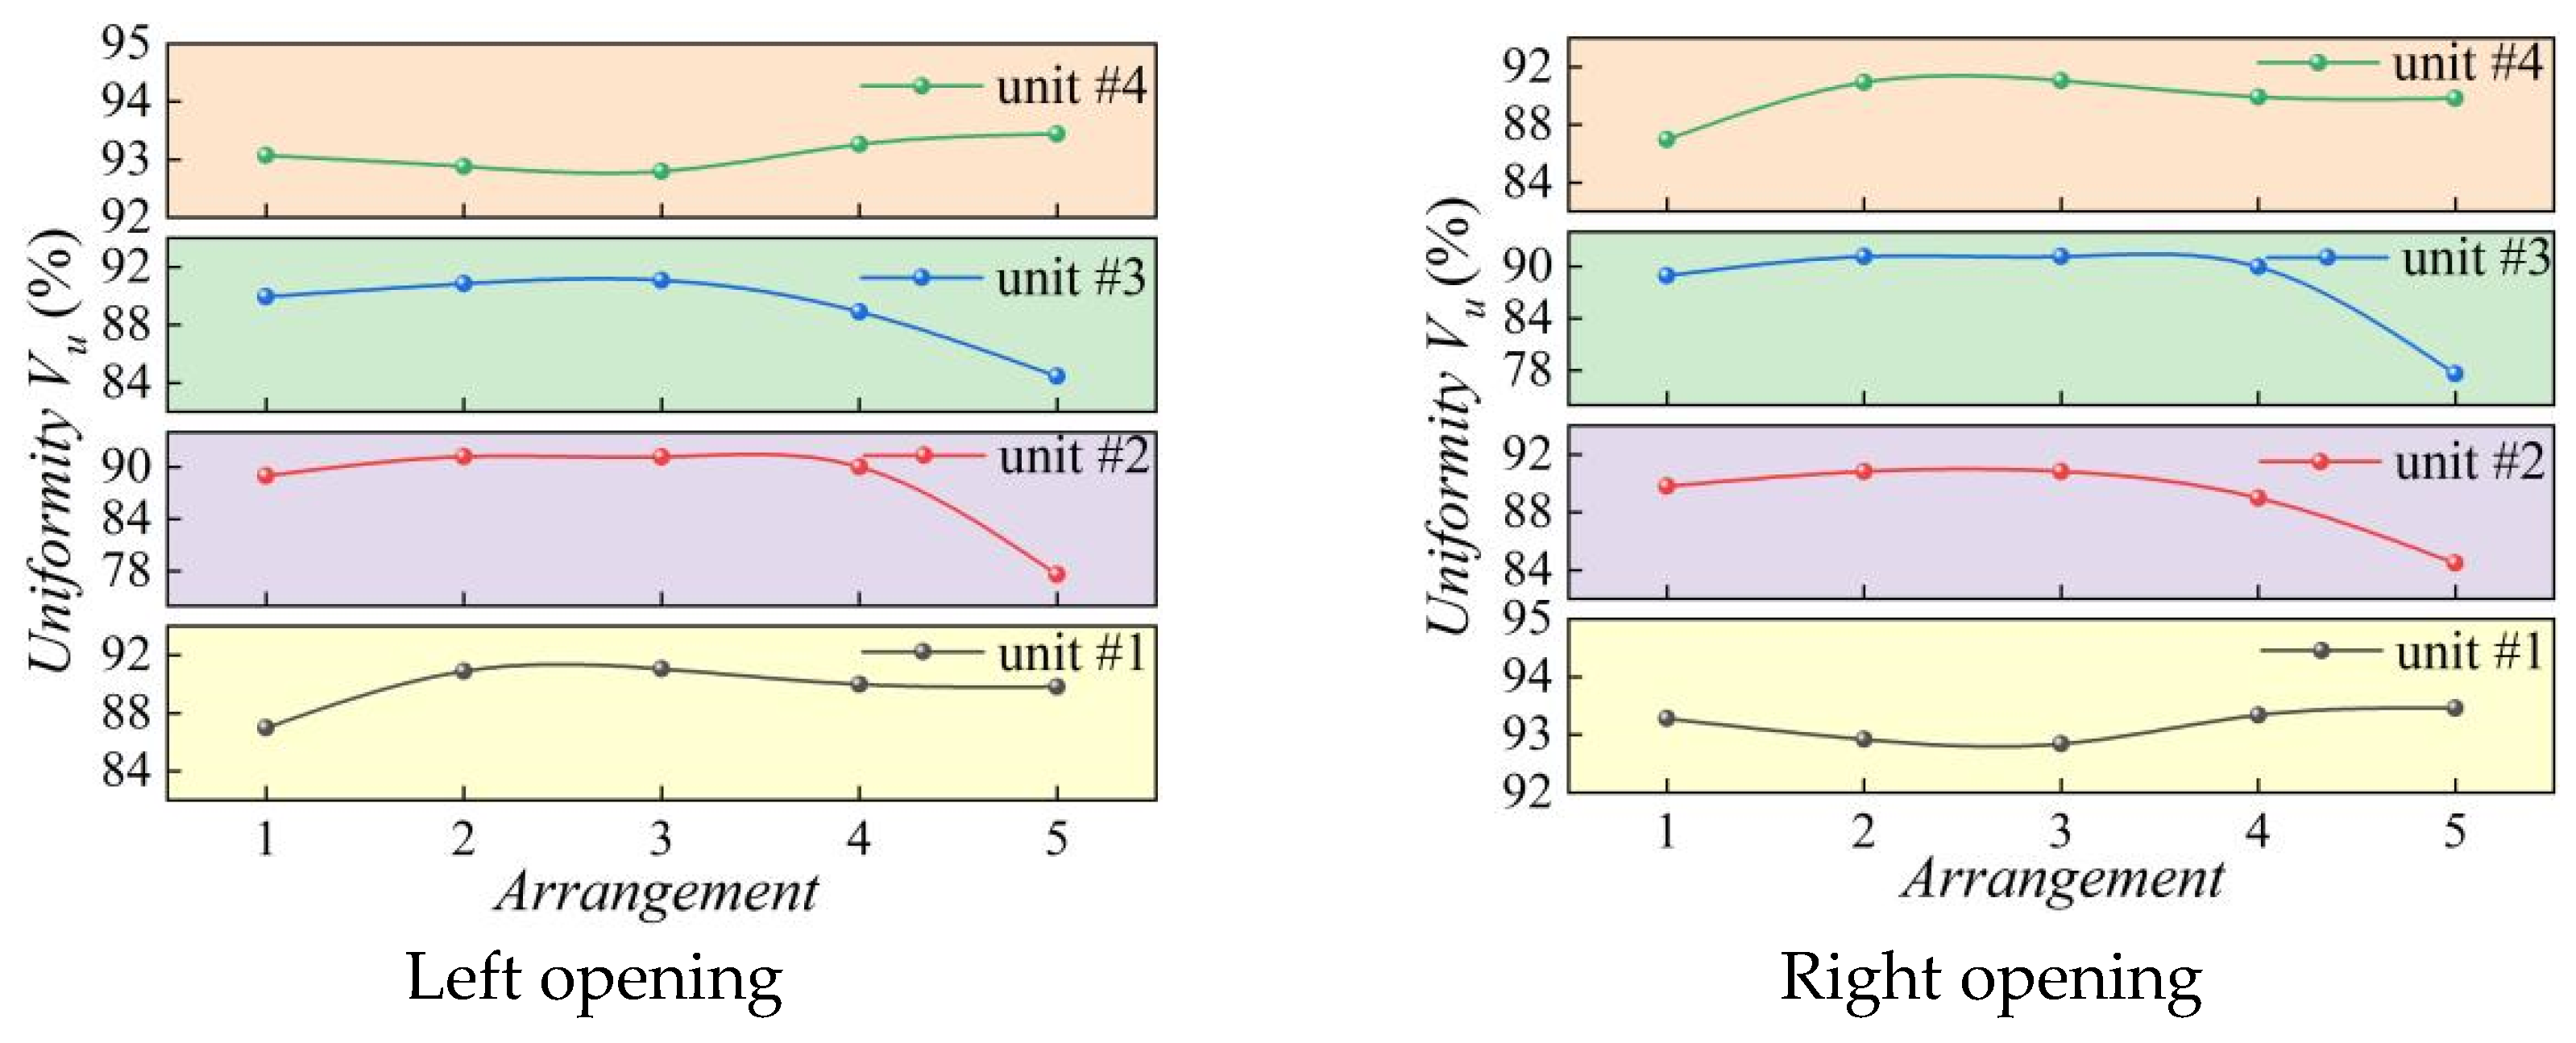
In operating condition 4, the uniformity of flow velocity distribution is shown in Figure 14. The uniformity of the left opening of unit #1’s inlet channel and the right opening of unit #4’s inlet channel both improved after adding a partition wall in the forebay, reaching optimal levels in arrangement 3. The uniformity decreases as the length of the partition wall continues to increase. The uniformity of the left and right openings of units #2 and 3 inlet channels was significantly enhanced by adding a partition wall, achieving optimal levels in arrangement 3. However, vortex areas appear on the right side of unit #2 and the left side of unit #3, affecting the inflow regime of the pump units. The uniformity of the left and right openings of units #2 and 3 inlet channels decreases rapidly as the partition wall length increases.
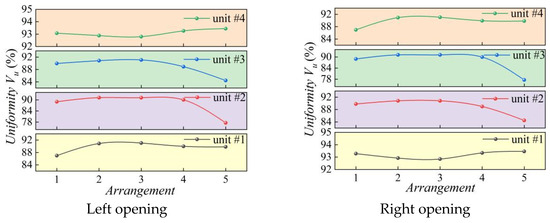
Figure 14.
Uniformity of flow velocity distribution behind the inlet of channels (operating condition 4).
Following the evaluation of the flow velocity distribution uniformity behind the channel inlets, arrangement 3 emerged as the most optimal choice. Compared to arrangement 1, under operating condition 1, the uniformity at the left opening of unit #1’s inlet channel increased from 84.22% to 89.62%. Similarly, under operating condition 2, the uniformity at the left opening of unit #1’s inlet channel increased from 87.00% to 92.27%, and for unit #2, it improved from 84.45% to 90.48%. Under operating condition 3, the uniformity at the left opening of unit #1’s inlet channel increased from 87.38% to 91.77%; for unit #2, it rose from 87.20% to 92.07%; and for unit #3, it increased from 87.27% to 91.96%. Additionally, under operating condition 4, the average uniformity of the flow velocity distribution at the left and right openings of each operating unit’s inlet channel increased by 1.75%.
5.1.3. Analysis of Transverse Flow Velocity
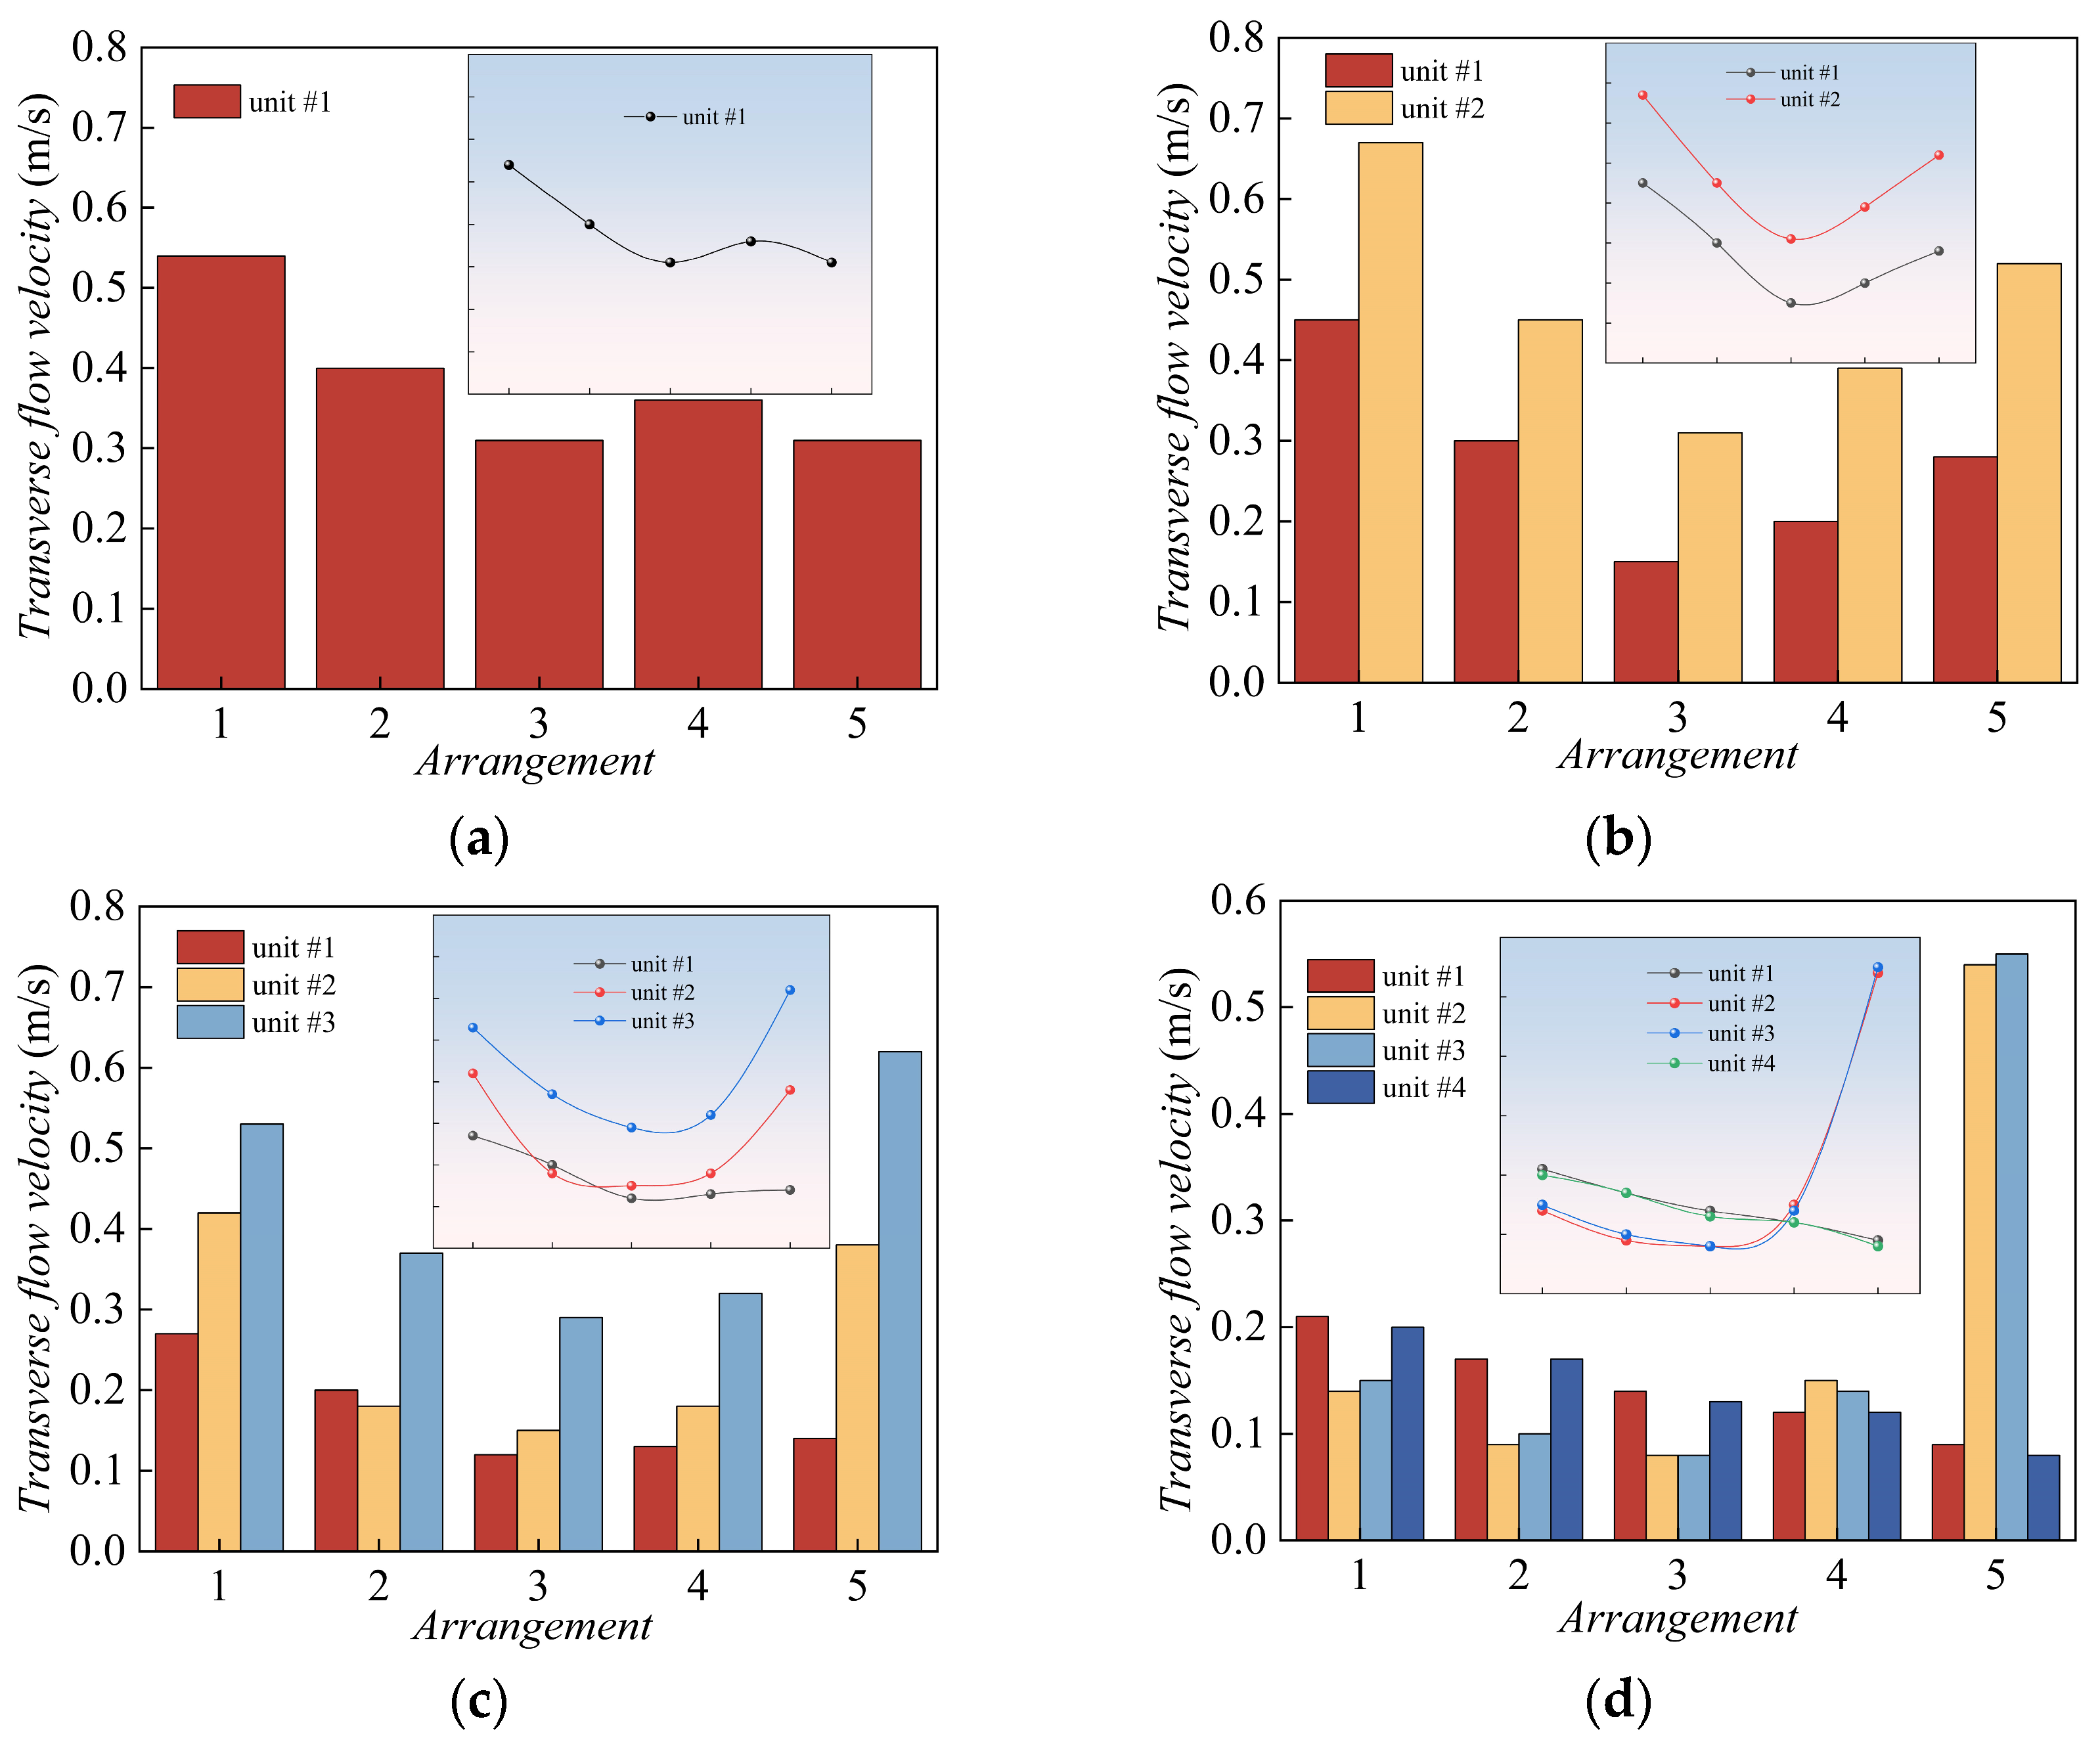
Figure 15 illustrates the transverse flow velocities at the channel’s inlet (section #2) for the five different arrangements of partition walls. For operating condition 1, due to the inflow of water from units #2, #3, and #4 into the inlet of unit #1 channel, there is a significant rightward transverse flow velocity at the left opening of unit #1’s inlet channel. After adding a partition wall in the forebay, the transverse flow velocity at the inlet of unit #1 significantly decreases. In arrangement 3, the transverse flow velocity at the inlet channel reaches a minimum. The reduction rate of the transverse flow velocity at the inlet of unit #1 is 42.5% in arrangement 3, which is higher than in arrangement 1. Additionally, when the length of the partition wall is further increased, there is a slight increase in the transverse flow velocity at the inlet of unit #1.
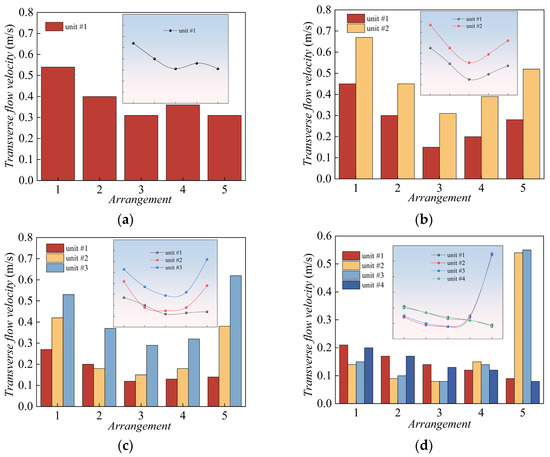
Figure 15.
Transverse flow velocities in front of the channel inlets (numerical simulation). (a) Operating condition 1; (b) operating condition 2; (c) operating condition 3; (d) operating condition 4.
In operating condition 2, as some water flows into unit #2’s inlet channel from units #3 and 4, the transverse flow velocity at the inlet of unit #2 must be greater than that of unit #1. After adding a partition wall in the forebay, the transverse flow velocity at the inlets of units #1 and #2 is significantly reduced. In arrangement 3, the transverse flow velocity at the channel’s inlet reaches a minimum. Compared to arrangement 1, the transverse flow velocity reduction rates at the inlets of units #1 and 2 in arrangement 3 reach 66.7% and 51.7%, respectively. When the length of the partition wall is further increased, the transverse flow velocity increases.
In operating condition 3, the transverse flow velocity at the inlet of unit #3 channel is required to be greater than that of units #1 and #2. After the addition of a partition wall in the forebay, the transverse flow velocity at the inlet of each channel was significantly reduced. In arrangement 3, the transverse flow velocity at the inlet of each channel reached a minimum. Compared with arrangement 1, the transverse flow velocity elimination rate at the inlet of unit #1 channel in arrangement 3 reached 55.6%, the elimination rate for unit #2 reached 55.3%, and the elimination rate for unit #3 reached 45.3%. When the length of the partition wall is further increased, the transverse flow velocity at the inlet of units #2 and #3 channels increases significantly.
In operating condition 4, the transverse flow velocity at the inlets of units #2 and #3 reaches its minimum in arrangement 3, with the elimination rate of the transverse flow velocity at the inlet of the operating units compared to arrangement 1 reaching 39.55%. As the length of the partition wall is further increased, the transverse flow velocity at the inlet of units #1 and #4 slightly decreases. In arrangement 5, the transverse flow velocity at the inlet of unit #2 and #3 channel sharply increases.
Overall, it can be seen that the addition of a partition wall in the forebay has a significant impact on the flow in the inlet channel. With the increasing length of the partition wall, the transverse flow velocity at the inlet of the channel is greatly reduced, and it reaches its minimum in arrangement 3, with the best effect of eliminating the transverse flow velocity at the inlet of the channel.
5.2. Analysis of Model Test Results
5.2.1. Flow Field Analysis
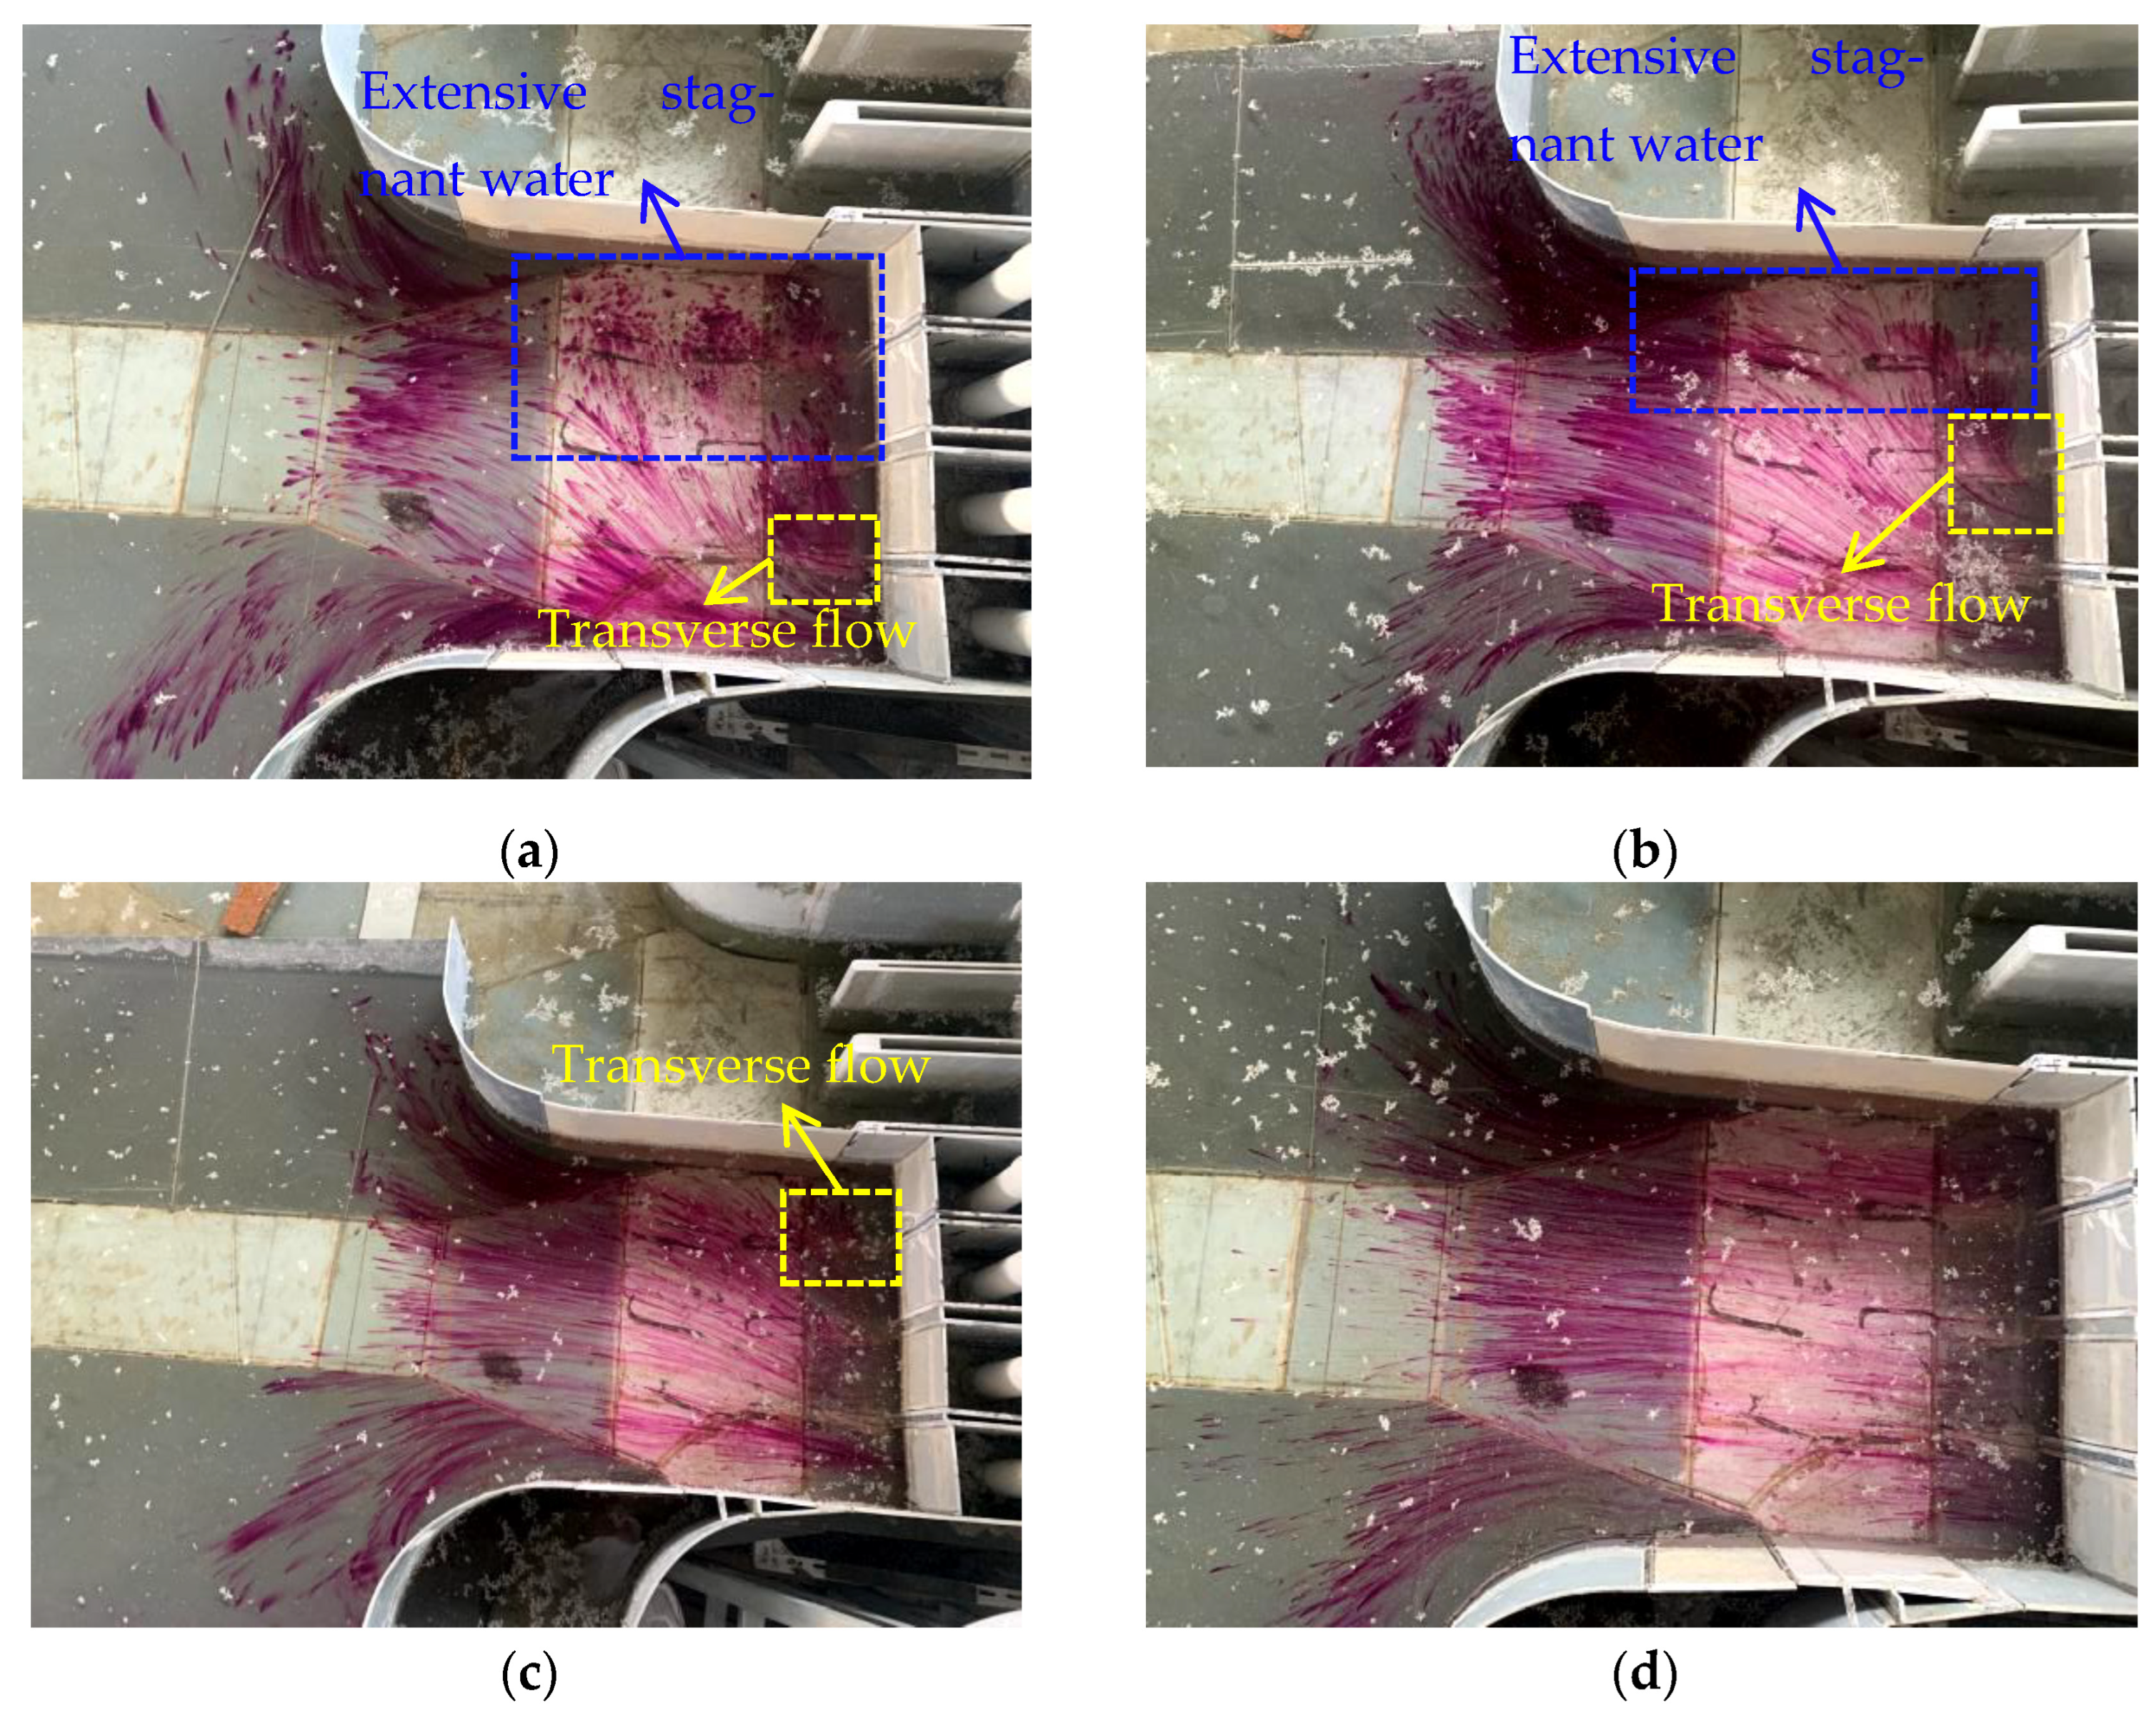
To compare with the numerical simulation results of the forebay flow field discussed in Section 5.1.1, the bottom layer flows for arrangements 1 and 3 were analyzed. Figure 16 illustrates the bottom layer flow pattern of the model test arrangement #1. In operating condition 4, there is a transverse flow in the forebay caused by the movement of potassium high monganate granules and sand mixture, influenced by the central partition pier at the inlet of each unit. When operating under conditions 1, 2, and 3, there is a large stagnant water area in the forebay, which decreases in size as the number of operating units increases. Additionally, there is significant longitudinal flow at the inlet of adjacent units next to the non-operating unit. In condition 1, there are disturbances and rotations in the water flow at the inlet of unit #1, while in condition 2, there are significant disturbances and rotations at the inlet of unit #2, potentially causing air ingestion vortices and impacting the safe operation of pump units.
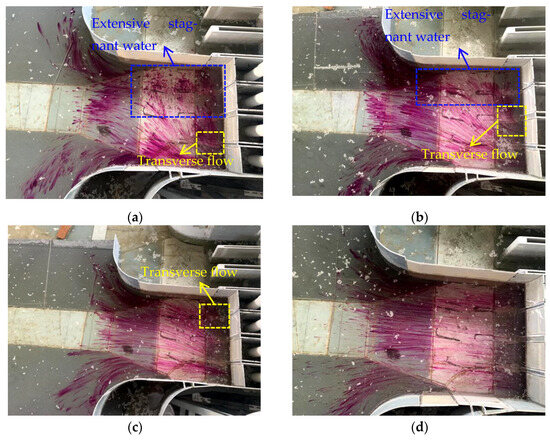
Figure 16.
Flow regime in the bottom layer of forebay in arrangement 1. (a) Operating condition 1; (b) operating condition 2; (c) operating condition 3; (d) operating condition 4.
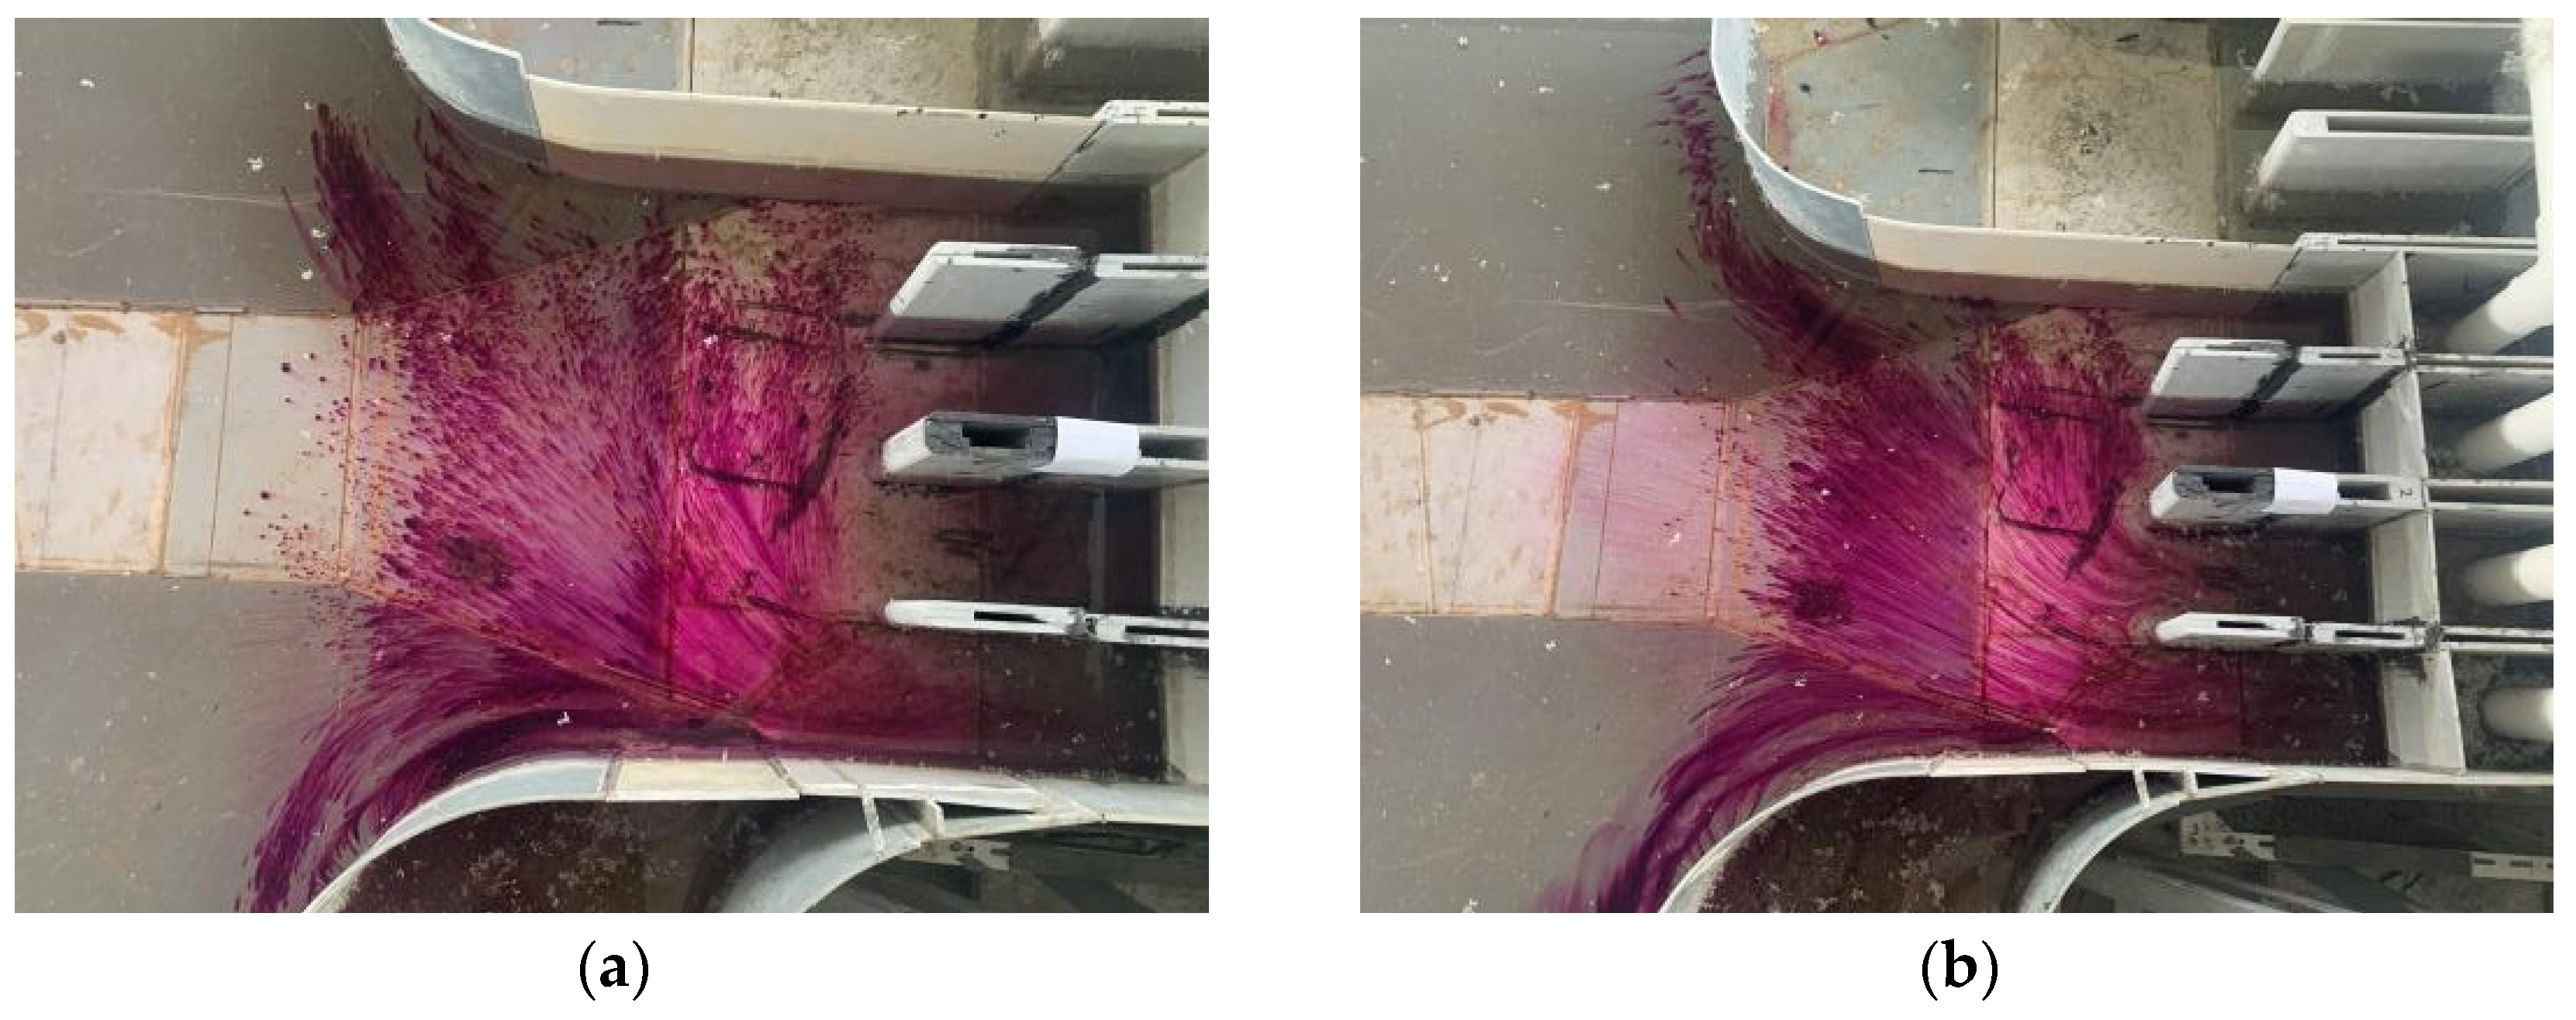
Figure 17 illustrates the flow dynamics at the bottom layer of the test arrangement #3. The inclusion of a partition wall in the forebay enhanced the flow conditions prior to the channel’s inlet, showing a marked improvement over arrangement 1. Disturbances and rotations of the water flow at the inlet of unit #1 channel in operating condition 1 and unit #2 in operating condition 2 were significantly weakened. As a result, the water flowed more evenly into the inlet channel, eliminating the main cause of air entrainment vortex generation.
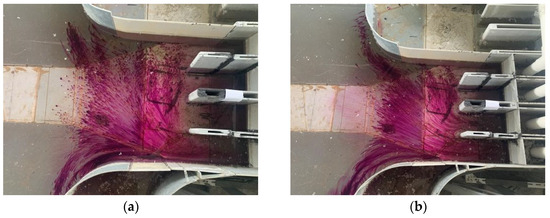

Figure 17.
Flow regime in the bottom layer of forebay in arrangement 3. (a) Operating condition 1; (b) operating condition 2; (c) operating condition 3; (d) operating condition 4.
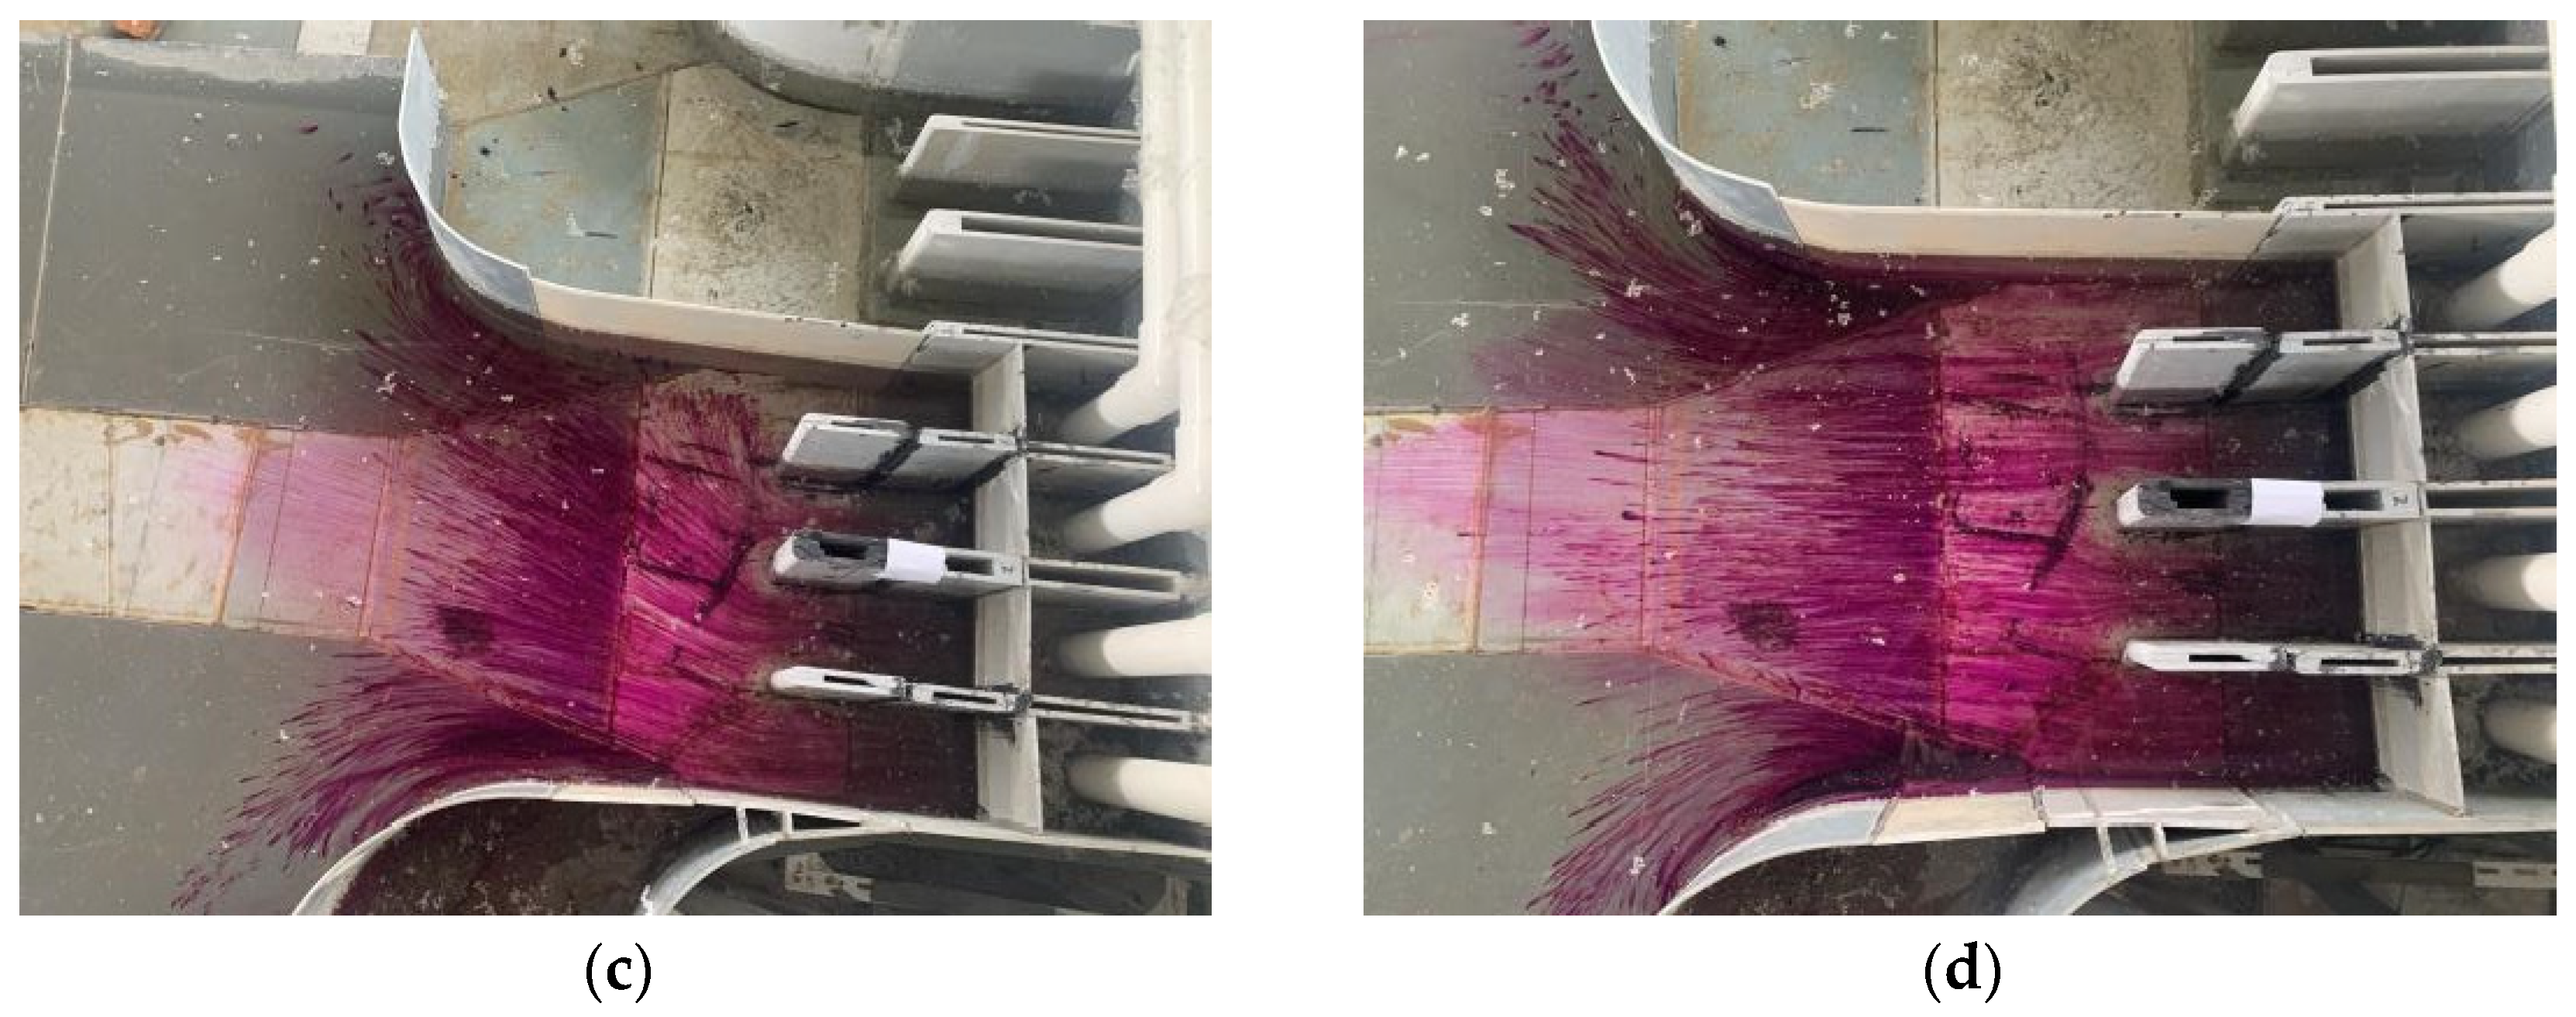
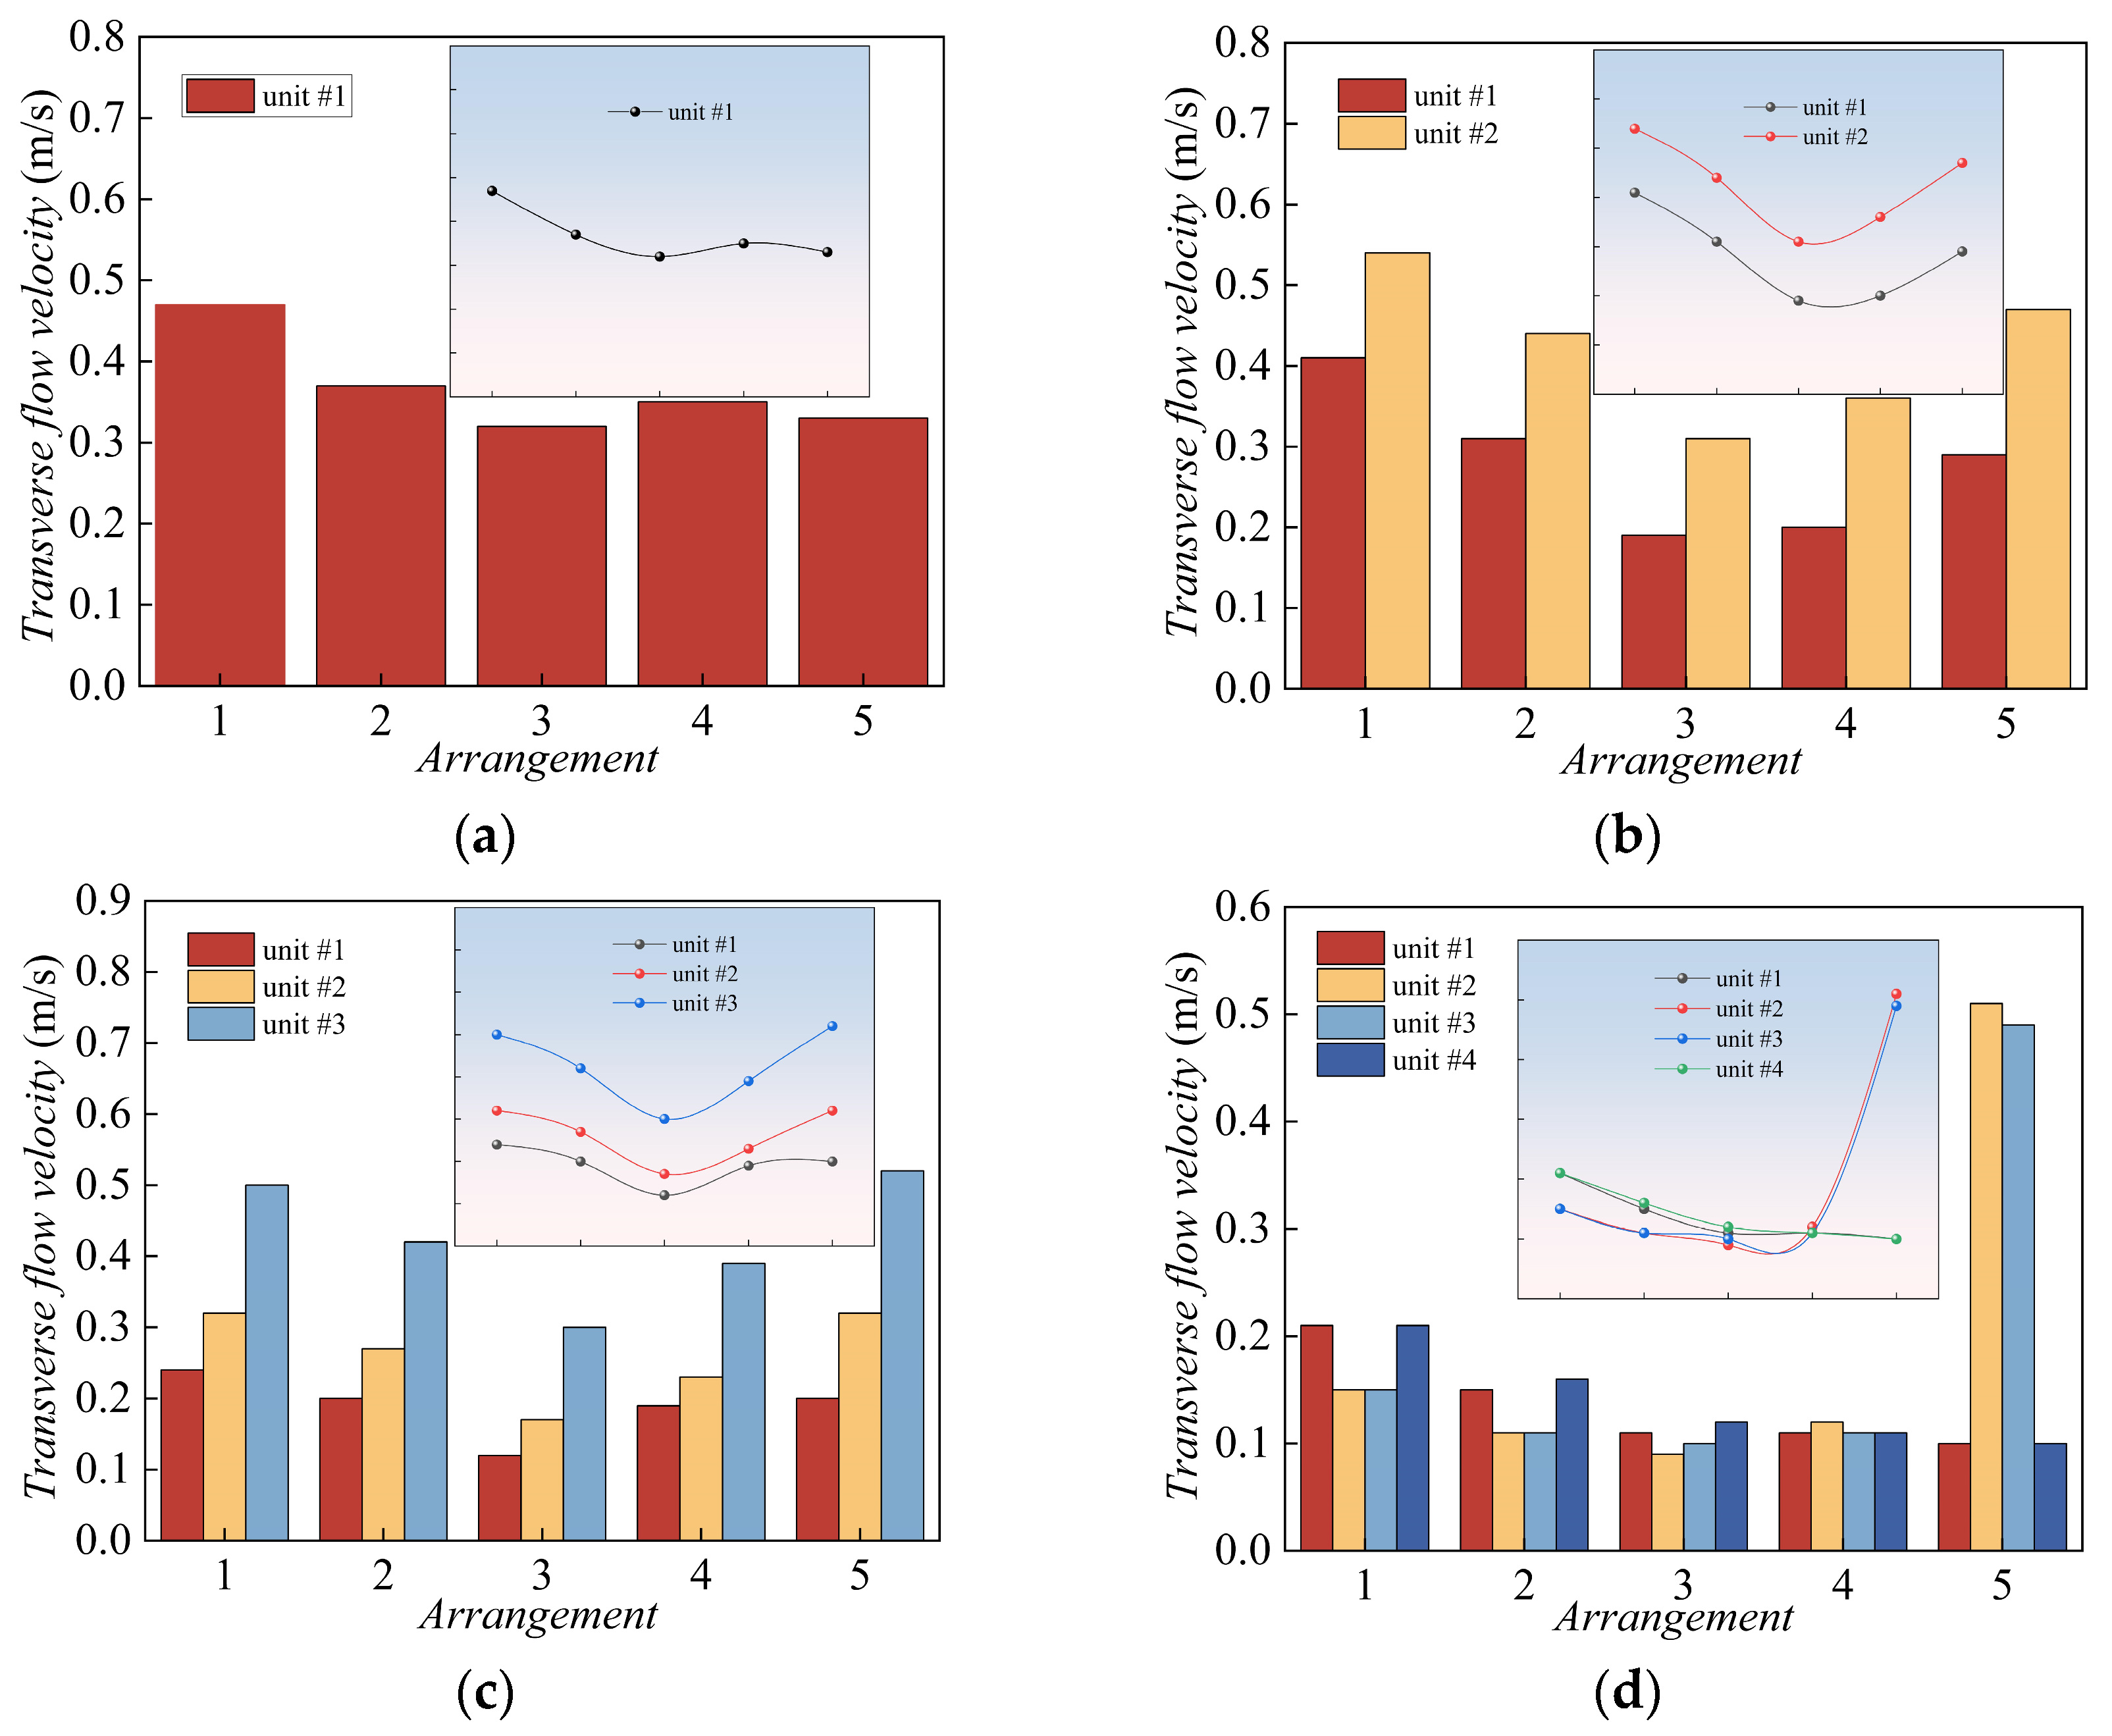
5.2.2. Analysis of Transverse Flow Velocity
The LGY-II intelligent miniature flow velocity meter (Hydraulic Research Institute, Nanjing, China) was utilized in the model tests. Measurement points were horizontally aligned in front of the inlet channels on both the left and right sides of each unit. The accuracy of the electromagnetic flow measurement is ±0.5%, and the water depth testing error is ±0.5 mm. When measuring the flow velocity before the inlet of the channel, each measurement point should be tested at least four times, with intervals of no less than eight seconds between each test. The error across multiple tests at each measurement point should not exceed 5%. Figure 18 illustrates the transverse flow velocities at the channel inlet for five different partition wall configurations. The installation of partition walls in the forebay notably decreased the transverse flow velocity at the channel inlet. In operating condition 1, the transverse flow velocity at the inlet of unit #1 channel was greatly reduced after the addition of partition walls in the forebay. Compared with arrangement 1, the elimination rate of transverse flow velocity at the inlet of unit #1 channel reached 36.4%. As the length of the partition wall increased, the transverse flow velocity at the inlet of unit #1 channel also slightly increased.

Figure 18.
Transverse flow velocities in front of the channel inlets (model test). (a) Operating condition 1; (b) operating condition 2; (c) operating condition 3; (d) operating condition 4.
In operating condition 2, after adding a partition wall in the forebay, the transverse flow velocity at the inlet of units #1 and #2 channels is significantly reduced. In arrangement 3, the transverse flow velocity at the inlet of the channel reaches a minimum. The elimination rate of transverse flow velocity at the inlet of unit #1 channel reaches 59.7%, while for unit #2 it reaches 45.6%, compared to arrangement 1. As the length of the partition wall increases, the transverse flow velocity at the inlet of both unit #1 and unit #2 channels also increases.
In operating condition 3, the installation of a partition wall in the forebay significantly reduces the transverse flow velocity at the inlet of the channel. In arrangement 3, the transverse flow velocity at the inlet of the channel reaches a minimum. In arrangement 3, the transverse flow velocity elimination rate at the inlet of unit #1 channel is 50.0%, for unit #2 it is 50.4%, and for unit #3 it is 41.2% when compared to arrangement 1. Additionally, as the length of the partition wall increases, the transverse flow velocity at the inlet of units #2 and 3# channels significantly increases.
In operating condition 4, the transverse flow velocity at the inlet of unit #2 and #3 channel reached its minimum in arrangement 3, with a 40.2% reduction in the transverse flow velocity at the inlet of each operating unit compared to arrangement 1. As the length of the partition wall increased further, the transverse flow velocity at the inlet of units #1 and #4 channels slightly decreased. In arrangement 5, the transverse flow velocities at the inlet of units #2 and #3 channels increased sharply.
After integrating various operating conditions, it can be seen that the addition of a partition wall in the forebay has a significant impact on the flow regime of the inlet channel. With the increase in the length of the partition wall, the transverse flow velocity at the inlet of the channel decreases significantly and is basically at its minimum when using arrangement 3.
The results of model experiments and numerical simulations exhibit a certain degree of error. This is attributed to the manual placement of the measurement frame card meter during the flow velocity measurement process described in this article. Despite the high precision with which the flow velocity meter was positioned, factors such as slight vibrations in the experimental system and unstable water flow in the measurement area introduced errors. Multiple flow velocity measurements verified this. Table 5 compares the results of the transverse velocity elimination rate at the inlet of the channel for arrangements 1 and 3 based on numerical simulations and model tests. As shown in Table 5, under various operational conditions, the relative errors between the numerical simulation results and the model test results of the transverse velocity elimination rate at the inlet of each channel are all less than 7.0%. The results of the transverse velocity elimination at the inlet of the channel are basically the same for both numerical simulations and model tests. The results of the pump station inflow flow regime and transverse velocity test at the inlet of the channel under different partition lengths obtained from hydraulic model tests are consistent with the numerical simulation results. The flow direction, biased flow, and position of low-velocity stagnation zones are also basically consistent, which can be used to verify the numerical simulation results.
Table 5.
Comparison of numerical and physical models for the elimination rate of transverse flow velocity at the inlet of channel between arrangement 1 and arrangement 3.
5.3. Discussion
The numerical simulation results of the design arrangement indicate that installing partition walls can improve the flow regime of the forebay in a coastal pumping station. Taking operating condition 2 as an example, under the original design arrangement without installing partition walls, there is a large area of vortex and low-speed zones on the side of the non-operating unit. The asymmetric start of the pump unit induces a bias flow in the forebay, and coupled with the influence of the vortex zone, there is severe lateral flow at the inlet channel, affecting the inlet flow regime of the pump station, as shown in Figure 9a. Compared with arrangement 1, arrangement 3 achieved the best results in terms of the uniformity of flow velocity distribution in the cross-section after the inlet of the inlet channel and the transverse flow velocity before the inlet of the pump station. The uniformity at the left opening of unit #1’s inlet channel increased 5.27%, and for unit #2, it increased 6.03%. The transverse flow velocity reduction rates at the inlets of units #1 and #2 in arrangement 3 reach 66.7% and 51.7%, respectively. As shown in Figure 9c, Figure 12 and Figure 15b. It can be inferred that the installation of the partition wall effectively adjusts the inlet flow regime of the pump station. This adjustment effect not only eliminates the influence of the vortex zone but also has a positive effect on the inlet flow regime under all operating conditions.
The physical model experiments corroborate the accuracy of numerical simulation calculations. Taking condition 2 as an example, when no partition wall is installed, there is significant transverse flow in front of the inlet channel, and there is a backflow area near the inlet of the inlet channel of the non-operating unit, with obvious water flow disturbance, as shown in Figure 16b. After installing a partition wall in the forebay, the gradient of water flow velocity in the forebay decreases, the incoming flow in front of the inlet channel becomes more uniform, and the transverse velocity decreases, as shown in Figure 17b. In arrangement 3, the elimination rate of transverse flow velocity at the inlet of unit #1 channel reaches 59.7%, while for unit #2 it reaches 45.6%, compared to arrangement 1, as shown in Figure 18b.
In conclusion, installing partition walls has been proven to be an effective method for optimizing the inflow flow regime in engineering structural design. It is crucial to use multiple evaluation indicators to measure the inflow flow regime of the pump station during the optimization process. This study provides effective insights into optimizing the structure of the pump station forebay by quantitatively analyzing the characteristics of the internal flow field, the transverse velocity distribution before the inlet, and the uniformity of the water flow distribution after the inlet. Unlike previous research results, this study proposes a more universal and applicable optimization method, which warrants further consideration and promotion in future research and applications, particularly in pump stations with different numbers of units or varying forebay diffusion angles.
6. Conclusions
This study aims to determine the optimal working length of the partition wall by using numerical simulation software to model the forebay of a pump station and to verify these findings through physical model experiments. The flow characteristics of the forebay under different configurations were comprehensively compared using multiple evaluation indicators, establishing a relationship between these indicators and the partition wall layout parameters. Consequently, a method and theory for optimizing the inflow conditions of the forebay in coastal pumping stations were developed. The principal conclusions of this study are as follows:
- (1)
- During asymmetric operation of large coastal low-head pump stations, hydraulic phenomena such as bias flow and stagnant water may occur in the forebay. The inflow direction at the channel inlet becomes inclined, resulting in a significant transverse flow velocity. With fewer operating units, the transverse flow at the channel inlet becomes more pronounced, which can easily lead to the formation of an air vortex at the inlet channel, thereby affecting the safe and stable operation of the pump units.
- (2)
- Numerical simulation results have demonstrated the feasibility of using multiple indicators to evaluate the flow regime of pumping stations under different operating conditions. Comprehensive evaluation indicators provide a more reasonable assessment of the operational status of pump stations. The optimal configuration for the partition wall is as follows: the width of the partition wall is 1.2 m, and the length is 2L (where L is the inlet width of the channel). Compared to the initial arrangement, during asymmetric operation, the average uniformity of flow velocity distribution in the left opening of the inlet channel of each unit increased by 5.11%, and the average elimination rate of lateral flow velocity before the inlet reached 52.85%. During the operation of the entire unit, the uniformity of flow velocity distribution in the left and right openings of each inlet channel increased by 1.75%, and the lateral flow velocity before the inlet was reduced by 39.55%. Therefore, the optimized pump station forebay meets the operational requirements of the project.
- (3)
- Physical model experiments can verify numerical simulation results. The experiment results of the inlet flow regime and transverse flow velocity at the inlet of the pump station under different partition wall configurations obtained from hydraulic model experiments, as well as their influence patterns, are consistent with the numerical simulation results. Under various operational conditions, the relative errors between the numerical simulation results and the model test results for the transverse velocity elimination rate at the inlet of each channel are all less than 7.0%.
- (4)
- In the next stage, this study will further consider the rectification effect under different working conditions of the pump station to ensure safe and stable operation with different forebay diffusion angles and more units after installing the partition wall.
Author Contributions
Conceptualization, F.L. and L.X.; methodology, F.L.; software, F.L. and P.L.; validation, F.L., X.G. and L.W.; formal analysis, F.L. and L.X.; investigation, F.L. and P.L.; resources, F.L.; data curation, F.L. and B.Z.; writing—original draft preparation, F.L. and P.L.; writing—review and editing, F.L., B.Z. and L.X.; visualization, F.L.; supervision, B.Z., X.G. and L.W.; project administration, L.X.; funding acquisition, L.X. All authors have read and agreed to the published version of the manuscript.
Funding
This research was funded by the Jiangsu South-to-North Water Diversion Technology R&D Project, grant number JSNSBD202105, the National Natural Science Foundation of China grant number Grant No. 51779215, and the Jiangsu Water Conservancy Science and technology project grant number Grant No. 2022010. The APC was funded by China Institute of Water Resources and Hydropower Research.
Data Availability Statement
The original contributions presented in this study are included in the article. Further inquiries can be directed to the corresponding author.
Conflicts of Interest
The authors declare no conflicts of interest.
References
- Jiang, W.; Yu, J.Z.; Fu, Z.P. Flow Patterns and Rectification Measures in a Forebay of Pumping Station Designed at Bend River. Yellow River 2019, 41, 83–87+118. [Google Scholar]
- Lu, Y.J.; Zhou, W.; Ming, Y.M. Layout design optimization of integrated pumping station and sluice with numerical stream simulation. J. Drain. Irrig. Mach. Eng. 2014, 32, 963–967. [Google Scholar]
- Huang, X.B.; Xi, C.N.; Dong, Z.H. Control methods of air-entrained vortex of intake. J. Irrig. Drain. Eng. 2024, 42, 657–662. [Google Scholar]
- Shi, W.; Lv, F.; Yu, X.; Wang, X.; Ni, C.; Lu, W.; Xu, L. Influence of Partition Wall Length on Inlet Flow Regime of a Pumping Station Arranged in Parallel with a Sluice Gate. Processes 2024, 12, 699. [Google Scholar] [CrossRef]
- Xu, W.T.; Cheng, L.; Du, K.L. Numerical and experimental research on rectification Measures for a contraction diversion pier in a pumping station. J. Mar. Sci. Eng. 2022, 10, 1437. [Google Scholar] [CrossRef]
- Xu, B.; Xu, S.P.; Xia, H. Optimal Design of Perforated Diversion Wall Based on Comprehensive Evaluation Indicator and Response Surface Method: A Case Study. Processes 2023, 11, 1539. [Google Scholar] [CrossRef]
- Yan, Z.Q.; Gu, J.D.; Zhao, J.J. Experimental study on hydraulic performance Optimization of pump house with ultra-short forebay. J. Phys. Conf. Ser. 2021, 2044, 12020. [Google Scholar]
- Bai, Y.C.; Li, B.; Xu, H.Y. Rectifying analysis of multi-herringbone diversion piers scheme for large span pumping station in forebay. Water Resour. 2019, 37, 75–79. [Google Scholar]
- Zhang, C.; Yan, H.; Jamil, M.T. Improvement of the Flow Pattern of a Forebay with a Side-Intake Pumping Station by Diversion Piers Based on Orthogonal Test Method. Water 2022, 14, 2663. [Google Scholar] [CrossRef]
- Liu, M.Q.; Lin, Q.; Liang, X. Numerical simulation research on improving flow pattern of forebay of a pumping station. J. Wuhan Univ. 2012, 45, 152–156. [Google Scholar]
- Zhou, J.R.; Zhong, S.W.; Liang, J.D. Three dimensional numerical simulation of side-intake forebay of pumping station. J. Irrig. Drain. Eng. 2015, 34, 52–55+80. [Google Scholar]
- Li, Y.Y.; Guo, P.C.; Sun, L.G. Numerical analysis on influence of vertical column on flow pattern in forebay and intake of large pumping station. J. Irrig. Drain. Eng. 2021, 39, 929–936. [Google Scholar]
- Xu, R.L.; Xu, L.; Lu, L.G. Optimum design of rectifying flow of column array in pressure forebay with extra-large diffusion angle of a pumping station. Water Resour. Hydropower Eng. 2021, 52, 134–145. [Google Scholar]
- Xia, C.Z.; Cheng, L.; Jiao, W.X. Nurnerical simulation on rectification measure of inverted T-shaped sill at forebay of pump station. South–North Water Transf. Water Sci. Technol. 2018, 16, 146–150+163. [Google Scholar]
- Xi, W.; Lu, W.G.; Wang, C. Optimization of the Hollow Rectification Sill in the Forebay of the Pumo Station Based on the PSO-GP Collaborative Algorithm. Shock Vib. 2021, 2021, 6618280. [Google Scholar]
- Xu, B.; Lv, H.P.; Xia, H. Influence of Trapezoidal sills on flow pattern in forebay of fenghuangjing new station. Water Resour. Power 2023, 41, 124–127. [Google Scholar]
- Yu, Y.H.; Yan, H.D.; Ye, C.L. Parameter optimization of rectification sill in the forebay of pumping station using BPNN-GA algorithm. Trans. Chin. Soc. Agric. Eng. 2023, 39, 106–113. [Google Scholar]
- Luo, C.; Cheng, L.; Liu, C. Numerical simulation of mechanism for sill rectifying flow in pumping station intake. J. Drain. Irrig. Mach. Eng. 2014, 32, 393–398. [Google Scholar]
- Song, W.W.; Pang, Y.; Shi, X.H. Study on the Rectification of Forebay in Pumping Station. Math. Probl. Eng. 2018, 2018, 2876980. [Google Scholar]
- Yang, F.; Zhang, Y.Q.; Liu, C. Numerical and Experimental Investigations of Flow Pattern and Anti-Vortex Measures of Forebay in a Multi-Unit Pumping Station. Water 2021, 13, 935. [Google Scholar] [CrossRef]
- Han, F.; Liang, J.D. Numerical Simulation and Improvement for Flow Pattern in Forebay of One-way Inflow Pumping Station. China Rural. Water Hydropower 2018, 8, 190–193. [Google Scholar]
- Feng, J.G.; Wang, X.B.; Cheng, B. Experimental Study on the Flow Pattern Modifying in the Fore Bay of large Urban Side Inflow Pumping Stations. Procedia Eng. 2012, 28, 214–219. [Google Scholar]
- Nasr, A.; Yang, F.; Zhang, Y.Q. Analysis of the Flow Pattern and Flow Rectification Measures of the Side-Intake Forebay in a Multi-Unit Pumping Station. Water 2021, 13, 2025. [Google Scholar] [CrossRef]
- Zheng, X.B.; Zhang, P.L.; Zhang, W.J. Numerical Study on the Influence of Combined Rectification Facilities on the Flow in the Forebay of Pumping Station. Water 2023, 15, 3847. [Google Scholar] [CrossRef]
- Li, Y.; Gu, J.D.; Guo, C. Flow Patterns and Rectification Measures in the Forebay of Pumping Station. IOP Conf. Ser. Mater. Sci. Eng. 2020, 794, 012058. [Google Scholar] [CrossRef]
- Matyakubov, B.; Mamajonov, M.; Shakirov, B. Forebays of the poligonal cross-section of the irrigating pumping station. IOP Conf. Ser. Mater. Sci. Eng. 2020, 883, 012050. [Google Scholar] [CrossRef]
- Khasanov, B.; Azimov, A.; Djurabekov, A. Full-scale testing of water intake pumps of pumping stations. In E3S Web of Conferences; EDP Sciences: Les Ulis, France, 2019; Volume 97, p. 05017. [Google Scholar]
- Chae, K.J.; Kim, I.-S.; Ren, X.H. Reliable energy recovery in an existing municipal wastewater treatment plant with a flow-variable micro-hydropower system. Energy Convers. Manag. 2015, 101, 681–688. [Google Scholar] [CrossRef]
- Arifjanov, A.M.; Sattorov, A.X.; Atakulov, D. Method of calculation of the flow motion model in water intake facilities. IOP Conf. Ser. Earth Environ. Sci. 2023, 1231, 012060. [Google Scholar] [CrossRef]
- Zhu, H.G.; Xi, B. New method for pump sump hydraulic medel study. Trans. Chin. Soc. Agric. Mach. 2023, 34, 72–75. [Google Scholar]
- ANSI/HI 9.8-2018; Rotodynamic Pumps for Pump Intake Design. American National Standards Institute: Washington, DC, USA, 2018.
- Sun, D.X.; Mu, Z.W.; Li, F.Q. Experimental study on hydraulic characteristics of diversion pier combined with rough-strips energy dissipator in the bend spillway. J. Water Resour. Water Eng. 2019, 30, 166–171. [Google Scholar]
- Zi, D.; Wang, F.J.; Tao, R. Research for impacts of boundary layer grid scale on flow field simulation results in pumping station. Shuili Xuebao 2016, 47, 139–149. [Google Scholar]
- Zhou, D.F.; Wang, Y.B.; Zhou, J.R. Optimization of numerical simulation for intake sump in a sluice-pump station. Hydro-Sci. Eng. 2023, 5, 68–77. [Google Scholar]


Disclaimer/Publisher’s Note: The statements, opinions and data contained in all publications are solely those of the individual author(s) and contributor(s) and not of MDPI and/or the editor(s). MDPI and/or the editor(s) disclaim responsibility for any injury to people or property resulting from any ideas, methods, instructions or products referred to in the content. |
© 2025 by the authors. Licensee MDPI, Basel, Switzerland. This article is an open access article distributed under the terms and conditions of the Creative Commons Attribution (CC BY) license (https://creativecommons.org/licenses/by/4.0/).