Article

Taxonomic and Functional Beta Diversity Patterns and Their Driving Factors of the Fish Assemblages Around Marine Islands

1
Zhejiang Marine Fisheries Research Institute, Zhoushan 316201, China
2
Key Laboratory of Sustainable Utilization of Technology Research for Fishery Resources of Zhejiang Province, Zhoushan 316021, China
3
Scientific Observing and Experimental Station of Fishery Resources for Key Fishing Grounds, Ministry of Agriculture and Rural Affairs of the People’s Republic of China, Zhoushan 316021, China
4
Marine and Fisheries Institute, Zhejiang Ocean University, Zhoushan 316022, China
5
Putuo District Bureau of Marine Economic Development, Zhoushan 266071, China
6
College of Ocean and Earth Sciences, Xiamen University, Xiamen 361005, China
7
Fisheries College, Ocean University of China, Qingdao 266003, China
*
Authors to whom correspondence should be addressed.
J. Mar. Sci. Eng. 2025, 13(4), 674; https://doi.org/10.3390/jmse13040674
Submission received: 16 February 2025 / Revised: 15 March 2025 / Accepted: 26 March 2025 / Published: 27 March 2025
(This article belongs to the Section Marine Ecology)

Abstract

:
Beta diversity is an important way to analyze community assembly mechanisms in different habitats or along environmental gradients. However, research on marine fish assemblages around islands has lagged, especially for functional beta diversity. In this study, we evaluated taxonomic and functional beta diversity change of island fish assemblages along the coast in two seasons and revealed its relationship with environmental factors and geographical distance. Taxonomic and functional beta diversity were both dominated by turnover (over 80% and 60%), while the contribution of nestedness on functional beta diversity was significantly increased. Environmental factors such as temperature and dissolved oxygen were important drivers of beta diversity rather than geographical distance. Fish assemblages around islands that are far away from mainlands or affected greatly by anthropogenic activities usually have higher beta diversity. These results indicated that environmental filtration is the primary factor driving the mechanism of fish community assembly. Our study revealed the importance of the integrated application of two facets of biodiversity to investigate beta diversity. The findings can provide theoretical support for the protection of marine fish and the planning of marine protected areas in the future.

1. Introduction

The distribution patterns and maintenance mechanisms of marine biodiversity are always the crucial cornerstone and core issues for the conservation and restoration of marine ecosystems [1,2]. Three levels of biodiversity, namely alpha, beta, and gamma diversity, are the research fundamentals and enduring hotspots for marine life [3,4]. Alpha diversity (α) refers to biodiversity within small-scale communities; beta biodiversity (β) elucidates the variations of species compositions between different habitats or the turnover of assemblages along environmental gradients; gamma diversity (γ) depicts the macro-regional scale [5]. Due to the limits in quantifying beta diversity compared to alpha and gamma diversity, researchers have mainly focused on alpha and gamma diversity in marine ecosystems over a long period in the past [5,6]. However, as a bridge connecting alpha and gamma diversity, beta diversity has always been a focus of attention for ecologists. With the deepening of the concept and the advancement of computer methods, studies concerning beta diversity have sprung up, but there is still little research on marine fish assemblages [7].
Beta diversity can add spatial components to the analysis process, focusing on changes in community compositions between different habitats, which differs significantly from alpha and gamma diversity. In addition, beta diversity can better capture the dynamic processes of biodiversity changes and guide the improvement of the rational planning of nature reserves [8]. Previous research generally proved that beta diversity can be decomposed into a combination of turnover components and nested components [9]. The former leads to a decrease in common species and an increase in unique species among different communities, while the latter results in differences in species richness between communities [2]. The ingenious decomposition of beta diversity provides a new perspective for a deeper understanding of the driving mechanisms behind the construction of communities at a spatial scale [10]. By exploring the changing process of beta diversity and its components and comprehending the contributions of the two components to beta diversity, we could better understand the ecological processes that affect the structure of communities in different ecosystems or varied regions, which is of great significance for biodiversity conservation and restoration.
Environmental filtering and dispersal limitations are considered the two main processes for maintaining beta diversity [11]. Environmental heterogeneity and dispersal can both lead to species replacement (turnover), while nestedness is mainly related to non-random extinction and colonization dynamics. In some cases, the two factors jointly shaped the patterns of spatial and temporal beta diversity [12]. However, the two factors sometimes play inconsistent roles and occupy their dominant positions in different spatial and temporal scales, as well as among different biotopes [13]. For example, aquatic organism groups with different dispersing abilities showed contrasting beta diversity patterns when facing the disturbance of dams [14]; environmental factors were more accurate in predicting the beta diversity patterns of fish assemblages [15]. Biodiversity has three facets: taxonomic, functional, and phylogenetic diversity. Taxonomic diversity is a useful and widely used index. Functional diversity considers the functional traits of species and their relationships with ecosystems. Through the study of functional diversity, we can gain a clearer understanding of the response patterns of biodiversity to environmental disturbances, which is beneficial for a deeper understanding of the mechanisms of changes in ecosystem functions [4]. Specifically, the functional diversity of fish assemblages is often used to characterize the stability, complexity, and resilience of aquatic ecosystems after disturbance [5,7] By analyzing the relationships between taxonomic diversity and functional diversity, which can provide an important approach for monitoring the health status of ecosystems, analyzing the degree of ecological niche overlap between different functional groups, and solving the problems of protecting aquatic organisms and managing biodiversity decisions [4,15]. Diversity at three levels is interrelated, each with its own characteristics, jointly revealing different community assembly mechanisms [16]. Some studies pointed out that environmental and spatial processes might synergistically affect three facets of biodiversity, although their contributions may not be the same [12]. However, some studies suggested that the two factors influenced taxonomic and functional beta diversity, respectively [17]. These discordances stem from differences in scientific questions, spatiotemporal scales, experimental subjects, and methods [5,18,19]. Therefore, it is crucial to search for the influential mechanisms of environmental and spatial factors that affect the different facets of biodiversity. In this way, management and protection strategies tailored to the specific local situation can be proposed.
Research on the conservation and restoration of biodiversity based on beta diversity is currently a hot topic in China, but most studies concentrate mainly on animals, plants, terrestrial microorganisms, and fish in freshwater ecosystems, with few studies involving marine fish assemblages. Marine fish are not only highly diverse in taxonomy (~15,000), function, and phylogeny but also exhibit significant ecosystem multifunctionalities, such as regulating food web dynamics and nutrient balances, serving as links between ecosystems [20,21,22]. The high biodiversity and richness make marine fish communities cover all trophic levels in the marine food web, which is central to ecosystem functions [21]. However, due to climate change and human disturbances, like rising temperatures, increasing fishing pressures, habitat degradation, and biological invasions, fish communities are facing global threats [23]. These disturbances prominently affect the spatial distribution and resource density of fish communities. It was reported that the preference of fish for water depth and habitat has changed [24]. In addition, these changes could disrupt ecological processes regulated by fish communities, thereby reducing the provision of ecosystem services. Studies of fish beta diversity have proven to be an important basis for developing protection strategies in recent years.
Marine protected areas (MPAs) are important and effective measures to protect the biodiversity of marine fish [25]. Marine ecosystems have higher dynamics and connectivity compared to terrestrial ecosystems, but the design and construction of MPAs have always ignored these issues [26]. Low connectivity and lack of comprehensive design at the national level seriously weaken the conservation effectiveness of MPAs in China [27,28]. Beta diversity, a proxy of ecological connections among marine communities, could help elucidate spatial patterns of connectivity, which is invaluable for establishing efficient and highly connected MPAs [29]. In addition, studying beta diversity could help enhance the understanding of potentially intrinsic correlations, which is meaningful for resisting environmental disturbances [26]. The Chinese Government has approved the construction of seven national marine special protected areas along the coast of Zhejiang province, all of which are located next to islands. Therefore, it is essential to study the current distribution and beta diversity of fish assemblages, which is helpful in achieving the goals of MPAs.
China has a large number of marine islands, with a total land area of nearly 80,000 km2 and a coastline of over 14,000 km. China’s islands are widely distributed in temperate, subtropical, and tropical waters. Islands, coastlines, beaches, mangroves, and coral reefs jointly form distinctive and relatively independent island ecosystems and various biodiversity. Islands have superior hydrological and physicochemical conditions, diverse marine organisms, and are important spawning, breeding, and migration grounds for fishery stocks [30,31]. Islands provide enormous ecosystem services, including the supply of high-quality protein, oxygen production, climate regulation, cultural services, support for biodiversity, and ecosystem diversity [32]. Because of the high levels of biodiversity and abundant fishery resources, island waters support an important component of marine fisheries. Additionally, the river flows bring sufficient nutrients and fresh water to the islands, providing an important material basis for the growth, fattening, and reproduction of marine organisms [33]. However, despite having unique ecological advantages, marine fishery resources around islands, especially fish, are on the brink of collapse due to overfishing and habitat destruction.
In summary, this study aims to explore beta diversity, as well as its components and influencing factors of fish assemblages around island waters, from the perspective of taxonomic and functional beta diversity. This work is beneficial in providing new insights into the construction and maintenance mechanisms of fish diversity, the basis for biodiversity conservation and rational utilization of resources, and object lessons for the research on beta diversity of marine fish assemblages in China. The main objectives of the paper are to determine (a) the relative contributions of turnover and nestedness on taxonomic and functional beta diversity; (b) the influencing mechanisms of environmental and geographical factors on taxonomic and functional beta diversity; (c) the consistency and differentiation of taxonomic and functional beta diversity between the eight island and two seasons.

2. Materials and Methods

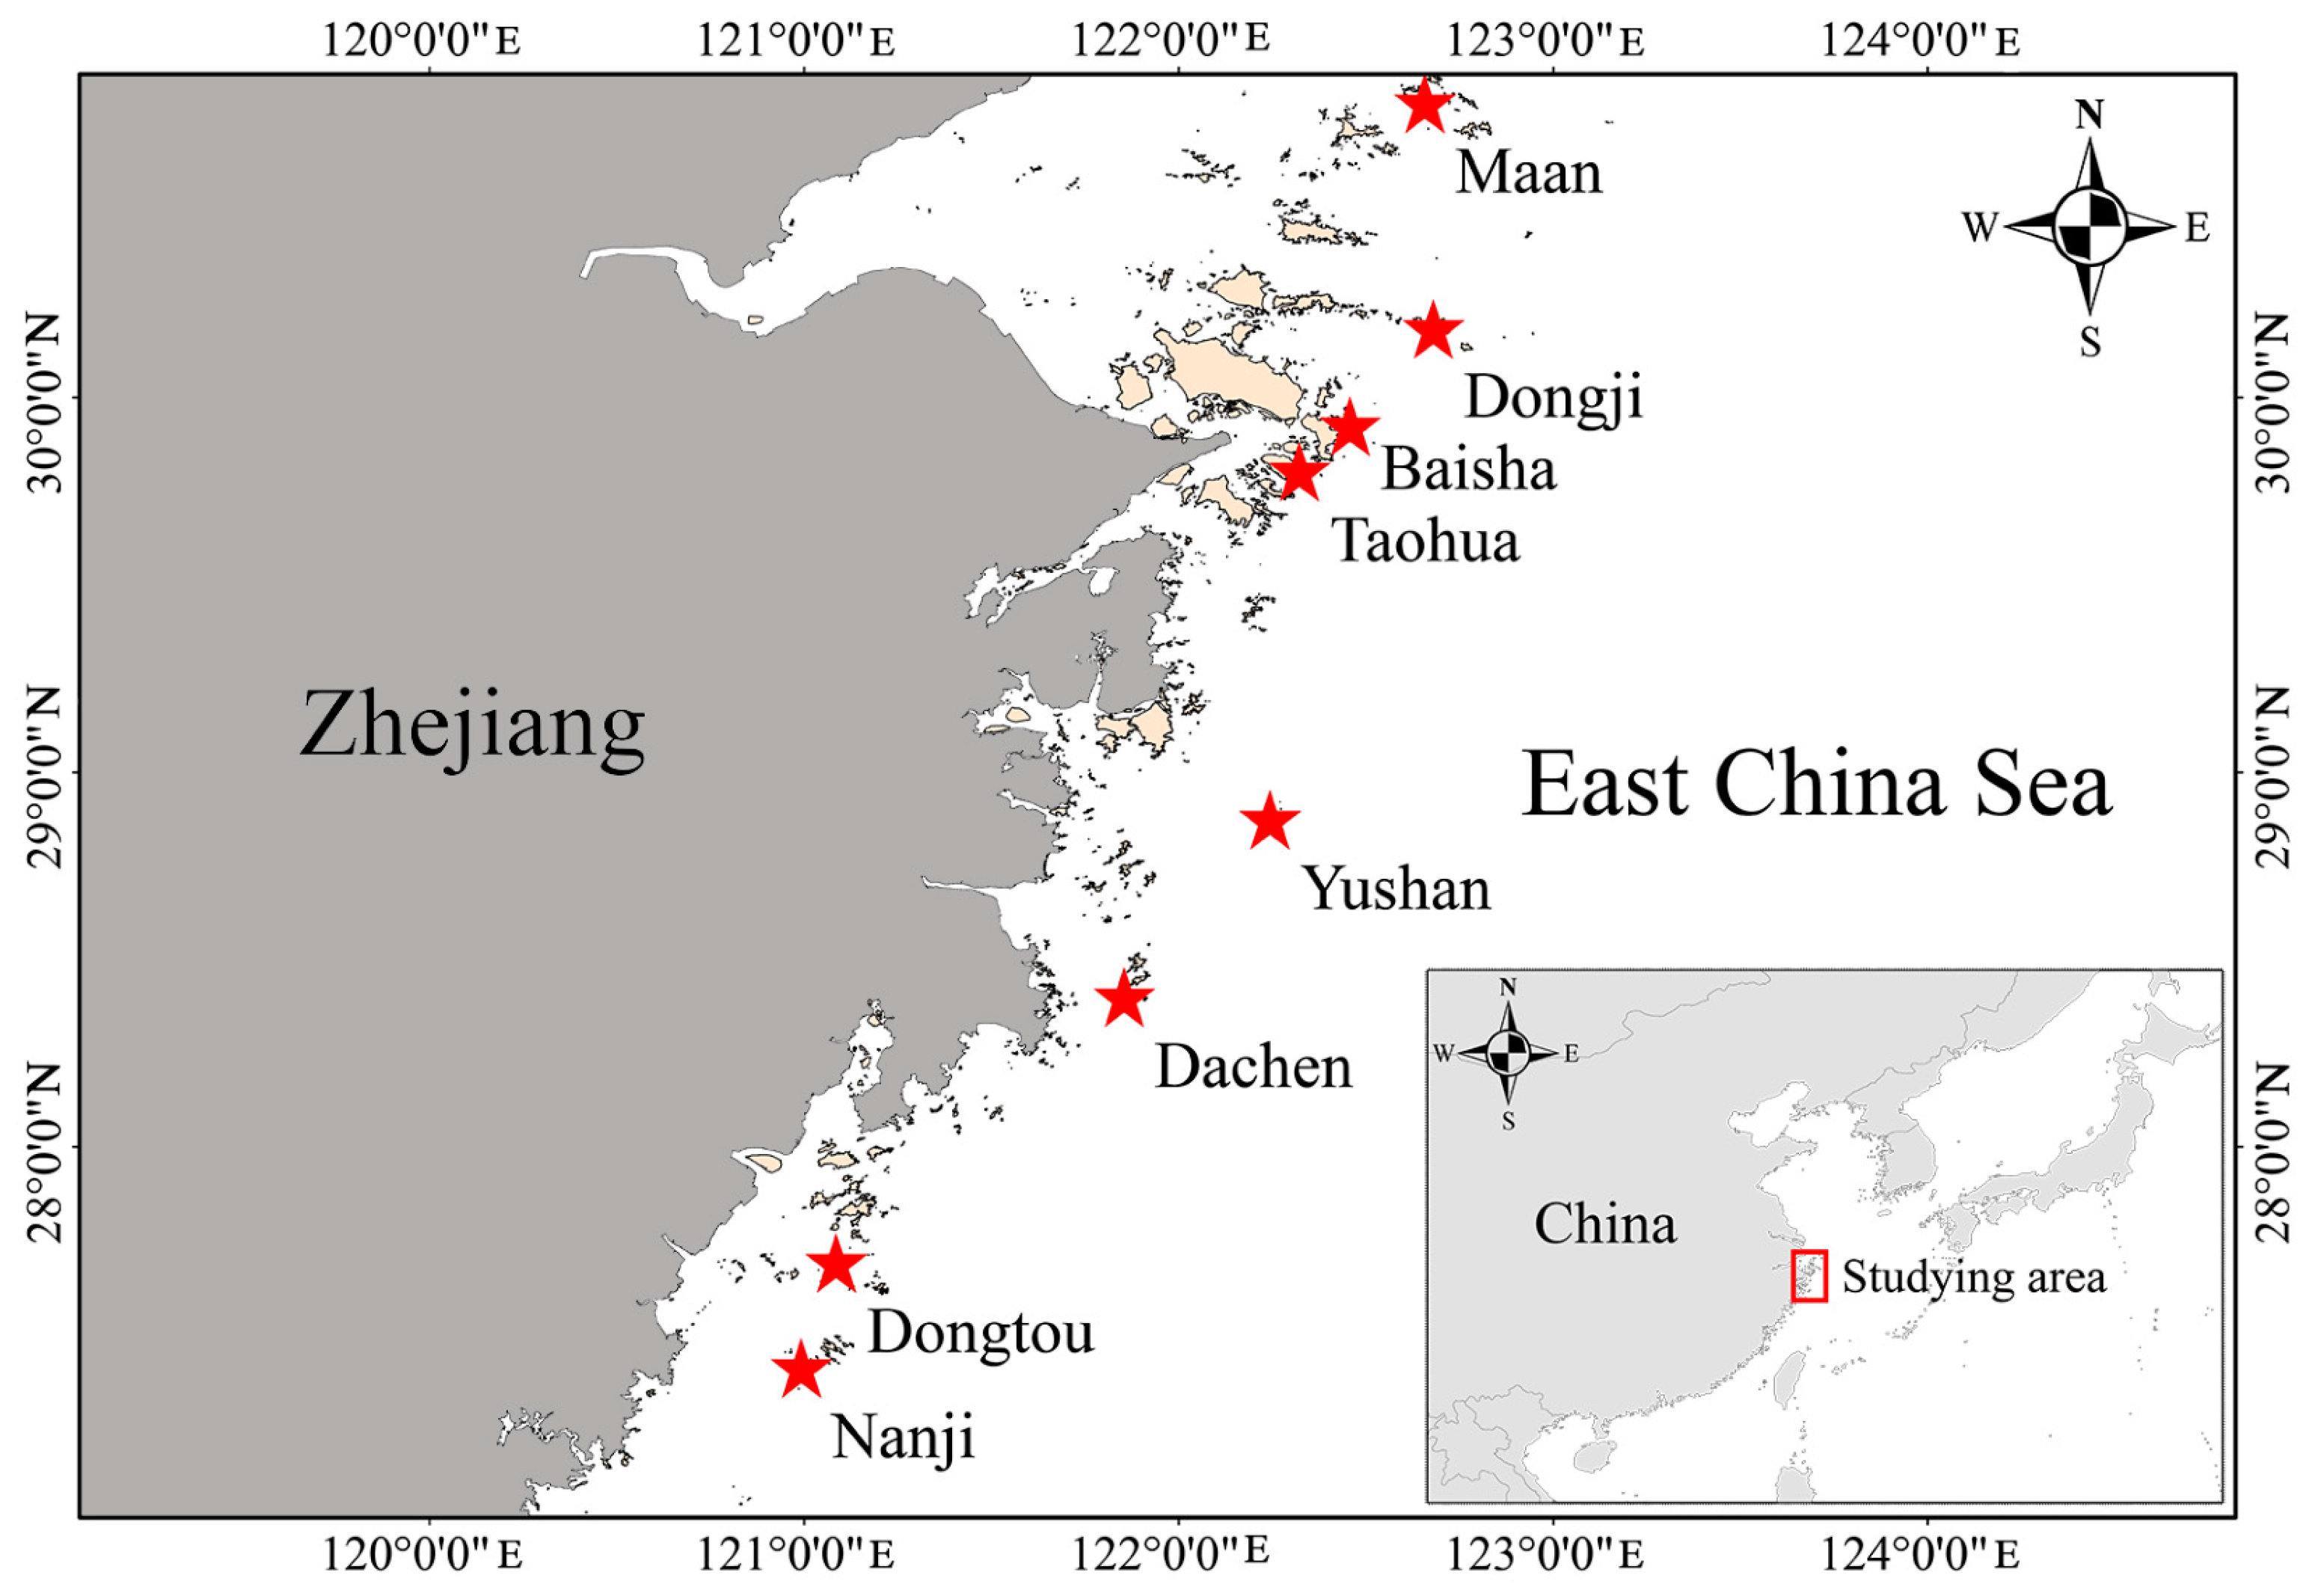
2.1. Study Area and Data Collection

Zhejiang Province is located on the southeast coast of China, with large river systems and a subtropical monsoon humid climate. Zhejiang has over 4300 islands along the coast of the East China Sea; the surrounding waters of islands are important breeding and feeding habitats for fishery resources. Under the influence of freshwater flushing from rivers like the Yangtze River, Qiantang River, and Ou River, Zhoushan Fishing Ground, a famous fishing ground in China, has emerged. Important economic fishery species inhabit the waters surrounding islands, such as large yellow croaker (Larimichthys crocea), cuttlefish (Sepiella japonica), brown croaker (Miichthys miiuy), and blackhead seabream (Acanthopagrus schlegelii). The annual average water temperature in the surrounding waters of the islands is 16~26 °C, and the water depth is within 30 m.
Eight important and representative islands were selected along the coast of Zhejiang to study the assembly mechanism of fish assemblages around marine islands (Figure 1). Eight islands, from north to south, are Maan Island (MA), Dongji Island (DJ), Basha Island (BS), Taohua Island (TH), Yushan Island (YS), Dachen Island (DC), Dongtou Island (DT), and Nanji Island (NJ). The basis for selecting eight islands in this paper includes the following factors: geographical distribution, whether it is a marine protected area (MPA), offshore distance, and the degree of disturbance from anthropogenic activities (Table S1). For geographical distribution, eight islands cover the entire coastal area of Zhejiang Province. For MPA, part of the waters of the four islands (MA, DJ, YS, NJ) are protected by policies, and fishing operations are not allowed. For offshore distance, five islands (MA, DJ, YS, DC, and NJ) are relatively far away from the mainland, while three islands (BS, TH, and DT) are close. For the degree of disturbance from anthropogenic activities, Dongtou Island is the largest of all islands, with bridges connecting the mainlands, Yushan Island is isolated and minimally affected by anthropogenic activities, making it a famous fishing ground in Asia, and the other six islands are famous tourist destinations.
Fish assemblages around the islands were sampled using demersal trawl. The sampling occurred in two seasons (spring in April and autumn in November), and both were completed within one month in 2022. Six random sampling stations around every island water (except Taohua Island, four stations) were designed to obtain fishery data and environmental data. Conduct one sampling operation per station, with each trawl lasting 30 min. Key trawl parameters, including gear coordinates, towing velocity, temporal markers, and geospatial positioning data, were systematically documented throughout the sampling duration. Then, the environmental factors containing temperature (Temp), dissolved oxygen (DO), chlorophyll-a (Chla), turbidity (Turb), sampling depth (Dep), pH, and salinity (Sal) of bottom water were measured in situ using an RBRmaestro3 C.T.D (RBR, Ottawa, ON, Canada). All catches were stored in a cooler filled with ice and transported back to the laboratory. Fish individuals were sorted, identified, and enumerated, and two biological characteristics (weight and total length) were measured. In this study, we obtained 43 (eight islands) and 32 (seven islands) valid samples in spring and autumn, respectively. Some samples failed due to weather conditions and damaged nets.

2.2. Taxonomic and Functional Beta Diversity and Decomposition

To quantify the taxonomic and functional beta diversity, the processing scheme of Baselga with additive partition was applied [2]. The Sørensen dissimilarity index was used to measure the beta diversity (βSor) and its two components (βSim: turnover and βSne: nestedness). Turnover represents the substitution of fish between assemblages, simultaneously including species loss and acquisition processes. Nestedness originates from the non-random loss process of fish between assemblages, where the fish contained in one assemblage are subsets of another assemblage. The contributions of the two components to beta diversity were calculated by the corresponding ratio of each component. Taxonomic beta diversity (TβSor) and its components (TβSim and TβSne) were evaluated based on the fish abundance matrix (presence/absence) by the package betapart.
In order to analyze functional beta diversity (FβSor) and its components (FβSim and FβSne), a functional matrix and an abundance matrix (presence/absence) were created. Eighteen functional traits affiliating to seven functional trait groups of 89 fish were coded by measuring fishery samples (maximum total length), professional website databases (e.g., Fishbase), and literature reviews (Tables S2 and S3). Seven groups, including food acquisition, locomotion, defense, ecological adaptation, reproduction, life history, and population dynamics, were used to represent the morphological characteristics, behavioral habits, and life history of fish. These functional traits are highly correlated with habitat characteristics, environmental changes, and human interference. Except for this, these traits were widely applied in studying the functional space of fish assemblages [15,16,19,22]. According to the classification of functional traits, eighteen traits were divided into thirteen response traits, two effects traits, and three traits that were ambiguous. Based on data type, eighteen traits contained three types, including three continuous traits, three ordinal traits, and twelve categorical traits. Then, the functional matrix had Gower’s distance conversion. Principal coordinate analysis (PCoA) was used to generate functional space based on the first four axes. The above calculations were completed using the package mFD.

2.3. Statistical Analysis

The environmental factor matrix and geographical distance matrix were preprocessed to enhance the data interpretability. Due to the potential high correlations between environmental factors, a collinearity test was performed before conducting later analysis to exclude factors with high correlation (Spearman r > 0.7). Then, Euclidean distance transformation was performed on the environmental factor matrix. These processes were performed using the Hmisc and vegan packages. The geographical distance between the two stations was calculated using longitude and latitude data through the package geosphere. The distance-based Moran’s eigenvector maps (dbMEM) were used to represent the spatial distance matrix as an orthogonal set of eigenvectors and obtain spatial factors. This transformation was handled using the package adespatial.
The Mantel test was used to analyze whether environmental factors and geographical distance have a significant impact on the taxonomic and functional beta diversity and its components of fish assemblages. Spearman correlation analysis was applied to test its correlation with 9999 permutations. Then, the partial Mantel was used to test the single effect of environmental factors or geographical distance on taxonomic and functional beta diversity. These two tests were conducted using the package vegan.
To explore the relationships between environmental factors, geographical distance, beta diversity, and their components, multiple regression analysis based on the matrix (MRM) was utilized through the package ecodist. The p-value was obtained through 9999 Mantel permutation tests. The MRM analysis ran twice. In the second MRM analysis, we removed the independent variables that were not significant (p > 0.05). The results of the second MRM analysis are presented. Variance partitioning analyses (VPA) were used to reveal the relative contributions of environmental factors and geographical distance to beta diversity and its components in different assemblages. The VPA was conducted using the package vegan.
All statistical analyses were conducted in R 4.2.3 (www.r-project.org). In addition to the R packages mentioned above, this study also used packages ggplot2, ggtern, and corrplot for analysis and plotting.

3. Results

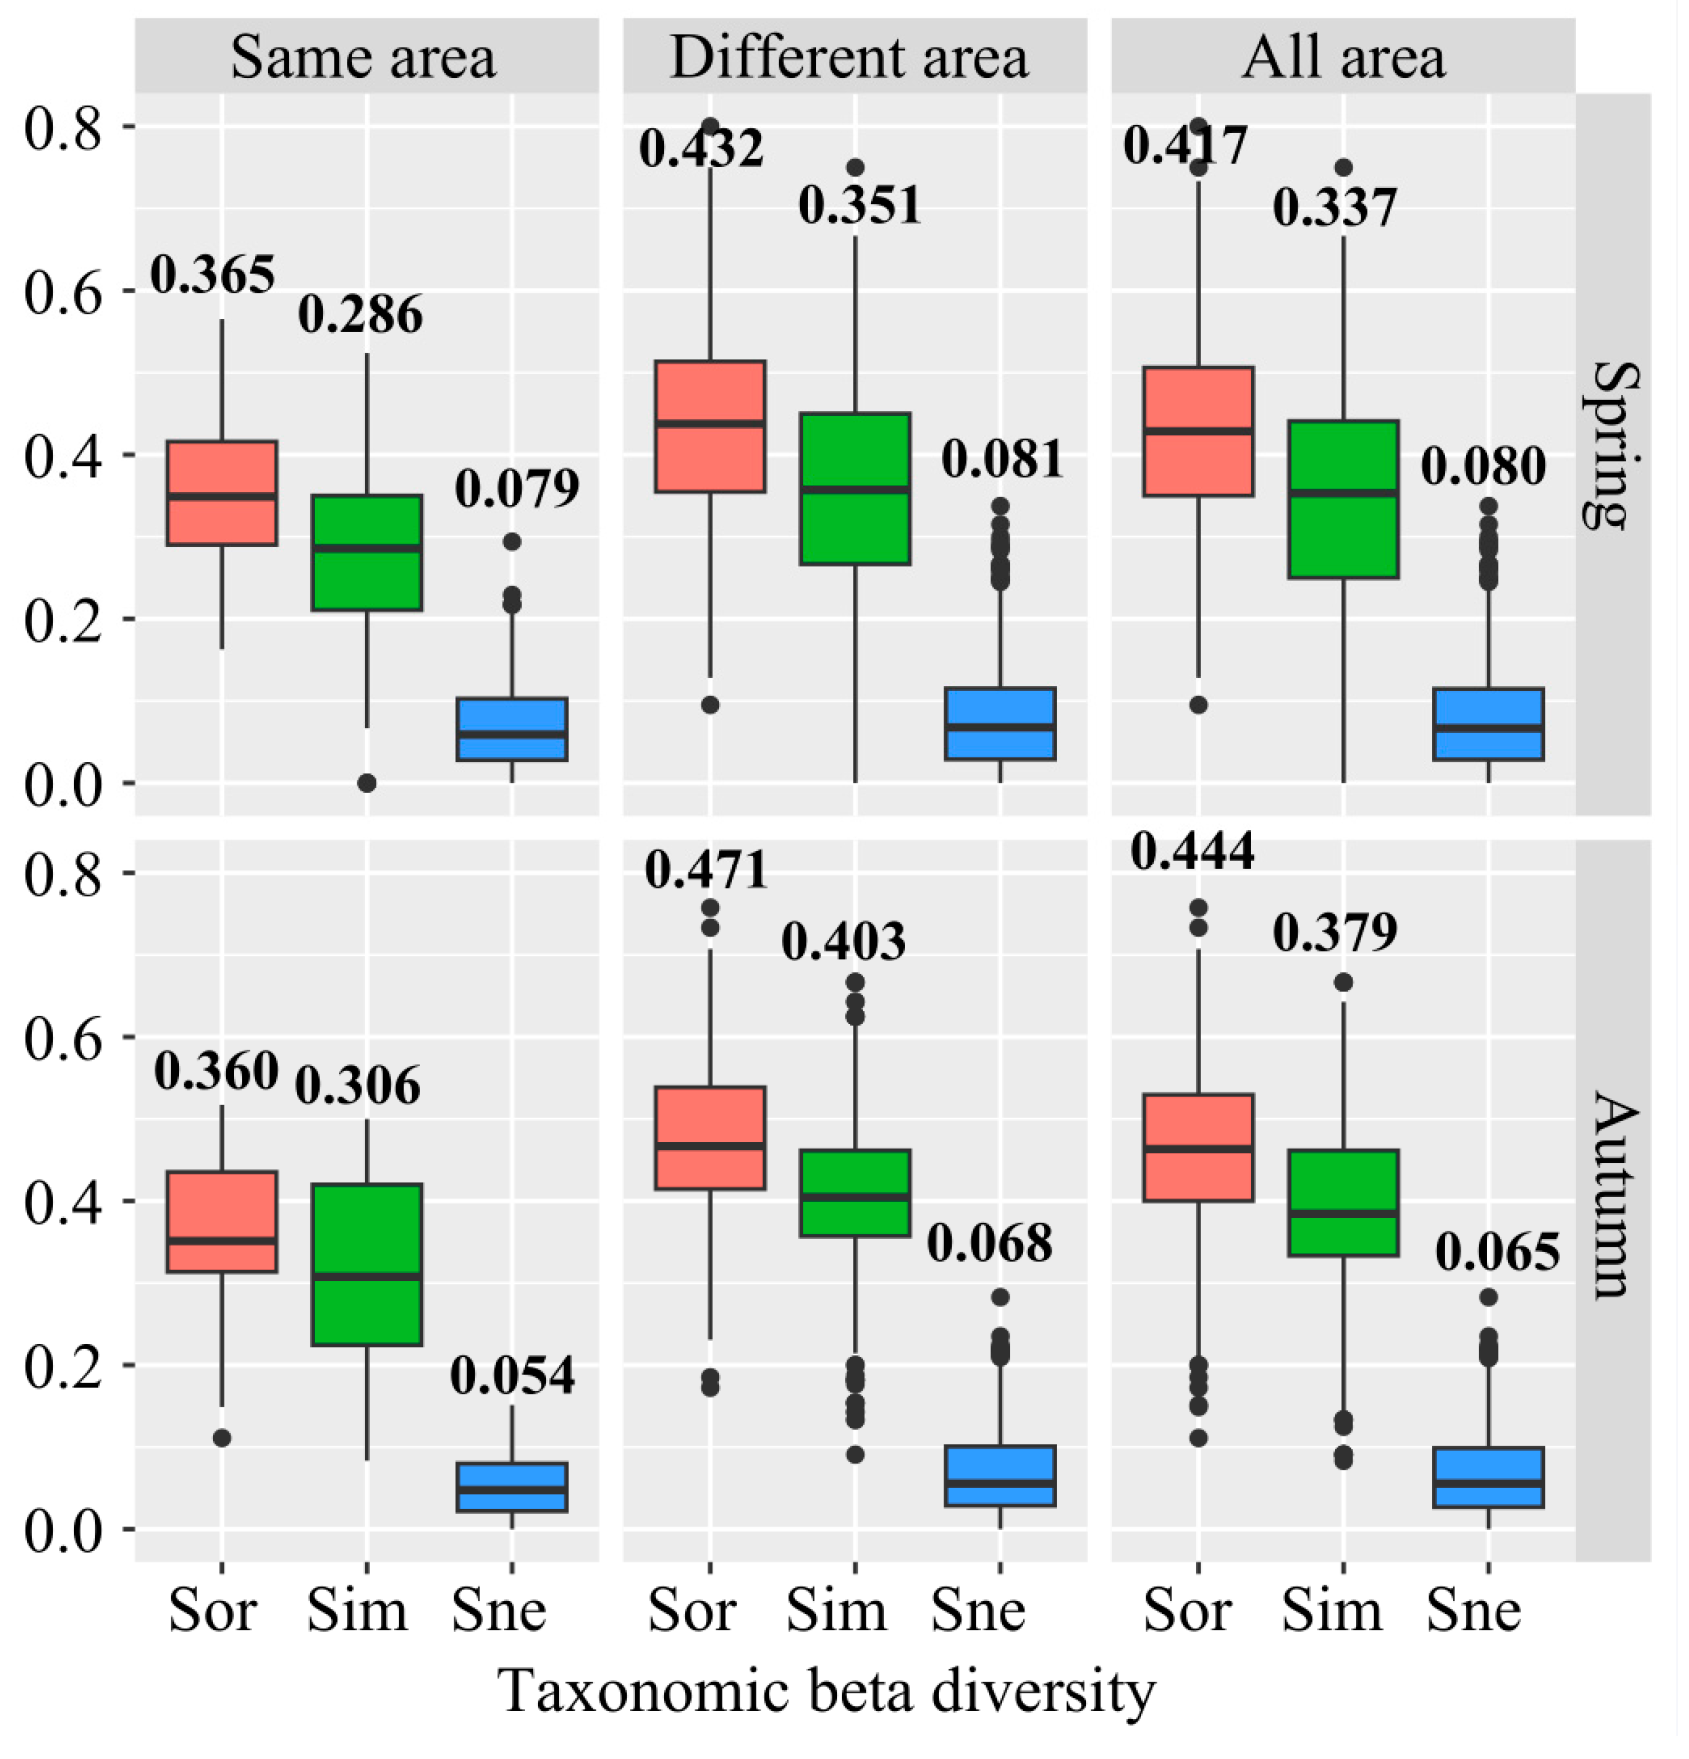
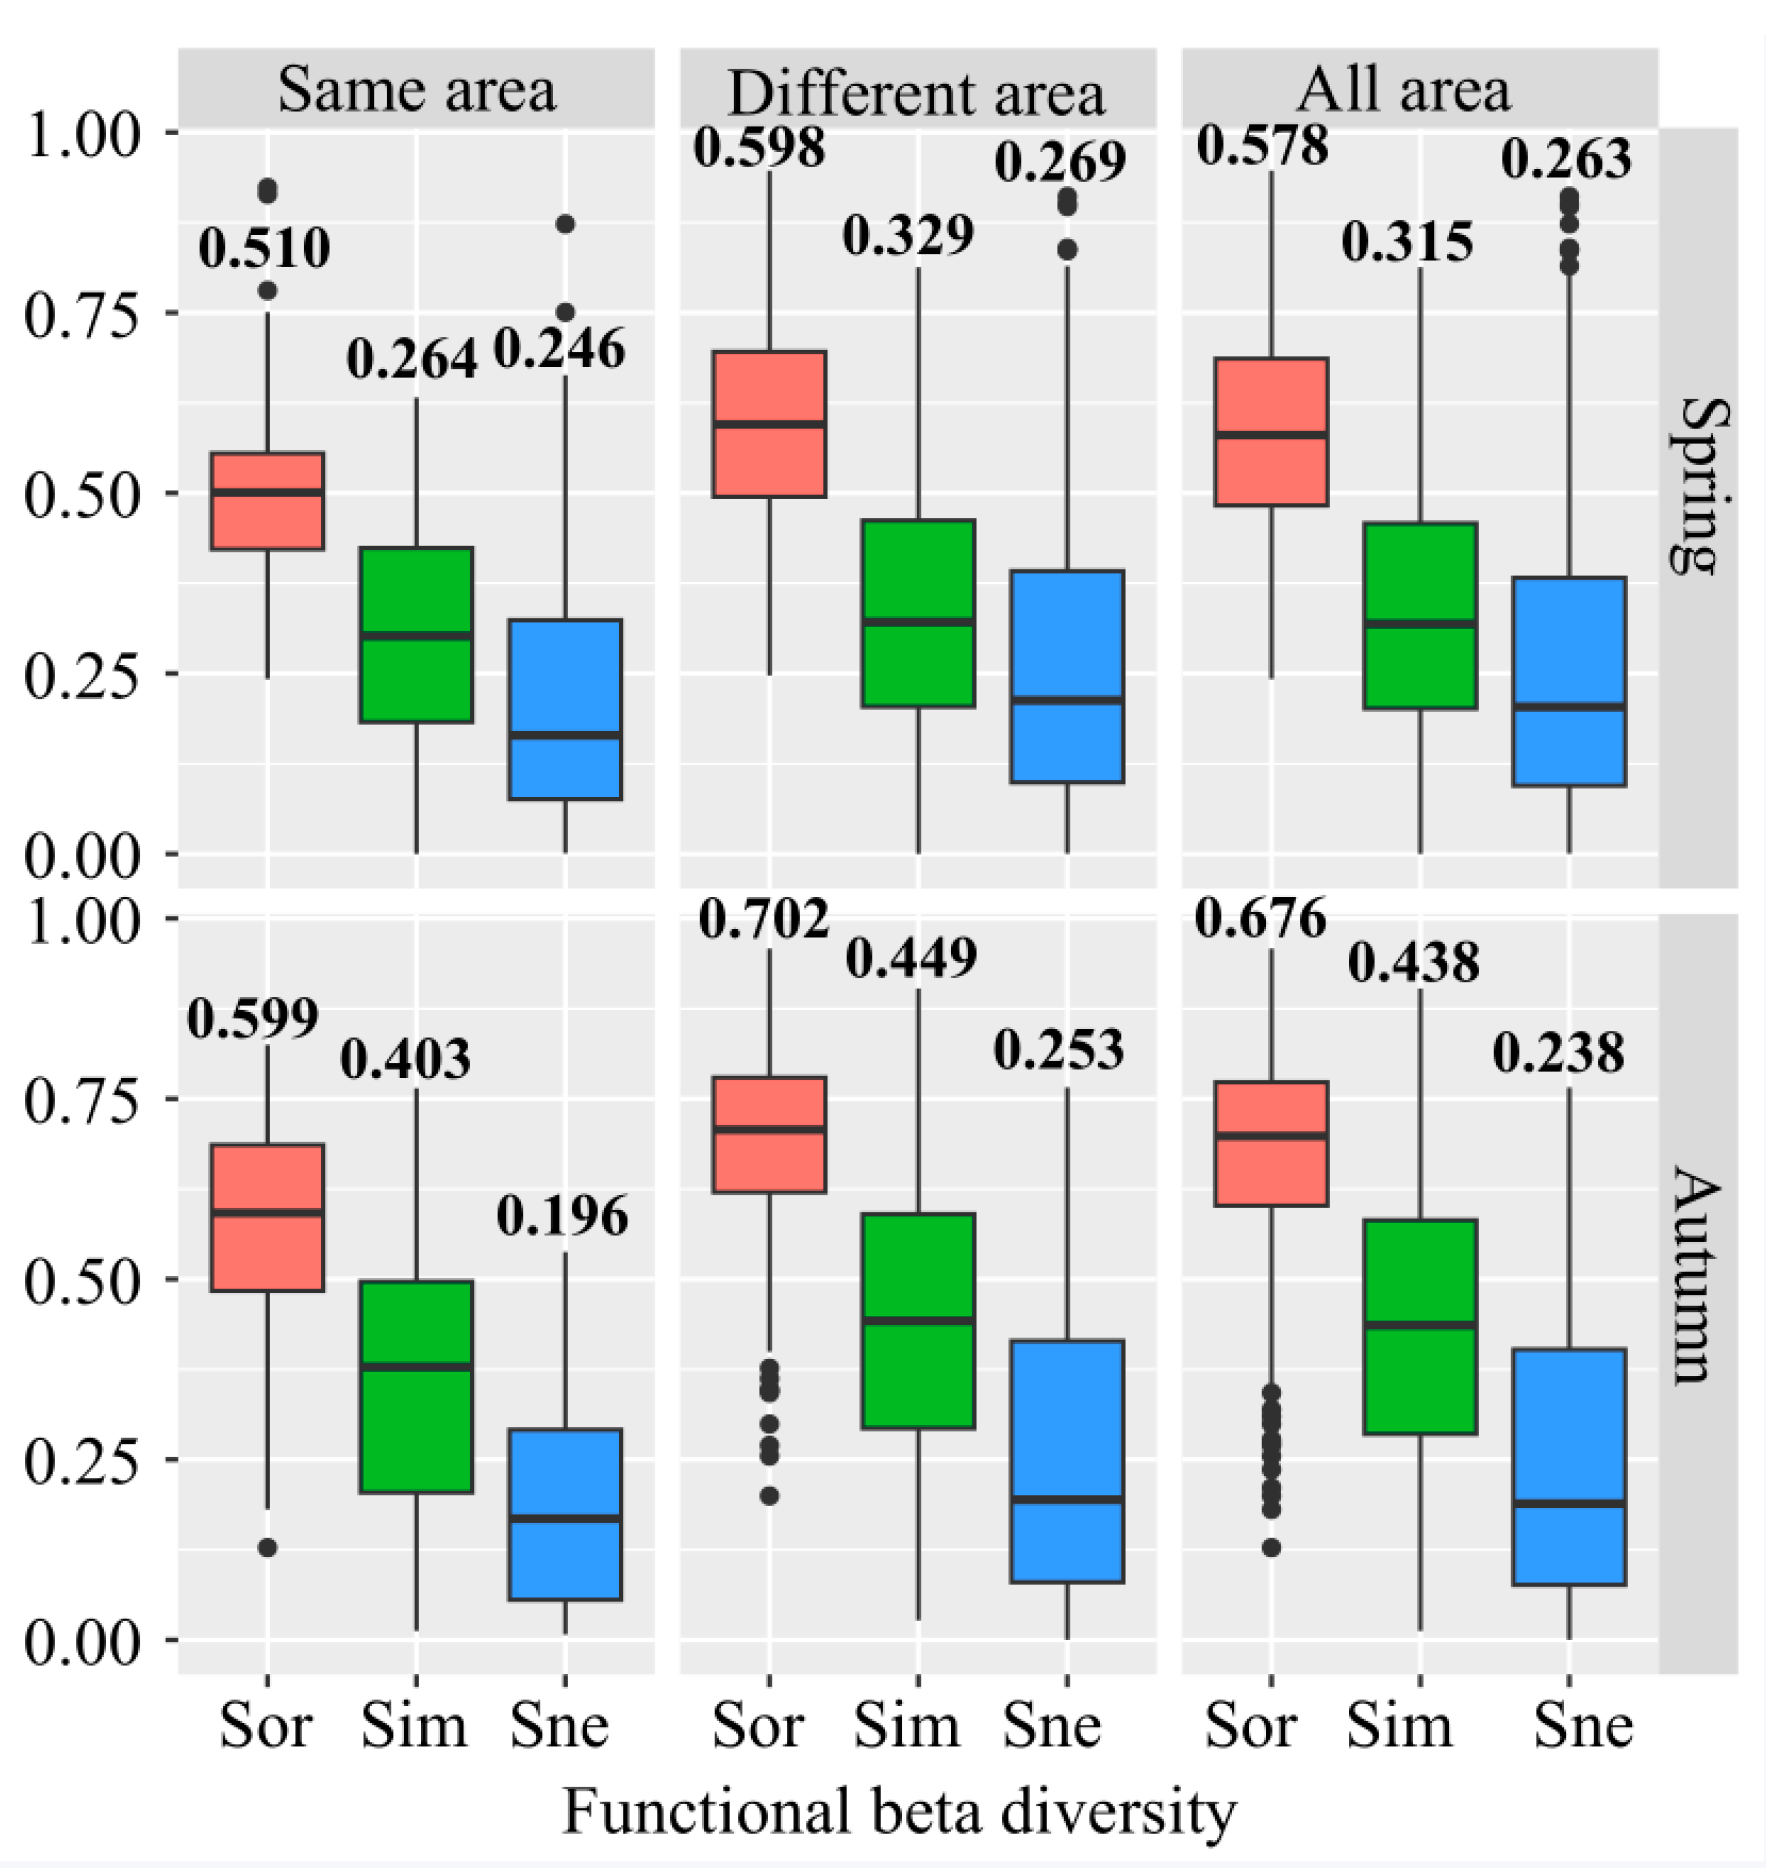
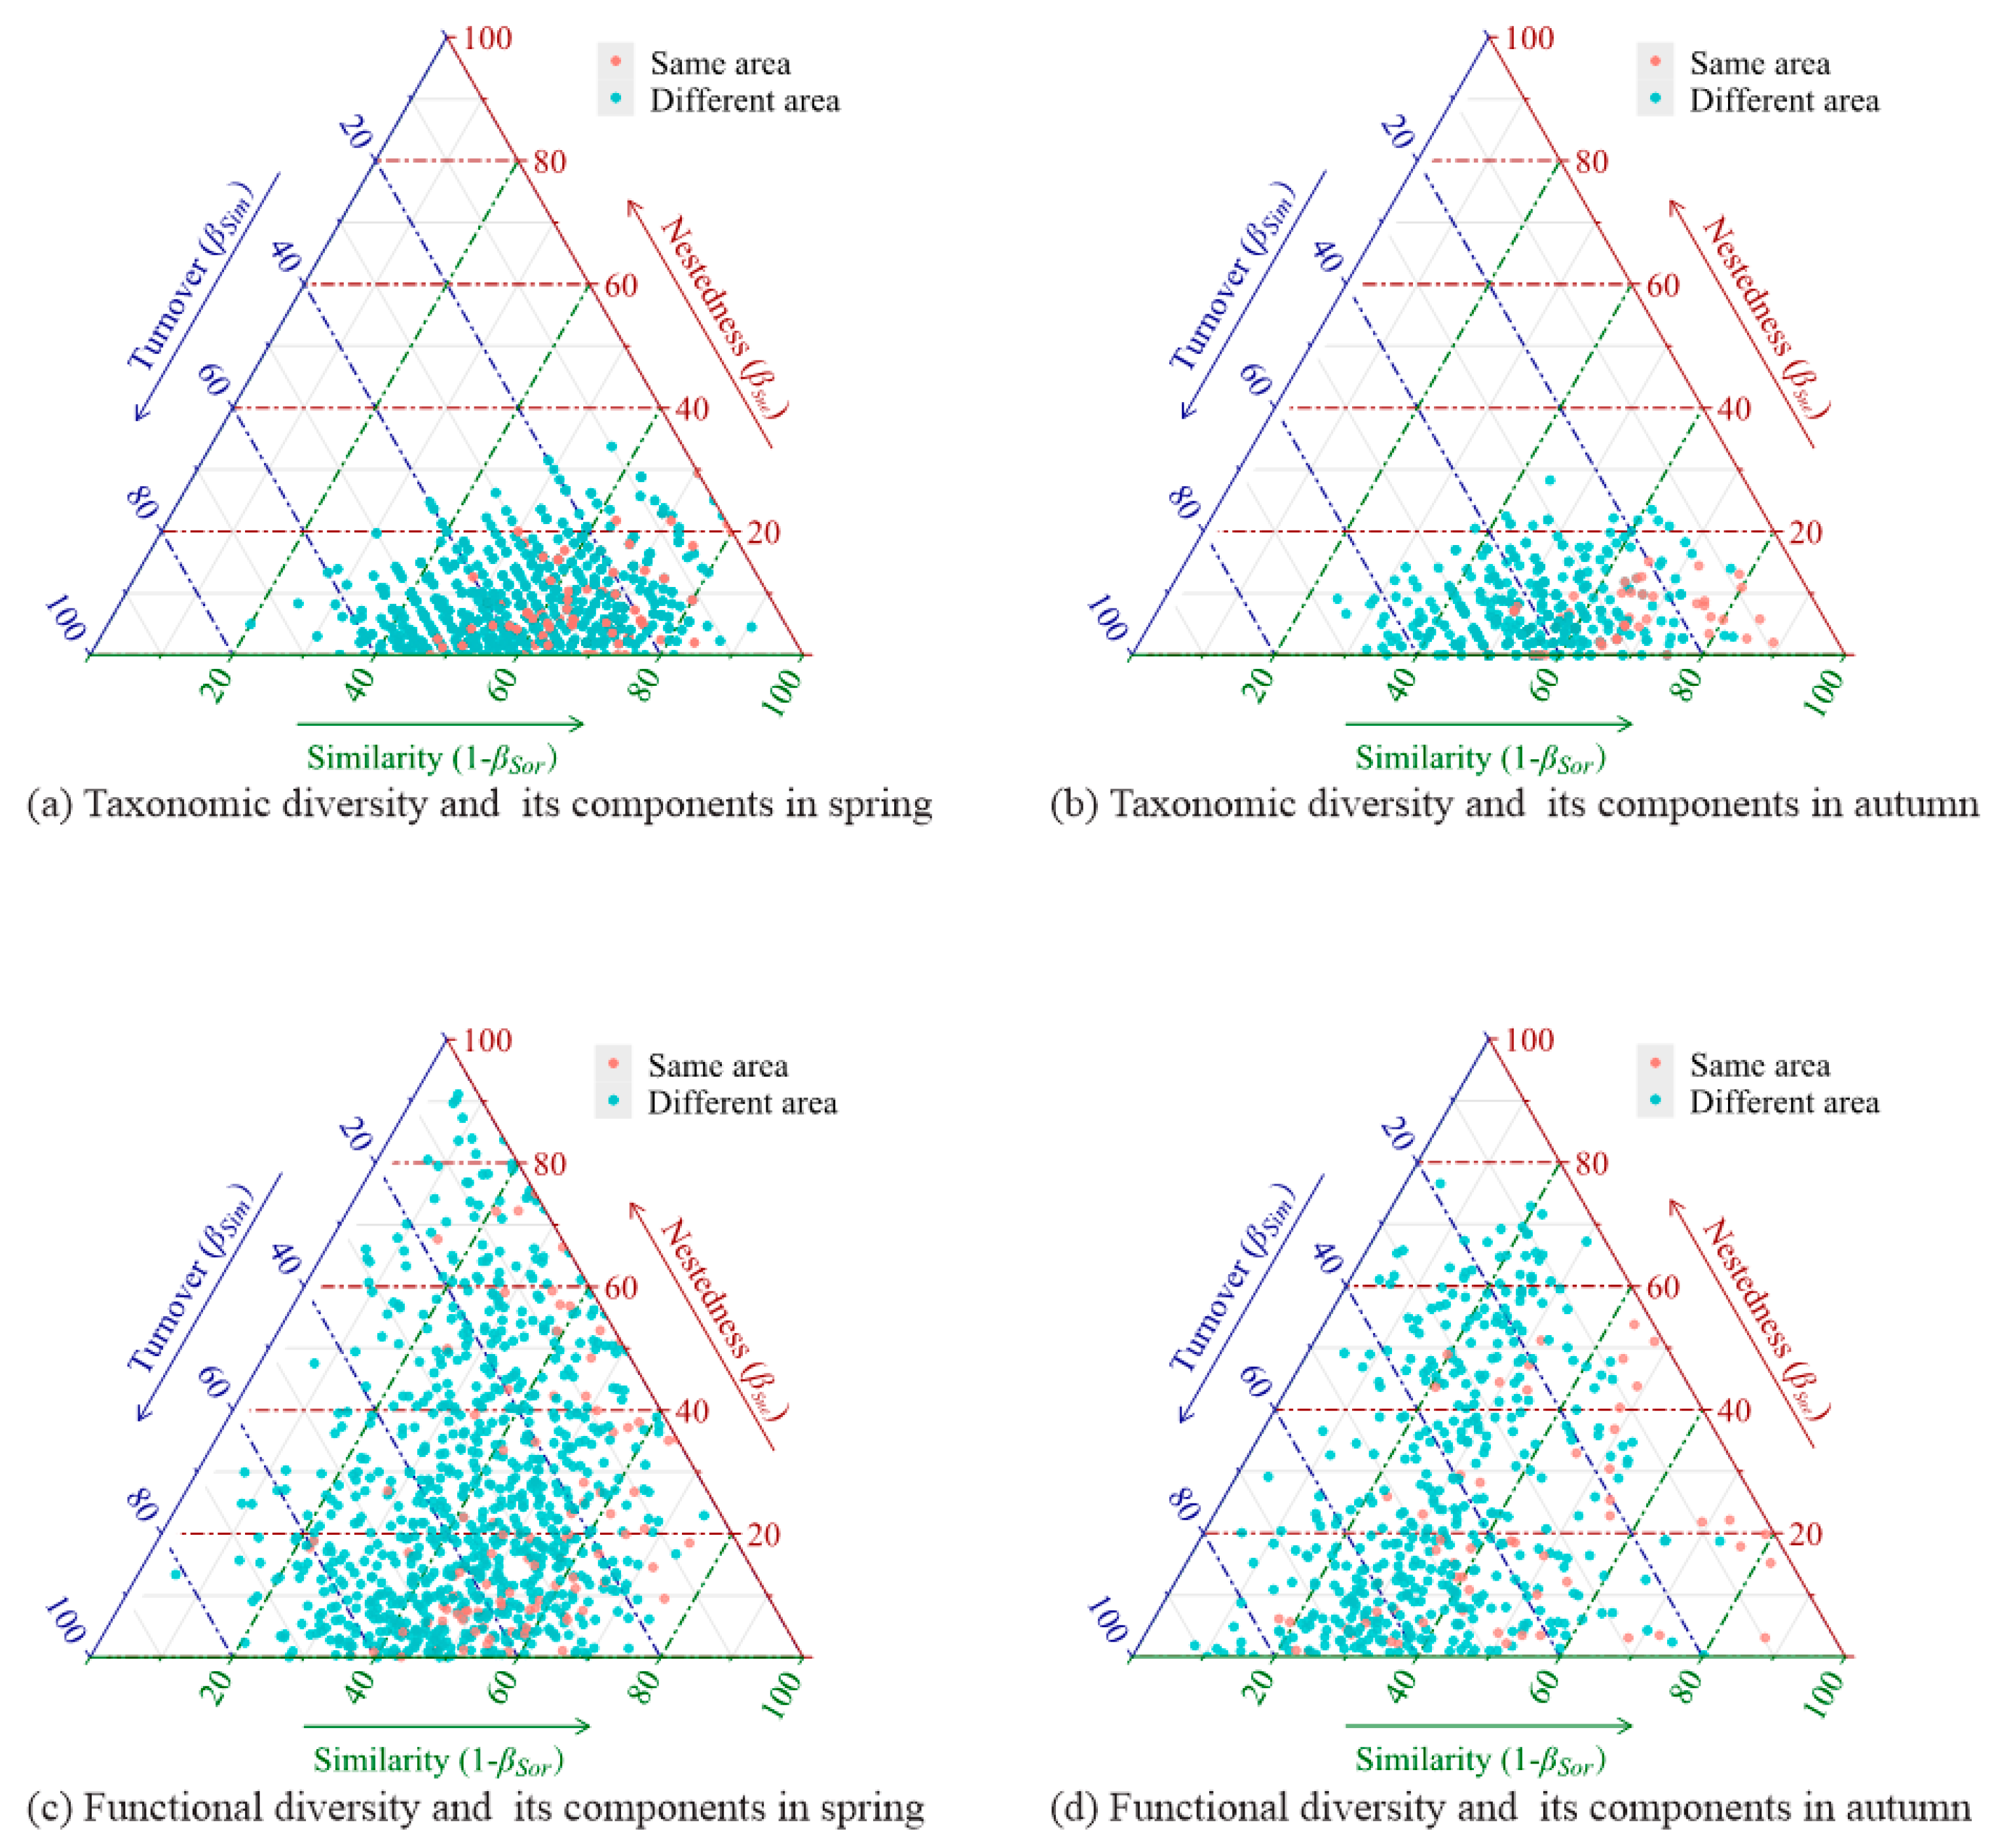
3.1. Beta Diversity and Its Components of Fish Assemblages Around Islands

A total of 89 fish species belonging to 58 families were observed, and Sciaenidae had the highest richness (Table S2). Regardless of taxonomic beta diversity or functional beta diversity, the beta diversity of stations between different islands was higher than that within the same island (Figure 2 and Figure 3, p < 0.05, Table S4). In addition, the beta diversity in autumn was higher than that in spring, especially for functional beta diversity (Table S4). The deviation of functional beta diversity (0.026) and its components were much higher than that of taxonomic beta diversity (0.019) (Figure 4). For taxonomic beta diversity, TβSor was mainly composed of TβSim; its contribution was 81.1% and 85.2% in spring and autumn, respectively (Figure 2 and Figure 4). For functional beta diversity, the contributions of FβSim and FβSne to FβSor were 56.1% and 43.9% in spring, and 63.5% and 36.5% in autumn, respectively (Figure 3 and Figure 4). TβSim had an absolute advantage in TβSor (more than 80%), while the ratio between FβSim and FβSne was about 6:4.
The fish assemblages around eight islands displayed varied beta diversity patterns (Figures S1–S3). The contribution of TβSim and TβSne to TβSor in eight islands was consistent, with TβSim contributing the largest proportion to TβSim (from 74.4% to 92.7%), while the ratio of TβSne was nearly equal to TβSim (51.4%) in Taohua Island in spring (Figure S1). On the contrary, the contribution of FβSne to FβSor in three (DJ, TH, and DT) and two (MA and DJ) islands was higher than FβSim in two seasons, respectively (Figure S2). TβSor between Yushan Island and other islands was highest in spring, and in Maan, Dongji, and Taohua Islands, it was highest in autumn (Figure S3). FβSor of Dongtou and Baisha Islands with other islands was highest in spring and autumn (Figure S3).

3.2. The Driving Mechanism of Beta Diversity and Its Components

The taxonomic and functional beta diversity and its components of fish assemblages were influenced by both geographical and environmental factors. The beta diversity was mainly driven by environmental factors (mean 23%) and less affected by geographical factors (mean 12%) (Table S5). Beta diversity increased with increasing geographical distance in spring, while slight and significant downtrends (p < 0.05) were observed in autumn (Figure 5, Tables S6 and S7). The explanation ratio of environmental factors on TβSor was 10.49% and 19.77% in spring and autumn, and explained 9.02% and 17.46% for TβSim, and 3.19% and 24.64% for TβSne in two seasons (Table 1). A relatively higher explanation ratio was observed for functional beta diversity. Environmental factors explained 15.65% and 24.64% for FβSor, 9.66% and 6.86% for FβSim, and 11.46% and 14.88% for FβSne (Table 1). For taxonomic beta diversity of fish assemblages, bottom water temperature, depth, and dissolved oxygen were the most influential environmental factors in spring, while dissolved oxygen and salinity significantly affected the fish assemblages in autumn. For functional beta diversity of fish assemblages, the primary influencing factors in spring were the same as those for taxonomic beta diversity, while bottom water temperature and salinity played important roles in the assembly of fish assemblages.

4. Discussion

In this study, we analyzed the spatiotemporal dynamics of the taxonomic and functional beta diversity of fish assemblages around marine islands in the East China Sea. We observed significant variations of the two facets of beta diversity and their components, spatial variations among islands, and seasonal variations between spring and autumn, and we found that the impact of environmental factors on beta diversity is significantly greater than that of geographical distance. Our research findings have significant implications for guiding the conservation of fish biodiversity in marine island-protected areas.

4.1. Beta Diversity Patterns of Fish Assemblages Around Islands

The level of taxonomic beta diversity was moderate with lower seasonal variations, while the level of functional beta diversity was relatively higher with moderate seasonal variations (Figure 1 and Figure 2). These results indicated that the taxonomic beta diversity of fish assemblages among islands was not high, but there are significant differences in fish functional traits. The higher functional beta diversity might be highly correlated with the specialization of fish assemblages around islands [34]. The locations, areas, shapes, and offshore distances of the eight islands all varied. Habitat heterogeneity, such as topographic characteristics, climatic characteristics, and water resources, may lead to differences in functional traits of fish assemblages. Some islands are inhabited by humans, and the influence of anthropogenic activities is significant, which may affect the functional redundancy of fish assemblages, reduce their functional diversity, and thus increase functional beta diversity [35]. Usually, the larger the island area, the higher the species diversity based on the species–area relationship [32]. However, seven out of eight islands are inhabited, and the impact of human activities cannot be ignored. Although there is no evidence, we believe that the impact of human activities may far exceed the effect of island size. The contributions of two components (turnover and nestedness) to the two facets of beta diversity were different, over 80% and 60% for taxonomic and functional beta diversity, respectively (Figure 4). The taxonomic and functional beta diversity were both dominated by turnover, but the nestedness accounted for the higher proportion of functional beta diversity (about 40%). Taxonomic beta diversity was mainly generated by the replacement of fish in space, while an obvious nesting phenomenon can be observed in functional beta diversity. Previous studies also indicate that the levels of taxonomic and functional beta diversity were related to spatial scale [36,37]. For the global scale, taxonomic diversity might exhibit a relatively high degree of spatial congruence, while functional beta diversity always had higher values at the local scale.
The taxonomic and functional beta diversity in autumn were all higher than that in spring (Table S4). For each component, turnover rapidly increased from spring to autumn while nestedness slightly decreased. Islands are usually regarded as relatively isolated areas; however, most islands in the East China Sea act as important fish migration paths in autumn [38]. Thus, migratory fish move to the surrounding waters of islands in autumn, increasing the proportion of turnover. The beta diversity of fish assemblages shows significant differences between islands, especially in spring. For example, the highest taxonomic and functional beta diversity of fish assemblages were observed on Yushan and Dongtou Islands, respectively (Figures S1 and S2). Yushan Island is an uninhabited island and is the farthest away from the mainland (about 75 km). The relatively isolated and unique marine environment has resulted in high species diversity. Dongtou is the island with the highest population density and is connected to the mainland through bridges. High levels of anthropogenic disturbance and environmental changes have led to fish assemblages having higher functional beta diversity. The area of Yushan and Dongji Island is lower than other islands, while the beta diversity of fish assemblages was similar to the largest island (Dongtou Island) (Table S1). Because of the connectivity of the sea and the migratory behavior of fish, the factors that affect fish diversity are diverse and interactive, and there are significant differences in their influencing mechanisms compared to island terrestrial organisms.

4.2. The Impacts of Environmental Factors on Beta Diversity and Its Components in Fish Assemblages

Environmental filtration is an important factor that affects the structure and function of communities [10]. Our results revealed that the impact of environmental factors on beta diversity is significantly greater than geographical distance (Table 1). Dissolved oxygen was the primary factor influencing fish taxonomic beta diversity, and temperature contributed the most to changing functional beta diversity. DO is the most essential factor for their maintenance of metabolism and growth, and the requirement of DO for fish varies. Some fast-swimming fish have a high dependence on DO (e.g., Lateolabrax japonicus), while some mudflat fishes (e.g., Periophthalmus cantonensis) have evolved special respiratory organs, and their demand for DO is reduced [39]. Therefore, different demand levels of DO may cause differences in the composition of fish assemblages. According to the report, warming temperatures would threaten 6%~25% of global freshwater fish assemblages to face the loss of functional diversity [40]. Depth and salinity significantly changed the beta diversity of fish assemblages in spring and autumn, respectively. The impact of migratory fish on fish assemblages around islands is relatively small in spring, so depth is an important influencing factor [41]. In autumn, with the entry of migratory fish, the impact of salinity on fish assemblages is gradually increasing [42].
We must acknowledge that environmental factors have low explanatory power for beta diversity and its components of fish assemblages (Table 1). Apart from the factors included in the study, we think that there are other biotic and abiotic factors affecting fish beta diversity. For biotic factors, we should consider the impacts of interspecific relationships, prey organisms, and predators on fish assemblages. The marine food web is very complex, and the trophic levels of fish occur at various levels [21]. Thus, it is recommended that interactions between fish be incorporated into the research framework. Abiotic factors, substrate, ocean currents, precipitation, biogeochemical cycles, and other factors were excluded from this study. Habitat characteristics may be one of the most important factors affecting the diversity patterns of fish assemblages [35]. The greater the heterogeneity of the habitat, the higher the fish functional beta diversity may be [43]. The substrate type, structural complexity, current velocity, growth of algae, etc., all significantly affect the reproductive behavior, feeding behavior, and swimming behavior of fish. Regretfully, these works have not made significant progress in marine ecosystem research due to factors such as difficulty in sampling and shortage of funding.
The influence of environmental factors on the fish beta diversity should be considered both in temporal and spatial scales. Long-time shifts can provide us with more accurate trends and serve as a basis for developing effective strategies [44]. For spatial scale, climate is a typical global environmental factor, and DO is considered a local environmental factor. Global and local environmental factors mainly target different types of fish: high diffusive fish and locally inhabiting fish, which could result in variations in fish beta diversity [15]. There is also a correlation between environmental factors and latitude. The studied islands are distributed in a north–south direction, and changes in latitude will have a certain impact on the analysis results. Fish diversity shifts along latitudinal gradients were observed from the equator to the tropics, which might be linked with temperature and habitat availability [45]. The differences in biodiversity observed along latitude gradients are inherently related to these gradients, as they reflect natural changes driven by factors such as temperature and habitat availability. We suggest a deeper understanding and explanation of the role of latitude in shaping biodiversity patterns. The increasing correlations between environmental factors and human activities require close attention, especially the mixed effects of the two [46]. Although there is uncertainty in the spatiotemporal scale of the mixed effects of the two factors, it is vital to formalize such assessments as soon as possible for the sustainable use of marine ecosystems.
The impact of anthropogenic activities such as marine engineering cannot be ignored, such as reclamation projects and offshore wind farms [47]. Although marine engineering has promoted economic development, it has also caused many ecological stresses. Reclamation projects are believed to have changed the hydrological characteristics of the ocean, affected the migration patterns of fish, destroyed habitats and spawning grounds, and ultimately led to a sharp decline in fish populations [48]. Wind power is considered a clean energy source and is widely developed along the coast of Zhejiang province. However, offshore wind farms are regarded as posing serious environmental risks to the seabed and the biodiversity of marine ecosystems, especially in semi-enclosed seas [49]. Therefore, marine protected areas with high biodiversity and valuable seascapes are not recommended for installation [49,50]. With the increase and frequency of global extreme environmental disturbance events, the role that functional diversity may play will become increasingly significant.

4.3. The Impacts of Geographical Distance on Beta Diversity and Its Components in Fish Assemblages

Another important driver for the pattern of beta diversity is dispersal limitation [51]. It typically manifests as a pattern in which variations between assemblages progressively increase with greater geographical distance. Our study showed that as the distance increases, there is a trend of increasing beta diversity in fish assemblages, but it is not significant (Figure 5). The previous research on the distribution of fish assemblages in New Zealand supported our findings [52,53]. As the distance increased, environmental heterogeneity increased, and the differences in functional traits of fish gradually increased. When a certain geographical distance level was reached, this trend gradually slowed down. However, a special phenomenon was found that functional beta diversity and its one component (turnover) of fish assemblages decreased with distance in autumn, while another component (nestedness) had gently changing trends for two diversities in two seasons (Figure 5). Three reasons may explain this issue. First, the dispersal of migratory fish reduces the spatial distribution differences of fish assemblages in autumn. During the feeding migration period in autumn, the distribution of fish assemblages is evener, reducing the differences in functional trait compositions [38]. Second, the impact of dispersal limitation on fish assemblages is controllable. Many studies have observed consistent results that the environmental filtering process might play a more important role in shaping beta diversity patterns of fish assemblages than dispersal limitation [15]. Environmental variables such as river conductivity, dissolved oxygen level, and substrate structure were considered to be primary mechanisms in structuring fish beta diversity, while spatial variables were complementary mechanisms [5,54]. Third, although turnover and nestedness are two components of beta diversity, they may have their own independent patterns of variation [37]. These unexplored differences require further attention.
The non-significance between beta diversity and distance may be related to spatial scale. The detachment of beta diversity from scale assumptions is confusing. However, the widely varying objectives of ecologists make it very difficult to determine a guideline for setting an accurate scale [55]. Generally, higher beta diversity is usually observed in local scale areas than in global scale areas, while the beta diversity at regional scales might be lower [56]. The distance of this study ranges from 1 km to 450 km, which can be seen as the local scale and small regional scale (Figure 1). Yushan Island is located at the center of the study area and is relatively close to other islands. These distances can be considered the local scale, which may be an important reason for their higher beta diversity. In addition to the geographical distance between islands, influencing factors such as offshore distance, area, human activities, habitat complexity, and marine protected areas should also be considered [57]. Yushan Island has the farthest offshore distance and is least affected by human activities, with a high level of beta diversity. Dongtou Island is the closest to the mainland, with a high level of urbanization, but it is connected to the mainland through bridges, which also results in high beta diversity. Due to its unique habitat and abundant resources of shellfish and algae, Nanji Island has been designed as a national marine protected area for shellfish and algae, which is beneficial for the high biodiversity of the sea area.

4.4. Management Implications and Prospects

The correlation between taxonomic beta diversity and functional beta diversity is often inconsistent, so exploring whether there are specific connectivity mechanisms between the two is an interesting approach. Previous research has shown that the biodiversity at different facets is independent of each other but also has intricate connections [5,57]. Because of inconsistency, we need to strengthen precise research and make prudent decisions to avoid misleading information caused by a single indicator [7,44]. We recommend adopting an integrated protection strategy that takes into account multiple facets of biodiversity to promote more effective marine biodiversity conservation and restoration actions. By obtaining more comprehensive biodiversity information, management strategies can be made more scientific and accurate, avoiding biased biodiversity conservation dilemmas caused by relying solely on taxonomic diversity.
Fish can be divided into dominant fish and rare fish based on their abundance, generalist, and specialist based on functional traits [58]. Our previous practice was to protect taxonomic rare species and make rational use of taxonomic dominant species, but we often neglect functional rare species. Dominant fish seem to have a greater impact on taxonomic beta diversity, while rare fish often affect functional beta diversity [59]. However, the mechanisms by which different types of fish affect beta diversity are still unclear. We suggest analyzing the contributions of different functional groups of fish, such as migratory, habitat preference, diet, etc., to beta diversity. The classification of fish based on their abundance is clear, but there is still no recognized guideline for their functional traits [60]. In subsequent research, we should carefully consider the selection criteria and significance of functional traits and pay attention to the potential correlations between traits.
The geographical distance between the eight islands varies greatly, from 10 km to 450 km (Figure 1). The ecological connectivity between islands varies, which might hinder the movement of fish assemblages between them. Due to the diversified habitats and environments of the islands, such as primary productivity and management policy, maximizing the utilization of island habitats is beneficial for increasing fish abundance. The large distance between islands might hinder the movement of fish [61]. We are thinking about whether it is possible to construct artificial habitats between islands as transit points for fish assemblages. While considering increasing fish abundance, the trade-offs between biodiversity conservation and the ecosystem services it provides to humanity need to be confirmed [62].
Collecting fish samples using different survey methods usually yields different results [63]. The commonly used sampling methods have their own advantages and disadvantages. Trawling is the most commonly used method in this study, but it is destructive to fish and difficult to capture reef or cryptic fish. The application of underwater video technology in coral reefs is becoming increasingly widespread, with advantages such as non-destructiveness and the ability to observe fish behavior [64]. Environmental DNA, a rapidly rising method, is considered a novel method for biodiversity monitoring of marine fish assemblages [65]. To overcome the limitations of sampling methods, multiple methods are used simultaneously, but there are certain difficulties in data analysis, such as standardization [66]. In future research, it is recommended to fully consider the characteristics of the sea and bottom structure and adopt different sampling method combinations according to the research objectives to achieve the highest level of biodiversity survey results.
In recent years, research on functional diversity has continued to deepen, and many new research directions are worth paying attention to. For instance, the response mechanism of functional diversity of fish assemblages at different life stages to habitat heterogeneity is still weak [67]; artificial habitats are commonly used to restore damaged marine habitats, but we still have limited understanding of the ecosystem functions they provide [68]; inferring the dynamic changes and stability of communities based on functional diversity under limited conditions, and ultimately making conservation decisions may be a wise strategy [69]. Research on the correlations between functional diversity and ecosystem function is becoming increasingly rich, which plays a key guiding role in discovering ecological problems and essence.
Finally, our study elucidated the taxonomic and functional beta diversity of fish assemblages around islands; however, some existing limitations cannot be neglected. First, beta diversity may be caused by natural processes or by inadequate sampling methods. Due to the special geomorphological conditions surrounding the islands, it is hard to capture fish that are close to the reefs, shallow waters, or cryptic species, like Acanthopagrus schlegelii. More advanced sampling methods like eDNA and acoustics surveys should be combined with sampling nets. Second, most of the functional traits used in this study are not continuous variables, and adult traits are used without considering the changes in fish traits from juvenile to adult, which is flawed. Third, temporal beta diversity over a long time requires further attention, especially over the years when special events occur. Last, the fish around the islands include both native and migratory fish. If we differentiate and study these two types of fish, it may provide new insights for management.

5. Conclusions

Our research depicts a picture of the spatiotemporal distribution and environmental driving mechanism of taxonomic and functional beta diversity and its components in fish assemblages around islands. Taxonomic beta diversity was mainly composed of turnover, while the contribution of nestedness to the functional beta diversity increased greatly. Environmental factors are the key drivers of beta diversity, not geographic distance. The potential ecological connectivity in fish assemblages among islands was observed, which may become an important foundation for the establishment of marine protected areas. Our findings integrated beta diversity at two facets, improving the understanding of the marine island fish community assembly mechanism. We recommend the application of multiple sampling methods in further investigations. These are beneficial to the general framework for biodiversity conservation and the construction of marine protected areas.

Supplementary Materials

The following supporting information can be downloaded at https://www.mdpi.com/article/10.3390/jmse13040674/s1: Figure S1: Taxonomic beta diversity and its components of fish assemblages within and between two islands. Figure S2: Functional beta diversity and its components of fish assemblages within and between two islands. Figure S3: Taxonomic (a) and Functional (b) beta diversity and its components of fish assemblages among islands. Table S1: The characteristics of eight islands from north to south. Table S2: The functional traits of fish around marine islands. Table S3: List of fishes and their functional traits around marine islands. Table S4: Paired t-test for beta diversity of fish assemblages for different areas and seasons around eight islands. Table S5: The contribution of environmental and geographic factors to the beta diversity and its components of fish assemblages around islands based on variance partitioning analyses (VPA). Table S6: Relationships between beta diversity and influencing factors based on the Mantel test. Table S7: Relationships between beta diversity and influencing factors based on the Partial Mantel test.

Author Contributions

Conceptualization: G.F., Y.Z. (Yazhou Zhang) and J.C.; methodology: G.F. and R.J.; validation: Y.Z. (Yazhou Zhang) and J.C.; investigation: J.L., C.C. and M.Y.; writing—original draft preparation: G.F. and Y.Z. (Yongdong Zhou); writing—review and editing: Y.Z. (Yazhou Zhang) and J.C.; supervision: Y.Z. (Yazhou Zhang); project administration: R.J. and Y.Z. (Yongdong Zhou); funding acquisition: G.F. and J.L. All authors have read and agreed to the published version of the manuscript.

Funding

This research was supported by the Zhejiang Provincial Natural Science Foundation of China under Grant No. LQ24C190010 and the National Key R & D project of China (2023YFD2401905).

Data Availability Statement

The raw data supporting the conclusions of this article will be made available by the authors on request.

Acknowledgments

We thank all scientific staff and crew members for their survey assistance. We thank anonymous reviewers for their insightful suggestions that enabled the manuscript to be significantly improved.

Conflicts of Interest

The authors declare no conflicts of interest.

References

  1. Duarte, C.M.; Agusti, S.; Barbier, E.; Britten, G.L.; Castilla, J.C.; Gattuso, J.-P.; Fulweiler, R.W.; Hughes, T.P.; Knowlton, N.; Lovelock, C.E.; et al. Rebuilding marine life. Nature 2020, 580, 39–51. [Google Scholar] [CrossRef] [PubMed]
  2. Baselga, A. Partitioning the turnover and nestedness components of beta diversity. Glob. Ecol. Biogeogr. 2010, 19, 134–143. [Google Scholar] [CrossRef]
  3. Whittaker, R.H. Vegetation of the Siskiyou Mountains, Oregon and California. Ecol. Monogr. 1960, 30, 279–338. [Google Scholar] [CrossRef]
  4. Yan, H.F.; Casey, J.M.; Knowlton, N.; Duffy, J.E.; Brandl, S.J. Examining the diversity, stability and functioning of marine fish communities across a latitudinal gradient. Glob. Ecol. Biogeogr. 2023, 32, 166–177. [Google Scholar] [CrossRef]
  5. Teichert, N.; Lepage, M.; Chevillot, X.; Lobry, J. Environmental drivers of taxonomic, functional and phylogenetic diversity (alpha, beta and gamma components) in estuarine fish communities. J. Biogeogr. 2018, 45, 406–417. [Google Scholar] [CrossRef]
  6. Bevilacqua, S.; Plicanti, A.; Sandulli, R.; Terlizzi, A. Measuring more of β-diversity: Quantifying patterns of variation in assemblage heterogeneity. An insight from marine benthic assemblages. Ecol. Indic. 2012, 18, 140–148. [Google Scholar] [CrossRef]
  7. Cuesta Núñez, J.; Romero, M.A.; Ocampo Reinaldo, M.; González, R.; Magurran, A.; Svendsen, G.M. Species turnover drives functional turnover with balanced functional nestedness in a Patagonian demersal assemblage. J. Sea Res. 2023, 196, 102452. [Google Scholar] [CrossRef]
  8. de Albuquerque Correa, C.M.; Da Silva, P.G.; Lara, M.A.; Puker, A. Spatiotemporal patterns of β-diversity of flower chafer beetles in urban park and natural reserve sites in Brazilian Cerrado. Int. J. Trop. Insect Sci. 2021, 41, 681–691. [Google Scholar] [CrossRef]
  9. Lennon, J.J.; Koleff, P.; Greenwood, J.J.D.; Gaston, K.J. The geographical structure of British bird distributions: Diversity, spatial turnover and scale. J. Anim. Ecol. 2001, 70, 966–979. [Google Scholar] [CrossRef]
  10. Soininen, J.; Heino, J.; Wang, J. A meta-analysis of nestedness and turnover components of beta diversity across organisms and ecosystems. Glob. Ecol. Biogeogr. 2018, 27, 96–109. [Google Scholar] [CrossRef]
  11. Gianuca, A.T.; Declerck, S.A.; Lemmens, P.; De Meester, L. Effects of dispersal and environmental heterogeneity on the replacement and nestedness components of β-diversity. Ecology 2017, 98, 525–533. [Google Scholar] [CrossRef] [PubMed]
  12. Shi, W.; Wang, Y.Q.; Xiang, W.S.; Li, X.K.; Cao, K.F. Environmental filtering and dispersal limitation jointly shaped the taxonomic and phylogenetic beta diversity of natural forests in southern China. Ecol. Evol. 2021, 11, 8783–8794. [Google Scholar] [CrossRef] [PubMed]
  13. Moritz, C.; Meynard, C.N.; Devictor, V.; Guizien, K.; Labrune, C.; Guarini, J.M.; Mouquet, N. Disentangling the role of connectivity, environmental filtering, and spatial structure on metacommunity dynamics. Oikos 2013, 122, 1401–1410. [Google Scholar] [CrossRef]
  14. Lansac-Tôha, F.M.; Heino, J.; Quirino, B.A.; Moresco, G.A.; Peláez, O.; Meira, B.R.; Rodrigues, L.C.; Jati, S.; Lansac-Tôha, F.A.; Velho, L.F.M. Differently dispersing organism groups show contrasting beta diversity patterns in a dammed subtropical river basin. Sci. Total Environ. 2019, 691, 1271–1281. [Google Scholar] [CrossRef]
  15. Lima, L.B.; Oliveira, F.J.M.; De Marco Júnior, P.; Lima-Junior, D.P. Local environmental variables are the best beta diversity predictors for fish communities from the Brazilian Cerrado streams. Aquat. Sci. 2024, 86, 19. [Google Scholar] [CrossRef]
  16. Cardoso, P.; Rigal, F.; Carvalho, J.C.; Fortelius, M.; Borges, P.A.V.; Podani, J.; Schmera, D. Partitioning taxon, phylogenetic and functional beta diversity into replacement and richness difference components. J. Biogeogr. 2014, 41, 749–761. [Google Scholar] [CrossRef]
  17. Peláez, O.; Pavanelli, C.S. Environmental heterogeneity and dispersal limitation explain different aspects of β-diversity in Neotropical fish assemblages. Freshw. Biol. 2019, 64, 497–505. [Google Scholar] [CrossRef]
  18. Hu, D.; Jiang, L.; Zhang, Y.; Qiu, S.; Hou, Z.; Zhang, J.; Lv, G.; Yue, M. The relative importance of environmental filtering and dispersal limitation on the multidimensional Beta diversity of desert plant communities depends on sampling scales. J. Soil Sci. Plant Nutr. 2023, 23, 5608–5620. [Google Scholar] [CrossRef]
  19. Li, Y.; Liu, F.; Zhou, Y.; Liu, X.; Wang, Q. Geographic patterns and environmental correlates of taxonomic, phylogenetic and functional β-diversity of wetland plants in the Qinghai-Tibet Plateau. Ecol. Indic. 2024, 160, 111889. [Google Scholar] [CrossRef]
  20. Holmlund, C.M.; Hammer, M. Ecosystem services generated by fish populations. Ecol. Econ. 1999, 29, 253–268. [Google Scholar] [CrossRef]
  21. Albouy, C.; Archambault, P.; Appeltans, W.; Araújo, M.B.; Beauchesne, D.; Cazelles, K.; Cirtwill, A.R.; Fortin, M.-J.; Galiana, N.; Leroux, S.J.; et al. The marine fish food web is globally connected. Nat. Ecol. Evol. 2019, 3, 1153–1161. [Google Scholar] [CrossRef] [PubMed]
  22. Villéger, S.; Brosse, S.; Mouchet, M.; Mouillot, D.; Vanni, M.J. Functional ecology of fish: Current approaches and future challenges. Aquat. Sci. 2017, 79, 783–801. [Google Scholar] [CrossRef]
  23. Lotze, H.K. Marine biodiversity conservation. Curr. Biol. 2021, 31, 1190–1195. [Google Scholar] [CrossRef] [PubMed]
  24. Freitas, C.; Villegas-Ríos, D.; Moland, E.; Olsen, E.M. Sea temperature effects on depth use and habitat selection in a marine fish community. J. Anim. Ecol. 2021, 90, 1787–1800. [Google Scholar] [CrossRef]
  25. Grorud-Colvert, K.; Sullivan-Stack, J.; Roberts, C.; Constant, V.; Horta e Costa, B.; Pike, E.P.; Kingston, N.; Laffoley, D.; Sala, E.; Claudet, J.; et al. The MPA Guide: A framework to achieve global goals for the ocean. Science 2021, 373, eabf0861. [Google Scholar] [CrossRef]
  26. Bevilacqua, S.; Boero, F.; De Leo, F.; Guarnieri, G.; Mačić, V.; Benedetti-Cecchi, L.; Terlizzi, A.; Fraschetti, S. β-diversity reveals ecological connectivity patterns underlying marine community recovery: Implications for conservation. Ecol. Appl. 2023, 33, e2867. [Google Scholar] [CrossRef] [PubMed]
  27. Li, Y.; Fluharty, D.L. Marine protected area networks in China: Challenges and prospects. Mar. Policy 2017, 85, 8–16. [Google Scholar] [CrossRef]
  28. He, M.; Cliquet, A. Challenges for protected areas management in China. Sustainability 2020, 12, 5879. [Google Scholar] [CrossRef]
  29. Thrush, S.F.; Hewitt, J.E.; Lohrer, A.M.; Chiaroni, L.D. When small changes matter: The role of cross-scale interactions between habitat and ecological connectivity in recovery. Ecol. Appl. 2013, 23, 226–238. [Google Scholar] [CrossRef]
  30. Dawson, M.N. Island and island-like marine environments. Glob. Ecol. Biogeogr. 2016, 25, 831–846. [Google Scholar] [CrossRef]
  31. Pinheiro, H.T.; Bernardi, G.; Simon, T.; Joyeux, J.-C.; Macieira, R.M.; Gasparini, J.L.; Rocha, C. Island biogeography of marine organisms. Nature 2017, 549, 82–85. [Google Scholar] [CrossRef] [PubMed]
  32. Balzan, M.V.; Potschin-Young, M.; Haines-Young, R. Island ecosystem services: Insights from a literature review on case-study island ecosystem services and future prospects. Int. J. Biodivers. Sci. Ecosyst. Serv. Manag. 2018, 14, 71–90. [Google Scholar] [CrossRef]
  33. Broadley, A.; Stewart-Koster, B.; Burford, M.A.; Brown, C.J. A global review of the critical link between river flows and productivity in marine fisheries. Rev. Fish Biol. Fish. 2022, 32, 805–825. [Google Scholar] [CrossRef]
  34. Aguilar-Medrano, R.; Vega-Cendejas, M.E. Implications of the environmental heterogeneity on the distribution of the fish functional diversity of the Campeche Bank, Gulf of Mexico. Mar. Biodivers. 2019, 49, 1913–1929. [Google Scholar] [CrossRef]
  35. Brandl, S.J.; Emslie, M.J.; Ceccarelli, D.M.; Richards, Z.T. Habitat degradation increases functional originality in highly diverse coral reef fish assemblages. Ecosphere 2016, 7, e01557. [Google Scholar] [CrossRef]
  36. García-Girón, J.; Heino, J.; Baastrup-Spohr, L.; Bove, C.P.; Clayton, J.; de Winton, M.; Feldmann, T.; Fernández-Aláez, M.; Ecke, F.; Grillas, P.; et al. Global patterns and determinants of lake macrophyte taxonomic, functional and phylogenetic beta diversity. Sci. Total Environ. 2020, 723, 138021. [Google Scholar] [CrossRef] [PubMed]
  37. Bevilacqua, S.; Terlizzi, A. Nestedness and turnover unveil inverse spatial patterns of compositional and functional β-diversity at varying depth in marine benthos. Divers. Distrib. 2020, 26, 743–757. [Google Scholar] [CrossRef]
  38. Jin, X.; Xu, B.; Tang, Q. Fish assemblage structure in the East China Sea and southern Yellow Sea during autumn and spring. J. Fish Biol. 2003, 62, 1194–1205. [Google Scholar] [CrossRef]
  39. Yokoya, S.; Tamura, O.S. Fine structure of the skin of the amphibious fishes, Boleophthalmus pectinirostris and Periophthalmus cantonensis, with special reference to the location of blood vessels. J. Morphol. 1992, 214, 287–297. [Google Scholar] [CrossRef]
  40. Scherer, L.; Boom, H.A.; Barbarossa, V.; van Bodegom, P.M. Climate change threats to the global functional diversity of freshwater fish. Glob. Change Biol. 2023, 29, 3781–3793. [Google Scholar] [CrossRef]
  41. Jankowski, M.W.; Graham, N.A.J.; Jones, G.P. Depth gradients in diversity, distribution and habitat specialisation in coral reef fishes: Implications for the depth-refuge hypothesis. Mar. Ecol. Prog. Ser. 2015, 540, 203–215. [Google Scholar] [CrossRef]
  42. Kantoussan, J.; Ecoutin, J.M.; Simier, M.; Tito de Morais, L.; Laë, R. Effects of salinity on fish assemblage structure: An evaluation based on taxonomic and functional approaches in the Casamance estuary (Senegal, West Africa). Estuar. Coast. Shelf Sci. 2012, 113, 152–162. [Google Scholar] [CrossRef]
  43. Cunha, E.R.; Winemiller, K.O.; da Silva, J.C.B.; Lopes, T.M.; Gomes, L.C.; Thomaz, S.M.; Agostinho, A.A. α and β diversity of fishes in relation to a gradient of habitat structural complexity supports the role of environmental filtering in community assembly. Aquat. Sci. 2019, 81, 38. [Google Scholar] [CrossRef]
  44. Rbiai, O.; Badaoui, B.; Chlaida, M. Temporal β-diversity decomposition: Insights into fish biodiversity dynamics in the Moroccan South Atlantic. Mar. Environ. Res. 2024, 198, 106504. [Google Scholar] [CrossRef]
  45. Diamond, J.; Roy, D. Patterns of functional diversity along latitudinal gradients of species richness in eleven fish families. Glob. Ecol. Biogeogr. 2023, 32, 450–465. [Google Scholar] [CrossRef]
  46. Gissi, E.; Manea, E.; Mazaris, A.D.; Fraschetti, S.; Almpanidou, V.; Bevilacqua, S.; Coll, M.; Guarnieri, G.; Lloret-Lloret, E.; Pascual, M.; et al. A review of the combined effects of climate change and other local human stressors on the marine environment. Sci. Total Environ. 2021, 755, 142564. [Google Scholar] [CrossRef]
  47. Siddagangaiah, S.; Chen, C.F.; Hu, W.-C.; Akamatsu, T.; Pieretti, N. Assessing the influence of offshore wind turbine noise on seasonal fish chorusing. ICES J. Mar. Sci. 2024, 0, fsae061. [Google Scholar] [CrossRef]
  48. Fabinyi, M.; Belton, B.; Dressler, W.H.; Knudsen, M.; Adhuri, D.S.; Abdul Aziz, A.; Akber, M.A.; Kittitornkool, J.; Kongkaew, C.; Marschke, M.; et al. Coastal transitions: Small-scale fisheries, livelihoods, and maritime zone developments in Southeast Asia. J. Rural Stud. 2022, 91, 184–194. [Google Scholar] [CrossRef]
  49. Lloret, J.; Turiel, A.; Solé, J.; Berdalet, E.; Sabatés, A.; Olivares, A.; Gili, J.-M.; Vila-Subirós, J.; Sardá, R. Unravelling the ecological impacts of large-scale offshore wind farms in the Mediterranean Sea. Sci. Total Environ. 2022, 824, 153803. [Google Scholar] [CrossRef]
  50. Wang, L.; Wang, B.; Cen, W.; Xu, R.; Huang, Y.; Zhang, X.; Han, Y.; Zhang, Y. Ecological impacts of the expansion of offshore wind farms on trophic level species of marine food chain. J. Environ. Sci. 2024, 139, 226–244. [Google Scholar] [CrossRef]
  51. Maxwell, M.F.; Leprieur, F.; Quimbayo, J.P.; Floeter, S.R.; Bender, M.G. Global patterns and drivers of beta diversity facets of reef fish faunas. J. Biogeogr. 2022, 49, 954–967. [Google Scholar] [CrossRef]
  52. Myers, E.M.V.; Eme, D.; Liggins, L.; Harvey, E.S.; Roberts, C.D.; Anderson, M.J. Functional beta diversity of New Zealand fishes: Characterising morphological turnover along depth and latitude gradients, with derivation of functional bioregions. Austral Ecol. 2021, 46, 965–981. [Google Scholar] [CrossRef]
  53. Zintzen, V.; Anderson, M.J.; Roberts, C.D.; Harvey, E.S.; Stewart, A.L. Effects of latitude and depth on the beta diversity of New Zealand fish communities. Sci. Rep. 2017, 7, 8081. [Google Scholar] [CrossRef] [PubMed]
  54. López-Delgado, E.O.; Winemiller, K.O.; Villa-Navarro, F.A. Local environmental factors influence beta-diversity patterns of tropical fish assemblages more than spatial factors. Ecology 2020, 101, e02940. [Google Scholar] [CrossRef]
  55. Palmer, M.W.; White, P.S. Scale Dependence and the Species-Area Relationship. Am. Nat. 1994, 144, 717–740. [Google Scholar] [CrossRef]
  56. Barton, P.S.; Cunningham, S.A.; Manning, A.D.; Gibb, H.; Lindenmayer, D.B.; Didham, R.K. The spatial scaling of beta diversity. Glob. Ecol. Biogeogr. 2013, 22, 639–647. [Google Scholar] [CrossRef]
  57. Roa-Fuentes, C.A.; Heino, J.; Cianciaruso, M.V.; Ferraz, S.; Zeni, J.O.; Casatti, L. Taxonomic, functional, and phylogenetic β-diversity patterns of stream fish assemblages in tropical agroecosystems. Freshw. Biol. 2019, 64, 447–460. [Google Scholar] [CrossRef]
  58. da Silva, V.E.L.; Fabré, N.N. Rare Species Enhance Niche Differentiation Among Tropical Estuarine Fish Species. Estuaries Coasts 2019, 42, 890–899. [Google Scholar] [CrossRef]
  59. Stefani, F.; Fasola, E.; Marziali, L.; Tirozzi, P.; Schiavon, A.; Bocchi, S.; Gomarasca, S. Response of functional diversity of fish communities to habitat alterations in small lowland rivers. Biodivers. Conserv. 2024, 33, 1439–1458. [Google Scholar] [CrossRef]
  60. Carmona, C.P.; De Bello, F.; Mason, N.W.; Lepš, J. Traits without borders: Integrating functional diversity across scales. Trends Ecol. Evol. 2016, 31, 382–394. [Google Scholar] [CrossRef]
  61. Jiang, X.; Zheng, P.; Cao, L.; Pan, B. Effects of long-term floodplain disconnection on multiple facets of lake fish biodiversity: Decline of alpha diversity leads to a regional differentiation through time. Sci. Total Environ. 2021, 763, 144177. [Google Scholar] [CrossRef] [PubMed]
  62. Fastré, C.; Possingham, H.P.; Strubbe, D.; Matthysen, E. Identifying trade-offs between biodiversity conservation and ecosystem services delivery for land-use decisions. Sci. Rep. 2020, 10, 7971. [Google Scholar] [CrossRef] [PubMed]
  63. Aglieri, G.; Baillie, C.; Mariani, S.; Cattano, C.; Calò, A.; Turco, G.; Spatafora, D.; Di Franco, A.; Di Lorenzo, M.; Guidetti, P.; et al. Environmental DNA effectively captures functional diversity of coastal fish communities. Mol. Ecol. 2021, 30, 3127–3139. [Google Scholar] [CrossRef] [PubMed]
  64. Mallet, D.; Dominique, P. Underwater video techniques for observing coastal marine biodiversity: A review of sixty years of publications (1952–2012). Fish. Res. 2014, 154, 44–62. [Google Scholar] [CrossRef]
  65. Miya, M. Environmental DNA metabarcoding: A novel method for biodiversity monitoring of marine fish communities. Annu. Rev. Mar. Sci. 2022, 14, 161–185. [Google Scholar] [CrossRef]
  66. Bacheler, N.M.; Schobernd, C.M.; Schobernd, Z.H.; Mitchell, W.A.; Berrane, D.J.; Kellison, G.T.; Reichert, M.J.M. Comparison of trap and underwater video gears for indexing reef fish presence and abundance in the southeast United States. Fish. Res. 2013, 143, 81–88. [Google Scholar] [CrossRef]
  67. Lattanzi, A.; Bellisario, B.; Cimmaruta, R. A review of fish diversity in Mediterranean seagrass habitats, with a focus on functional traits. Rev. Fish Biol. Fish. 2024, 34, 1329–1349. [Google Scholar] [CrossRef]
  68. Michael, J.S.; Meaghan, E.E.; Joshua, P.K.; Jonathan, A.P.; Kara, R.W.; Williams, I.; Stallings, C.D. Reef fish assemblages differ both compositionally and functionally on artificial and natural reefs in the eastern Gulf of Mexico. ICES J. Mar. Sci. 2024, 81, 1150–1163. [Google Scholar] [CrossRef]
  69. Yeager, M.E.; Hughes, A.R. Functional trait analysis reveals the hidden stability of multitrophic communities. Ecology 2025, 106, e70001. [Google Scholar] [CrossRef]
Figure 1. Map of the study area for eight marine islands.
Jmse 13 00674 g001
Figure 2. Taxonomic beta diversity of fish assemblages around islands in spring and autumn. Sor, Sim, and Sne correspond to beta diversity and its two components (turnover, nestedness), respectively. Same area: beta diversity between two sites on one island. Different area: beta diversity between two sites on two islands. All areas: beta diversity between two sites on all islands. Black bold numbers represent the mean value.
Jmse 13 00674 g002
Figure 3. Functional beta diversity of fish assemblages around islands in spring and autumn. Sor, Sim, and Sne correspond to beta diversity and its two components (turnover, nestedness), respectively. Same area: beta diversity between two sites on one island. Different area: beta diversity between two sites on two islands. All areas: beta diversity between two sites on all islands. Black bold numbers represent the mean value.
Jmse 13 00674 g003
Figure 4. Taxonomic and functional beta diversity and its components (turnover and nestedness). Same area: beta diversity between two sites on one island. Different area: beta diversity between two sites on two islands.
Jmse 13 00674 g004
Figure 5. The relationships of taxonomic and functional beta diversity and its components of fish assemblages with differences in geographic distance. Sor, Sim, and Sne correspond to beta diversity and its two components (turnover, nestedness), respectively. The lines were fitted through linear models, and the shadows represent the confidence interval.
Jmse 13 00674 g005
Table 1. Multiple regression (MRM) of taxonomic and functional beta diversity and its components with environmental factors based on distance matrices.
Beta DiversitySeasonCoefficientR2p
Depth (m)Temperature
(°C)
SalinityChlorophyll-a (µg/L)Turbidity (FTU)Dissolved Oxygen (mg/L)Distance (m)
Taxonomic beta diversity (TβSor)Spring0.2199 **0.2565 ** −0.1307 * 0.10490.0010
Turnover (TβSim)0.1568 *0.2372 ** −0.2114 *** 0.09020.0016
Nestedness (TβSne) 0.1785 ** 0.03190.0024
Taxonomic beta diversity (TβSor)Autumn -0.1372 * 0.3402 *** 0.19770.0001
Turnover (TβSim) 0.1706 **−0.2058 ** 0.3390 *** 0.17460.0001
Nestedness (TβSne) 0.4679 ***−0.1562 **0.1621 * −0.1456 * 0.24640.0001
Functional beta diversity (FβSor)Spring0.2031 **0.3477 *** 0.15650.0001
Turnover (FβSim) 0.2449 ** −0.2845 *** 0.09660.0001
Nestedness (FβSne)0.1567 * 0.2988 *** 0.11460.0001
Functional beta diversity (FβSor)Autumn 0.3340 *** −0.1988 *0.1755 * 0.1186 *0.24640.0008
Turnover (FβSim) −0.2480 **0.1779 * 0.06860.0037
Nestedness (FβSne) 0.4012 ***−0.1314 * 0.14880.0004
Note: “-” indicated the factor was not selected in the second run of the MRM. * means p < 0.05; ** means p < 0.01; *** means p < 0.001.
Disclaimer/Publisher’s Note: The statements, opinions and data contained in all publications are solely those of the individual author(s) and contributor(s) and not of MDPI and/or the editor(s). MDPI and/or the editor(s) disclaim responsibility for any injury to people or property resulting from any ideas, methods, instructions or products referred to in the content.

